
the Creative Commons Attribution 4.0 License.
the Creative Commons Attribution 4.0 License.
 | 06 Jul 2026
Automated dock-based UAV systems for geohazard monitoring in mountainous terrain
Alexander Maschler
Sarah Langes
Lukas Schild
Thomas Scheiber
Paula Snook
Jacob Clement Yde
Harald Zandler
Ueli Sager
This study presents the first systematic field evaluation of dock-based UAV (Uncrewed Aerial Vehicle) systems for geohazard monitoring in mountainous terrain. We assess their potential to provide reliable, high-frequency, and automated monitoring of surface changes across three different hazard scenarios: (1) a fast-moving glacier icefall (Supphellebreen, Norway), (2) an unstable rock slope (Skjøld, Norway), and (3) a post-failure landscape resulting from a catastrophic rock-ice avalanche (Blatten, Switzerland). Effective hazard management requires timely detection of displacement patterns and terrain change. To address these issues, we introduce an automated workflow integrating multitemporal UAV dock data acquisition with an end-to-end processing pipeline for displacement field generation and change detection. The results show that this workflow has the potential to provide data at centimetre-level accuracy before, during, and after hazard events, supporting both precautionary risk assessments and timely decision-making in critical phases of potential hazard evolution. Wider adoption will depend on supportive regulatory frameworks, reliable power and communication infrastructure, and sufficient expertise to ensure effective operation, maintenance, data interpretation and risk management. Overall, dock-based UAV systems represent a significant technological advancement in efficient geohazard monitoring, facilitating rapid response in critical situations, thereby contributing to increased resilience of communities living in vulnerable mountain environments.
- Article
(13761 KB) - Full-text XML
- BibTeX
- EndNote


Unstable rock slopes and glacier-related hazards such as ice avalanches, glacier collapse, and glacier lake outburst floods pose significant risks in mountainous regions, with increasing activity driven by climate change (Stoffel et al., 2024; Stuart-Smith et al., 2021). The growing threat of these natural hazards, which can potentially develop into multi-hazard cascades with catastrophic consequences, emphasises the necessity for highly flexible monitoring and continuous risk assessments (Clague et al., 2012; Klimeš et al., 2021; Picarelli et al., 2021; Zhong et al., 2025). One example of such a multi-hazard cascade was observed in the catastrophic failure event of the Birchgletscher in May 2025, where several larger rockfalls onto the glacier triggered its collapse, which developed into a rock-ice avalanche. The deposits from this event buried the village Blatten and dammed the river Lonza, creating a lake with potential for flooding (Büntgen et al., 2025). Monitoring, alongside modelling approaches and prior knowledge on hazard dynamics, represents a critical pillar for predicting hazardous events in mountain environments and protect exposed communities (Kristensen et al., 2021; Stähli et al., 2015).
Despite significant advances in monitoring technologies, including terrestrial laser scanning, differential global navigation satellite system (GNSS), interferometric synthetic aperture radar (InSAR), and camera systems, each technique faces distinct trade-offs regarding spatial coverage, temporal frequency, logistical feasibility, and line of sight (LoS) constraints (Dwivedi et al., 2016; Frodella et al., 2017; Huang et al., 2023; Schlögl et al., 2022). To overcome these challenges, Uncrewed Aerial Vehicles (UAVs) equipped with Light Detection and Ranging (LiDAR) sensors (e.g., Lelli et al., 2025) or digital cameras are increasingly deployed in mountain environments as an extension of the existing geohazard monitoring toolkit (Gerstner et al., 2025; Maschler et al., 2026a; Rossi et al., 2018). Digital cameras carried by UAVs offer high-resolution imagery, and especially photogrammetric mapping has become relatively cheap. Yet, conventional UAV surveys remain largely campaign-based often limiting their temporal frequency. While UAVs can follow predefined routes and cover mapping areas automatically, presence on site as well as several manual steps such as setup, unfolding, and battery changes are required. Recent advancements in automated and semi-autonomous UAV technologies, such as base stations housing a UAV, often referred to as UAV docks or drone docks, enable a high frequency of operations, even in remote areas, as they reduce the need for on-site presence and physical access to hazardous sites.
In this context, it is important to distinguish between different levels of operational autonomy, particularly because of different regulatory implications. Automated UAV surveys generally refer to pre-programmed flight missions that follow predefined waypoints while requiring supervision by a remote pilot, who remains responsible for safety and can intervene if necessary, e.g., during mission planning or flight execution (Nex and Remondino, 2014). In contrast, fully autonomous UAV systems would, once set in operation mode, be capable of independently deciding when and where to fly, as well as how and when to acquire data, without relying on any human intervention. While many modern UAV systems already integrate autonomous functionalities, such as adapting to environmental conditions (e.g., wind speed changes) and obstacle avoidance, these features operate at a subsystem level and do not constitute full system autonomy. As long as higher-level decision-making and safety responsibility remain with a human operator, such systems are more appropriately classified as automated or, at most, semi-autonomous. Autonomous systems, in the stricter sense, would require advanced onboard intelligence enabling the UAV to execute mission-critical decisions entirely independently and without remote pilot oversight (EASA, 2020). Accordingly, many current UAV dock systems fall within the automated to semi-autonomous spectrum, combining pre-programmed flight routines with remote monitoring instead of independently being able to decide on or adapt to evolving monitoring priorities.
The dock-based UAV system used in this study allows for fully automated flight operations, including take-off, mission execution, flight abortion in case of emergency, landing, charging, and wireless data transfer. In a previous study, a similar dock-based UAV system was tested to map surface elevation changes for sediment monitoring in Switzerland (Walter et al., 2022). Although UAV docks represent a significant advancement in automated UAV technology, their potential to enhance geohazard monitoring by tracking surface displacements and changes in remote alpine environments and their usability across different geohazard setting is yet largely unexplored.
This study presents the first systematic field evaluation of a dock-based automated UAV system coupled with a new automated workflow for displacement and change detection, tested across three contrasting geohazard settings in mountainous terrain. We demonstrate the potential of using a UAV dock for hazard monitoring and assessment of (1) a fast-moving glacier icefall, (2) a complex unstable rock slope, and (3) post-failure deposits from a catastrophic glacier collapse. The central research question of this study is to what extent automated UAV monitoring can improve the observation and analysis of geohazards. Given the differences in process dynamics, spatial extent, and expected deformation signals across the study sites, more specific research questions are formulated for each case. For (1) the focus is on how high-frequency, automated UAV monitoring can capture short-term glacier dynamics in a steep and inaccessible icefall, and which temporal and spatial resolutions are required to resolve these processes. For (2) the key question is how automated UAV systems can be applied to analyse complex slope instabilities characterised by relatively low displacement rates to delineate displacement zones and detect changes in the unstable rock slope. And finally, for (3), we investigate the possibilities and limitations of a dock-based UAV system for monitoring the temporal evolution of secondary hazards in access-restricted post-disaster environments and seek to derive operational lessons from its deployment. By assessing the operational reliability, data quality, and monitoring capabilities under real-world conditions, this work addresses a critical gap in current research concerning the practical deployment and performance of automated UAV systems. Beyond visual inspection of hazardous sites, effective hazard management requires the ability to capture displacement patterns and track terrain changes in real time. To address this challenge, we introduce a novel workflow that integrates multitemporal data acquisition from UAV docks with an end-to-end processing pipeline for displacement field generation and change detection. Across the three complementary study sites, the results demonstrate that UAV docks provide highly spatially and temporally resolved data for pre-failure assessment of unstable slopes and glacier hazards, rapid-response mapping immediately after failure events, and situational awareness in the aftermath of catastrophic multi-hazard scenarios, where access for UAV surveys with on-site pilot presence is impossible due to high risk. At the same time, we compare in which scenarios standard UAV missions remain advantageous and those in which dock-based systems offer clear benefits. We evaluate the feasibility and limitations of automated UAV technology, complemented by a brief accuracy assessment. Drawing on our operational experience, we highlight how automated monitoring can contribute to both research on mass movements and practical geohazard management. We identify current challenges and provide recommendations on what is needed to advance automated monitoring networks in difficult to access and high-risk terrain.
We tested our innovative monitoring approach, composed of a dock-based UAV system and an automated data processing workflow, at two locations in Norway and one in Switzerland: (1) Supphellebreen is an outlet glacier of Jostedalsbreen ice cap, the largest ice mass in continental Europe; (2) Skjøld is a large and complex unstable rock slope in Vang municipality, Norway; and (3) the Blatten locality in Lötschental, Switzerland, where a catastrophic ice-rock-debris avalanche occurred in 2025. The selection of the sites was guided by the aim of capturing different geohazard types, process dynamics, and operational constraints relevant to UAV-based monitoring. The sites represent contrasting hazard processes, including glacier dynamics with potential glacier lake outburst floods, a slow-moving unstable rock slope, and rapid post-failure movements in deposited masses. In addition, the sites cover a range of spatial scales and deformation rates as well as varying degrees of accessibility and feasibility for both conventional and UAV-based monitoring approaches.
The terminal part of Supphellebreen consists of a fast-flowing icefall in steep and inaccessible terrain that makes conventional measurement campaigns and the installation of in-situ instruments impractical and hazardous. The complex unstable mountain slope, Skjøld, covers over 1.4 km2 and has displacement rates below 1 m a−1. The terrain allows for implementing traditional in-situ instrumentation, which is, however, time-consuming and contains substantial risk due to the unstable nature of the site and frequent rockfalls. The third site, Blatten, represents a post-failure rock and ice avalanche scenario, where a UAV dock was successfully deployed for hazard mapping and risk assessment. Following the rock and ice avalanche event, the area remained inaccessible due to persistent instability, which prevented the use of conventional ground-based monitoring. In this context, frequent UAV surveys enabled the generation of up-to-date high-resolution surface models, supporting ongoing hazard assessment by documenting morphological changes, identifying zones of continued instability, and providing critical spatial information for risk evaluation. It is important to note that the deployments in Norway were conducted as controlled test cases, with an on-site operator supervising the automated surveys and to evaluate the technical feasibility and performance of the dock-based UAV system and automated processing workflow under realistic field conditions.
2.1 Supphellebreen – an outlet glacier of Jostedalsbreen ice cap, Norway
Supphellebreen (61°28′31.1′′ N, 6°48′31.5′′ E) is an outlet glacier in the southern part of Jostedalsbreen ice cap in Fjærland, western Norway (Fig. 1). The glacier below is classified as a regenerated glacier because the glacier terminus is detached from the main glacier above (Fig. 1a). The regenerated glacier is fed by snow and ice avalanche activity from the icefall at the margin of the upper part of the glacier and exists at a very low altitude of about 60 m a.s.l.; thereby, being the lowest glacier in Norway. The heavily crevassed icefall channels glacier ice at high flow velocities from an accumulation area that reaches up to 1690 m a.s.l. and has a maximum ice thickness of about 435 m (Gillespie et al., 2024) to a steep mountain slope where the ice dry-calves (Fig. 1b). Although no previous studies about the glacier dynamics and ice velocities of Supphellebreen exist, it can be assumed that the ice flow velocity at the icefall is controlled by changes in ice thickness and the amount of subglacial meltwater. Temporal variations in ice velocity and episodic acceleration during moderate to heavy rainfall events and intense melting of snow and ice have been observed at other outlet glaciers from Jostedalsbreen (e.g., Wangensteen et al., 2006; Hart et al., 2025). As a consequence of climate change, Supphellebreen has lost approximately 16 % of its area since its maximum Little Ice Age extent in 1750 (Carrivick et al., 2022) and glacier change simulations indicate that Supphellebreen will undergo severe thinning and recession in the future, particularly from the last decades of the 21st century (Åkesson et al., 2025). In 2004, a glacier lake outburst flood (GLOF) occurred at Supphellebreen due to significant lake level increase triggering the breaching of the moraine ridge and the subsequent drainage of the moraine-dammed lake. This lake level rise was due to unusually heavy snowmelt and rain in spring, before the usual subglacial drainage channels were fully established (Breien et al., 2008). The GLOF impacted a popular hiking path, though no causalities occurred, as the event took place off-season. The volume of eroded debris along the channel was approximately 240 000 m3, and around 250 000 m2 of the valley's farmland was inundated (Breien et al., 2008). In November 2022, an atmospheric river that affected Western Norway led to a debris flow in the Tverrdøla catchment in Supphelledalen. While this event was smaller than the debris flows resulting from the 2004 GLOF, as it did not involve moraine breaching, it still caused considerable damage to fields, the road, and a bridge, isolating 5 people in the valley (Andreassen et al., 2023; Buskas, 2024). During this debris flow event significant amounts of water drained through the well-established subglacial drainage system below the icefall. The viewpoint below Supphellebreen is frequently visited by locals and tourists, however, access to the regenerated glacier and the area around it is prohibited due to icefall risk. Apart from smaller icefall and serac collapse events, Supphellebreen is currently not considered a significant hazard. Given its steep icefall setting and recent glaciological history, Supphellebreen provides an excellent site for investigating velocity changes in steep, fast-flowing glaciers that may precede partial glacier failure or large-scale collapse events.

Figure 1(a) Overview map showing the location of Supphellebreen, the icefall, the lake and the regenerated glacier below. The monitored glacier areas are highlighted in blue. Contour lines indicate elevation in m a.s.l. (b) The aerial imagery (camera location is indicated in panel (a) as an orange dot) shows the heavily crevassed icefall at 1000 m a.s.l. Location of Jostedalsbreen in Norway (inset) Elevation data: Kartverket.
2.2 The complex unstable rock slope Skjøld in Vang municipality, Norway
The complex rock slope instability Skjøld (61°08′48.0′′ N, 8°26′33.2′′ E), is situated south of lake Vangsmjøse in Vang Municipality, Norway (Fig. 2). The European Route E16 runs along the base of the slope, highlighting the potential hazard to infrastructure. The bedrock in the area consists of strongly foliated phyllite of the Fortun-Vang nappe in the lower section, overlain by gabbroic, granitic and monzonitic gneiss of the Jotun nappe (Heim, 2003). The unstable area (1.4 km2) extends from an elevation of 670 m a.s.l. up to the summit of Bergsfjellet at 1585 m a.s.l.. A prominent 250 m-high vertical cliff marks the upper boundary of the slope (Fig. 2b). The majority of the slope is covered by scree deposits, with block sizes ranging from 1 to 500 m3 and is characterised by displacement rates of up to 0.75 m a−1. Several distinctive rock towers are located in the upper part of the slope. Recent failures from the vertical top cliff occurred in October 2019 and 2021, with major deposition on the scree below and single boulders reaching beyond the foot of the scree deposits (Norwegian Water Resources and Energy Directorate Atlas). In the western section, a well-defined rock slab with an estimated volume of > 106 m3 is bounded by up to 20 m wide open fractures and currently exhibits minimal displacement. However, due to its considerable volume and the potential runout distance, this section represents a significant hazard in case of potential future acceleration and failure scenarios. Frequent rockfall activity is observed across the slope throughout the year, with a marked increase during spring, likely associated with freeze-thaw cycles and snowmelt processes. The site has not yet been assigned a risk class within the Norwegian classification system for unstable rock slopes (Hermanns et al., 2013) and its processes and activity are currently under investigation for research purposes.

Figure 2(a) Location of the unstable rock slope Skjøld above the road E16 and Vangsmjøse in eastern Norway (inset). Contour lines indicate elevation in m a.s.l. (b) Photograph showing the location of the main tower, the failure events from 2019 and 2021 (red outlines) and the rock slab (orange outline). The camera location is indicated in panel (a) by an orange dot. Elevation data: Kartverket.
2.3 The multi-hazard cascade in Blatten, Lötschental in Valais, Switzerland
Following several rock slope failures from Kleines Nesthorn (Fig. 3) onto the underlying Birchgletscher (46°24′11.9′′ N, 7°50′11.8′′ E) the glacier collapsed catastrophically on 28 May 2025 (Büntgen et al., 2025). 9.57 × 10⁶ ± 1.39 × 10⁵ m3 of rock and ice were deposited in Lötschental burying large parts of the village of Blatten (Yang et al., 2026). A UAV dock was rapidly deployed and automated UAV flights were carried out 1 d after the event until 18 November 2025 to monitor changes in the ice-containing landslide deposits, in the dammed or kettle lake formation, and to assist in ongoing hazard assessment and response efforts.
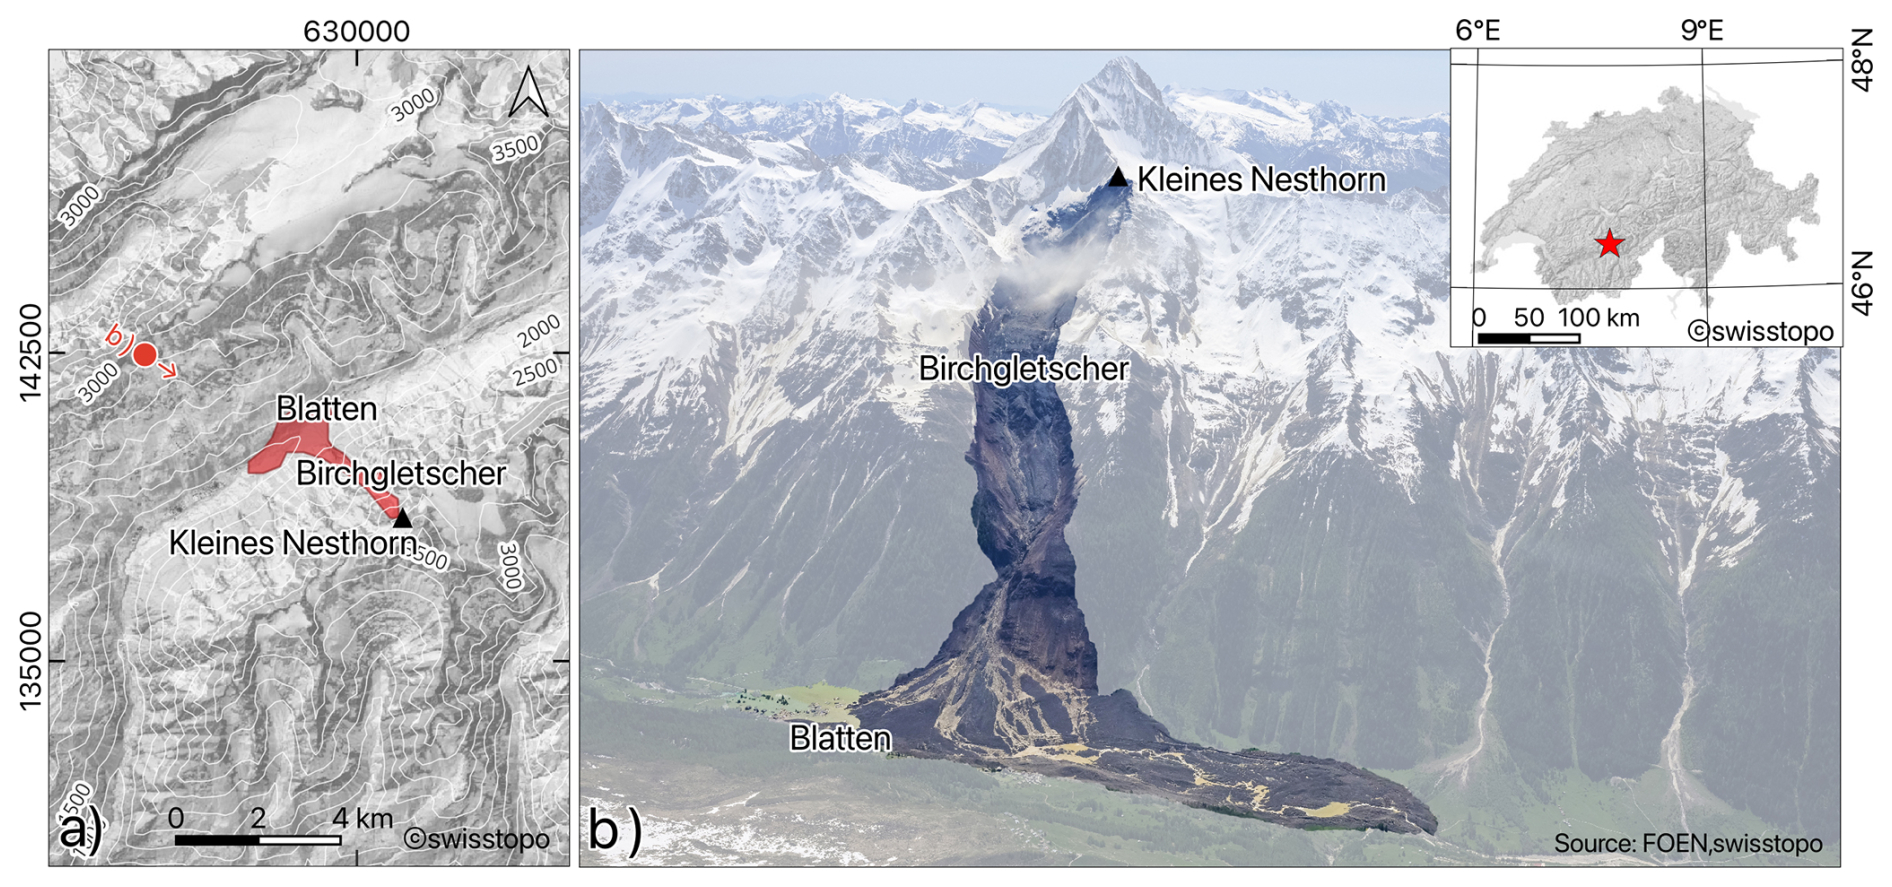
Figure 3(a) Map showing the location of the ice-rock-debris avalanche from Birchgletscher and Kleines Nesthorn in southwestern Switzerland (inset). Contour lines indicate elevation in m a.s.l. (b) Aerial photograph taken by the rapid mapping campaign (Source: FOEN, swisstopo) showing the extent of the failure event from 28 May 2025, destroying the village of Blatten. The camera location is indicated in panel (a) by a red dot. Basemap: Swisstopo.
The upper part of Birchgletscher has been monitored after an ice avalanche event (40 000 m3) in 1993, which impacted skiing infrastructure (Walliser Bote, 1993). Since 2019, however, the lower part of the glacier front advanced approximately by 50 m related to acceleration of ice flow. Simultaneously, thinning of ice was observed in the upper reaches, while ice thickness at the lower part of the glacier increased by 30 m between 2011 and 2023 (Farinotti et al., 2025). This may be explained by accumulation of rock debris from periodic, pre-event rockfalls that insulated the glacier ice, reducing melting rates on the lower part of the glacier. Due to the enhanced thickening and moderate rainfall, the glacier front started to accelerate to 0.5 m per day in the days up to the glacier collapse (Islam et al., 2025). A combination of drivers led to the multi-hazard cascade on 28 May 2025. These drivers likely included terrain motion due to partial collapse of the unstable Kleines Nesthorn lying within an area of probable permafrost, and rock debris accumulation on the glacier surface of the underlying Birchgletscher (Farinotti et al., 2025). Furthermore, a strong increase in rock-ice thickness would cause pressure melting and accelerate the sliding velocity of a temperate glacier. Consequently, Birchgletscher collapsed (i.e., the glacier front separated from the upper part of the glacier, disintegrated, and was displaced down-valley) and buried the village of Blatten (Büntgen et al., 2025). Local authorities issued an evacuation order for citizens to evacuate the village on 19 May 2025. Geohazard monitoring and timely early warning prior the catastrophic glacier collapse facilitated the evacuation of around 300 residents with their livestock to nearby villages outside the hazard zone in Lötschental. The deposits dammed the river Lonza and created a lake which necessitated close monitoring. Alongside the social and environmental impacts, the 28 May 2025 Blatten event also caused a significant economic impact, with initial estimated costs of around CHF 320 million (Islam et al., 2025).
3.1 Novel automated monitoring workflow
In this study we introduce a new automated, end-to-end workflow for multitemporal 3D monitoring of complex mountainous terrain, using a UAV operated from a dock. The workflow comprises five core components (Fig. 4): (a) flight planning (human input), (b) flight management, execution, data capturing, and data upload done by the UAV dock (automated with human remote supervision), (c) image processing and dense 3D reconstruction (automated), (d) spatiotemporal change and displacement analysis (automated), and (e) accuracy assessment (automated). The system is designed for near-continuous automated operation with minimal human intervention, enabling frequent and consistent surveys in complex and remote environments.

Figure 4Workflow for multitemporal UAV monitoring, displacement and change detection analysis in mountainous terrain, consisting of (a) flight planning, (b) flight management by the UAV dock. Photograph shows the dock in operation at the study site Skjøld, (c) image processing and 3D reconstruction, (d) spatiotemporal change and displacement detection (optical flow on DSM and M3C2 on point cloud), and (e) accuracy assessment.
3.2 Data capturing using an automated UAV system
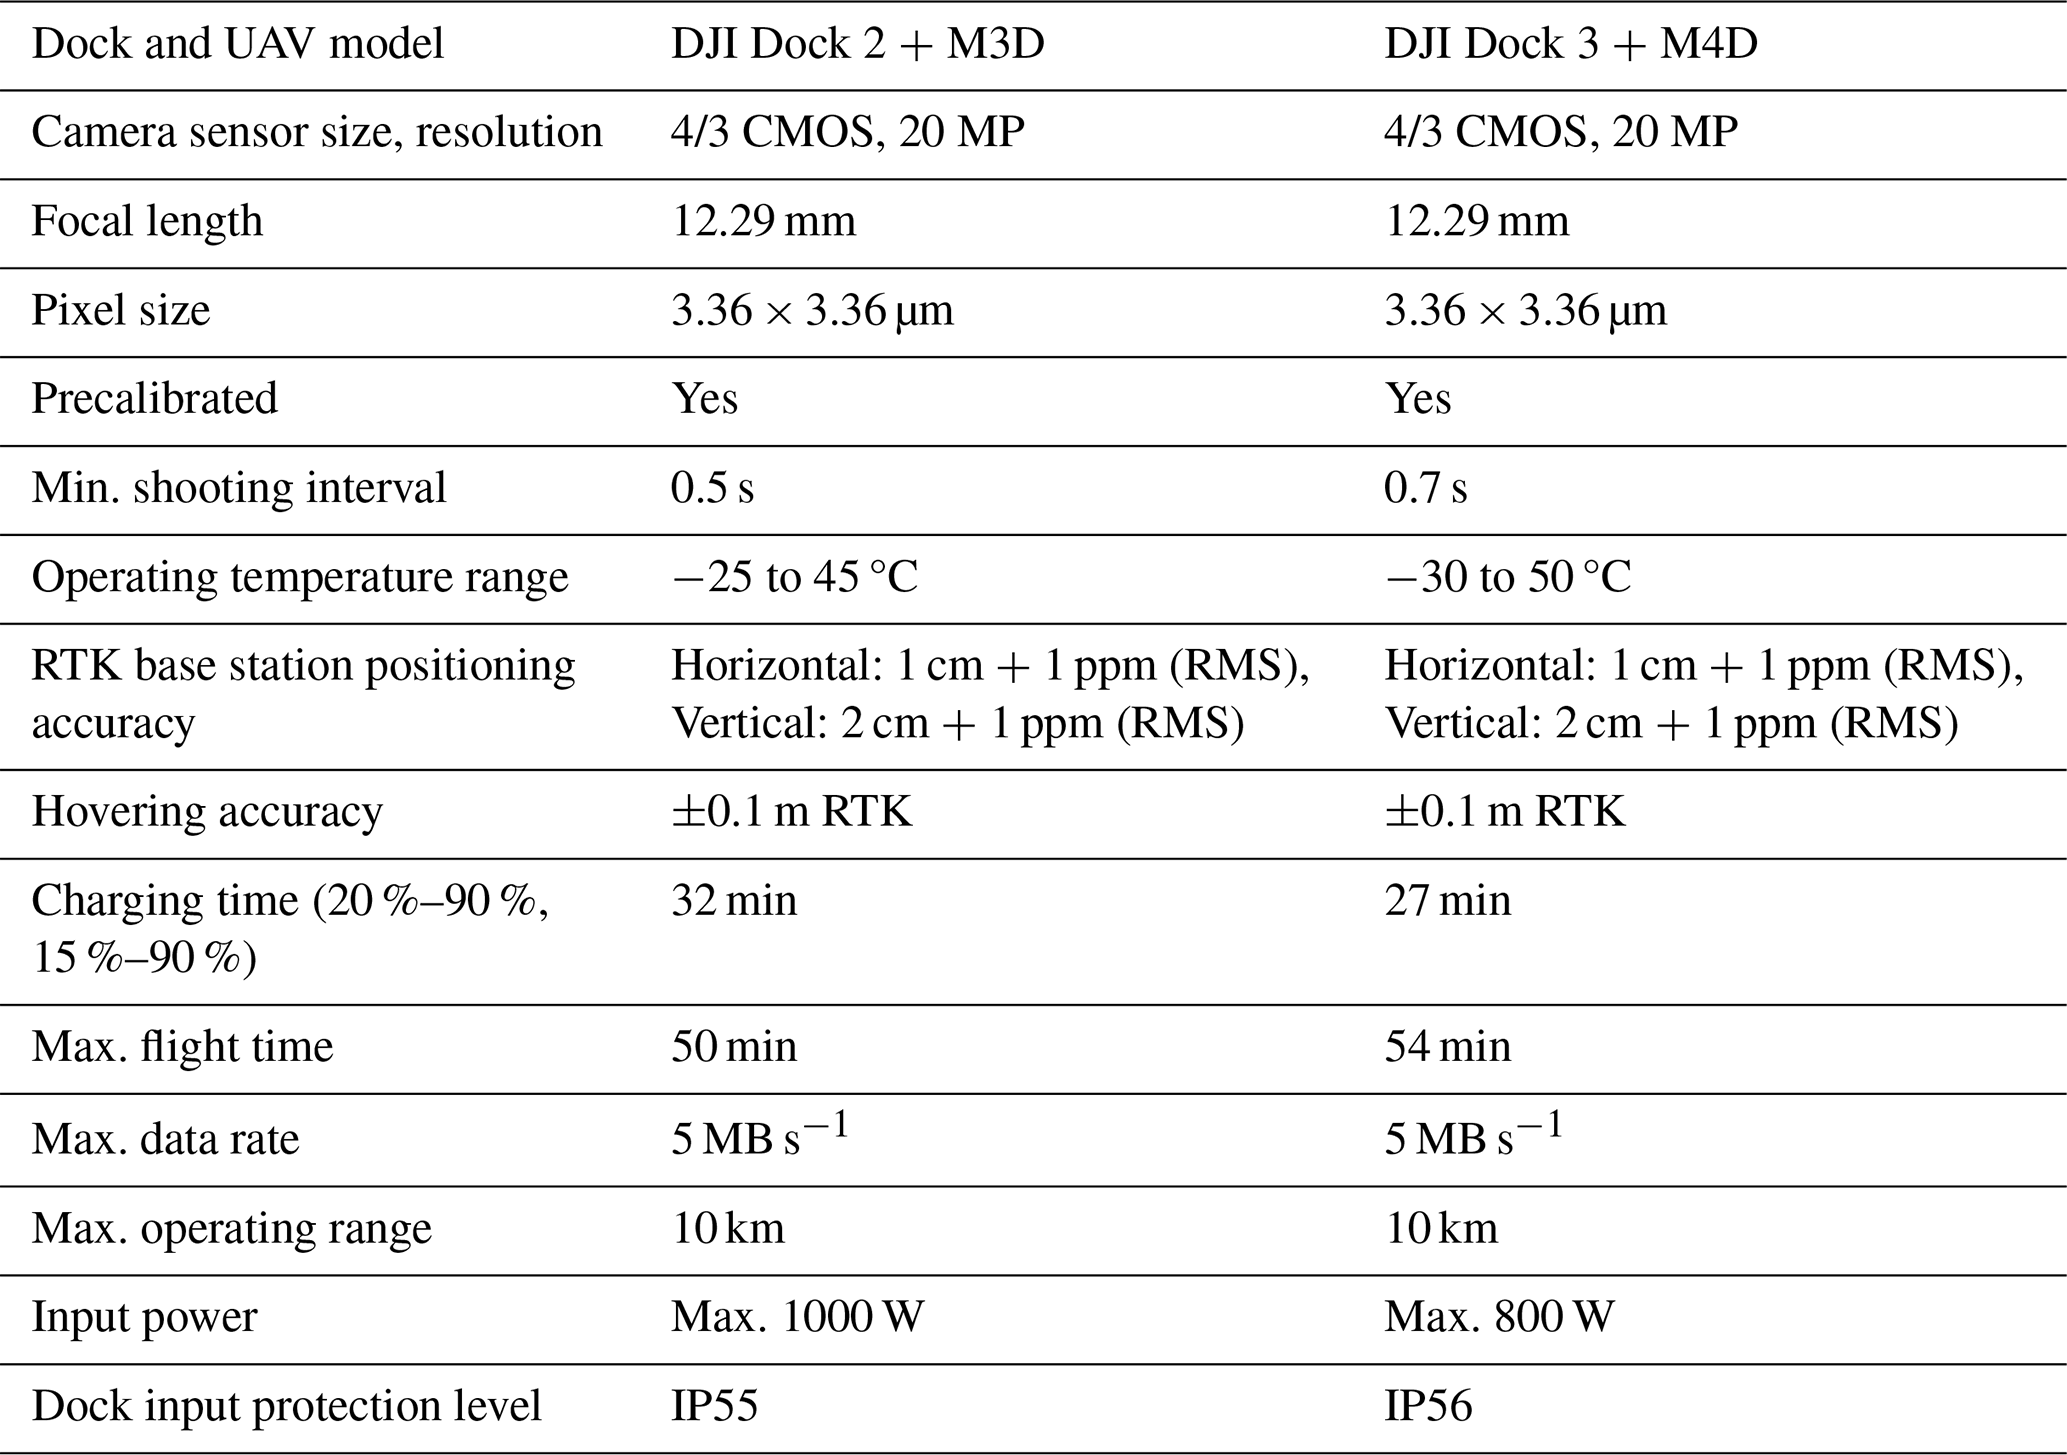
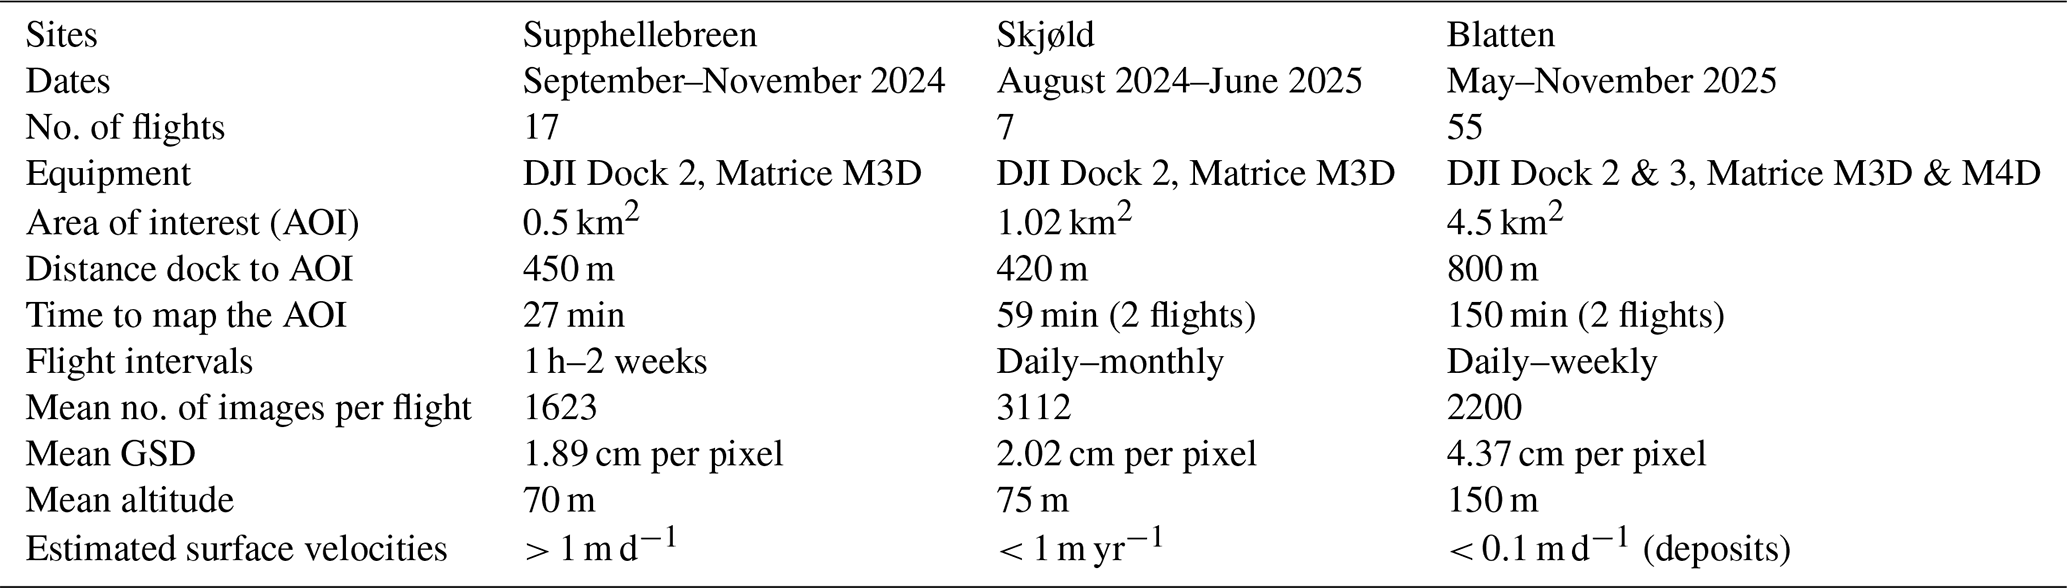
The automated UAV system consists of a UAV dock, the DJI Dock 2 & 3 in this study, and its compatible multirotor UAVs Matrice 3D and 4D. The dock provides weatherproof housing, inductive battery charging, thermal regulation (cooling/heating), data transmission, and enables remote mission execution. The inbuilt weather station allows for wind speed and precipitation monitoring and prohibits the UAV from taking off in case of bad weather. For terrain adaptive flight planning and the UAV and dock management, we used the cloud-based software DJI FlightHub 2. The UAVs are equipped with a 20 Megapixel RGB sensor with a mechanical shutter. Detailed technical specifications of the camera sensor are presented in Table 1. For the geo-localisation, we use the inbuilt real-time kinematic positioning (RTK)-GNSS and correction data from base stations nearby, streamed via NTRIP. For the tests in Norway, the system was not permanently installed; instead, we deployed the UAV dock temporarily at each site, with a pilot and observer present to ensure compliance with aviation safety regulations. The dock has a baseline standby power consumption of approximately 50–100 W, increasing to levels around 800–1000 W during charging, with short peaks of up to ∼ 1200 W with internal heating or cooling on. Power was supplied by several 600 Wh portable power stations and communication with the dock was established using a local network, provided by a 4G router and connection via ethernet cable. Flight missions were scheduled at hourly, daily, and weekly intervals to capture high-resolution aerial imagery. At Supphellebreen, we scheduled the daily flights mainly in the evenings in civil twilight about 10 min after sunset to achieve uniform, diffuse illumination conditions across the glacier surface. Terrain-following flight paths were generated using a high-resolution digital elevation model (DEM) derived from the initial survey at each site. In the flight planning phase, the area of interest and the target ground sample distance (GSD) was manually selected. Redundant image coverage with at least 85 % forward and lateral overlap was implemented to ensure robust 3D reconstruction under varying illumination and surface conditions. Table 2 shows an overview of the UAV operations at the different study sites. In Norway, flights were conducted at mean altitudes of 70–75 m above ground, leading to a mean GSD of 1.95 cm per pixel. In Blatten, two UAV docks (DJI Dock 3) were installed in the evacuation zone. The deployment of two dock systems further allowed for a reduction in airspace occupation time while simultaneously introducing hardware redundancy. Power was supplied by the grid, and communication was established using a 4G router and a Starlink access point. Each flight at 150 m altitude captured imagery with 4.37 cm per pixel resolution, georeferenced using RTK and virtual ground control points. Flights were conducted up to 3000 m a.s.l. under remote supervision, sometimes requiring dynamic mission adjustment. This included real-time adaptation of flight paths and image acquisition density to rapidly changing weather and airspace constraints.
Table 1Technical specifications of the UAV docks, the UAVs and the camera sensors (DJI, 2024, 2025).
3.3 Data processing workflow
3.3.1 From multi-view imagery to 3D: Gaussian Splatting and Structure from Motion processing
After mission completion, the acquired aerial imagery was automatically transferred to the internal data storage of the dock and then uploaded to FlightHub 2 and stored for further analysis following our processing pipeline. For the dense 3D reconstruction, we implemented two distinct processing pathways (Fig. 4c): (1) a rapid 3D reconstruction approach based on Gaussian Splatting (Kerbl et al., 2023), which is a neural rendering method that represents scenes as collections of 3D Gaussian primitives and enables fast, high-fidelity visualisation suitable for time-sensitive situational awareness for decision-makers, media, and the public, and (2) a photogrammetric Structure-from-Motion (SfM) pipeline aimed at producing high resolution point clouds, orthophotos, and digital surface models (DSMs). For the SfM 3D reconstructions we mainly used DJI Terra (cloud processing implemented in FlightHub 2) and for some datasets OpenDroneMap (ODM) (OpenDroneMap Authors ODM, 2025). DJI Terra was used due to its cloud integration within the flight management software FlightHub 2 and streamlined data management. We utilised ODM as a complementary open-source solution that provides higher processing flexibility and adjustability for monitoring dynamic processes in complex alpine terrain (Groos et al., 2019; Toffanin, 2023).
3.3.2 Change detection and displacement analysis
The photogrammetric products obtained from the SfM processing were further analysed to detect changes such as rockfalls or ice calving, 3D and 2D displacements. The data acquisition epochs were processed as successive pairs (e.g. A–B, B–C,) to minimise decorrelation, which is especially important for rapid mass movements such as the icefall at Supphellebreen. For the slow-moving unstable rock slope Skjøld, we processed the datasets against the base line dataset (1st survey) (e.g. A–B, A–C,) to increase the sensitivity for displacement detection. For three-dimensional displacement analysis, we applied the Multiscale Model-to-Model Cloud Comparison M3C2 algorithm (Lague et al., 2013) to the point clouds, enabling quantification of surface changes along the normal direction of the reference surface. For the multitemporal analysis, we used the py4dgeo library for change analysis in 4D (3D + time) point clouds (py4dgeo Development Core Team, 2022). For the calculation of two-dimensional horizontal displacements, we used multidirectional hillshades (generated from the DEMs) and applied the Dense Optical Flow algorithm Dense Inverse Search (DIS) (Kroeger et al., 2016). Previous studies have shown that DIS overcomes the limitations of classical area-based algorithms, such as Phase Correlation (PC), which frequently suffer from decorrelation noise and restricted velocity ranges when analysing fast-moving glaciers and complex landslides (Hermle et al., 2022). DIS, an intensity-based approach (Kroeger et al., 2016) proved to be more sensitive, less rigid, more flexible, and less constrained than traditional methods. DIS performed robustly under unfavourable illumination conditions and was capable of reliably tracking displacements in challenging steep high-alpine sites. Nevertheless, in areas where extremely rapid surface motion occurs, DIS tends to underestimate displacements, and the results obtained from such areas should therefore be interpreted with caution (Hermle et al., 2022).
3.3.3 Accuracy assessment
In order to support confidence in the obtained results, we hereby include an assessment of data accuracy and quality, although this is not the primary aim of this study. To assess the data quality and accuracy of the displacement measurements, we followed common practice in UAV-based monitoring studies (e.g., Chudley et al., 2019) by manually defining stable, non-moving reference areas (“stable areas”) at each study site: (1) at Supphellebreen, we used stable bedrock below the glacier front; (2) at Skjøld, we used stable rock surfaces outside the instability; and (3) at Blatten, we used buildings located outside the deposition area. Due to inaccessibility of the areas of interest and, especially for Supphellebreen, the risk of icefall and avalanches, ground control points could not be installed. We quantified the uncertainty of both 2D surface displacements (DIS optical flow) and 3D changes (M3C2) by measuring residuals in these stable areas. The variability of these residuals provides an empirical estimate of the detection limit at 95 % confidence, expressed as LoD95 = 1.96⋅σ, where σ is the standard deviation of the residuals. As in previous studies (Fey and Wichmann, 2017; Kromer et al., 2017; Lague et al., 2013) we interpreted this 95 % confidence interval or Level of Detection at 95 % (LoD95) as an estimate of the minimum detectable change.
In the following section, we highlight representative results for each specific study site. The findings reveal that automated UAV systems can effectively monitor surface changes and velocity patterns with a high temporal and spatial resolution.
4.1 Monitoring of the icefall at Supphellebreen
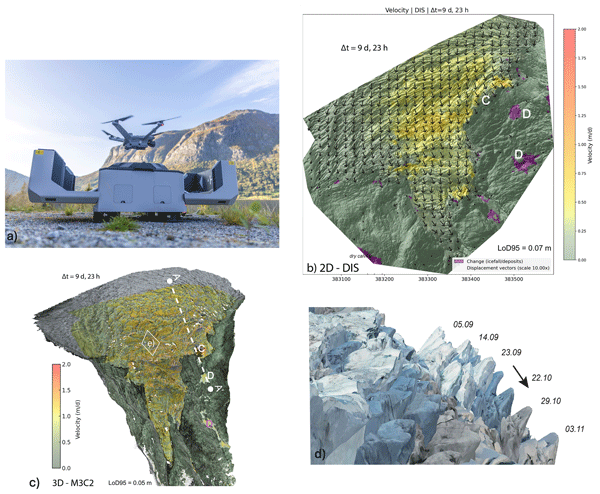
The dataset collected at Supphellebreen, at time intervals between 1 h and 2 weeks, offers unique insights on glacier dynamics, especially short-term processes, including acceleration phases of the glacier and single seracs (standing blocks of ice in the icefall), crevassing, and several dry calving events (Fig. 5). The glacier surface velocities at the icefall of Supphellebreen between September and November ranged from 0.4 to 1.5 m d−1, with higher rates observed in steeper sections of the icefall (Fig. 5a–d). We could determine volumes and detect pre-failure acceleration of single seracs (Fig. 5a, d; marked with a C), exceeding 5 times the normal ice velocities. In the subsequent surveys, we identified run-out and ice deposition (marked with a D). Flow direction was mainly towards the southeast following the terrain, and there was minimal displacement towards the terminal moraine. Surface elevation changes in those almost stagnant ice zones indicated ablation rates of up to −0.06 m d−1. Gaussian Splatting was used to create photorealistic 3D representations of the glacier surface from the different mapping campaigns (Fig. 5e). Compared to multitemporal UAV surveys with on-site pilot presence, the dock-based approach allows for automated data collection with short flight intervals and enables the detection of short-term processes in the icefall.
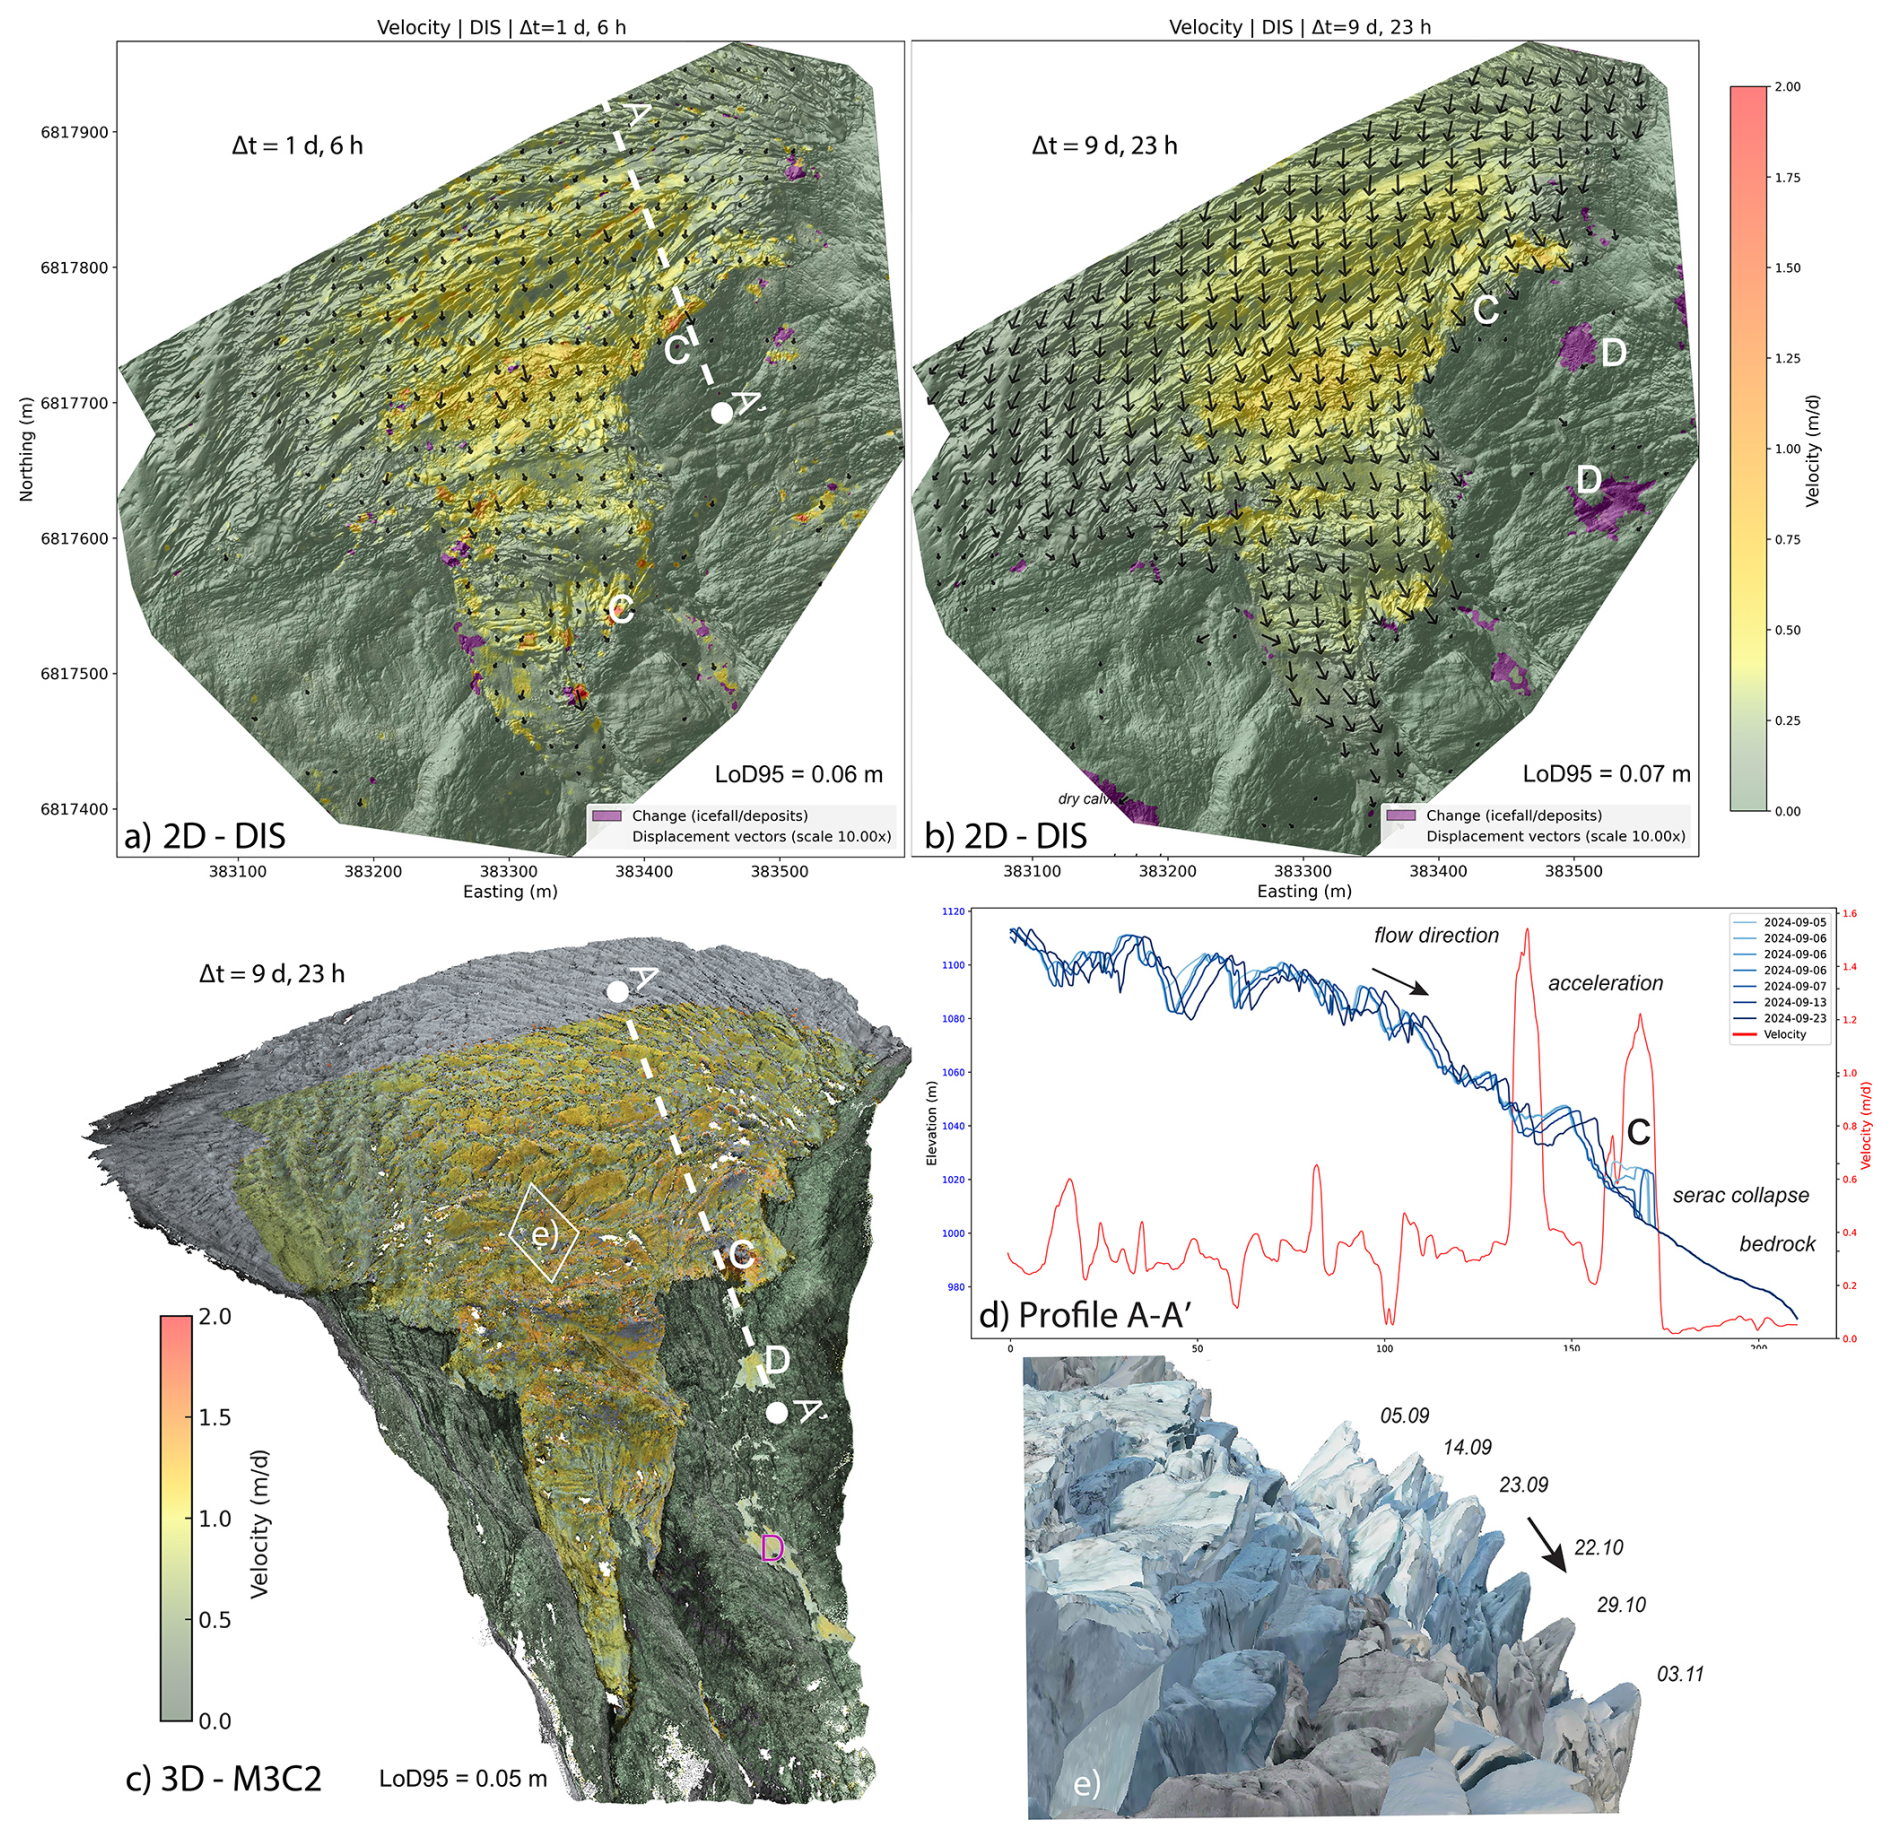
Figure 5Changes detected at the upper part of Supphellebreen. (a) Horizontal displacement (DIS) for a one-day interval, (b) for a ten-days interval. (c) 3D changes derived from point clouds using the M3C2 algorithm over the same time interval; white spots are gaps in the point clouds. (d) Longitudinal profile A–A′, showing glaciers surface and the flow direction between 5 and 23 September 2024. The red line shows the horizontal velocity along that profile. Point C marks a section that showed increased acceleration prior collapse. The deposits are marked with a D below in panel (b). (e) Photorealistic 3D models derived by Gaussian Splatting showing several seracs (location is indicated in panel (c) between 5 September and 3 November 2024).
4.2 Monitoring of a complex unstable rock slope at Skjøld
We demonstrated the system's ability to monitor and analyse the kinematics of the unstable rock slope at Skjøld (Fig. 6). Annual horizontal displacements at the site typically remain below 1 m and generally range between 0.2 and 0.4 m.

Figure 6Monitoring results at the complex unstable rock slope Skjøld. (a) 2D displacement field (DIS). (b) Inset shows the contact between the “tower” and the area with higher displacement rates (purple shows changes, such as rockfall detachment and deposition). (c) Profile showing the displacement vectors and the surface 2013, 2024, 2025. (d) 3D model (Gaussian Splatting) showing the main section of the rock slope. (e) DIS and (f) Photograph showing the detachment (white arrows) of several rockfalls from the “tower” between August and November 2024.
The multitemporal photogrammetric data collected in this study allow us to delineate the extent of the instability (Fig. 6a, b) and to assess the kinematic behaviour of individual structural features such as the isolated rock towers and the scree slope underneath (Fig. 6b, c). Most of the scree slope shows displacement rates of approximately 0.25 m yr−1, while no measurable movement was detected in the rock towers. If the towers should move downslope, their displacement remains below the detection threshold of 0.07 m for our displacement analysis. Short-term GB-InSAR campaigns by the Norwegian Water Resources and Energy Directorate confirm that most displacement is concentrated directly below the towers, which is consistent with the UAV-derived delineation of the instabilities (Fig. 6b, c). Using the point clouds and DEMs we could reconstruct the 3D displacement vector which dips approx. 70° towards the north. Consequently, the horizontal component represents only a small fraction of the total displacement. Between August and November 2024 several smaller rockfalls could be detected from the tower (Fig. 6d–f). Compared to standard multitemporal UAV surveys, the dock-based approach can keep predetermined flight intervals of about 2 weeks, while in periods of displacement acceleration or increased rockfall activity this can be adjusted rapidly to shorter flight intervals.
4.3 Post-disaster UAV mapping and rapid response at Blatten
The automated monitoring campaign following the rock-ice avalanche event at Blatten highlights the possibilities offered by automated UAV systems in post-disaster response, especially in areas that remain potentially hazardous and where human access is therefore restricted. Two DJI Dock 3 units conducted twice-daily automated flights in close coordination with police and emergency authorities and air traffic in the area. The docks were installed close to the evacuation zone and could only be visited once during the monitoring period due to safety restrictions and ongoing hazard activity. This situation emphasises the critical importance of robust remote control and automated functionality for monitoring in hazardous, high-risk environments.
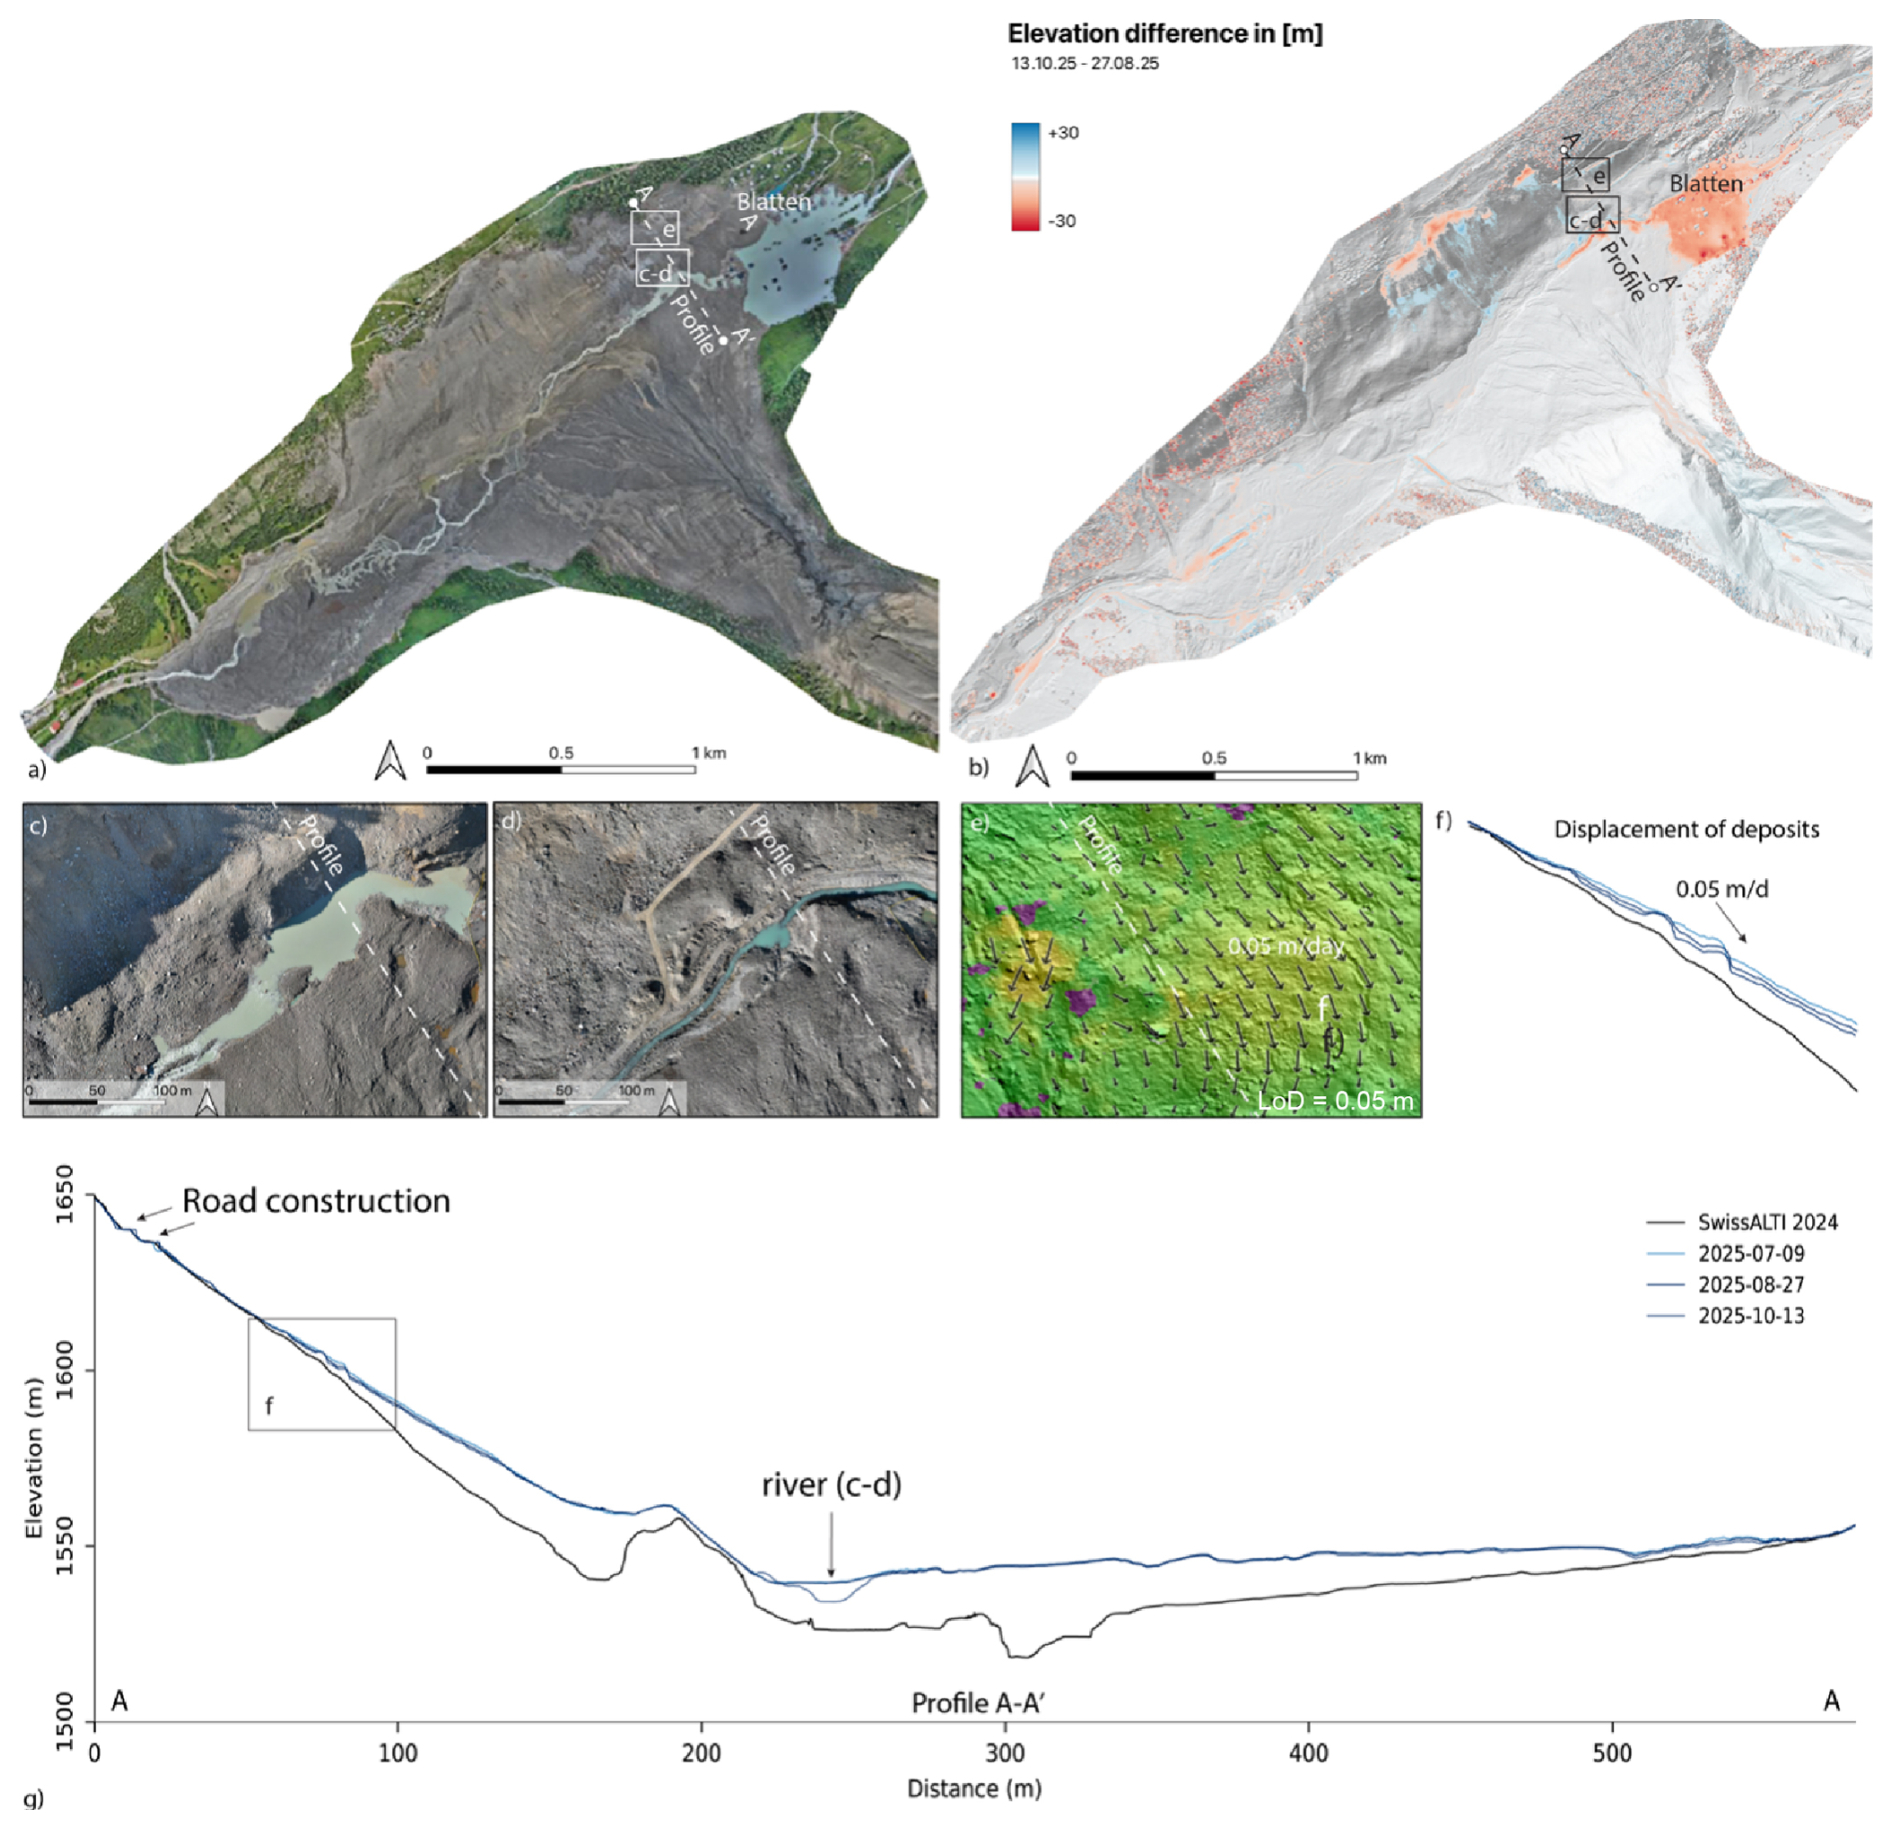
Figure 7(a) Orthophoto of the monitored area after the rock-ice avalanche event at Blatten. (b) DoD elevation difference between 27 August and 13 October 2025. (c–d) Changes along the river channel between 27 August and 13 October 2025. (e) Horizontal displacement (DIS) of the deposits on the adjacent slope. (f–g) Profiles through the deposits. The black lines correspond to the terrain before the event (Swiss Alti 2024), while the blue lines are selected UAV surveys after the event between July and October.
Figure 7 illustrates the monitored deposition area of the rock-ice avalanche (Fig. 7a) and representative analysis results, e.g., elevation differences between the two UAV campaigns from 27 August and 13 October 2025 (Fig. 7b), revealing zones of erosion (red), deposition (blue), and lake development, as well as subsequent lake outflow pathways (Fig. 7c, d). Due to the melting of ice-rich debris, subsidence and downslope displacement affect the deposits (Fig. 7e, f). The highest displacement rates were recorded in the run-up deposits on the SE-facing slope reaching 0.05 m d−1 between July and August, gradually decreasing over time. The cross-sections (Fig. 7g) compare pre-event topography (SwissALTI 2024) with three UAV-derived post-event mapping, and also depict recovery efforts, such as newly constructed access roads. Due to high risk and the closure of the evacuation zone, UAV surveys requiring an operator on site would not have been possible, while the dock-based approach secured regular mapping, directly generating situational insights, without exposing personnel to risk. During the initial stage of the damage assessment, geologists primarily relied on the UAV-derived survey results to support continuous site evaluation. At later stages, the datasets were increasingly utilised by engineering and construction teams responsible for on-site operations. A range of stabilisation and reconstruction activities, including slope stabilisation, hydraulic engineering, road construction, and remediation works were carried out based on the UAV system derived elevation models, distance measurements, and volume calculations. Photogrammetric processing achieved spatial accuracies of approximately ±5 cm over an area of 4.5 km2. Individual flights generated data volumes of approximately 10 GB, requiring careful optimisation of flight parameters and image acquisition strategies.
4.4 Accuracy assessment
An accuracy assessment was conducted using stable reference areas defined for each site. The results of the reprojection error, camera location error and LoD95 for the UAV surveys are summarized for each study site in Table 3. The LoD values are mainly below 0.10 m across the study sites. Mean LoD values are 0.07 m for both Supphellebreen and Skjøld, and 0.08 m for Blatten. The minimum LoD values range between 0.03 and 0.04 m, while maximum values reach up to 0.12 m, reflecting variability in survey geometry, surface texture, and georeferencing quality. For Supphellebreen, a detailed comparison was conducted between LoD values derived from 2D and 3D displacement analyses (Fig. 8a). The 2D displacement measurements derived from optical flow (DIS), yield a mean level of detection (LoD95) of 0.09 m with min/max values ranging between 0.06 and 0.17 m (Fig. 8b). In contrast, the 3D displacement analysis based on point clouds and the M3C2 algorithm shows consistently lower LoD95 values, with a mean of 0.07 m and a narrower range between 0.04 and 0.09 m depending on the acquisition date. Temporal variability in LoD95 reflects differences in georeferencing quality between surveys (Fig. 8c, d). Displacement measurements exceeding the calculated LoD95 thresholds can be interpreted with high confidence as true surface displacement rather than noise. Importantly, LoD95 values should be determined for each survey pair and serve as a critical quality metric, establishing the threshold above which measured displacements can be regarded as reliable. For the displacement analysis, a consistent reference direction was defined. For the 2D optical flow, calculated on hillshaded DEMs in map coordinates, positive values indicate downslope motion, and negative values indicate upslope motion (e.g., retrogressive erosion). In the 3D M3C2 analysis, distances are measured along the surface normal, with positive values representing outward movement (e.g., accumulation or downslope movement) and negative values indicating inward movement (e.g., erosion). This ensures a consistent and physically correct interpretation of the displacement measurements.
Table 3Photogrammetric accuracy metrics and LoD95 across the different study sites.

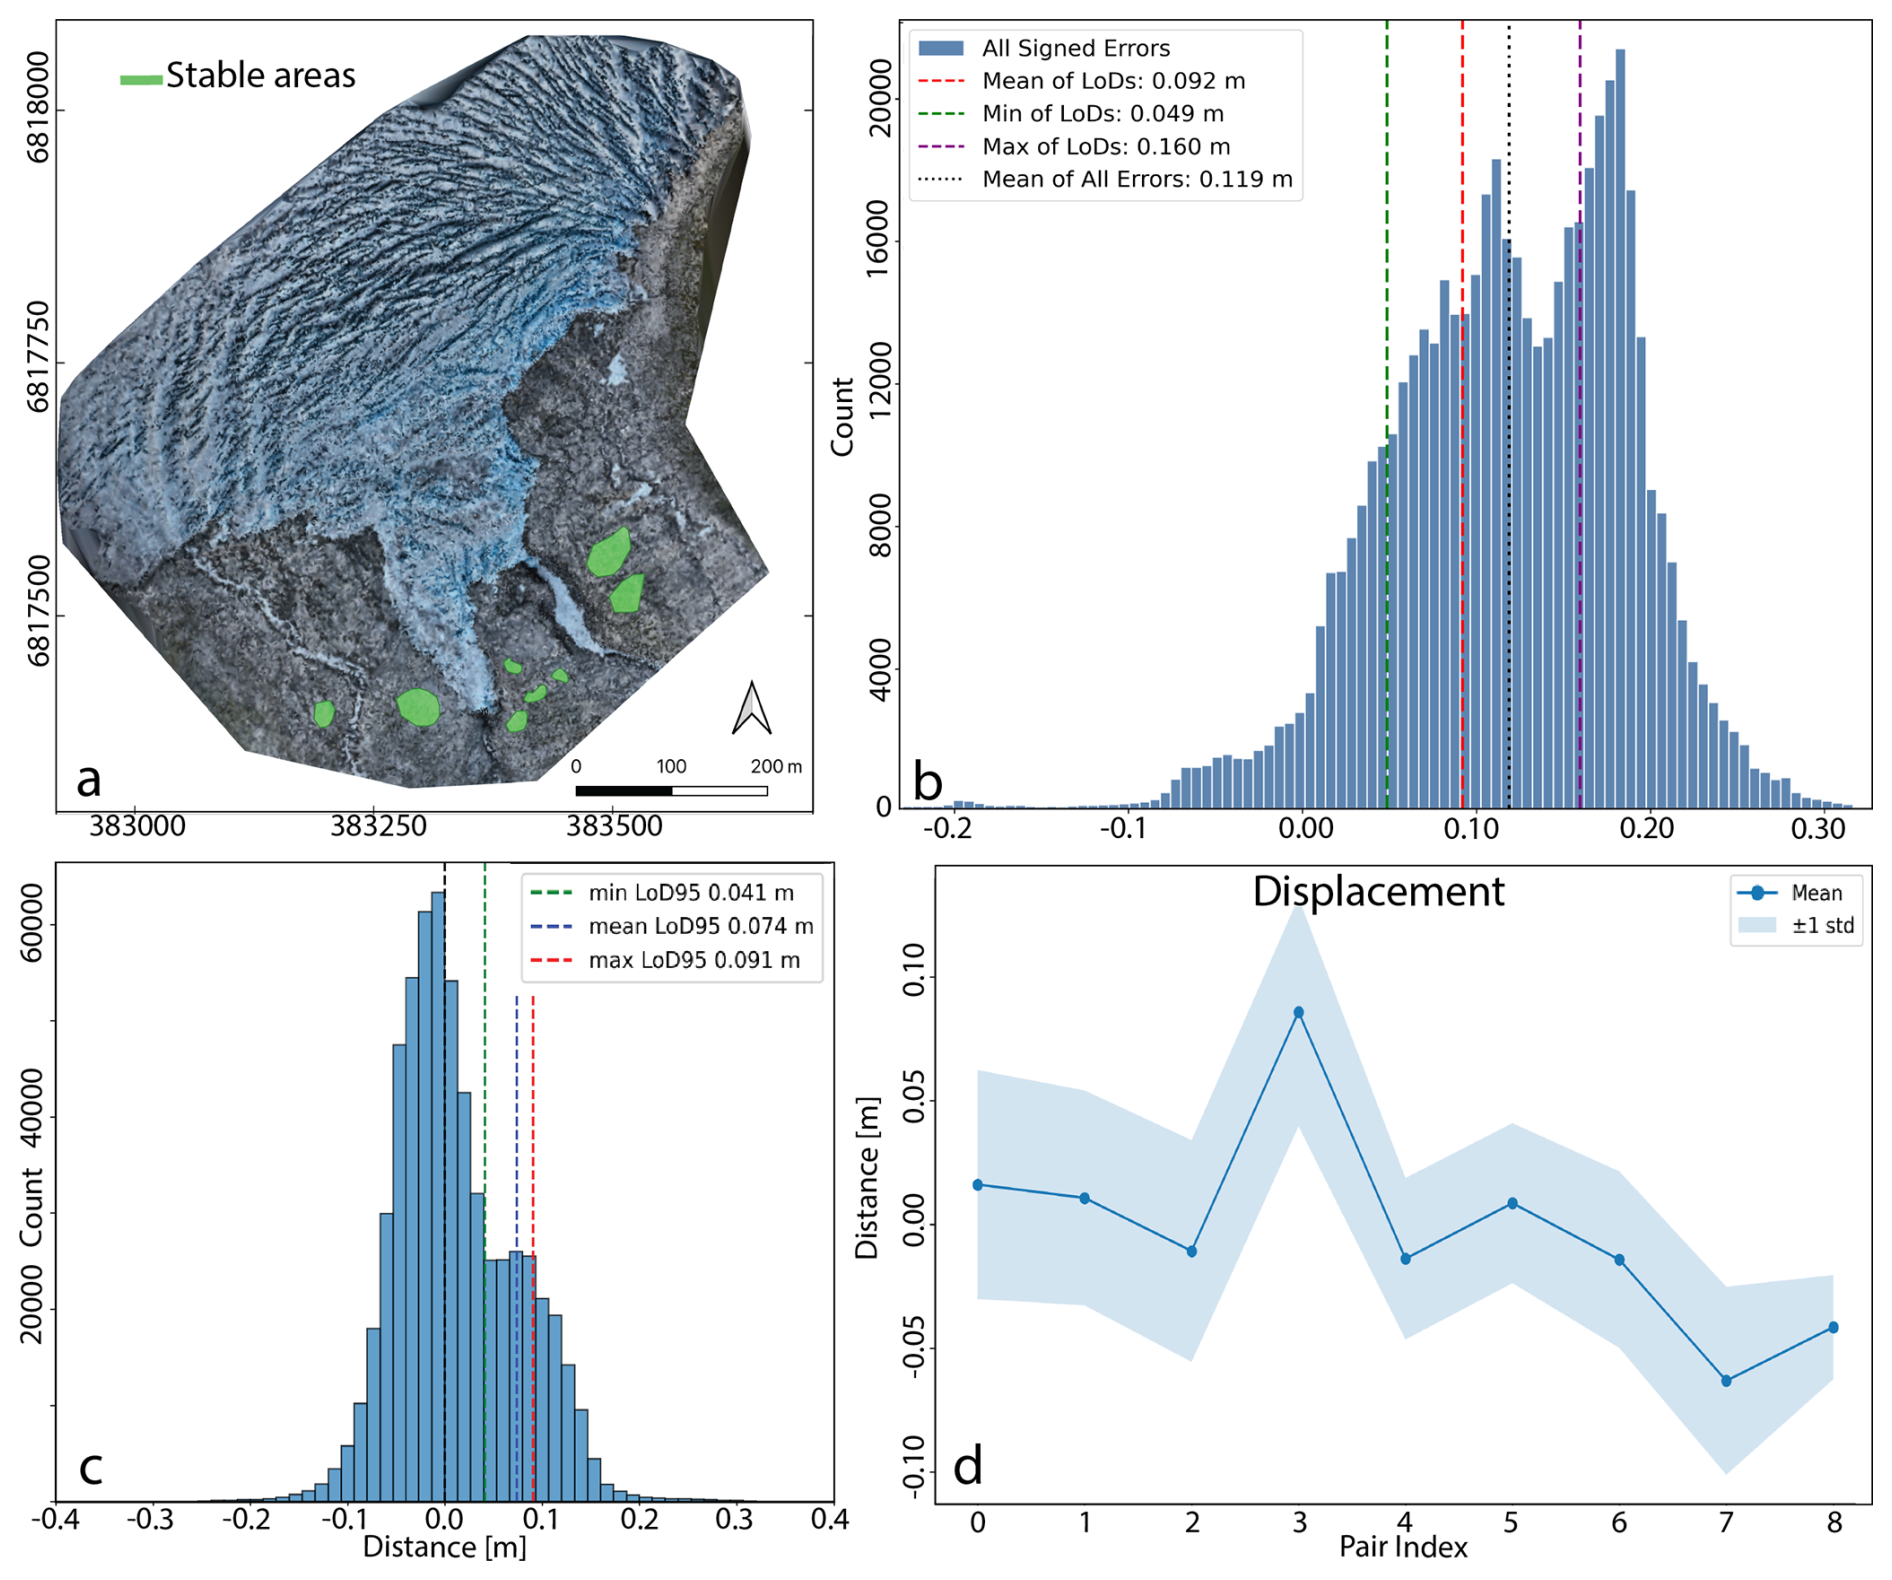
Figure 8Accuracy assessment for the Supphellebreen site. (a) Defined stable areas (bedrock) below the glacier front. (b) Derived displacement in stable areas (DIS). (c) M3C2 and the corresponding LoD values, and (d) mean displacements and changes of the LoD over time for the different surveys.
Figure 9 shows a comparison of manually measured displacement vectors from the hillshade time series and DIS optical flow derived vectors. The agreement between the two datasets is strong (R2 = 0.798), indicating that the optical flow approach captures the main displacement signal reliably. The manual vectors were independently measured by two authors to reduce individual observer bias; however, a degree of subjectivity remains unavoidable. Manual vector estimation is inherently challenging, particularly in areas with low contrast or complex surface patterns, and small discrepancies in vector magnitude and orientation are therefore expected.
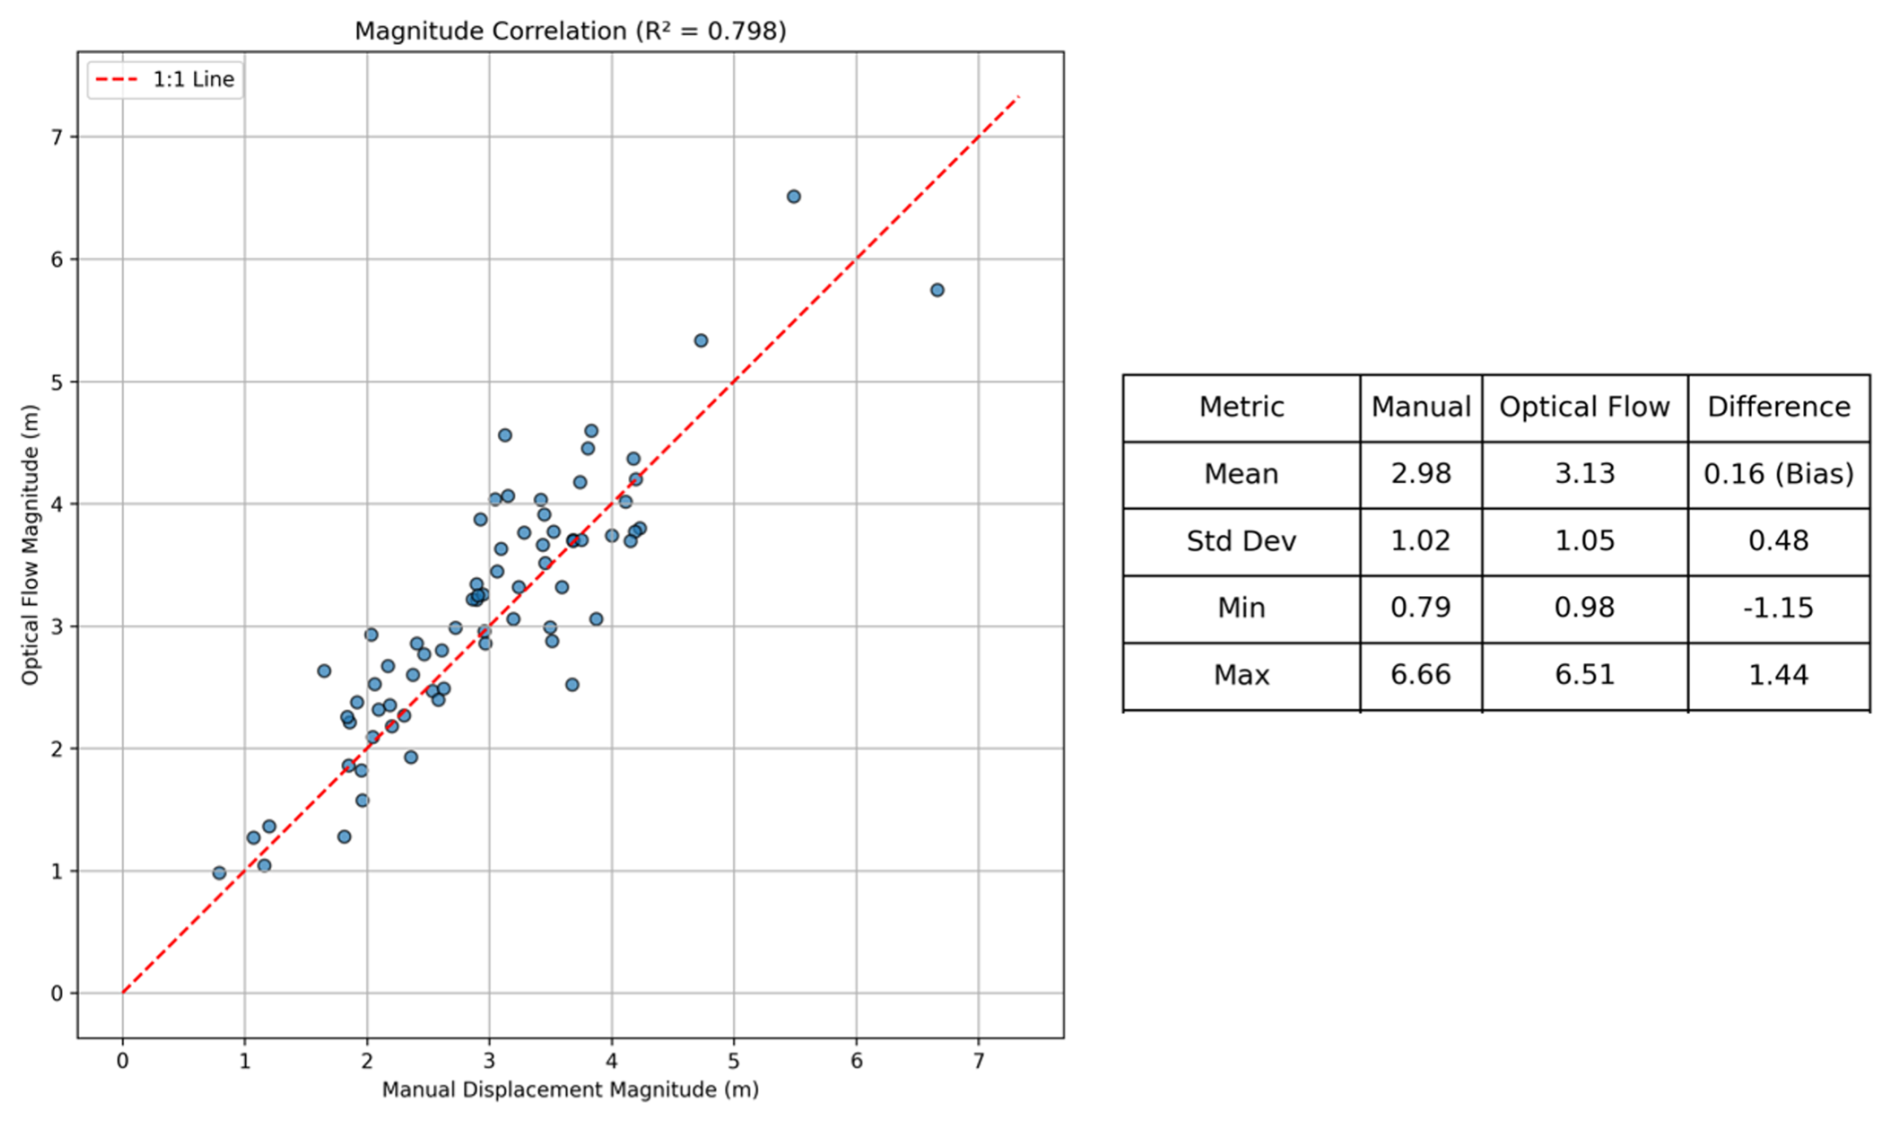
Figure 9Comparison between manuel derived displacement vectors and the DIS optical flow results (on hillshades).
Automated dock-based UAV systems may represent a paradigm shift in the monitoring of dynamic and remote geohazard environments; from UAVs as tools in primarily campaign-based surveys toward the integration of automated, near-continuous monitoring systems. This is likely a first step to eventually unsupervised, fully autonomous operations allowing for a significant reduction in time resources and personnel on site, specifically if the system includes automated data upload and processing. This study demonstrates for the first time that UAV docks can support fully automated high-frequency observations of unstable slopes, glacier hazards and a post-disaster landscape. By transitioning from standard campaign-based surveys to a continuous near-real-time monitoring approach, rapid surface changes that would otherwise go undetected can be captured. UAV docks placed at high-risk sites can enable more frequent missions and improved situational awareness in critical phases of hazard evolution, without exposing UAV pilots and the hazard assessment team to risk. Systematic and automated processing of the resulting image series yields centimetre-level displacement fields that resolve subtle deformation and changes in displacement rates. The ability to detect acceleration in displacement is crucial for timely decision making in settings where slope failures threaten communities or infrastructure, and rapid actions may be required.
5.1 Analytical capabilities and temporal resolution
Recent advances in computer vision, image-based processing, and point-cloud algorithms have considerably expanded UAV monitoring capabilities. Modern change detection methods such as image correlation, optical flow, and feature-based tracking achieve sub-pixel precision (Hermle et al., 2022; Xiao et al., 2023). Deep learning-based image matching has further improved robustness and accuracy, outperforming conventional cross-correlation or feature-tracking approaches in glacier surface velocity estimation (Zandler et al., 2025). For three-dimensional datasets, the Multiscale Model-to-Model Cloud Comparison (M3C2) algorithm (Lague et al., 2013) remains the benchmark for point-cloud change detection. Today, a steadily growing diverse suite of algorithms with variable sensitivity, computational demand, and spatial resolution enables tailored analyses.
Accuracy represents a core issue of reliable monitoring solutions. Current RTK positioning allows centimetre-scale georeferencing, which is generally sufficient for detailed geomorphic mapping and hazard-monitoring applications. For slowly deforming slopes (< 5 cm yr−1), however, detection of smaller displacements remains challenging. Nevertheless, repeated imaging provides valuable insights into near-surface processes such as rockfall activity and when equipped with infrared sensors also waterflows, air flows and temperature fields. At Skjøld, slope deformation over time intervals shorter than two weeks could not be quantified with confidence due to displacement rates remaining below the detection threshold (LoD95 0.04–0.09 m). However, the high temporal resolution enabled the identification of detachment zones associated with individual smaller rockfall events. Importantly, any future acceleration exceeding the LoD95 would be detectable, highlighting the system's capability for identification of increasing slope displacement.
Maintaining consistent flight geometry (e.g., area to cover and flight trajectories), integrating post-processing kinematics or ground control point corrections, and applying co-registration techniques such as for example ICP (Besl and McKay, 1992) or xDEM (xDEM contributors, 2023) can contribute to reducing systematic errors and lower the LoD95. In our study, network RTK via CORS with 20–30 km baselines yield acceptable accuracy (< 5–10 cm), though shorter baselines or local base stations could further improve results. While we intentionally varied flight plans to test different configurations, future deployments should emphasise consistent trajectories and incorporate co-registration algorithms. In optimal conditions, LoD95 values can improve from 1 × GSD to approximately 0.3–0.5 × GSD (James et al., 2017; Santise et al., 2014). When lower thresholds are needed, reducing the flight altitude, or establishing local correction networks can further enhance precision (McMahon et al., 2021).
The dynamic nature of geohazards, such as landslides and glacier collapses that can further develop into multi-hazard cascades, highlights the need for rapidly deployable and adaptive monitoring technologies. The flexibility of automated UAV systems allows adaptive scheduling from weekly missions for slow-moving or creeping slopes to sub-daily operations during critical phases. Following catastrophic events, UAV docks can provide near-real time situational awareness, supporting rapid topographic mapping for search, rescue and damage assessment, as documented in the case of Blatten.
The flight intervals required to reliably capture surface changes strongly depend on the expected displacement rates and process dynamics. Based on the observed conditions at our study sites, we propose the following optimal intervals: (1) Supphellebreen icefall: 1–5 d; (2) unstable rock slope at Skjøld: ∼ 2 weeks; and (3) Blatten: 1–2 d. For the unstable rock slope Skjøld, intervals of approximately two weeks are sufficient during periods of low displacement rates but should be shortened in phases of acceleration. In rapidly evolving environments, high temporal resolution is critical. At Supphellebreen, especially in the steepest areas with the highest ice velocities, flight intervals exceeding 7–10 d resulted in feature mismatches and reduced tracking accuracy. In contrast, more frequent UAV acquisitions successfully captured accelerated ice flow and serac collapses, highlighting the importance of dense temporal sampling for reliable hazard assessment. In addition to temporal resolution, high-resolution terrain data enable precise quantification of displacements and volume changes. These datasets are essential for runout modelling, identifying controlling factors, post-event analysis, and supporting mitigation planning.
High-resolution, high-frequency UAV data bridges the observational gap between coarse-resolution satellite imagery (e.g., Sentinel, Landsat, Planet) and sporadic UAV campaigns. The resulting 4D datasets offer a robust foundation for training deep learning models (e.g., Ma and Mei, 2021; Hosseini et al., 2026) to improve displacement detection and prediction (e.g., Schild et al., 2026), ultimately leading to a better understanding of slope and glacier dynamics. Unlike one-dimensional line of sight measurements, UAV photogrammetry enables the derivation of full 3D displacement vectors. UAVs can also integrate multispectral, thermal, or lightweight meteorological sensors (e.g., Haualand et al., 2025) for the collection of additional environmental parameters. Recent advances in computational efficiency and automated pipelines have made near-real-time analysis feasible, enabling responsive and data-driven hazard monitoring (Kothari and Momayez, 2018).
During our deployments, automated missions operated successfully under light rain and snowfall, though image quality was occasionally degraded by lens droplets. Modern weather resistant docks and waterproof UAVs equipped with environmental control and real-time weather monitoring mitigate many of these issues, yet rapidly changing conditions near glaciers or steep slopes can still necessitate mission aborts for safety. The combination of high-altitude overview missions at around 100–120 m above ground combined with low-altitude detailed surveys at 20–50 m above ground enables scalable and flexible monitoring.
5.2 Advantages, limitations, and remaining challenges
5.2.1 Weather and illumination challenges
A challenge in UAV-based monitoring relying on optical imagery is the influence of weather and illumination conditions. Weather conditions such as fog, heavy winds or intense precipitation may hinder take-offs and restrict flight frequencies, and varying illumination conditions can adversely affect image alignment, surface reconstruction, and subsequent change detection. Variations in sunlight intensity, shadow extent, and surface reflectance often lead to radiometric inconsistencies between image sets, particularly in complex mountainous terrain. At Supphellebreen, most automated UAV flights were conducted during civil twilight (approximately 10 min after sunset), providing diffuse, uniform illumination and minimal shadowing, conditions that improve reconstruction and displacement analysis consistency. However, such survey scheduling is not always feasible due to operational or weather-related constraints. Advancements in illumination normalisation, shadow-compensation algorithms, and the use of radiometrically invariant image features will therefore be crucial to improve the reliability and comparability of optical UAV-based monitoring across variable environmental conditions (e.g., Shen et al., 2025). Especially at the sites in Norway, we note that precipitation and low-level clouds can often hinder remote sensing such as satellite image acquisition or fixed terrestrial camera observations. Automated UAVs can either fly above the cloud barrier, or low enough, providing crucial observations when other sensors fail. Nevertheless, we suggest using complementary and redundant instrumentation in critical situations at high-risk sites (e.g., Choi et al., 2024; Maschler et al., 2026a).
5.2.2 Conventional campaign-based UAV surveys versus automated dock-based systems
Conventional campaign-based UAV surveys offer the possibility for episodic data collection but require at least one pilot to be present on site. As a result, this necessitates travel to or operation near potentially hazardous and active sites. Depending on the remoteness of these locations, this can lead to considerable logistical complexity and financial costs. At the same time, when risks are increasing, the need to capture precursors and understand ongoing processes becomes particularly important for hazard assessment. Conducting repeated standard UAV missions under such conditions may expose scientists to increased risk during data collection. Furthermore, timely data upload can become a major limitation in critical situations, especially if access to reliable internet infrastructure is constrained. These circumstances can delay rapid assessments when they are needed most. In cases where access to the site is entirely restricted, data collection through surveys with on-site pilot presence becomes impossible. Compared to conventional campaign-based UAV surveys, dock-based systems represent a step change from episodic data toward near-continuous data acquisition, also allowing for event-triggered and remotely operated monitoring. One primary advantage lies in the ability to perform surveys at predefined intervals or immediately following hazardous events. This on-demand capability can enhance both temporal resolution and timely data acquisition, which is particularly critical in rapidly evolving environments, such as for the rock-ice avalanche deposits in Blatten. From a risk management perspective, the decoupling of data acquisition from direct human presence on site represents a major improvement in operational safety. Hazard-prone or inaccessible areas can be monitored with high-resolution imagery without exposing personnel to objective dangers. This is especially relevant for high-frequency monitoring scenarios, where repeated field access would otherwise be required. Furthermore, the increased temporal resolution of UAV dock collected 4D datasets enables the detection of subtle deformation signals, that are often missed by sparse temporal sampling or lower resolution satellite observations. The combination of photogrammetric surface models and time series analysis allows for the identification of precursory movements, thereby strengthening the analytical basis for early warning and improved process understanding. In addition, operational costs related to travel, field logistics, and personnel time are reduced once the system is deployed, while automated charging and data handling eliminate the need for manual battery replacement and data retrieval in the field.
At the same time, for certain monitoring objectives, such as short-term campaigns, exploratory surveys, or sites with limited infrastructure, standard repeated UAV missions may remain more practical and flexible. Dock-based systems are associated with substantially higher initial investment costs, typically on the order of EUR 15 000–40 000, about 4–5 times higher than a comparable standalone UAV, due to the dock and additional infrastructure required for power supply, communication, and system integration.
5.2.3 Practical and infrastructure requirements
A key practical challenge for the deployment of dock-based UAV systems compared to UAV missions with on-site pilot presence is the requirement for a stable and continuous power supply. Docking stations rely on energy not only for UAV charging but also for environmental control systems, such as heating and cooling, to ensure reliable operation under extreme temperature conditions. Establishing such infrastructure in high-mountain terrain often necessitates hybrid energy solutions, such as fuel cells or solar power systems. Another aspect is the management of large data volumes generated by near continuous and high-resolution surveys. Efficient data transfer from remote sites to centralised processing environments requires robust communication infrastructure, which is often limited or absent in mountainous regions. This challenge can be mitigated by deploying satellite-based internet solutions (e.g., Starlink) or long-range directional radio links (Richtfunk). Thus, supporting the timeliness of data processing and consequently ensuring the responsiveness of the monitoring system.
Harsh environmental conditions, such as icing and strong winds, can potentially affect the systems' durability and the need for maintenance. In particular, increased wear on the mechanical components may occur. Although modern UAVs are increasingly weather-resistant and can operate under moderate wind conditions (e.g., up to ∼ 15 m s−1), extreme weather, precipitation, and fog can still interrupt flight operations or degrade data quality, leading to gaps in time series.
Future research should therefore focus on improving power management, optimising data acquisition and transmission strategies, and investigating the long-term system robustness under extreme environmental conditions. In this study, winter deployment was not tested. Cold-season operation, however, could be particularly relevant for applications such as snow and avalanche monitoring and should be addressed in future work.
5.2.4 Regulatory frameworks and operational constraints
Beyond technical considerations, regulatory frameworks currently represent one of the barriers to the widespread adoption of automated dock-based UAV systems. Automated flights beyond visual line of sight (BVLOS) often require special permissions, airspace coordination, and risk mitigation measures (e.g., parachutes & geofencing). The tests in Norway for this study were conducted within visual line of sight and below 120 m above ground level, allowing operation within the standard regulatory framework. In contrast, the deployment in Blatten required a different regulatory approach due to the operational context. There, flights were conducted in close coordination with regional emergency management structures, including the cantonal police, and under a Specific Operation Risk Assessment (SORA), as implemented in European aviation regulations. As the operations were carried out on behalf of the regional crisis management authority and under the mandate of the cantonal police of Valais, they fell under the Swiss state aviation regulation framework. This emergency context facilitated more flexible flight permissions and demonstrated how regulatory barriers can be reduced in crisis situations. However, for routine or long-term operational monitoring, significantly more extensive administrative procedures are typically required, including formal approvals, detailed risk assessments, and longer coordination processes with aviation authorities. Moreover, SORA-based authorisations are highly context-dependent, as they are tailored to specific locations, operators, risk environments, and operational objectives. This limits their direct transferability to other sites and constrains the scalability of such approaches for standardised monitoring applications.
5.3 Perspectives on scalable deployment and early warning systems
Effective hazard communication and vulnerability reduction depend on providing clear and understandable information to populations at risk (World Meteorological Organization, 2022). Our results show that automated UAV systems for geohazard monitoring can supply authorities with actionable technical data before, during, and after disasters, while also generating accessible visual insights (e.g. 3D models & Gaussian Splatting outputs) that can strengthen situational awareness. A single strategically positioned UAV dock can in some cases be used to monitor multiple hazards such as rockfalls, icefalls, and glacier lakes while simultaneously serving as a simple meteorological station, thus collecting information that serves civil protection. Although the initial investment in automated UAV systems is relatively high, especially when advanced equipment, such as LiDAR and thermal sensors, is included, compared to the logistics and personnel costs of traditional surveys the recurring costs per inspection or monitoring interval decrease over time. Regulatory frameworks currently represent a challenge to operational scaling, as requirements for automated UAV operations can vary significantly between countries, regions, monitoring sites, and use contexts, thereby limiting standardisation. Furthermore, setting priorities for geohazard monitoring and technology deployment remains challenging for vulnerable regions with a high density of potentially hazardous sites and limited financial resources (Ghosh, 2025; Huggel et al., 2020). Additionally, in regions where mountains hold cultural or spiritual significance, social acceptance becomes a decisive factor in the implementation of UAV monitoring technology and its long-term sustainability (Fraser, 2017). Participatory approaches, involving close dialogue and collaboration between scientists, authorities and the local community, could enable the co-development of robust and adaptive monitoring frameworks that integrate local knowledge systems (e.g., Hermans et al., 2022).
Broader adoption depends on development of appropriate legal frameworks, equitable access to technological infrastructure, the availability of skilled personnel and social acceptance (du Plessis and Amoah, 2025; Islam et al., 2025). We recommend that future research focuses on integrating near-continuous UAV data into existing early warning systems. Moreover, we would like to emphasise that technological innovations in risk monitoring and visualisation need to be complemented by participatory educational initiatives and strategic capacity building programs to effectively increase risk awareness among citizens and support community resilience.
5.4 Rapid response UAV dock operations: Lessons from Blatten
The 28 May 2025 Blatten landslide in Switzerland highlights both the potential and complexity of using automated UAV dock systems for rapid crisis response. While the UAV system demonstrated high reliability, operational success is dependent on expert oversight and pre-established coordination protocols. Operating across elevations from 1500 to 3000 m in changing alpine meteorology required precise remote supervision and dynamic mission adjustment. Real-time airspace awareness emerged as critical for safe BVLOS operations, particularly in the post-event context where dense helicopter activity required continuous monitoring of surrounding air traffic.
In the Blatten case, Skylens was used, an airspace monitoring system developed and produced by Remote Vision in collaboration with FLARM (flarm.com). It integrates position messages from multiple aviation separation and traffic awareness technologies (e.g., FLARM, ADS-B and related systems), which are fused and visualised in real time on a unified map interface. This interface provides a comprehensive overview of surrounding air traffic and was actively used by the dock operator to monitor helicopter and aircraft traffic in the vicinity of the monitoring area, thereby supporting safe BVLOS operations in the dynamically changing post-event airspace. Depending on the scenario, BVLOS crisis response may instead be enabled by other means, such as visual observers positioned close to the site, pre-coordinated restricted airspace, or onboard detect-and-avoid systems. The most practical solution depends not only on the operational context but also on the applicable regulatory framework, as BVLOS approvals are granted on a jurisdiction- and situation-specific basis; hence, this constrains the direct transferability of the configuration used at Blatten to other sites or countries. Nonetheless, in scenarios with dynamically evolving air traffic, tools that provide real-time air-traffic awareness are particularly valuable for ensuring safe and scalable operations.
The deployment of two dock systems further enhanced operational robustness by reducing airspace occupation time and achieving system redundancy. This redundancy ensures operational continuity in the event of a UAV loss or malfunction, although no such failures have occurred. These findings underscore that successful rapid-response mapping depends not only on robust technology but also on proactive system preparation, inter-agency coordination, and skilled human oversight capable of operating within complex environmental and regulatory frameworks.
This study demonstrates that automated dock-based UAV systems can substantially improve the monitoring of glacier and rock slope instabilities in remote alpine terrain. Across three different test sites, the application of automated UAVs coupled with subsequent automated image processing, displacement and change detection enabled safe and high-frequency data acquisition at centimetre-level accuracy. Automatically collected UAV data with high spatio-temporal resolution bridge the observational gap between satellite imagery and sporadic, UAV campaigns. Near-continuous UAV observations revealed short-term dynamic processes such as serac acceleration, scree slope creep, and post-failure terrain subsidence. These findings highlight the value of automated UAVs for both monitoring and post-disaster assessment, particularly where rapid hazard evolution requires flexibility and adaptability to gain situational awareness. However, favourable regulatory conditions, reliable power and communication infrastructure, and local expertise remain essential preconditions for scalable deployment. Overall, UAV dock-based monitoring represents a promising step toward automated hazard monitoring networks in a large variety of geo-hazardous environments, with the potential to enhance risk mitigation and strengthen the resilience of exposed communities. Future research should focus on integrating these systems into fully operational early warning frameworks.
The code and supplementary data is accessible at DataverseNO under: https://doi.org/10.18710/YARAKI (Maschler et al., 2026b).
AM: Conceptualization, Data collection & curation, Analysis, Methodology, Validation, Visualisation, Writing – original draft, review, and editing. SL: Conceptualization, Data collection, Analysis, Methodology, Validation, Visualisation, Writing original draft, review, and editing. LS: Data collection, Writing – review and editing. TS: Conceptualization, Supervision, Writing – review and editing. PS: Conceptualization, Supervision, Writing – review and editing. JCY: Conceptualization, Supervision, Writing – review and editing. HZ: Writing – review and editing, Validation. US: Data collection, Writing – review and editing.
Ueli Sager is CEO of the company Remote Vision, which is developer of Skylens in collaboration with the company FLARM.
Publisher's note: Copernicus Publications remains neutral with regard to jurisdictional claims made in the text, published maps, institutional affiliations, or any other geographical representation in this paper. The authors bear the ultimate responsibility for providing appropriate place names. Views expressed in the text are those of the authors and do not necessarily reflect the views of the publisher.
We acknowledge DJI and Boston, in particular Kjetil Hatlen, for providing access to a demonstration unit of the UAV drone dock and for technical assistance. For the Blatten case study, we acknowledge Terradata (Switzerland), in particular Alain Oggier, for his role as the local surveying technician. We further acknowledge the Dienststelle Naturgefahren Wallis (Canton of Valais) including the cantonal geological service for institutional support and coordination in the context of natural hazard monitoring. We acknowledge the use of AI tools for coding assistance. We also gratefully acknowledge the editor Matthias Schlögl, the reviewer input provided by Alexander Raphael Groos, and of one anonymous reviewer, which helped to improve the manuscript.
The study at Supphellebreen was conducted within the framework of the JOSTICE project, funded by the Research Council of Norway (grant no. 302458).
This paper was edited by Matthias Schlögl and reviewed by Alexander Raphael Groos and one anonymous referee.
Åkesson, H., Sjursen, K. H., Schuler, T. V., Dunse, T., Andreassen, L. M., Gillespie, M. K., Robson, B. A., Schellenberger, T., and Yde, J. C.: Recent history and future demise of Jostedalsbreen, the largest ice cap in mainland Europe, The Cryosphere, 19, 5871–5902, https://doi.org/10.5194/tc-19-5871-2025, 2025.
Andreassen, L. M., Elvehøy, H., and Kjøllmoen, B.: Glaciological investigations in Norway 2022 (Report No. 23/2023), Norwegian Water Resources and Energy Directorate, ISBN 978-82-410-2283-8, 2023.
Besl, P. J. and McKay, N. D.: A Method for Registration of 3-D Shapes, IEEE PAMI, 14, 239–256, https://doi.org/10.1109/34.121791, 1992.
Breien, H., Elverhøi, A., De Blasio, F., and Høeg, K.: Erosion and morphology of a debris flow caused by a glacial lake outburst flood, Western Norway, Landslides, 5, 271–280, https://doi.org/10.1007/s10346-008-0118-3, 2008.
Büntgen, U., Oppenheimer, C., Farinotti, D., Nahtz, T., and Esper, J.: The 2025 Blatten disaster in the Swiss Alps followed exceptional warming and highlights the vulnerability of people and heritage in glaciated landscapes, Commun. Earth Environ., 6, 994, https://doi.org/10.1038/S43247-025-02994-8, 2025.
Buskas, P. K.: Dynamics of the glacial lake at Flatbreen in Fjærland, Western Norway, and its role in the flood regime of the Tverrdøla catchment, MS thesis, Western Norway University of Applied Sciences, https://hdl.handle.net/11250/3158244 (last access: 30 June 2026), 2024.
Carrivick, J. L., Andreassen, L. M., Nesje, A., and Yde, J. C.: A reconstruction of Jostedalsbreen during the Little Ice Age and geometric changes to outlet glaciers since then, Quat. Sci. Rev., 284, 107501, https://doi.org/10.1016/j.quascirev.2022.107501, 2022.
Choi, S.-K., Ramirez, R. A., Lim, H.-H., and Kwon, T.-H.: Multi-source remote sensing-based landslide investigation: the case of the August 7, 2020, Gokseong landslide in South Korea, Sci. Rep., 14, 12048, https://doi.org/10.1038/s41598-024-59008-4, 2024.
Chudley, T. R., Christoffersen, P., Doyle, S. H., Abellan, A., and Snooke, N.: High-accuracy UAV photogrammetry of ice sheet dynamics with no ground control, The Cryosphere, 13, 955–968, https://doi.org/10.5194/tc-13-955-2019, 2019.
Clague, J. J., Huggel, C., Korup, O., and McGuire, B.: Climate change and hazardous processes in high mountains, Rev. Asoc. Geol. Argent., 69, 328–338, https://doi.org/10.5167/uzh-77920, 2012.
DJI: DJI Dock 2 – Technical Specifications, https://enterprise.dji.com/de/dock-2/specs (last access: 30 April 2026), 2024.
DJI: DJI Dock 3 – Technical Specifications, https://enterprise.dji.com/de/dock-3/specs (last access: 30 April 2026), 2025.
du Plessis, J. and Amoah, C.: Factors hindering the use of unmanned aerial vehicles for construction project monitoring, Discov. Appl. Sci., 7, 782, https://doi.org/10.1007/S42452-025-07414-2, 2025.
Dwivedi, R., Narayan, A. B., Tiwari, A., Dikshit, O., and Singh, A. K.: Multi-Temporal SAR Interferometry for Landslide Monitoring. Int. Arch. Photogramm. Remote Sens. Spatial Inf. Sci., XLI-B8, 55–58, https://doi.org/10.5194/isprs-archives-XLI-B8-55-2016, 2016.
European Union Aviation Safety Agency (EASA): EASA guidance document, https://www.easa.europa.eu/en/faq/116449 (last access: 10 April 2026), 2020.
Farinotti, D.,Huss,M., Jacquemart, M., Werder, M., Walden, J., Knutti, R., Seneviratne, S., Gagliardini, O., Schuler, T., Fischer, E., and Bresch, D.: Birchgletscher Fact Sheet, ETH Zurich Laboratory of Hydraulics, Hydrology and Glaciology VAW, 88028-VAW-2025–06d, 2025.
Fey, C. and Wichmann, V.: Long-range terrestrial laser scanning for geomorphological change detection in alpine terrain – handling uncertainties, Earth Surf. Process. Landf., 42, 789–802, https://doi.org/10.1002/esp.4022, 2017.
Fraser, B.: Learning from flood-alarm system's fate, EcoAméricas, https://cooperacionsuiza.pe/wp-content/uploads/2017/05/fraser_sat_carhuaz_ecoamericas17.pdf (last access: 25 June 2026), 2017.
Frodella, W., Salvatici, T., Pazzi, V., Morelli, S., and Fanti, R.: GB-InSAR monitoring of slope deformations in a mountainous area affected by debris flow events, Nat. Hazards Earth Syst. Sci., 17, 1779–1793, https://doi.org/10.5194/nhess-17-1779-2017, 2017.
Gerstner, R., Maschler, A., Schneider-Muntau, B., Agliardi, F., Avian, M., Frießenbichler, M., and Zangerl, C.: The critical role of fracture propagation in the evolution of extensive, structurally preconditioned rockslides, Eng. Geol., 358, 108359, https://doi.org/10.1016/j.enggeo.2025.108359, 2025.
Ghosh, S. (Ed.): Living on the Edge of Fragile Majesty: An Introductory Note on Emerging Risks, Hazards and Disasters in the Himalaya, in: The Himalaya Dilemma: Navigating Risk, Vulnerability, and Resilience in Geohazard-Prone Regions, Springer, Cham., Switzerland, 1–42, https://doi.org/10.1007/978-3-031-95083-4_1, 2025.
Gillespie, M. K., Andreassen, L. M., Huss, M., de Villiers, S., Sjursen, K. H., Aasen, J., Bakke, J., Cederstrøm, J. M., Elvehøy, H., Kjøllmoen, B., Loe, E., Meland, M., Melvold, K., Nerhus, S. D., Røthe, T. O., Støren, E. W. N., Øst, K., and Yde, J. C.: Ice thickness and bed topography of Jostedalsbreen ice cap, Norway, Earth Syst. Sci. Data, 16, 5799–5825, https://doi.org/10.5194/essd-16-5799-2024, 2024.
Groos, A. R., Bertschinger, T. J., Kummer, C. M., Erlwein, S., Munz, L., and Philipp, A.: The Potential of Low-Cost UAVs and Open-Source Photogrammetry Software for High-Resolution Monitoring of Alpine Glaciers: A Case Study from the Kanderfirn (Swiss Alps), Geosciences, 9, 356, https://doi.org/10.3390/geosciences9080356, 2019.
Haualand, K. F., Sauter, T., Abermann, J., de Villiers, S. D., Georgi, A., Goger, B., Dawson, I., Nerhus, S. D., Robson, B. A., Sjursen, K. H., Thomas, D. J., Thomaser, M., and Yde, J. C.: Meteorological Impact of Glacier Retreat and Proglacial Lake Temperature in Western Norway, J. Geophys. Res.-Atmos., 130, https://doi.org/10.1029/2024JD042715, 2025.
Hart, J. K., Baurley, N. R., Bonnie, A., Robson, B. A., Bragg, G., and Martinez, K.: Seasonal velocity patterns provide insights for the soft-bed subglacial hydrology continuum, Commun. Earth Environ. 6, 223, https://doi.org/10.1038/s43247-025-02198-0, 2025.
Heim, M.: Berggrunnskart ØYE 1517 II, M 1 : 50 000, Norges geologiske undersøkelse, https://doi.org/10.13140/RG.2.1.4366.4806, 2003.
Hermanns, R. L., Oppikofer, T., Anda, E., Blikra, L. H., Böhme, M., Bunkholt, H., Crosta, G. B., Dahle, H., Devoli, G., Fischer, L., Jaboyedoff, M., Loew, S., Sætre, S., and Yugsi Molina, F. X.: Hazard and risk classification for large unstable rock slopes in Norway, Italian Journal of Engineering Geology and Environment, 23–36, https://doi.org/10.4408/IJEGE.2013-06.B-22, 2013.
Hermans, T. D. G., Šakić Trogrlić, R., van den Homberg, M. J. C., Bailon, H., Sarku, R., and Mosurska, A.: Exploring the integration of local and scientific knowledge in early warning systems for disaster risk reduction: a review, Nat. Hazards, 114, 1125–1152, https://doi.org/10.1007/S11069-022-05468-8, 2022.
Hermle, D., Gaeta, M., Krautblatter, M., Mazzanti, P., and Keuschnig, M.: Performance Testing of Optical Flow Time Series Analyses Based on a Fast, High-Alpine Landslide, Remote Sens., 14, 455, https://doi.org/10.3390/rs14030455, 2022.
Hosseini, K., Zubareva, S., Hummelsberger, J., and Holst, C.: Improved 4D feature-based deformation tracking for high-resolution real-time landslide and slope deformation monitoring based on terrestrial laser scanning, Nat. Hazards, 122, 178, https://doi.org/10.1007/s11069-025-07939-0, 2026.
Huang, G., Du, S., and Wang, D.: Open Access Satellite Navigation GNSS techniques for real-time monitoring of landslides: a review, Satell. Navig., 4, 5, https://doi.org/10.1186/s43020-023-00095-5, 2023.
Huggel, C., Carey, M., Emmer, A., Frey, H., Walker-Crawford, N., and Wallimann-Helmer, I.: Anthropogenic climate change and glacier lake outburst flood risk: local and global drivers and responsibilities for the case of lake Palcacocha, Peru, Nat. Hazards Earth Syst. Sci., 20, 2175–2193, https://doi.org/10.5194/nhess-20-2175-2020, 2020.
Islam, N., Carrivick, J. L., Coulthard, T., Westoby, M., Dunning, S., and Gindraux, S.: A growing threat of multi-hazard cascades highlighted by the Birch Glacier collapse and Blatten landslide in the Swiss Alps, Geology Today, 41, 200–205, https://doi.org/10.1111/GTO.12526, 2025.
James, M. R., Robson, S., d'Oleire-Oltmanns, S., and Niethammer, U.: Optimising UAV topographic surveys processed with structure-from-motion: Ground control quality, quantity and bundle adjustment, Geomorphology, 280, 51–66, https://doi.org/10.1016/j.geomorph.2016.11.021, 2017.
Kerbl, B., Kopanas, G., Leimkuehler, T., and Drettakis, G.: 3D Gaussian Splatting for Real-Time Radiance Field Rendering, ACM Trans. Graph., 42, 1–14, https://doi.org/10.1145/3592433, 2023.
Klimeš, J., Novotný, J., Rapre, A. C., Balek, J., Zahradníček, P., Strozzi, T., Sana, H., Frey, H., René, M., Štěpánek, P., Meitner, J., and Junghardt, J.: Paraglacial Rock Slope Stability Under Changing Environmental Conditions, Safuna Lakes, Cordillera Blanca Peru, Front. Earth Sci., 9, https://doi.org/10.3389/feart.2021.607277, 2021.
Kothari, U. C. and Momayez, M.: Machine Learning: A Novel Approach to Predicting Slope Instabilities, Int. J. Geophys., 1–9, https://doi.org/10.1155/2018/4861254, 2018.
Kristensen, L., Czekirda, J., Penna, I., Etzelmüller, B., Nicolet, P., Pullarello, J. S., Blikra, L. H., Skrede, I., Oldani, S., and Abellan, A.: Movements, failure and climatic control of the Veslemannen rockslide, Western Norway, Landslides, 18, 1963–1980, https://doi.org/10.1007/s10346-020-01609-x, 2021.
Kroeger, T., Timofte, R., Dai, D., and Van Gool, L.: Fast Optical Flow using Dense Inverse Search, arXiv [preprint], https://doi.org/10.48550/arXiv.1603.03590, 2016.
Kromer, R. A., Abellán, A., Hutchinson, D. J., Lato, M., Chanut, M.-A., Dubois, L., and Jaboyedoff, M.: Automated terrestrial laser scanning with near-real-time change detection – monitoring of the Séchilienne landslide, Earth Surf. Dynam., 5, 293–310, https://doi.org/10.5194/esurf-5-293-2017, 2017.
Lague, D., Brodu, N., and Leroux, J.: Accurate 3D comparison of complex topography with terrestrial laser scanner: Application to the Rangitikei canyon (N-Z), ISPRS J. Photogramm. Remote Sens., 82, 10–26, https://doi.org/10.1016/J.ISPRSJPRS.2013.04.009, 2013.
Lelli, F., Mulas, M., Critelli, V., Fabbiani, C., Tondo, M., Aleotti, M., and Corsini, A.: Leveraging High-Frequency UAV–LiDAR Surveys to Monitor Earthflow Dynamics-The Baldiola Landslide Case Study, Remote Sens., 17, 2657, https://doi.org/10.3390/rs17152657, 2025.
Ma, Z. and Mei, G.: Deep learning for geological hazards analysis: Data, models, applications, and opportunities, Earth-Sci. Rev., 223, 103858, https://doi.org/10.1016/j.earscirev.2021.103858, 2021.
Maschler, A., Snook, P., Schild, L., Samnøy, S. F., Kristensen, L., Dahle, H., Aalbu, J. H., Henriksen, H., Nerhus, S. D., and Scheiber, T.: Multistage 54 000 m3 rockfall (Stampa, Western Norway): Insights from comprehensive monitoring and failure analysis, Landslides, 23, 851–869, https://doi.org/10.1007/s10346-025-02620-w, 2026a.
Maschler, A., Langes, S., Schild, L., Scheiber, T., Snook, P., Yde, J. C., Zandler, H., and Sager, U.: Code and Data for: Automated dock-based UAV systems for geohazard monitoring in mountainous terrain, V1, DataverseNO [data set], https://doi.org/10.18710/YARAKI, 2026b.
McMahon, C., Mora, O. E., and Starek, M. J.: Evaluating the Performance of sUAS Photogrammetry with PPK Positioning for Infrastructure Mapping, Drones, 5, 50, https://doi.org/10.3390/drones5020050, 2021.
Nex, F. and Remondino, F.: UAV for 3D mapping applications: a review, Appl. Geomat., 6, 1–15, https://doi.org/10.1007/s12518-013-0120-x, 2014.
OpenDroneMap Authors ODM: A command line toolkit to generate maps, point clouds, 3D models and DEMs from drone, balloon or kite images, OpenDroneMap/ODM GitHub [code], https://github.com/OpenDroneMap/ODM (last access: 24 May 2026), 2025.
Picarelli, L., Lacasse, S., and Ho, K. K. S.: The Impact of Climate Change on Landslide Hazard and Risk, in: Understanding and Reducing Landslide Disaster Risk, edited by: Sassa, K., Mikoš, M., Sassa, S., Bobrowsky, P. T., Takara, K., and Dang, K., WLF 2020. ICL Contribution to Landslide Disaster Risk Reduction, Springer, Cham, https://doi.org/10.1007/978-3-030-60196-6_6, 2021.
py4dgeo Development Core Team: py4dgeo: library for change analysis in 4D point clouds, GitHub [code], https://github.com/3dgeo-heidelberg/py4dgeo (last access: 24 May 2026), 2022.
Rossi, G., Tanteri, L., Tofani, V., Vannocci, P., Moretti, S., and Casagli, N.: Multitemporal UAV surveys for landslide mapping and characterization, Landslides, 15, 1045–1052, https://doi.org/10.1007/s10346-018-0978-0, 2018.
Santise, M., Fornari, M., Forlani, G., and Roncella, R.: Evaluation of DEM generation accuracy from UAS imagery, Int. Arch. Photogramm, Remote Sens. Spatial Inf. Sci., XL-5, 529–536, https://doi.org/10.5194/isprsarchives-XL-5-529-2014, 2014.
Schild, L., Scheiber, T., Snook, P., Maschler, A., and Arghandeh, R.: Exposing the potential of XAI-based causal discovery for analysing unstable rock slopes, Sci. Rep., https://doi.org/10.1038/s41598-026-48268-x, 2026.
Schlögl, M., Gutjahr, K., and Fuchs, S.: The challenge to use multi-temporal InSAR for landslide early warning, 112, 2913–2919, https://doi.org/10.1007/s11069-022-05289-9, 2022.
Shen, X., Cao, Y., Sui, B., Zhang, S., and Feng, D.: An automatic remote sensing image shadow compensation method utilizing reflectance differences and transfer learning, GISci. Remote Sens., 62, https://doi.org/10.1080/15481603.2025.2487334, 2025.
Stähli, M., Sättele, M., Huggel, C., McArdell, B. W., Lehmann, P., Van Herwijnen, A., Berne, A., Schleiss, M., Ferrari, A., Kos, A., Or, D., and Springman, S. M.: Monitoring and prediction in early warning systems for rapid mass movements, Nat. Hazards Earth Syst. Sci., 15, 905–917, https://doi.org/10.5194/nhess-15-905-2015, 2015.
Stoffel, M., Trappmann, D. G., Coullie, M. I., Ballesteros Cánovas, J. A., and Corona, C.: Rockfall from an increasingly unstable mountain slope driven by climate warming, Nat. Geosci., 17, 249–254, https://doi.org/10.1038/s41561-024-01390-9, 2024.
Stuart-Smith, R. F., Roe, G. H., Li, S., and Allen, M. R.: Increased outburst flood hazard from Lake Palcacocha due to human-induced glacier retreat, Nat. Geosci., 14, 85–90, https://doi.org/10.1038/s41561-021-00686-4, 2021.
Toffanin, P.: OpenDroneMap: The Missing Guide, 2nd edn., UAV4GEO, ISBN 979-8857908136, 2023.
Walliser Bote: Birchgletscher wird nach Abbruch von 40 000 Kubikmeter Eis genauer beobachtet, Walliser Bote, 29 December 1993, https://www.e-newspaperarchives.ch/?a=d&d=WAB19931229-01.2.59 (last access: 28 April 2026), 1993.
Walter, F., Hodel, E., Mannerfelt, E. S., Cook, K., Dietze, M., Estermann, L., Wenner, M., Farinotti, D., Fengler, M., Hammerschmidt, L., Hänsli, F., Hirschberg, J., McArdell, B., and Molnar, P.: Brief communication: An autonomous UAV for catchment-wide monitoring of a debris flow torrent, Nat. Hazards Earth Syst. Sci., 22, 4011–4018, https://doi.org/10.5194/nhess-22-4011-2022, 2022.
Wangensteen, B., Tønsberg, O. M., Kääb, A., Eiken, T., and Hagen, J. O.: Surface elevation change and high resolution surface velocities for advancing outlets of jostedalsbreen, Geogr. Ann. A, 88, 55–74, https://doi.org/10.1111/j.0435-3676.2006.00283.x, 2006.
World Meteorological Organization: Early warnings for all: The UN Global Early Warning Initiative for the implementation of climate adaptation, Executive action plan 2023–2027, WMO, Geneva, https://www.itu.int/en/ITU-D/Emergency-Telecommunications/Documents/2025/EW4All/Executive_Action_Plan_en.pdf (last access: 30 June 2026), 2022.
xDEM contributors: xDEM, Zenodo [code], https://doi.org/10.5281/zenodo.11204531, 2023.
Xiao, H., Jiang, N., Chen, X., Hao, M., and Zhou, J.: Slope deformation detection using subpixel offset tracking and an unsupervised learning technique based on unmanned aerial vehicle photogrammetry data, Geol. J., 58, 2342–2352, https://doi.org/10.1002/gj.4677, 2023.
Yang, D., Qiu, H., Quevedo, R. P., Liu, Y., and Glade, T.: Birchgletscher rock-ice avalanche burying the village of Blatten on 28 May 2025, Valais, Switzerland, Landslides, 23, 283–291, https://doi.org/10.1007/S10346-025-02656-Y, 2026.
Zandler, H., Abermann, J., Robson, B. A., Maschler, A., Scheiber, T., Carrivick, J. L., and Yde, J. C.: Deep learning outperforms existing algorithms in glacier surface velocity estimation with high-resolution data – the example of Austerdalsbreen, Norway, Front. Remote Sens., 6, https://doi.org/10.3389/frsen.2025.1586933, 2025.
Zhong, Y., Allen, S., Li, D., Corona, C., Zheng, G., Liu, Q., and Stoffel, M.: Unravelling driving conditions of rock and ice avalanches and resulting cascading processes in High Mountain Asia, Landslides, 22, 989–1001, https://doi.org/10.1007/s10346-024-02421-7, 2025.