the Creative Commons Attribution 4.0 License.
the Creative Commons Attribution 4.0 License.
 | 20 Jan 2026
The first Earthquake Early Warning System for the high-speed railway in Italy: enhancing rapidness and operational efficiency during seismic events
Simona Colombelli
Aldo Zollo
Francesco Carotenuto
Alessandro Caruso
Luca Elia
Gaetano Festa
Sergio Gammaldi
Antonio Giovanni Iaccarino
Giovanni Iannaccone
Alberto Mauro
Matteo Picozzi
Giulia Polimanti
Rosario Riccio
Stefania Tarantino
Francesco Cirillo
Andrea Vecchi
Franco Iacobini
Earthquake Early Warning (EEW) systems are modern, real-time seismic monitoring infrastructures capable of identifying relevant earthquakes and providing warnings to population and infrastructures, possibly before the arrival of the strongest shaking. Railway infrastructures represent a key target application for EEW systems, due to their strategic role for public transportation of passengers and goods. Here we describe the end-to-end system developed for the Naples-Rome high-speed railway that integrates seismic monitoring, advanced signal processing, and railway-specific protocols to enhance the management of railway operation in case of earthquakes in one of Italy's most seismically active regions.
The system utilizes a dedicated network of seismic stations equipped with accelerometers to detect ground motion and predict Peak Ground Acceleration in real-time. A probabilistic decision-making module evaluates seismic data and dynamically updates alerts as the P wave propagates. Alerts are issued for the Alerted Segment of the Railway, allowing operational restrictions like train deceleration or halting to mitigate seismic impacts. The system minimizes unnecessary disruptions by targeting specific segments, unlike traditional approaches that shut down entire lines.
The developed EEW system integrates train traffic control system, ensuring synchronized communication between trains, signaling infrastructure, and control centers. This enables rapid activation of emergency braking systems when required. Performance evaluations reveal high reliability, with rapid alerts issued within 3–10 s and correct predictions in over 90 % of cases.
Designed with scalability in mind, the system is exportable to other railway segments and adaptable to diverse seismic networks. Its ability to generate real-time shake maps and refine alerts during seismic events positions it as a global benchmark for integrating seismic management into high-speed rail operations.
- Article
(4836 KB) - Full-text XML
-
Supplement
(2308 KB) - BibTeX
- EndNote


Active faults are a serious threat for several regions in the world and many high-impact earthquakes of the recent century have caused huge casualties, dramatic economic losses, and irreparable damage to historical buildings as well as to critical, modern infrastructures (Firmi et al., 2020; Lakušić et al., 2020; Zhu et al., 2020). An Earthquake Early Warning (EEW) system is a complex seismic monitoring infrastructure that has the potential to provide warning to targets, prior to strong ground shaking, mitigating the impact of earthquakes in terms of fatalities, injuries and economic losses. This is possible through the rapid detection of the early P wave signals radiated by an ongoing earthquake and the fast issuing of information on the expected ground shaking, either within the epicentral area or at far locations (Allen and Melgar, 2019; Satriano et al., 2011).
During the last two decades, EEW systems have been widely developed and experimented in several high seismic hazard countries around the world, such as Japan, USA, Mexico, Taiwan, China, Italy, Romania, Switzerland, Turkey, Greece, and the Ibero-Maghrebian region (Allen and Melgar, 2019). At European scale, first Clinton et al. (2016) and then Cremen et al. (2022) investigated the feasibility of EEW application and the potential effectiveness of these systems across Europe and demonstrated that some parts of Europe would benefit from real-time alerts, with enough time to perform emergency actions (such as stopping traffic, stopping elevators, shutting off gas supplies, among others).
In the context of EEW, railway infrastructures are of particular interest due to their strategic role for private/public transportation of both passengers and goods (Minson et al., 2021; Nakamura and Saita, 2007; Yamamoto and Tomori, 2013). High-speed railways are nowadays becoming one of the most popular and fast transportation systems, with trains achieving cruise velocities of several hundred km h−1 that demand advanced systems for the railway signaling and remote/onboard control, in view of the application of severe protection measurements for travelers. Despite the rapid progress in methodological/technological developments in real-time seismic monitoring and source modelling, the interactions of EEW systems with final end-user applications are still complex and under development. It is required that real-time methodologies and technologies are not only validated and implemented at prototype level but also should satisfy high levels of Technological Readiness (European Commission, 2014).
There are a few successful examples of application of EEW systems to normal or high-speed railway lines in active seismic regions around the world. Among them, the Urgent Earthquake Detection and Alarm System (UrEDAS) (Nakamura, 1988; Nakamura and Saita, 2007) in Japan, the EEW system for the Bay Area Rapid Transit (BART) train system in California (Strauss and Allen, 2016), the EEW system on the high-speed railways in China (Tan et al., 2024; Yu et al., 2023; Zhang et al., 2024), and the EEW system for Marmaray Tube Tunnel in Turkey (Clinton et al., 2016; Erdik et al., 2003).
This paper presents the first end-to-end application of an EEW system in Italy, fully targeted to a public transportation infrastructure at national scale, managed by RFI (Rete Ferroviaria Italiana, the lead company in the Infrastructure Unit of the Ferrovie dello Stato Group) which, in its role of Infrastructure Manager, is responsible for the management and safety of the national rail traffic. With the aim of issuing real-time earthquake alerts and measuring the shaking along the railway line, during a period of 3 years, we designed and implemented a prototype EEW system on the high-speed railway between the cities of Rome and Naples (hereinafter RM-NA line). The system is designed as a support system for the management of earthquakes in the railway environment. The RM-NA line extends for about 200 km and runs almost parallel and nearby to the central-south Apennine Mountain chain, which constitutes one of the most seismically active areas of the country (Stucchi et al., 2004), where significant earthquakes (M>6.5) (Bernard and Zollo, 1989; Chiarabba et al., 2018; Chiaraluce, 2012; Galli and Galadini, 1999) have occurred in the past (Fig. 1). The system is end-to-end, since it is fully customized to the specific application it has been built for, adapted and optimized to maximize its performance in terms of speediness of the alert issuance and reliability of impact prediction, and thus, to account for the needs of the railway infrastructure manager. It implements the most advanced scientific and technological solutions to predict the expected ground shaking along the railway, with the purpose of adopting operational restrictions for slowing down or stopping the running trains approaching the potentially impacted portion of the line. It concretizes the cutting-edge vision of EEW systems, in which the interaction with the end-user and the interface with the target action play a key role in the design and configuration of the system itself (Cremen and Galasso, 2020). Here, we provide an overview of the system and describe the main elements and steps of its implementation and operation. The core of our study is devoted to the description of an innovative, quantitative performance evaluation, together with general considerations and criteria about the impact of the EEW system on the railway traffic along the pilot RM-NA High Speed line that should be considered in all designs of similar target applications.
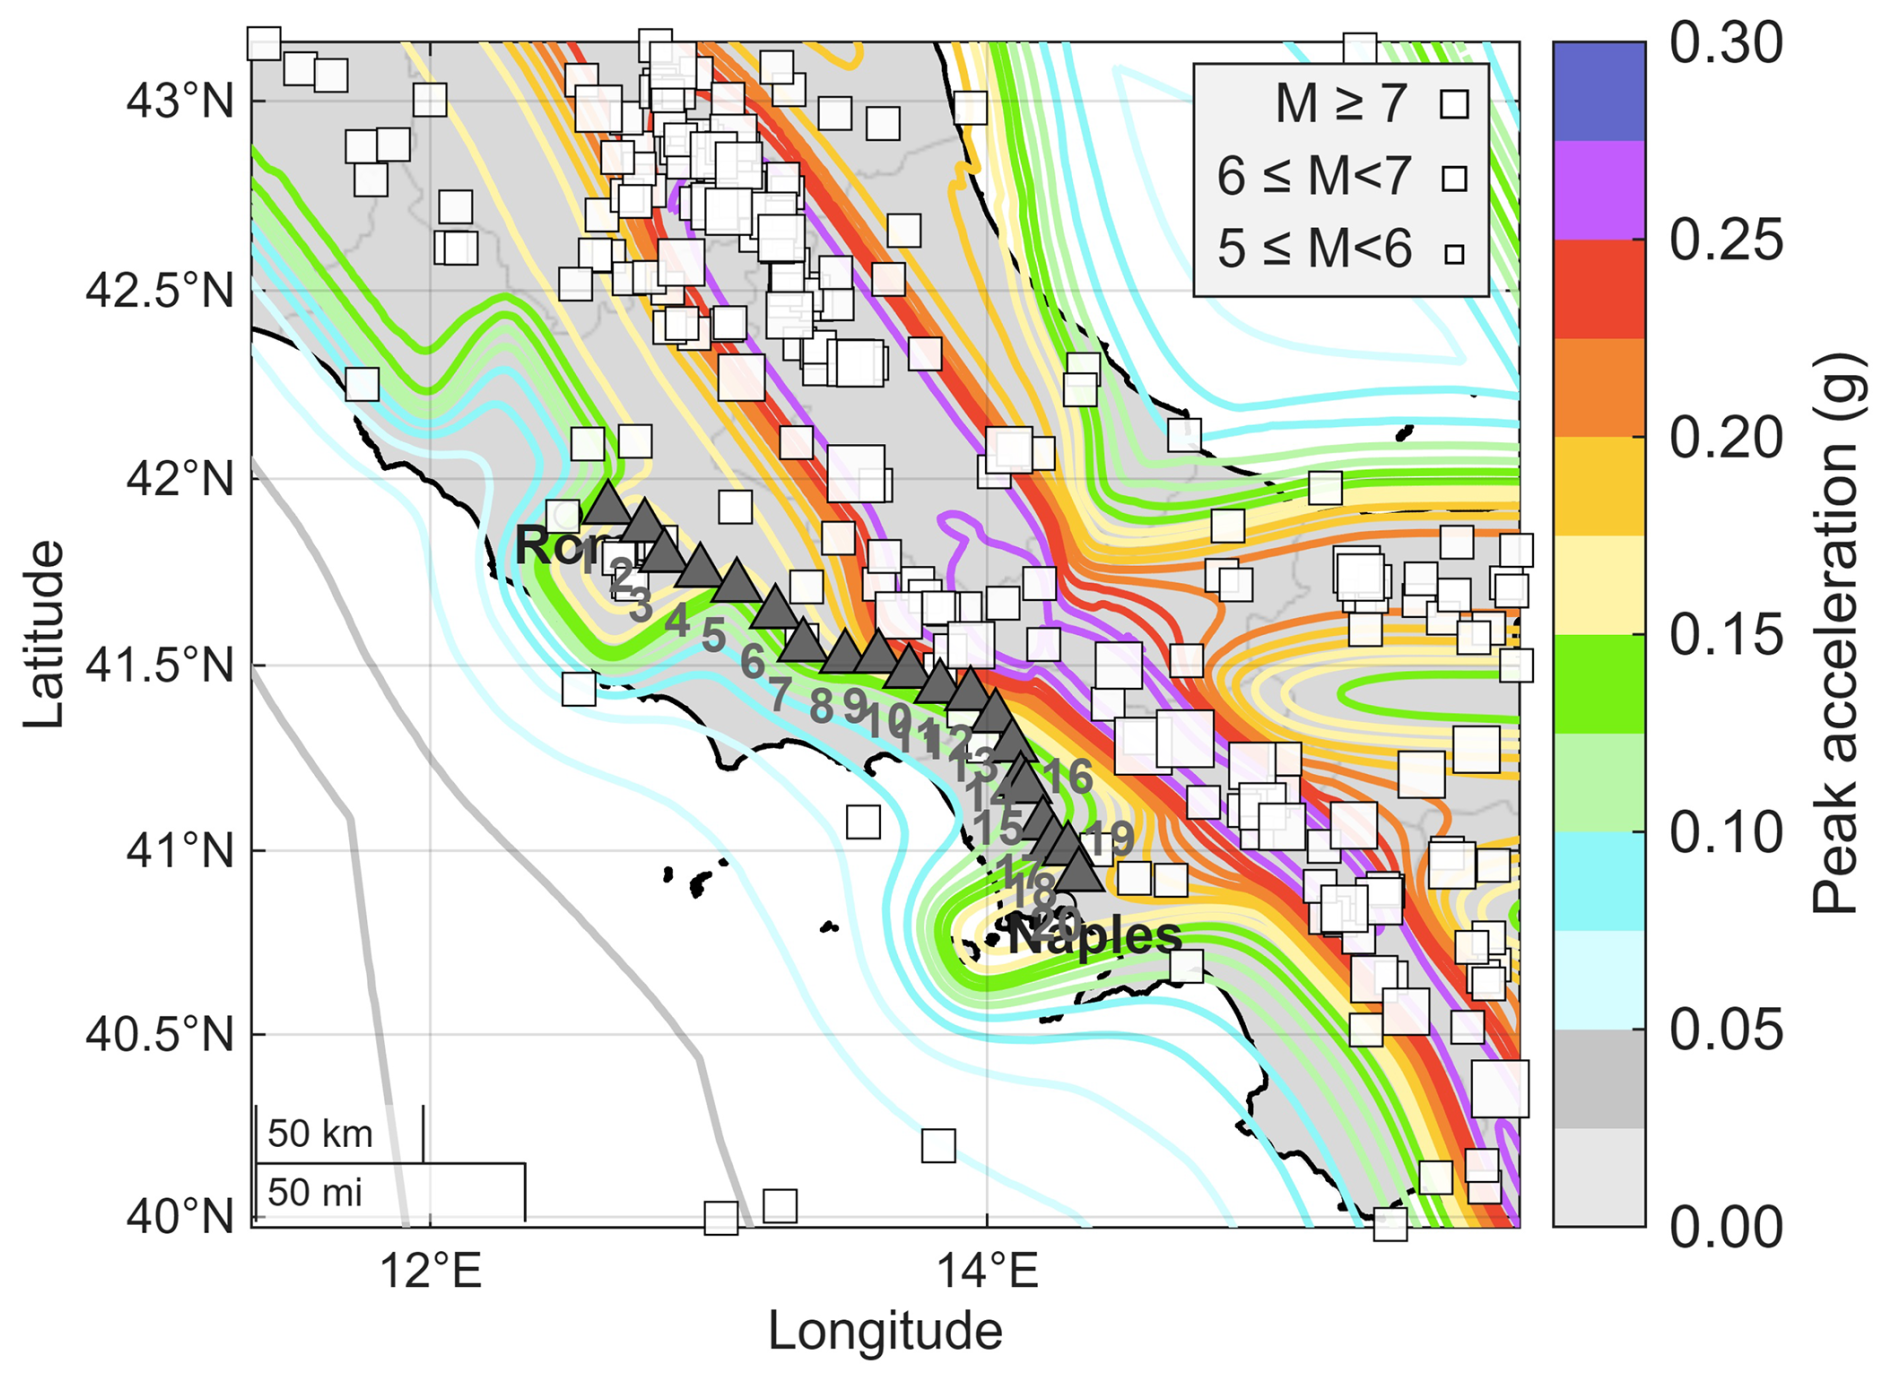
Figure 1Target area and lines. Map of the seismic network along the RFI high-speed railway for the Earthquake Early Warning application. The 20 stations are represented as dark gray triangles (with an average distance of about 10 km). The background color shows the peak ground acceleration with an exceedance probability of 10 % in 50 years according to MPS04 (Stucchi et al., 2004). White squares show all the M>5 earthquakes that occurred since 1000 according to the CPTI15 historic database (Rovida et al., 2020).
2.1 Seismic monitoring infrastructure development
A dedicated seismic monitoring infrastructure was first developed. It is operated by RFI, with real-time data acquisition and transmission capacity. The network consists of 20 stations installed in March 2020, within the RFI Technological Sites located along the train line, covering the route from the northern endpoint nearby Rome (Salone station) to the southern end-point nearby Naples (Afragola station) (Fig. 1). Each station is equipped with a 3-component accelerometer, installed in a small buried superficial vault (volume of about 1 m3), specifically conceived to ensure the optimal coupling between sensor and ground and to protect the sensor from high temperature variations. A triaxial accelerometer (model SARA SA-10 FBA) was employed, providing a sensor output voltage of 20 Vpp and a full-scale range of ±2 g (adjustable via the acquisition software). A borehole installation version of the sensor (model SARA SSBHV-SA10) was also used; although it features a different form factor, its performance specifications are equivalent. In 5 sites, an additional accelerometer is installed at the bottom of a 20 m-deep borehole, to improve the signal-to-noise ratio by reducing the contamination of shallow noise ground vibrations. The installation of permanent stations was preceded by a preliminary experimentation campaign aimed at the site characterization (in terms of quality of each recording site, periodic noise-sources identifications, optimal sensor positioning). Section S1 in the Supplement shows examples of preliminary analyses for the site characterization (see also Figs. S1 and S2).
The ground motion data is acquired at a frequency of 125 Hz (with 30 bit-dynamic range data loggers), georeferenced and synchronized via GPS, and transmitted in real-time to a central server (located in Naples), through a dedicated, proprietary fiber optic telecommunication infrastructure managed by RFI. The servers for calculation, data acquisition and storage are installed at Naples Central Station. Data acquisition from the stations is done through the SeedLink protocol (http://ds.iris.edu/ds/nodes/dmc/services/seedlink/, last access: 4 December 2025), in the form of miniSeed packets with a fixed size of 512 bytes and a fixed time duration of 0.6 s, to minimize the latency in data transmission (Fig. 2). The EEW method is implemented in a modular software platform whose block diagram is shown in Fig. 2. The platform is named AlpEW (Array lineare per Early Warning) and the main steps of the methodology are synthetically described in the following paragraphs.
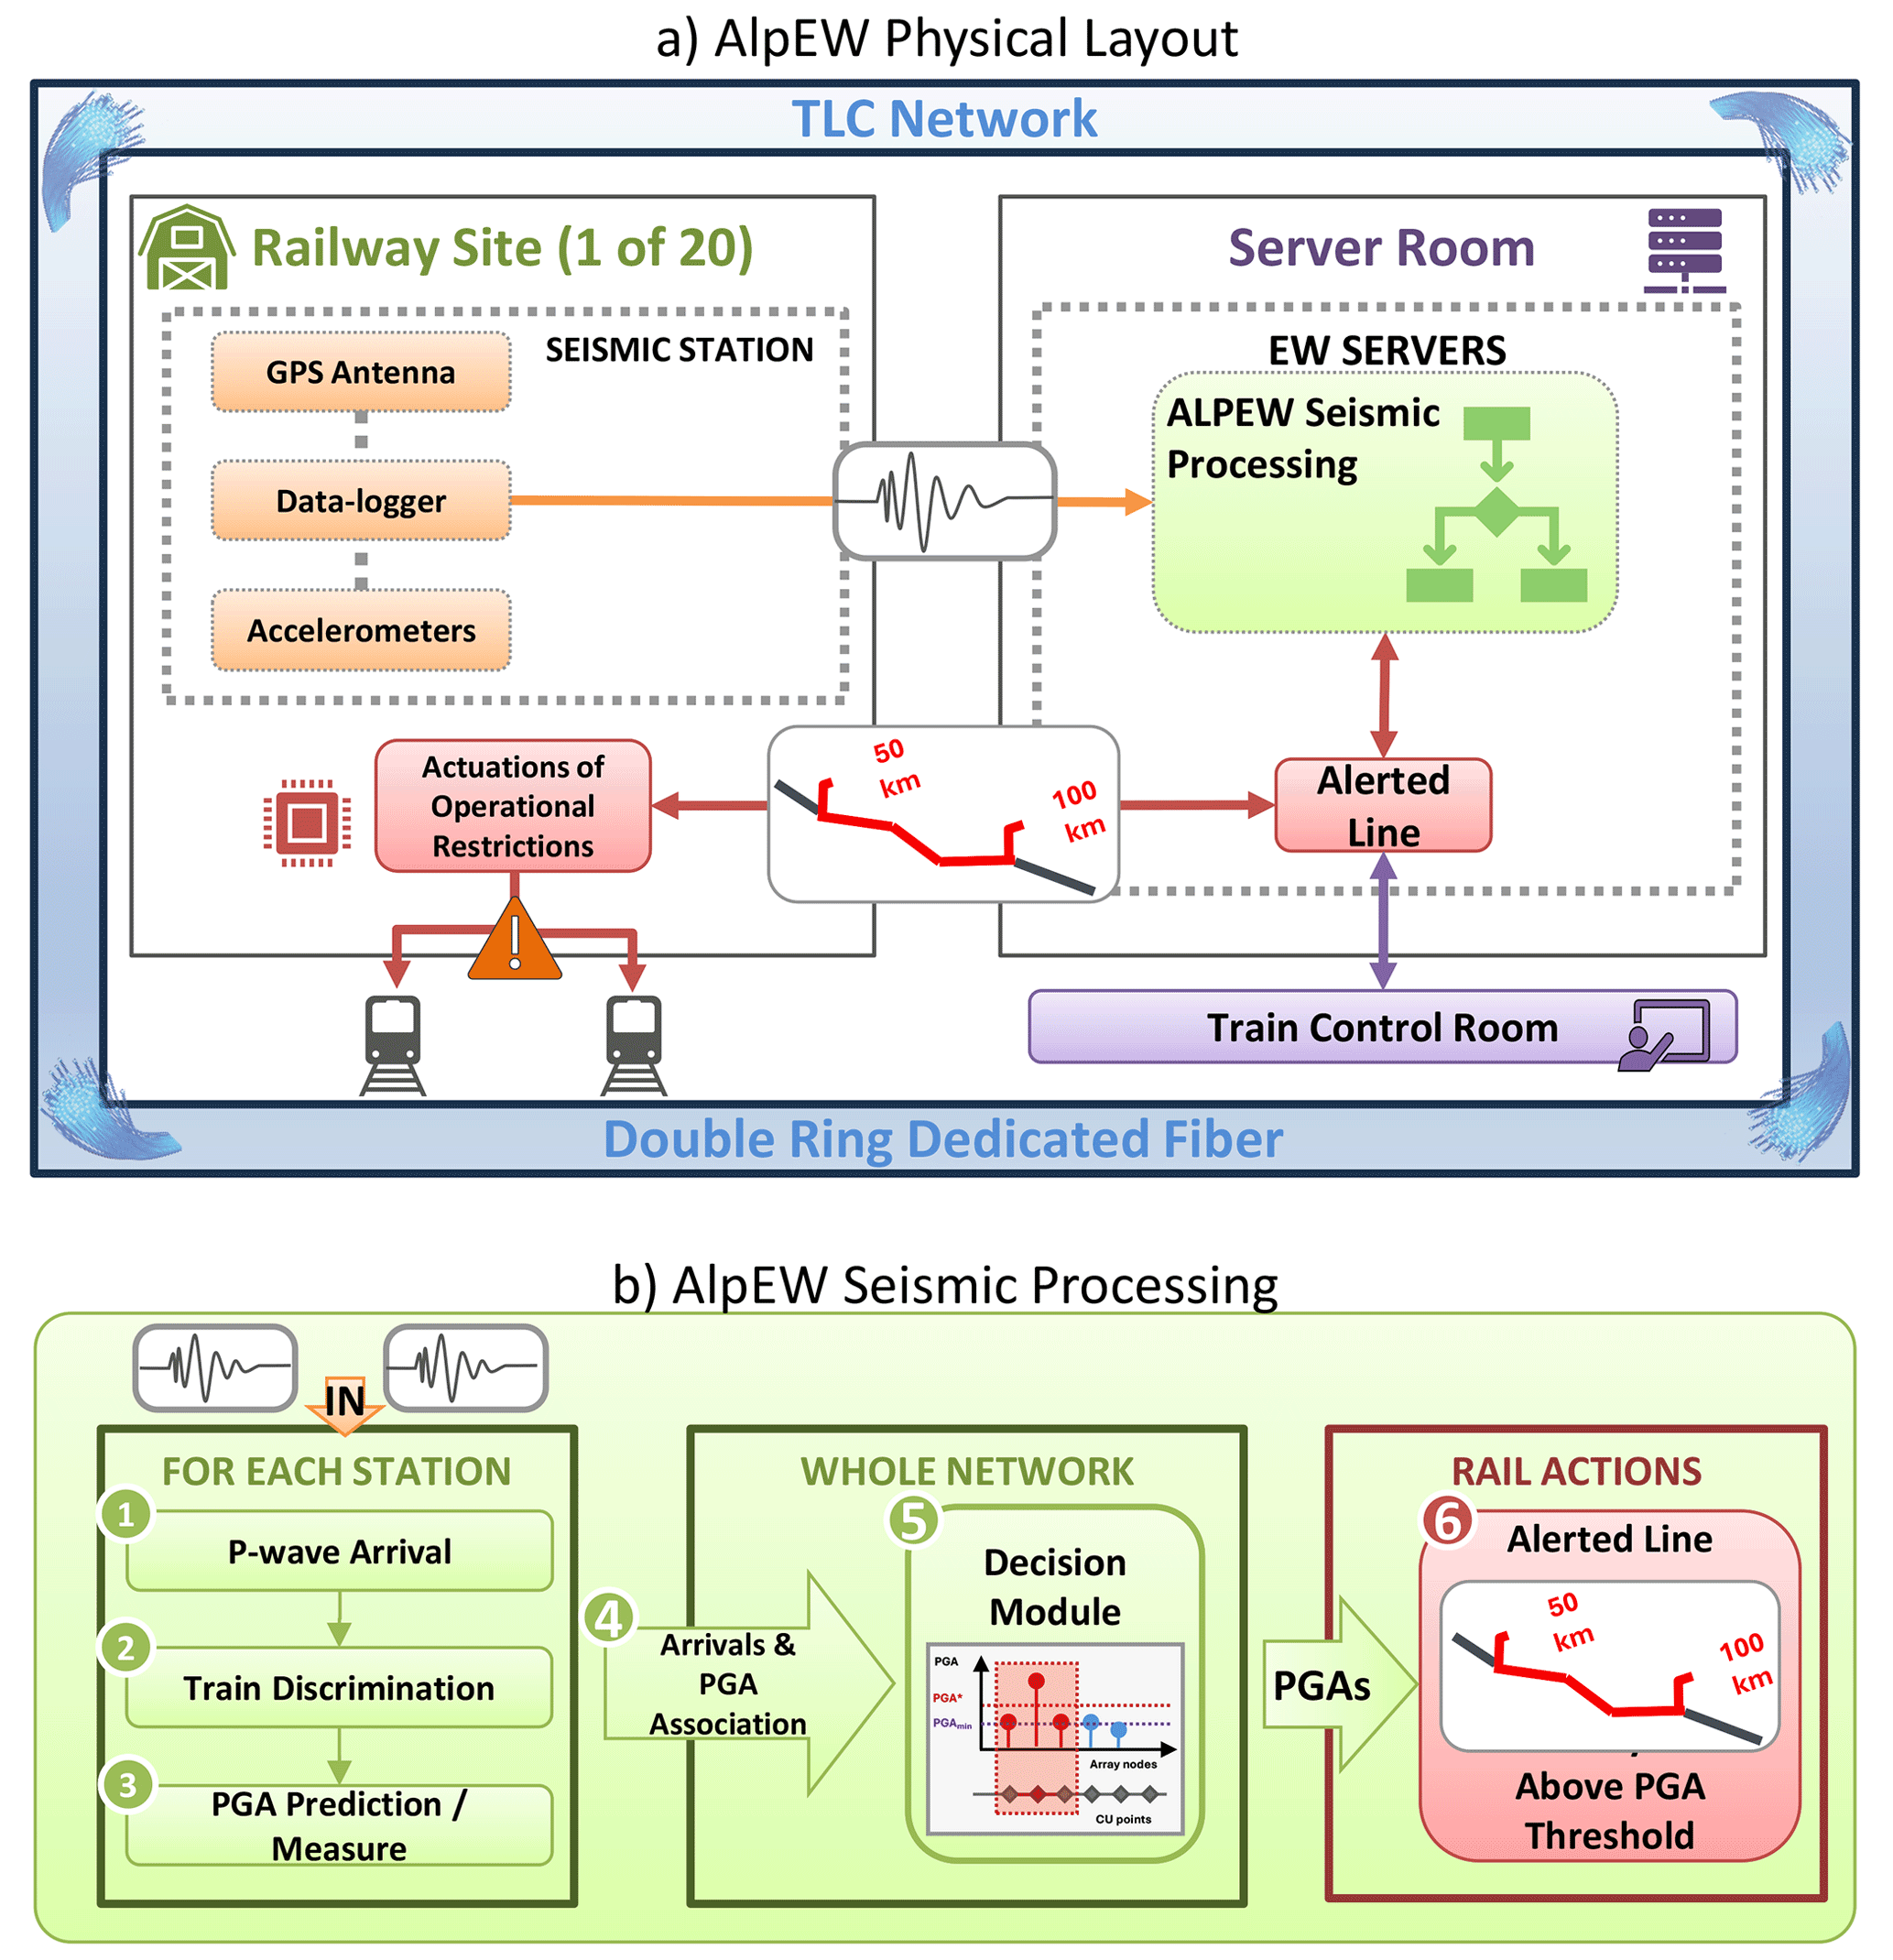
Figure 2Block diagram of the AlpEW system. (a) ALpEW Physical Layout: Left: installed instruments in one of the twenty RFI Technological Sites. The seismic stations record and transmit the continuous data streams containing the 3-component ground motion from all the accelerometers of the RFI network. Right: The AlpEW software installed at the server level. The main output of the seismic processing module is the Alerted Segment of the Railway (ASR) i.e., the evolutive identification of the railway segments above the PGA threshold (kilometric ranges) where operational restrictions are applied. Still at server level, the graphical user interfaces are used for monitoring the state and the Early Warning outputs, and for controlling the train operation. The light blue ring around represents the dedicated fiber optics telecommunication line across the railway, between sites and the server room. (b) AlpEW seismic processing: the inputs are the continuous data from the seismic network. Left panel (1 to 3) shows the modules implemented at each node: the identification of the arrival times and the corresponding predicted/measured PGAs at each station, after discriminating the potential seismic signals from the train noise. Center panel (4–5) shows the network-level data association. Here, the decision-making module continually analyses the available arrival times and PGAs from all stations and declares an alert when it identifies an earthquake whose impact on the railway is above the threshold. Right panel (6) represents the outcome of the system and the actions on the railway: during the alert, the evolutionary ASR is continually updated and provided as output.
2.2 Earthquake detection and train discrimination
At the arrival of raw ground motion data from the seismic network, an automatic picking algorithm (Filter Picker) (Lomax et al., 2012) is first used to identify the occurrence of a transient signal with respect to the background noise. The most recurrent recorded noise signal at the station sites to be discriminated against the earthquake signal is the ground vibration excited by the high-speed train transit that occurs hundreds of times per day on average due to the intense daily railway traffic. Therefore, a dedicated algorithm for train transit detection has been developed (Train Marker, TM), which analyses 1.5 s of recorded signal (after the transient trigger detection) at each recording station and allows discriminating the earthquake signal from the ground vibrations caused by the train transit, through the analysis of amplitude and frequency content of the signals (see Appendix A: Train Discrimination). The TM parameter is built in a way that signals with a dominant low frequency energy content (< 15 Hz), such as seismic events, are associated to small TM values, while the high frequency signals, such as those produced by the train passage or other sources of noise, are generally associated to large TM values, although a clear separation of TM values between trains and earthquakes does not exist (Fig. S3).
2.3 Peak Ground Acceleration prediction
When, at a given station, a potential P wave pick originated by an earthquake is detected, its initial peak acceleration (Pa), velocity (Pv) and displacement (Pd) amplitudes are computed in consecutive 1 s time windows after the first P-arrival time on the vertical component of ground motion up to a maximum time window of 5 s (see Appendix B: Peak Ground Acceleration prediction). The observed P-motion peak amplitudes at each site are used to predict the expected Peak Ground Acceleration (PGApred) at each site, using predefined, empirical ground motion prediction equations (see Appendix B: Peak Ground Acceleration prediction). Ground motion prediction equations are often affected by large uncertainties, reflecting the natural variability and scatter of data, and which may result in wrong estimates of the predicted quantities. Here, we propose a probabilistic decision scheme for the alert declaration which accounts for the probability of exceedance of a given PGA threshold value (PGAth), considering the uncertainty associated with the empirical scaling relationships. For each value of observed Pd (Pv, or Pa) the corresponding, predicted PGA value (PGApred) is first computed from the empirical scaling relationship. Then, an Exceedance Probability Level (EPL) is set to quantify to what extent (with which confidence level) the predicted PGA will exceed the threshold level (PGAth), accounting for the uncertainties on scaling relationships. If the predicted PGA, considering the EPL threshold, exceeds the PGAth, the alert system is activated (Fig. S4). On the contrary, if the predicted PGA, considering the EPL threshold, does not exceed the PGAth, no action is taken by the system (Fig. S4). Through the definition of the EPL, the system evaluates to what extent the predicted PGA will exceed the user-set threshold level (PGAth), accounting for the uncertainties on predictions (see Appendix B: Peak Ground Acceleration prediction).
2.4 Decision Module and criteria for first alert declaration
The probabilistic scheme described above is used at each recording site to establish the exceedance or not of a given threshold value (PGAth) on the predicted PGA. A Decision Module (DM) finally declares the alert at the nodes of the line where the PGAth is exceeded either by the predicted PGA, or by the recorded acceleration on the horizontal sensor components, whichever condition comes first. The DM implements different configurations for the issuing of the first alert, requiring from a single node to multiple nodes (max 4) to exceed the threshold in a user-defined time window, and accounting for space and time coincidence criteria (Le Guenan et al., 2016; Minson et al., 2019), as described below and schematically shown in Fig. S5:
-
Single Station Basic alert (SSB). the system declares an alert as soon as PGApred≥ PGAth at one station;
-
Single Station Refined alert (SSR1–SSR2). the system declares an alert when PGApred≥ PGAth at one station and PGApred≥ PGAthmin at one or two adjacent stations, respectively, with PGAthmin being a second lower threshold on PGA.
-
Multi Station alert (MS). the release of the alert occurs if PGApred≥ PGAth at N stations (with N going from 2 to 4) meeting specific time and space criteria, based upon the P wave propagation. Specifically, the relative spatial distances of the stations, Δx(N), and temporal time differences of the picks, Δt(N), are checked for consistency with the propagation of seismic waves: the apparent velocities of the N picks above threshold, calculated from the first pick, must be within a physically acceptable range.
The system is conceived to be evolutionary so that, even if the condition for the first alert release is not satisfied at a certain time, the same condition may be fulfilled at later times.
2.5 Emergency actions on the railway
When the alert is declared by the DM, the “Alerted Segment of the Railway” (ASR) is the section of the railway where PGApred≥ PGAth. During the alert, the evolutionary ASR is computed and is continually expanded as long as new P-waveform data are available from adjacent stations for which the predicted PGA exceeded the threshold .
Potential initial underestimations, even at the two extreme segments of the line, can therefore be automatically corrected when longer portions of the P wave time windows and more stations are used and are automatically recovered in the following seconds after the first alert declaration. Finally, it is worth mentioning that the segment of the railway where operational restrictions are recommended, is evaluated as the segment comprising the nodes that issued alert, extended with an additional branch at the edge nodes, for caution. No information is communicated at the non-triggered nodes.
2.6 Integrated Earthquake Early warning and High-Speed Train Braking and Emergency Management System
The protocol for high-speed train braking system management follows the European Train Control System (ETCS) (Rados et al., 2010) that works as part of the broader European Rail Traffic Management System (ERTMS) (Laroche and Guihéry, 2013) to ensure safe and efficient operation of trains, including high-speed traffic. The European Train Control System (ETCS) manages train movements and braking through a combination of continuous communication, onboard computing, precise monitoring, and centralized control (Flammini, 2010). The system relies on GSM-R (Global System for Mobile Communications – Railways) for uninterrupted communication between the train and the control center, known as the Radio Block Center (RBC). The RBC centralizes information on train movements and headway (the safe distance between consecutive trains) and issues movement authorizations. Each train is equipped with an onboard European Vital Computer (EVC), which processes data such as train speed, position, and status, as well as inputs from the RBC, to calculate train behaviour, including movement and braking strategies.
To ensure accurate positional data, Eurobalise transponders placed along the tracks provide precise position and speed information to the train. When a train passes over a Eurobalise, updated data is transmitted to the EVC to enhance accuracy. Using this real-time information – such as train speed, headway, distance to the next target, and safety parameters – the system calculates the optimal braking strategy.
The braking actuator (or emergency closure device) is then triggered to ensure the train stops precisely before the designated stopping point. The RBC continuously monitors train positions and enforces movement limits to prevent collisions, enabling trains to brake intelligently and stop safely at target points like signals or platforms. The emergency closure devices along a railway line are designed to quickly interrupt train operations in response to safety-critical situations, such as accidents, infrastructure failures, or hazards on the track. They can be activated manually by authorized personnel, such as railway operators or staff at a control center, or automatically by connected systems detecting anomalies like derailments, track obstructions, or signalling failures.
For the Italian high-speed railways, specific emergency closure devices have been designed and built to be interfaced and remotely controlled by the seismic Early Warning system so to automatically activate the train stopping signal along the RM-NA railway. Once activated, the device sends an immediate signal to the railway signalling system, indicating that operational restrictions must be applied in the affected section of the track. This signal may also alert the centralized control center, allowing operators to coordinate further operational measures.
The electronic communications through GSM-R in ETCS-equipped railways transmit the emergency status directly to the onboard systems of trains, instructing them to stop. Approaching trains receive the emergency signal and initiate braking procedures; in automatic or semi-automatic systems, the train's braking system is triggered immediately without requiring driver intervention, ensuring all trains within or approaching the affected section come to a stop. Once the emergency closure is activated, the section of the railway line is marked as out of service in the control system, preventing further train movements until the issue is resolved. This process also triggers protocols for emergency response teams to assess and address the situation and inspect the line. After the issue is resolved, the emergency closure device must be reset manually or electronically by authorized personnel, and normal train operations can resume once the area has been inspected with a positive outcome. In our integrated Early Warning and train traffic system, the message of “end of earthquake emergency” is declared by the seismic Early Warning system that pilots the automatic or semi-automatic deactivation, of the along-line emergency closure devices.
2.7 Graphical User Interface (GUI)
Finally, the EEW platform further outputs its analyses and results in a Graphical User Interface (GUI) for the RFI's control room, which displays the main parameters provided by the system in real-time, some statistics over set time windows (12 h, 7 d), and portion of the lines where operational restrictions have been applied. In the post-event, the GUI allows an operator to evaluate the performance of the system in terms of measured parameters and output release and to promptly identify any relevant anomalies (such as the absence of data from a station or the presence of anomalous noise records), which is useful for prompt intervention and maintenance.
3.1 Offline analysis of system performance
A quantitative evaluation of the performance of the EEW system is crucial for stakeholders and end-users (Le Guenan et al., 2016) to setup the operational system and properly configure the several configuration parameters, including, for instance, the PGAth threshold value and the minimum number of nodes at which the predicted PGA should exceed this value to declare the warning. Due to the absence of a massive catalogue of real earthquake waveforms recorded at the high-speed railway sites, the performance here is evaluated through a retrospective, off-line analysis of the system outputs, for a massive number of offline playbacks of earthquake records at the AlpEW system, as explained in the following paragraphs.
The database for performance evaluation includes both real earthquake waveforms (sorted from the waveform database of Italian earthquakes (Luzi et al., 2008) and train transit signals (effectively recorded at stations along the RM-NA line). We identified 2 linear arrays of stations from the Italian National Accelerometric Network (RAN) (Gorini et al., 2010). The arrays have been specifically selected to simulate at best the geometry, extension (total length about 200 km), orientation and spacing of the sensors, as compared to the RFI nodes, as well as their relative position with respect to the source area. The arrays were selected by the National Accelerometric Network (RAN) and are located in Central Italy, in the Apennine area, in a near-parallel and near-orthogonal orientation with respect to the Apennine chain itself. Figure S6 shows the networks used for the experiment, the relative stations and the epicentral positions of the earthquakes. A total of 56 seismic events and 975, 3-component records were selected (i.e., 325 records for each component). The complete earthquake database is composed as follows:
-
Apennine Array. 16 stations, 28 earthquakes with magnitudes between 3.5 and 6.5;
-
Anti-Apennine Array. 12 stations, 28 earthquakes with magnitudes between 3.5 and 6.5.
We also evaluated the impact of the train transits on the system performance by simulating the partial and total overlapping of their signals with the P wave recordings. We extracted random samples of train transits (acquired at the RFI nodes during an earlier phase of the project) and summed-up them to the earthquake records, simulating a partial or total overlap with the P wave. Figure S7 illustrates an example of signal obtained by adding the train passage record to a seismic event, before the arrival of the P wave, in acceleration, velocity and displacement (from top to bottom, respectively).
As for the simulation of different configuration parameters, here we explore three specific parameters which are: the PGAth, the EPL level and the DM configuration for the first alert release. We varied these parameters in reasonable ranges (suitable for the Italian railway applications) and, for each combination of the three parameters, we evaluated the response of the system. The complete list of the twenty-two explored combinations (denoted by C) is shown in Table S3. Considering the total number of available records (975) and the selected noise windows (7), a total of 6825 three-component recordings (2275 records per single component) were generated.
For each of the configurations explored, we used all the available records to evaluate the performance. Depending on the comparison between the predicted and the observed value of PGA (PGAobs), four different alert categories at each single node may occur:
SD (Successful Declaration of threshold exceedance):
SND (Successful No Declaration of threshold exceedance):
FD (False Declaration of threshold exceedance):
MD (Missed Declaration of threshold exceedance):
We then introduced a straightforward formulation for the performance assessment of the AlpEW system in terms of two indicators:
-
the Quickness Index QI(C), computed as:
This parameter is defined as the mean value of TFD for each specific configuration C and represents the rapidity of the system in providing first alerts. TFD is the time of the first declaration of threshold exceedance, measured in seconds since the first P wave detection at the network. The QI is computed only for the events belonging to the Nalerts subset;
-
the Impact Prediction Performance IPP(C,t), computed as:
This parameter represents the percentage of successful predictions of PGA (as the sum of NSD+NSND), at a given time t and for a specific configuration C and it is evaluated for all available nodes for which the P wave signal is available at the considered time. It represents the EEW system ability to correctly predict/not predict the ground shaking level at a single node.
In the above formula:
Nalerts is the number of earthquakes PGAobs ≥ PGAth at a variable number of nodes (depending on the configuration C); Nnodes is the total number of available nodes considering all networks and performed simulations (it is the same for each configuration C and is equal to 2275);
For each configuration of the three explored parameters (PGAth, DM, EPL), we computed the median values of QI and IPP as obtained from the playbacks. A useful way of representing the performance is provided by the IPP vs. QI diagram of Fig. 3. The proposed scheme allows positioning each configuration in the ideal space of the two indicators and provides an immediate and quick visualization of the system performance. The best performing configurations are those that maximize the IPP parameter while minimizing the QI value (top-left diagram corner). For clarity of representation, in Fig. 3, we did not associate each configuration with a different symbol, but we highlighted the behavior of the system depending on DM, PGAth and EPL values.
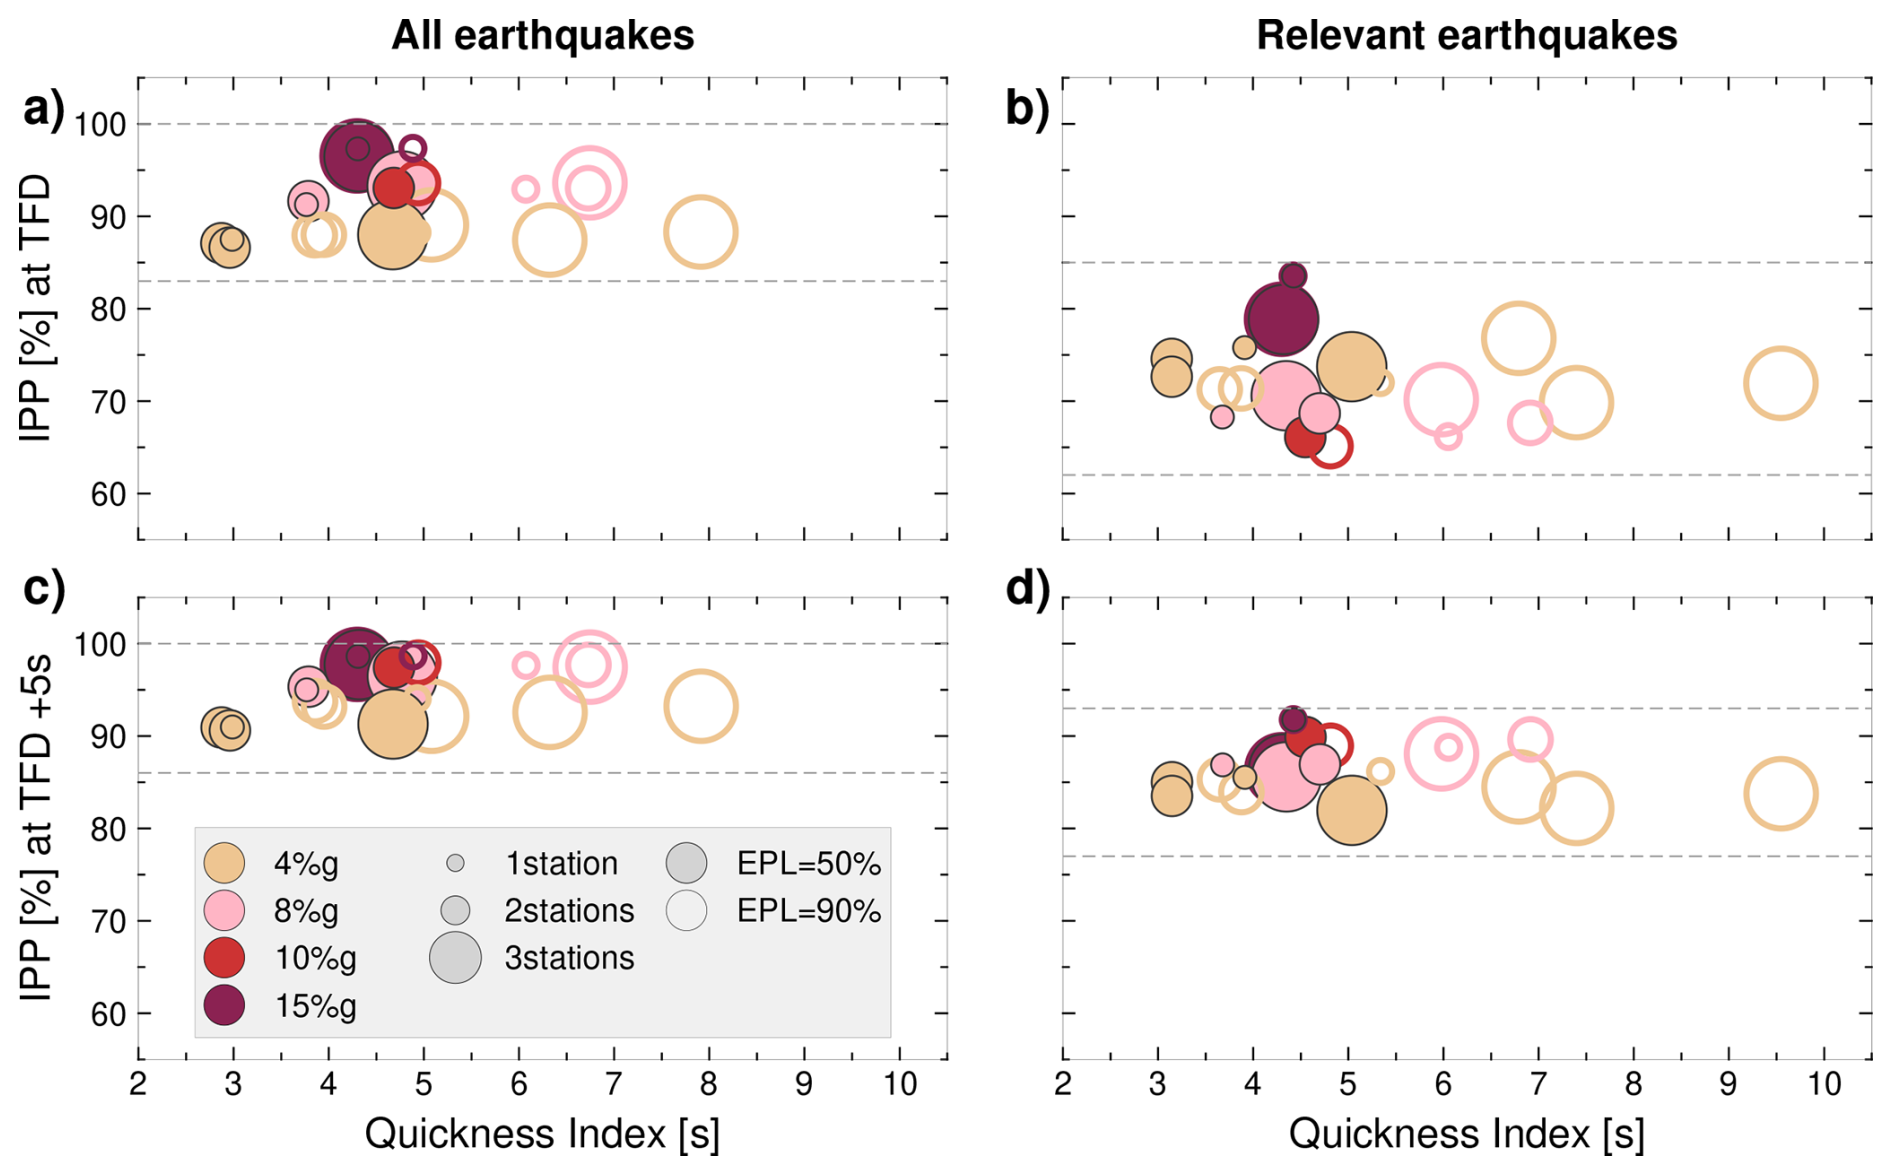
Figure 3Performance Analysis. The figure shows the IPP parameter as a function of QI at the time of the first declaration (TFD) for all events (a) and for relevant earthquakes only (b) and the IPP vs QI at the time of the first declaration + 5 s for all earthquakes (c) and for relevant earthquakes only (d). In all panels: the size of the symbols increases with the increasing complexity of the Decision Module (i.e., if 1, 2 or 3 stations are used for the first alert release); the color shows the PGA threshold value; filled circles are associated to EPL = 50 %; empty circles are associated to EPL = 90 %.
The performance analysis is summarized in Fig. 3 for all events (panels a, c) and relevant earthquakes only (panels b, d), where a “relevant” earthquake is defined as an event for which the observed PGA has exceeded the user-set threshold at least in one node of the network. The performance is shown at the Time of the First Declaration of threshold exceedance (TFD) (panels a, b), and 5 s later (TFD+5) (panels c, d) for all events (panels a, c) and for relevant earthquakes only (panels b, d). For all the tested configurations, the first alert declaration (TFD) is typically released within a short time after the first P-detection at the network, in a range of 3 to 8 s for all earthquakes, and 3 to 10 s for relevant earthquakes. At these times, the IPP parameter ranges between 85 % and 97 % of successes (positive and negative successful alerts) for all events (Fig. 3a) and between 65 % and 85 % for relevant earthquakes (Fig. 3b). At later times, at TFD + 5 s, the performance in terms of IPP varies between 90 % and 100 % for all events (Fig. 3c) and between 80 % and 93 % for relevant earthquakes (Fig. 3d). For all configurations, the use of high EPL values (75 % or 90 %; empty symbols) generally requires longer times to issue the first alert declaration and does not provide significant performance improvements, as compared to the value EPL = 50 % (filled symbols).
Whichever configuration is used, an increase of the user-set PGAth generally results into a slightly higher impact prediction performance, when considering all the events. This is a widely understood behaviour of EEW systems and reflects the relative larger number of SND, with respect to the SD, when increasing the threshold level for warning declaration (Minson et al., 2019). Indeed, the same effect is less evident when considering the relevant earthquakes only, for which the number of SD remains rather constant between different configurations, and SND are partially reduced from the computation. The threshold-dependency of impact prediction performance becomes less evident at later times.
It is worth to mention that the percentages here refer to the individual node numbers that provide successful declarations (both SD and SND) vs. unsuccessful declarations (both MD and FD). This means that, in case of a missed/false declaration of threshold exceedance at a single node, there will be an underestimation/overestimation of the railway segment length affected by strong shaking, but anyway the alert for a potential damaging earthquake occurrence will be issued in most of the cases. The underestimation of the railway segment length affected by strong shaking is mitigated by considering a buffer zone at the beginning and at the end of the segment.
3.2 Real-time system monitoring
During the period March 2020–January 2022, the EW system has been running in real-time at the RFI railway to test the whole operational chain from data acquisition, transmission, and analysis. The AlpEW system was configured to run with the SSRA decision module, with PGAth set to 10 % of g for the central station and to 5 % of g for the two adjacent stations.
Together with the real-time software running, we carried out a daily monitoring activity during working days (Monday–Friday), through remote connection to the servers at “Napoli Centrale” train station, with the main goal of checking the state-of-health of the EW system, including both the physical infrastructure and the software components. The daily monitoring procedures included a visual inspection of the system status (through dedicated monitors) and the analysis of specific parameters, which are automatically computed and stored in a dedicated file. On a daily basis, we essentially monitored: the number of working stations; the presence of gaps or delays in data transmission at each station (and the potential lost minutes of signals); the quality of recorded signals (in terms of minimum and maximum recorded PGA); the presence of noise transients and, finally, the performance of the EW software in case of earthquake detections.
During this period, 9 earthquakes with magnitude ranging between 2.0 and 3.4 have occurred at minimum distances from the rail of 10–20 km. None of the recorded earthquake triggered the alert declaration at the network sites, with all the PGApred being correctly smaller than the threshold value at all nodes. As an example, Fig. S8 shows the position (with respect to the network infrastructure) of the largest recorded event with local magnitude 3.4 on 22 June 2021 at 18:37:04 (http://terremoti.ingv.it/event/27189251, last access: 4 December 2025) and summarizes the performance of the EEW system in terms of parameter estimates, Decision Module and Alert Declaration.
We presented here the first, end-to-end EEW system operating along the high-speed railway between Naples and Rome in Italy. The system has been conceived and developed to be fully target-oriented, incorporating dedicated methodologies for the impact evaluation and customized strategies for alert release.
4.1 Innovation of the proposed Earthquake Early Warning system for High-Speed Railway Seismic management
The EEW system developed for high-speed railway infrastructure in Italy represents a groundbreaking advancement in both seismology and railway control technologies. Unlike traditional offline applications and testing of EEW methodologies, this work pioneers the first operational system specifically designed for the high-speed Italian railway network. High-speed trains, travelling at several hundred kilometers per hour, require cutting-edge signaling and control systems to ensure fast interventions and operational efficiency. Thanks to the successful results obtained during the implementation of this pilot project, RFI decided to expand Earthquake Early Warning systems to other high-speed lines of the national network.
The innovation of this system is multifaceted: it integrates P wave and S wave data to assess potential impacts, moving beyond conventional source-based early warning approaches. Additionally, it combines network-based and on-site decision-making using probabilistic, evolutionary approaches that continuously refine alerts as seismic data becomes available. The robust processing capabilities leverage accelerometric, velocimetric and displacement signals to ensure high-frequency range coverage, allowing precise and reliable seismic analysis. A standout feature of the system is its ability to define geographically targeted alert zones, avoiding unnecessary shutdowns and enabling operation on unaffected segments – a stark improvement over other systems that may enforce the traffic arrest along wide-impacted railway line (Yamamoto and Tomori, 2013). Moreover, the project introduces a technological leap by automating the railway emergency closure mechanisms, transitioning from manual to remote operations with real-time functionality. This operationalization of EEW for railways not only exemplifies innovation but also sets a new benchmark for integrating earthquakes management into critical transportation infrastructures.
4.2 System performance evaluation
For a distributed target such as the railway line, the traditional concept of magnitude estimation accuracy and lead-time are, indeed, not applicable. The effectiveness of an EEW system should, therefore, be evaluated in a broader sense. Here, we first propose a compact and powerful diagram which transforms the classical approach to the performance evaluation and allows end-users to choose the optimal system configuration parameters. We then evaluate the impact of the system on the railway traffic of the whole line, accounting for the actual probability of occurrence of potentially relevant earthquakes.
The EEW system for high-speed railways in Italy is evolutionary in time, meaning that PGA predictions are updated as the P wave propagates across the network. However, the Decision Module (DM) is conceived in a way that once the declaration of threshold exceedance is given at any node, the step back is no longer possible during the seismic shock. Indeed, the definitions of SD (Successful Declaration), SND (Successful No Declaration), FD (False Declaration) and MD (Missed Declaration) are based on the comparison between predicted and observed PGA values. While the PGA prediction may evolve with time, as longer portions of P wave signals are analyzed, the a-posteriori observed value of PGA is fixed. Moreover, the expected PGA is continuously predicted from the initial P wave peak amplitude (Pd, Pv, Pa) which are computed as the absolute maximum amplitude in increasing P wave time windows, in displacement, velocity and acceleration, respectively. Therefore, the prediction can only increase or remain stable with time. In other words, once the predicted PGA has exceeded the threshold value, the warning declaration cannot be cancelled during the seismic shock. With this in mind, the prediction performance at any node may potentially evolve with time from SND to FD or from MD to SD. Other transitions between alert states are indeed not possible. Thus, a way to improve the quality of predictions and maximize the real-time performance is by reducing FD since the first alert, with more robust P-amplitude to PGA prediction models, accounting for a more comprehensive approach for all source, propagation, and site effects. Additionally, the experience of operational or under testing EEW systems worldwide teaches us that: (1) the performance of a system in terms of correct or wrong predictions of the PGA strongly depends on the threshold value for the alert declaration; (2) the declaration of correct alerts can be pushed to the limits, while the trade-off between missed and false alerts cannot be eliminated (Minson et al., 2019). Indeed, the lower the threshold is, the higher is the probability for the system of issuing false alerts, with a relatively small number of missed alerts. Conversely, if a high threshold is requested to release the warning, the chance of declaring false alerts decreases, but the incidence of missed alerts may increase.
4.3 Alerted Segment of the Railway (ASR) and Potential Benefits of the Early Warning System
Beyond the performance evaluation, a critical aspect of this study is the utilization and effectiveness of earthquake alerts in railway applications (Minson et al., 2021). Stopping a high-speed train completely requires a considerable amount of time, which may sometimes exceed the warning time provided by the system. Therefore, one of the primary advantages of the EEW system is its ability to prevent high-speed trains from entering the Alerted Segment of the Railway (ASR) while promptly initiating deceleration for trains already within the segment. This approach helps mitigate the potential impacts of seismic shocks. During an earthquake alert, operational restrictions would slow down and eventually stop trains within the ASR, while preventing entry for trains approaching the segment from either direction.
The proportion of trains inside or outside the ASR during an alert depends on train traffic density along the railway and the extent of the ASR, which is determined by the earthquake's magnitude (M) and its distance (R) from the railway line. We computed the expected ASR lengths for earthquakes with magnitudes between 4.5 and 7.0, occurring at distances of 10 to 100 km from the RM-NA railway line, using an empirical relation, similar to a standard GMPE, between the length of ASR, the earthquake magnitude (M) and the distance of the earthquake from the railway (R) (see Appendix C: Alerted Segment of the Railway computation). Figure 4 shows data used for the estimation of the ASR. Additionally, a two-month analysis of train traffic on the high-speed railway revealed two occupancy patterns: low-density periods (06:00–10:00 and 20:00–23:00) and high-density periods (10:00–20:00), during which rail occupancy remains relatively consistent across the line (Fig. 5a). Based on these occupancy trends and earthquake scenarios, we estimated the distribution of trains inside and outside the ASR, as shown in Fig. 5b. For most ASR lengths and time periods, the percentage of trains outside the ASR exceeds those within it, except for the case where ASR = 100 km, where the proportions are approximately equal. An ASR length of 100 km corresponds to a large earthquake occurring close to the railway line (M>6.5, R<20 km). This represents a rare scenario for the RM-NA railway, with an estimated return period of approximately 2000 years (Fig. 5c) (Appendix C: Alerted Segment of the Railway computation). More frequent cases, with return periods of 10–15 years, involve moderate earthquakes (M 4–5) occurring within 10–20 km of the railway, resulting in ASRs of about 10 km. In these instances, the vast majority of trains would likely receive sufficient warning to decelerate or stop before entering the ASR.
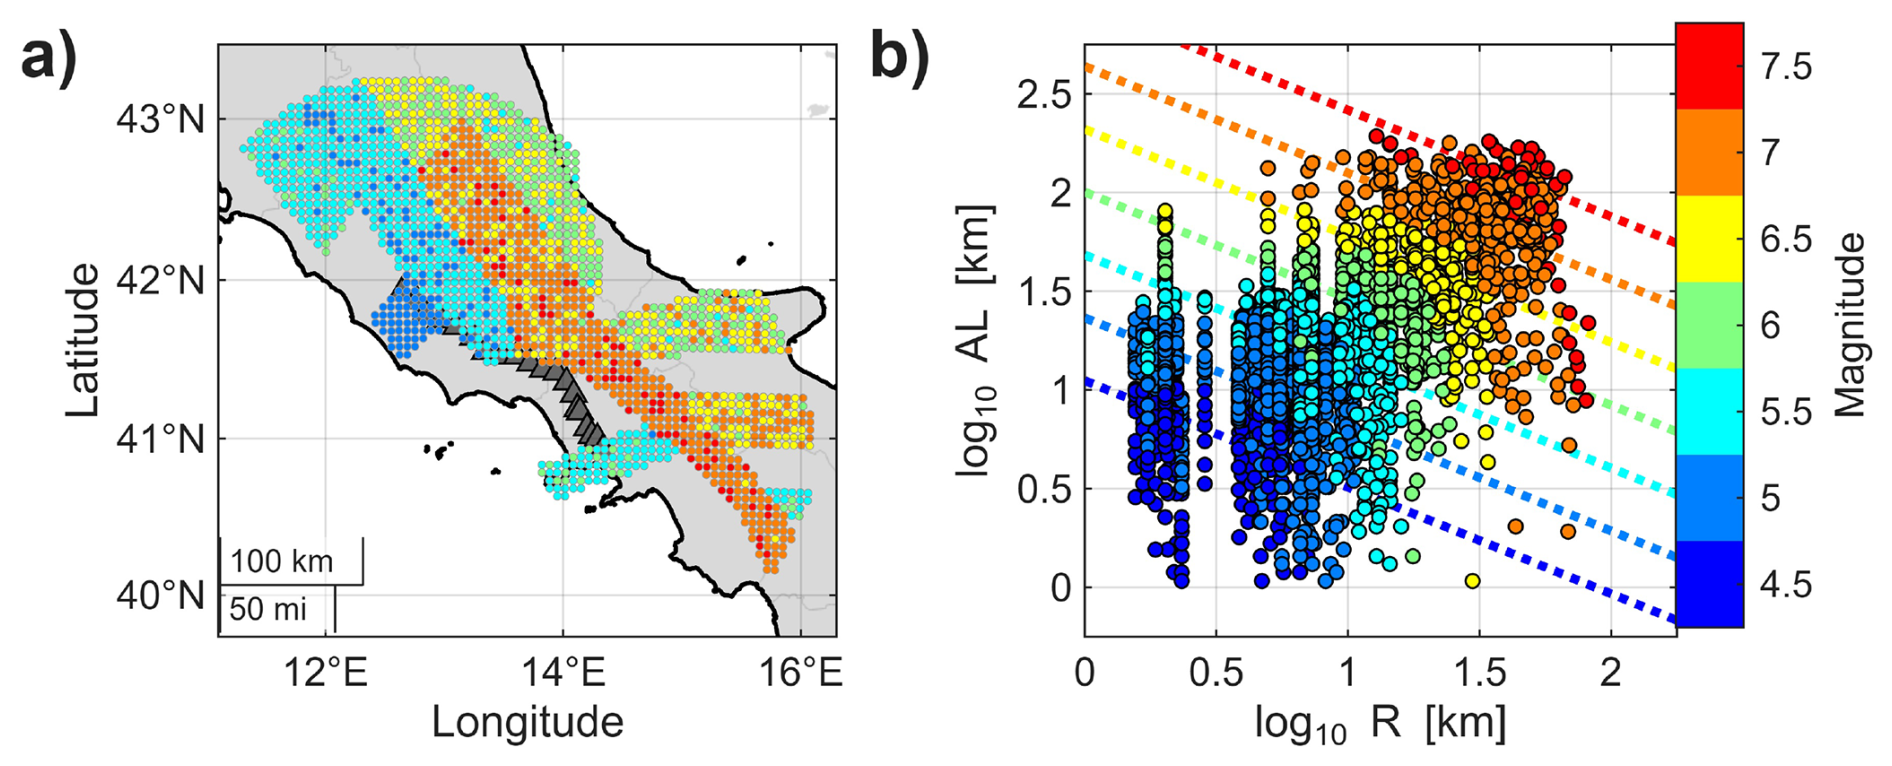
Figure 4Alerted Segment of the Railway computation. (a) Catalogue used for the simulations. Each point represents co-located earthquakes with a maximum magnitude represented by the color. (b) Length of the ASR as a function of the minimum distance (R) from the railway and of magnitude (color). The dotted lines represent Eq. (4) at different magnitude values, and they are colored according to colorbar.
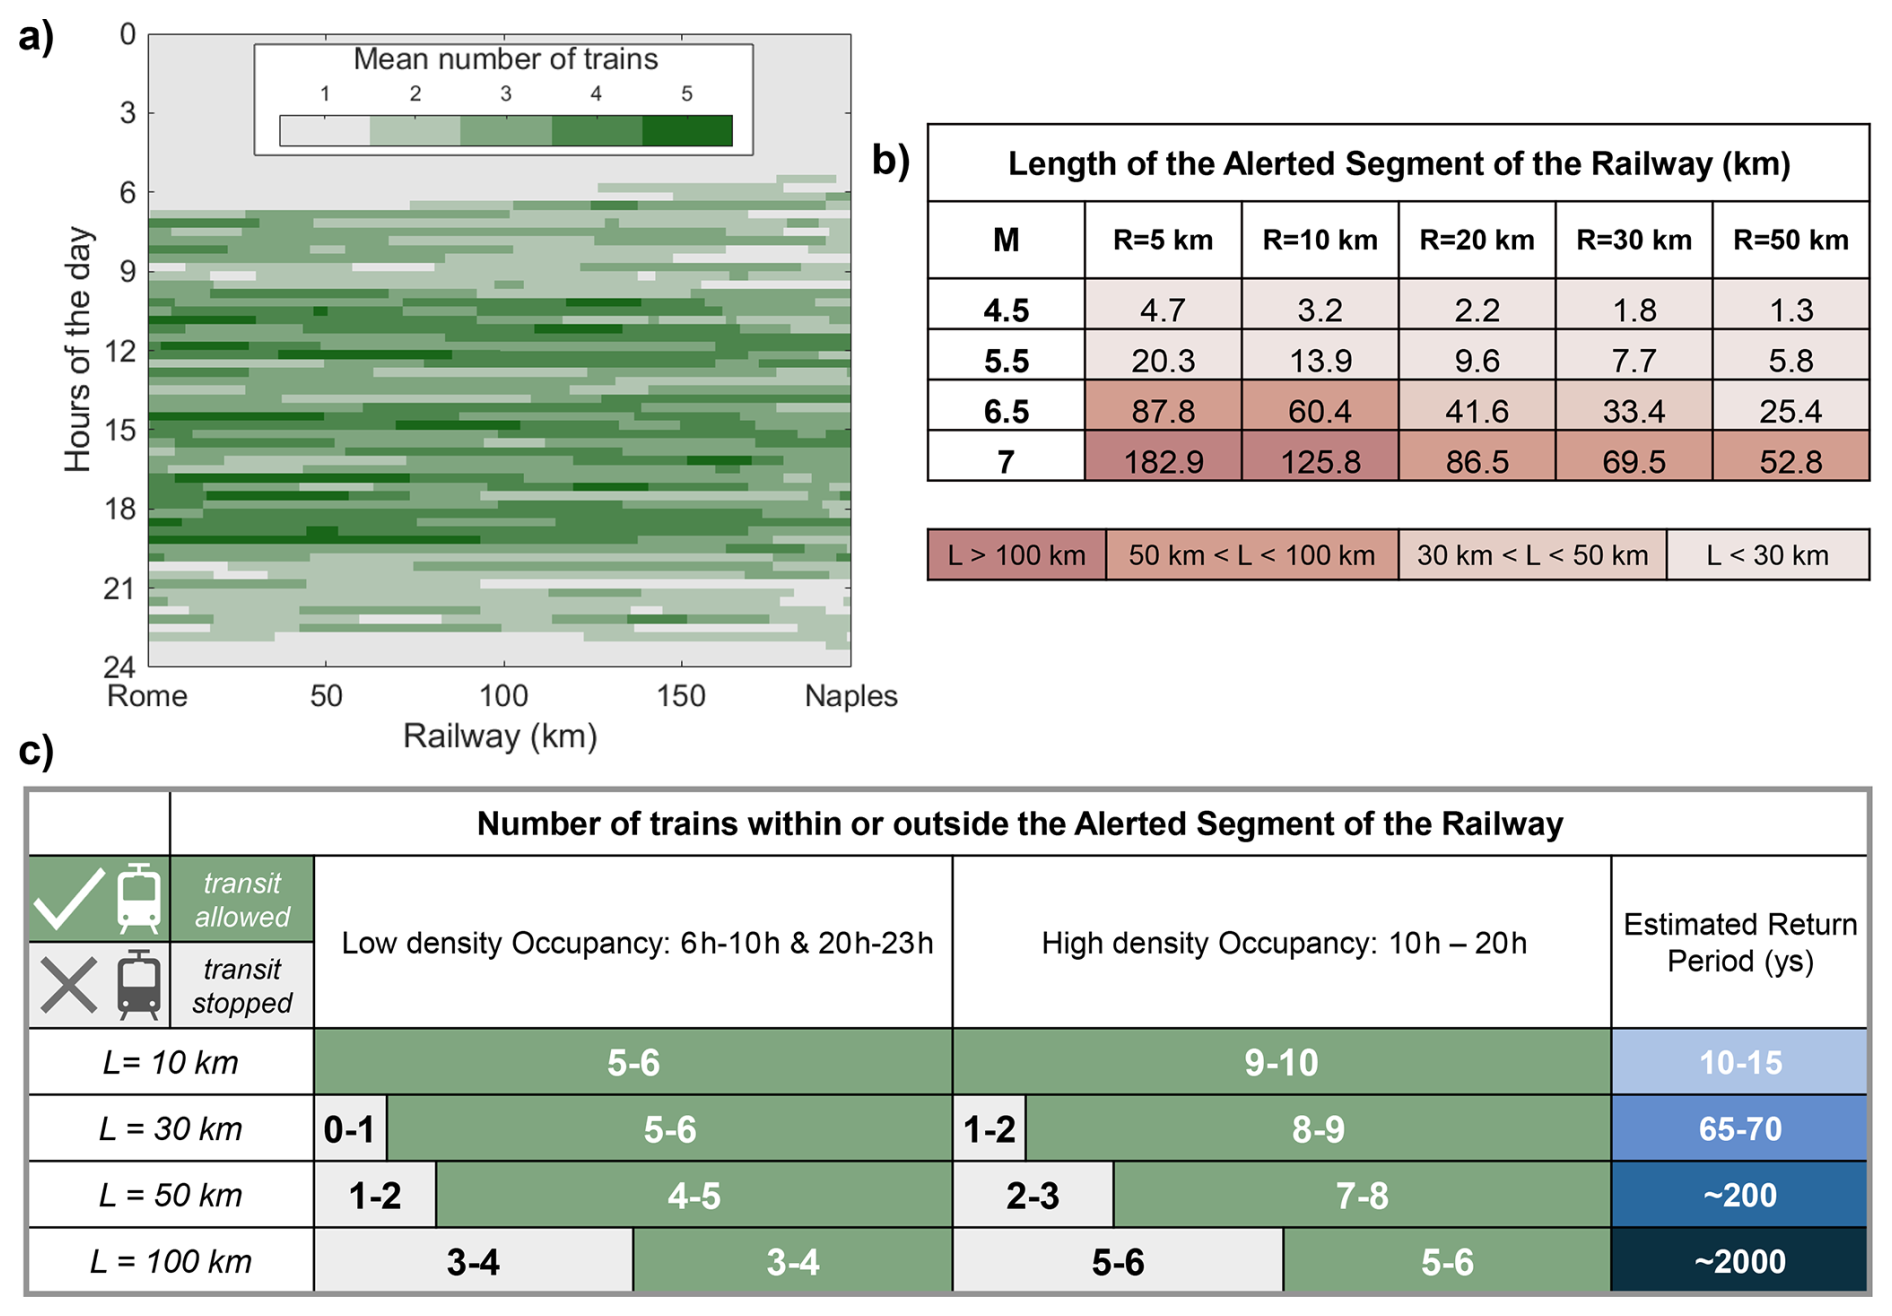
Figure 5Impact on the railway traffic. (a) mean number of trains during different hours of the day, based on a two-month track record of train transit on the RM-NA line. (b) length of the Alerted Segment of the Railway (in km), as a function of the magnitude of the event (rows) and distance from the railway line (columns). (c) the figure shows the average number of trains travelling within or outside the Alerted Segment of the Railway, for specific values of the segment lengths (rows). The average number of trains is computed for two different time slots of the day, corresponding to a low-density occupancy interval (left columns, 6–10 & 20–23 h) and to a high-density occupancy interval (10–20 h). Green segments represent those portions of the line in which the train traffic would be allowed, while gray segments are those in which the traffic would be stopped. The estimated return period for each case is also shown.
Furthermore, while the current ASR estimates rely on theoretical PGA values, the ability of the EEW system to rapidly identify non-relevant earthquakes or adjust ASR parameters based on real-time data could significantly enhance the system's efficiency. This would enable faster resuming train operations, providing substantial benefits to the overall railway infrastructure.
Finally, to validate the trigger criteria, we simulated the criteria for the first alert release embedded in the SSR2 configuration of the DM and evaluated its performance on the largest historical earthquakes occurred nearby the railway line (see Appendix C: Alerted Segment of the Railway computation). We evaluated the expected shaking produced by these earthquakes along the route and whether they would or would not have triggered the activation of the EEW system. The results are explained in Sect. S2 and shown in Fig. S9. For all the selected scenarios, the earthquakes would have triggered the activation of the alert, resulting in the interruption of the train circulation within a portion of the line (ASR), ranging from 20 to 50 km, while keeping the circulation possible in the rest of the route.
4.4 Early Warning System Exportability
A significant aspect of this work is the scalability and adaptability of the proposed early warning system beyond the pilot line. The platform has been designed with exportability in mind, making it readily applicable to other segments of the national railway network. This flexibility is critical for extending the benefits of the system to a broader range of railway infrastructures, particularly in seismically active regions.
The system can be seamlessly integrated with any existing seismic network, whether linear or spatially distributed, provided that the network supports real-time data acquisition and transmission. Once deployed, the platform can process incoming data from these networks to deliver precise earthquake location and magnitude and generate accurate near real-time shake maps.
In the current implementation of the operational system, the earthquake magnitude is not computed, as this requires an estimate of both the earthquake location and its distance from the array. Preliminary tests and validation experiments indicated that earthquake locations derived from first P-arrival times recorded by a linear array are highly uncertain, making this approach unsuitable for operational use. Looking ahead, when the system is extended to additional and intersecting railway segments, the resulting sparse network geometry is expected to enable more reliable earthquake location and magnitude estimates. Incorporating these two parameters into the region-specific GMPE would make it possible to expand the definition of the ASR beyond the limits imposed by the sole use of recorded P wave signals.
These capabilities are crucial not only for issuing timely alerts but also for coordinating rapid post-event response actions, such as infrastructure inspections and traffic management. Furthermore, the ability to generate reliable shake maps in near-real-time allows railway operators to assess the impact of seismic events on specific segments of the infrastructure. This targeted approach ensures that traffic can be quickly resumed on unaffected sections of the railway line, minimizing disruptions and reducing downtime. The system's modular design also enables customization to meet the specific requirements of different railway networks, accommodating variations in seismic hazard levels, infrastructure layouts, and operational priorities.
This study presents the development and implementation of the first fully operational Earthquake Early Warning (EEW) system specifically designed for high-speed railway infrastructure in Italy. Implemented along the Naples-Rome high-speed railway line, the system embodies a significant technological and methodological leap in both seismic management and railway operations. It offers a practical and highly effective solution for mitigating the risks posed by earthquakes in critical transportation networks:
-
Unlike traditional EEW approaches that focus solely on source parameters, this system integrates P wave and S wave data to evaluate potential impacts dynamically and adopts an evolutionary decision-making approach. This ensures that alerts are continuously refined as seismic data becomes available, improving accuracy and response times.
-
Its ability to define geographically specific alert zones minimizes unnecessary disruptions by isolating affected railway segments, a stark contrast to conservative systems that may necessitate total line shutdowns. Furthermore, the integration of automated emergency closure mechanisms enhances operational efficiency and reliability by enabling remote, real-time control of railway traffic during seismic events.
-
The performance evaluation of the system demonstrates its robustness and adaptability to the unique challenges posed by high-speed railways. The system accounts for the complexities of train occupancy patterns, seismic event parameters, and the spatial distribution of seismic networks. By preventing trains from entering the Alerted Segment of the Railway (ASR) and initiating controlled deceleration for those within it, the system effectively mitigates seismic impacts.
-
The platform's design is inherently scalable and exportable, making it applicable to other segments of the national and international railway networks. Its seamless integration with existing seismic networks enables precise earthquake location and near real-time shake map generation, essential for coordinating post-event responses.
The TM parameter is a linear combination of the form:
where:
Pa and Pd are the absolute maximum amplitude on acceleration and displacement waveforms, respectively, measured on the vertical components in a short time window after the P wave arrival; τc is the characteristic (or dominant) period of the signal (Kanamori, 2005); RUD (Iwata et al., 2015) expresses the ratio between the acceleration signal, filtered in the high-frequency band (15–40 Hz) and the acceleration signal, filtered in the low-frequency band (0.075–3 Hz); α, β, γ are empirical coefficients. The signals with a dominant low frequency energy content (< 15 Hz), such as seismic events, are associated to small TM values, while the high frequency signals, such as those produced by the train passage or other sources of noise, are generally associated to large TM values, although a clear separation of TM values between trains and earthquakes does not exist (Fig. S3). The coefficients α, β, γ are estimated for each station using a global exploration algorithm and are chosen as the values that maximize the discrimination capability of the TM parameter (i.e., those parameters that minimize the overlap of TM distributions, between train signals and earthquake records). The α, β, γ values, as well as the threshold value on TM parameter for each station are reported in Table S1.
The discrimination algorithm finally requires an additional constraint on the amplitude level of the recorded signal, to discard other potential sources of noise (such as electromagnetic or lightning interferences) that may produce ground vibrations and interfere with seismic signals. A seismic event is declared when either TM < TMth or when Pd>Pdth, being TMth and Pdth prior established threshold levels on the two parameters, respectively. The threshold value on the logarithm of Pd is set for all stations to −2.16 (cm), which corresponds to a Mercalli–Cancani–Sieberg macro-Intensity (IMCS,) equal to III, when log Pd is scaled to the Peak Ground Acceleration (PGA) through the empirical relationship from Faenza and Michelini (2010), as explained in the following section.
We point out that there are currently several literature papers supporting the use of ML classification and discrimination algorithms for seismic signals, as well as for the prediction of ground motion quantities (Choi et al., 2024; Li et al., 2023; Zhu et al., 2024). While the identification of train generated signals may be accomplished by machine learning algorithms, the challenge for an EW system is to be able to discriminate against the earthquake from the train signals using a very short time window (of the order of 1 s). To our knowledge, there are no consolidated examples of machine learning algorithms specifically tailored for detecting and picking P wave arrivals along railway lines.
The observed P-motion peak amplitudes at each site are used to predict the expected Peak Ground Acceleration (PGApred), which represents the standard parameter for seismic hazard assessments in railways applications (Nakamura, 1988; Nakamura and Saita, 2007). The PGA is predicted from the initial peak amplitude parameters using empirical ground motion prediction equations relating the initial amplitude of the P wave to the maximum acceleration level of the form:
where Px represents the initial peak amplitude, computed as the absolute value in a short time window after the P wave arrival in displacement, velocity, or acceleration (Pd, Pv, Pa, respectively), a and b are empirically derived coefficients (and related uncertainties) for each specific time window from 1.5 to 5 s, and PGA is the absolute maximum among the two horizontal components. Equation (5) is used in real-time operations to predict the PGA as the weighted average between the three estimates from Pd, Pv, Pa. For each value of observed Pd (Pv or Pa) the corresponding, predicted PGA value (PGApred) is first associated to a log-normal distribution, centred at the log-PGApred value and with a width given by the standard deviation of the empirical scaling relationship (Fig. S4). Then, an Exceedance Probability Level (EPL) is set to the log-normal distribution, to quantify to what extent (with which confidence level) the predicted PGA will exceed the threshold level (PGAth). Weights are inversely proportional to the standard error of each scaling relationship (defined by Eq. 2) and the final variance (σPGApred) is given by the standard propagation of the errors on the three estimated quantities. The coefficients a and b are calibrated on a database of Italian earthquakes occurred between 2009 and 2016, with magnitude between 3.5 and 6, available from the Department of Civil Protection through the ITACA 2.0 Portal (Luzi et al., 2008). The table containing all coefficients for each parameter and each time-window is provided in Table S2.
The use of three peak-amplitude parameters has already been discussed in literature (Colombelli et al., 2015) and has been shown to improve the PGA predictions, with respect to the use of a single amplitude parameter, since the three quantities are related to different frequency bands of the recorded ground motion and thus their combination allows for a more broad-band characterization of the earthquake ground motion. The maximum time window of 5 s has been chosen according to the expected maximum P-displacement half-duration for moderate to large earthquakes (M about 7) in Italy as inferred from theoretical and observed rupture duration vs seismic moment scaling relationships (Sato and Hirasawa, 1973).
To predict the extension of the ASR, we derive an empirical relation, similar to a standard GMPE, between the length of ASR, the earthquake magnitude (M) and the distance of the earthquake from the railway (R). To this purpose, we simulated the seismicity of the area (in terms of earthquake locations and magnitudes), through the seismogenic zones of the Italian seismic hazard model MPS04 (Stucchi et al., 2004). We generated a massive distribution of events in a maximum distance of 200 km from the railway, for a total of 100 catalogs, each simulating 100 years of seismicity. Then, for each event, we computed the PGApred along the RM-NA railway, using the empirical attenuation relation from Bindi et al. (2011) and estimated ASR as the portion of the line in which PGApred ≥ PGAth defines the length of the ASR. This estimated length is finally correlated to the earthquake magnitude and distance from the line (Fig. 4b) using the following model:
where R is measured in km, ASR is in km and A, B, and C are empirically estimated coefficients. We found A= −0.54 ± 0.04, B= 0.64 ± 0.02, C= −1.82 ± 0.08, σ= 0.24.
To estimate the impact in terms of train transit, we counted the number N of trains that exceeded a given threshold (10 % g) in impacted length. The return period is then computed as: RP = (1000 ⋅ 100 years)/N.
To further evaluate the trigger criteria, we extracted from the Italian catalogue the events with a predicted PGA value larger than 10 % g, at least in one point on the railway and simulated the criteria for the first alert release that is embedded in the SSR2 configuration of the Decision Module and requiring PGApred > 10 % g at one station and PGApred > 5 % g at the two adjacent stations. In this simulation, we did not include the aleatory variability of the predicted PGA associated with the empirical relations between P wave peak velocity, acceleration, and displacement amplitudes. Since this analysis relies entirely on PGA values predicted through empirical GMPEs (for a given location and magnitude in the catalogue), we do not make any consideration of the other steps of the EWS – such as P wave picking, train/earthquake discrimination, or waveform quality control – that are normally carried out in real time.
Earthquake acceleration waveforms used in this study were collected from the Italian Accelerometric Archive (ITACA) 3.1 (https://doi.org/10.13127/itaca.3.1, D'Amico et al., 2020; Pacor et al., 2011) at http://itaca.mi.ingv.it (last access: 4 December 2025). Train passages have been recorded at proprietary stations of the Italian Railway Company (RETE FERROVIARIA ITALIANA S.p.A).
The supplement related to this article is available online at https://doi.org/10.5194/nhess-26-299-2026-supplement.
SC, Conceptualization, Methodology, Writing- Reviewing and Editing; AZ, Conceptualization, Methodology, Writing – Reviewing and Editing, Supervision, Funding acquisition; LE, Methodology, Software, Writing – Reviewing and Editing; GF, Methodology, Writing – Reviewing and Editing; GI, Methodology, Writing – Reviewing and Editing; MP, Methodology, Writing – Reviewing and Editing; AC, Methodology, Formal analysis, Data Curation, Writing- Reviewing and Editing; FC, Formal analysis, Data Curation, Writing – Reviewing and Editing; SG, Formal analysis, Data Curation, Writing – Reviewing and Editing; AGI, Methodology, Formal analysis, Data Curation, Writing – Reviewing and Editing; RR, Formal analysis, Data Curation, Writing – Reviewing and Editing; ST, Methodology, Formal analysis, Data Curation, Writing – Reviewing and Editing; AM, Conceptualization, Methodology, Writing – Reviewing and Editing; GP, Conceptualization, Methodology, Writing – Reviewing and Editing; FC, Methodology, Writing – Reviewing and Editing; AV, Methodology, Writing – Reviewing and Editing; FI, Conceptualization, Writing- Reviewing and Editing.
The contact author has declared that none of the authors has any competing interests.
Publisher’s note: Copernicus Publications remains neutral with regard to jurisdictional claims made in the text, published maps, institutional affiliations, or any other geographical representation in this paper. While Copernicus Publications makes every effort to include appropriate place names, the final responsibility lies with the authors. Views expressed in the text are those of the authors and do not necessarily reflect the views of the publisher.
This research was conducted within a scientific collaboration between the Italian high-speed railway operator Rete Ferroviaria Italiana (RFI) and the University of Naples, Department of Physics “E. Pancini”, under the Agreement No. 599/2017 (Contract No. 7/2018) for the Development of Seismic Early Warning Systems. We acknowledge the project oversight provided by the Japan Railways Technical Research Institute and are grateful to Dr. Sonia Sorrentino for her continuous technical and managerial support. We also acknowledge Dr. Grazia De Landro, Dr. Sahar Nazeri, and Dr. Antonio Scala for their collaboration throughout the project, as members of the seismological research group of the Department of Physics “E. Pancini”.
This research has been supported by RETE FERROVIARIA ITALIANA S.p.A under the Agreement No. 599/2017 (Contract No. 7/2018) for the Development of Seismic EarlyWarning Systems.
This paper was edited by Filippos Vallianatos and reviewed by Gordon Woo and one anonymous referee.
Allen, R. M. and Melgar, D.: Earthquake early warning: Advances, scientific challenges, and societal needs, Annu. Rev. Earth Planet. Sci., 47, 361–388, https://doi.org/10.1146/annurev-earth-053018-060457, 2019.
Bernard, P. and Zollo, A.: The Irpinia (Italy) 1980 earthquake: Detailed analysis of a complex normal faulting, J. Geophys. Res. Solid Earth, 94, 1631–1647, https://doi.org/10.1029/JB094IB02P01631, 1989.
Bindi, D., Pacor, F., Luzi, L., Puglia, R., Massa, M., Ameri, G., and Paolucci, R.: Ground motion prediction equations derived from the Italian strong motion database, Bulletin of Earthquake Engineering, 9, 1899–1920, https://doi.org/10.1007/S10518-011-9313-Z, 2011.
Chiarabba, C., De Gori, P., Cattaneo, M., Spallarossa, D., and Segou, M.: Faults Geometry and the Role of Fluids in the 2016–2017 Central Italy Seismic Sequence, Geophys. Res. Lett., 45, 6963–6971, https://doi.org/10.1029/2018GL077485, 2018.
Chiaraluce, L.: Unravelling the complexity of Apenninic extensional fault systems: A review of the 2009 L'Aquila earthquake (Central Apennines, Italy), J. Struct. Geol., 42, 2–18, https://doi.org/10.1016/J.JSG.2012.06.007, 2012.
Choi, S., Lee, B., Kim, J., and Jung, H.: Deep-Learning-Based Seismic-Signal P-Wave First-Arrival Picking Detection Using Spectrogram Images, Electronics, 13, 229, https://doi.org/10.3390/ELECTRONICS13010229, 2024.
Clinton, J., Zollo, A., Marmureanu, A., Zulfikar, C., and Parolai, S.: State-of-the art and future of earthquake early warning in the European region, Bulletin of Earthquake Engineering, 14, https://doi.org/10.1007/s10518-016-9922-7, 2016.
Colombelli, S., Caruso, A., Zollo, A., Festa, G., and Kanamori, H.: A P wave-based, on-site method for earthquake early warning, Geophys. Res. Lett., 42, 1390–1398, https://doi.org/10.1002/2014GL063002, 2015.
Cremen, G. and Galasso, C.: Earthquake early warning: Recent advances and perspectives, Earth Sci. Rev., 205, https://doi.org/10.1016/j.earscirev.2020.103184, 2020.
Cremen, G., Galasso, C., and Zuccolo, E.: Investigating the potential effectiveness of earthquake early warning across Europe, Nature Communications, 13, 1–10, https://doi.org/10.1038/s41467-021-27807-2, 2022.
D'Amico, M., Felicetta, C., Russo, E., Sgobba, S., Lanzano, G., Pacor, F., and Luzi, L.: Italian Accelerometric Archive v 3.1, Istituto Nazionale di Geofisica e Vulcanologia, Dipartimento della Protezione Civile Nazionale [data set], https://doi.org/10.13127/itaca.3.1, 2020.
Erdik, M., Fahjan, Y., Ozel, O., Alcik, H., Mert, A., and Gul, M.: Istanbul earthquake rapid response and the early warning system, Bulletin of Earthquake Engineering, 1, 157–163, https://doi.org/10.1023/A:1024813612271, 2003.
European Commission: Technology Readiness Levels (TRL), HORIZON 2020 – WORK PROGRAMME 2014–2015 General Annexes, Extract From Part 19 – Commission Decision C, Bruxelles, 4995 pp., https://www.cesaer.org/content/10-library/2021/technology-readiness-level/h2020-wp1415-annex-g-trl-en.pdf (last access: 4 December 2025), 2014.
Faenza, L. and Michelini, A.: Regression analysis of MCS intensity and ground motion parameters in Italy and its application in ShakeMap, Geophys. J. Int., 180, 1138–1152, https://doi.org/10.1111/J.1365-246X.2009.04467.X, 2010.
Firmi, P., Iacobini, F., Rinaldi, A., Vecchi, A., Agostino, I., and Mauro, A.: Methods for managing hydrogeological and seismic hazards on the Italian railway infrastructure, Structure and Infrastructure Engineering, 17, 1651–1666, https://doi.org/10.1080/15732479.2020.1822883, 2020.
Flammini, F.: Sistemi di controllo per l'Alta Velocità ferroviaria, Mondo Digitale, 9, 18–32, 2010.
Galli, P. and Galadini, N. F.: Seismotectonic Framework of the 1997–1998 Umbria-Marche (Central Italy) Earthquakes, Seismological Research Letters, 70, 417–427, 1999.
Gorini, A., Nicoletti, M., Marsan, P., Bianconi, R., De Nardis, R., Filippi, L., Marcucci, S., Palma, F., and Zambonelli, E.: The Italian strong motion network, Bulletin of Earthquake Engineering, 8, 1075–1090, https://doi.org/10.1007/s10518-009-9141-6, 2010.
Iwata, N., Yamamoto, S., Korenaga, M., and Noda, S.: Improved Algorithms of Seismic Parameters Estimation and Noise Discrimination in Earthquake Early Warning, Quarterly Report of RTRI, 56, 291–298, https://doi.org/10.2219/RTRIQR.56.4_291, 2015.
Kanamori, H.: Real-time seismology and earthquake damage mitigation, Annu. Rev. Earth Planet. Sci., 33, 195–214, https://doi.org/10.1146/annurev.earth.33.092203.122626, 2005.
Lakušić, S., Haladin, I., and Vranešić, K.: Railway infrastructure in earthquake affected areas, Gradjevinar, 72, 905–921, https://doi.org/10.14256/JCE.2967.2020, 2020.
Laroche, F. and Guihéry, L.: European Rail Traffic Management System (ERTMS): Supporting competition on the European rail network?, Research in Transportation Business & Management, 6, 81–87, https://doi.org/10.1016/J.RTBM.2012.12.006, 2013.
Le Guenan, T., Smai, F., Loschetter, A., Auclair, S., Monfort, D., Taillefer, N., and Douglas, J.: Accounting for end-user preferences in earthquake early warning systems, Bulletin of Earthquake Engineering, 14, 297–319, https://doi.org/10.1007/s10518-015-9802-6, 2016.
Li, B., Fan, L., Jiang, C., Liao, S., and Fang, L.: CSESnet: A deep learning P wave detection model based on UNet designed for China Seismic Experimental Site, Front Earth Sci (Lausanne), 10, 1032839, https://doi.org/10.3389/feart.2022.1032839, 2023.
Lomax, A., Satriano, C., and Vassallo, M.: Automatic picker developments and optimization: Filterpicker-A robust, broadband picker for real-time seismic monitoring and earthquake early warning, Seismological Research Letters, 83, 531–540, https://doi.org/10.1785/gssrl.83.3.531, 2012.
Luzi, L., Hailemikael, S., Bindi, D., Pacor, F., Mele, F., and Sabetta, F.: ITACA (Italian ACcelerometric Archive): A web portal for the dissemination of Italian strong-motion data, Seismological Research Letters, 79, 716–722, https://doi.org/10.1785/gssrl.79.5.716, 2008.
Minson, S. E., Baltay, A. S., Cochran, E. S., Hanks, T. C., Page, M. T., McBride, S. K., Milner, K. R., and Meier, M. A.: The Limits of Earthquake Early Warning Accuracy and Best Alerting Strategy, Sci. Rep., 9, https://doi.org/10.1038/s41598-019-39384-y, 2019.
Minson, S. E., Cochran, E. S., Wu, S., and Noda, S.: A Framework for Evaluating Earthquake Early Warning for an Infrastructure Network: An Idealized Case Study of a Northern California Rail System, Front. Earth Sci. (Lausanne), 9, 450, https://doi.org/10.3389/feart.2021.620467, 2021.
Nakamura, Y.: On the urgent earthquake detection and alarm system (UreDAS), Proc. 9th World Conf. Earthq. Engr., 6, 1–6, https://www.iitk.ac.in/nicee/wcee/article/9_vol7_673.pdf (last access: 4 December 2025), 1988.
Nakamura, Y. and Saita, J.: UrEDAS, the earthquake warning system: Today and tomorrow, in: Earthquake Early Warning Systems, https://doi.org/10.1007/978-3-540-72241-0_13, 2007.
Pacor, F., Paolucci, R., Luzi, L., Sabetta, F., Spinelli, A., Gorini, A., Nicoletti, M., Marcucci, S., Filippi, L., and Dolce, M.: Overview of the Italian strong motion database ITACA 1.0, Bulletin of Earthquake Engineering, 9, 1723–1739, https://doi.org/10.1007/s10518-011-9327-6, 2011.
Rados, J., Rados, B., and Kolar, V.: European Train Control System, Annals of DAAAM and Proceedings of the International DAAAM Symposium, 277–301, https://doi.org/10.1007/978-3-642-14509-4_7, 2010.
Rovida, A., Locati, M., Camassi, R., Lolli, B., and Gasperini, P.: The Italian earthquake catalogue CPTI15, Bulletin of Earthquake Engineering, 18, 2953–2984, 2020.
Sato, T. and Hirasawa, T.: Body Wave Spectra From Propagating Shear Cracks, Journal of Physics of the Earth, 21, 415–431, https://doi.org/10.4294/JPE1952.21.415, 1973.
Satriano, C., Wu, Y. M., Zollo, A., and Kanamori, H.: Earthquake early warning: Concepts, methods and physical grounds, Soil Dynamics and Earthquake Engineering, 31, 106–118, https://doi.org/10.1016/j.soildyn.2010.07.007, 2011.
Strauss, J. A. and Allen, R. M.: Benefits and Costs of Earthquake Early Warning, Seismological Research Letters, 87, 765–772, https://doi.org/10.1785/0220150149, 2016.
Stucchi, M., Meletti, C., Montaldo, V., Akinci, A., Faccioli, E., Gasperini, P., Malagnini, L., and Valensise, G.: Pericolosità sismica di riferimento per il territorio nazionale MPS04, Istituto Nazionale di Geofisica e Vulcanologia (INGV), https://doi.org/10.13127/sh/mps04/ag, 2004.
Tan, M., Hu, Q., Wu, Y., Lin, J., and Fang, X.: Decision-making method for high-speed rail early warning system in complex earthquake situations, Transportation Safety and Environment, 6, https://doi.org/10.1093/TSE/TDAD034, 2024.
Yamamoto, S. and Tomori, M.: Earthquake Early Warning System for Railways and its Performance, Journal of JSCE, 1, 322–328, https://doi.org/10.2208/JOURNALOFJSCE.1.1_322, 2013.
Yu, H., Ma, Y., and Yu, T.: High-Speed Railway Earthquake Early Warning Testing System Based on LabVIEW, Advances in Transdisciplinary Engineering, 34, 45–54, https://doi.org/10.3233/ATDE230008, 2023.
Zhang, G., Yang, L., and Jiang, W.: Key technologies of earthquake early warning system for China's high-speed railway, Railway Sciences, 3, 239–262, https://doi.org/10.1108/RS-11-2023-0046, 2024.
Zhu, J., Sun, W., Li, S., Yao, K., and Song, J.: Threshold-based earthquake early warning for high-speed railways using deep learning, Reliab. Eng. Syst. Saf., 250, 110268, https://doi.org/10.1016/J.RESS.2024.110268, 2024.
Zhu, W., Liu, K., Wang, M., and Koks, E. E.: Seismic Risk Assessment of the Railway Network of China's Mainland, International Journal of Disaster Risk Science, 11, 452–465, https://doi.org/10.1007/s13753-020-00292-9, 2020.
- Abstract
- Introduction
- Design and Implementation of the Early Warning System
- Performance Evaluation
- Discussion
- Conclusions
- Appendix A: Earthquake detection and train discrimination
- Appendix B: Peak Ground Acceleration prediction
- Appendix C: Alerted Segment of the Railway computation
- Appendix D
- Data availability
- Author contributions
- Competing interests
- Disclaimer
- Acknowledgements
- Financial support
- Review statement
- References
- Supplement