the Creative Commons Attribution 4.0 License.
the Creative Commons Attribution 4.0 License.
 | 16 Jun 2026
Psychometric and cultural characterization of relative volcanic risk perception levels of individuals highly exposed to proximal activity from Villarrica volcano, Chile
Luis E. Lara
Marcelo A. Lagos
Alfredo A. Vives
This study combines the Psychometric Paradigm and Cultural Theory to analyze volcanic risk perception (VRP) among more than two hundred residents and a comparable number of non-residents living in or visiting the high-hazard zone of Villarrica volcano. While the psychometric approach captures the multidimensional structure and relative positioning of key VRP factors, Cultural Theory helps interpret the cultural patterns through which risk perception is socially differentiated. Together, these approaches provide a more comprehensive framework for understanding VRP in support of emergency management. In this study, VRP is interpreted as a relative measure of awareness of potential volcanic consequences and preparedness-related factors, rather than as an expression of alarmism or perceived likelihood. A key distinction emerges between residents and non-residents. Residents display lower risk-related knowledge but higher levels of internal trust, reflecting strong community ties alongside more limited knowledge of hazards. Non-residents, in contrast, exhibit higher knowledge scores but lower internal trust, which may be associated with a potential overestimation of individual coping capacity during volcanic events. Despite these differences, both groups show similarly high levels of external trust, indicating confidence in authorities and experts and suggesting favourable conditions for adherence to official emergency guidance. Socio-demographic factors further shape VRP configurations. Elderly individuals and those outside the workforce tend to occupy lower VRP positions, highlighting groups that may benefit from tailored risk communication strategies. Higher educational attainment is generally associated with higher VRP, while economic activity, particularly in sectors such as tourism and agriculture, is linked to pronounced variability in risk perception. Indigenous populations are slightly overrepresented in lower VRP levels, underscoring the importance of integrating Indigenous knowledge systems more effectively into volcanic risk assessments. In contrast, no clear patterns are observed for gender identity or religion, although existing literature suggests these factors may influence risk perception in more complex, context-dependent ways. Overall, the findings emphasize the importance of situating volcanic risk perception within its social, cultural, and economic context, and demonstrate how integrating complementary theoretical frameworks can support the design of more effective, group-specific risk communication strategies to enhance community resilience.
- Article
(6974 KB) - Full-text XML
-
Supplement
(435 KB) - BibTeX
- EndNote


Risk perception has been a crucial topic in disaster risk science, highlighted as a key component in the decision-making processes of individuals facing emergencies, with the outcomes of these decisions directly impacting human safety (Siegrist and Arvai, 2020). Risk perception refers to people's judgments when characterizing and evaluating hazardous activities and technologies (Slovic, 1987). These judgments are not purely rational but are strongly influenced by intuition, affect, and experience (Slovic and Peters, 2006), and involve processes of collecting, selecting, interpreting, and communicating signals about uncertain and potentially harmful events (Wachinger et al., 2013). Consequently, risk perception is widely recognized as a contextual, socially embedded, and multifactorial process rather than a purely individual cognitive assessment (Gaillard, 2010).
In the context of natural hazards, significant scientific attention on risk perception has focused on earthquakes, floods, and tsunami-related disasters, while comparatively less attention has been given to volcanic hazards (Siegrist and Arvai, 2020; Favereau et al., 2018). However, this does not imply an absence of research on Volcanic Risk Perception (VRP). On the contrary, a growing body of literature, especially since the 2000s, has documented how communities exposed to volcanic activity perceive, interpret, and respond to volcanic hazards across different geographical and cultural contexts, including Iceland (Bird et al., 2011; Kokorsch and Gísladóttir, 2023), Mexico (López-Vázquez, 2009), Chile (Vergara-Pinto and Romero, 2023; Vergara-Pinto et al., 2024), and Colombia (Hernández Peña et al., 2020). Collectively, these studies show that VRP is shaped by local experience, social organization, attachment to place, trust in institutions, and disaster memory. Nevertheless, compared to other geological hazards, VRP studies remain relatively fragmented, strongly context-specific, and methodologically heterogeneous, limiting cross-case comparison and the systematic identification of relative levels of risk perception. VRP has therefore been identified as a key gap in supporting volcanic emergency strategies and safety protocols more efficiently (Favereau et al., 2018). Volcanic eruptions are serious hazards, having caused the deaths of approximately a quarter of a million people over the past five centuries (Brown et al., 2017; Auker et al., 2013). Unlike many rapid-onset disasters, volcanic crises often unfold over extended periods, lasting from days to years or even decades, with varying intensities and phases. Decisions made by exposed populations during these prolonged episodes are critical, as they strongly influence injuries, fatalities, and long-term social impacts. Notably, over 60 % of fatal volcanic incidents occur more than a week after an eruption begins, with more than 40 % involving individuals who return to hazard zones to recover assets, secure livelihoods, or protect homes (Barclay et al., 2019). Most victims are residents, although non-residents or temporary visitors, such as tourists, scientists, and media personnel, are also frequently affected (Brown et al., 2017). These patterns highlight the central role of VRP in shaping observable behaviours rather than merely attitudes toward risk.
Approaches to studying VRP include qualitative, quantitative, and mixed methodologies. Qualitative approaches such as interviews, ethnographic studies, and narrative analyses have been particularly effective in capturing meanings, beliefs, local knowledge, and cultural interpretations of volcanic hazards (Gaillard, 2008; Dove, 2008; Bird et al., 2011). Quantitative approaches, often grounded in psychometric traditions, allow for the operationalization and comparison of risk perception across individuals and groups through standardized survey instruments (Slovic, 1987; Marris et al., 1998; Favereau et al., 2018). Mixed approaches attempt to integrate both perspectives (Gaillard, 2010). In this study, we adopt a quantitative approach focused on estimating relative levels of VRP, while explicitly acknowledging the limitations of quantifying certain cultural dimensions, such as belief systems or symbolic attachments, that are inherently complex and dynamic (Gaillard, 2008). Previous research on VRP has emphasized a set of recurring factors influencing how individuals interpret and respond to volcanic hazards. Favereau et al. (2018) identified fourteen key peer-reviewed studies as major contributions to the field (e.g., Chester, 2005; Barberi et al., 2008; Carlino et al., 2008; Dove, 2008; Gaillard, 2008; Haynes et al., 2008; Perry and Lindell, 2008; Gavilanes-Ruiz et al., 2009; Njome et al., 2010; Tobin et al., 2011; Jones et al., 2013; Ricci et al., 2013; Eiser et al., 2015). Across these studies, the most frequently examined VRP factors include knowledge, trust (both internal and external), previous experience, proximity to the hazard, sense of community and attachment to place, demographic characteristics, and vulnerability. Importantly, these studies consistently demonstrate that different communities, such as rural versus urban populations or residents versus non-residents, may perceive and respond to the same volcanic threat in markedly different ways (Bird et al., 2011; Gaillard, 2010).
This research focuses on four VRP factors that have been repeatedly highlighted in literature: knowledge, internal trust, external trust, and attachment to place. In this context, knowledge is understood as the appropriation of scientific information about volcanic processes and hazards, combined with experiential learning derived from previous eruptions, local memory, and social transmission (Carlino et al., 2008; Ricci et al., 2013). Previous studies indicate that knowledge is influenced by socioeconomic characteristics such as age, education level, and access to information, although higher levels of formal education do not necessarily translate into higher perceived risk (Haynes et al., 2008). Internal trust refers to individuals' confidence in their own understanding and ability to respond effectively to volcanic emergencies, often associated with self-efficacy and preparedness. This dimension may be enhanced through participation in emergency planning and public discussions (Barclay et al., 2019). External trust refers to the degree of confidence placed in external actors, particularly scientists, monitoring agencies, and authorities. Previous research shows that lower trust in experts or institutions is often associated with heightened awareness of risk, rather than a lower perception of hazard likelihood (Espluga et al., 2009; Njome et al., 2010). In this study, perceiving risk is therefore interpreted as being more aware of potential consequences, rather than as an expression of alarmism. Attachment to place has been widely identified as a critical factor influencing evacuation decisions and long-term exposure to volcanic hazards. Strong emotional, symbolic, and functional ties to place often reduce willingness to evacuate, even when individuals are aware of the associated risks (Barberi et al., 2008; Favereau et al., 2018; Barclay et al., 2019). However, recent studies emphasize that attachment to place should not be interpreted as irrational resistance to safety measures, but rather as a complex relationship between identity, livelihood, comfort, and perceived normalcy (Kokorsch and Gísladóttir, 2023).
The primary data for this study were collected through risk perception surveys applied in areas historically impacted by lahars surrounding Villarrica volcano, one of the most active volcanic systems in South America. Lahars have been selected as the focal hazard because they represent the most frequent and socially experienced volcanic process affecting nearby communities and have historically caused the most severe impacts in the region. While other hazards, such as tephra fallout, may occur, the emphasis on lahars reflects a focus on locally experienced and socially internalized threats. Villarrica volcano is located in the Southern Volcanic Zone of Chile and has produced approximately 160 eruptions over the past 2000 years, with around 130 events recorded during the last five centuries (GVP, 2025). Most eruptions have been effusive, with a Volcanic Explosivity Index (VEI) of 2, although the volcano has also produced VEI 3 and VEI 4 events (Sepúlveda, 2004; van Daele, 2014). The most severe impacts have been associated with lahars, which have repeatedly affected nearby urban and rural settlements, including Pucón, Coñaripe, Villarrica, and surrounding rural valleys. Seasonal population increases due to tourism further complicate exposure patterns and risk communication strategies. Risk perception levels are calculated using a statistical clustering method based on survey responses, allowing for the identification of relative VRP profiles among residents and non-residents. Demographic and socioeconomic variables are then analyzed to explore their influence on these profiles. This study combines two complementary theoretical approaches: the psychometric paradigm, which supports the quantitative estimation of relative VRP levels, and cultural theory, which facilitates the interpretation of social trends and contextual patterns within different VRP groups. The following subsections describe these frameworks (Sects. 1.1 and 1.2), followed by a description of the study area and volcanic history (Sect. 1.3). The Methods section details the survey design and analytical procedures, while the Results and Discussion sections present and interpret the findings in relation to volcanic risk management and preparedness strategies.
1.1 General frameworks to study risk perception
Two general frameworks have been widely used to estimate and characterize risk perception levels in the context of human-made and natural hazards: the Psychometric Paradigm and Cultural Theory (described in the following sections). Both frameworks typically rely on data collection through questionnaires or workshops, using point-scale systems such as Likert scales or 5-point questions to quantify participant responses (Marris et al., 1998). These approaches are particularly useful when the objective is to compare risk perception across individuals or social groups and to relate perception patterns to decision-making and behavioural responses in emergency contexts. This research proposes employing both approaches to achieve the specified objectives of calculating relative VRP levels of populations highly exposed to volcanic activity from Villarrica volcano (Sect. 1.2) using a psychometric approach, and the characterization of social trends within different VRP groups based on a cultural theory perspective (Sect. 2.3). In this context, VRP levels are understood as analytical and comparative constructs rather than absolute or fixed categories, allowing the identification of gradients and profiles of perception within the studied population.
1.1.1 Psychometric Paradigm
The Psychometric Paradigm originated from psychology to gain insights into people's understanding of risk and to support the design of effective risk communication and emergency management strategies (Slovic, 1987). Grounded in foundational research on risk perception heuristics (Fischhoff et al., 1978; Slovic et al., 1979; Slovic, 1987), psychometric studies are commonly used to elicit quantitative judgments on perceived risk, acceptable risk levels, and the perceived benefits of various activities and technologies. In response to early criticism regarding its reliance on cognitive heuristics, the paradigm later incorporated the concept of affect, emphasizing the role of emotions and intuitive responses in risk perception and decision-making (Sjöberg, 1996; Slovic and Peters, 2006). Psychometric approaches have employed a wide range of statistical methods, including multiple regression analysis, Exploratory Factor Analysis, and Principal Components Analysis, to analyze survey-based risk perception data (Fischhoff et al., 1978; Jaspal et al., 2022; Mitsushita et al., 2023). When applied to non-aggregated data and combined with socio-demographic variables, psychometric analyses have demonstrated substantial explanatory power and have been shown to overcome some of the interpretability limitations raised in earlier critiques of the paradigm (Siegrist et al., 2005; Bronfman et al., 2008). In the context of volcanic hazards, psychometric approaches have been particularly useful for identifying differences in risk perception between residents and non-residents, for exploring normalization processes in areas affected by recurrent or persistent volcanic activity, and for comparing relative perception levels across exposed populations (Bird et al., 2011; López-Vázquez, 2009; Johnston et al., 1999). Today, the psychometric paradigm is widely applied across multiple research fields, including health-related risk studies, such as perceived risks during the COVID-19 pandemic, and disaster risk assessment, where it supports the identification of perception profiles relevant for preparedness and communication strategies (Weber et al., 2002; Jaspal et al., 2022; Mitsushita et al., 2023).
1.1.2 Cultural theory
Cultural Theory, developed by sociologists and anthropologists, seeks to identify cultural patterns that influence how individuals and groups perceive and respond to risk (Douglas and Wildavsky, 1982). Within this framework, risk is understood as a social construct, and individuals are often described through four archetypal orientations, namely isolates, hierarchists, individualists, and egalitarians, each associated with distinct attitudes toward authority, regulation, and uncertainty (Douglas and Wildavsky, 1982; Tansey and O'Riordan, 1999; Edgar and Sedgwick, 1999). Cultural Theory has been both widely applied and critically debated. Some authors have argued that culture is dynamic, context-dependent, and difficult to fully represent through a limited number of archetypes (Tansey and O'Riordan, 1999). Others have pointed to its relatively low explanatory power and methodological constraints when used as a rigid classificatory tool (Tansey, 2004; Oltedal et al., 2004; Sjöberg, 1996). In response to these critiques, more recent applications have emphasized the use of Cultural Theory as an interpretative framework rather than a deterministic typology, focusing on identifying social tendencies, shared meanings, and contextual patterns rather than categorizing individuals into fixed groups (Tansey, 2004; Oltedal et al., 2004). Despite these limitations, Cultural Theory remains a valuable perspective in disaster risk research, particularly for understanding how values, beliefs, traditions, and relationships with the environment shape perceptions of natural hazards (Renn and Rohrmann, 2000; Paton et al., 2010). In volcanic contexts, this approach has contributed to explaining why populations exposed to similar hazards may develop markedly different interpretations of risk, responsibility, and acceptable levels of danger across cultural and geographical settings (Renn and Rohrmann, 2000; Paton et al., 2010; Jones et al., 2013; Zeidler, 2015). Within these settings, risk perception is often embedded in territorial identities, including rural livelihoods, tourism-based activities, and everyday coexistence with the volcanic environment, which interact with belief systems and religious worldviews to shape interpretations of risk (Bird et al., 2011; Salazar and Jalabert, 2016; Gaillard, 2008).
1.2 Study area: Villarrica volcano
Villarrica is a stratovolcano located in the Southern Volcanic Zone (SVZ) at 39.42° S, 71.93° W, active since the Late Pleistocene and situated between Villarrica and Calafquen lakes (Fig. 1). It is primarily a basaltic to basaltic-andesite volcano and ranks among the most active volcanic systems in South America (Lara and Clavero, 2004). The estimated proximal hazard zone includes potential impacts from lava flows, lahars, and minor pyroclastic flows, covering an area of approximately 1500 km2 (Lara et al., 2021, 2011). The volcanic edifice spans about 400 km2, reaching an elevation of 2847 m above sea level and rising 2450 m above its base (Lara and Clavero, 2004). In this study, the names Pucón and Villarrica refer both to urban localities and to their corresponding municipalities. When referring to rural areas, the analysis includes sparsely populated zones within the municipalities of Pucón, Villarrica, and Panguipulli. Pucón, with approximately 17 000 inhabitants, and Coñaripe, with about 1500 inhabitants according to the 2017 Census, are the closest urban localities to the Villarrica summit and have been severely impacted by historic lahars from the volcano (Fig. 1). In addition, around 10 000 people live in surrounding rural areas, where valley floors are particularly exposed due to the channelization of lahar flows along river networks. Urban localities such as Pucón, Coñaripe, Villarrica, and Lican Ray experience significant seasonal population increases during the austral summer, driven by tourism and recreational activities associated with the volcanic landscape and the ski center near the summit. This combination of permanent residents, rural populations, and transient visitors has led to increased land use pressure and expanding exposure in areas affected by volcanic hazards, particularly lahars, reinforcing the relevance of analyzing volcanic risk perception in this dynamic social and territorial context.
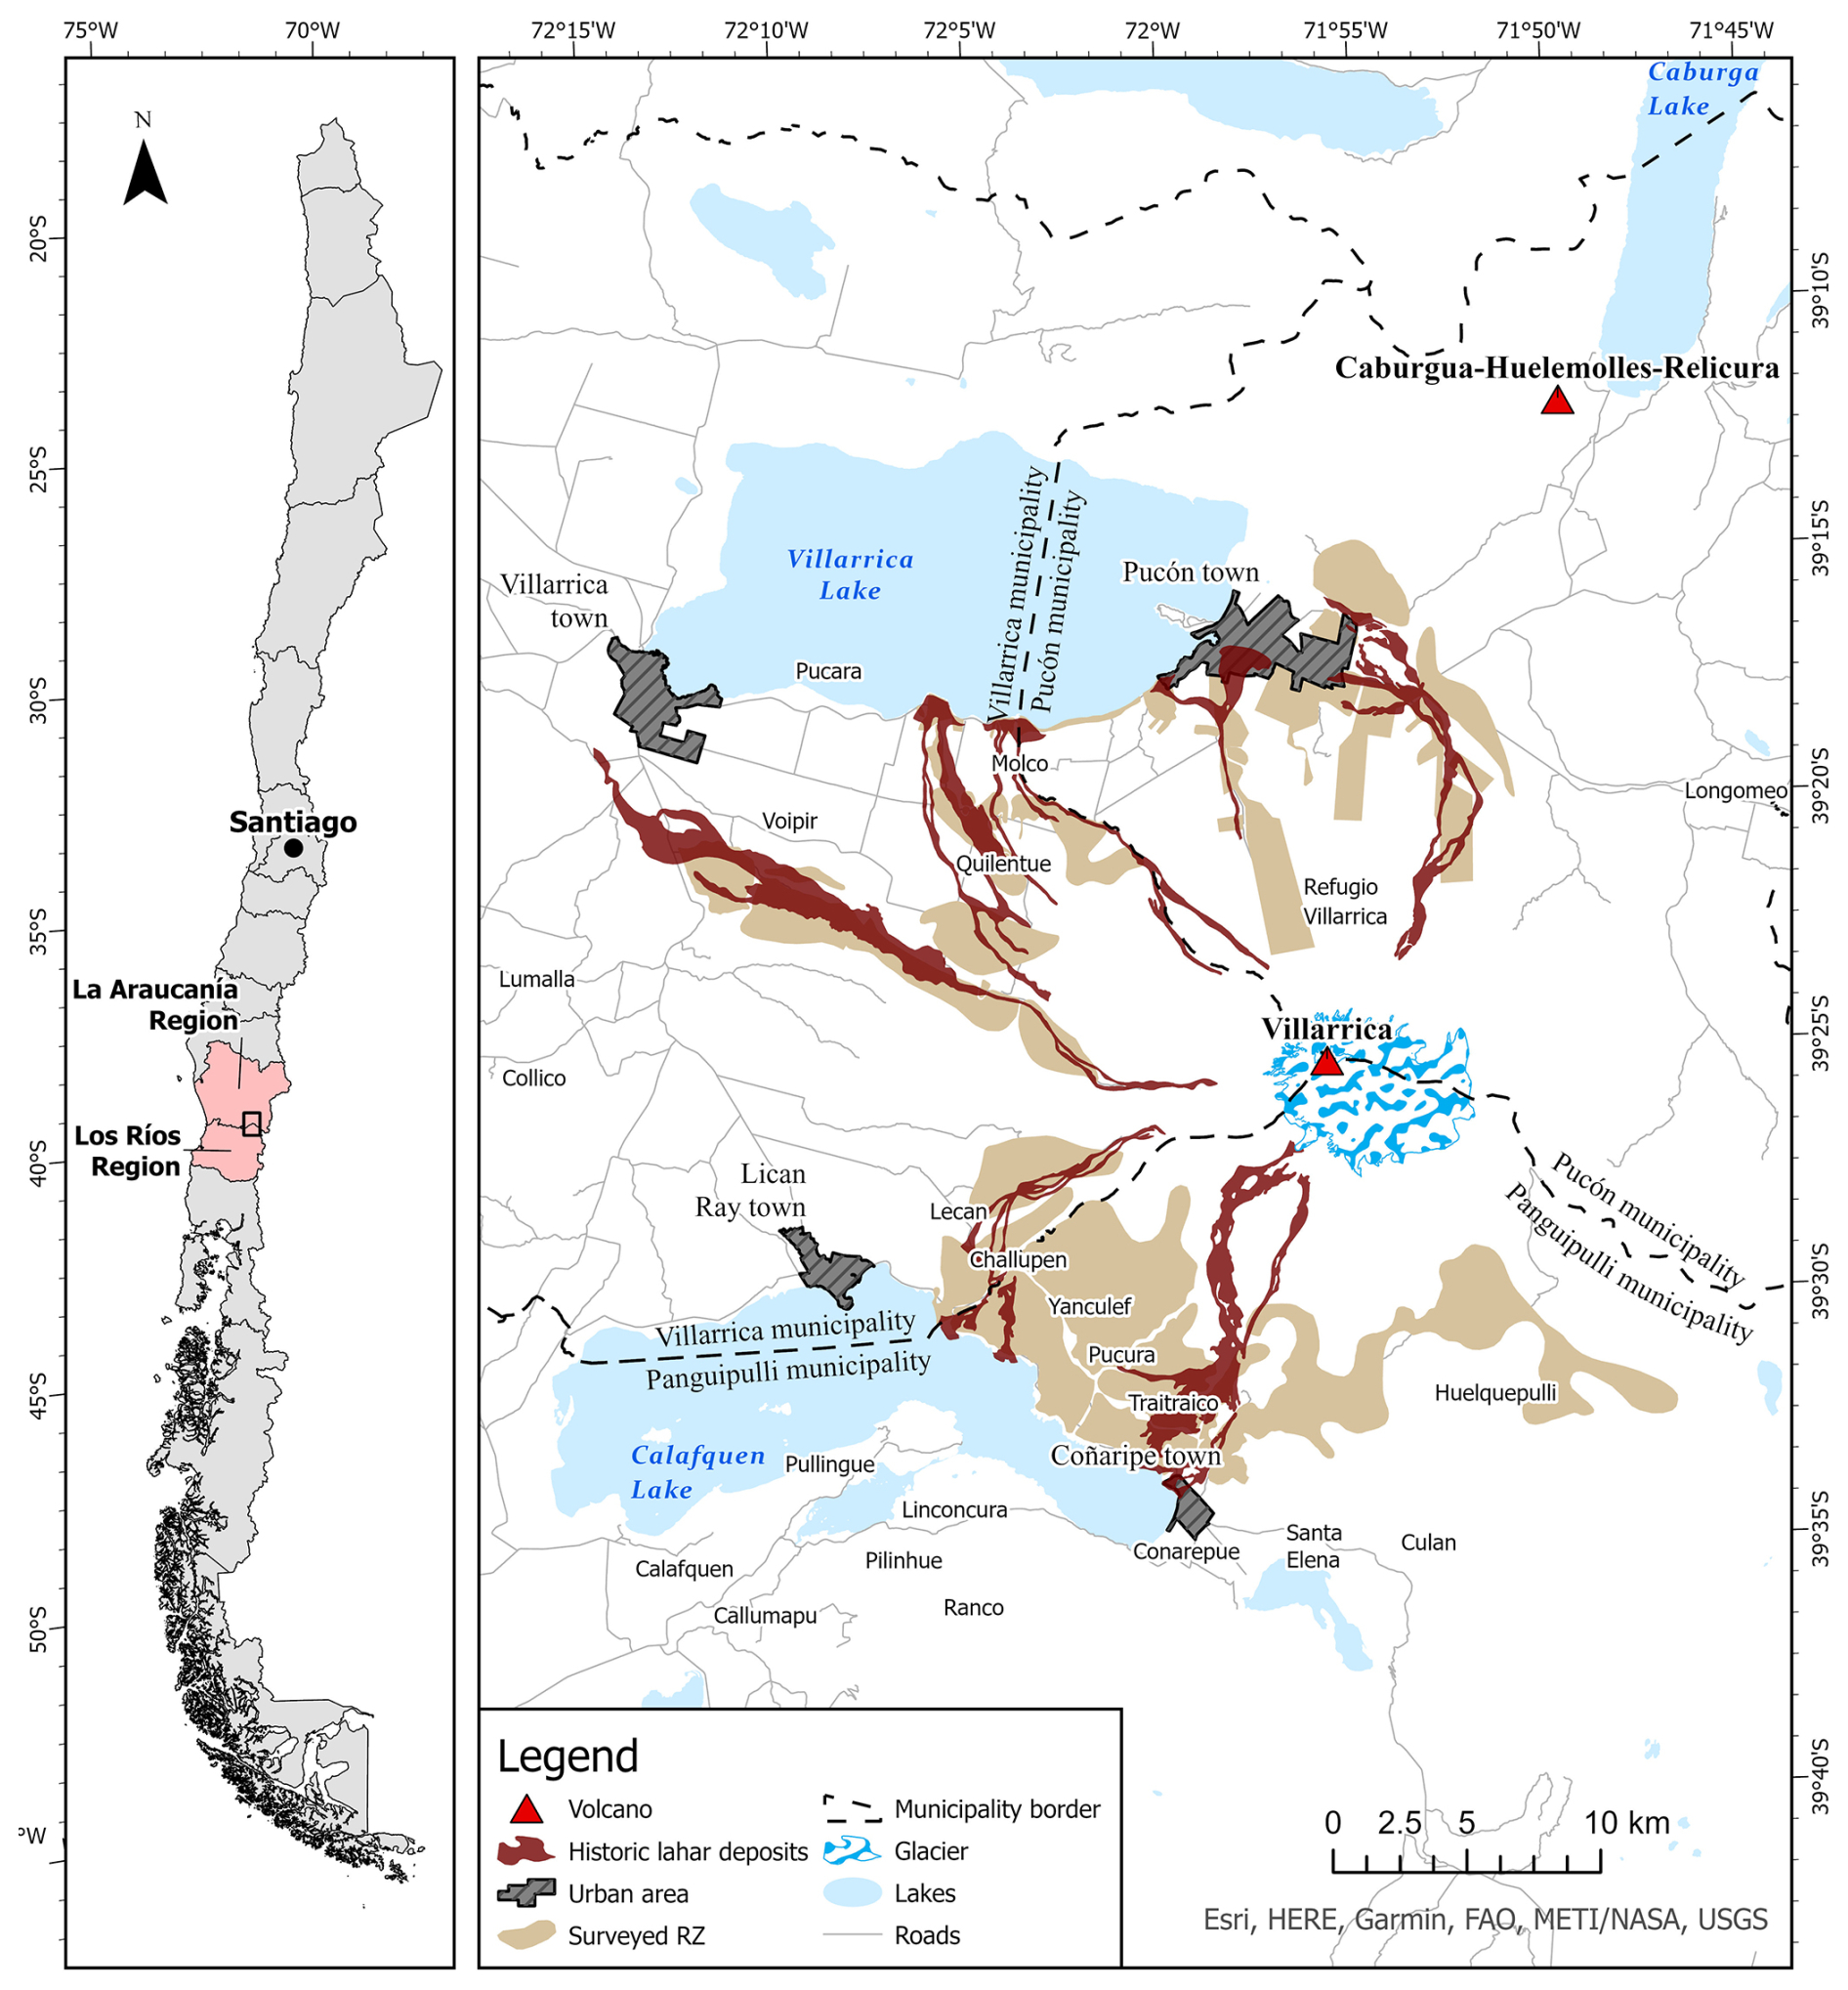
Figure 1Villarrica volcano location and exposure of rural zones to historical lahar deposits. Sources: Esri, HERE, Garmin, FAO, METI/NASA, USGS | Powered by Esri.
1.3 Historical volcanic activity from Villarrica volcano
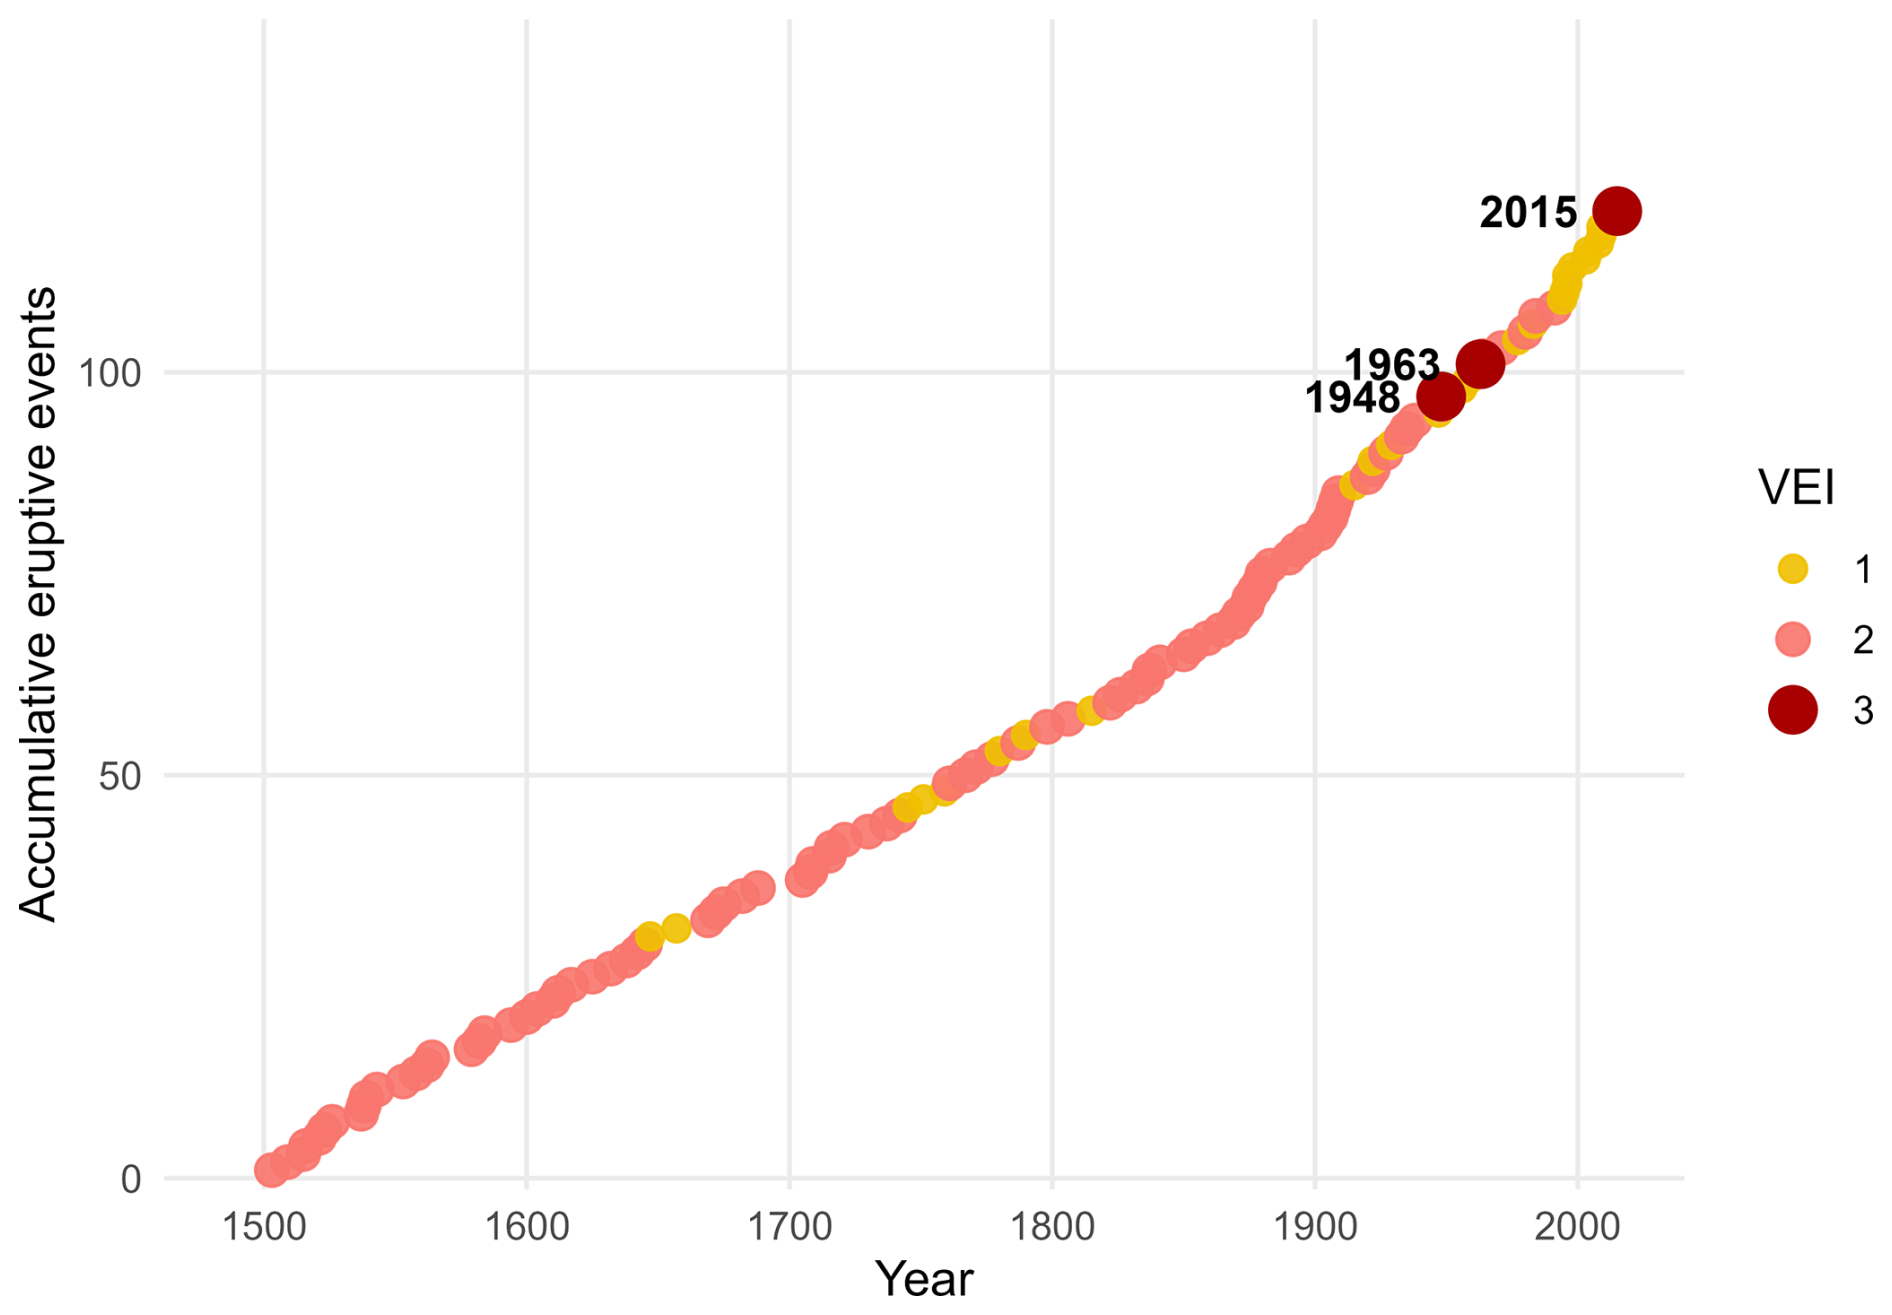
About 160 eruptions have been recorded at Villarrica Volcano over the past 2000 years, with approximately 130 occurring during the last 500 years (Fig. 2; GVP, 2025). Most of these events were effusive eruptions with a Volcanic Explosivity Index (VEI) of 2 (Dzierma and Wehrmann, 2010; Sepúlveda, 2004; GVP, 2025). At least one eruption with a VEI greater than 2 is estimated to occur approximately every 22 years (Van Daele, 2014). Villarrica has also demonstrated the potential for VEI 3 eruptions, such as those in 1948, 1963, and 2015, and for VEI 4 eruptions, such as those inferred for 670 CE and 1230 CE (GVP, 2025). Most eruptions have exhibited Hawaiian to Strombolian eruptive styles, with associated hazards including lahars, lava flows, tephra fallout, and small-volume pyroclastic flows (Sepúlveda, 2004; Moreno and Clavero, 2006). The most significant eruptions resulting in casualties occurred in 1948, 1949, 1963, and 1971, with a cumulative death toll of approximately 60 people, all due to lahar impacts (Sepúlveda, 2004; Moreno, 2006). The VEI 3 eruption of March 2015 involved powerful lava fountains, pyroclastic density currents near the vent, and lahars, prompting preventive evacuations (Romero et al., 2023). Although no severe impacts were recorded, subsequent studies highlighted mental health effects among emergency response volunteers, emphasizing the need for psychosocial interventions during and after volcanic crises (Espinoza et al., 2019). Following the 2015 eruption, Villarrica has remained intermittently active, with periods of elevated unrest and a prolonged yellow alert status between 2022 and 2024, highlighting the persistence of volcanic hazard in the area and reinforcing the relevance of ongoing preparedness and volcanic risk perception among exposed populations (Romero et al., 2023; GVP, 2025).
The Psychometric Paradigm guides the development and implementation of a VRP questionnaire, structured into thematic groups of questions to estimate selected VRP factors (Sect. 2.1). While psychometric approaches often rely on multi-point Likert-type scales, this study applies a simplified scoring strategy adapted to field-based surveys in highly exposed volcanic settings, as described below. In this case study, a k-means calculation is applied to surveyed answers from completed questionnaires to create a five-tier index scale based on their resulting k-means scores, representing relative volcanic risk perception levels. This approach allows for a detailed statistical analysis of the variance associated with selected risk perception factors by analyzing the k-means scores of calculated cluster centroids (Sect. 2.2). Furthermore, the cultural, social, and economic characteristics of the sample are grouped and analyzed to assess how their relative VRP is distributed, providing insights into the influence of these characteristics on risk perception (Sect. 2.3).
2.1 Questionnaire design and application
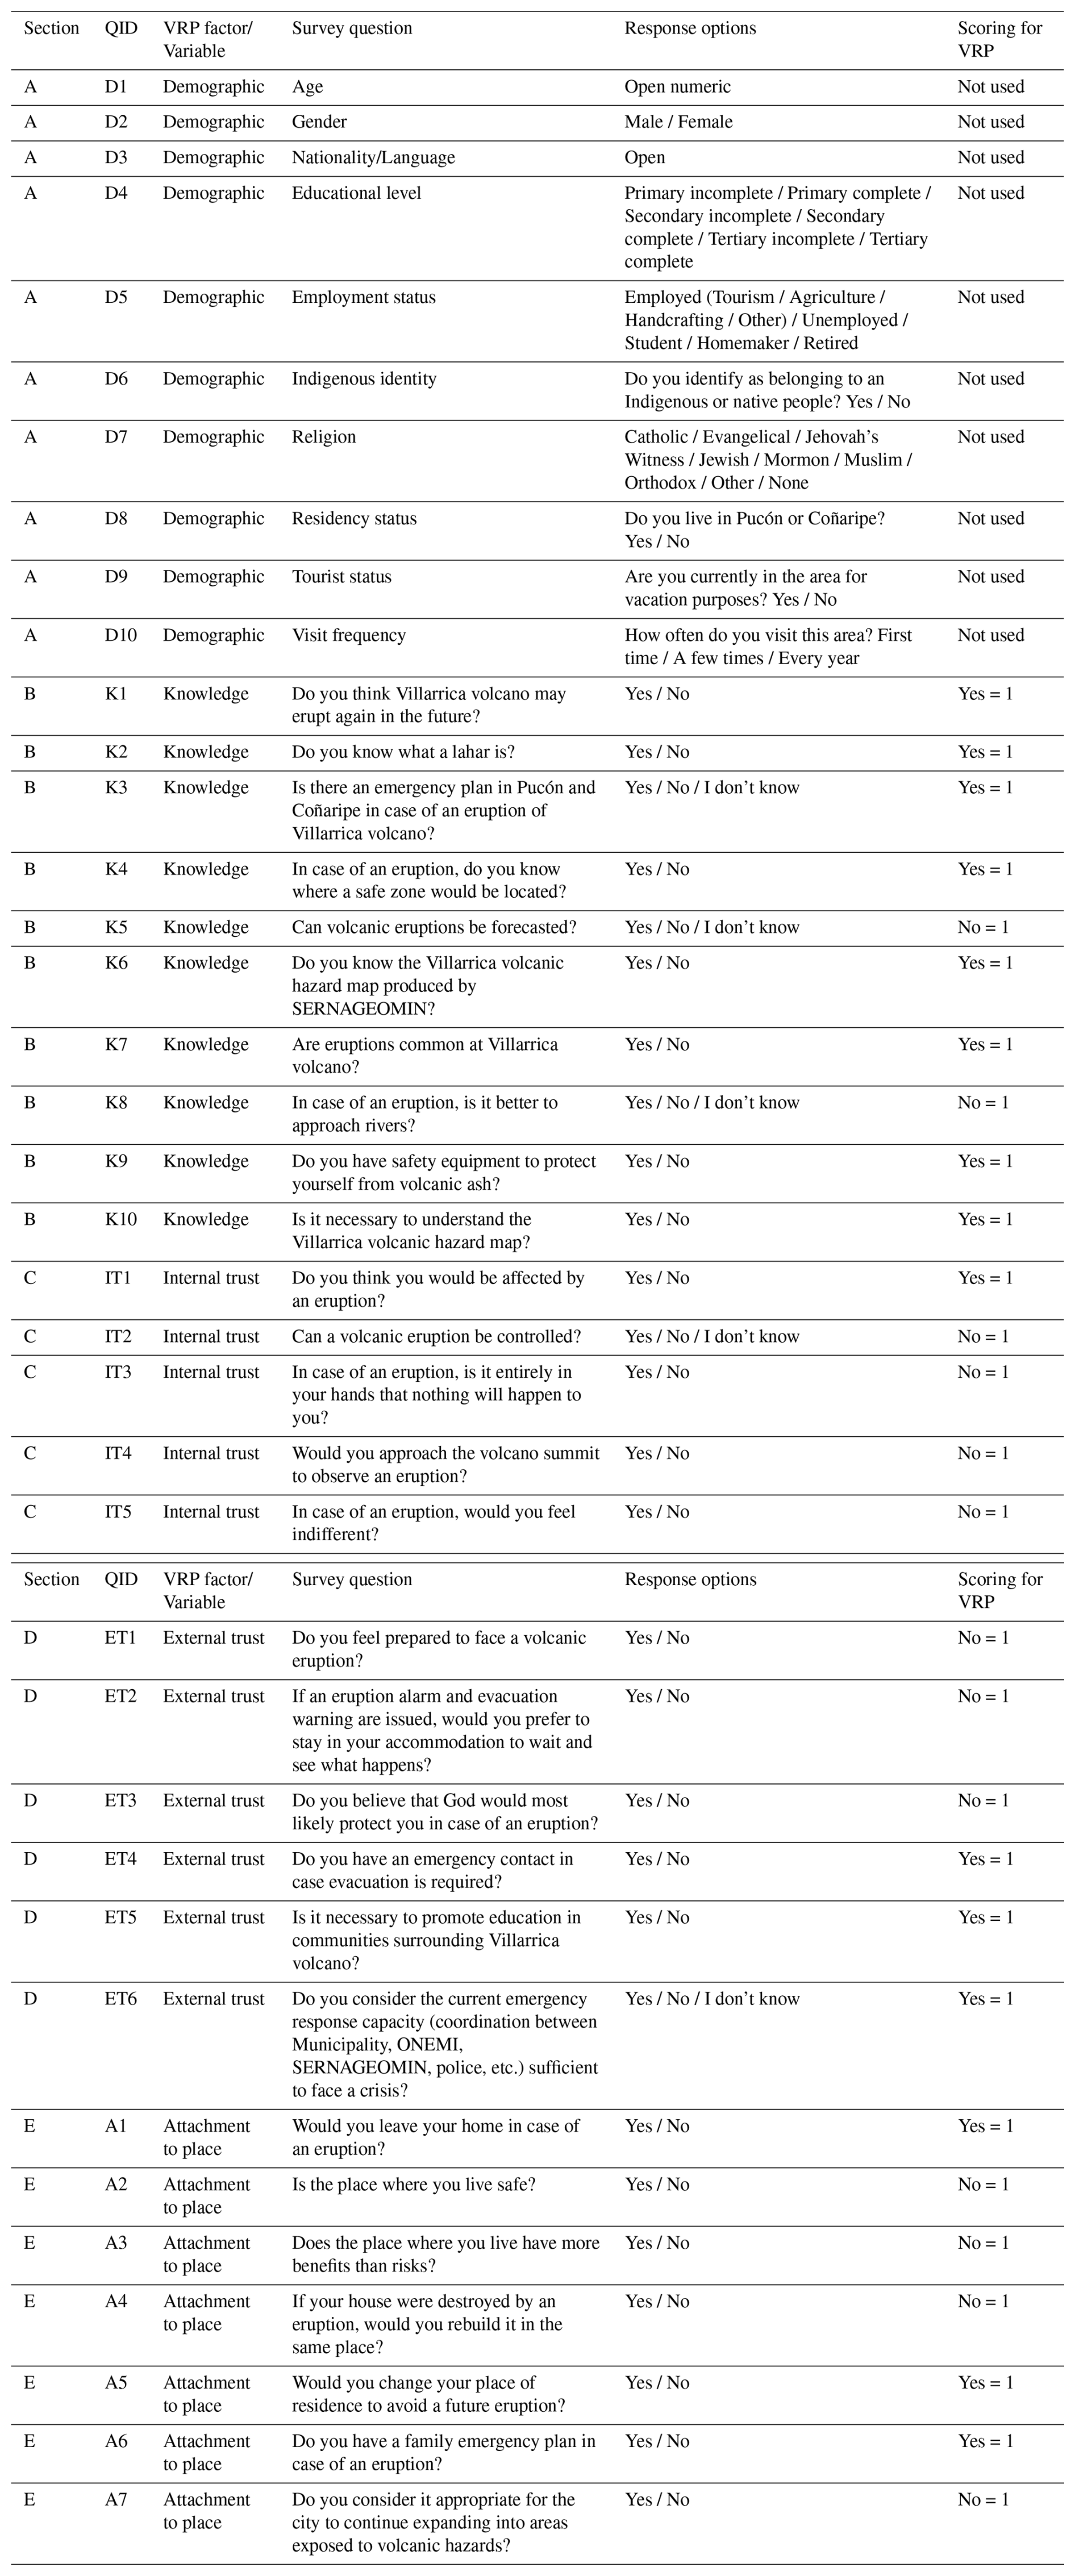
We designed a survey consisting of twenty-eight questions addressing various aspects of risk perception and individuals' attitudes toward volcanic emergencies. The questionnaire design follows the psychometric paradigm introduced in Sect. 1.1, operationalized through closed-ended questions suitable for rapid application during field campaigns. Instead of applying multi-point Likert scales, responses were collected using binary (yes/no) and multiple-choice formats. This approach was selected to reduce ambiguity, facilitate comprehension across diverse social and educational backgrounds, and ensure consistency during in situ data collection. For the VRP analysis, responses were recoded into dichotomous scores. A response consistent with a theoretically favourable VRP condition was assigned a value of one (1), while other responses were assigned a value of zero (0). The complete set of survey questions, their wording, associated VRP factors, and scoring criteria are presented in Table 1.
Table 1Survey questions, associated VRP factors, response options, and scoring criteria.
We considered the proximal volcanic hazard of lahars only. This is because lahar flows have been the most impactful volcanic process from Villarrica eruptions. While we do not neglect the potential occurrence of ashfall impacts, we consider lahars more relevant for the application of VRP surveys among populations highly exposed to locally known and experienced volcanic hazards. The selected risk perception factors included knowledge, internal trust, external trust, and attachment to the place, which have been widely studied in volcanology (Sect. 1). The survey questionnaire also included questions to determine cultural groups (Sect. 2.3). The survey was administered during two fieldwork campaigns conducted by the Chilean National Geological and Mining Service (SERNAGEOMIN) personnel. The first campaign, in 2016, targeted 19 census zones of rural areas, while the second, in 2017, focused on the two primary urban areas at risk: Pucón and Coñaripe. In this study, the summit of Villarrica Volcano marks the tripartite political-administrative boundary between the districts of Villarrica, Pucón, and Panguipulli in Chile (Fig. 3). The distinction between districts in the VRP results is crucial for supporting emergency management, as volcanic emergency plans in Chile, as in many other regions, are designed at the district level. Efforts were made to represent the sparsely populated rural areas of all exposed districts as accurately as possible. However, some higher valley areas near the volcano's summit were inaccessible due to road closures and poor weather conditions.
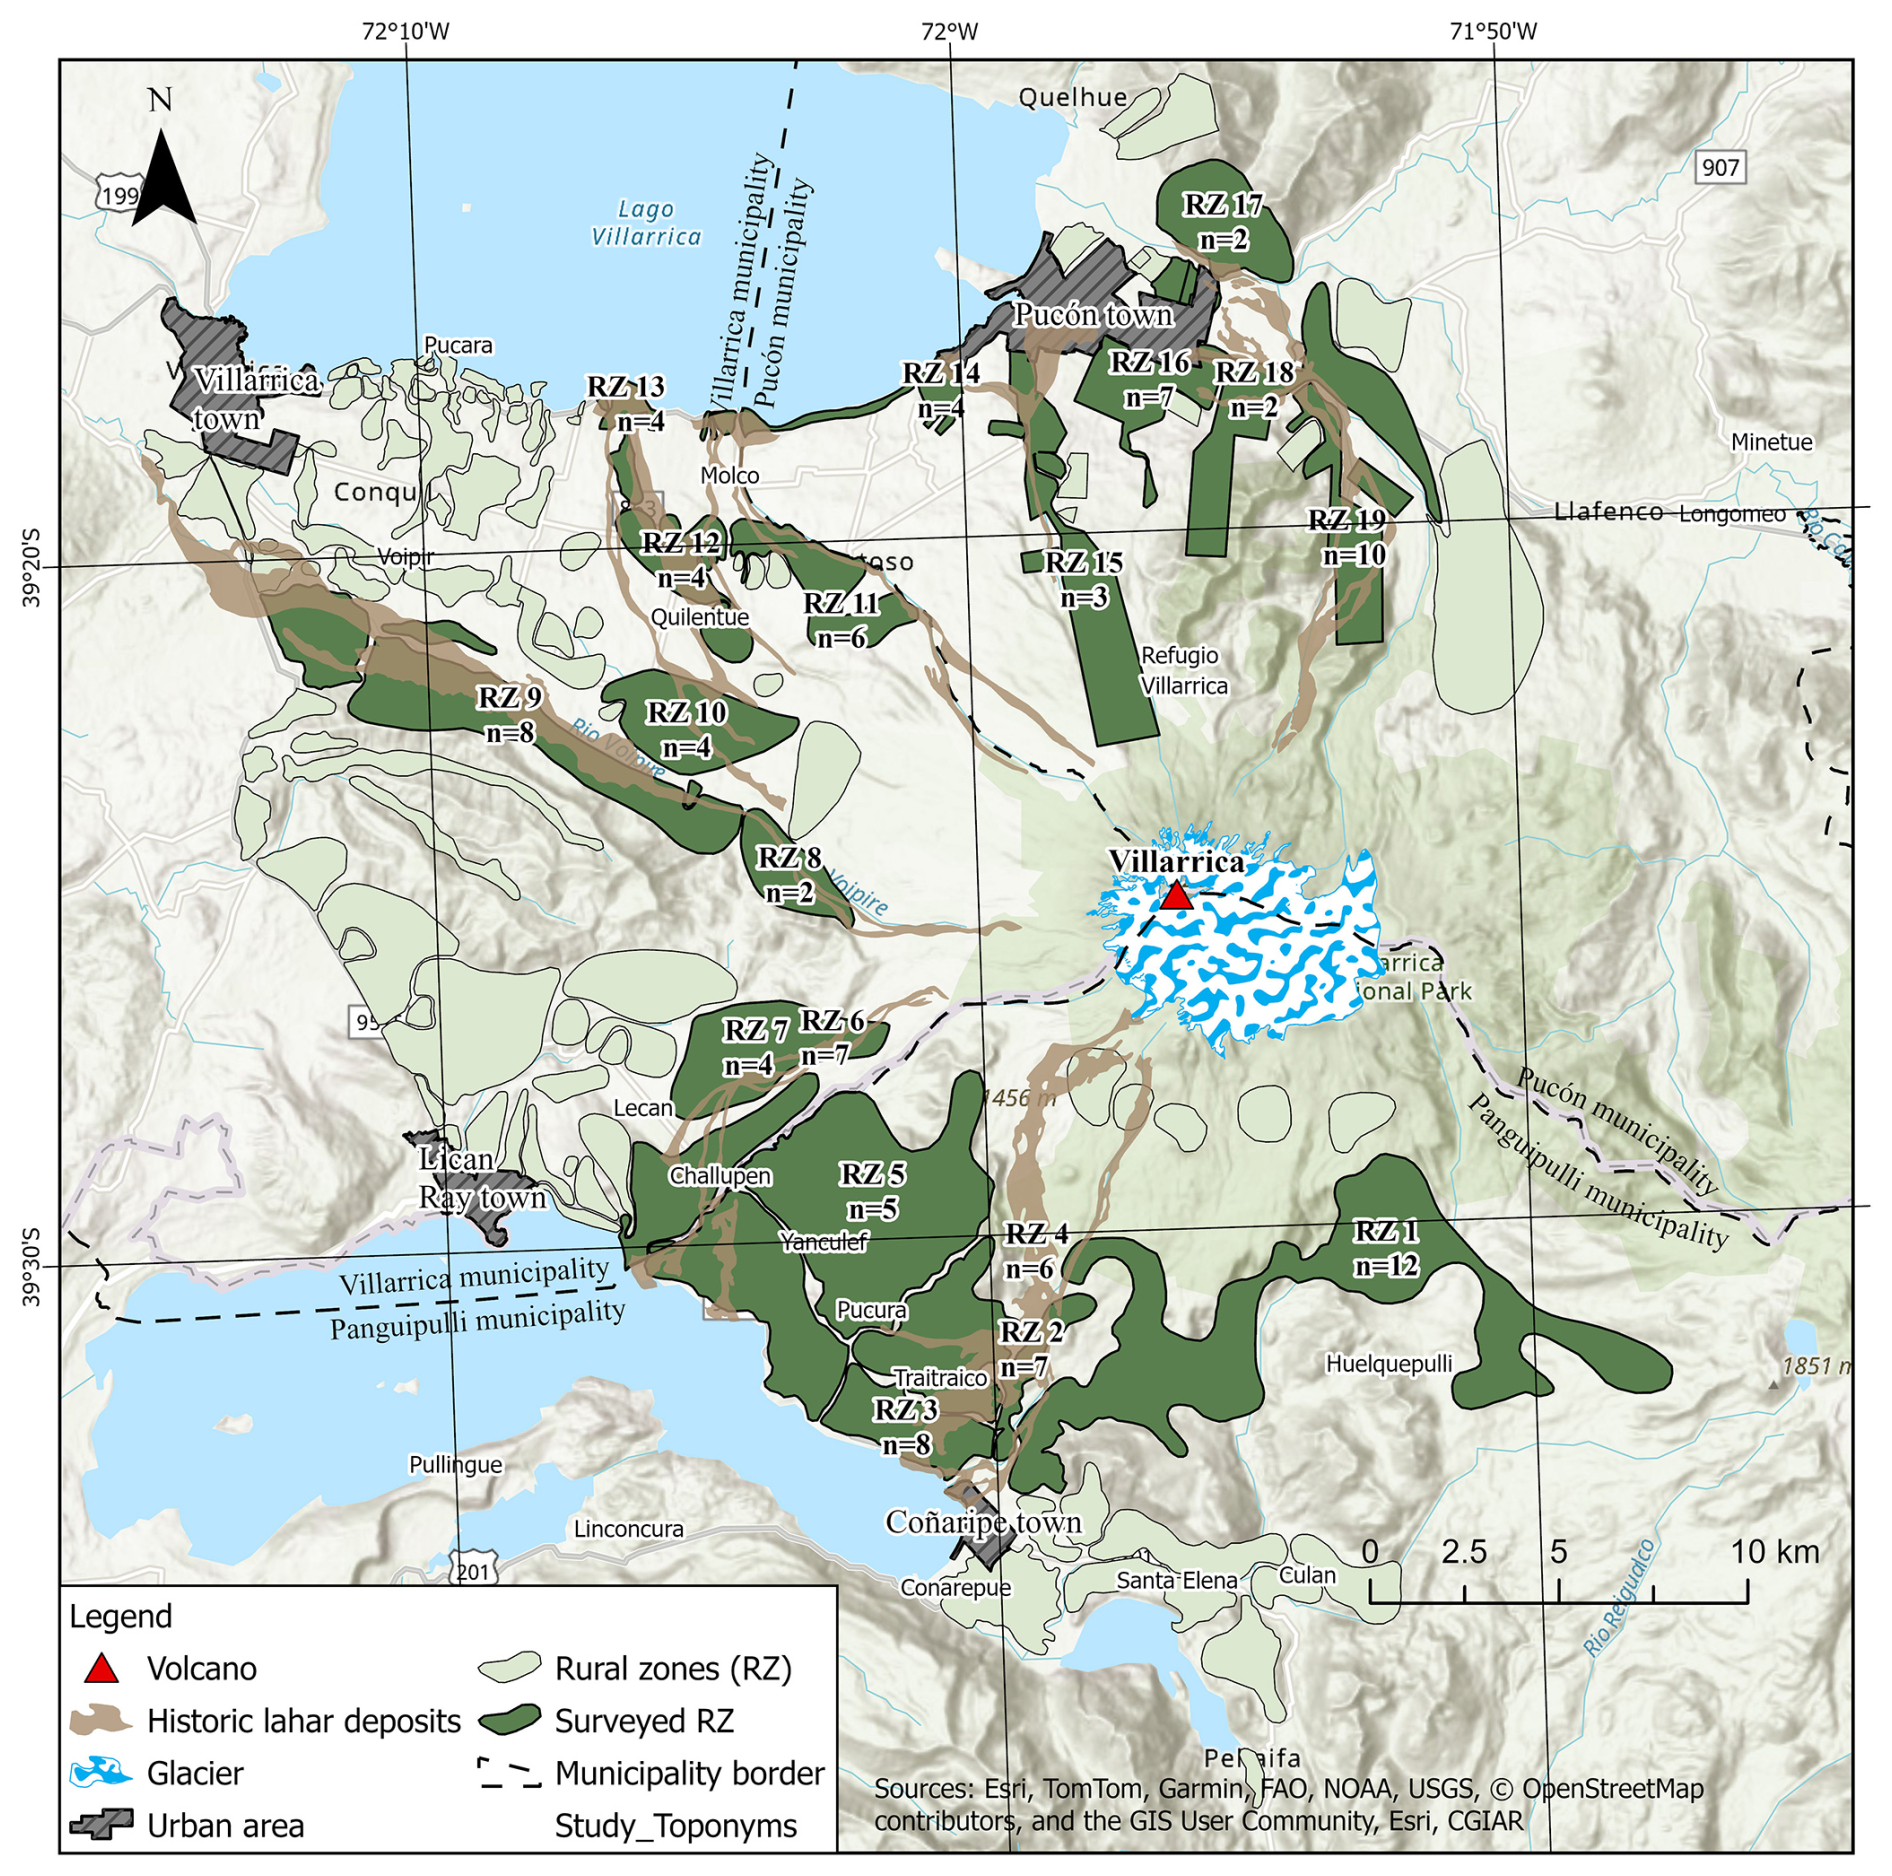
Figure 3Rural areas zones for questionnaire application. RZ denotes rural zones defined for this study and identified with a unique numerical code. Sources: Esri, TomTom, Garmin, FAO, NOAA, USGS, © OpenStreetMap contributors, and the GIS User Community | Powered by Esri.
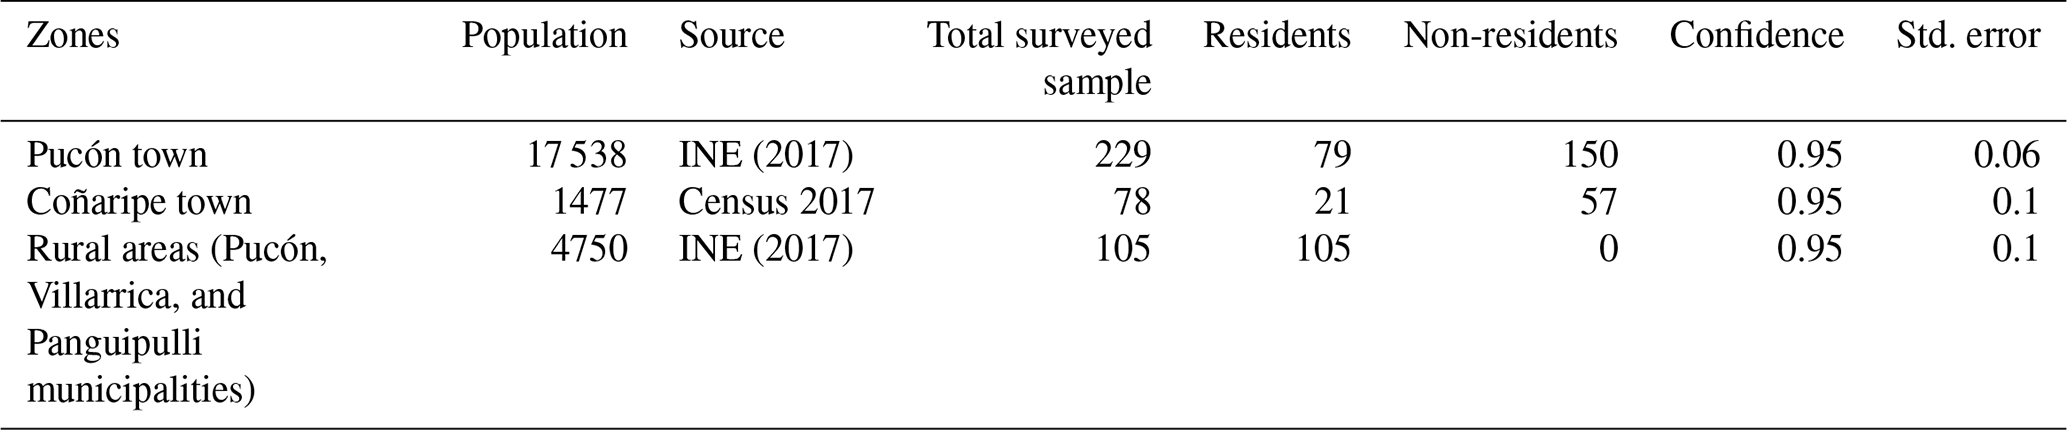
A total of 412 questionnaires were completed, with the sample geographically distributed in proportion to the population based on the available census data at the time (Table 2). Non-resident transient populations were surveyed in urban localities, and responses related to attachment to the place were considered methodologically irrelevant for non-resident respondents and therefore excluded from the analysis. This resulted in two distinct data groups: residents (n=205), who responded to all four selected VRP factors, and non-residents (n=207), for whom attachment to the place was not considered. VRP calculations were applied independently to each group. Most questionnaires were collected in the urban locality of Pucón (229), where more than half of the respondents (150) corresponded to non-resident transient populations. In the urban locality of Coñaripe, 78 questionnaires were completed, with non-residents also representing the majority of respondents (57). In rural areas, only residents (105) were surveyed, through direct household interviews in sparsely populated zones located within the municipalities of Pucón, Villarrica, and Panguipulli (Fig. 3). All samples were calculated with a 95 % confidence level and a standard error of less than or equal to 0.1, representing the target population based on the available census data used for each zone at the time of survey application (Table 2).
2.2 K-means Clustering analysis and social characterization
Each survey question was assigned a value of one (1) when the response aligned with a theoretically optimal VRP condition (Table 1). A total of 28 survey questions were used to compute the VRP scores, distributed across four factors: knowledge (10 questions), internal trust (5 questions), external trust (6 questions), and attachment to place (7 questions). For the question addressing respondents' expected reaction in the event of an eruption, responses were dichotomized to capture risk awareness rather than emotional intensity: indifference was coded as 0, whereas all other responses indicating concern or affective engagement were coded as 1. Demographic and socio-cultural variables were excluded from the VRP score calculation and used exclusively for sample characterization and subgroup analyses. For non-resident respondents, attachment-to-place questions were omitted, and VRP scores were computed using the remaining 21 questions. Each factor score was calculated as the average of its associated questions. To ensure comparability across dimensions and avoid scale-related bias, factor scores were standardized using z-scores before clustering. The standardized scores were subsequently classified into five clusters using a k-means analysis (Eq. 1). The selection of five clusters was guided by the objective of producing an interpretable ordinal VRP scale (very high, high, moderate, low, and very low), consistent with classifications commonly used in risk perception and disaster risk studies. Raw factor scores, standardized z-scores, and final VRP level classifications for all respondents are provided in the Supplement (Table S2).
Table 2Sample size, residency status, and confidence levels of the surveyed population by zone.
Cluster centroids represent the relative position of respondents within the multidimensional factor space, defined as the mean standardized scores of all factors for each VRP level. Clusters were ordered according to their centroid scores, from higher to lower values, and interpreted as very high, high, moderate, low, and very low VRP levels. The resulting classification reflects relative VRP conditions within the analyzed sample, where higher centroid scores indicate more favourable VRP conditions based on current disaster risk science understanding. Cluster centroids represent the mean position of each group in the multidimensional standardized factor space used in the k-means clustering procedure. Consequently, when projected onto a single factor, centroid values do not necessarily coincide with the median of the univariate score distributions shown in the boxplots. This difference reflects within-cluster heterogeneity, distributional asymmetry, and the fact that clustering is performed simultaneously across all factors rather than independently for each dimension. Therefore, centroid positions should be interpreted as reference values summarizing the relative contribution of each factor to the overall VRP classification, rather than as measures of central tendency within the individual score distributions. Cluster centroids for each VRP level are reported in the Supplement (Table S1).
Where J is the sum of squared Euclidean distances minimized by the k-means algorithm, zi is the vector of standardized (z-score) VRP factor scores for the case i, cj is the centroid (mean vector) of cluster j in the standardized factor space, Cj is the set of cases assigned to cluster j, and k is the number of clusters.
2.3 Cultural groups analysis
In this research, the primary classification of cultural groups distinguishes between two main population samples: residents and non-residents. This distinction is important for understanding relative influences on VRP, as non-residents or transient visitors are generally believed to have lower awareness levels due to limited knowledge of local volcanic emergency plans, lack of preparedness, and a greater tendency to approach volcanic summits (Wulan Mei et al., 2020; Bird et al., 2010; Nomura et al., 2004). Unlike rural areas, where only permanent residents were surveyed, urban areas such as Pucón and Coñaripe included both residents and transient populations (Figs. 4 and 5). This classification also incorporates social variables commonly used in risk assessments of individuals and communities exposed to volcanic activity. The selected variables include age, educational level, gender, native identity, religion, language, occupation, and economic activity, with classifications and known vulnerable groups described below.
2.3.1 Age
Age groups are classified as young adults (18–40 years), adults (41–65 years), and the elderly (over 65 years). Children, a recognized vulnerable group during emergencies (Cutter, 2017), were excluded from this research due to ethical concerns regarding the sensitive nature of risk perception studies involving minors. In addition to children, the elderly population is considered more vulnerable during emergencies due to their relatively reduced mobility and reaction capacity. However, some studies have found little correlation between age and risk perception (e.g., Barberi et al., 2008).
2.3.2 Educational level
Educational level is categorized into three groups: primary, secondary, and tertiary education, regardless of whether respondents completed them. Some studies, such as Ricci et al. (2013) and Njome et al. (2010), have found a negative correlation between educational level and trust in authorities, suggesting that highly educated individuals may be more reluctant to follow official instructions during emergencies. Conversely, lower educational levels tend to be associated with reduced self-preparedness and lower engagement with official preparedness measures in the context of volcanic emergencies (Ricci et al., 2013).
2.3.3 Gender
Gender is classified as male and female. This study does not inquire about gender identity, including LGBTQ+ groups, as it remains a sensitive and evolving topic beyond the scope of this research. Women are recognized as a highly vulnerable group in the context of natural hazards due to persistent social inequalities, which in turn increase the vulnerability of children (Cutter, 2017). In the volcanic risk literature, women tend to be more aware of and concerned about volcanic hazards, whereas men are generally considered to exhibit higher levels of self-protection when facing the consequences of volcanic emergencies (Barberi et al., 2008; Eiser et al., 2015).
2.3.4 Native identity and professed religion
Native identity is classified into two categories: native and non-native. Professed religion is categorized based on the most prevalent religions in Chile: Catholic (59 %), Evangelism (19 %), and other (17 %) (CPPUC, 2017). Cultural beliefs, including strong native identity and religious faith, can influence self-efficacy in responding to volcanic emergencies. For instance, some individuals may choose not to evacuate during an eruption, instead of waiting for a spiritual warning or divine communication (Wantim et al., 2024; Barclay et al., 2015; Njome et al., 2010). However, these beliefs and identities can also foster strong social networks and a sense of community, which may aid in effectively communicating volcanic risk information (Barclay et al., 2015; Chester et al., 2008). Additionally, they can contribute positively to socio-ecological system relationships (Salazar and Jalabert, 2016).
2.3.5 Nationality and language
The sample is classified by nationality and language into three groups: Chilean, Hispanic American, and non-Spanish speakers. Cultural and language barriers are widely recognized as major challenges in understanding local risks and emergency plans (Ogie et al., 2018; O'Brien et al., 2018; Teo et al., 2019). In the context of volcanic risk, temporary workers often have lower adaptive capacity due to weaker social networks, differing cultural beliefs, and reduced trust in local volcanic warning systems (Thouret et al., 2022).
2.3.6 Occupation
Occupation is classified into four categories: employed, unemployed, student, and stay-at-home or retired. Employment status can influence VRP, as employed individuals may receive emergency preparedness information through workplace programs, whereas unemployed individuals may face additional financial challenges that could impact their ability to respond to emergencies. Students and young educated individuals often have greater access to risk-related knowledge through educational programs and technology, such as the Internet, which can enhance their understanding of hazards and emergency plans (Chester et al., 2008). In contrast, stay-at-home and retired individuals may have limited access to such information, making them potentially more vulnerable during volcanic emergencies.
2.3.7 Economic activity
The surveyed employed population is categorized into four economic activities: tourism, agriculture, handcrafting, and others. Tourism is particularly sensitive in volcanic areas, as landscapes attract visitors who often lack hazard knowledge and preparedness. Similar trends have been observed among tourism employees, who may have a limited understanding of early warning systems (Bird et al., 2010). Agriculture is highly vulnerable to volcanic eruptions due to widespread ashfall, which can significantly impact farmers, crops, and livestock (Bonadonna et al., 2021). Handcrafting is also affected, as eruptions lead to a decline in tourism, reducing the number of potential customers.
The following sections present the results of the K-means calculations for residents and non-residents exposed to proximal volcanic activity from Villarrica volcano, including the resulting VRP levels, their geographical distribution, the statistical distribution of the evaluated VRP factors, and the socio-cultural characterization of the sample based on the assigned VRP levels. All VRP levels discussed below represent relative configurations within each population sample, derived from multivariate clustering, and should be interpreted comparatively rather than as absolute perception thresholds. The results are presented descriptively and are supported by graphical evidence, without inferring statistical significance.
3.1 Results of VRP levels
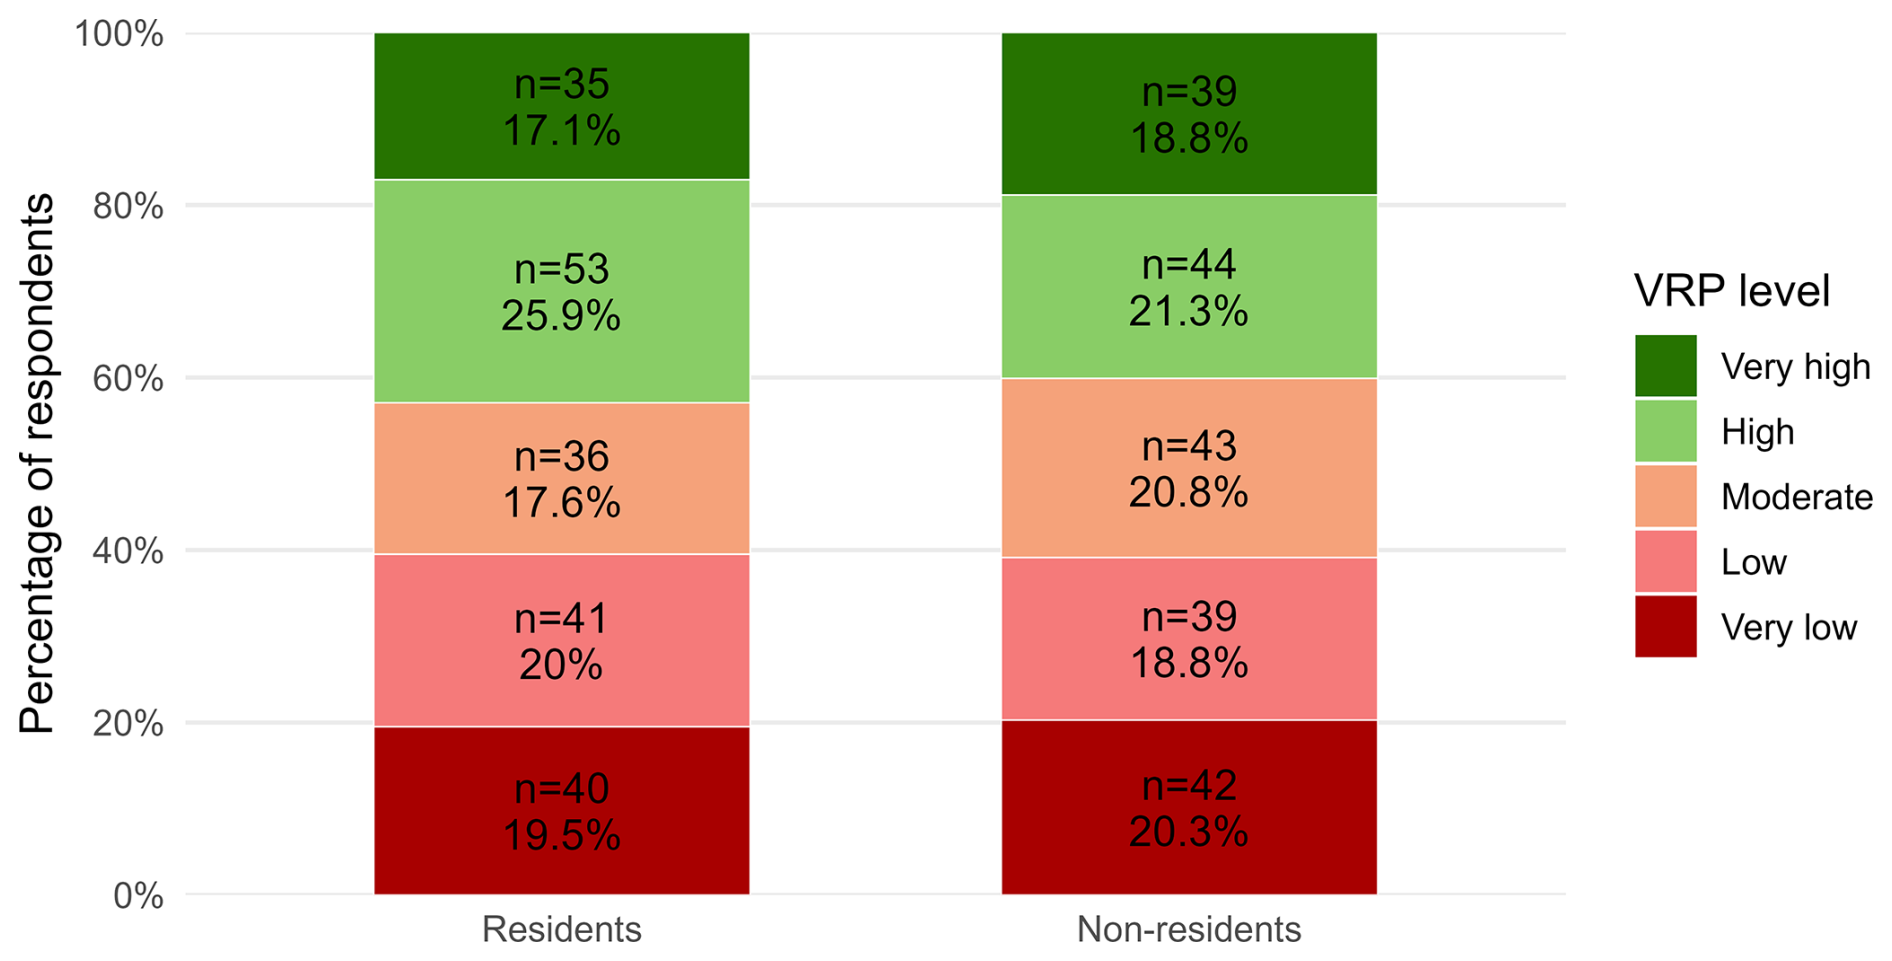
K-means calculations result in a relatively balanced distribution of VRP levels across the 205 resident and 207 non-resident questionnaires, with each VRP category representing approximately 20 % of the sample, as expected given the clustering approach (Fig. 4). Among residents, the highest concentration corresponds to the high VRP level (25.9 %), whereas the lowest proportion is observed in the very high VRP level (17.1 %). Low and very low VRP levels represent 20.0 % and 19.5 % of the resident sample, respectively. Among non-residents, VRP levels are more evenly distributed. Moderate VRP represents the largest group (20.8 %), followed by very low VRP (20.3 %), while very high VRP shows the lowest proportion (18.8 %). Overall, residents tend to display slightly greater variability across VRP levels than non-residents, although both groups exhibit comparable distributions (Fig. 4).
3.2 Geographical distribution of residents' VRP levels
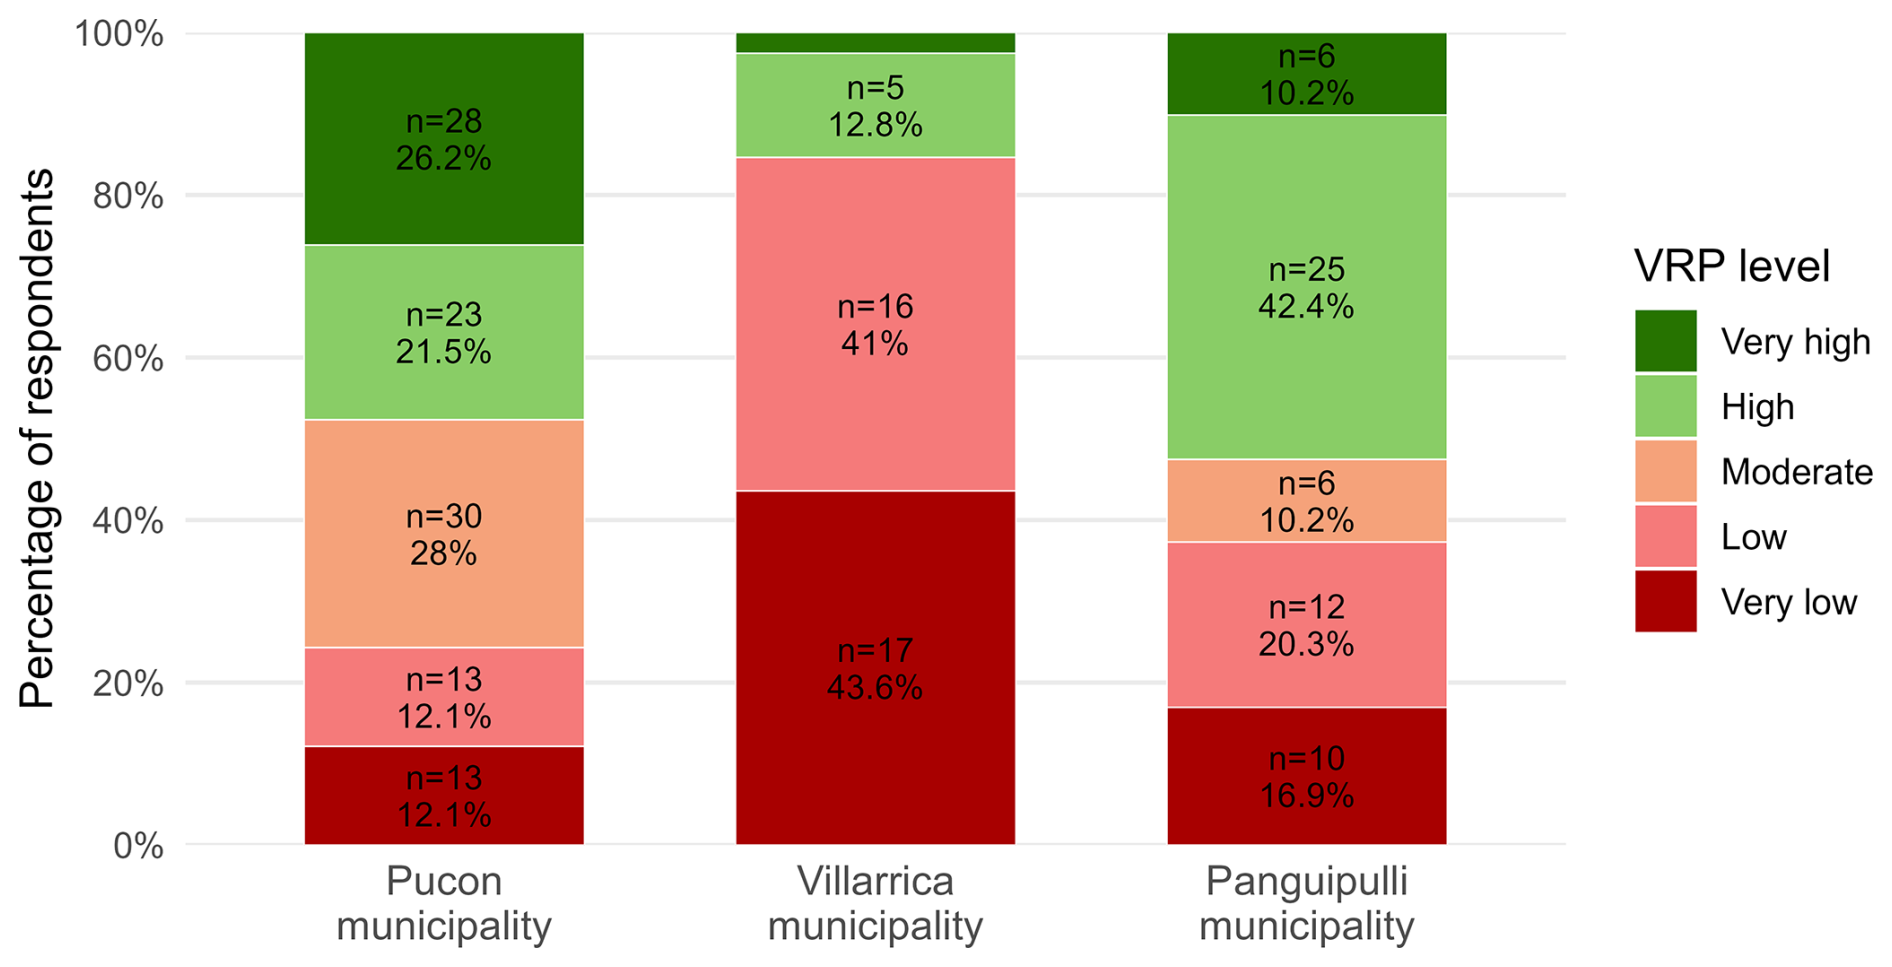
VRP levels vary across districts within the study area. Given the high mobility and transient nature of non-resident populations, their spatial patterns require a separate analytical approach. Therefore, this section focuses exclusively on residents, who exhibit greater spatial stability. In the Pucón district, residents show a predominance of very high (26.2 %), high (21.5 %), and moderate (28.0 %) VRP levels, while low and very low VRP each account for 12.1 % (Fig. 5). In contrast, the Villarrica district concentrates the highest proportions of low (43.6 %) and very low (41.0 %) VRP levels among all districts. High VRP represents 12.1 % of the sample, very high VRP only 2.6 %, and no cases are recorded in the moderate category (Fig. 5). In Panguipulli, high VRP dominates (42.4 %), followed by very low (20.3 %) and low (16.9 %) VRP, while moderate and very high VRP each represent 10.2 % of the sample. Spatially, higher VRP levels are more frequently observed in urban areas, particularly in Pucón town, where very high, high, and moderate VRP levels are more prevalent (Fig. 6). In contrast, rural zones, especially in Villarrica and surrounding districts, concentrate larger proportions of low and very low VRP levels. These patterns suggest that urban contexts are associated with higher VRP among residents, although this interpretation should be considered descriptive rather than causal.
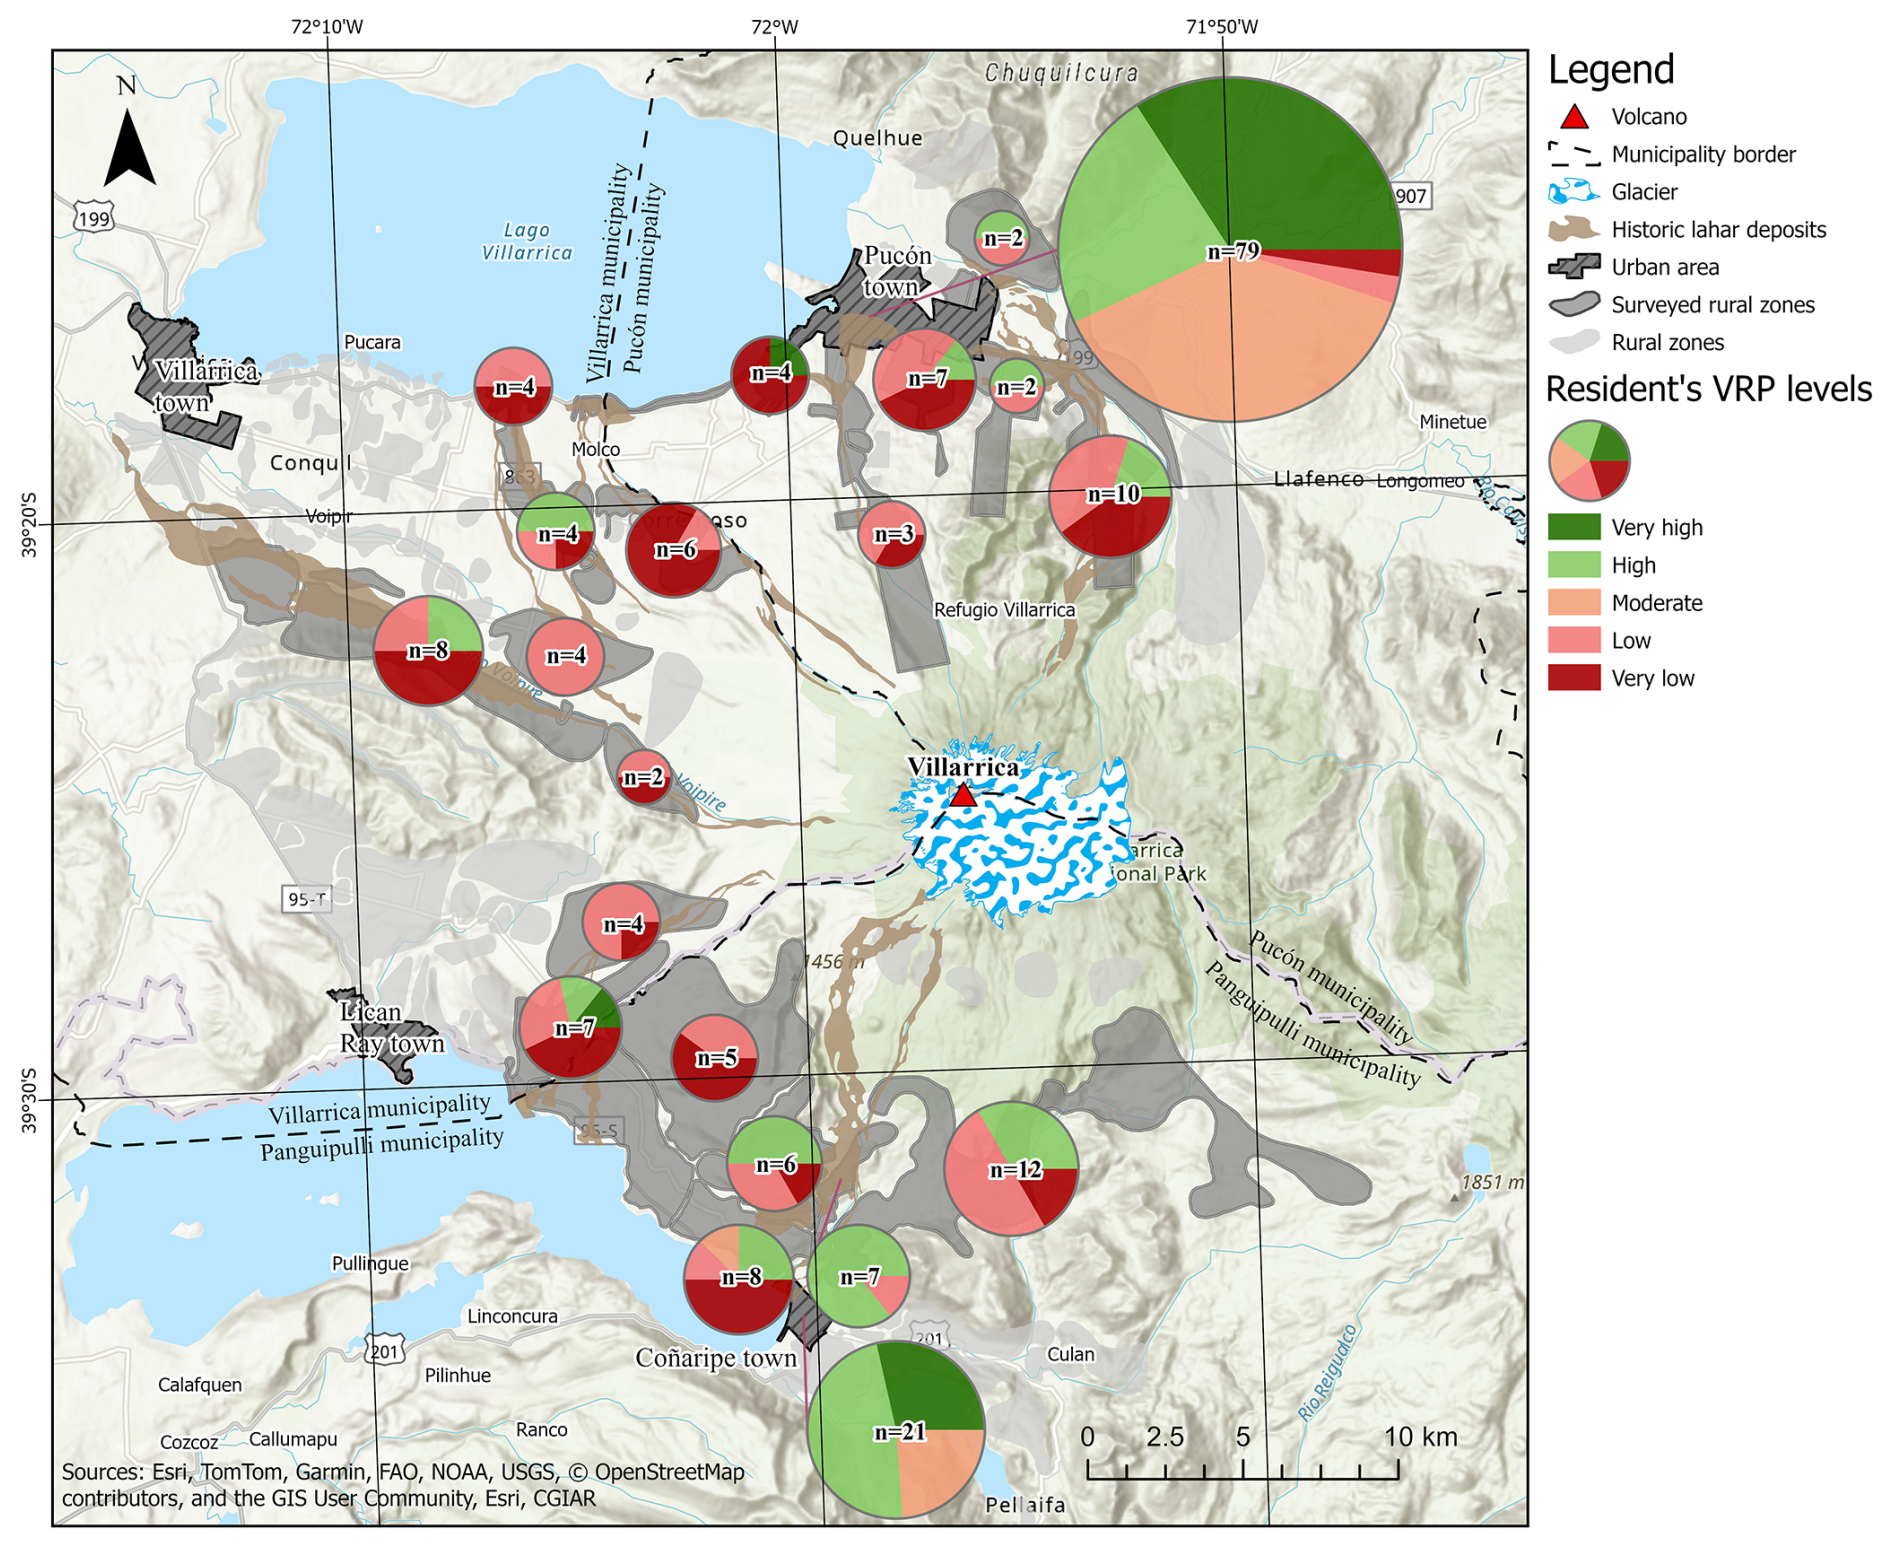
Figure 6Geographical distribution of VRP levels. Pie charts show the relative distribution of VRP levels by zone. Chart sizes provide a visual indication of sample size. Sources: Esri, TomTom, Garmin, FAO, NOAA, USGS, © OpenStreetMap contributors, and the GIS User Community | Powered by Esri.
3.3 Statistical distribution of VRP factors
This psychometric approach using K-means clustering provides insight into how each selected VRP factor contributes to the differentiation of VRP levels. The following sections describe the distribution of standardized factor scores for residents and non-residents, supported by boxplots and cluster centroid values.
3.3.1 VRP factors by residents
Four VRP factors were evaluated for residents: knowledge information, internal trust, external trust, and attachment to place. Among these, knowledge information exhibits the largest variation across VRP levels, as reflected by the separation of cluster centroids (Fig. 7). The very low VRP level shows the lowest centroid value (approximately −0.9 Std. dev.), while the remaining VRP levels range between −0.5 and 0.2 Std. dev. This pattern indicates that residents classified within the very low VRP level tend to report lower knowledge scores relative to other groups. Notably, the relationship between knowledge, information, and VRP is not strictly linear. The high VRP level exhibits knowledge scores comparable to those of the low VRP level, whereas moderate and very high VRP levels display higher centroid values. This non-linear pattern suggests that increasing knowledge does not correspond directly to increasing VRP among residents. This pattern reinforces that knowledge alone does not determine VRP levels but operates in interaction with trust-related and contextual factors within broader perception configurations.
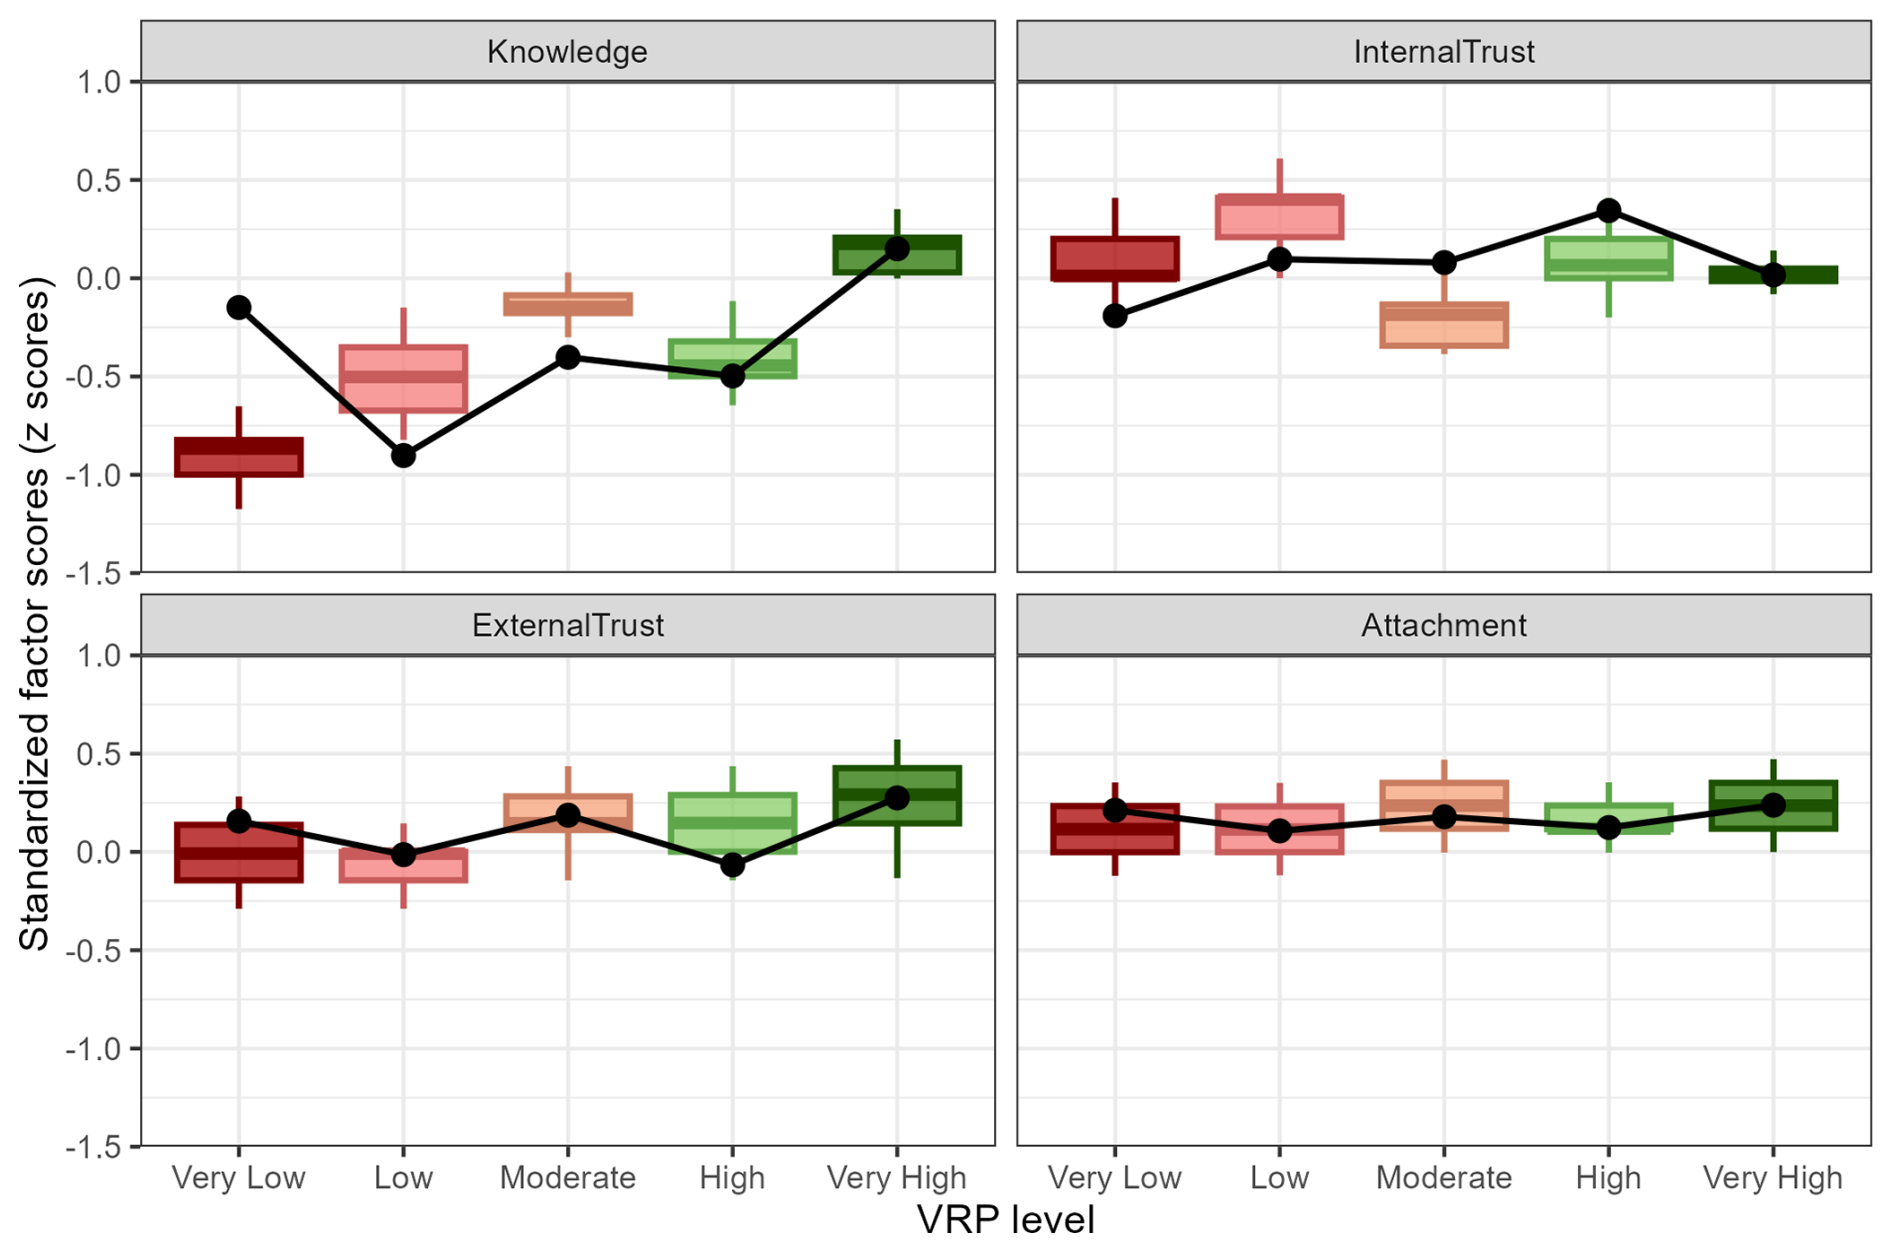
Figure 7Statistical distribution of VRP factors for residents. Boxplots show the distribution of standardized factor scores for each VRP level. Colours indicate VRP levels, ranging from Very Low (dark red) to Very High (dark green). Black points and lines represent cluster centroids, corresponding to the average standardized scores within each VRP level.
Internal trust shows relatively small differences across VRP levels, with substantial overlap in the distributions (Fig. 7). The low VRP level exhibits the highest centroid value (approximately 0.3 Std. dev.), while the moderate VRP level shows the lowest (approximately −0.2 Std. dev.). However, given the limited separation between centroid values and the dispersion observed in the boxplots, internal trust appears to play a secondary role in differentiating VRP levels among residents. External trust exhibits a clearer pattern. Very high, high, and moderate VRP levels show positive centroid values (approximately 0.2–0.3 Std. dev.), whereas low and very low VRP levels cluster around neutral or slightly negative values. This pattern indicates that higher VRP levels among residents are associated with higher external trust, particularly regarding willingness to follow evacuation instructions. Attachment to place shows consistently positive and closely clustered centroid values across all VRP levels (approximately 0.1–0.2 Std. dev.). The limited variation suggests that attachment to place functions as a relatively stable background factor rather than a primary driver of VRP differentiation among residents.
3.3.2 VRP factors by non-residents
For non-residents, three VRP factors were evaluated: knowledge information, internal trust, and external trust. Knowledge information displays higher centroid values for the very high and moderate VRP levels (approaching 2 Std. dev.), while very low, low, and high VRP levels cluster around neutral values (Fig. 8). Although these differences indicate variation across VRP levels, the overall dispersion of knowledge scores is lower than that observed among residents. Internal trust scores among non-residents are consistently low and show limited separation between VRP levels, ranging from approximately −0.3 Std. dev. in the very low VRP level to values close to zero in the high and very high VRP levels. Given the strong overlap among boxplots, internal trust does not appear to strongly differentiate VRP levels in this group. External trust emerges as the most consistent differentiating factor among non-residents. Centroid values increase progressively from lower to higher VRP levels, with the very high VRP level reaching the highest score (approximately 0.3 Std. dev.). This pattern indicates that VRP differentiation among non-residents is primarily structured by variations in external trust. Across all factors, non-residents exhibit narrower boxplots and closer alignment between median and mean values compared to residents, indicating lower within-group heterogeneity. This homogeneity supports the robustness of the VRP classification among non-resident respondents. Overall, while residents' VRP reflects combined variations in knowledge, trust, and attachment to place, non-residents' VRP is more narrowly differentiated, with external trust playing a dominant role.
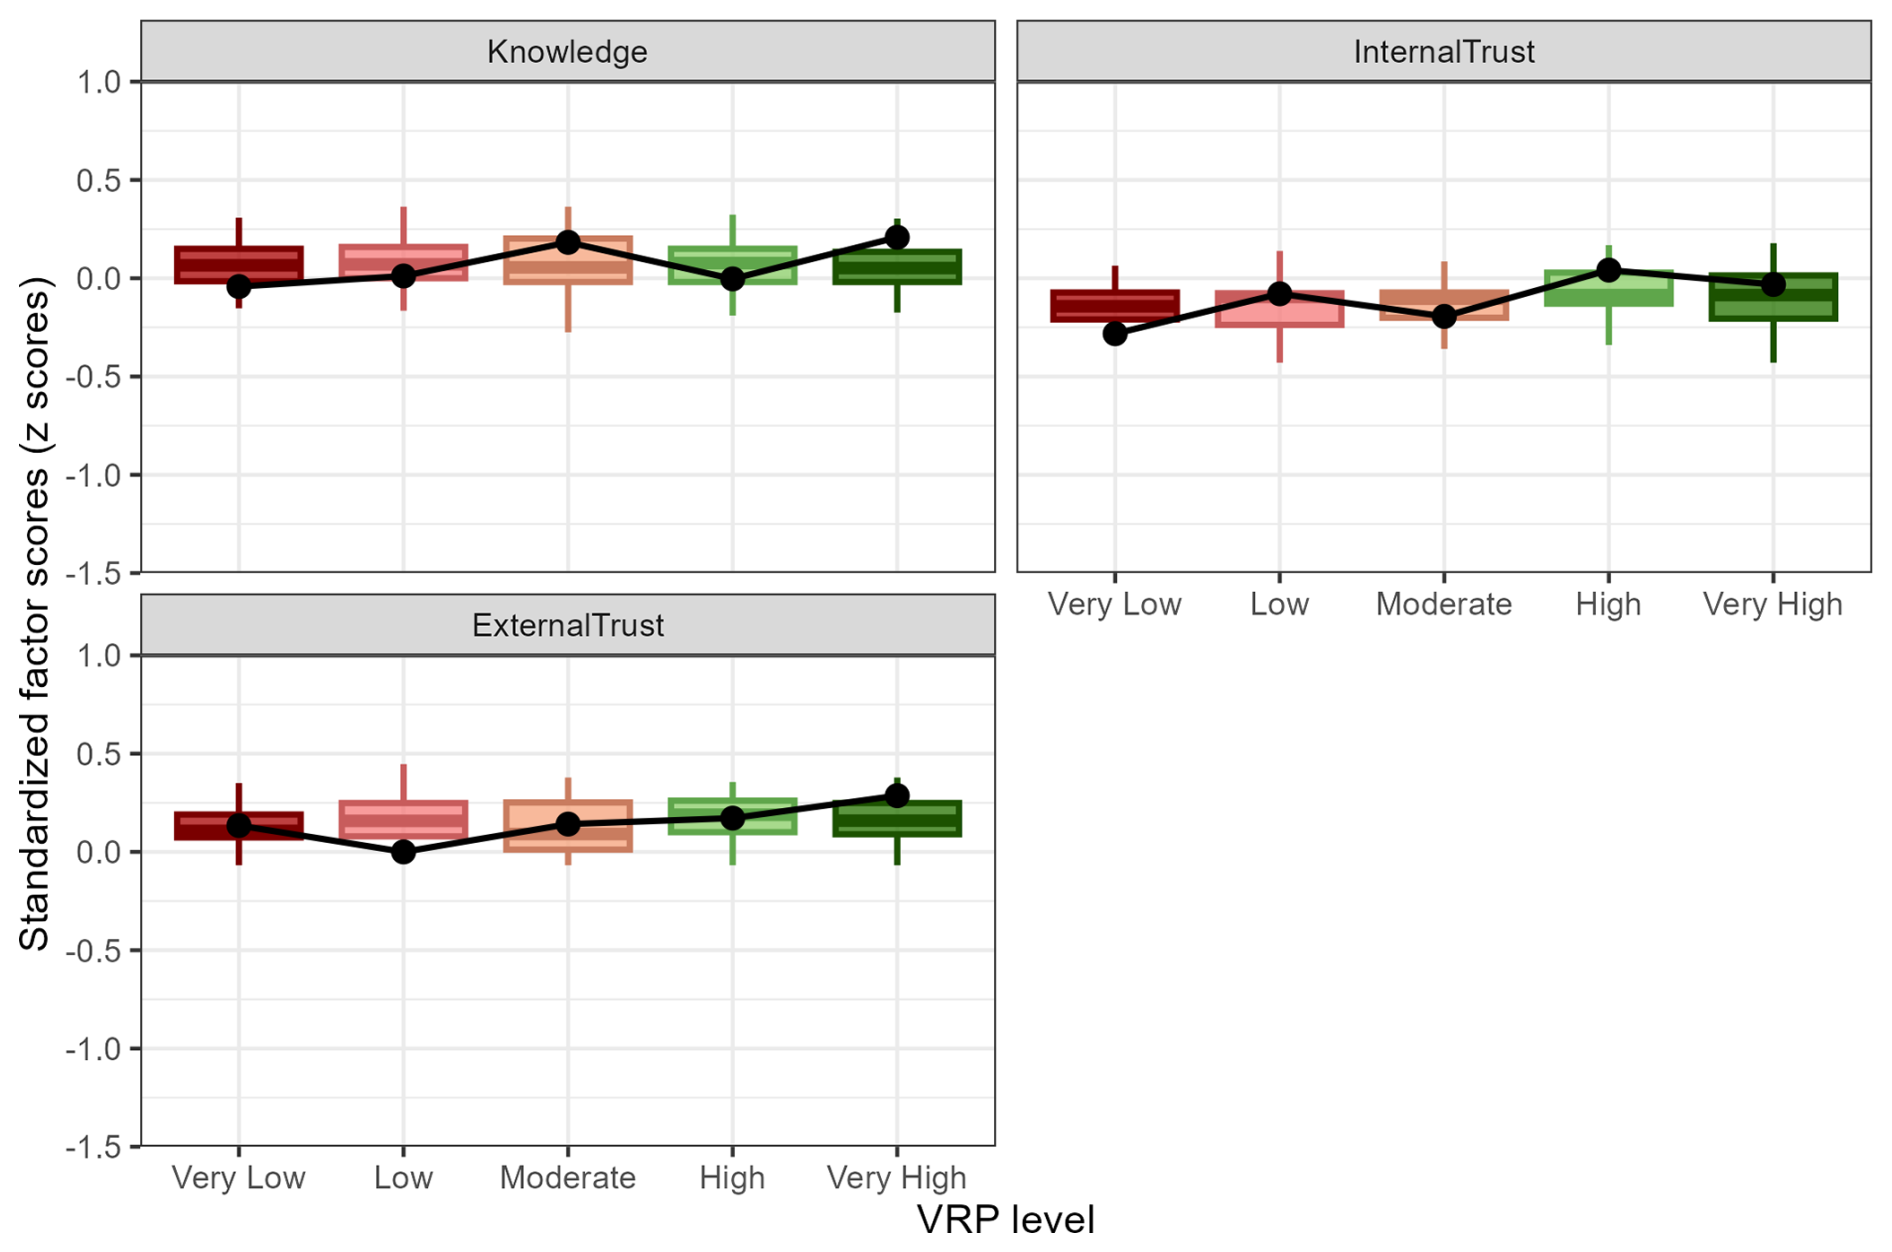
Figure 8Statistical distribution of VRP factors for non-residents. Boxplots show the distribution of standardized factor scores for each VRP level. Colours indicate VRP levels, ranging from Very Low (dark red) to Very High (dark green). Black points and lines represent cluster centroids, corresponding to the average standardized scores within each VRP level.
3.4 Distribution of VRP across socio-cultural groups
This section describes the distribution of volcanic risk perception (VRP) within socio-cultural groups, distinguishing between residents and non-residents. Figures 9 and 10 illustrate the relative distribution of VRP levels across demographic, socio-economic, and cultural variables. Greater variability in VRP distributions is observed across age, educational level, native identity, employment status, and economic activity, whereas gender and religious affiliation display more stable and comparatively balanced profiles across VRP levels. Differences related to nationality and language are also evident, although the interpretation of these patterns is constrained by smaller subgroup sizes. The following subsections detail these distributions, highlighting similarities and contrasts between residents and non-residents without inferring statistical significance.
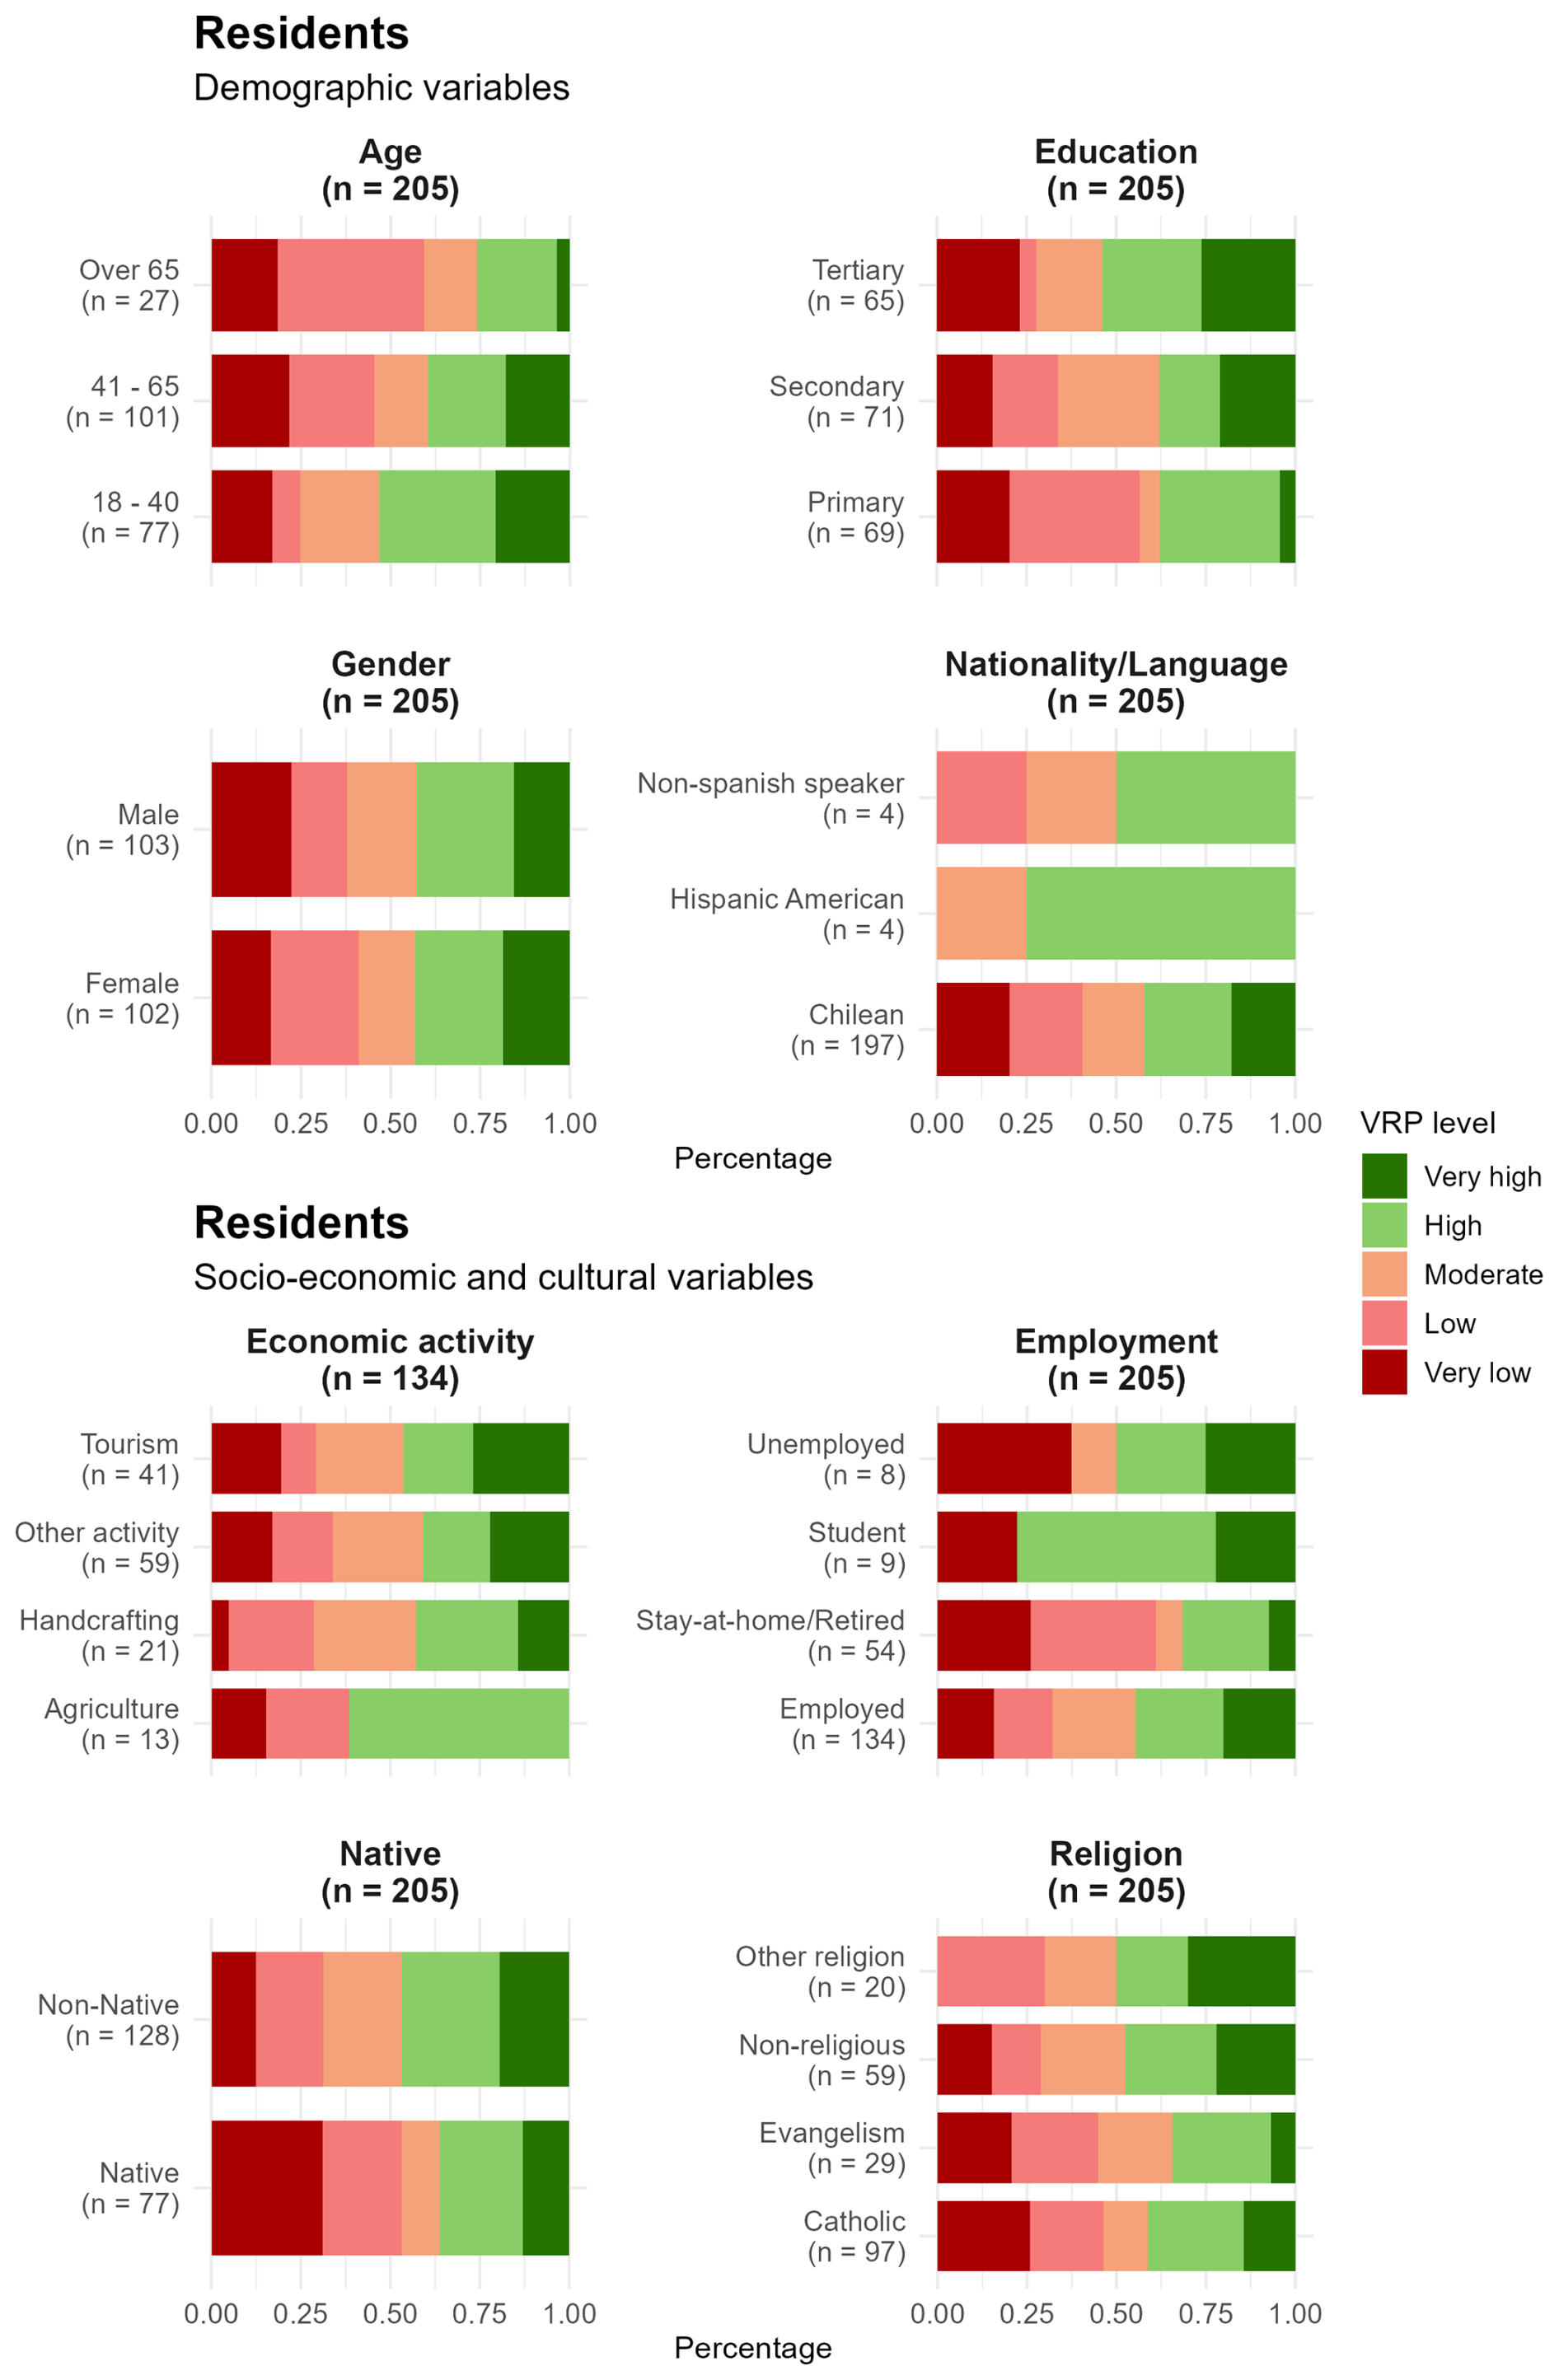
Figure 9Relative distribution of volcanic risk perception (VRP) levels across demographic, socio-economic, and cultural variables for residents.
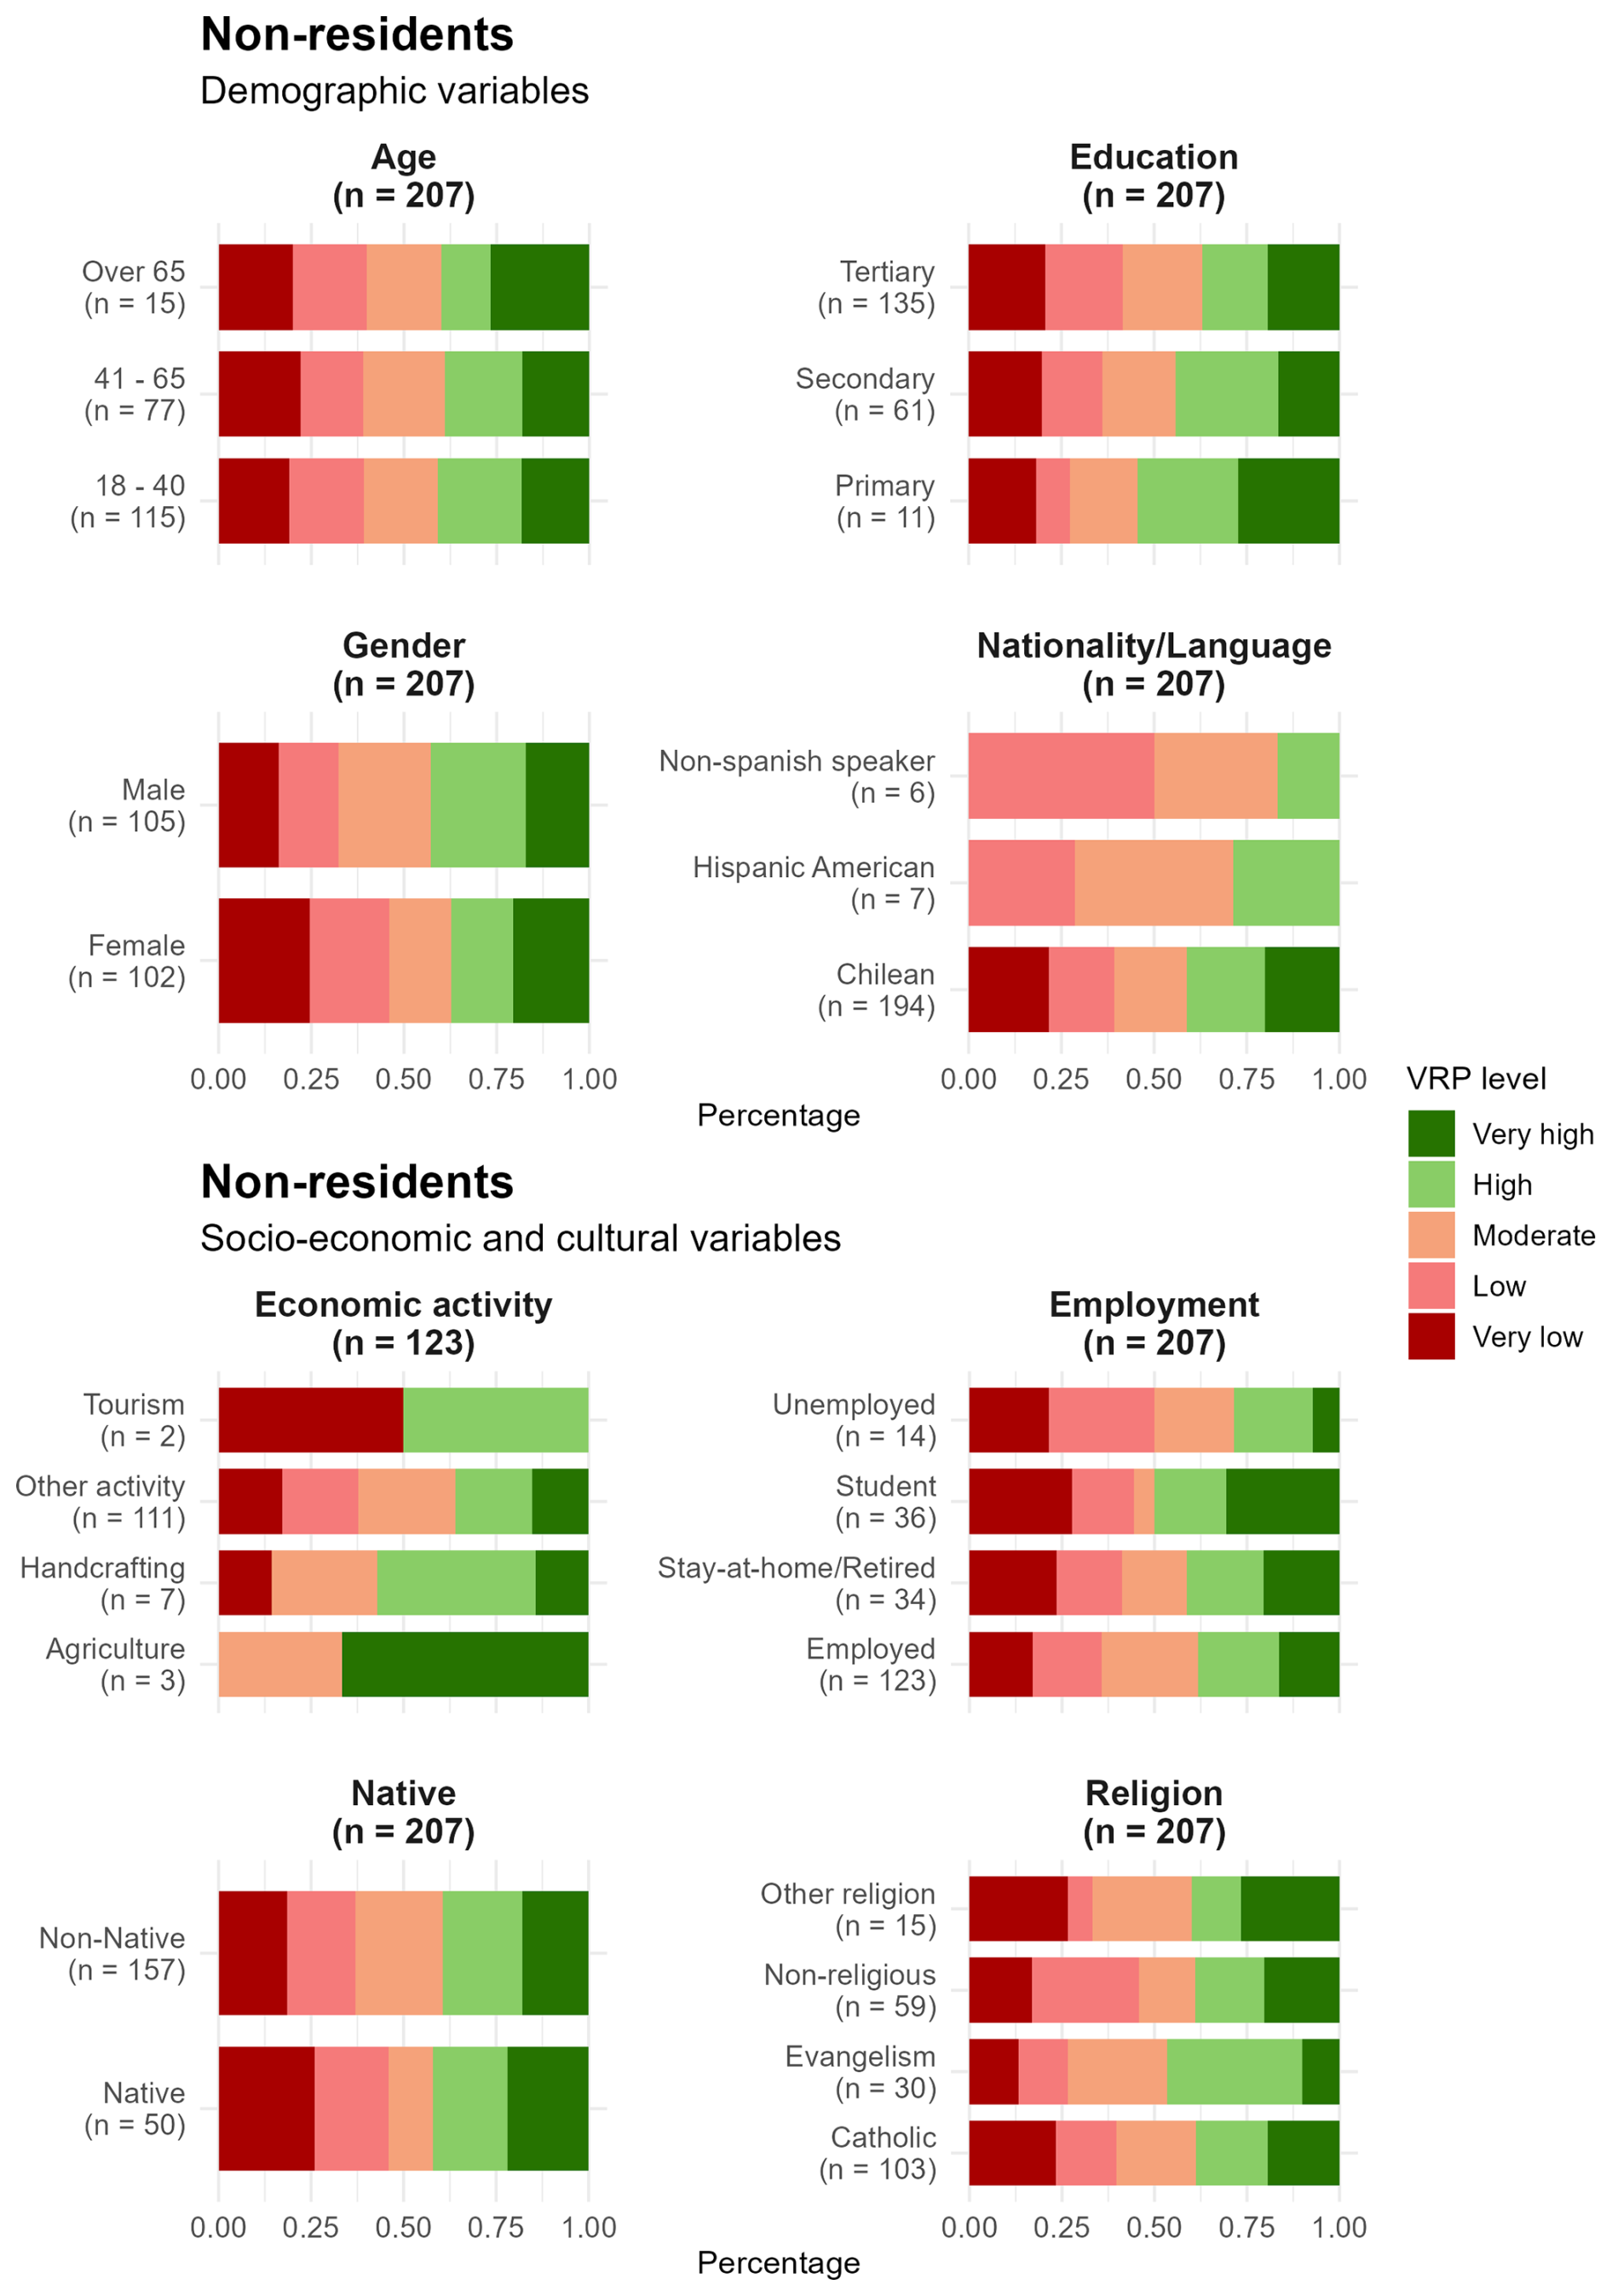
Figure 10Relative distribution of volcanic risk perception (VRP) levels across demographic, socio-economic, and cultural variables for non-residents.
3.4.1 Demographic profiles
Age
Among residents, VRP distributions vary by age group (Fig. 9). Young adults (18–40) show higher representation in high and very high VRP levels, whereas older residents (65+) exhibit a more evenly distributed profile across VRP categories, indicating greater heterogeneity rather than dominance of a single perception level. The intermediate age group (41–65) displays a transitional pattern with moderate and high VRP levels slightly more represented. Among non-residents (Fig. 10a), VRP distributions by age are generally more balanced, although elderly non-residents show greater variability, including higher representation in the very high VRP level.
Gender
Across both residents and non-residents, VRP distributions by gender are largely comparable, with similar proportions across VRP levels and no systematic differences observed (Figs. 9a and 10a).
Education
Among residents, primary education is more strongly represented in low and very low VRP levels, while secondary education exhibits a more evenly distributed profile. Residents with tertiary education show relatively higher proportions in high and very high VRP levels, although no single category dominates. Among non-residents, tertiary education predominates across the sample, and VRP levels remain broadly balanced, suggesting limited differentiation by educational level (Fig. 10a).
Nationality and language
VRP distributions across nationality and language groups are generally stable among residents. Greater variability is observed among non-Chilean and non-Spanish-speaking subgroups; however, these patterns are based on small sample sizes and should be interpreted cautiously. Similar limitations apply to non-resident subgroups (Figs. 9a and 10a).
3.4.2 Socio-economic and cultural profiles
Employment status
Employment status shows clearer differentiation in VRP distributions than demographic variables (Fig. 9). Among residents, employed individuals are more frequently represented in moderate and high VRP levels, whereas unemployed and retired or stay-at-home residents concentrate more strongly in low and very low VRP levels. Resident students, although a small subgroup, display relatively higher representation in high VRP levels. Among non-residents (Fig. 10), employed participants similarly show higher representation in moderate and high VRP levels. Students exhibit a more polarized distribution, with higher representation in both high and very high VRP levels.
Economic activity
VRP distributions vary across economic activities. Among residents, tourism-related and agricultural activities exhibit more polarized profiles, with higher representation at the extremes of VRP levels. Other activities show more evenly distributed patterns. Among non-residents, some economic activities are also associated with higher VRP levels; however, interpretation is constrained by small subgroup sizes (Figs. 9 and 10).
Native identity
Among residents, individuals identifying as native are more strongly represented in low and very low VRP levels. In contrast, non-residents show more evenly distributed profiles across VRP levels. Overall, native identity does not emerge as a strong differentiating factor when residency status is considered (Figs. 9 and 10).
Religion
Religious affiliation does not show systematic differentiation across VRP levels for either residents or non-residents, with relatively balanced distributions observed across groups (Figs. 9 and 10).
3.4.3 Summary of cross-cutting patterns
Overall, demographic variables are associated with relatively stable VRP distributions, whereas socio-economic and cultural variables exhibit greater variability. Residents display more differentiated VRP profiles than non-residents, particularly with respect to age and economic activity. These patterns suggest that residency status is associated with differences in how VRP is structured across socio-cultural groups.
4.1 Methodological approach
The Psychometric Paradigm and Cultural Theory approaches were combined in this research, where responses from a questionnaire allowed not only the assessment of relative risk perception levels but also an analysis of how selected factors influence them and how different cultural groups are characterized by these levels. Both approaches have been criticized for their low statistical explanatory power (e.g., Sjöberg, 1996; Marris et al., 1998). Marris et al. (1998) tested these approaches and found several cultural biases, although the psychometric approach explains about 32 % of the variation in risk perception for only one out of four specifically analyzed cultural groups. However, as suggested by other studies (e.g., Paton et al., 2010; Zeidler, 2015; Renn and Rohrmann, 2000; Jones et al., 2013), we do not disregard the complementary usefulness of Cultural Theory, particularly in characterizing the cultural patterns of the surveyed population. Rather than treating these frameworks as competing explanations, we argue that both approaches are complementary and, when used together, provide broader and more practical insights into volcanic risk perception. The psychometric paradigm is effective in capturing the multidimensional structure and relative positioning of key VRP factors, while Cultural Theory contributes to interpreting how groups commonly addressed in volcanic risk contexts are socially composed and differentiated. This combined approach allows the identification of distinct configurations of risk perception that would not be evident through the application of a single framework alone. Importantly, this integration facilitates a shift from interpreting risk perception solely in terms of individual factor scores toward understanding how combinations of knowledge, trust, and territorial attachment jointly shape differentiated risk perception profiles. Such an approach is particularly relevant for applied contexts, as both VRP levels and associated cultural patterns can inform civil protection agencies in designing more targeted and context-sensitive emergency management and communication strategies. In this study, Cultural Theory is not applied as a classificatory or predictive model, but rather as an interpretative lens to contextualize social and cultural patterns emerging from the VRP results. This approach follows recent applications that emphasize interpretation over typological assignment in disaster risk research.
4.2 Residents and non-residents as contrasting risk perception contexts
Residents and non-residents represent a fundamental distinction in this research, as both groups were surveyed using the same VRP questions, except for those related to place attachment. Although VRP levels were calculated independently for residents and non-residents, comparative interpretations focus on structural patterns and relative factor contributions rather than direct metric equivalence. This distinction is justified because transient visitors typically lack a local sense of community, including emotional attachment to place and sustained civic participation in emergency planning processes (Paton et al., 2008; Barberi et al., 2008; Ricci et al., 2013). For residents, the results indicate consistently positive scores across all VRP levels, which may reflect a strong sense of community cohesion when facing volcanic emergencies (Sect. 3.3.1). Only three VRP factors were evaluated for both residents and non-residents: knowledge, internal trust, and external trust. Among these, knowledge exhibited the greatest variation between the two groups. Residents scored lower, whereas non-residents showed more moderate scores (Sect. 3.3). This discrepancy may indicate that populations living in exposed areas do not necessarily possess higher levels of volcanic risk knowledge, a pattern widely documented in volcanic risk perception studies (e.g., Carlino et al., 2008; Ricci et al., 2013; Davis and Ricci, 2004). This finding suggests that long-term exposure and familiarity with volcanic environments may contribute to the normalization of risk, where everyday coexistence with volcanic activity reduces perceived threat and the motivation to seek or retain detailed hazard-related information. Regarding internal trust, non-residents displayed lower and predominantly negative VRP scores compared to residents (Sect. 3.3), suggesting lower reliance on local social networks and a possible tendency to overestimate their individual capacity to cope with volcanic hazards (Barberi et al., 2008). In contrast, external trust levels were similar across both groups, with predominantly positive scores across all VRP levels (Sect. 3.3). This result indicates that both residents and non-residents place comparable trust in scientific experts and authorities, increasing the likelihood of compliance with official recommendations and emergency protocols (Espluga et al., 2009; Njome et al., 2010; Haynes et al., 2008).
4.3 Cultural patterns of VRP levels
Some distinct cultural patterns associated with VRP levels were identified primarily among residents, whereas non-residents were more evenly distributed across VRP categories (Sect. 3.4). Among residents, age and educational level emerged as the most relevant differentiating factors. Adults and elderly individuals were more frequently concentrated in low and very low VRP levels, consistent with previous findings that identify elderly populations as potentially vulnerable groups in disaster contexts. However, as observed in similar studies, no consistent or linear relationship between age and risk perception can be firmly established (e.g., Barberi et al., 2008). Educational levels exhibited a stronger association with VRP levels (Sect. 3.4). Among residents, individuals with primary education were predominantly concentrated in low (61 %) and very low (35 %) VRP categories, although a notable proportion was also found in the high VRP category. In contrast, residents with secondary education were more frequently represented in moderate and very high VRP levels, suggesting that formal education may play a role in enhancing risk awareness and interpretation. This pattern may reflect greater exposure to scientific information, risk communication materials, or institutional narratives related to volcanic hazards.
Regarding occupation, residents outside the workforce, such as retired individuals or those engaged in unpaid domestic activities, were predominantly concentrated in low and very low VRP categories (Sect. 3.4). This group may face increased vulnerability due to limited access to information channels or reduced engagement with institutional preparedness initiatives. Conversely, students, primarily represented among non-residents, displayed VRP levels concentrated at both extremes, very high and very low, suggesting heterogeneous perceptions potentially influenced by unequal access to reliable information and digital media environments (e.g., Chester et al., 2008; Njome et al., 2010). Among economically active residents, VRP levels varied substantially depending on economic sector (Sect. 3.4). Occupations closely linked to local livelihoods, such as agriculture, handcrafting, and especially tourism, showed pronounced variability in VRP levels. Given the direct economic consequences that volcanic activity can impose on these sectors, such variability may reflect tensions between economic dependency, perceived threat, and risk acceptance. These findings highlight the importance of developing sector-specific risk communication strategies that acknowledge both economic vulnerability and perceptual diversity.
Although self-identified native populations were slightly overrepresented in low and very low VRP categories (Sect. 3.4), this result should be interpreted with caution. Similar patterns have been reported in other Indigenous contexts, where lower scores in standardized risk perception measures coexist with strong place-based knowledge, experiential understanding of hazards, and culturally embedded interpretations of risk that are not fully captured by survey-based instruments (Roder et al., 2016). Indigenous relationships with volcanic landscapes are often shaped by culturally embedded knowledge systems, cosmologies, and historical experience, which may not be fully captured through standardized survey instruments. Greater integration of Indigenous knowledge frameworks is therefore needed to understand better how volcanic risk is perceived and responded to within these communities (e.g., Hastangka and Suprapto, 2023; Niroa and Nakamura, 2022; Roder et al., 2016). No clear patterns were identified concerning gender identity or religion. While existing literature suggests that these factors may influence risk perception through worldview formation and belief systems (e.g., Cutter, 2017; Barberi et al., 2008; Eiser et al., 2015; Clarke, 2004; Breskaya and Zrinščak, 2024), their effects may be highly context-dependent and require more targeted qualitative or mixed-method approaches to be adequately captured.
This research integrates the Psychometric Paradigm and Cultural Theory to examine volcanic risk perception, demonstrating that both approaches are complementary and jointly provide valuable insights for risk management. While the psychometric approach captures the multidimensional structure and relative positioning of key VRP factors, Cultural Theory facilitates the interpretation of how social and cultural groupings relate to these perception patterns. Together, these frameworks support a more nuanced understanding of risk perception that extends beyond isolated variables. Importantly, the identified VRP levels reflect relative awareness-based profiles shaped by interacting social and contextual factors, rather than fixed or absolute measures of perceived danger. A central finding of this research is the differentiated VRP between residents and non-residents. Residents, who tend to exhibit stronger community ties and territorial attachment, show lower levels of risk-related knowledge but higher internal trust, whereas non-residents display higher knowledge scores coupled with lower internal trust, potentially leading to an overestimation of personal coping capacity. Despite these differences, both groups exhibit similar levels of external trust, underscoring the central role of institutional credibility in shaping compliance with emergency guidance.
Socio-demographic factors such as age, education, and occupation further influence VRP configurations. Elderly individuals and those outside the workforce emerge as potentially vulnerable groups requiring tailored communication strategies. Education appears to play a relevant role in shaping risk perception among residents, while individuals employed in economically sensitive sectors display highly variable VRP levels, emphasizing the need for context-specific risk engagement approaches. Finally, the study identifies several areas requiring further investigation. The slightly lower VRP observed among Indigenous populations highlights the importance of incorporating culturally grounded knowledge systems into volcanic risk research. Similarly, the absence of clear patterns related to gender identity and religion suggests that these dimensions may operate through complex, context-dependent mechanisms that are not easily captured by standardized instruments. Future research should therefore explore integrative methodological approaches capable of addressing these sociocultural dynamics in greater depth. Overall, this research reinforces the importance of situating volcanic risk perception within its broader social, cultural, and economic context. By advancing typological and context-sensitive understandings of VRP, this study contributes to the development of more effective, inclusive, and adaptive emergency management strategies in volcanic regions.
The repository contains the code and supporting materials used for the analyses presented in the manuscript. No proprietary third-party code was required beyond standard R packages cited within the scripts. The repository can also be accessed directly at https://doi.org/10.5281/zenodo.20300064 (Calderon, 2026).
The repository is openly accessible and contains the research datasets used in this study. All shared data were anonymized prior to publication. No restricted third-party datasets were used. The repository can also be accessed directly at: https://doi.org/10.5281/zenodo.20300064 (Calderon, 2026).
The supplement related to this article is available online at https://doi.org/10.5194/nhess-26-2841-2026-supplement.
RAC designed the study, conducted the data analysis, and led the manuscript writing. LEL contributed to the conceptual framework, supervised the volcanic hazard context, and reviewed the manuscript. MAL contributed to the cultural and geographical interpretation of the results and reviewed the manuscript. AAV supported the field data collection and contributed to manuscript revision. All authors discussed the results and approved the final version of the manuscript.
The contact author has declared that none of the authors has any competing interests.
Publisher's note: Copernicus Publications remains neutral with regard to jurisdictional claims made in the text, published maps, institutional affiliations, or any other geographical representation in this paper. The authors bear the ultimate responsibility for providing appropriate place names. Views expressed in the text are those of the authors and do not necessarily reflect the views of the publisher.
We would like to express our sincere gratitude to SERNAGEOMIN for the institutional and logistical support provided during the field campaigns conducted in 2016 and 2017. The data compiled during these campaigns later contributed to the development of the master’s thesis associated with this research. We also acknowledge the educational support provided by the Geography Institute of the Pontifical Catholic University of Chile.
This paper was edited by Giovanni Macedonio and reviewed by Francisca Vergara-Pinto and Letícia Freitas Guimarães.
Auker, M. R., Sparks, R. S. J., Siebert, L., Crosweller, H. S., and Ewert, J.: A statistical analysis of the global historical volcanic fatalities record, Journal of Applied Volcanology, 2, 1–24, https://doi.org/10.1186/2191-5040-2-2, 2013.
Barberi, F., Davis, M. S., Isaia, R., Nave, R., and Ricci, T.: Volcanic risk perception in the Vesuvius population, J. Volcanol. Geoth. Res., 172, 244–258, https://doi.org/10.1016/j.jvolgeores.2007.12.011, 2008.
Barclay, J., Haynes, K., Houghton, B., and Johnston, D.: Social processes and volcanic risk reduction, in: The Encyclopedia of Volcanoes, 2nd edn., edited by: Sigurdsson, H., Academic Press, 1203–1214, https://doi.org/10.1016/B978-0-12-385938-9.00069-9, 2015.
Barclay, J., Few, R., Armijos, M. T., Phillips, J. C., Pyle, D. M., Hicks, A., and Robertson, R. E. A.: Livelihoods, wellbeing and the risk to life during volcanic eruptions, Front. Earth Sci., 7, 1–15, https://doi.org/10.3389/feart.2019.00205, 2019.
Bird, D. K., Gisladottir, G., and Dominey-Howes, D.: Volcanic risk and tourism in southern Iceland: Implications for hazard, risk and emergency response education and training, J. Volcanol. Geoth. Res., 189, 33–48, https://doi.org/10.1016/j.jvolgeores.2009.09.020, 2010.
Bird, D. K., Gísladóttir, G., and Dominey-Howes, D.: Different communities, different perspectives: Issues affecting residents' response to a volcanic eruption in southern Iceland, B. Volcanol., 73, 1209–1227, https://doi.org/10.1007/s00445-011-0464-1, 2011.
Bonadonna, C., Biass, S., Menoni, S., and Gregg, C. E.: Assessment of risk associated with tephra-related hazards, in: Forecasting and Planning for Volcanic Hazards, Risks, and Disasters, Vol. 2, edited by: Papale, P., Elsevier, 329–378, https://doi.org/10.1016/B978-0-12-818082-2.00008-1, 2021.
Breskaya, O. and Zrinščak, S.: Annual Review of the Sociology of Religion, Vol. 15, Brill, https://doi.org/10.1163/9789004713802, 2024.
Bronfman, N. C., Cifuentes, L. A., and Gutiérrez, V. V.: Participant-focused analysis: Explanatory power of the classic psychometric paradigm in risk perception, J. Risk Res., 11, 735–753, https://doi.org/10.1080/13669870801967143, 2008.
Brown, S. K., Jenkins, S. F., Sparks, R. S. J., Odbert, H., and Auker, M. R.: Volcanic fatalities database: Analysis of volcanic threat with distance and victim classification, Journal of Applied Volcanology, 6, 15, https://doi.org/10.1186/s13617-017-0067-4, 2017.
Calderon, R. A.: NHESS reproducibility repository for psychometric and cultural characterization of volcanic risk perception at Villarrica volcano, Chile (Version v1.0.1), Zenodo [data set and code], https://doi.org/10.5281/zenodo.20300064, 2026.
Carlino, S., Somma, R., and Mayberry, G. C.: Volcanic risk perception of young people in the urban areas of Vesuvius: Comparisons with other volcanic areas and implications for emergency management, J. Volcanol. Geoth. Res., 172, 229–243, https://doi.org/10.1016/j.jvolgeores.2007.12.010, 2008.
Centro de Políticas Públicas UC (CPPUC): Bicentennial Survey 2017, Pontifical Catholic University of Chile, https://encuestabicentenario.uc.cl (last access: 8 June 2026), 2017.
Chester, D. K.: Volcanoes, society, and culture, in: Volcanoes and the Environment, Cambridge University Press, 404–439, https://doi.org/10.1017/CBO9780511614767.015, 2005.
Chester, D. K., Duncan, A. M., and Dibben, C. J. L.: The importance of religion in shaping volcanic risk perception in Italy, with special reference to Vesuvius and Etna, J. Volcanol. Geoth. Res., 172, 216–228, https://doi.org/10.1016/j.jvolgeores.2007.12.009, 2008.
Clarke, P. B.: New Religions in Global Perspective: Religious Change in the Modern World, 1st edn., Routledge, https://doi.org/10.4324/9780203508336, 2004.
Cutter, S. L.: The forgotten casualties redux: Women, children, and disaster risk, Global Environ. Chang., 42, 117–121, https://doi.org/10.1016/j.gloenvcha.2016.12.010, 2017.
Davis, M. S. and Ricci, D. T.: Perceptions of risk for volcanic hazards in Italy: A research note, International Journal of Sociology and Social Policy, 24, 159–165, https://doi.org/10.1108/01443330410791091, 2004.
Douglas, M. and Wildavsky, A.: Risk and Culture: An Essay on the Selection of Technological and Environmental Dangers, University of California Press, Berkeley, 224 pp., https://doi.org/10.2307/2130451, 1982.
Douglas, M. and Wildavsky, A.: Risk and Culture: An Essay on the Selection of Technological and Environmental Dangers, University of California Press, Berkeley, 224 pp., https://doi.org/10.2307/2130451, 1982.
Dove, M. R.: Perception of volcanic eruption as agent of change on Merapi volcano, Central Java, J. Volcanol. Geoth. Res., 172, 329–337, https://doi.org/10.1016/j.jvolgeores.2007.12.037, 2008.
Dzierma, Y. and Wehrmann, H.: Eruption time series statistically examined: Probabilities of future eruptions at Villarrica and Llaima volcanoes, Southern Volcanic Zone, Chile, J. Volcanol. Geoth. Res., 193, 82–92, https://doi.org/10.1016/j.jvolgeores.2010.03.009, 2010.
Edgar, A. and Sedgwick, P. (Eds.): Key Concepts in Cultural Theory, 1st edn., Routledge, https://doi.org/10.4324/9780203981849, 1999.
Eiser, J. R., Donovan, A., and Sparks, R. S. J.: Risk perceptions and trust following the 2010 and 2011 Icelandic volcanic ash crises, Risk Anal., 35, 332–343, https://doi.org/10.1111/risa.12275, 2015.
Espinoza, A. E., Osorio-Parraguez, P., and Posada Quiroga, E.: Preventing mental health risks in volunteers in disaster contexts: The case of the Villarrica volcano eruption, Chile, Int. J. Disast. Risk Re., 34, 154–164, https://doi.org/10.1016/j.ijdrr.2018.11.013, 2019.
Espluga, J., Prades, A., Gamero, N., and Solá, R.: El papel de la confianza en los conflictos socioambientales, Política y Sociedad, 46, 255–273, 2009.
Favereau, M., Robledo, L. F., and Bull, M. T.: Analysis of risk assessment factors of individuals in volcanic hazards: Review of the last decade, J. Volcanol. Geoth. Res., 357, 254–260, https://doi.org/10.1016/j.jvolgeores.2018.05.009, 2018.
Fischhoff, B., Slovic, P., Lichtenstein, S., Read, S., and Combs, B.: How safe is safe enough? A psychometric study of attitudes towards technological risks and benefits, Policy Sci., 9, 127–152, https://doi.org/10.1007/BF00143739, 1978.
Gaillard, J. C.: Alternative paradigms of volcanic risk perception: The case of Mt. Pinatubo in the Philippines, J. Volcanol. Geoth. Res., 172, 315–328, https://doi.org/10.1016/j.jvolgeores.2007.12.036, 2008.
Gaillard, J. C.: Vulnerability, capacity and resilience: Perspectives for climate and development policy, J. Int. Dev., 22, 218–232, https://doi.org/10.1002/jid.1675, 2010.
Gavilanes-Ruiz, J. C., Cuevas-Muñiz, A., Varley, N., Gwynne, G., Stevenson, J., Saucedo-Girón, R., and Cortés-Cortés, A.: Exploring the factors that influence the perception of risk: The case of Volcán de Colima, Mexico, J. Volcanol. Geoth. Res., 186, 238–252, https://doi.org/10.1016/j.jvolgeores.2008.12.021, 2009.
Global Volcanism Program (GVP): Villarrica volcano (357120), in: Volcanoes of the World, v. 5.2.6, Smithsonian Institution, https://doi.org/10.5479/si.GVP.VOTW5-2024.5.2, 2025.
Hastangka and Suprapto: Conception and perception of Indigenous people on Merapi volcano eruption: Knowledge, philosophy, and Indigenous education on disaster risk reduction in Indonesia, in: Indigenous Knowledge and Disaster Risk Reduction: Insight Towards Perception, Response, Adaptation and Sustainability, edited by: Panda, G. K., Chatterjee, U., Bandyopadhyay, N., Setiawati, M. D., and Banerjee, D., Springer International Publishing, 35–59, https://doi.org/10.1007/978-3-031-26143-5_3, 2023.
Haynes, K., Barclay, J., and Pidgeon, N.: Whose reality counts? Factors affecting the perception of volcanic risk, J. Volcanol. Geoth. Res., 172, 259–272, https://doi.org/10.1016/j.jvolgeores.2007.12.012, 2008.
Hernández Peña, Y., Vargas Cuervo, G., and Zafra Mejía, C.: Percepciones sobre fenómenos volcánicos: Elementos para la gestión del riesgo en Colombia, Perspectiva Geográfica, 25, 99–119, https://doi.org/10.19053/01233769.9488, 2020.
INE (Instituto Nacional de Estadísticas): Censo 2017, https://www.ine.gob.cl/estadisticas/sociales/censos-de-poblacion-y-vivienda/censo-de-poblacion-y-vivienda (last access: 18 May 2026), 2017.
Jaspal, R., Fino, E., and Breakwell, G. M.: The COVID-19 Own Risk Appraisal Scale (CORAS): Development and validation in two samples from the United Kingdom, J. Health Psychol., 27, 790–804, https://doi.org/10.1177/1359105320967429, 2022.
Johnston, D. M., Bebbington, M. S., Lai, C. D., Houghton, B. F., and Paton, D.: Volcanic hazard perceptions: Comparative shifts in knowledge and risk, Disaster Prev. Manag., 8, 118–126, https://doi.org/10.1108/09653569910266166, 1999.
Jones, E. C., Faas, A. J., Murphy, A. D., Tobin, G. A., Whiteford, L. M., and McCarty, C.: Cross-cultural and site-based influences on demographic, well-being, and social network predictors of risk perception in hazard and disaster settings in Ecuador and Mexico, Hum. Nature, 24, 5–32, https://doi.org/10.1007/s12110-013-9162-3, 2013.
Kokorsch, M. and Gísladóttir, J.: “You talk of threat, but we think of comfort”: the role of place attachment in small remote communities in Iceland that experience avalanche threat, Reg. Environ. Change, 23, 150, https://doi.org/10.1007/s10113-023-02144-w, 2023.
Lara, L. E. and Clavero, J.: Lara, L. E., and Clavero Ribes, J. E.: Villarrica volcano (39.5° S), Southern Andes, Chile, Servicio Nacional de Geología y Minería (SERNAGEOMIN), available at: https://www.bibliotecadigital.uchile.cl/permalink/56UDC_INST/1r5tlhf/alma991005450079703936 (last access: 19 May 2026), 2004.
Lara, L. E., Orozco, G., Amigo, A., and Silva, C.: Peligros volcánicos de Chile [material cartográfico], Servicio Nacional de Geología y Minería, Carta Geológica de Chile, Serie Geología Ambiental No. 13, Santiago, Chile, https://www.bibliotecanacionaldigital.gob.cl/bnd/631/w3-article-350755.html (last access: 19 May 2026), 2011.
Lara, L. E., Flores, F., Calderón, R., and Cardona, C.: Volcano hazards and risks in Chile, in: Forecasting and Planning for Volcanic Hazards, Risks, and Disasters, Vol. 2, edited by: Papale, P., Elsevier, 617–633, https://doi.org/10.1016/B978-0-12-818082-2.00017-2, 2021.
López-Vázquez, E.: Risk perception and coping strategies for risk from Popocatépetl volcano, Mexico, Geofis. Int., 48, 133–147, 2009.
Marris, C., Langford, I. H., and O'Riordan, T.: A quantitative test of the cultural theory of risk perceptions: Comparison with the psychometric paradigm, Risk Anal., 18, 635–647, https://doi.org/10.1111/j.1539-6924.1998.tb00376.x, 1998.
Mitsushita, K., Murakoshi, S., and Koyama, M.: How are various natural disasters cognitively represented? A psychometric study of natural disaster risk perception applying three-mode principal component analysis, Nat. Hazards, 116, 977–1000, https://doi.org/10.1007/s11069-022-05708-x, 2023.
Moreno, H. and Clavero, J.: Geología del volcán Villarrica, Regiones de la Araucanía y de Los Lagos, Servicio Nacional de Geología y Minería, Carta Geológica de Chile, Serie Geología Básica No. 98, Santiago, Chile, 2006.
Niroa, J. J. and Nakamura, N.: Volcanic disaster risk reduction in Indigenous communities on Tanna Island, Vanuatu, Int. J. Disast. Risk Re., 74, 102937, https://doi.org/10.1016/j.ijdrr.2022.102937, 2022.
Njome, M. S., Suh, C. E., Chuyong, G., and de Wit, M. J.: Volcanic risk perception in rural communities along the slopes of Mount Cameroon, West-Central Africa, J. Afr. Earth Sci., 58, 608–622, https://doi.org/10.1016/j.jafrearsci.2010.08.007, 2010.
Nomura, K., Yamaoka, K., Okano, T., and Yano, E.: Risk perception, risk-taking attitude, and hypothetical behavior of active volcano tourists, Hum. Ecol. Risk Assess., 10, 595–604, https://doi.org/10.1080/10807030490452214, 2004.
O'Brien, S., Federici, F., Cadwell, P., Marlowe, J., and Gerber, B.: Language translation during disaster: A comparative analysis of five national approaches, Int. J. Disast. Risk Re., 31, 627–636, https://doi.org/10.1016/j.ijdrr.2018.07.006, 2018.
Ogie, R., Rho, J. C., Clarke, R. J., and Moore, A.: Disaster risk communication in culturally and linguistically diverse communities: the role of technology, Proceedings, 2, 1256, https://doi.org/10.3390/proceedings2191256, 2018.
Oltedal, S., Moen, B.-E., Klempe, H., and Rundmo, T.: Explaining risk perception: An evaluation of cultural theory, Rotunde publikasjoner No. 85, Department of Psychology, Norwegian University of Science and Technology (NTNU), Trondheim, Norway, ISBN 82-7892-025-7, 2004.
Paton, D., Smith, L., Daly, M., and Johnston, D.: Risk perception and volcanic hazard mitigation: Individual and social perspectives, J. Volcanol. Geoth. Res., 172, 179–188, https://doi.org/10.1016/j.jvolgeores.2007.12.026, 2008.
Paton, D., Sagala, S., Okada, N., Jang, L.-J., Buergelt, P., and Gregg, C. E.: Making sense of natural hazard mitigation: Personal, social and cultural influences, Environ. Hazards-UK, 9, 183–196, https://doi.org/10.3763/ehaz.2010.0039, 2010.
Perry, R. W. and Lindell, M. K.: Volcanic risk perception and adjustment in a multi-hazard environment, J. Volcanol. Geoth. Res., 172, 170–178, https://doi.org/10.1016/j.jvolgeores.2007.12.006, 2008.
Renn, O. and Rohrmann, B. (Eds.): Cross-Cultural Risk Perception, Technology, Risk, and Society, vol. 13, Springer, Boston, MA, https://doi.org/10.1007/978-1-4757-4891-8, 2000.
Ricci, T., Barberi, F., Davis, M. S., Isaia, R., and Nave, R.: Volcanic risk perception in the Campi Flegrei area, J. Volcanol. Geoth. Res., 254, 118–130, https://doi.org/10.1016/j.jvolgeores.2013.01.002, 2013.
Roder, G., Ruljigaljig, T., Lin, C. W., and Tarolli, P.: Natural hazards knowledge and risk perception of Wujie Indigenous community in Taiwan, Nat. Hazards, 81, 641–662, https://doi.org/10.1007/s11069-015-2100-4, 2016.
Romero, J. E., Morgado, E., Pisello, A., Boschetty, F., Petrelli, M., Cáceres, F., Alam, M. A., Polacci, M., Palma, J. L., Arzilli, F., Vera, F., Gutiérrez, R., and Morgavi, D.: Pre-eruptive conditions of the 3 March 2015 lava fountain of Villarrica Volcano (Southern Andes), B. Volcanol., 85, 2, https://doi.org/10.1007/s00445-022-01621-0, 2023.
Salazar, G. and Jalabert, D.: Towards a landscape ecosophy: Interpreting how the Villarrica-Pucón urban system inhabitants in the Araucanía region of Chile perceive and relate with the dynamics of landscape, Urbe, 8, 28–41, https://doi.org/10.1590/2175-3369.008.001.SE02, 2016.
Sepúlveda, M. E.: La historia eruptiva de los volcanes hispanoamericanos (siglos XVI al XX): el modelo chileno, Servicio de Publicaciones, Cabildo Insular de Lanzarote, Arrecife, España, ISBN 84-95938-32-4, 2004.
Siegrist, M. and Arvai, J.: Risk perception: Reflections on 40 years of research, Risk Anal., 40, 2191–2206, https://doi.org/10.1111/risa.13599, 2020.
Siegrist, M., Keller, C., and Kiers, H. A.: A new look at the psychometric paradigm of perception of hazards, Risk Anal., 25, 211–222, https://doi.org/10.1111/j.0272-4332.2005.00580.x, 2005.
Sjöberg, L.: A discussion of the limitations of the psychometric and cultural theory approaches to risk perception, Radiat. Prot. Dosim., 68, 219–225, https://doi.org/10.1093/oxfordjournals.rpd.a031868, 1996.
Slovic, P.: Perception of risk, Science, 236, 280–285, https://doi.org/10.1126/science.3563507, 1987.
Slovic, P. and Peters, E.: Risk perception and affect, Curr. Dir. Psychol. Sci., 15, 322–325, https://doi.org/10.1111/j.1467-8721.2006.00461.x, 2006.
Slovic, P., Fischhoff, B., and Lichtenstein, S.: Rating the risks, Environ. Sci. Policy Sustain. Dev., 21, 14–39, https://doi.org/10.1080/00139157.1979.9933091, 1979.
Tansey, J.: Risk as politics, culture as power, J. Risk Res., 7, 17–32, https://doi.org/10.1080/1366987042000151188, 2004.
Tansey, J. and O'Riordan, T.: Cultural theory and risk: A review, Health Risk Soc., 1, 71–90, https://doi.org/10.1080/13698579908407008, 1999.
Teo, M., Goonetilleke, A., Deilami, K., Ahankoob, A., and Lawie, M.: Engaging residents from different ethnic and language backgrounds in disaster preparedness, Int. J. Disast. Risk Re., 39, 101245, https://doi.org/10.1016/j.ijdrr.2019.101245, 2019.
Thouret, J.-C., Wavelet, E., Taillandier, M., Tjahjono, B., Jenkins, S. F., Azzaoui, N., and Santoni, O.: Defining population socio-economic characteristics, hazard knowledge and risk perception: the adaptive capacity to persistent volcanic threats from Semeru, Indonesia, Int. J. Disast. Risk Re., 77, 103064, https://doi.org/10.1016/j.ijdrr.2022.103064, 2022.
Tobin, G. A., Whiteford, L. M., Jones, E. C., Murphy, A. D., Garren, S. J., and Padros, C. V.: The role of individual well-being in risk perception and evacuation for chronic vs. acute natural hazards in Mexico, Appl. Geogr., 31, 700–711, https://doi.org/10.1016/j.apgeog.2010.12.008, 2011.
van Daele, M., Moernaut, J., Silversmit, G., Schmidt, S., Fontijn, K., Heirman, K., Vandoorne, W., de Clercq, M., van Acker, J., Wolff, C., Pino, M., Urrutia, R., Roberts, S. J., Vincze, L., and de Batist, M.: The 600 yr eruptive history of Villarrica volcano (Chile) revealed by annually laminated lake sediments, Bull. Geol. Soc. Am., 126, 481–498, https://doi.org/10.1130/B30798.1, 2014.
Vergara-Pinto, F. and Romero, J. E.: Perceptions of past and future eruptions of Puyehue-Cordón Caulle (southern Chile): Connecting neighbourhood, social cohesion and disaster memory in volcanic risk research, Revista de Estudios Latinoamericanos sobre Reducción del Riesgo de Desastres, 7, 88–110, https://doi.org/10.55467/reder.v7i2.126, 2023.
Vergara-Pinto, F., O'Grady, N., Fredriksen, A., Romero, J. E., Marchant, C., Walshe, R., Donovan, A., Morin, J., and Szlam, M.: How residents and volcanoes co-produce risk knowledge: Ways of knowing and affective attunement to the rhythms of Lonquimay volcano, Chile, J. Volcanol. Geoth. Res., 454, 108180, https://doi.org/10.1016/j.jvolgeores.2024.108180, 2024.
Wachinger, G., Renn, O., Begg, C., and Kuhlicke, C.: The risk perception paradox: Implications for governance and communication of natural hazards, Risk Anal., 33, 1049–1065, https://doi.org/10.1111/j.1539-6924.2012.01942.x, 2013.
Wantim, M. N., Bradriyo, I., Zisuh, A. F., Balgawa, L. M., Yannah, M., Karume, K., Peter, N.-F., Amban, B., Wayih, N. L., Yenshu, E. V., and Ayonghe, S. N.: Volcanic risk perception and coping strategies from Mounts Cameroon and Nyiragongo eruptions, Central Africa: A comparative analysis, Journal of Geoscience and Environment Protection, 12, 161–189, https://doi.org/10.4236/gep.2024.126011, 2024.
Weber, E. U., Blais, A. R., and Betz, N. E.: A domain-specific risk-attitude scale: Measuring risk perceptions and risk behaviors, J. Behav. Decis. Making, 15, 263–290, https://doi.org/10.1002/bdm.414, 2002.
Wulan Mei, E. T., Harijoko, A., Setiawan, N. I., Wijayanti, H., and Riasasi, W.: Tourists' perception on volcanic hazard and risk in Guci Hot Spring, Slamet Volcano, Indonesia, IOP C. Ser. Earth Env., 412, 012012, https://doi.org/10.1088/1755-1315/412/1/012012, 2020.
Zeidler, J. A.: Modeling cultural responses to volcanic disaster in the ancient Jama–Coaque tradition, coastal Ecuador: A case study in cultural collapse and social resilience, Quatern. Int., 394, 79–97, https://doi.org/10.1016/j.quaint.2015.09.011, 2015.