the Creative Commons Attribution 4.0 License.
the Creative Commons Attribution 4.0 License.
 | 19 Jan 2026
Hourly Precipitation Patterns and Extremization over Italy using convection-permitting reanalysis data
Francesco Cavalleri
Cristian Lussana
Francesca Viterbo
Michele Brunetti
Riccardo Bonanno
Veronica Manara
Matteo Lacavalla
Maurizio Maugeri
The latest generation of convection-permitting reanalyses, capable of representing atmospheric processes at small spatial scales (≤4 km), is crucial for studying the temporal and spatial evolution of phenomena such as convective storms and orographic precipitation. Given the long (37 years) and continuous availability of the MERIDA HRES convection-permitting reanalysis datasets over Italy, this study employs its precipitation fields to investigate hourly precipitation patterns, extremes, and quantify their increase over time in this region. Precipitation clusters are extracted from hourly reanalysis fields as spatially coherent structures, yielding approximately 160 000 of them per year, each one characterized by intensity and shape indicators. The resulting HOPSS-X (HOurly Precipitation Spatial Structures and eXtremes) dataset enables a detailed climatological analysis of hourly precipitation frequency, intensity, and spatial extent across different seasons and regions. The Hourly Precipitation Extremes (HPEs) are selected from this dataset basing on the mean of local annual maxima in hourly precipitation (RX1hour). Significant upward trends in HPEs occurrences (+20 % / +30 %) are present during summer in several Alpine and Prealpine regions, as well as in parts of Calabria. In autumn, similar signals (+30 % / +40 %) emerge in the southern Apennines and in coastal and maritime areas, including the eastern Ligurian coast, eastern Sardinia, the southern Adriatic Sea, and the Ionian Sea. These spatial and seasonal patterns align with regions where convective processes predominantly drive intense, localised precipitation, potentially amplified by climate change. While these findings should be considered in light of known limitations of reanalysis products, such as spatial mismatches with observations and temporal inhomogeneities, multiple independent observational studies support the increase in HPEs during summer and autumn in specific areas. Moreover, the methodology presented here is broadly applicable in any region with access to long-term convection-permitting reanalysis data. In summary, the purpose of this study is to offer a contribution to the ongoing discussion on precipitation extremes and trends in Italy and provide guidance for leveraging reanalysis data to enhance infrastructure resilience to short-lived, intense precipitation events.
- Article
(13854 KB) - Full-text XML
-
Supplement
(2661 KB) - BibTeX
- EndNote


As global temperatures continue to rise due to climate change (IPCC, 2023), significant alterations in large-scale precipitation patterns are being observed across the globe (Allan et al., 2020). These shifts can trigger even more pronounced changes at the local level (Fowler et al., 2021), particularly in the frequency, intensity, and timing of extreme precipitation. The physical reason for these changes lies in the Clausius-Clapeyron thermodynamic relationship (Hardwick Jones et al., 2010), which describes how a warmer atmosphere can hold more water vapour. Moreover, the rising ocean temperature observed in recent decades (Garcia-Soto et al., 2021) provides more moisture to fill the atmospheric column. Climate change produces however contrasting effects: some regions may experience drier conditions, while others may see more intense and frequent rainfall (Zaitchik et al., 2023). Both drying and wetting regions may experience changes in extreme precipitation (Donat et al., 2017). The thermodynamic effects tend to produce a relatively uniform increase in precipitation extremes, but dynamic contributions (such as orography, coastal interaction, and changes in weather regimes) can modulate these changes regionally, leading to local variations in the intensity and frequency of extremes (Pfahl et al., 2017). Moreover, such extremes are generally more pronounced at shorter timescales, such as hourly, than at longer durations (Lenderink et al., 2017).
The Mediterranean region, in particular, is recognised as a climate change hotspot, undergoing warming at a faster rate than many other parts of the world (Lionello and Scarascia, 2018). The increasing sea surface temperatures in the Mediterranean contribute to more frequent heavy precipitation events (Senatore et al., 2025), in particular at the hourly timescale (Peleg et al., 2025). Within this region, Italy is especially vulnerable to short-lived extreme precipitation. (Giovannini et al., 2021; Donnini et al., 2023; Padulano et al., 2019), largely due to its complex orography and the dynamical interaction between moist air masses, mountain chains, and coastal interface (Stocchi and Davolio, 2017; Mazzoglio et al., 2022). All these aspects highlight the need to investigate whether and to what extent climate change is impacting the distribution of hourly precipitation extremes over Italy.
Research on precipitation trends in Italy has been extensive over the past decades, revealing a complex spatial and temporal variability shaped by regional climatic dynamics, topography, and large-scale atmospheric patterns. Several regional investigations based on observational datasets contributed to this discussion, emphasising pronounced local differences. Caloiero et al. (2018, 2021) reported significant negative trends for the period 1951–2016 in both seasonal and annual total rainfall in Southern Italy and inland central regions, especially in winter and autumn. Similarly, in Trentino-Alto Adige (north-eastern Italy), Brugnara et al. (2012) observed a decrease in annual precipitation on the order of 1.0 %–1.5 % per decade in the period 1922–2009, with spring and winter contributing most to the decline. In the same study, the number of wet days significantly decreased east of the Adige Valley (north-western Italy), while trends in extremes (90th, 95th, 99th percentiles) were weak and mostly non-significant. In Tuscany (west-central Italy), Bartolini et al. (2014) found a declining trend in annual rainfall and wet days for the period 1955–2007, largely due to winter and spring decreases. In Calabria (southern Italy), Brunetti et al. (2012), using a high-resolution daily dataset for the period 1923–2006, detected negative trends in mean precipitation intensity (total precipitation per wet day), a reduction in daily precipitation amounts, and a decreased frequency of high-intensity daily events (95th and 99th percentiles). Similarly, Pavan et al. (2017), analysing the Archivio Climatologico per l'Italia Centro Settentrionale (ARCIS), a high-resolution gridded precipitation dataset for north-central Italy, for the period 1961–2015, found widespread summer declines in most regions – driven by fewer rainy days, longer dry spells, and reduced daily intensity – except in the northern Alpine area, where both total and intense precipitation increased. Finally, Capozzi et al. (2023) analysed multiple stations across Campania (south-western Italy) for the period 2002–2021 and found an increasing trend in both precipitation intensity and the frequency of heavy rainfall events during autumn, particularly in the northern part of the region and in mountainous areas.
Collectively, these studies show a complex and heterogeneous evolution of precipitation regimes in Italy. However, they are based on daily datasets, whereas climate change impacts on precipitation are most evident at sub-daily timescales (Lenderink et al., 2017). Sub-daily observational datasets usually cover limited regions and rarely provide long-term, nationwide coverage (Blenkinsop et al., 2018; Morbidelli et al., 2025). In Italy, the observational network is extensive and of high quality, but since the 1990s it has been managed at the regional level, resulting in some heterogeneity among measurement networks. The GRidded Italian Precipitation Hourly Observations (GRIPHO) dataset (Fantini, 2019) was developed to homogenize hourly observations, but its limited temporal coverage (2001–2016) restricts its usefulness for long-term trend analyses. Consequently, sub-daily precipitation trends can be investigated using observations available for specific regions only. Regional analyses show a delay of sub-daily rainfall extremes toward autumn and increasing event magnitude in Emilia-Romagna (Persiano et al., 2020), while southern Italy exhibits rising hourly extremes whose significance decreases at longer durations (Avino et al., 2024). Mazzoglio et al. (2020) developed the I2-RED dataset (1916–2022), showing nationwide increases in annual maxima for short durations (especially 1 h). In contrast, longer durations, such as 24 h aggregations, exhibit more spatially variable trends, including some negative tendencies (Mazzoglio et al., 2025). These findings underscore the need for innovative methodologies to effectively capture and interpret evolving patterns in hourly extreme precipitation across Italy, beyond observations alone. This is also because rain gauge networks often lack the spatial density needed to capture highly localised events, such as convective storms, unless they occur directly over a station, and consequently they tend to underestimate extremes by about 20 % (Schroeer et al., 2018). Conversely, radar and satellite-based precipitation estimates, while offering broader spatial coverage, can exhibit substantial positive or negative biases, particularly during high-intensity events or in areas affected by terrain-induced signal blocking (Wang et al., 2021). For this reason, convection-permitting reanalyses, blending model outputs with observational data, have proven to be valuable tools for investigating precipitation extremes and assessing their potential trends over time (Dallan et al., 2024; Poschlod et al., 2021).
In this context, this study aims to contribute to the ongoing scientific discussion on precipitation trends and extremes by proposing a methodological framework for an informed use of convection-permitting reanalysis data to characterise hourly precipitation structures across space and seasons, and to investigate the potential precipitation extremization over time. To this end, the hourly precipitation fields from the convection-permitting MEteorological Reanalysis Italian DAtaset – High RESolution, MERIDA HRES (Viterbo et al., 2024) are employed, covering the 37 year period from 1986 to 2022 at about a 4 km resolution.
Even if convection-permitting reanalyses represent a state-of-the-art, precipitation remains one of the most challenging variables to simulate, and it is not directly assimilated by the reanalyses, but instead derived from assimilated variables such as temperature, pressure, and humidity. These limitations often lead to some discrepancies between simulated and observed precipitation fields at the smaller scales, especially during summer, mainly due to precipitation positioning uncertainties (Cavalleri et al., 2024). This issue also arises from the inherently chaotic nature of the atmosphere (Hohenegger and Schär, 2007) together with limitations in the data assimilation frequency of the driving global reanalyses (Kalnay et al., 2024) (e.g., ERA5 assimilates data every 12 h, much less than typical timescales of convection). Assimilated observations remain the same regardless of the investigated temporal scale. Temporal aggregation (e.g. daily) can sometimes hide deficiencies at a smaller scale. At the sub-daily scale (e.g. hourly) precipitation fields no longer benefit from this effect, making deviations from observations more noticeable. Another relevant aspect is the potential divergence in precipitation trends between observations and reanalyses. Discrepancies in trends of annual precipitation totals were highlighted in global reanalyses (Lussana et al., 2024) and Italian regional ones (Cavalleri et al., 2024).
In light of these limitations, an approach based on precipitation structures has been adopted to mitigate positioning uncertainties issues. In particular, in this work spatially continuous hourly precipitation structures and associated extremes are identified through the use of a clustering technique. Clustering methods are commonly employed to identify individual precipitation structures from gridded datasets, particularly in the context of radar-based observations and operational verification. These techniques typically rely on threshold-based object identification combined with clustering algorithms to isolate spatially coherent precipitation structures. For example, Wernli et al. (2008) describe an object-based verification method (SAL) that requires the identification of distinct precipitation objects using a threshold proportional to the domain's maximum precipitation value, a strategy also discussed by Davis et al. (2006). Marzban and Sandgathe (2006) provide a broader review of clustering approaches applied to precipitation fields, showing how cluster analysis can be used to define features or objects in both forecast and observation fields, enabling verification. Moreover, clustering methods have also been applied to classify sub-daily rainfall episodes according to their internal structure (Sottile et al., 2022). Several methods have also been developed to track precipitation events over time (Chang et al., 2016; White et al., 2017; Li et al., 2020). In this study, however, a straightforward approach to identify precipitation structures is proposed, not accounting for the temporal evolution of the precipitation events, focusing on each hourly time step independently.
The paper is organized as follows. Section 2 introduces the MERIDA HRES reanalysis, detailing the reasons for its selection along with its inherent strengths and limitations, and describes the methodology adopted to construct the HOurly Precipitation Spatial Structures and Xtremes (HOPSS-X) dataset, publicly available on Zenodo at https://bit.ly/HOPSS-X (last access: 8 October 2025). Section 3 outlines the main results, focusing on the spatial distribution and seasonal patterns of hourly precipitation structures, with particular emphasis on the extremes subset and related trends. Section 4 discusses these findings in the context of previous studies on precipitation trends and known limitations of reanalysis data. Finally, Sect. 5 summarises the key conclusions and outlines potential directions for future research.
2.1 MERIDA HRES, a convection-permitting reanalysis
This study employs the hourly precipitation fields from MERIDA HRES (Viterbo et al., 2024), a reanalysis developed for the Italian domain, resolving explicit convection to better represent localised and intense precipitation events. MERIDA HRES, developed by Ricerca sul Sistema Energetico (RSE), employs the Weather Research and Forecasting (WRF) model to dynamically downscale over Italy the global ERA5 reanalysis (Hersbach et al., 2020) to a higher-resolution horizontal grid of approximately 4 km and 56 vertical levels, with increased vertical resolution in the lower atmosphere (levels located at 10, 35, 70, 100, 130, 180, 250, 325, 415, and 500 m). It is driven by large-scale initial and boundary conditions from ERA5 and applies a spectral nudging technique (von Storch et al., 2000) to constrain synoptic-scale features while filtering out smaller-scale perturbations that could introduce spurious signals. Additionally, SYNOP surface air temperature observations are assimilated through an observational nudging technique (Liu et al., 2012; Bonanno et al., 2019; Viterbo et al., 2024), further enhancing the representation of regional atmospheric characteristics. The dataset spans the period from 1986 to 2022, but is constantly updated with about a two-year lag. The analyses for this work are calculated over the domain 5.84 to 18.96° E and 35.37 to 48.25° N, centred on the Italian peninsula, for the period 1986–2022, enclosing the full period of availability for MERIDA HRES at the time of writing.
The specific choice of MERIDA HRES reanalysis is supported by previous validation studies. In particular, its precipitation fields have been assessed from climatological to daily (Cavalleri et al., 2024; Viterbo et al., 2024) and hourly (Giordani et al., 2025) timescales, also comparing with other convection-permitting reanalyses for the same area, highlighting both its strengths and limitations. The effective horizontal spatial resolution of MERIDA HRES has been evaluated in previous works using a wavelet spectral decomposition approach (see Cavalleri et al., 2024, Fig. 2), which demonstrated its ability to represent convective precipitation, although it may not fully resolve the smallest structures. Moreover, MERIDA HRES shows good agreement with both gridded and station-based observations, and demonstrates overall temporal stability when compared with homogenised observational datasets (Cavalleri et al., 2024). These qualities make it an appropriate product for hourly precipitation trend analyses. Other convection-permitting models available for Italy, such as MOLOCH (Capecchi et al., 2023) and SPHERA (Cerenzia et al., 2022; Giordani et al., 2023), have been found to generally produce larger deviations from observed precipitation trends than MERIDA HRES (Cavalleri et al., 2024), while results from VHR-REA_IT (Raffa et al., 2021) indicate a slightly weaker agreement with daily-scale observations (Cavalleri et al., 2024). These aspects may limit the applicability of other products in this study.
Nevertheless, these studies also indicate that MERIDA HRES occasionally overestimates rainfall amounts during summer in specific regions, including the Po Valley–Adriatic interface, parts of the Calabrian mountains, southern Apulia, and the southern portions of the main islands, with local deviations from observations reaching 10–30 mm. However, since these regions are generally dry during summer, the relative error can be substantial, up to locally doubling the observed rainfall amounts in July and August (Cavalleri et al., 2024). Moreover, the trend in the annual differences between MERIDA HRES and homogenised observations precipitation totals is on average 4 % per decade, meaning that this fraction of annual precipitation increase might be attributable to a deviation from observations rather than a true climate signal (Cavalleri et al., 2024). This mismatch is not uniform across the territory (see the supplementary material of Cavalleri et al., 2024). The knowledge of these specific inhomogeneities of MERIDA HRES will be taken into account when discussing the results of this work (Sect. 4).
2.2 Precipitation structures detection and characterization
The first step involves identifying coherent Hourly Precipitation Spatial Structure (HPSSs) in each MERIDA HRES hourly field. To account for seasonal and regional differences, thresholds are calculated for each grid point of the reanalysis and separately for each season by taking the median (i.e., 50th percentile) of precipitation values exceeding 1 mm. After that, a spatial smoothing filter with a 20 km radius is applied to reduce noise and improve spatial consistency across neighbouring grid cells (Fig. 1).
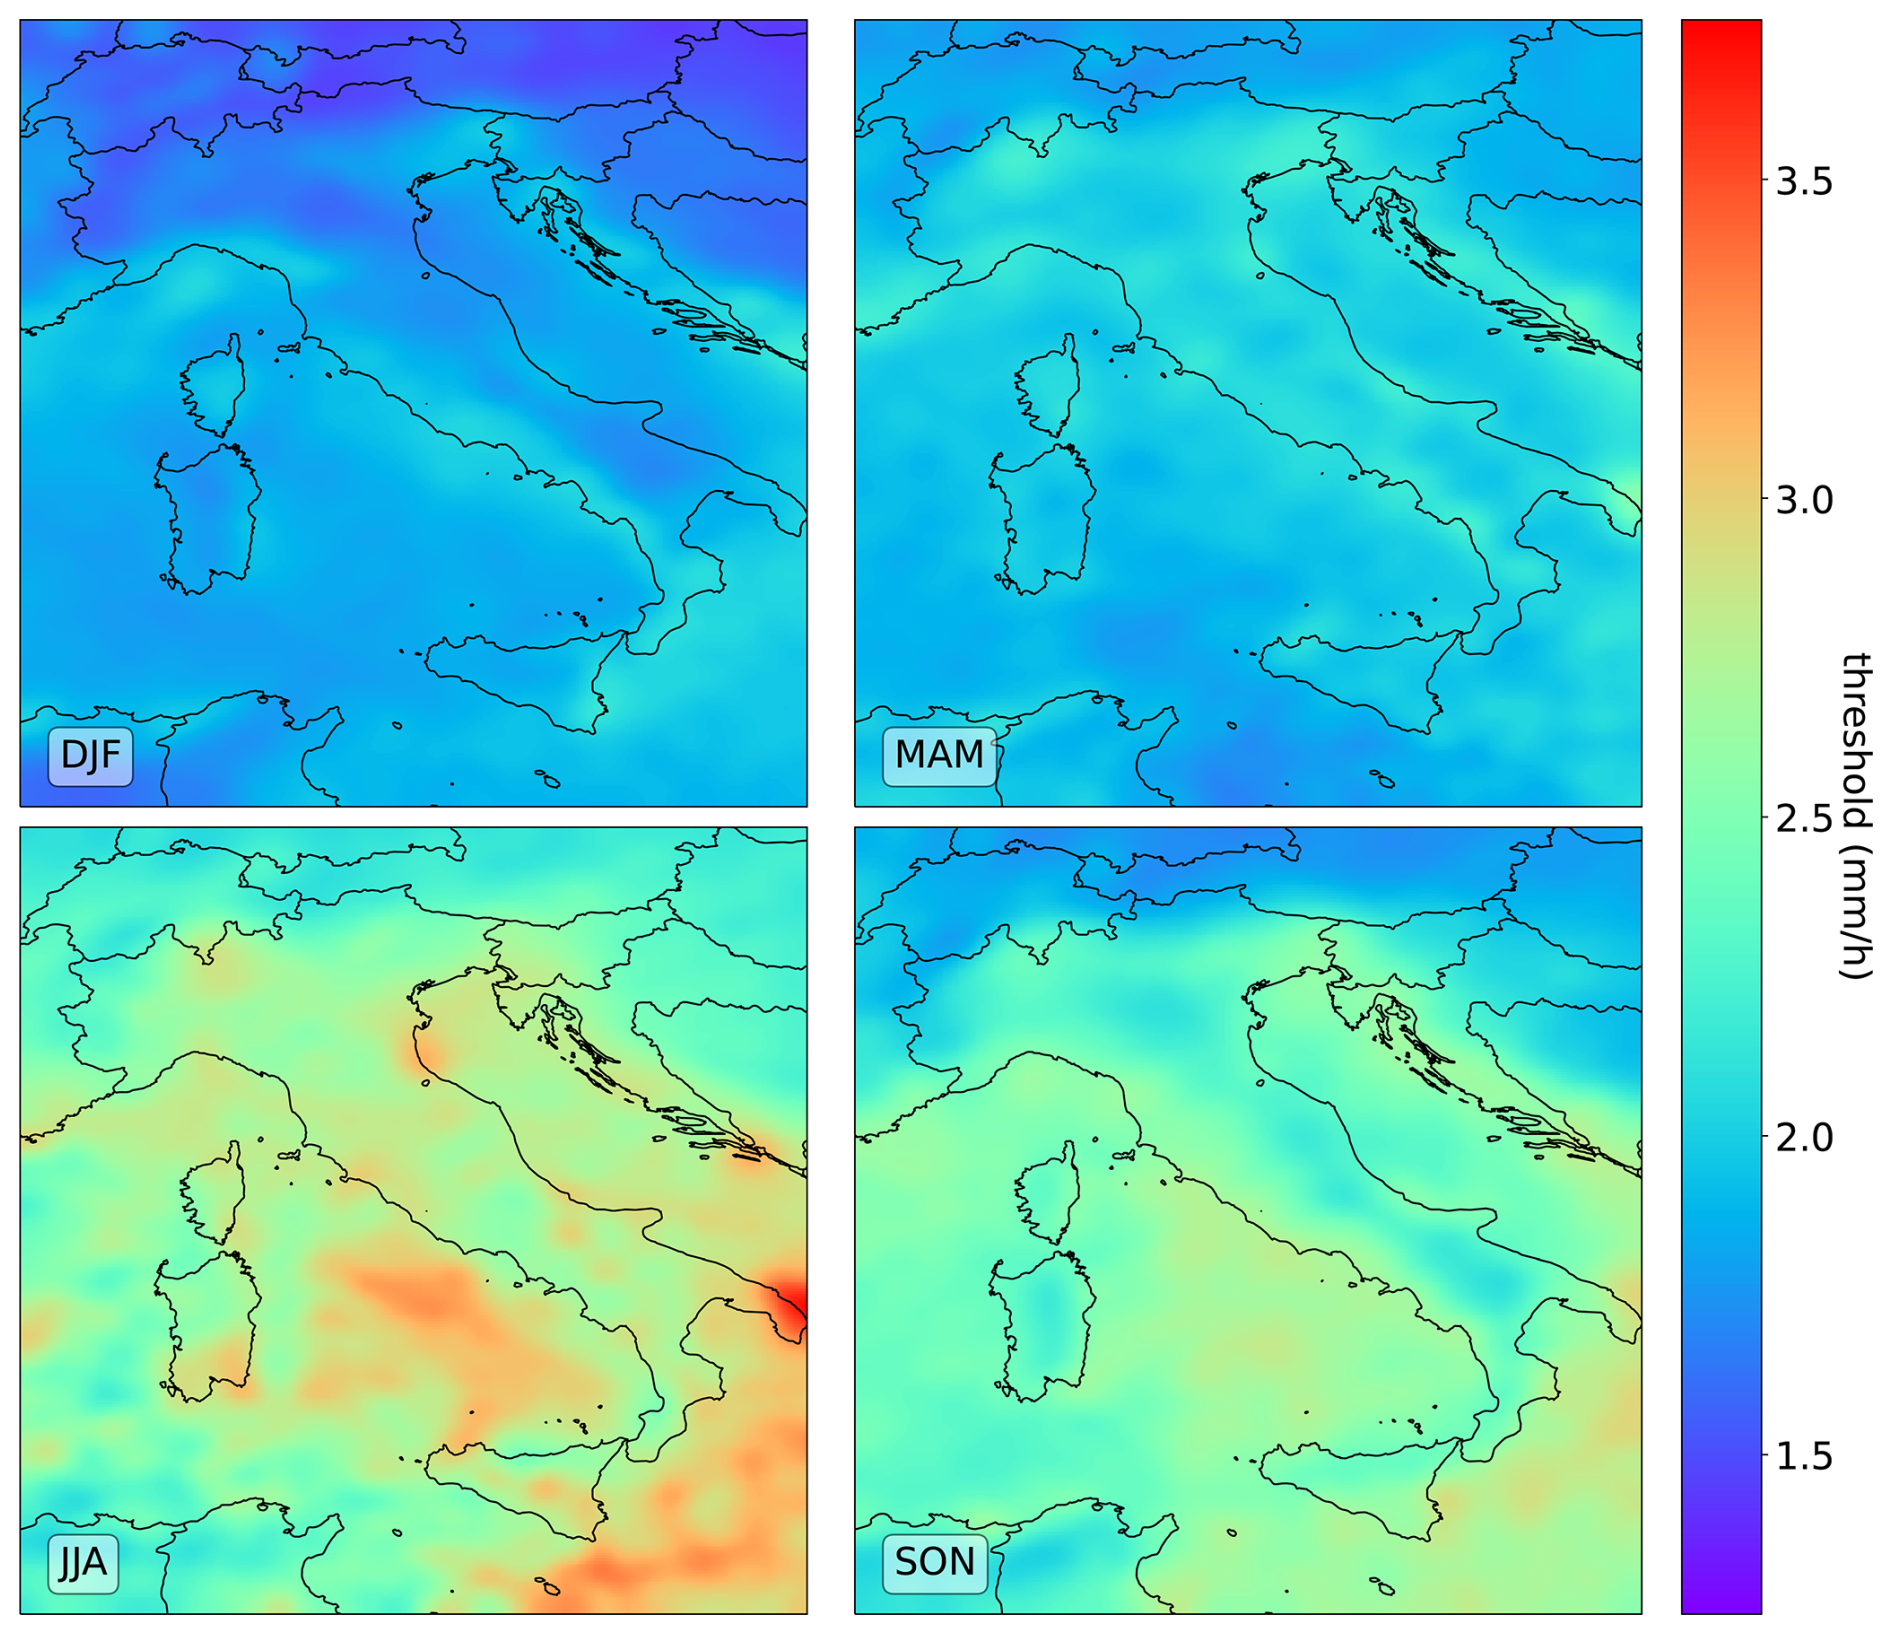
Figure 1Seasonal maps of the median of hourly precipitation values above 1 mm, used as thresholds.
Precipitation values below 1 mm h−1 are excluded to distinguish meaningful precipitation from background noise. Indeed, below 1 mm h−1 the spatial variability is very high, whereas it significantly decreases above it, indicating that precipitation becomes more spatially coherent and representative of broader areas (Lussana et al., 2023). During the first stages of this work, a fixed 1 mm threshold was applied to detect HPSS. Nevertheless, the choice of a uniform threshold across the entire domain and for all seasons did not adequately account for the spatial and seasonal variability of precipitation regimes, leading to the merging of multiple distinct convective cells into a single, large cluster that did not reflect the localised nature of HPSSs. This mismatch between the actual physical scale of convective systems and the scale of the detected clusters motivated the choice of a percentile-based threshold. In determining the most suitable smoothing radius, several values were tested. Radii larger than 20 km excessively smoothed areas with higher thresholds, reducing the ability to resolve regions of intense precipitation. Conversely, smaller radii retained too much noise, limiting the effectiveness of the thresholds in isolating coherent precipitation structures. Moreover, 20 km approximately corresponds to the boundary between the meso-β and meso-γ atmospheric scales (Thunis and Bornstein, 1996), below which convective phenomena typically occur.
Contiguous grid points exceeding the thresholds (Fig. 1) are treated as an individual cluster. To reduce noise, clusters composed of fewer than five grid points are excluded: approximately 95 % of them exhibit intensities below 10 mm h−1, and therefore have a negligible impact on the focus of this study on extreme precipitation. Each retained cluster is identified as an HPSS. More specifically, in this work HPSSs are spatially continuous hourly precipitation structures, identifying detectable and relevant precipitation with reference to a given area and season. Figure 2 shows an example of the procedure used to identify HPSSs, applied to the hourly precipitation field of 20 October 2011 at 13:00:00 UTC. On that day, intense precipitation affected Rome and the surrounding areas, causing several floods throughout the city and widespread power outages (Bonanno et al., 2019).
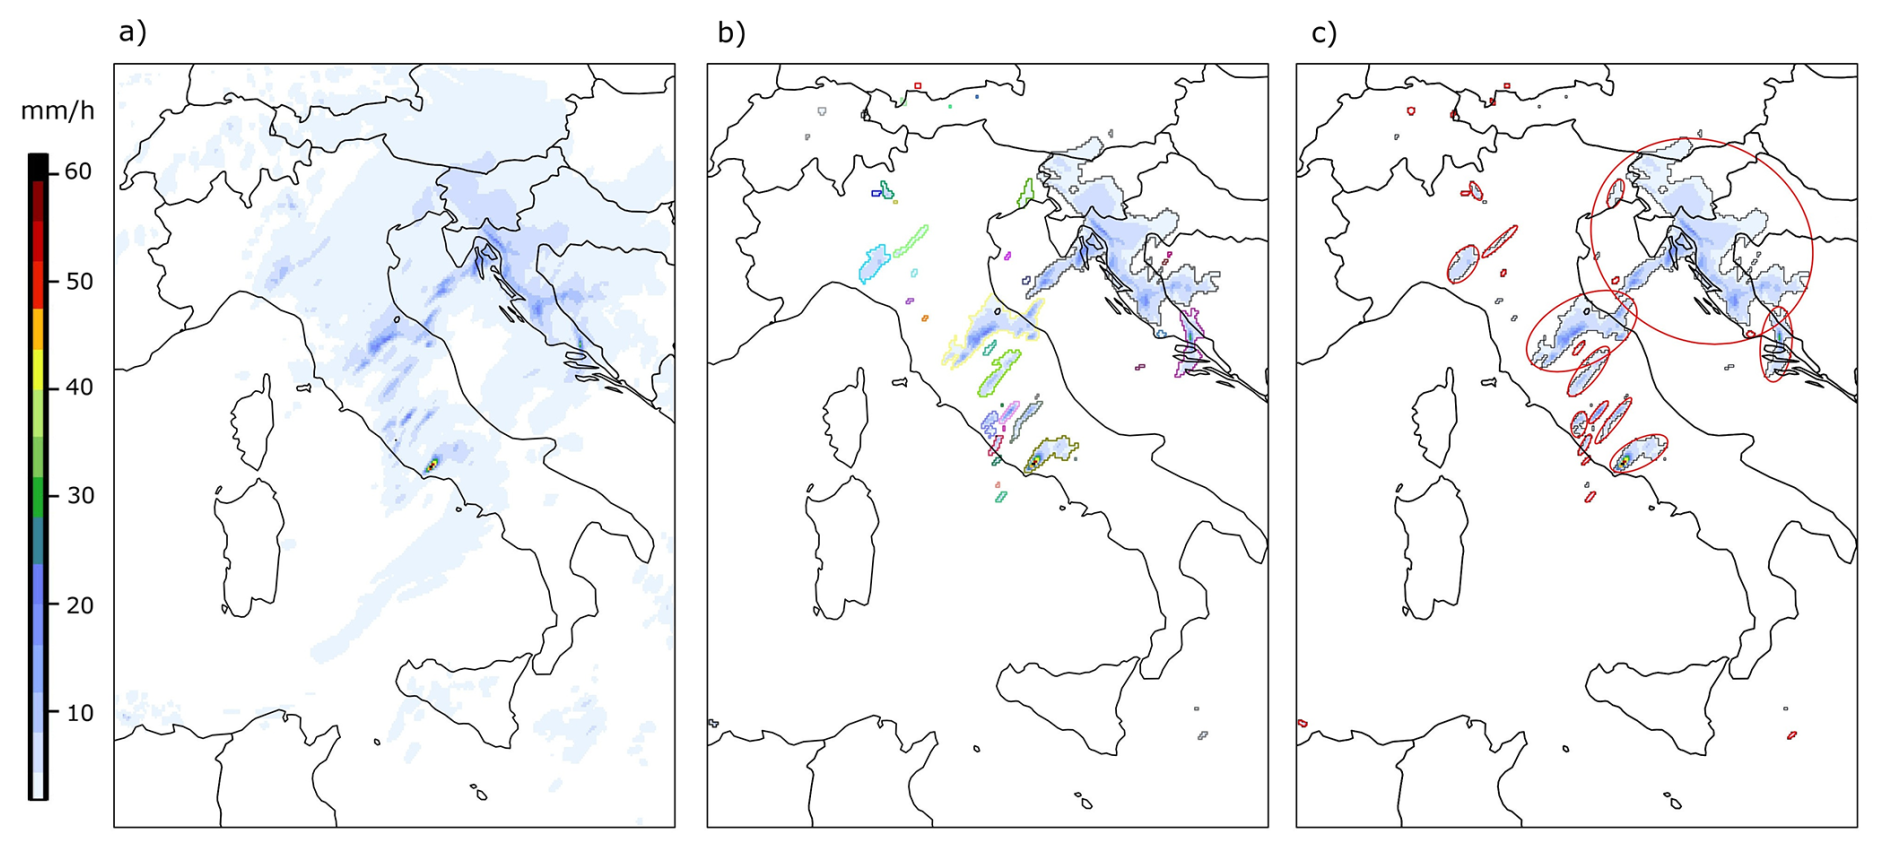
Figure 2Example of HPSS detection process for the day 20 October 2011, 13:00:00 UTC. (a) Raw precipitation field, (b) after applying the threshold and the clustering (each border colour represents a different cluster), (c) minimum enclosing ellipses (in red) identify retained structures.
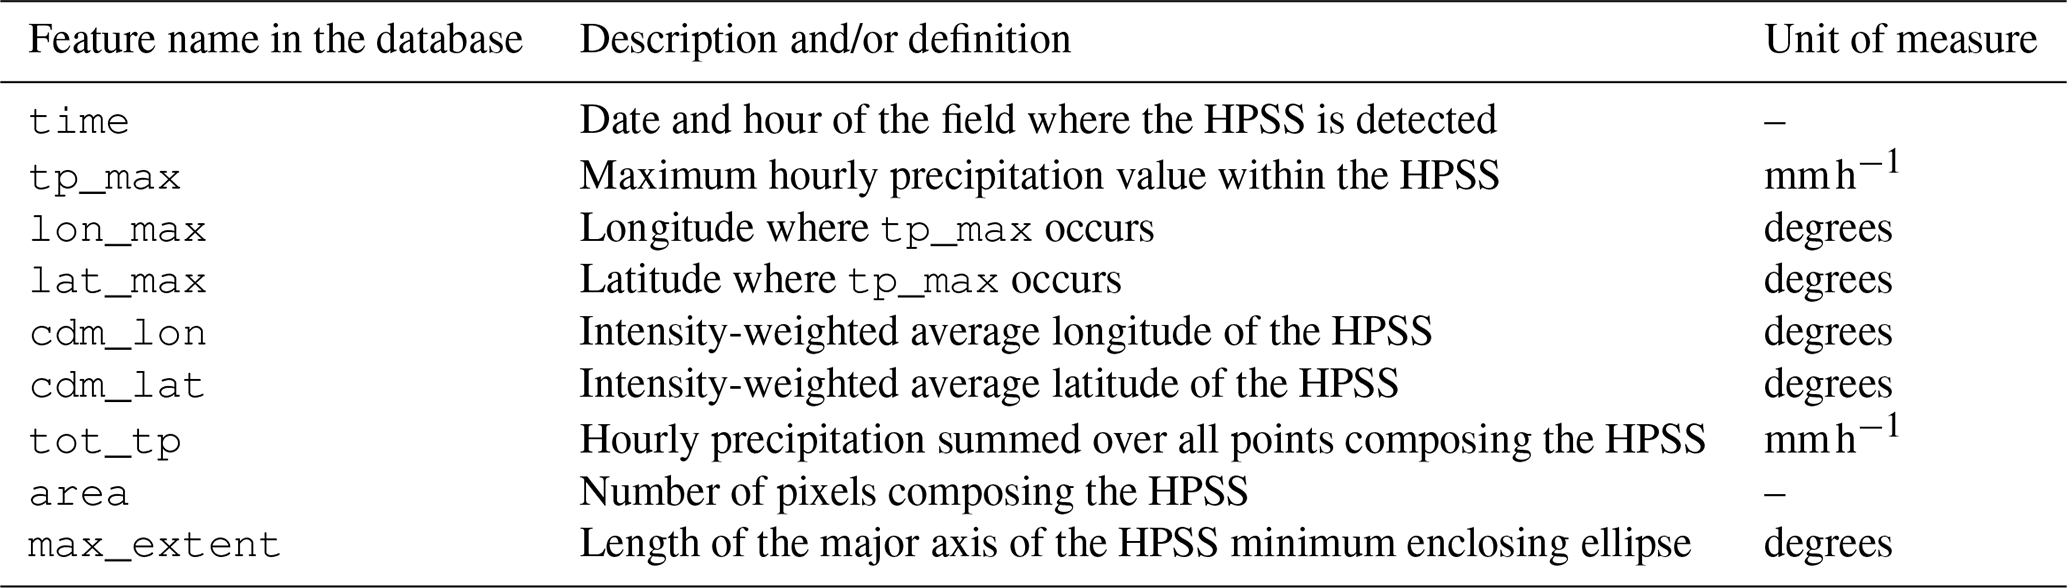
Each identified HPSS is characterized by a set of features describing its date and time of occurrence, position, and total and maximum precipitation intensity, as summarized in Table 1. The maximum linear spatial extent of a HPSS is defined as the major axis of its minimum enclosing ellipse – i.e., the smallest ellipse that fully contains all grid points belonging to the structure (Wernli et al., 2008). The choice of characterizing the shape of an HPSS by its maximum linear extent is motivated by the fact that atmospheric spatial scales are generally defined in linear terms (Thunis and Bornstein, 1996). Moreover, deriving this feature from the minimum enclosing ellipse allows for a consistent characterization of precipitation structure having very different shapes. Additional features are included in the complete database available only, while only features used in this study are reported here.
Table 1The set of feature recorded for each HPSS which are relevant for this study.
2.3 Structure-based statistics
The HPSS detection methodology described above produced the HOPSS-X dataset, which can be analysed through the set of features associated with each HPSS. First, the seasonal distributions of mean precipitation intensity (), peak precipitation intensity (tp_max), and maximum linear spatial extent (max_extent) of all HPPS are examined. Then, spatial patterns of hourly precipitation are investigated. To account for location uncertainty inherent in reanalysis data and avoid misleading point-scale analyses, statistics are not evaluated at individual grid points but within a 0.5° moving window (≈156 grid points) with 0.1° increments in both latitude and longitude. In each of these windows, the Number of occurrences (N) of HPSSs whose centre of mass (𝚌𝚍𝚖_𝚕𝚊𝚝,𝚌𝚍𝚖_𝚕𝚘𝚗) fell inside the window is counted. Because the sliding distance (0.1°) is smaller than the window size (0.5°), a single HPSS is counted in multiple adjacent windows, ensuring smooth spatial transitions. Then, some features are averaged among all the HPSSs falling in a window. Specifically, the Average Mean Intensity (MeanInt), Average Peak Intensity (PeakInt), and Average Maximum Linear Spatial Extent (SpatExtent) are obtained by averaging , tp_max and max_extent respectively, as detailed in Table 2.
Table 2Description of indicators used for the analyses and their units of measure, where indicates the different hours within the period over which the indicator is computed (typically a season), and denotes the different HPSSs occurring at a timestep within a given spatial window.

To help disentangle the respective contributions of the hourly spatial density of HPSSs and their frequency of occurrence, alternative metrics to N – such as the frequency of wet hours (i.e., the percentage of hours with at least one structure detected in the window) – were also evaluated (Fig. S1 in the Supplement). These analyses produced very similar results, and N is preferred as the indicator of HPSS occurrence due to its easier interpretability.
Both MeanInt and PeakInt are expressed in millimetres per hour (mm h−1), but they reflect different aspects of precipitation intensity. MeanInt represents the average intensity across all grid points of all HPSSs within a given window, while PeakInt refers to the mean of the maximum intensities recorded at a single point for each HPSS. SpatExtent indicates the average maximum linear extent of the HPSSs within the same window. Finally, these values are cumulated (for N) or averaged (for MeanInt, PeakInt, SpatExtent) over time to obtain characteristic values for each location. Statistics on the full dataset, including climatologies of these indicators, are presented in Sect. 3.1.
2.4 Hourly extreme precipitation sub-setting
After characterising the properties of the HPSSs, the Hourly Precipitation Extremes (HPEs) are selected from the full dataset. The selection criterion is based on the annual maxima of hourly precipitation (RX1hour), calculated for each grid point and each year. The resulting time series of 37 RX1hour values are then averaged throughout the period 1986–2022 to derive a threshold value for each cell of the grid, representing the average RX1hour at that location. Higher threshold values were found to excessively restrict the statistical sample of extremes, whereas lower values, although expanding the subset of identified structures, would have blurred the distinction between HPEs, as defined by Extreme Value Theory (Coles, 2001), and more moderate high-quantile HPSSs, thereby reducing the interpretability of the results.
This approach is similar to the methodology used by Lavers et al. (2025), who introduced the Extreme Rain Multiplier to classify extreme daily precipitation events. Lavers et al. (2025) employ ERA5 and consider daily precipitation accumulations to compute the mean of the annual daily maxima (RX1day). The daily accumulation is the most appropriate timescale considering the coarse spatial scale of ERA5 (Chinita et al., 2023; Raffa et al., 2021). In contrast, this study uses a regional convection-permitting reanalysis, which provides a more accurate representation of hourly precipitation and associated extremes. Therefore, it is possible to define a threshold based on hourly maxima (RX1hour). As the last step, the same Gaussian filter as specified in Sect. 2.2 is applied to smooth the average RX1hour field and reduce local-scale noise (Fig. 3).
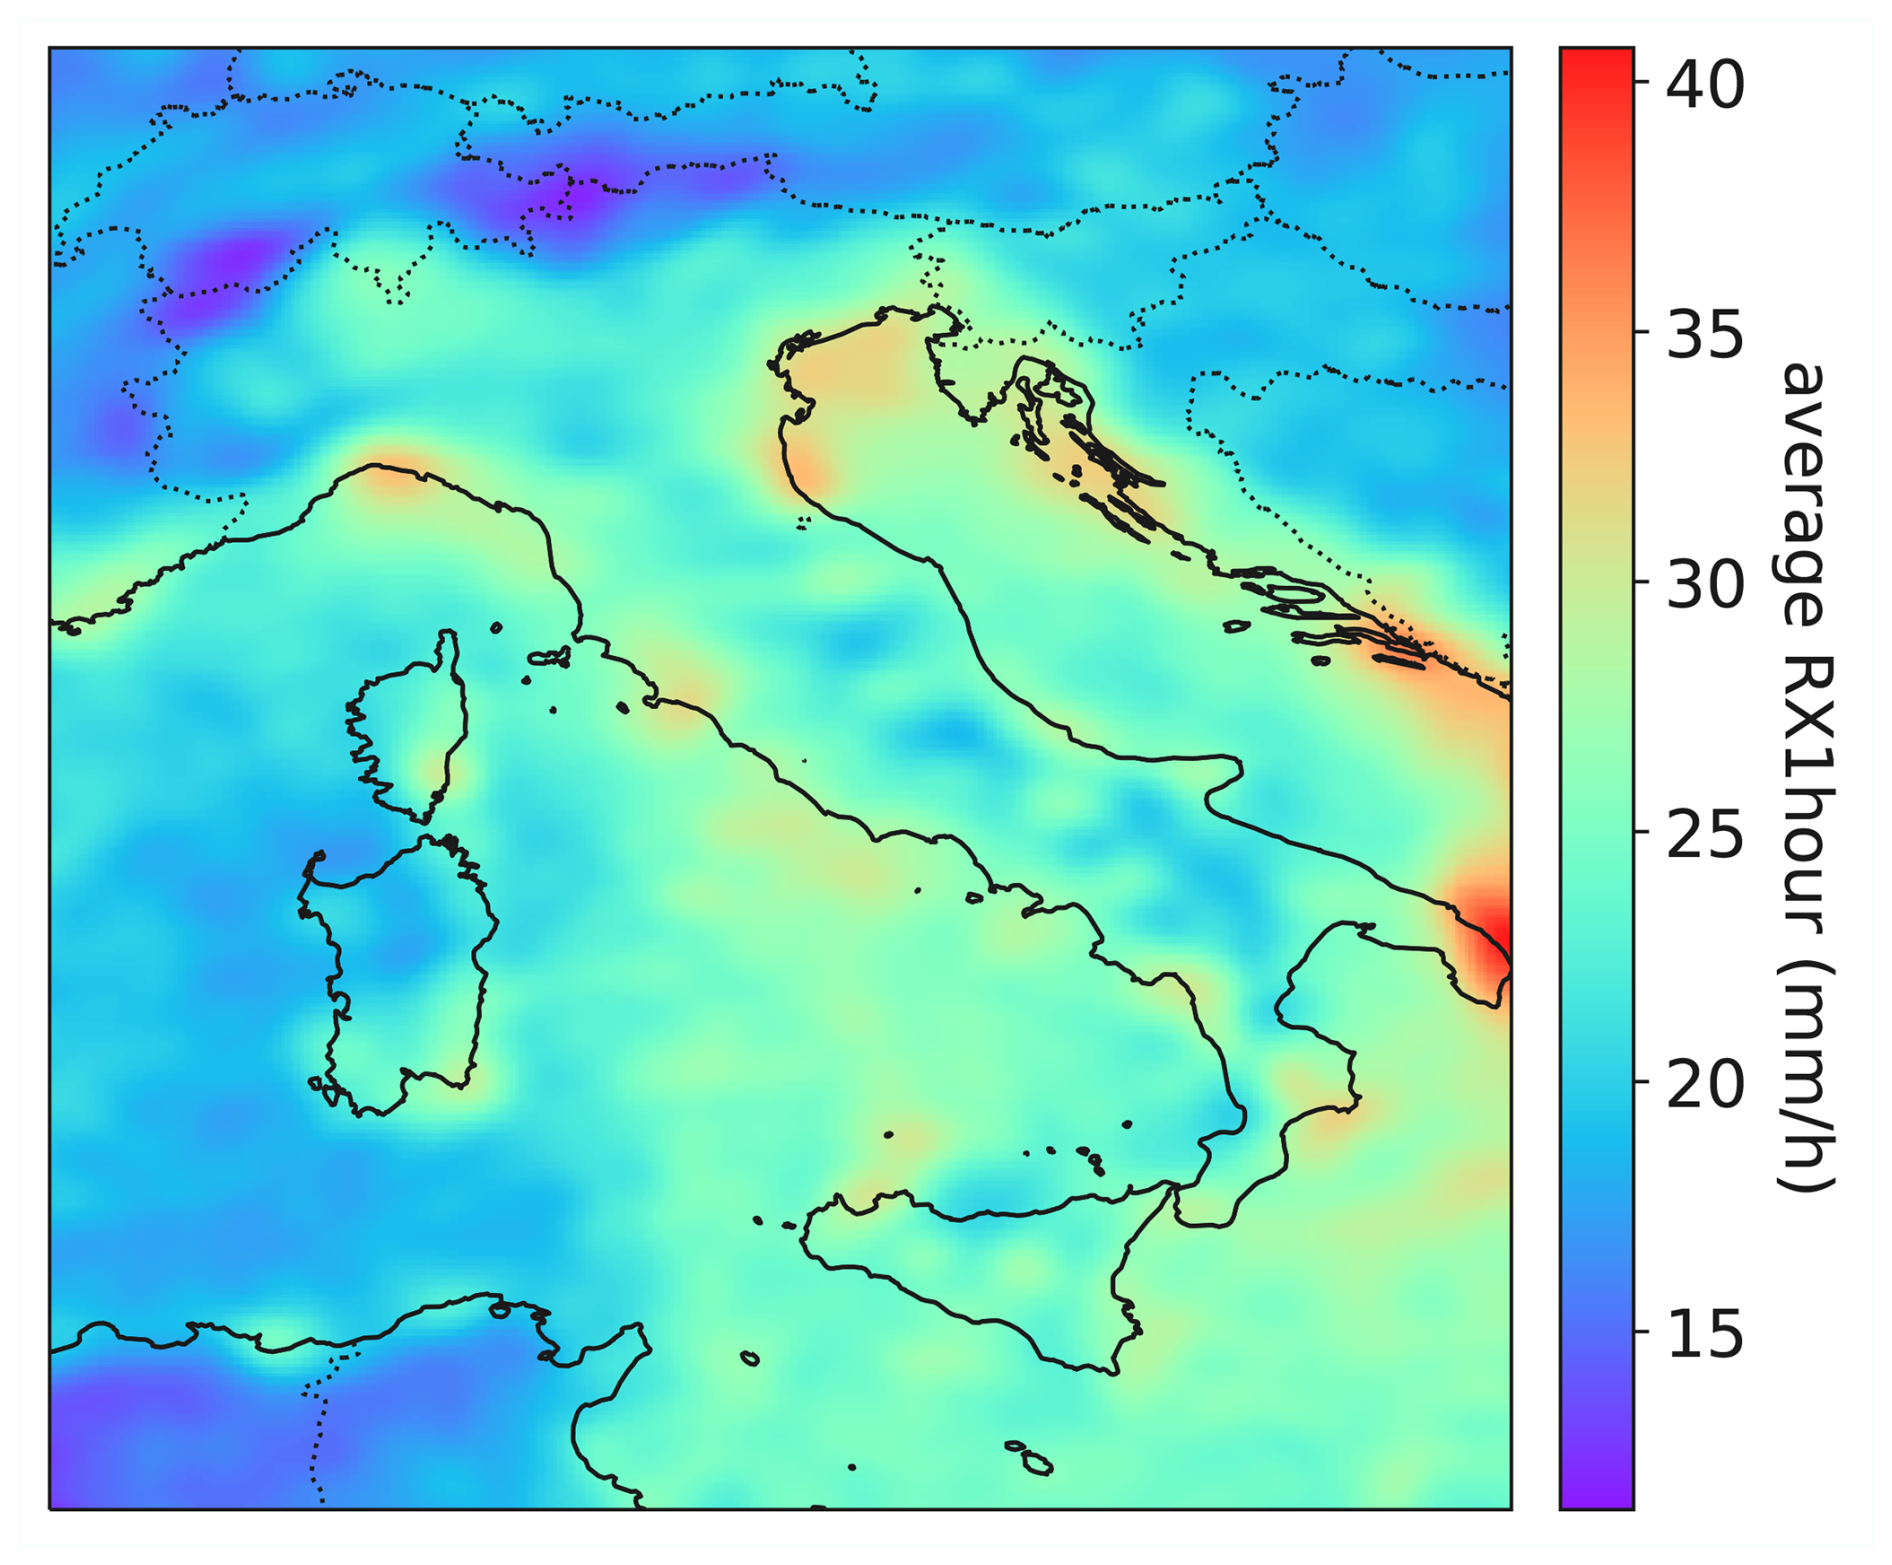
Figure 31986–2022 average of the annual maxima of hourly precipitation (RX1hour), after the application of a 20 km Gaussian filter.
Finally, a HPSS is identified as HPE if its maximum precipitation value (tp_max) exceeds the average RX1hour value in the position where it occurred (𝚕𝚊𝚝_𝚖𝚊𝚡,𝚕𝚘𝚗_𝚖𝚊𝚡). The selected HPEs can be interpreted as extreme precipitation events within a fixed-area (Eulerian) framework, which is more suitable for this study since no tracking of individual events is performed, unlike in a Lagrangian approach that follows storm structures over time (Ignaccolo and De Michele, 2010). In support of this interpretation, in Sect. 3.3 the local persistence of HPEs is investigated, showing that HPSSs exceeding the extreme threshold are typically short-lived, rarely persisting for more than one hour, thus aligning with the common use of “extreme event” terminology.
2.5 Hourly Precipitation Extremes statistics and trends
Extreme statistics are calculated within the subset of HPSSs classified as HPEs with the same methodology described in Sect. 2.3. Subsequently, the trends of the yearly series of N, MeanInt, PeakInt and SpatExtent are computed (results shown in Sect. 3.2). The similarity between N and wet-hour frequency (see Fig. S1) also applies to HPEs and their respective trends (figures not shown). Within each moving window, the trend analysis is performed using the Theil–Sen slope estimator (Sen, 1968), suitable for non-parametric data. The statistical significance of the trends is evaluated using the Mann–Kendall test (Mann, 1945; McLeod, 2005). To control for the multiple testing problem across the spatial domain, the False Discovery Rate (FDR) correction is applied (Benjamini and Hochberg, 1995; Wilks, 2006). Since the FDR procedure tends to be conservative in the presence of spatial correlation, approximately correct global results can be obtained by setting the FDR threshold to twice the desired global significance level (Wilks, 2016, 2019). Therefore, results are considered statistically significant if the FDR-corrected p-value is below 0.1, corresponding to a global significance level of 0.05. The results of the trend analysis are presented in the Results Sect. 3.3.
3.1 Hourly precipitation structures analyses
Before focusing on extremes, the overall patterns of HPSSs across the dataset are first examined, providing a broader climatological context to facilitate the interpretation of the subsequent results on extreme precipitation. The dataset consists of approximately 160 000 precipitation HPSSs per year over the period 1986–2022. The interannual variability, calculated as the relative standard deviation of the annual number of HPSSs, is around 10 %. At the seasonal level, the highest number of HPSSs is generally recorded in autumn (SON), accounting for 29 % of the total, while summer (JJA) shows the lowest share, with 21 %. Winter (DJF) and spring (MAM) contribute similarly, representing 26 % and 24 % of the total number of HPSSs, respectively. The fraction of hours showing no identified HPSSs across the entire domain varies seasonally, with approximately 11 % for winter, 12 % for spring, 9 % for summer, and 7 % for autumn. The number of HPSSs detected per hour follows the distribution of Fig. 4.
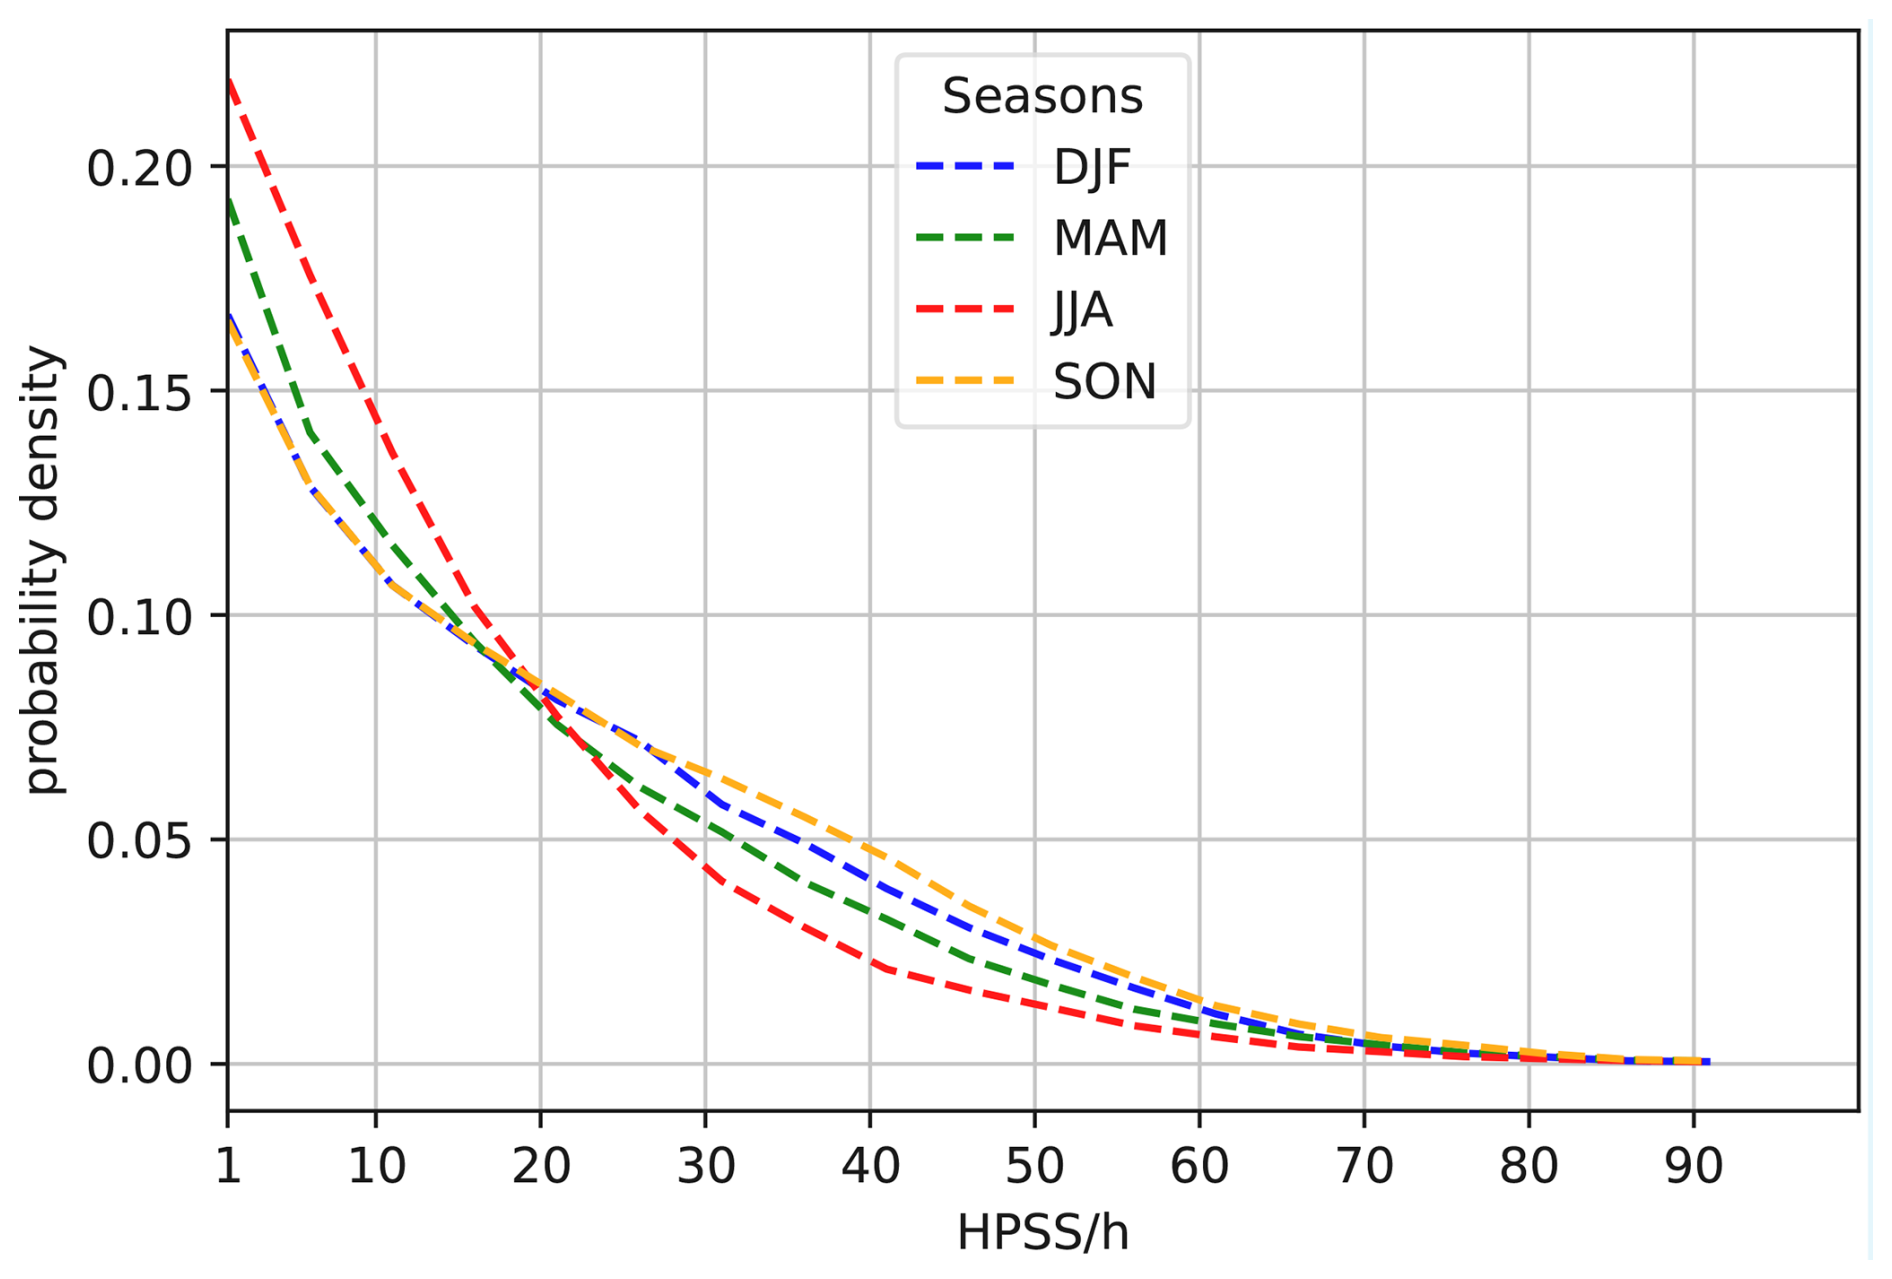
Figure 4Distribution of the number of HPSSs recorded per hour. Values are normalised by the total number of hours in each season (). Bin width: 5.
The maximum number of HPSSs recorded in a single hour is 136, observed at 14:00 UTC on 11 June 1992, as a result of a widespread low-pressure area associated with large quasi-stationary cyclone influencing the whole Italian peninsula. Intensity and spatial scale distributions exhibit markedly skewed shapes, with a sharp peak at low values followed by an approximately exponential decay as their magnitude increases (Fig. 5).
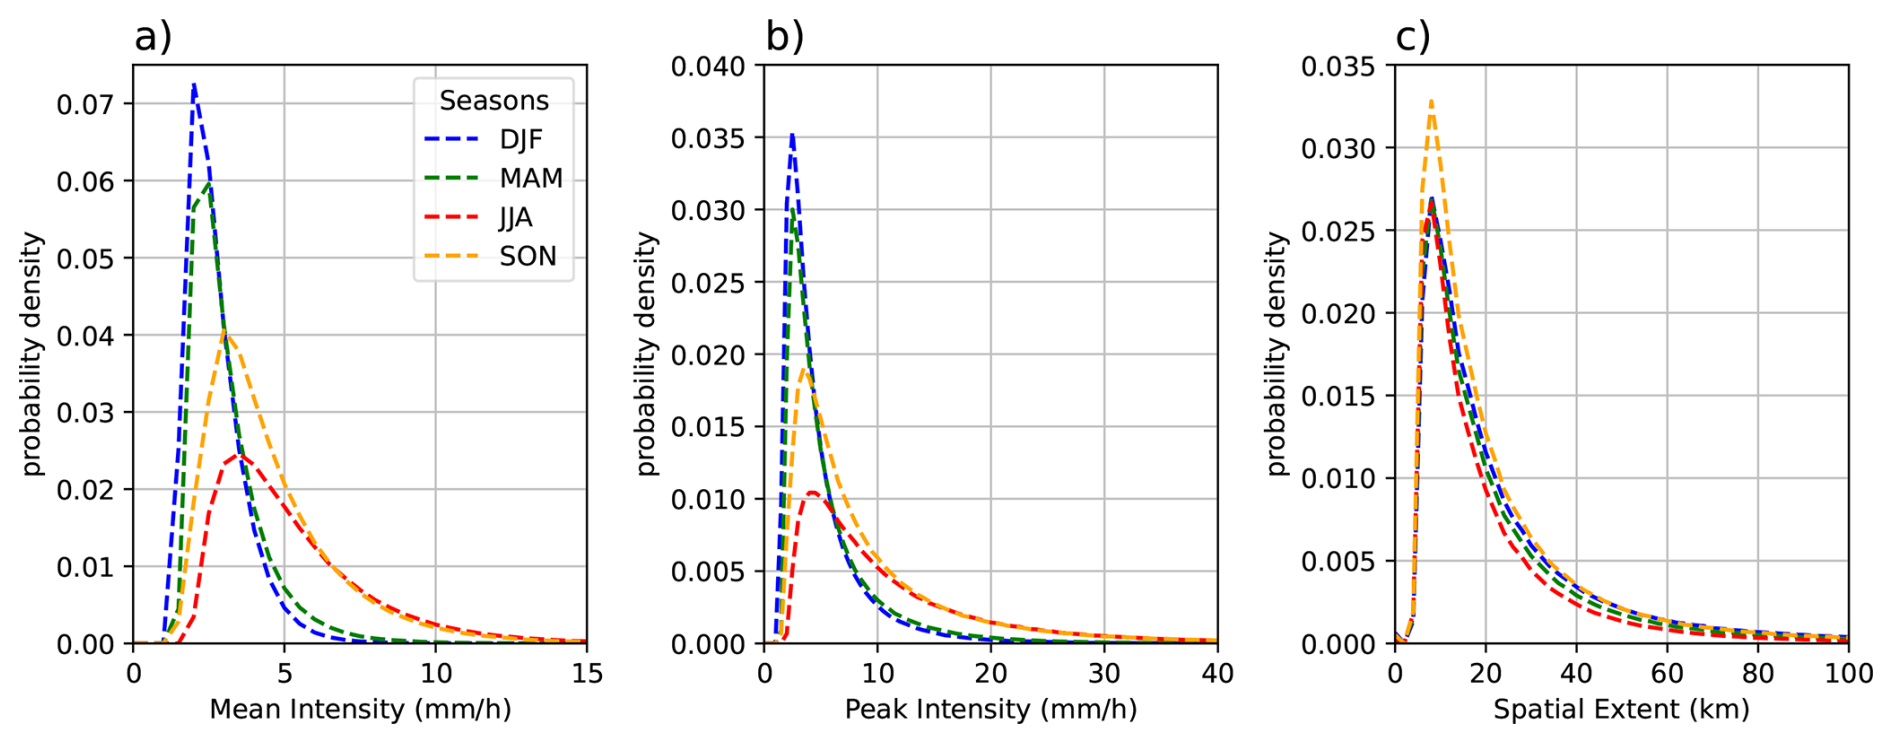
Figure 5Seasonal distributions of (a) mean intensity, (b) peak intensity, and (c) maximum linear spatial extent of HPSSs. Bin width: 0.5 mm for intensity variables, 2 km for spatial extent. Distributions are normalised by the total number of HPSSs; that is, the sum of the integral of the four seasonal distributions gives 1.
During summer and autumn, HPSSs tend to exhibit higher median values and heavier tails for both mean precipitation intensity (, Fig. 5a) and peak precipitation intensity (tp_max, Fig. 5b). The maximum linear spatial extent (max_extent, Fig. 5c) distributions show less pronounced seasonal variation, with only summer displaying HPSSs with a slightly smaller extent. A small percentage of HPSSs fall outside the range of the distributions plotted in Fig. 5: 0.22 % of HPSSs exhibit a mean precipitation intensity greater than 15 mm h−1, 0.96 % have a peak precipitation intensity above 40 mm h−1, and 2.98 % show a maximum linear extent larger than 100 km. According to definitions of atmospheric scales in the scientific literature (Thunis and Bornstein, 1996), phenomena with lifetimes ranging from about one hour to one day – such as isolated thunderstorms or groups of storms – typically occur within the lower portion of the mesoscale, with spatial extents from approximately 2 km up to 200 km. The results of HPSSs distribution analysis confirm that, at the hourly timescale, they generally fall within the meso-γ scale (2–20 km), with only occasional instances exhibiting larger spatial extents. This result is consistent with the fact that precipitation structures are extracted from a 4 km convection-permitting reanalysis precipitation field, which is capable of representing convection (Cavalleri et al., 2024) even if it may not fully resolve it at the smaller scales. This finding is particularly relevant for applications that require knowledge of the typical spatial scales of hourly precipitation, such as spatial analysis of precipitation fields (Fortin et al., 2018; Van Hyfte et al., 2023). In general, structures with smaller spatial extents tend to correspond to higher intensities (see Fig. S2 in the Supplement). Overall, the majority of HPSSs concentrate on low values of intensity and small spatial extents. This underscores the need to isolate the most extreme HPSSs to better understand their specific characteristics.
HPSSs are analysed using the methodology described in Sect. 2.3, resulting in seasonal maps of N (Fig. 6), SpatExtent (Fig. 7), MeanInt (Fig. 8) and PeakInt (not shown, see Supplement). Higher values in a given area indicate a greater number of HPSSs with their centre of mass located within that region (for N), or larger values of MeanInt, PeakInt and SpatExtent for those same HPSSs. HPSSs may extend beyond the boundaries of the window in which they are counted, since the averaging considers only the HPSSs whose centre of mass lies within the window. However, most of the recorded HPSSs are well delimited in a small space (Fig. 5c). It is also important to emphasise that these means are computed from distributions that are strongly right-skewed, as shown in Fig. 5. Consequently, the values presented in the maps should be interpreted with some caution. While they may not fully capture the absolute characteristics of typical HPSS intensity and spatial extent, they are informative when used to explore spatial and seasonal patterns and their relative differences.
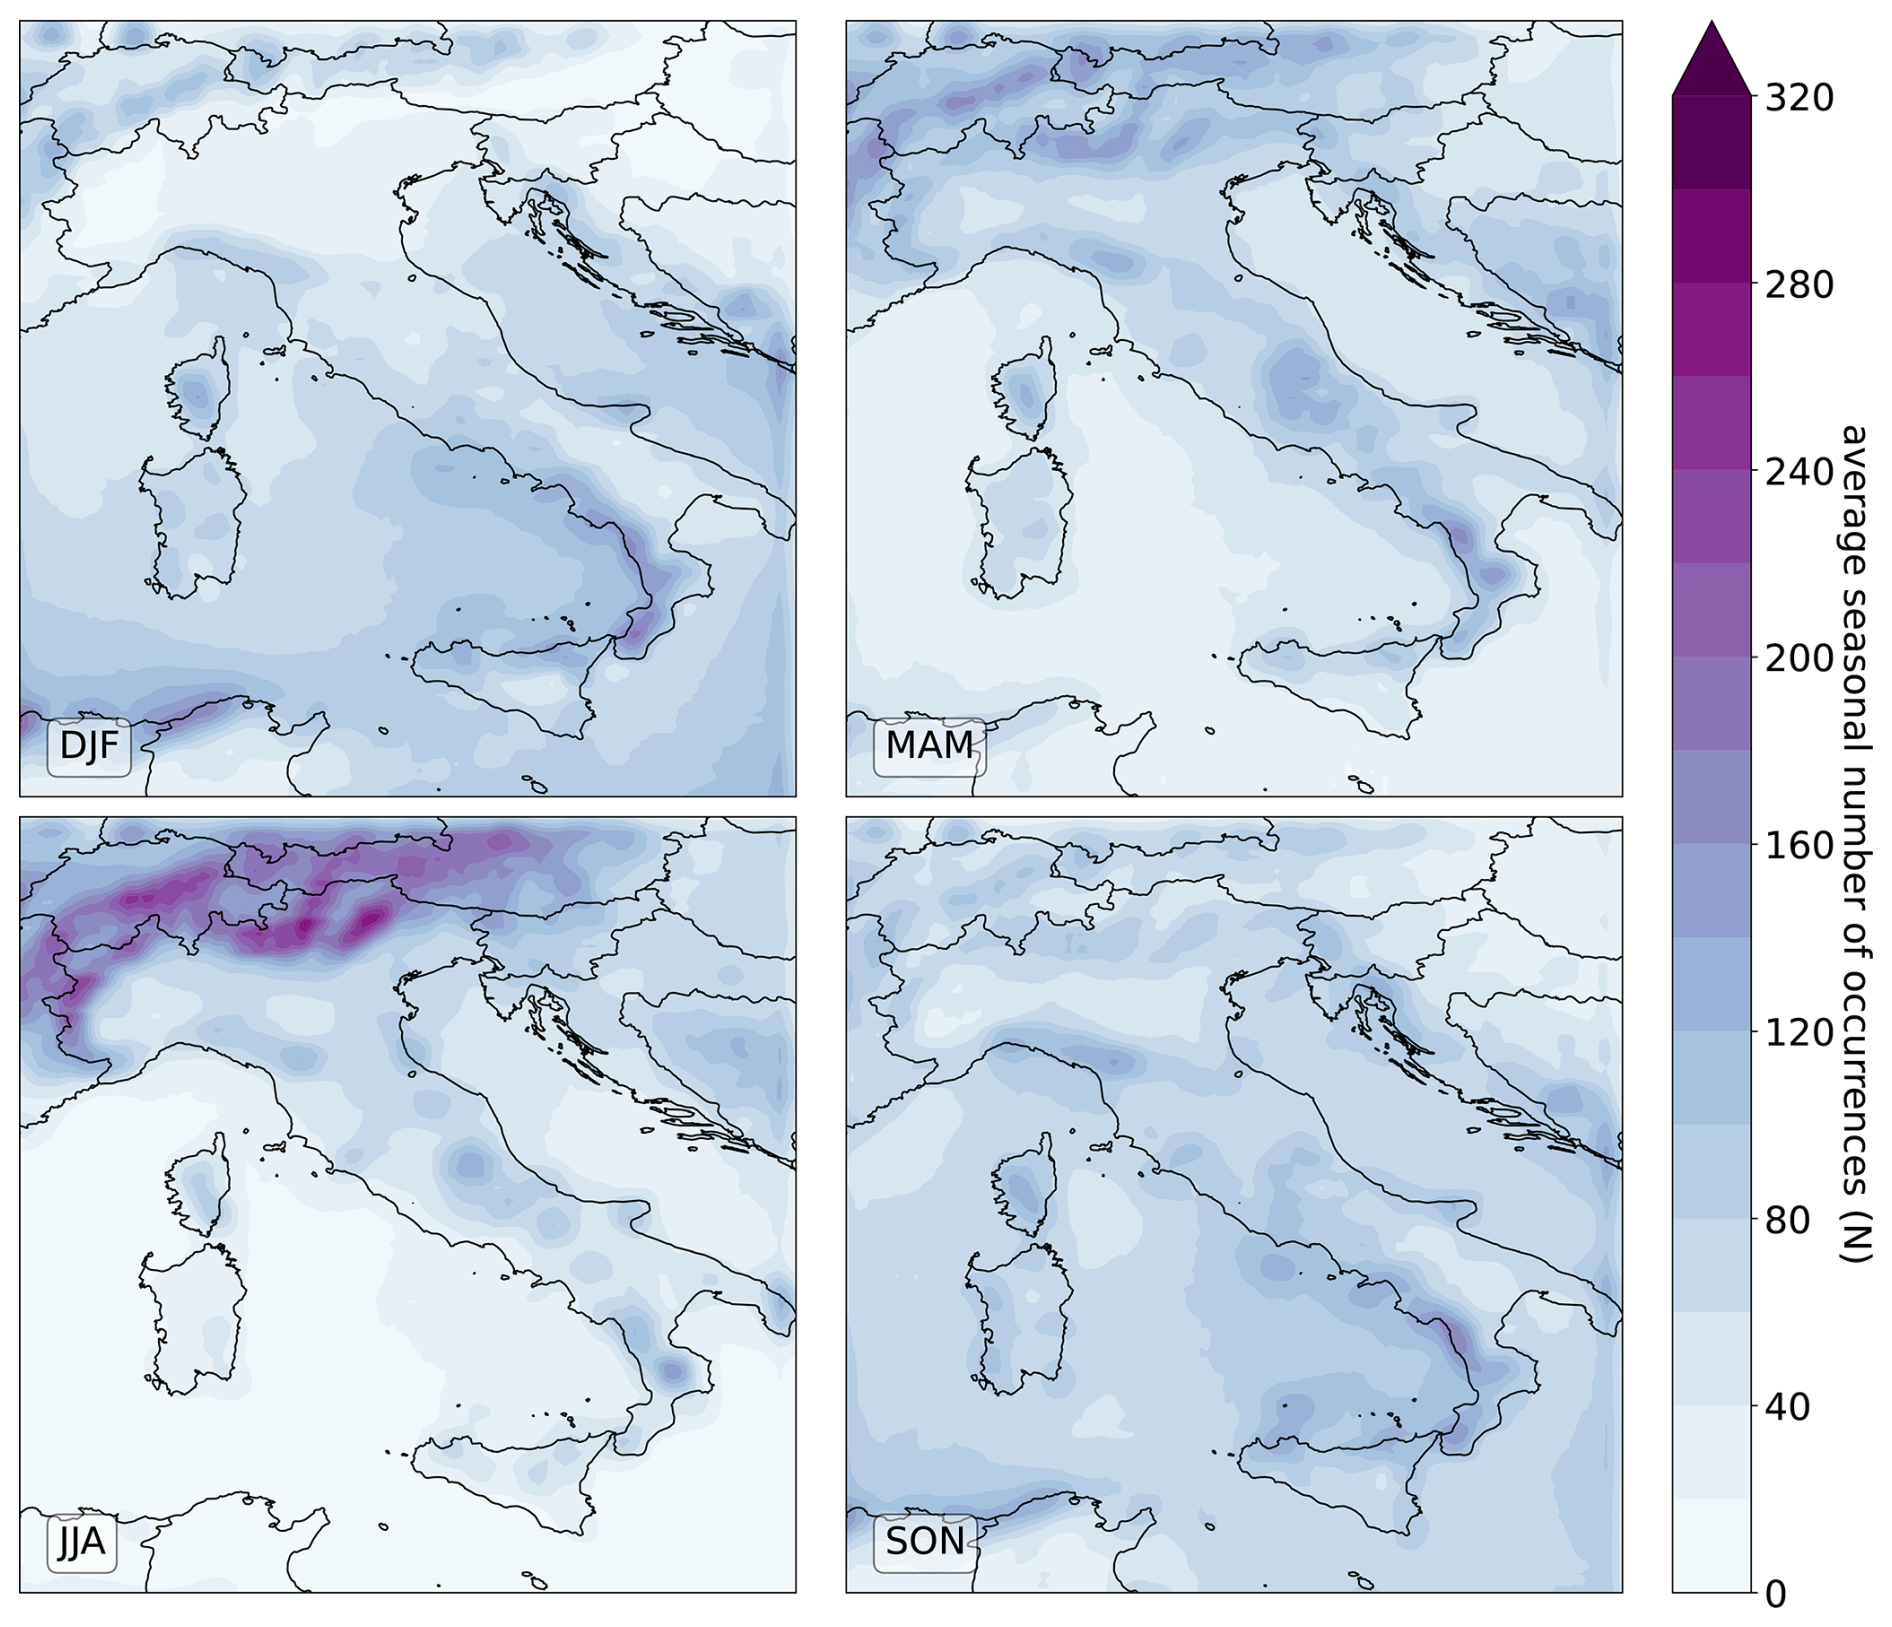
Figure 6Seasonal map of N occurring within the 0.5×0.5 windows (step size 0.1), averaged over the period 1986–2022.
Figure 7Seasonal map of SpatExtent of the HPSSs occurring within the 0.5×0.5 window (step size 0.1), averaged annually over the period 1986–2022.
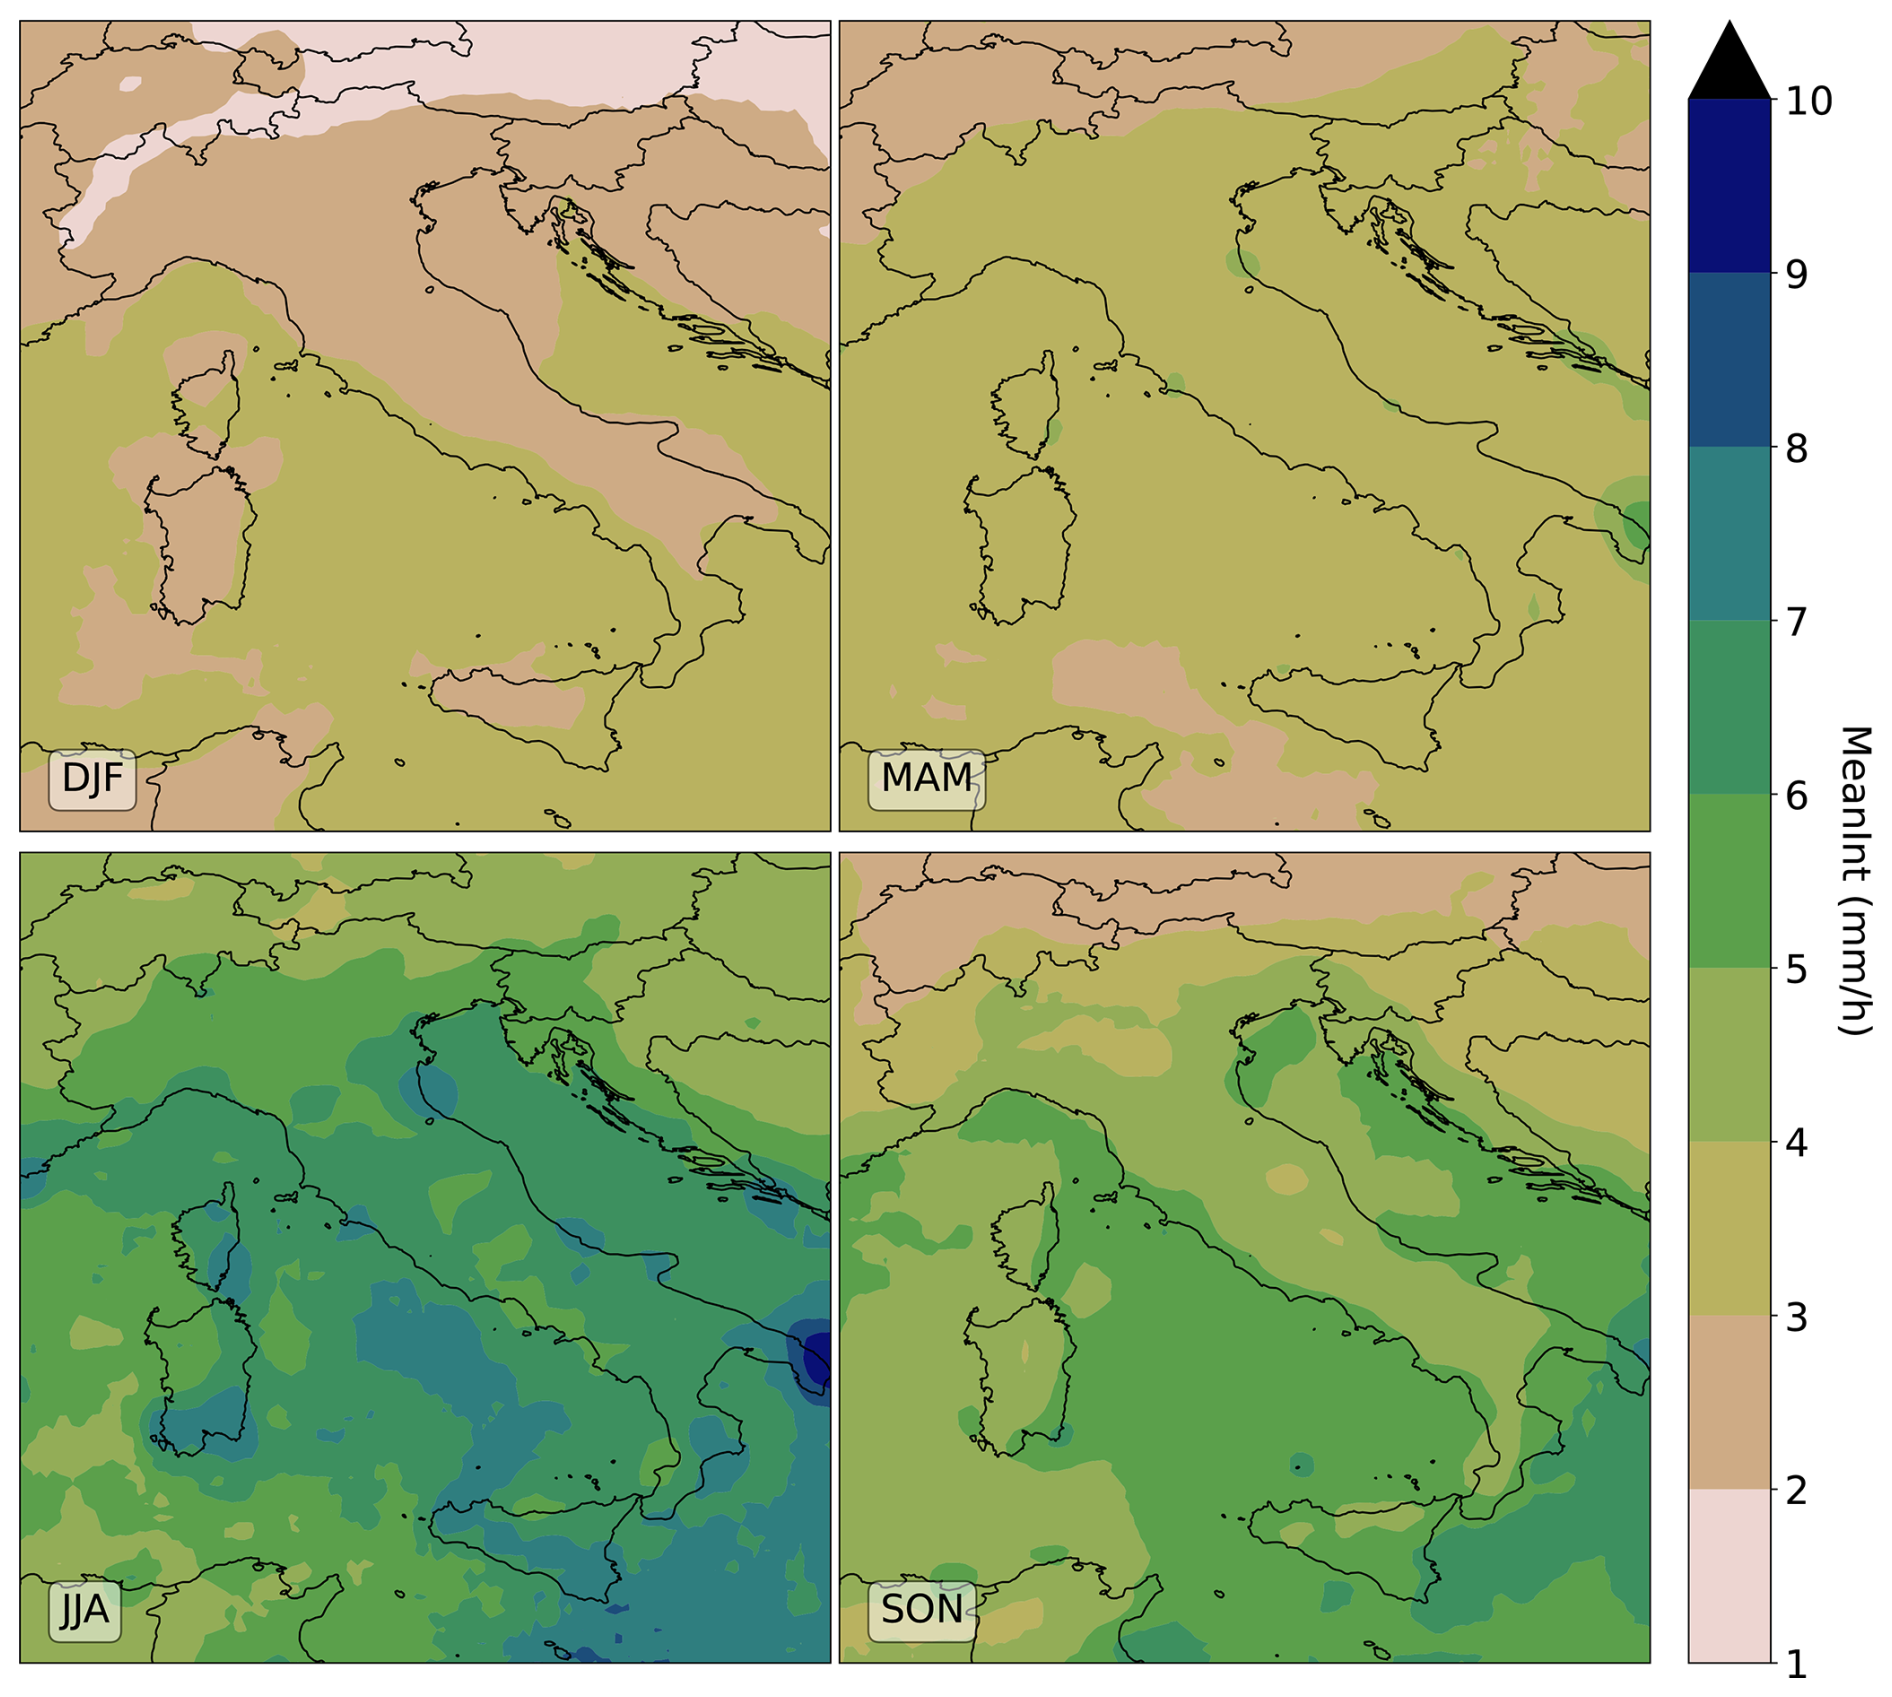
Figure 8Seasonal map of MeanInt of the HPSSs occurring within the 0.5×0.5 window (step size 0.1), averaged annually over the period 1986–2022.
The spatial distribution of N (Fig. 6) shows that, in summer, most of the HPSSs occur in the Prealpine regions, with secondary hotspots along parts of the Apennines, and almost no HPSSs over the sea. In autumn and winter, the areas with high N shift toward coastal and offshore areas, particularly along the Tyrrhenian and Ligurian seas. During spring, the Prealps and Apennines are again prominent, although the occurrences are generally lower than in summer. The Po Valley and Prealpine region exhibit very low N during the winter season. These seasonal patterns reflect the typical climatology of convective precipitation in Italy, which tends to be more frequent during the warmer months and over mountainous regions and coastal areas (Lombardo and Bitting, 2024).
The seasonal maps of SpatExtent (Fig. 7) reveal that during summer HPSSs have generally smaller extents, with typical average SpatExtent ranging between 10 and 20 km, especially along coastal areas and in southern Italy, and from 20 to 30 km in the other Italian areas. This is consistent with the convective nature of summer precipitation. Spring shows slightly larger SpatExtent, but still below 30 km over the Prealps and in southern regions, where autumn also displays similar values, despite showing larger ones over plain areas in the north and central Italy. In contrast, winter is characterised by generally larger HPSSs, especially over the Po Plain, where average SpatExtent commonly reach 50 km, exceeding values registered over the Alps and Apennines. This broader extent reflects the influence of large-scale synoptic systems typical of wintertime precipitations over Italy. Overall, these patterns highlight a seasonal modulation in SpatExtent, reflecting the shift from localised convective activity in summer to more widespread, synoptic-driven precipitation in autumn and winter.
The spatial distribution of MeanInt (Fig. 8) highlights summer as the season with the highest average intensities, often exceeding 5 mm h−1 with maxima of more than 7 mm h−1 in some areas along the Adriatic coast, such as Calabria, the Tyrrenian sea, southeastern parts of the islands and southern Apulia. In winter, intensities generally range between 2 and 3 mm h−1 over most of the peninsula, dropping below 2 mm h−1 along the Alpine arc and exceeding this value only slightly in some southern areas and along the Tyrrhenian coast. During spring, values between 3 and 4 mm h−1 are widespread throughout Italy, except for isolated spots over 4 mm h−1 in similar areas to those observed in summer. In autumn, slightly higher intensities, ranging from 4 to 5 mm h−1, cover most of the country, while lower values persist mostly in the Prealpine and Alpine regions. Intensities above 5 mm h−1 are found mainly along the coastal areas and over the surrounding seas.
The seasonal patterns of PeakInt (Fig. S3 in the Supplement) closely resemble those for MeanInt, although PeakInt are generally higher. PeakInt increases from winter values ranging between 2 and 7 mm h−1 to well over 15 mm h−1 during summer, with spring and autumn showing intermediate values. Notably, in autumn, PeakInt exceeding 10 mm h−1 are mostly confined to coastal areas and the surrounding seas. In summer, PeakInt surpasses 17 mm h−1 in the same regions characterised by high summer MeanInt (Fig. 8).
Since it is not straightforward to determine the extent to which the seasonal differences in those maps are influenced by the use of seasonally varying thresholds for HPSS selection, a set of corresponding figures derived from the dataset built using a fixed 1 mm threshold is provided in the Supplement (Figs. S4–S7). These figures display very similar spatial patterns, albeit with generally lower intensity values. This suggests that the observed seasonal differences primarily reflect the signal of the model rather than artefacts introduced by the clustering method. Overall, these results are consistent with the established climatology of the region (Crespi et al., 2018; Giordani et al., 2025). However, while MeanInt and PeakInt seasonal maps appropriately reflect higher values during the autumn and summer seasons, they also show some regions with unrealistically high precipitation. This overestimation of summer precipitation has been previously documented through comparisons with observational precipitation fields in earlier studies (Cavalleri et al., 2024) (Giordani et al., 2025). This issue will be examined in greater detail in the Discussion Sect. 4.
3.2 Hourly Precipitation Extremes analyses
A subset of the dataset HOPSS-X is obtained (according to Sect. 2.4) to gain insight into the HPEs patterns and tendencies. This resulted in approximately 4.8 % HPSSs selected as HPEs, corresponding to an average of around 7800 HPEs per year across the whole domain, with a notable interannual variability of about 30 %. Most HPEs are selected from summer (11 % of all summer HPSSs) and autumn (7 %), while only a marginal fraction is identified in spring (1.5 %) and winter (0.5 %). This seasonal breakdown results from the combined effect of higher thresholds applied for HPSS identification during summer (Fig. 1), which selected relatively intense HPSSs even within the full dataset for that season, and the use of a fixed threshold (average RX1hour) for HPE selection throughout the year. The greater number of HPEs in summer and autumn is also consistent with the expectation that hourly precipitation more effectively captures extremes and their associated impacts at smaller spatial scales, such as convective storms and other meso-γ scale phenomena, particularly prevalent during the warmer seasons. Consequently, Sect. 3.2 and 3.3 focus exclusively on summer and autumn precipitation extremes.
A comparison between the distributions of intensity and spatial scale within the HPEs subset (Fig. 9) and those from the full dataset (Fig. 5) confirms that the applied filter effectively excludes a substantial number of HPSSs from the lower tails of the distributions. This effect is quite obvious for the peak intensity, which is explicitly used as the filtering parameter. However, it also significantly influences the distribution of mean intensity, suggesting that, on average, HPEs are not only more intense locally but also tend to have higher mean values. Moreover, the spatial extent distributions are shifted towards larger values. Summarising, the applied filtering leads to the exclusion of a large fraction of small and weak HPSSs, not meaningful for the HPEs analysis.
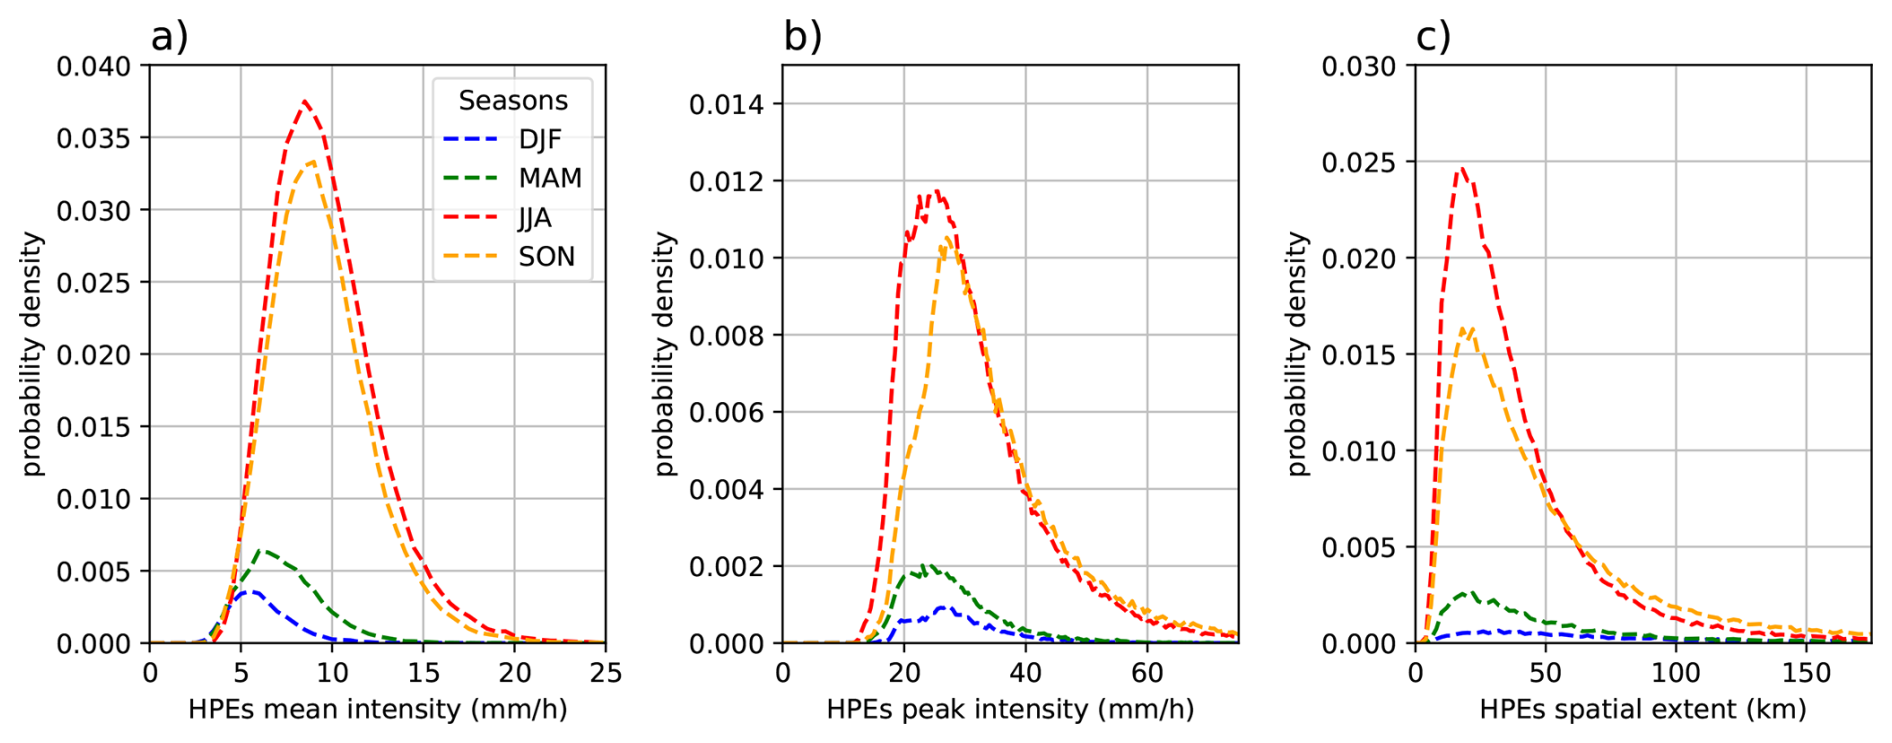
Figure 9Seasonal distributions within the HPEs subset: (a) mean intensity, (b) peak intensity, and (c) maximum linear spatial extent of HPEs. Distributions are normalised by the total number of HPEs; that is, the sum of the integral of the four seasonal distributions gives 1. Binning as in Fig. 5.
The climatological seasonal maps of N within the HPEs subset (Fig. 10) highlights clear seasonal differences between summer and autumn.

Figure 10JJA and SON maps of HPEs occurrences (N) within the 0.5×0.5 window (step size 0.1), averaged annually over the period 1986–2022.
In summer, HPEs occur predominantly over mountainous areas, particularly the Alps and some spots along the Apennines, and Calabria, reaching 20 to 30 HPEs per 0.5° grid window per year. In contrast, coastal and marine regions display a significantly lower N, often fewer than 3 per window per year. In autumn, N is substantially less compared to summer. However, a clear spatial shift emerges: mountain areas experience fewer to none HPEs, while coastal and marine zones see some, with over 7 occurrences per window per year observed along many stretches of coastline. The seasonal redistribution is likely driven by the persistence of warm sea surface conditions beneath a cooler atmosphere, creating conditions favourable to convection and sustaining intense precipitation activity into autumn. (Cheng et al., 2022; Argüeso et al., 2024).
Marked differences between summer and autumn also emerge in terms of SpatExtent (Fig. 11). In summer, HPEs rarely exceed 50 km in size, except in limited areas such as Friuli (North-East) and South Switzerland, and remain well below 20 km across much of southern Italy and the islands. Conversely, in autumn, significantly larger HPEs (exceeding 100 km in spatial extent) are frequently observed. Spatial extents remain small mainly in the south, along the Adriatic coast, and over the islands. This suggests that HPEs are typically small, convective systems during summer across most of the Italian territory, and during autumn along the southern coastlines. In contrast, in northern Italy and neighbouring regions, autumn HPEs are more frequently associated with larger-scale systems.
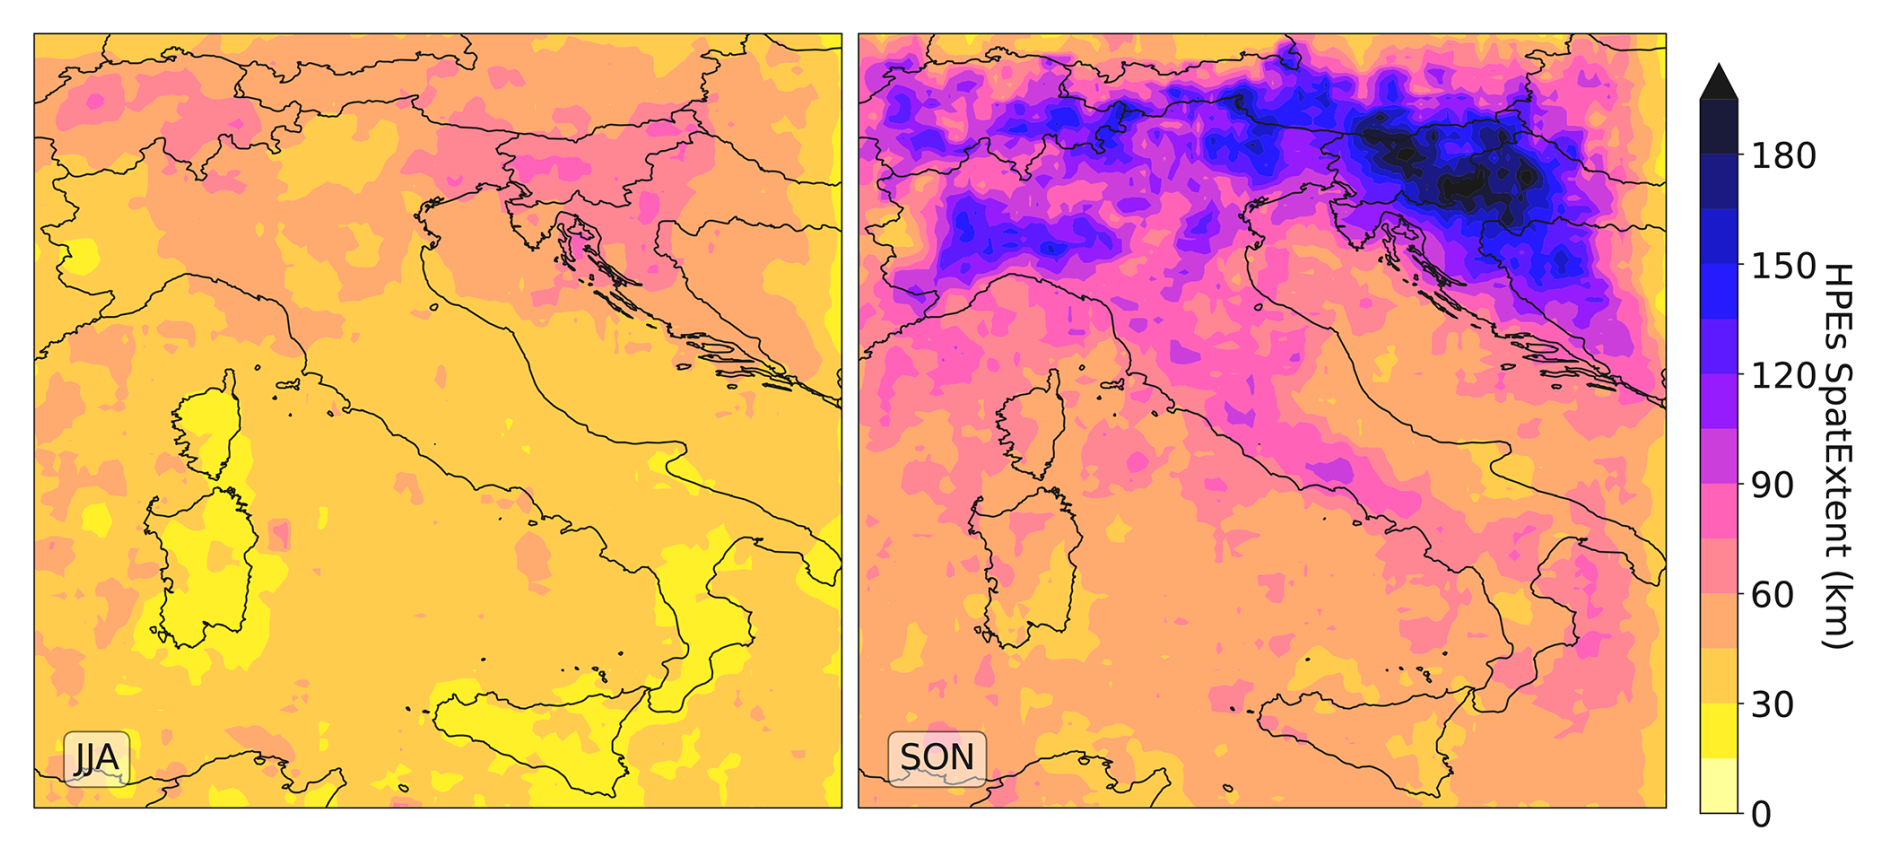
Figure 11JJA and SON maps of SpatExtent of the HPEs occurring within the 0.5×0.5 window (step size 0.1), averaged annually over the period 1986–2022.
The climatological maps for the MeanInt and the PeakInt of HPEs are provided in the Supplement (Figs. S8 and S9). Overall, their spatial patterns closely resemble those observed for the full dataset, though with generally higher values, due to the filtering, which also reduces the seasonal differences. Specifically, the MeanInt range from approximately 5 to 15 mm h−1, increasing from the Alpine regions to southern Italy for both seasons, while the PeakInt range from 20 up to 50 mm h−1, with the lowest values again found over the Alps and the highest values concentrated in the same hotspots highlighted before, such as the southern Apulia.
3.3 Hourly Precipitation Extremes trends
Finally, given the context provided by the previous results, a trend analysis within the subset of HPEs is conducted, following the methodology outlined in Sect. 2.5. Significant trends in the number of HPEs occurrences (N) during summer and autumn are detected (Fig. 12). Trends are expressed as percentages relative to the seasonal and local mean values of N (i.e., normalised by the values shown in Fig. 10). For example, a 10 % trend in Fig. 12 means a decadal increase of 10 % in N, indicating that, on average in that area, approximately 30 % more HPEs occur at the end of the study period compared to its beginning. Overall, a general increase in HPEs occurrences is detected across the peninsula, even though only some regions exhibit statistically significant trends.
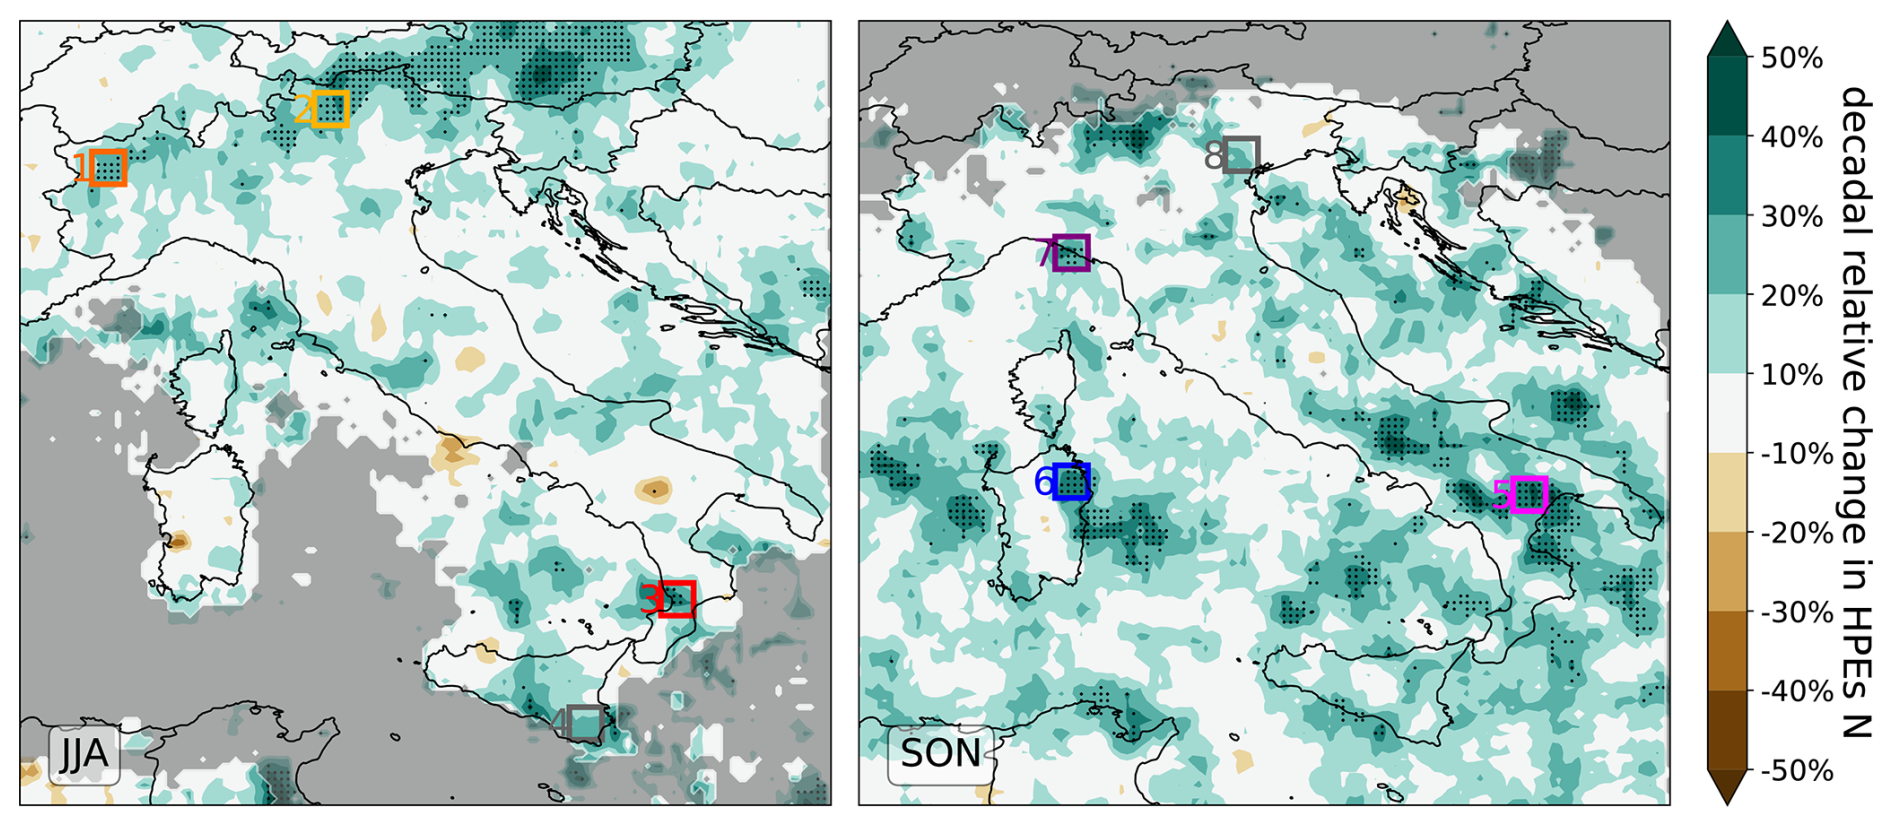
Figure 12Maps of the significant decadal relative trends in the number of Hourly Precipitation Extremes (HPEs) occurring within each 0.5°×0.5° window (sliding step: 0.1°) for summer (JJA) and autumn (SON). Black dots indicate statistically significant trends. Areas with more than 10 years without HPEs are masked in grey. The four colored boxes for each season highlight the regions used to extract the time series shown in Fig. 13.
In summer, a significant increase of approximately 20 % to 30 % per decade is detected across several Alpine and Prealpine regions, and in some parts of Calabria. In autumn, significant trends are primarily concentrated over the southern Apennines, and various coastal and sea areas, such as Ligurian eastern coast, the eastern coast of Sardinia, the southern Adriatic Sea, and the Ionian Sea. Individual series of some selected areas (specifically, inside colored 0.5 degree boxes of Fig. 12) are extracted to visualise the HPEs annual occurrences along with the detected trends (Fig. 13). In summer, trends ranging from 10 % to 40 %, depending on the region, correspond to an increase of 2 to 6 HPEs per decade. In autumn, comparable percentage changes are associated with a smaller increase of 1 to 2 HPEs per decade. In both seasons, some regions also display positive trends that are not statistically significant (e.g., boxes 4 and 8 in Figs. 12 and 13), likely due to high interannual variability that dominates the signal.
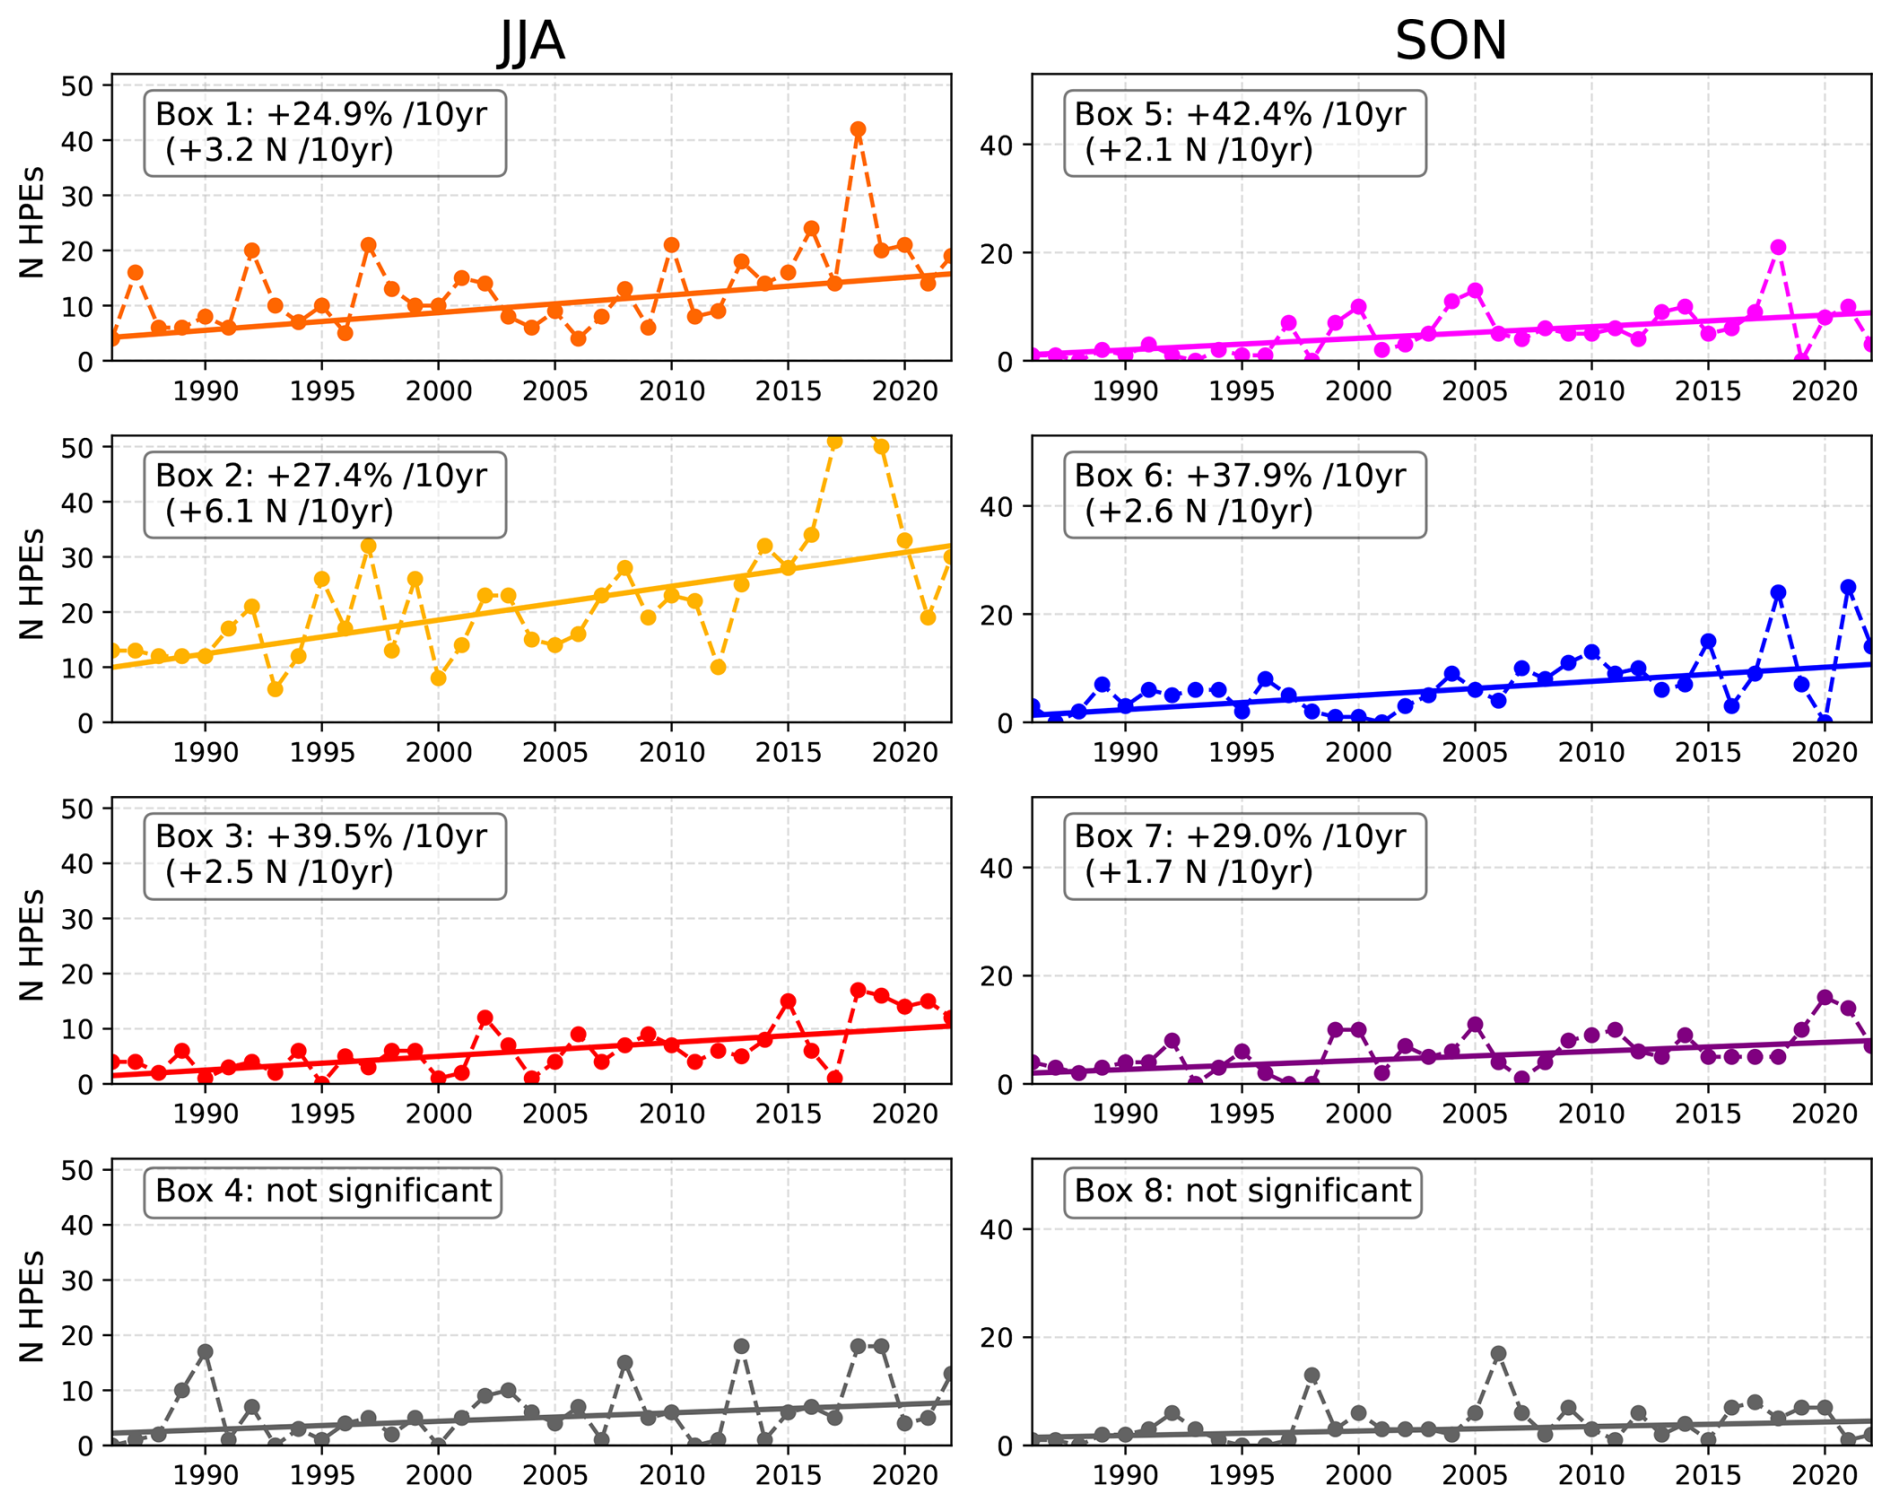
Figure 13Time series of the annual N of HPEs within the colored windows in Fig. 12. The left column shows the summer (JJA) series, while the right column displays the autumn (SON) series. Trend lines are plotted for each series, and the corresponding decadal trends are reported. Grey (last row) plots denote non-significant trends.
Trends are also computed for the SpatExtent, MeanInt, and PeakInt of HPEs (see Figs. S10–S12 in the Supplement, respectively). Overall, only weak trends (below 10 % per decade) are observed, primarily over land points in summer and over some marine areas in autumn, showing spatial heterogeneity in the sign of the signal with a slight tendency toward increasing intensities and decreasing spatial scales. However, none of these trends is statistically significant at any location. This suggests that the detected increase in N is potentially driven by an underlying intensification of extreme precipitation that, while not statistically significant in MeanInt or PeakInt, results in more frequent exceedances. Owing to its lower noise sensitivity, the metric N allows these changes to emerge more clearly and to reach statistical significance.
Trend estimates could be biased by potential double-counting of temporally persistent HPEs, as the analysis is conducted at hourly resolution. To address this, an additional analysis quantifies HPEs persistence, defined as the number of consecutive hours during which an HPSS exceeds the local average RX1hour threshold within the same window.
Results (Fig. 14) show that persistence exceeds one hour only marginally in most regions, with average persistence values above 1.5 h limited to a few localised areas expecially during autumn, such as the Ligurian Gulf, where persistent mesoscale convective systems are more common (Cassola et al., 2016), and in parts of eastern Sardinia and southeastern Sicily, where prolonged convective activity can occur (Forestieri et al., 2018). These findings support the overall temporal isolation of most HPEs and suggest that the impact of double-counting on trend estimates remains limited.
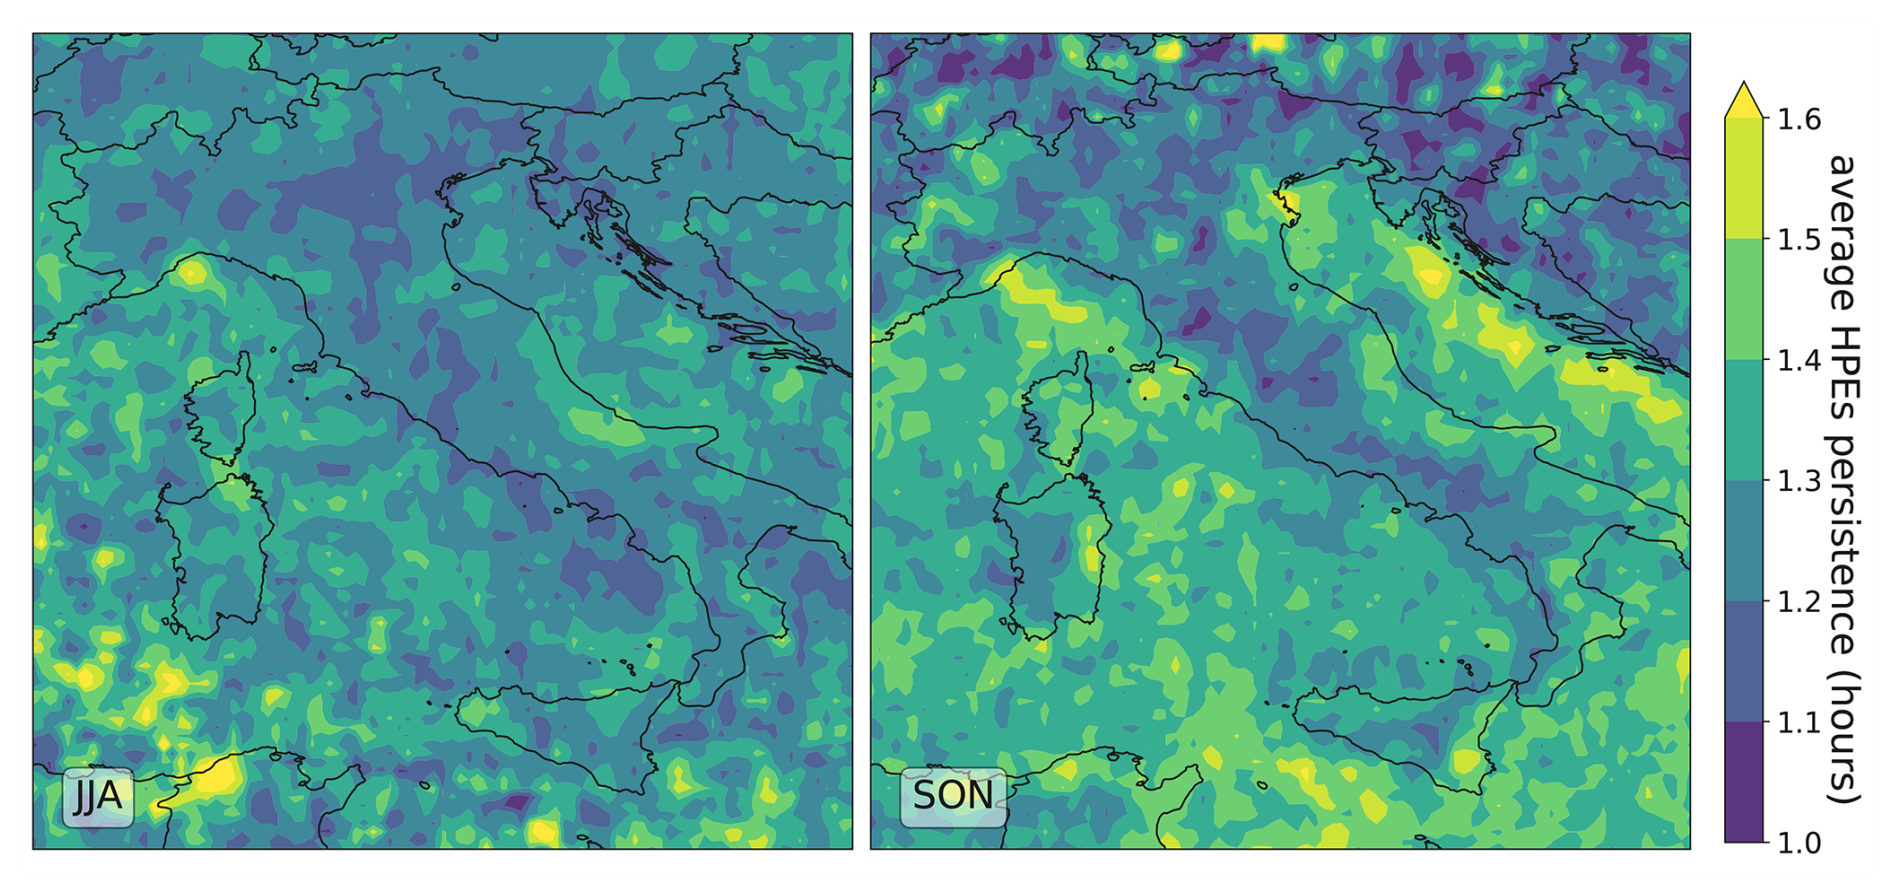
Figure 14Seasonal (JJA and SON) maps of the average HPEs persistence (expressed in hours) occurring within the 0.5×0.5 window (step size 0.1).
In understanding the results of this work, it is important to underline the uncertainties in analysing signals from hourly precipitation as represented by MERIDA HRES. First, while this 4 km model can explicitly represent convective processes (Viterbo et al., 2024; Cavalleri et al., 2024), it may not fully resolve all aspects of these phenomena. For the purposes of this study, however, the HPSS isolated from MERIDA HRES hourly fields resulted consistent with the spatial scales under investigation (Thunis and Bornstein, 1996) and allows for a characterization of hourly precipitation patterns, even if some sub-grid aspects of convection may not be fully captured.
Then, an overestimation of summer precipitation is present, which has also been documented in previous studies (Cavalleri et al., 2024). The areas exhibiting very high HPSS intensities, as shown in Fig. 8, are highly localised and often occur near the coasts. This behaviour may be associated with a less accurate estimation of skin temperature at the land-sea interface due to the interpolation of skin temperature from the coarse ERA5 domain to the finer-resolution MERIDA HRES domain. Overestimation of skin temperature may occur at certain points along the coastlines, leading to high values of latent heat flux. In particular meteorological conditions associated with convective instability, this may exacerbate convection, resulting in an overestimation of precipitation amounts.
However, it is important to notice that these biases are temporally stable and do not coincide spatially with the areas showing significant HPSs increases. Another aspect to consider is the deviation of MERIDA HRES annual precipitation trends from observational ones (Cavalleri et al., 2024). The average deviation over Italy has been quantified at approximately 4 % for decade. This value is not negligible, but relatively small if compared to the 10 % to 40 % increases found in HPEs occurrences. Althought these quantities are not directly comparable, as they refer to different precipitation characteristics and temporal scales, they qualitatively provide the potential magnitude of bias, indicating that the impact on the detected HPE trends is limited. Moreover, the regions where this discrepancy is more marked (see supplementary material of Cavalleri et al., 2024) do not overlap with those in which significant trends in HPEs occurrences have been found. In principle, such biases could have masked decreasing trends in those areas; however, the overall spatial pattern suggests that this scenario is highly unlikely.
The increasing trends in hourly HPEs identified in this study for the period 1986–2022 align with several previous research efforts based on both sub-daily and daily extreme precipitation observations across Italy and its specific regions. In particular, Mazzoglio et al. (2025) reported positive trends in the same Prealpine area analyzed here, based on the RX1hour index, largely attributed to summer convective activity. At a regional scale, Dallan et al. (2022) examined extreme precipitation trends from 1991 to 2020 by separating storm intensity and occurrence frequency, attributing the observed increases in the Eastern Alps to a growing proportion of sub-daily convective storms during summer. Similarly, Persiano et al. (2020) found a generalized increase in both the frequency and intensity of sub-daily extreme rainfall over the Apennines in Emilia-Romagna (northern Italy) for the 1961–2015 period. Moreover, Pavan et al. (2017), using a daily gridded precipitation dataset for the north and central Italy covering 1961–2015, reported significant positive trends in the 90th percentile of daily precipitation across most of the Alpine area and the northern Po Valley during summer, also supporting the idea that summer and autumn are the seasons most affected by precipitation changes. In autumn, some of the hourly HPEs trends detected in this study agree with findings by Capozzi et al. (2023), who, based on daily station data for the 2002–2021 period, documented an increasing tendency in both the intensity and frequency of heavy rainfall events in inland Campania. Additionally, the autumnal trends over the central Prealps are in line with the results of Pavan et al. (2017), who also reported significant increases in daily precipitation extremes over the Alps during autumn. Some of these studies adopt percentile-based definitions of extremes; although not directly comparable to Rx1hour in absolute terms, they are nonetheless consistent in documenting a strengthening of intense precipitation across Italy. This kind of local evidence provides an important observational context that supports the reliability of some of the signals identified through the present reanalysis-based approach.
This study employs hourly precipitation fields from the convection-permitting MERIDA-HRES reanalysis to investigate the characteristics of hourly precipitation spatial structures, with a focus on the extremes and their temporal evolution over the period 1986–2022. This approach yields a twofold outcome. First, it enables the construction of the HOPSS-X dataset, an archive in which nearly 6 million precipitation structures are described by a set of intensity and spatial characteristics. Second, a method is proposed to facilitate the description of hourly precipitation patterns, and, by isolating the most extreme subset, to detect statistically significant trends in the occurrence of hourly extremes.
In summer, increasing trends in HPEs occurrences are detected over several Alpine and Prealpine regions as well as in parts of Calabria. In autumn, the most prominent trends emerged over the southern Apennines, over the central Prealps, and several maritime regions, including Ligurian eastern coast, the eastern coast of Sardinia, the southern Adriatic Sea, and the Ionian Sea.
The results obtained in this work represent an additional perspective within the ongoing and complex debate on precipitation trends in Italy, even with full awareness of some of the limitations of reanalysis datasets. Spatial uncertainty of MERIDA HRES reanalysis was addressed through a structure-based approach, which allowed the identification and subsequent spatial aggregation of HPSSs using moving windows, with the intent of reducing the impact of spatial misplacement errors. The results were also interpreted in light of some known and documented local biases of the reanalysis, such as the systematic – thought constant – overestimation of convective precipitation in some areas and local deviations between modelled and observed trends at longer timescales. The areas where statistically significant trends in the occurrence of HPEs are detected generally did not overlap with these of such inconsistencies, supporting the robustness of the results.
The comparison with previous works on precipitation trends and extremes, based on observational data at both daily and sub-daily timescales, supports the robustness of the results presented in this work. In particular, the consistency observed across different studies strengthens the evidence of increasing occurrences of HPEs over specific regions of Italy during summer and autumn.
Future developments may involve leveraging the dataset HOPSS-X to explore additional characteristics of hourly precipitation structures, such as their dominant propagation direction and potential associations with changes in large-scale atmospheric circulation (Iacomino et al., 2025). In selected regions, identifying and employing sufficiently long hourly observational records could allow for a more direct validation of the detected trends. The approach could also be extended to identify precipitation structures of different nature and duration, including synoptic-scale precipitation structures, by analysing longer accumulation periods (e.g., 3, 6, 12, or 24 h). Furthermore, similar datasets based on precipitation structures could be produced using the same methodology to detect precipitation extremes in other regions where convection-permitting reanalyses are available.
MERIDA-HRES data are openly available from the RSE repository: “PREC” at https://merida.rse-web.it/ (last access: 10 May 2025). The HPSSs dataset used and produced in this study is openly available on Zenodo (DOI: https://doi.org/10.5281/zenodo.15772543, Cavalleri, 2025), or via the short link https://bit.ly/HOPSS-X (last access: 8 October 2025). The code used in this work is openly available on GitHub: https://github.com/fcavalleri/EPEs (last access: 16 January 2026, Cavalleri, 2026).
The supplement related to this article is available online at https://doi.org/10.5194/nhess-26-279-2026-supplement.
FC: Conceptualization; Formal Analysis; Investigation; Software; Visualization; Writing – Original Draft Preparation; CL: Conceptualization; Methodology; Investigation; Supervision; Validation; Writing – Review and Editing; FV: Data Curation; Methodology; Investigation; Supervision; Validation; Writing – Review and Editing; MB: Investigation; Writing – Review and Editing; RB: Data Curation; Investigation; Writing – Review and Editing; VM: Investigation; Writing – Review and Editing; ML: Data Curation; Investigation; Funding Acquisition; Writing – Review and Editing; MM: Investigation; Supervision; Validation; Writing – Review and Editing; Funding Acquisition.
The contact author has declared that none of the authors has any competing interests.
Publisher's note: Copernicus Publications remains neutral with regard to jurisdictional claims made in the text, published maps, institutional affiliations, or any other geographical representation in this paper. The authors bear the ultimate responsibility for providing appropriate place names. Views expressed in the text are those of the authors and do not necessarily reflect the views of the publisher.
During the preparation of this work, the authors used ChatGPT in order to enhance readability. After using this tool, the authors reviewed and edited the content as needed and take full responsibility for the content of the publication.
The PhD of the co-author Francesco Cavalleri was activated pursuant to DM 352 and is co-sponsored by PNRR funds and R.S.E. s.p.a. The PNRR funds come from the EU Next Generation programme. This work has been financed by the Research Fund for the Italian Electrical System under the Three-Year Research Plan 2025–2027 (MASE, Decree no. 388 of 6 November 2024), in compliance with the Decree of 12 April 2024. This work has been financed by Research Funds from the Italian Ministry for University and Research (PRIN 2022 – CN4RWK–CCHP-ALPSClimate Change and HydroPower in the Alps, funded by the European Union (Programme Next Generation EU)). Veronica Manara was supported by the “Ministero dell'Università e della Ricerca” of Italy [grant FSE – REACT EU, DM 10/08/2021 no. 1062].
This paper was edited by Joaquim G. Pinto and reviewed by Edgar Dolores Tesillos and two anonymous referees.
Allan, R. P., Barlow, M., Byrne, M. P., Cherchi, A., Douville, H., Fowler, H. J., Gan, T. Y., Pendergrass, A. G., Rosenfeld, D., Swann, A. L. S., Wilcox, L. J., and Zolina, O.: Advances in understanding large-scale responses of the water cycle to climate change, Annals of the New York Academy of Sciences, 1472, 49–75, https://doi.org/10.1111/nyas.14337, 2020. a
Argüeso, D., Marcos, M., and Amores, A.: Storm Daniel fueled by anomalously high sea surface temperatures in the Mediterranean, npj Climate and Atmospheric Science, https://doi.org/10.1038/s41612-024-00872-2, 2024. a
Avino, A., Cimorelli, L., Furcolo, P., Noto, L. V., Pelosi, A., Pianese, D., Villani, P., and Manfreda, S.: Are rainfall extremes increasing in southern Italy?, Journal of Hydrology, 631, 130684, https://doi.org/10.1016/j.jhydrol.2024.130684, 2024. a
Bartolini, G., Messeri, A., Grifoni, D., Mannini, D., and Orlandini, S.: Recent trends in seasonal and annual precipitation indices in Tuscany (Italy), Theoretical and Applied Climatology, 118, 147–157, 2014. a
Benjamini, Y. and Hochberg, Y.: Controlling the false discovery rate: a practical and powerful approach to multiple testing, Journal of the Royal Statistical Society: Series B (Methodological), 57, 289–300, 1995. a
Blenkinsop, S., Fowler, H. J., Barbero, R., Chan, S. C., Guerreiro, S. B., Kendon, E., Lenderink, G., Lewis, E., Li, X.-F., Westra, S., Alexander, L., Allan, R. P., Berg, P., Dunn, R. J. H., Ekström, M., Evans, J. P., Holland, G., Jones, R., Kjellström, E., Klein-Tank, A., Lettenmaier, D., Mishra, V., Prein, A. F., Sheffield, J., and Tye, M. R.: The INTENSE project: using observations and models to understand the past, present and future of sub-daily rainfall extremes, Adv. Sci. Res., 15, 117–126, https://doi.org/10.5194/asr-15-117-2018, 2018. a
Bonanno, R., Lacavalla, M., and Sperati, S.: A new high-resolution MEteorological Reanalysis Italian DAtaset: MERIDA, Quarterly Journal of the Royal Meteorological Society, 145, 1756–1779, https://doi.org/10.1002/qj.3530, 2019. a, b
Brugnara, Y., Brunetti, M., Maugeri, M., Nanni, T., and Simolo, C.: High-resolution analysis of daily precipitation trends in the central Alps over the last century, International Journal of Climatology, 32, https://doi.org/10.1002/joc.2363, 2012. a
Brunetti, M., Caloiero, T., Coscarelli, R., Gullà, G., Nanni, T., and Simolo, C.: Precipitation variability and change in the Calabria region (Italy) from a high resolution daily dataset, International Journal of Climatology, 32, 57, https://doi.org/10.1002/joc.2233, 2012. a
Caloiero, T., Caloiero, P., and Frustaci, F.: Long-term precipitation trend analysis in Europe and in the Mediterranean basin, Water and Environment Journal, 32, 433–445, 2018. a
Caloiero, T., Coscarelli, R., and Pellicone, G.: Trend analysis of rainfall using gridded data over a region of southern Italy, Water, 13, 2271, https://doi.org/10.3390/w13162271, 2021. a
Capecchi, V., Pasi, F., Gozzini, B., and Brandini, C.: A convection-permitting and limited-area model hindcast driven by ERA5 data: precipitation performances in Italy, Climate Dynamics, 61, 1411–1437, https://doi.org/10.1007/s00382-022-06633-2, 2023. a
Capozzi, V., Rocco, A., Annella, C., Cretella, V., Fusco, G., and Budillon, G.: Signals of change in the Campania region rainfall regime: An analysis of extreme precipitation indices (2002–2021), Meteorological Applications, 30, e2168, https://doi.org/10.1002/met.2168, 2023. a, b
Cassola, F., Ferrari, F., Mazzino, A., and Miglietta, M.: The role of the sea on the flash floods events over Liguria (northwestern Italy), Geophysical Research Letters, 43, 3534–3542, https://doi.org/10.1002/2016GL068265, 2016. a
Cavalleri, F.: HOPSS-X (HOurly Precipitation Spatial Structures and Xtremes) from MERIDA HRES Reanalysis, Zenodo [data set], https://doi.org/10.5281/zenodo.15772543, 2025. a
Cavalleri, F.: fcavalleri/EPEs: Hourly Extreme Precipitation Structures Scripts (release), Zenodo [code], https://doi.org/10.5281/zenodo.18266486, 2026. a
Cavalleri, F., Lussana, C., Viterbo, F., Brunetti, M., Bonanno, R., Manara, V., Lacavalla, M., Sperati, S., Raffa, M., Capecchi, V., Cesari, D., Giordani, A., Cerenzia, I. M. L., and Maugeri, M.: Multi-scale assessment of high-resolution reanalysis precipitation fields over Italy, Atmospheric Research, 312, 107734, https://doi.org/10.1016/j.atmosres.2024.107734, 2024. a, b, c, d, e, f, g, h, i, j, k, l, m, n, o, p
Cerenzia, I. M. L., Giordani, A., Paccagnella, T., and Montani, A.: Towards a convection-permitting regional reanalysis over the Italian domain, Meteorological Applications, 29, e2092, https://doi.org/10.1002/met.2092, 2022. a
Chang, W., Stein, M. L., Wang, J., Kotamarthi, V. R., and Moyer, E. J.: Changes in spatiotemporal precipitation patterns in changing climate conditions, Journal of Climate, 29, 8355–8376, 2016. a
Cheng, K., Harris, L., Bretherton, C., Merlis, T., Bolot, M., Zhou, L., Kaltenbaugh, A., Clark, S. K., and Fueglistaler, S.: Impact of Warmer Sea Surface Temperature on the Global Pattern of Intense Convection: Insights From a Global Storm Resolving Model, Geophysical Research Letters, 49, https://doi.org/10.1029/2022GL099796, 2022. a
Chinita, M. J., Witte, M., Kurowski, M. J., Teixeira, J., Suselj, K., Matheou, G., and Bogenschutz, P.: Improving the representation of shallow cumulus convection with the simplified-higher-order-closure–mass-flux (SHOC+MF v1.0) approach, Geosci. Model Dev., 16, 1909–1924, https://doi.org/10.5194/gmd-16-1909-2023, 2023. a
Coles, S.: An Introduction to Statistical Modeling of Extreme Values, Springer-Verlag, London, https://doi.org/10.1007/978-1-4471-3675-0, 2001. a
Crespi, A., Brunetti, M., Lentini, G., and Maugeri, M.: 1961–1990 high-resolution monthly precipitation climatologies for Italy, International Journal of Climatology, 38, 878–895, https://doi.org/10.1002/joc.5217, 2018. a
Dallan, E., Borga, M., Zaramella, M., and Marra, F.: Enhanced Summer Convection Explains Observed Trends in Extreme Subdaily Precipitation in the Eastern Italian Alps, Geophysical Research Letters, 49, e2021GL096727, https://doi.org/10.1029/2021GL096727, 2022. a
Dallan, E., Borga, M., Fosser, G., Canale, A., Roghani, B., Marani, M., and Marra, F.: A Method to Assess and Explain Changes in Sub-Daily Precipitation Return Levels from Convection-Permitting Simulations, Water Resources Research, 60, e2023WR035969, https://doi.org/10.1029/2023WR035969, 2024. a
Davis, C., Brown, B., and Bullock, R.: Object-based verification of precipitation forecasts. Part II: Application to convective rain systems, Monthly Weather Review, 134, 1785–1795, 2006. a
Donat, M. G., Lowry, A. L., Alexander, L. V., O’Gorman, P. A., and Maher, N.: Addendum: More extreme precipitation in the world's dry and wet regions, Nature Climate Change, 7, 154–158, https://doi.org/10.1038/nclimate3160, 2017. a
Donnini, M., Santangelo, M., Gariano, S. L., Bucci, F., Peruccacci, S., Alvioli, M., Althuwaynee, O., Ardizzone, F., Bianchi, C., Bornaetxea, T., Bornaetxea, M., Brunetti, T., Cardinali, M., Esposito, G., Grita, S., Marchesini, I., Melillo, M., Salvati, P., Yazdani, M., and Fiorucci, F.: Landslides triggered by an extraordinary rainfall event in Central Italy on September 15, 2022, Landslides, https://doi.org/10.1007/s10346-023-02109-4, 2023. a
Fantini, A.: Climate Change Impact on Flood Hazard Over Italy, PhD thesis, Università degli Studi di Trieste, https://arts.units.it/handle/11368/2940009, 2019. a
Forestieri, A., Arnone, E., Blenkinsop, S., Candela, A., Fowler, H., and Noto, L. V.: The impact of climate change on extreme precipitation in Sicily, Italy, Hydrological Processes, 32, 332–348, https://doi.org/10.1002/hyp.11421, 2018. a
Fortin, V., Roy, G., Stadnyk, T., Koenig, K., Gasset, N., and Mahidjiba, A.: Ten Years of Science Based on the Canadian Precipitation Analysis: A CaPA System Overview and Literature Review, Atmosphere-Ocean, 56, 178–196, https://doi.org/10.1080/07055900.2018.1474728, 2018. a
Fowler, H. J., Lenderink, G., Prein, A. F., Westra, S., Allan, R. P., Ban, N., Barbero, R., Berg, P., Blenkinsop, S., Do, H. X., Guerreiro, S., Haerter, J. O., Kendon, E. J., Lewis, E., Schaer, C., Sharma, A., Villarini, G., Wasko, C., and Zhang, X.: Anthropogenic intensification of short-duration rainfall extremes, Nature Reviews Earth & Environment, 2, 107–122, https://doi.org/10.1038/s43017-020-00128-6, 2021. a
Garcia-Soto, C., Cheng, L., Caesar, L., Schmidtko, S., Jewett, E. B., Cheripka, A., Rigor, I., Caballero, A., Chiba, S., Báez, J. C., Zielinski, T., and Abraham, J. P.: An Overview of Ocean Climate Change Indicators: Sea Surface Temperature, Ocean Heat Content, Ocean pH, Dissolved Oxygen Concentration, Arctic Sea Ice Extent, Thickness and Volume, Sea Level and Strength of the AMOC (Atlantic Meridional Overturning Circulation), Frontiers in Marine Science, 8, 642372, https://doi.org/10.3389/fmars.2021.642372, 2021. a
Giordani, A., Cerenzia, I. M. L., Paccagnella, T., and Di Sabatino, S.: SPHERA, a new convection-permitting regional reanalysis over Italy: Improving the description of heavy rainfall, Quarterly Journal of the Royal Meteorological Society, 149, 781–808, https://doi.org/10.1002/qj.4428, 2023. a
Giordani, A., Ruggieri, P., and Di Sabatino, S.: Added Value of a Multi-Model Ensemble of Convection-Permitting Rainfall Reanalyses Over Italy, SSRN [preprint],https://doi.org/10.2139/ssrn.5227549, 2025. a, b, c
Giovannini, L., Davolio, S., Zaramella, M., Zardi, D., and Borga, M.: Multi-model convection-resolving simulations of the October 2018 Vaia storm over Northeastern Italy, Atmospheric Research, 253, 105455, https://doi.org/10.1016/j.atmosres.2021.105455, 2021. a
Hardwick Jones, R., Westra, S., and Sharma, A.: Observed Relationships between Extreme Sub-Daily Precipitation, Surface Temperature, and Relative Humidity, Geophysical Research Letters, 37, L22805, https://doi.org/10.1029/2010GL045081, 2010. a
Hersbach, H., Bell, B., Berrisford, P., Hirahara, S., Horanyi, A., Munoz-Sabater, J., Nicolas, J., Peubey, C., Radu, R., Schepers, D., Simmons, A., Soci, C., Abdalla, S., Abellan, X., Balsamo, G., Bechtold, P., Biavati, G., Bidlot, J., Bonavita, M., Chiara, G., Dahlgren, P., Dee, D., Diamantakis, M., Dragani, R., Flemming, J., Forbes, R., Fuentes, M., Geer, A., Haimberger, L., Healy, S., Hogan, R. J., Holm, E., Janiskova, M., Keeley, S., Laloyaux, P., Lopez, P., Lupu, C., Radnoti, G., Rosnay, P., Rozum, I., Vamborg, F., Villaume, S., and Thepaut, J.: The ERA5 global reanalysis, Quarterly Journal of the Royal Meteorological Society, 146, 1999–2049, https://doi.org/10.1002/qj.3803, 2020. a
Hohenegger, C. and Schär, C.: Predictability and Error Growth Dynamics in Cloud-Resolving Models, Journal of the Atmospheric Sciences, 64, 4467–4478, https://doi.org/10.1175/2007JAS2143.1, 2007. a
Iacomino, C., Pascale, S., Zappa, G., Iotti, M., Grazzini, F., Ghinassi, P., and Portal, A.: A Classification of High-Risk Atmospheric Circulation Patterns for Italian Precipitation Extremes, International Journal of Climatology, e70118, https://doi.org/10.1002/joc.70118, 2025. a
Ignaccolo, M. and De Michele, C.: A point based Eulerian definition of rain event based on statistical properties of inter drop time intervals: An application to Chilbolton data, Advances in Water Resources, 33, 933–941, https://doi.org/10.1016/j.advwatres.2010.04.002, 2010. a
IPCC: Climate Change 2021 – The Physical Science Basis: Working Group I Contribution to the Sixth Assessment Report of the Intergovernmental Panel on Climate Change, Cambridge University Press, https://doi.org/10.1017/9781009157896, 2023. a
Kalnay, E., Mote, S., and Da, C.: Earth System Modeling, Data Assimilation and Predictability: Atmosphere, Oceans, Land and Human Systems, 2nd edn., Cambridge University Press, https://doi.org/10.1017/9780511920608, 2024. a
Lavers, D. A., Villarini, G., Cloke, H. L., Simmons, A., Roberts, N., Lombardi, A., Burgess, S. N., and Pappenberger, F.: How bad is the rain? Applying the extreme rain multiplier globally and for climate monitoring activities, Meteorological Applications, 32, e70031, https://doi.org/10.1002/met.70031, 2025. a, b
Lenderink, G., Barbero, R., Loriaux, J. M., and Fowler, H. J.: Super-clausius-clapeyron scaling of extreme hourly convective precipitation and its relation to large-scale atmospheric conditions, Journal of Climate, 30, 6037–6052, https://doi.org/10.1175/JCLI-D-16-0808.1, 2017. a, b
Li, L., Li, Y., and Li, Z.: Object-based tracking of precipitation systems in western Canada: the importance of temporal resolution of source data, Climate Dynamics, 55, 2421–2437, 2020. a
Lionello, P. and Scarascia, L.: The relation between climate change in the Mediterranean region and global warming, Regional Environmental Change, 18, 1481–1493, https://doi.org/10.1007/s10113-018-1290-1, 2018. a
Liu, P., Tsimpidi, A. P., Hu, Y., Stone, B., Russell, A. G., and Nenes, A.: Differences between downscaling with spectral and grid nudging using WRF, Atmos. Chem. Phys., 12, 3601–3610, https://doi.org/10.5194/acp-12-3601-2012, 2012. a
Lombardo, K. and Bitting, M.: A Climatology of Convective Precipitation over Europe, Monthly Weather Review, 152, 1555–1585, https://doi.org/10.1175/MWR-D-23-0156.1, 2024. a
Lussana, C., Baietti, E., Båserud, L., Nipen, T. N., and Seierstad, I. A.: Exploratory analysis of citizen observations of hourly precipitation over Scandinavia, Advances in Science and Research, 20, 35–48, 2023. a
Lussana, C., Cavalleri, F., Brunetti, M., Manara, V., and Maugeri, M.: Evaluating long-term trends in annual precipitation: A temporal consistency analysis of ERA5 data in the Alps and Italy, Atmospheric Science Letters, e1239, https://doi.org/10.1002/asl.1239, 2024. a
Mann, H. B.: Nonparametric tests against trend, Econometrica, 13, 245–259, https://www.jstor.org/stable/1907187 (last access: 10 July 2025), 1945. a
Marzban, C. and Sandgathe, S.: Cluster analysis for verification of precipitation fields, Weather and Forecasting, 21, 824–838, 2006. a
Mazzoglio, P., Butera, I., and Claps, P.: I2-RED: a massive update and quality control of the Italian annual extreme rainfall dataset, Water, 12, 3308, https://doi.org/10.3390/w12123308, 2020. a
Mazzoglio, P., Butera, I., Alvioli, M., and Claps, P.: The role of morphology in the spatial distribution of short-duration rainfall extremes in Italy, Hydrol. Earth Syst. Sci., 26, 1659–1672, https://doi.org/10.5194/hess-26-1659-2022, 2022. a
Mazzoglio, P., Viglione, A., Ganora, D., and Claps, P.: Mapping the uneven temporal changes in ordinary and extraordinary rainfall extremes in Italy, Journal of Hydrology: Regional Studies, 58, 102287, https://doi.org/10.1016/j.ejrh.2025.102287, 2025. a, b
McLeod, A. I.: Kendall rank correlation and Mann-Kendall trend test, R package Kendall, 602, 1–10, 2005. a
Morbidelli, R., Flammini, A., Echeta, O., Albano, R., Anzolin, G., Zumr, D., Badi, W., Berni, N., Bertola, M., Bodoque, J. M., Brandsma, T., Cauteruccio, A., Cesanelli, A., Cimorelli, L., Chaffe, P. L., Chagas, V. B., Dari, J., das Neves Ameida, C., Díez-Herrrero, A., Doesken, N., El Khalki, E. M., Saidi, M. E., Ferraris, S., Freitas, E. S., Gargouri-Ellouze, E., Gariano, S. L., Hanchane, M., Hurtado, S. I., Kessabi, R., Khemiri, K., Kim, D., Kowalewski, M. K., Krabbi, M., Lazzeri, M., Lompi, M., Mazzoglio, P., Meira, M. A., Moccia, B., Moutia, S., Napolitano, F., Newman, N., Pavlin, L., Peruccacci, S., Pianese, D., Pirone, D., Ricetti, L., Ridolfi, E., Russo, F., Sarochar, R. H., Segovia-Cardozo, D. A., Segovia-Cardozo, S., Serafeim, A. V., Sojka, M., Speranza, G., Urban, G., Versace, C., Wałȩga, A., Zubelzu, S., and Saltalippi, C.: A reassessment of the history of the temporal resolution of rainfall data at the global scale, Journal of Hydrology, 654, 132841, https://doi.org/10.1016/j.jhydrol.2025.132841, 2025. a
Padulano, R., Reder, A., and Rianna, G.: An ensemble approach for the analysis of extreme rainfall under climate change in Naples (Italy), Hydrological Processes, 33, 2020–2036, 2019. a
Pavan, V., Antolini, G., Barbiero, R., Berni, N., Bonati, V., Brunier, F., Cacciamani, C., Cagnati, A., Cazzuli, O., Cicogna, A., Gozzini, B., Maraldo, L., Marigo, G., Micheletti, S., Onorato, L., Panettieri, E., and Villani, G.: The ARCIS daily precipitation observational analysis for North-Central Italy from 1961 to 2015, Theoretical and Applied Climatology, 129, 151–168, 2017. a, b, c
Peleg, N., Koukoula, M., and Marra, F.: A 2 °C warming can double the frequency of extreme summer downpours in the Alps, npj Climate and Atmospheric Science, 8, 216, https://doi.org/10.1038/s41612-025-01081-1, 2025. a
Persiano, S., Ferri, E., Antolini, G., Domeneghetti, A., Pavan, V., and Castellarin, A.: Changes in seasonality and magnitude of sub-daily rainfall extremes in Emilia-Romagna (Italy) and potential influence on regional rainfall frequency estimation, Journal of Hydrology: Regional Studies, 32, 100751, https://doi.org/10.1016/j.ejrh.2020.100751, 2020. a, b
Pfahl, S., O'Gorman, P. A., and Fischer, E. M.: Understanding the regional pattern of projected future changes in extreme precipitation, Nature Climate Change, 7, 423–427, https://doi.org/10.1038/nclimate3287, 2017. a
Poschlod, B., Ludwig, R., and Sillmann, J.: Ten-year return levels of sub-daily extreme precipitation over Europe, Earth Syst. Sci. Data, 13, 983–1003, https://doi.org/10.5194/essd-13-983-2021, 2021. a
Raffa, M., Reder, A., Marras, G. F., Mancini, M., Scipione, G., Santini, M., and Mercogliano, P.: VHR-REA_IT Dataset: Very High Resolution Dynamical Downscaling of ERA5 Reanalysis over Italy by COSMO-CLM, Data, 6, https://doi.org/10.3390/data6080088, 2021. a, b
Schroeer, K., Kirchengast, G., and O, S.: Strong Dependence of Extreme Convective Precipitation Intensities on Gauge Network Density, Geophysical Research Letters, 45, 8253–8263, https://doi.org/10.1029/2018GL077994, 2018. a
Sen, P. K.: Estimates of the Regression Coefficient Based on Kendall's Tau, Journal of the American Statistical Association, 63, 1379–1389, https://doi.org/10.1080/01621459.1968.10480934, 1968. a
Senatore, A., Furnari, L., Nikravesh, G., Castagna, J., and Mendicino, G.: Increasing Daily Extreme and Declining Annual Precipitation in Southern Europe: A Modeling Study on the Effects of Mediterranean Warming, EGUsphere [preprint], https://doi.org/10.5194/egusphere-2025-1567, 2025. a
Sottile, G., Francipane, A., Adelfio, G., and Noto, L. V.: A PCA-based clustering algorithm for the identification of stratiform and convective precipitation at the event scale: an application to the sub-hourly precipitation of Sicily, Italy, Stochastic Environmental Research and Risk Assessment, 36, 2303–2317, 2022. a
Stocchi, P. and Davolio, S.: Intense air-sea exchanges and heavy orographic precipitation over Italy: The role of Adriatic sea surface temperature uncertainty, Atmospheric Research, 196, 62–82, 2017. a
Thunis, P. and Bornstein, R.: Hierarchy of Mesoscale Flow Assumptions and Equations, Journal of Atmospheric Sciences, 53, 380–397, https://doi.org/10.1175/1520-0469(1996)053<0380:HOMFAA>2.0.CO;2, 1996. a, b, c, d
Van Hyfte, S., Le Moigne, P., Bazile, E., Verrelle, A., and Boone, A.: High-Resolution Reanalysis of Daily Precipitation using AROME Model Over France, Tellus A: Dynamic Meteorology and Oceanography, https://doi.org/10.16993/tellusa.95, 2023. a
Viterbo, F., Sperati, S., Vitali, B., D'Amico, F., Cavalleri, F., Bonanno, R., and Lacavalla, M.: MERIDA HRES: A new high-resolution reanalysis dataset for Italy, Meteorological Applications, 31, e70011, https://doi.org/10.1002/met.70011, 2024. a, b, c, d, e
von Storch, H., Langenberg, H., and Feser, F.: A Spectral Nudging Technique for Dynamical Downscaling Purposes, Monthly Weather Review, 128, 3664–3673, https://doi.org/10.1175/1520-0493(2000)128<3664:ASNTFD>2.0.CO;2, 2000. a
Wang, S., Li, C., Li, D., Tian, X., Bao, H., Chen, G., and Xia, Y.: Exploring the utility of radar and satellite-sensed precipitation and their dynamic bias correction for integrated prediction of flood and landslide hazards, Journal of Hydrology, https://doi.org/10.1016/j.jhydrol.2021.126964, 2021. a
Wernli, H., Paulat, M., Hagen, M., and Frei, C.: SAL – A novel quality measure for the verification of quantitative precipitation forecasts, Monthly Weather Review, 136, 4470–4487, 2008. a, b
White, R., Battisti, D., and Skok, G.: Tracking precipitation events in time and space in gridded observational data, Geophysical Research Letters, 44, 8637–8646, 2017. a
Wilks, D.: On “field significance” and the false discovery rate, Journal of Applied Meteorology and Climatology, 45, 1181–1189, 2006. a
Wilks, D.: Statistical Methods in the Atmospheric Sciences, Elsevier Science, https://doi.org/10.1016/C2017-0-03921-6, 2019. a
Wilks, D. S.: “The Stippling Shows Statistically Significant Grid Points”: How Research Results are Routinely Overstated and Overinterpreted, and What to Do about It, Bulletin of the American Meteorological Society, 97, 2263–2273, https://doi.org/10.1175/BAMS-D-15-00267.1, 2016. a
Zaitchik, B. F., Rodell, M., Biasutti, M., and Seneviratne, S. I.: Wetting and Drying Trends Under Climate Change, Nature Water, 1, 502–513, https://doi.org/10.1038/s44221-023-00073-w, 2023. a