the Creative Commons Attribution 4.0 License.
the Creative Commons Attribution 4.0 License.
 | 10 Jun 2026
The Pluvial Flood Index (PFI): a new instrument for evaluating flash flood hazards and facilitating real-time warning
Markus Weiler
Julia Krumm
Ingo Haag
Hannes Leistert
Max Schmit
Andreas Steinbrich
Andreas Hänsler
Pluvial (flash) floods frequently cause damage in rural and urban watersheds as a result of short-term, intense local precipitation events that cause infiltration excess runoff and overland flow. Unlike fluvial floods, pluvial floods are primarily characterized by surface runoff and flow in small ditches and creeks, making them unsuitable for evaluation using common extreme value statistics based on long-term river discharge data. Precipitation statistics alone are insufficient for predicting pluvial floods because these floods are also influenced by hydrological and hydrodynamic processes. We propose a new regional-scale pluvial flood index (PFI) that considers precipitation as well as hydrological and hydrodynamic processes to assess the hazard of surface flooding. The PFI is based on local pluvial flood hazard areas (PFHA), which are defined as areas where water depth, flow velocity, or both exceed thresholds that endanger pedestrians and vehicles. We defined four PFI classes based on historical and design events, ranging from no hazard to very large flood hazard. The PFI serves as a simple, dimensionless measure and information tool to support regional to local scale pluvial flood management.
PFHA and PFI were calculated for various events using radar-based precipitation input, dynamic simulations of infiltration and saturation excess, and hydrodynamic simulations of surface runoff. PFI forecasting requires quantitative precipitation data as well as appropriate processed-based distributed hydrodynamic and hydrological models at large temporal and spatial scales. We demonstrate the PFI's applicability and utility by creating large-scale flash flood hazard maps and hindcasting an extreme historical event. Furthermore, the PFI can link to detailed local flash flood hazard information, assisting municipal decision-making. It can also be a key component in operational pluvial flood warning systems, providing information on the occurrence and severity of floods on a scale of several hectares to square kilometres. This educates stakeholders and the community, improving real-time warning systems, preparedness, and planning decisions.
- Article
(16298 KB) - Full-text XML
-
Supplement
(1155 KB) - BibTeX
- EndNote


Pluvial floods are flash floods with inundation typically arising from localized, severe convective precipitation events. They are characterized by short formation durations, attributable not only to the rapid growth and movement of convective thunderstorm cells but also to the underlying runoff generation mechanisms. Pluvial floods predominantly arise from unrestrained surface runoff caused by infiltration excess (Beven, 2004), occurring with fast moving water typically away from rivers and watercourses (Archer and Fowler, 2018), even under dry preconditions. The rapid formation time and typically limited spatial extent of these events (generally only a few square kilometres) complicate prediction and real-time forecasting and result in a minimal lead time for such occurrences (Borga et al., 2011).
Due to climate change and the resultant rise in temperature, an intensification of the hydrological cycle (Huntington, 2006; Kunstmann et al., 2023) is anticipated, leading to a probable increase in heavy rainfall events (BBK, 2015) and a corresponding increase in pluvial flood occurrence and magnitude (Wasko et al., 2021). The escalating threat of pluvial floods, exacerbated by ongoing urbanization and surface sealing, alongside with insufficient awareness and protective measures, suggests a significant vulnerability to damage in numerous locations, which is likely to persist in the foreseeable future. Heavy rainfall currently constitutes around 50 % of all flood-related damages in Germany (BBK, 2015). A similar picture was derived for England, with 3 million properties susceptible to pluvial flooding – compared to 2.7 million properties at risk of fluvial or coastal flooding (Environment Agency, 2018).
In addition to increasing awareness and formulating protective measures, the comprehensive categorization of pluvial flood hazards and the improvement of pluvial flood forecasting and alerts are essential components that enhance pluvial flood management and mitigate their detrimental effects (Haag et al., 2022a). Therefore, we propose the new Pluvial Flood Index PFI as a versatile tool to reach these goals. PFI encompasses information beyond mere heavy rainfall data, as the occurrence of a flash flood from heavy rainfall is contingent upon the interplay of hydrological and hydraulic static features and dynamic processes. Unlike current fluvial flood classifications or hazard indices that primarily pertain to river flow and subsequent overbank flooding (Kazakis et al., 2015; Kabenge et al., 2017; Vojtek, 2023), the PFI is designed exclusively for pluvial events, aiming to address the hazard arising from uncontrolled surface runoff at a regional scale. The PFI is characterized as a hazard index that does not account for vulnerability or damage potential, hence offering no independent assessment of flood risk. On one hand, the PFI is designed to assess and compare the susceptibility of various regions to pluvial floods. On the other hand, it is also intended as an operational index to alert the public in real-time on the potential occurrence of pluvial floods in order to facilitate appropriate measures within communities. While this is currently often still hampered by the computational needs of the real time flow accumulation, the rapid development in either GPU based hydrodynamic models (e.g. Apel et al., 2022), KI-based applications (e.g. ANN; Berkhahn et al., 2019) or simplified hydrodynamic approaches (e.g. Leistert et al., 2026) will soon make this operational. Consequently, the PFI must satisfy the following criteria (Krumm et al., 2024):
-
The PFI should allow broad applicability and thus be founded on readily available data. The intended practical real-time application necessitates that the PFI can be ascertained rapidly while maintaining adequate precision.
-
For optimal application of the PFI, the index must not be an abstract figure; it should instead be grounded in a measure that is straightforward, comprehensible, and tangible, establishing a direct and significant correlation to the hazards associated with uncontrolled surface runoff.
-
As a tool for operational public warning, the PFI must be readily comprehensible and distinctly conveyable.
In order to derive meaningful flooding estimates it is absolutely central to the PFI concept that all hydrological and hydraulic factors and processes, in addition to precipitation, that contribute to the occurrence of local flash floods resulting from heavy rainfall events have been considered in the process of generating the baseline data. Recently, several approaches have been published that appear to be similar to the proposed PFI hazard maps. An example is the nationwide pluvial flood map for Germany (Wimmer and Hovenbitzer, 2025) that display the maximum inundation depth based on a detailed hydrodynamic model for a 100-year return period and an extreme event using a high resolution DGM (1 m) and land cover data. However, it completely ignores the hydrological processes by assuming a constant runoff coefficient of 100 % regardless of soil, land cover and land use or initial conditions, hence leading to substantially enhanced flooding. Also for Switzerland a nationwide pluvial hazard map exists (Kipfer et al., 2018). From a hydrological perspective, it is more sophisticated because it takes into account certain relevant hydrological processes as well as an appropriate hydrodynamic model. To disentangle pluvial from fluvial flooding, they assume that the simulated surface runoff “disappears” into the first water body (blue line of rivers and lakes), hence making their results dependent on the definition of a water body
We will first describe in detail the relevant processes that need to be considered when evaluating pluvial flood hazards. The definition and designation of Pluvial Flood Hazard Areas (PFHA), which form the core of the PFI, will then be explained followed by a list of requirements for the hydrological and hydrodynamic models necessary to derive the PFHA and PFI. In the result section, we will first show the potential of the new approach with a hindcast the flash flood of 2024 in the Wieslauf catchment, Germany and then illustrating the potential of the PFI for creating a PFI or flash flood hazard map.
Although the paper focus on a novel approach to identify PFHA and subsequent PFI classification, it is essential that the relevant processes controlling the generation of pluvial floods have been considered in the process of preparing the baseline data for the PFHA analysis. Not every heavy rainfall event leads to a pluvial flash flood. In fact, the occurrence of a pluvial flood is contingent not only on the precipitation itself but also on several spatially and temporally variable factors and processes at the land surface (e.g., Tarboton, 2003; Steinbrich et al., 2016; Ries et al., 2020). To derive a meaningful and robust PFI, it is imperative to incorporate, in addition to a quantitative precipitation input, all these hydrological and hydrodynamic (hydraulic) influences and processes as depicted in Fig. 1.
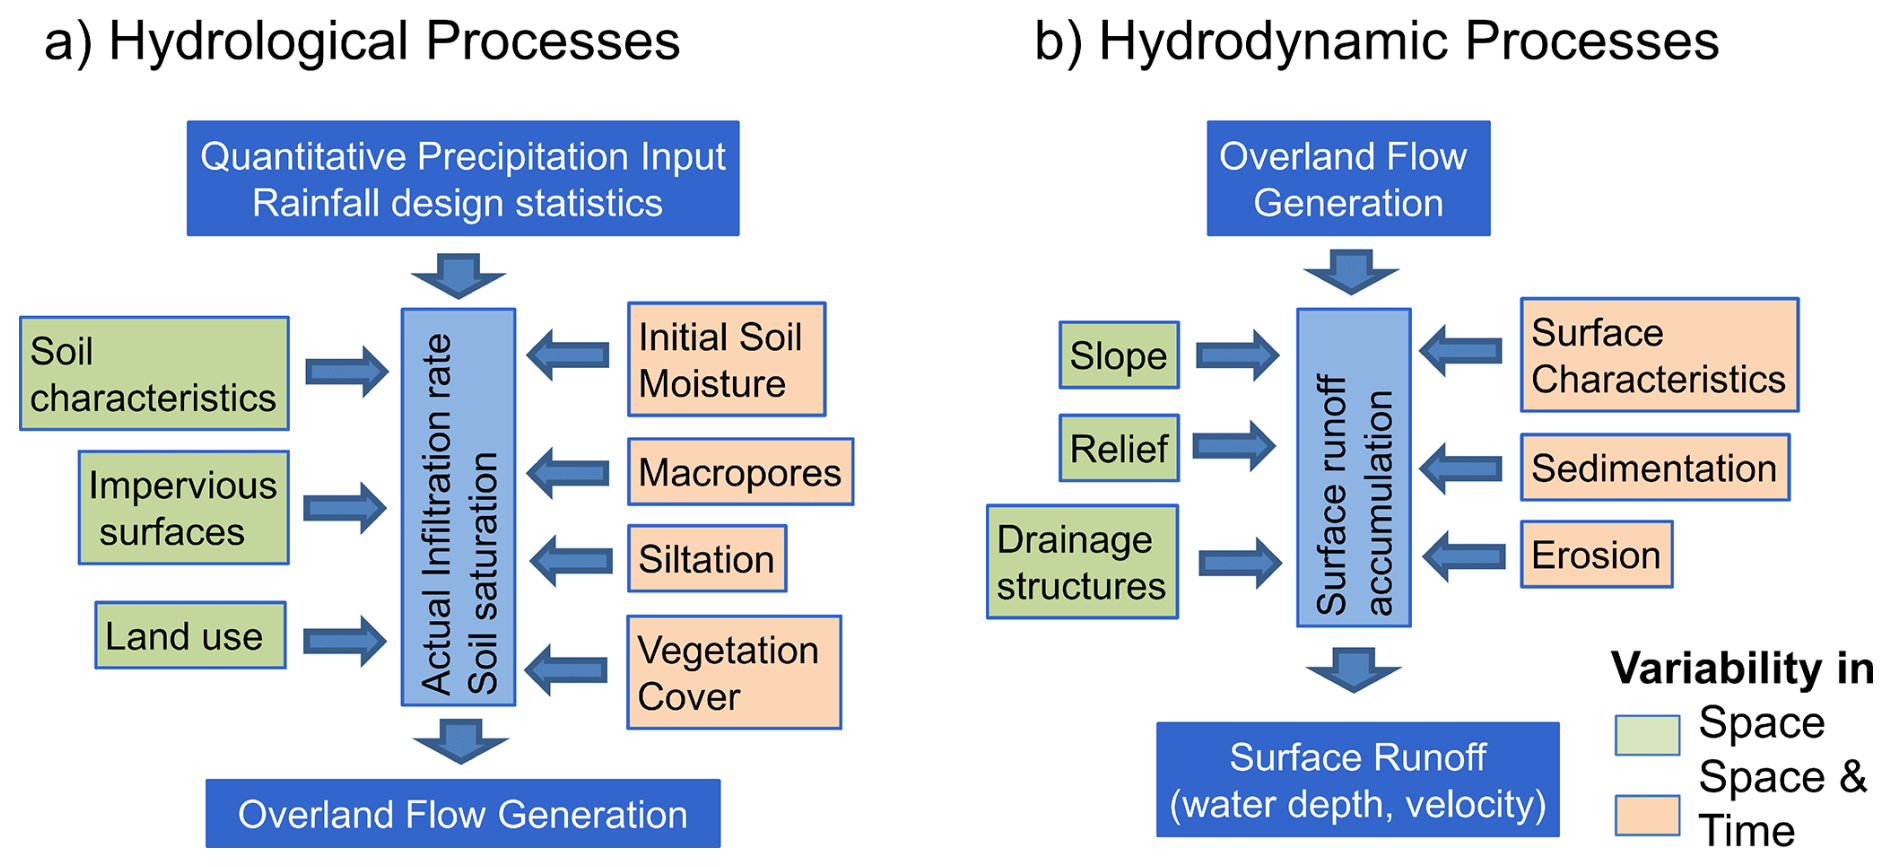
Figure 1Factors and processes specific to the generation of overland flow and resulting surface runoff due to (a) hydrological processes and (b) hydrodynamic processes.
First, it is essential to determine the amount and intensity of overland flow generated by infiltration excess or saturation excess. The second phase occurs only when the infiltration or saturation surplus spills over the surface and accumulates to cause significant surface runoff. On impermeable surfaces, surface runoff can occur following minimal initial losses. Consequently, the ratio of impervious surfaces is a significant, spatially highly variable but temporally static factor, in the generation of surface runoff. In instances of pluvial flash floods, originating outside of settlements, the extent of impermeable surfaces is typically small, making surface runoff from permeable areas very important. In this case, the infiltration characteristics of the soils, along with the initial soil moisture, are crucial factors. Unlike extensive fluvial floods, the generation of overland flow during localized pluvial floods is frequently more influenced by infiltration excess and the consequent Hortonian overland flow than by saturation excess form saturated areas (Steinbrich et al., 2016; Stewart et al., 2019). Infiltration excess occurs when the rainfall intensity surpasses the infiltration rate. Soil type and structure as well as the initial soil moisture strongly influence the infiltration rate (e.g. Rawls et al., 1992; Jury and Horton, 2004). Land use and vegetation can also greatly affect infiltration, through varying macroporosity (Bachmair et al., 2009; Zhang et al., 2019; Ries et al., 2020) and varying susceptibility to siltation (Bonta and Shipitalo, 2013; Seibert and Auerswald, 2020). Soil type and land use are relatively stable temporal characteristics. However, vegetation cover fluctuates seasonally, in particular on agricultural land, and thereby influences infiltration capacity via root penetration, soil macropores and siltation in a seasonal manner (Seibert and Auerswald, 2020). Moreover, the initial soil moisture prior to an event exerts a dynamic influence on the actual infiltration capacity and possible infiltration excess (Fig. 1). Considering the rather short durations of the high-intensive convective rain events usually triggering the type of pluvial flood events in focus of our study, it is worth to mention that interflow generally plays a minor role. This finding is based on a large series of sprinkling experiments considering different rain-fall durations and intensities, soil types and soil moisture conditions as well as various land use and land management situations (Ries et al., 2020).
Once overland flow has been generated, the terrain is crucial for the accumulation of unrestrained surface runoff and the formation of a pluvial flash flood. Attributes such as slope gradients and relief along with natural or artificial drainage structures determine the direction and activation of surface runoff routes (Fiener et al., 2011). Surface roughness strongly influences the hydrodynamic process of flow accumulation. Therefore, different spatially and temporally variable surface characteristics, that typically influence surface roughness, have to be taken into account (Fiener et al., 2011; Seibert and Auerswald, 2020). This is particularly important for surface runoff, where roughness coefficients are also influenced by flow depth and small micro flow paths (Oberle et al., 2021). Frequently, erosion and sedimentation by surface runoff goes hand in hand with larger pluvial flood events (Fig. 1), in particular on low-permeable surfaces and areas with low vegetation cover (agricultural, burned areas and badlands) (Lange et al., 2003; García-Ruiz et al., 2008). Both geomorphological processes may alter the flow pathways, trigger surface retention and significantly alter the impact of surface runoff on infrastructure and buildings, but are typically not even considered in most hydrodynamic flood models (Hamidifar et al., 2024).
The PFI is designed as a user-oriented warning index targeting on the meso- to macroscale application spanning from municipally to the federal state level. Hence it is important that the PFI on the one hand aggregates the information, so it can be applied seamlessly for the different scales. On the other hand, it has to be established on the local scale in order to include the relevant processes and the correct location of potential pluvial flood hazard areas (PFHA, see Sect. 3.1 below), which are relevant for local flood management activities. In the following we will detail the definition of the PFHA and their subsequent categorisation into the PFI.
3.1 Pluvial Flood Hazard Areas (PFHA)
The PFI refers to the area-wide hazard source of unrestrained surface runoff. This hazard can best be quantified by the extent of the areas where there is a thread from surface runoff and flooding. In our case a hazard is defined as either pedestrian no longer being able to safely cross a flooded area or the inability of vehicles to safely navigate. The floating of vehicles naturally poses a significant hazard to people, namely the vehicles occupants and pedestrians, who may be affected by the drifting vehicles. The areas where such a hazard to pedestrians or vehicles exists are hereinafter referred to as Pluvial Flood Hazard Areas (PFHA).
The criteria for defining the PFHA can be obtained from current research on the stability of pedestrians and vehicles (e.g. Shand et al., 2011 or Xia et al., 2011) at specific flow velocities and water depths as summarized in Martínez-Gomariz et al. (2016, 2018). Figure 2 presents the respective summary evaluations on the stability of pedestrians (a) and vehicles (b). This leads to the conclusion that a hazard for pedestrians is fundamentally characterized by the product of flow velocity (v) and water depths (z), represented as a specific surface runoff (q = v* z). Motivated by these studies we defined a general stability threshold with respect to specific surface runoff of 0.2 m2 s−1 for given cross-sectional wide of 1 m.
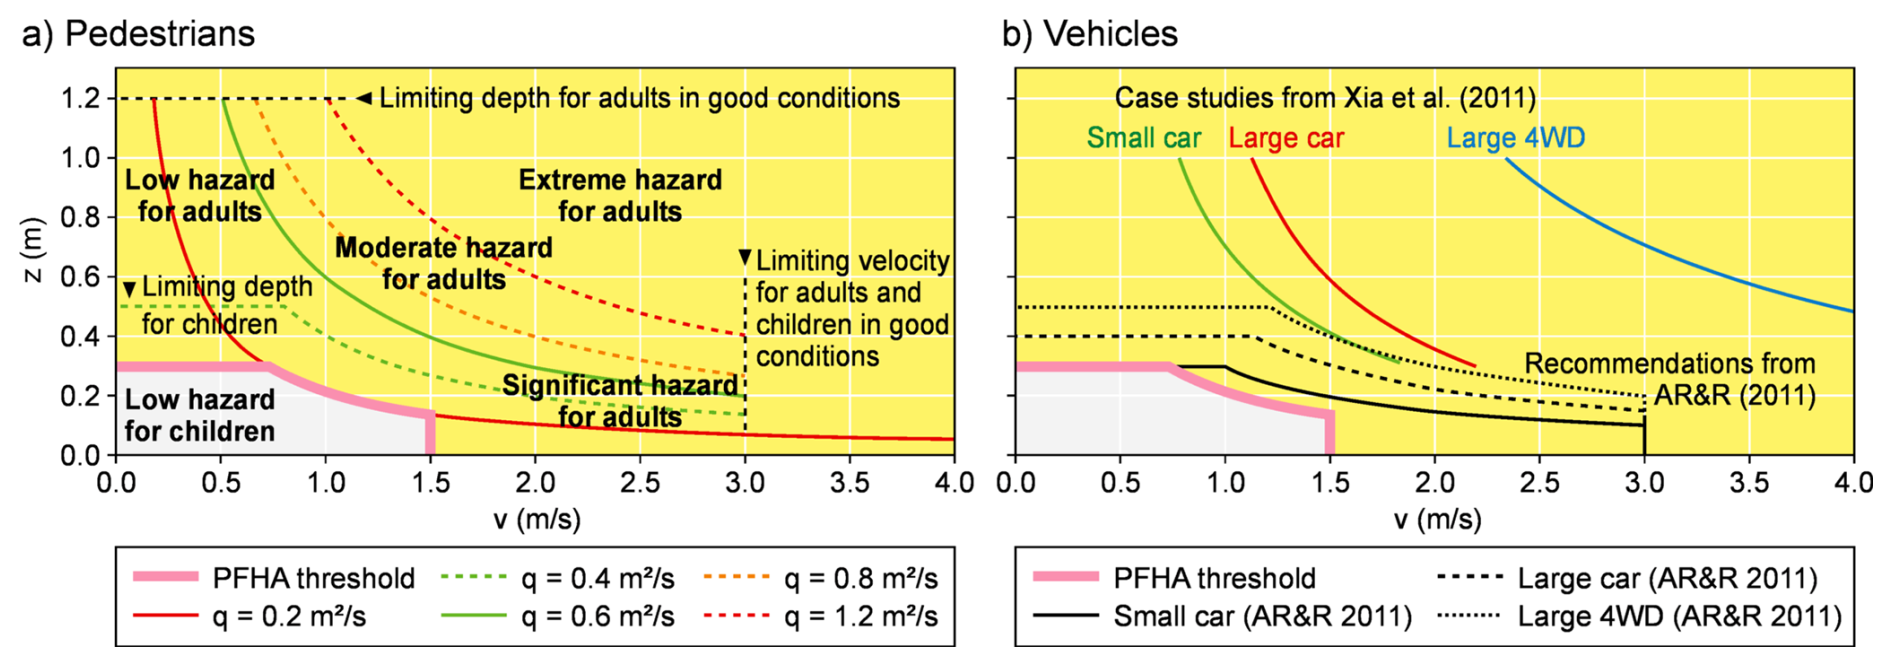
Figure 2Experimentally derived criteria (water depth z and surface runoff velocity v) for pedestrians (a) and vehicles (b) modified after Martínez-Gomariz et al. (2016) (a) and Martínez-Gomariz (2018) (b). The figure is supplemented by the selected criteria for delineating pluvial flood hazard areas (purple thick line) and the conditions of PFHA (yellow transparent area). The citations for the two studies in panel (b) are provided in the reference list under Xia et al. (2011) and for AR&R (2011) please see Shand et al. (2011).
At elevated flow velocities, the flooding depths becomes insignificant; thus, a hazard exists even at low water depth purely owing to the flow velocity. For vehicles, a hazard is encountered only with a greater specific discharge than for pedestrians. Nevertheless, lightweight compact vehicles can already remain buoyant at relatively shallow water depths, irrespective of the flow velocity. To provide a conservative, or safe, delineation of the PFHA, which covers the potential risk to elderly individuals or lightweight compact vehicles, a comprehensive envelope of all three hazard factors was employed. The threshold for pedestrian hazard based purely on flow velocity, irrespective of water depth, was set to 1.5 m s−1, as also recommended by practitioners, which is considerably more stringent than the guidelines proposed by Martínez-Gomariz et al. (2016). The region characterized by elevated flow velocities, termed the “high hazard zone” for pedestrians by Martínez-Gomariz et al. (2016) (refer to the yellow box in Fig. 2a), is deemed hazardous irrespective of the water level. The threshold for water depth to ensure no hazard for persons in cars was set to 0.3 m.
The criteria for delineating the pluvial flood hazard area (PFHA) are satisfied when the following conditions occur:
Hence, PFHA are areas where pedestrians (mainly due to elevated flow velocities) or vehicles (mainly due to high water levels) are at risk as water depth, flow velocity or the combination of both exceed the defined thresholds.
We purposely did not include the stability of houses or other infrastructure in the PFHA criteria, knowing that damage to houses and infrastructure often are the major source of flood related costs. However, the damage to houses and infrastructures not only depends on the physical exposure that can be estimated form the output of the data of 2d-hydraulic models, but additionally the general structure and design of the individual buildings as well as their interior have a major effect. This data is usually not available on the larger scale. On a case study basis, however, the defined thresholds for water depth and flow velocity seem to match rather well with thresholds used to determine the damage of pluvial floods to private houses (e.g. Singh et al., 2026) or commercial buildings (e.g. Guntu et al., 2026).
3.2 Pluvial Flood Index (PFI)
Pluvial floods are rare, typically local events, complicating the establishment of dependable, site-specific return intervals as established for fluvial floods. Moreover, unrestrained surface runoff or the resultant PFHA is not a viable operational measurement. Hence, long-term time series of the extend of PFHA or other pluvial flood metrics are not existing. Consequently, return periods of pluvial floods must be determined using model calculations, leading to significant uncertainty of the return period. Moreover, the application of return periods (e.g., Grisa, 2013) and its communication with the public may lead to misunderstandings. Finally, no protective framework for pluvial floods exists, in contrast to fluvial floods, which are usually associated with a specified return period to ensure specific protection measures (e.g. protection against a flood with a return period of 100 years: HQ100).
To capture the hazards of a flash flood, the absolute extent of the local PFHA within a certain region is therefore more crucial than the occurrence probability of an event. Absolute thresholds also provide comparability among different regions (e.g., with the assumption of identical precipitation and initial soil moisture conditions) and allow to map the pluvial flood hazard om a regional scale. The pluvial flood index (PFI) is fundamentally based on the relative area fraction of the pluvial flood hazard area (PFHA) to a reference area. The PFI thus represents the relative fraction of the total area where there is a hazard to pedestrians or vehicles due to uncontrolled surface runoff and flooding. Thus, the PFI has a comprehensible, clearly interpretable basis scalable to the regional scale, but still has a tangible reference to the main hazard source of flash floods.
In addition to defining the PFHA, the reference area must be determined for which the fraction of the PFHA is calculated. As reference areas (or denominator), catchment areas (e.g., basic catchment areas), uniform grids, or buffered regions (e.g. circles) are fundamentally suitable (Fig. 3). Additionally, it would be conceivable to determine the PFI only for vulnerable areas of a catchment, for example, only the PFHA fraction in settlements, roads or densely built-up areas.
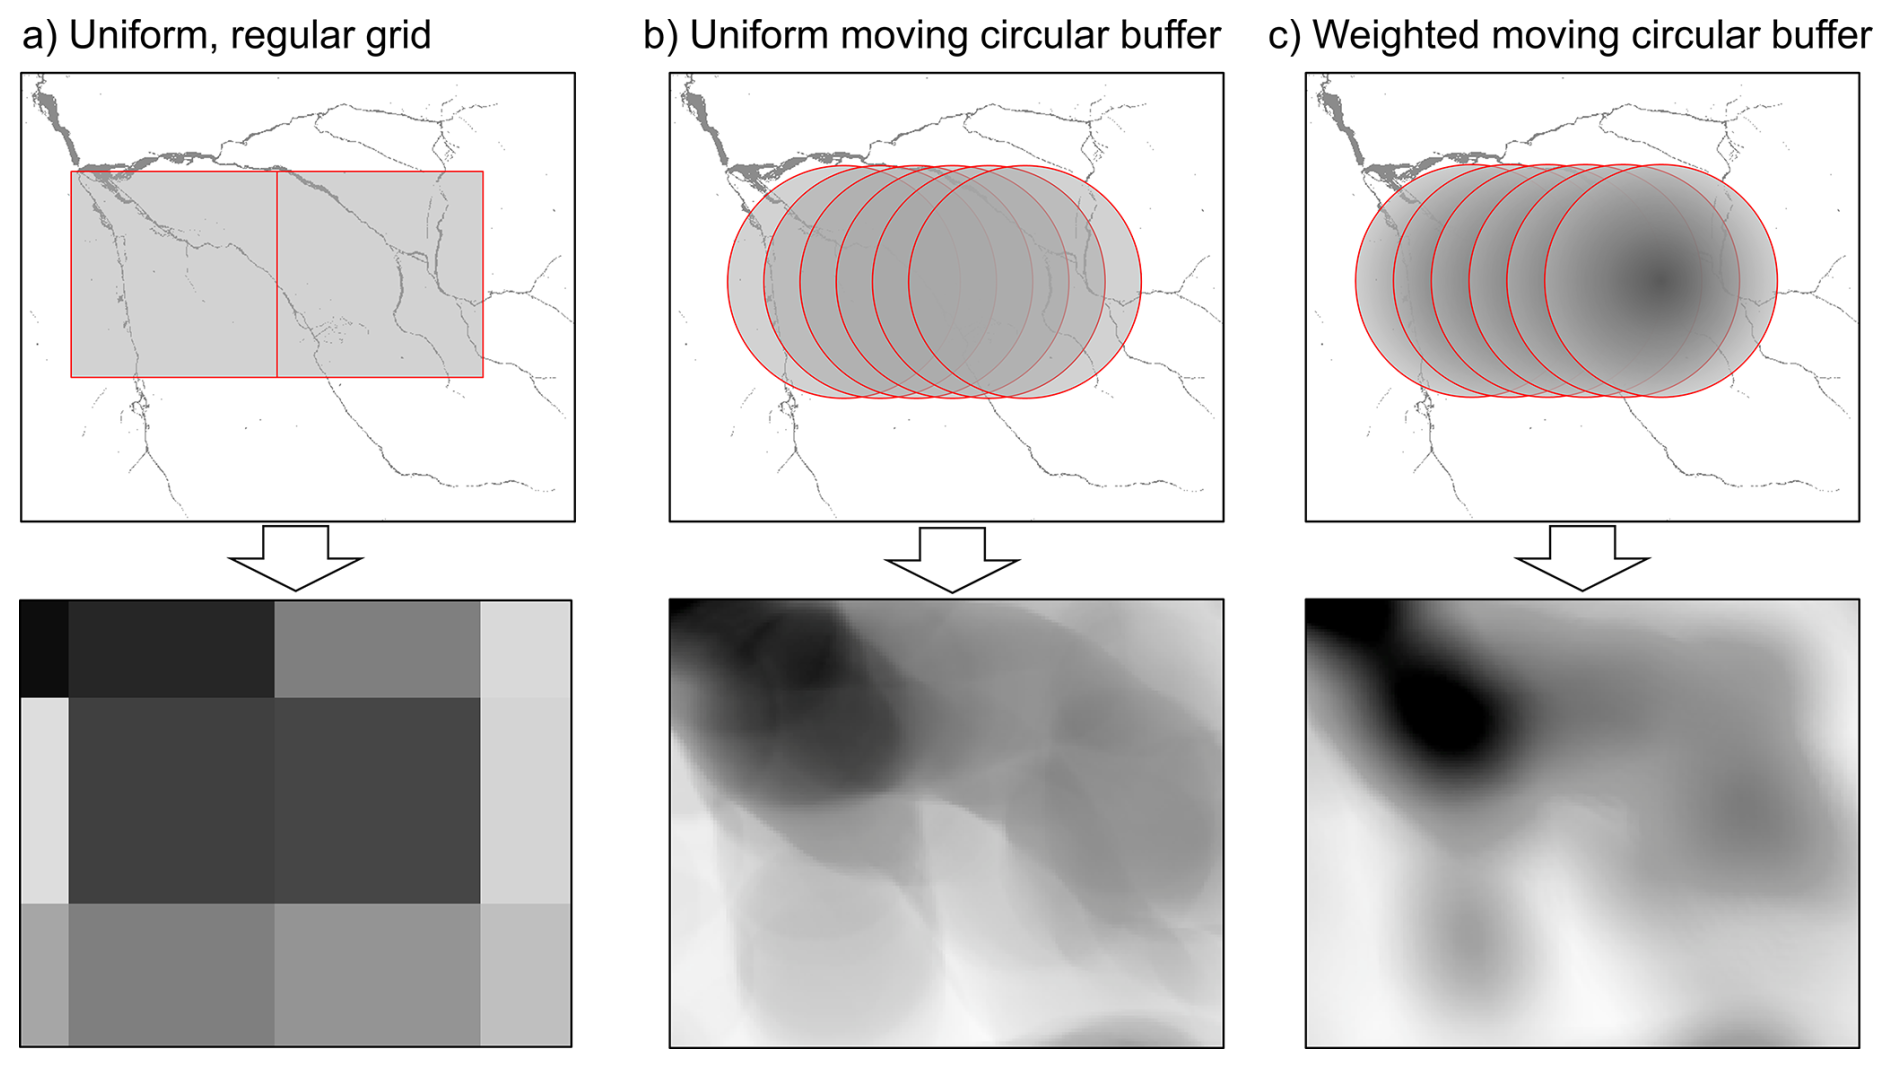
Figure 3Comparison of the three potential approaches to derive the PFHA fraction from the PFHA for a defined reference area with (a) shows the example of applying a uniform, regular grid, (b) a uniform moving circular buffer and (c) a weighted (radial linear) moving circular buffer with the resulting map of PFHA fraction with lower brightness indicating higher fractions.
The PFHA fraction and hence the PFI clearly depends on the size or structure of the reference areas. Natural catchment areas, and especially intermediate catchment areas, are very heterogeneous in terms of their size distribution. In addition, radar products of precipitation, which can be used as input for simulating PFHA and PFI, are usually available as raster data and would need to be regionalized again for the catchment areas when using catchment areas as reference surfaces. Using uniform grids as the reference area for determining the PFI could be an option, but the gridding extend and boundaries among the grids may have strong effects on the PFI. Therefore, we propose instead of using a uniform, regular grid (as typically done for determining heavy rainfall from radar data), to use a moving circular buffer (uniform or weighted by the radius of the circular buffer to focus more on the areas closer to the centre) with the recommended area to visualize the PFI in space.
The larger the reference areas are, the more the local maxima of the PFHA fraction are dampened and the more the differences among neighbouring areas are blurred. The dampening effect, however, is substantially reduced in the case of using weighted moving circular buffer. In addition, for the determination of the PFI, depending on the approach, it may be necessary to assume a comparable amount and intensity of precipitation for the area to be evaluated. In the case of local heavy rainfall, this area should generally not be larger than approximately 5–10 km2 (Lengfeld et al., 2019). On the other hand, disproportionately small reference areas lead to local peculiarities being overemphasized and uncertainties in determining the PFHA resulting in significant uncertainties in the reference area-specific PFI. Furthermore, also the spatial scale and uncertainties of the input data for the hydrological and hydraulic simulations (e.g. radar based precipitation estimates, see section below) as well as the resolution of (large scale) hydrological models have to be taken into account when defining the spatial reference area. Eventually, the PFI is intended for a broad assessment of flash flood hazard, for example at the state level, where regional rather than local differences are to be captured. Against the outlined background, we recommend an area of 2 to 4 km2 as the reference area. For generating our results presented in Sect. 4 we used a weighted moving circular buffer with an area of 2 km2. Here we also briefly discuss the impact of different radii on the PFI results.
In theory, the PFHA fraction can range between 0 and 1 (or between 0 % and 100 %). The PFI is intended to serve as a dimensionless index, primarily for simple and clear communication with the general public. For the information and communication with specialized users, an index is, however, typically only partially suitable.
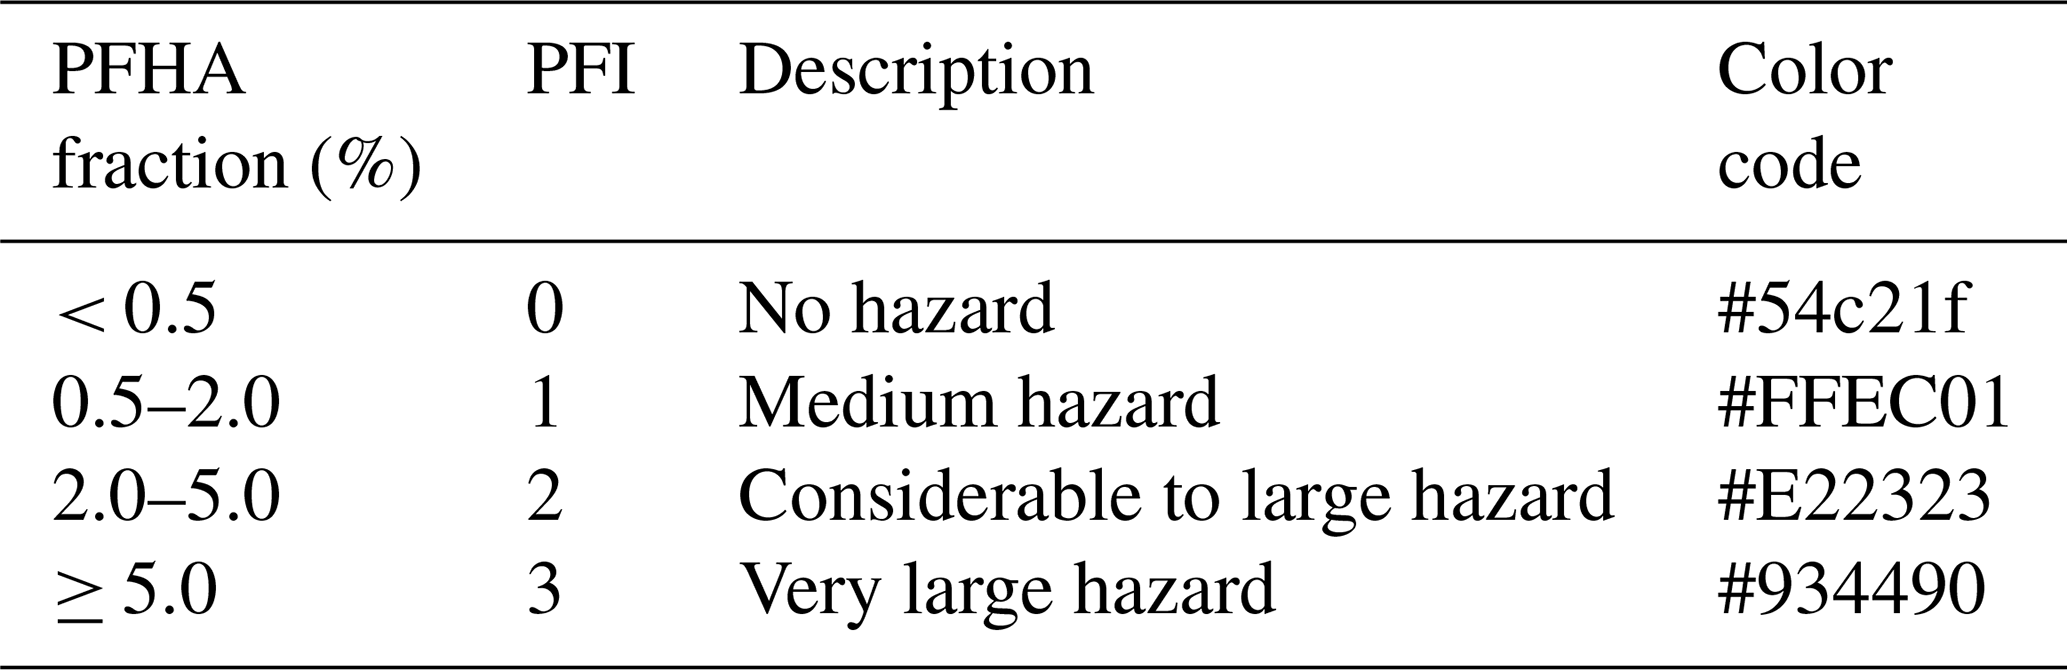
Absolute thresholds are favoured in the context of the PFI for the reasons already stated. These are uniformly established across regions, ensuring comparability among them. In accordance with various stakeholders form the government and flood forecasting services in Germany, the PFI was categorized into four classes according to three thresholds (Table 1). This quantity of classes communicates more than a just binary information (flash flood hazard: yes/no). Conversely, the quantity of classes stays reasonable, allowing for the assignment of a descriptive significance to each class and facilitating unambiguous differentiation among them. A considerably greater number of classes may indicate a classification accuracy that does not align with the actual precision attainable on a broad scale by the PFHA. There are no clearly objective criteria for establishing the thresholds for PFI classification. Nevertheless, the thresholds of PFHA fractions were determined on the basis of a small number of recent flood events with some damage information available (mostly meta-information) as accurately as possible in order to capture relevant hazard situations. The general idea behind the classification is that the larger the flood hazard of a certain event was, the larger also the PFI for the event should be, although substantial damage can also already occur in regions classified with PFI equals 1. A first evaluation with historical pluvial flood events (Krumm et al., 2025) shows considerable skill in reflecting the magnitude of flood hazard by the PFI. However, the thresholds may need to be adopted if more documented information on flood hazards of pluvial flood events might become available in the future or when applied to different regions and countries. Hence, the proposed levels only serve as an initial definition for different pluvial hazards in Germany.
Table 1Classification of the PFI into different absolute hazard levels.
As stated previously, intended use-cases for the PFI are to assess the regional susceptibility to pluvial floods, as well as the real-time warning with respect to the potential occurrence of hazardous pluvial floods. Since both applications aim at the region to state level, the PFI needs to aggregate the local data into an information that can be assessed on the intended scale. Hence it is important to state that the PFI is intended to identify regions affected by pluvial floods and hence trigger local action by stakeholders. However, the required local flood management measures need to be based on detailed inundation estimates from local flood risk assessments or the locally derived PFHA extent. An example of how the PFI can be linked to existing pluvial flood maps on a municipality level is provide by Krumm et al. (2025).
3.3 Selected data and models to derive PFHA and PFI
In theory, a wide range of different models can be applied to derive the baseline data for the estimation of PFHA and PFI. However, there are a few requirements for the hydrological and hydrodynamic models. The distributed hydrological models must primarily be capable of accurately representing the highly dynamic temporal formation of overland flow due to infiltration or saturation excess under high rainfall intensities. As the surface characteristic are spatially very variable, the spatial resolution should be relatively high in the order of 1 to 5 m to capture the size of roads and buildings. The process-based hydrological model RoGeR (Steinbrich et al., 2016; Schwemmle et al., 2024) was selected for this study as it allows long-term simulation to define initial conditions, captures all runoff generation processes at a high temporal resolution of 5 min, was evaluated in many catchments in the area of South-West Germany and even at smaller spatial scales of hillslopes with high intensity rainfall experiments (Steinbrich et al., 2016; Ries et al., 2020).
The concentration and accumulation of surface runoff can be simulated using suitable 2D hydraulic models including shallow water table calculations and an accurate mass balance. Of course, the spatially distributed and temporally dynamic input from the hydrological model must be taken into account. As we plan to derive PFHA and PFI for larger areas with a spatial resolution smaller or equal to 5 m, computation time plays a crucial role. This is even more crucial, when the PFI is used in real time forecasting systems. Models whose time requirements are significantly reduced even for relatively large-scale calculations compared to established models are now available (e.g. Apel et al., 2022) or simplified hydrodynamic approaches can be applied (e.g. Leistert et al., 2026). For larger scale applications, the nowadays available high-resolution DEM from airborne LiDAR sensing is in term of spatial resolution and accuracy very good (Liu, 2008; Saksena and Merwade, 2015). However, the surface models are usually not capturing all relevant drainage structures like culverts, creeks under small bridges or other kind of artificial water retention infrastructure (Lindsay and Dhun, 2015). Hence, these DEM must be pre-processed to make sure that the derived water depths and velocity maps are as accurate as possible. In addition, the 2D hydraulic models should allow for concurrent simulation of the three variables maximum water depth, maximum flow velocity and maximum specific surface runoff (see Eq. 1). For this study, we apply the new approach AccRo (Leistert et al., 2026), as it allows for fast and reliable simulation of the necessary variables at a spatial resolution of 5 m defining the surface roughness according to the land-use and surface characteristics as defined in LUBW (2016). As for the majority of the available hydrodynamic models, AccRo does not consider erosion or other geomorphological processes potentially altering flow paths in the cause of an event.
For the precipitation data temporally and spatially well resolved data products are needed. For the application of the PFI in real time forecasting systems or for the post-event analysis radar-based precipitation products in 5 min temporal resolution are semi-operationally available for the whole of Germany at a spatial resolution of 500 to 1000 m for the real time nowcasting or even higher at 250 m resolution in the case of post event analysis (see Sect. 4.1, Weiler et al., 2019).
If the PFI is used to assess the regional susceptibility to pluvial floods (see Sect. 4.2), precipitation input is usually provided in the form of design rainfall events for different event durations. These data are based on extreme value analysis of heavy rainfall events recorded at stations and then spatially interpolated. For Germany the reference data set for heavy rainfall design events would be the so called KOSTRA dataset (KOSTRA V2020, Junghänel et al., 2023) providing estimates of rainfall sums for different event durations and return periods on a spatial scale of 5 km × 5 km. For the state of Baden-Württemberg, additionally a data set of design rainfall events is available at 1 km × 1 km resolution (LUBW, 2016). This data was used for the SFI example described in Sect. 3.2.
Note that the application of design rainfall events results in widespread heavy rainfall input which would lead to unrealistically high flooding in the downstream areas. In reality, however, extreme rainfall events of convective nature have a certain spatial extend only (e.g. Lengfeld et al., 2019), generally limiting the amount of water available for pluvial flooding. To incorporate this into the process of flow accumulation usually an accumulation threshold is set, that defines the maximum accumulation area (e.g. LUBW, 2016). Beyond this threshold, the capacity of the main drainage system is assumed to be large enough to completely capture the accumulated flows, hence for cells with accumulation areas above the threshold, accumulated flow is set to zero.
4.1 Hindcasting the flash flood of 2024 in the Wieslauf catchment, Germany
We selected an extreme pluvial flash flood event that occurred in the evening of 2 June 2024 in the Wieslauf watershed (Rems-Murr-Kreis) to illustrate and elucidate the procedures and outcomes of our methodology for producing PFHA and PFI maps. The event caused extensive pluvial and fluvial flooding. The discharge recorded at the gauge at the confluence of the Wieslauf river into the Rems river was far above the discharge with a 100-year return period. The estimated damages in the catchment exceeded EUR 300 million (Landtag von Baden-Württemberg, 2024).
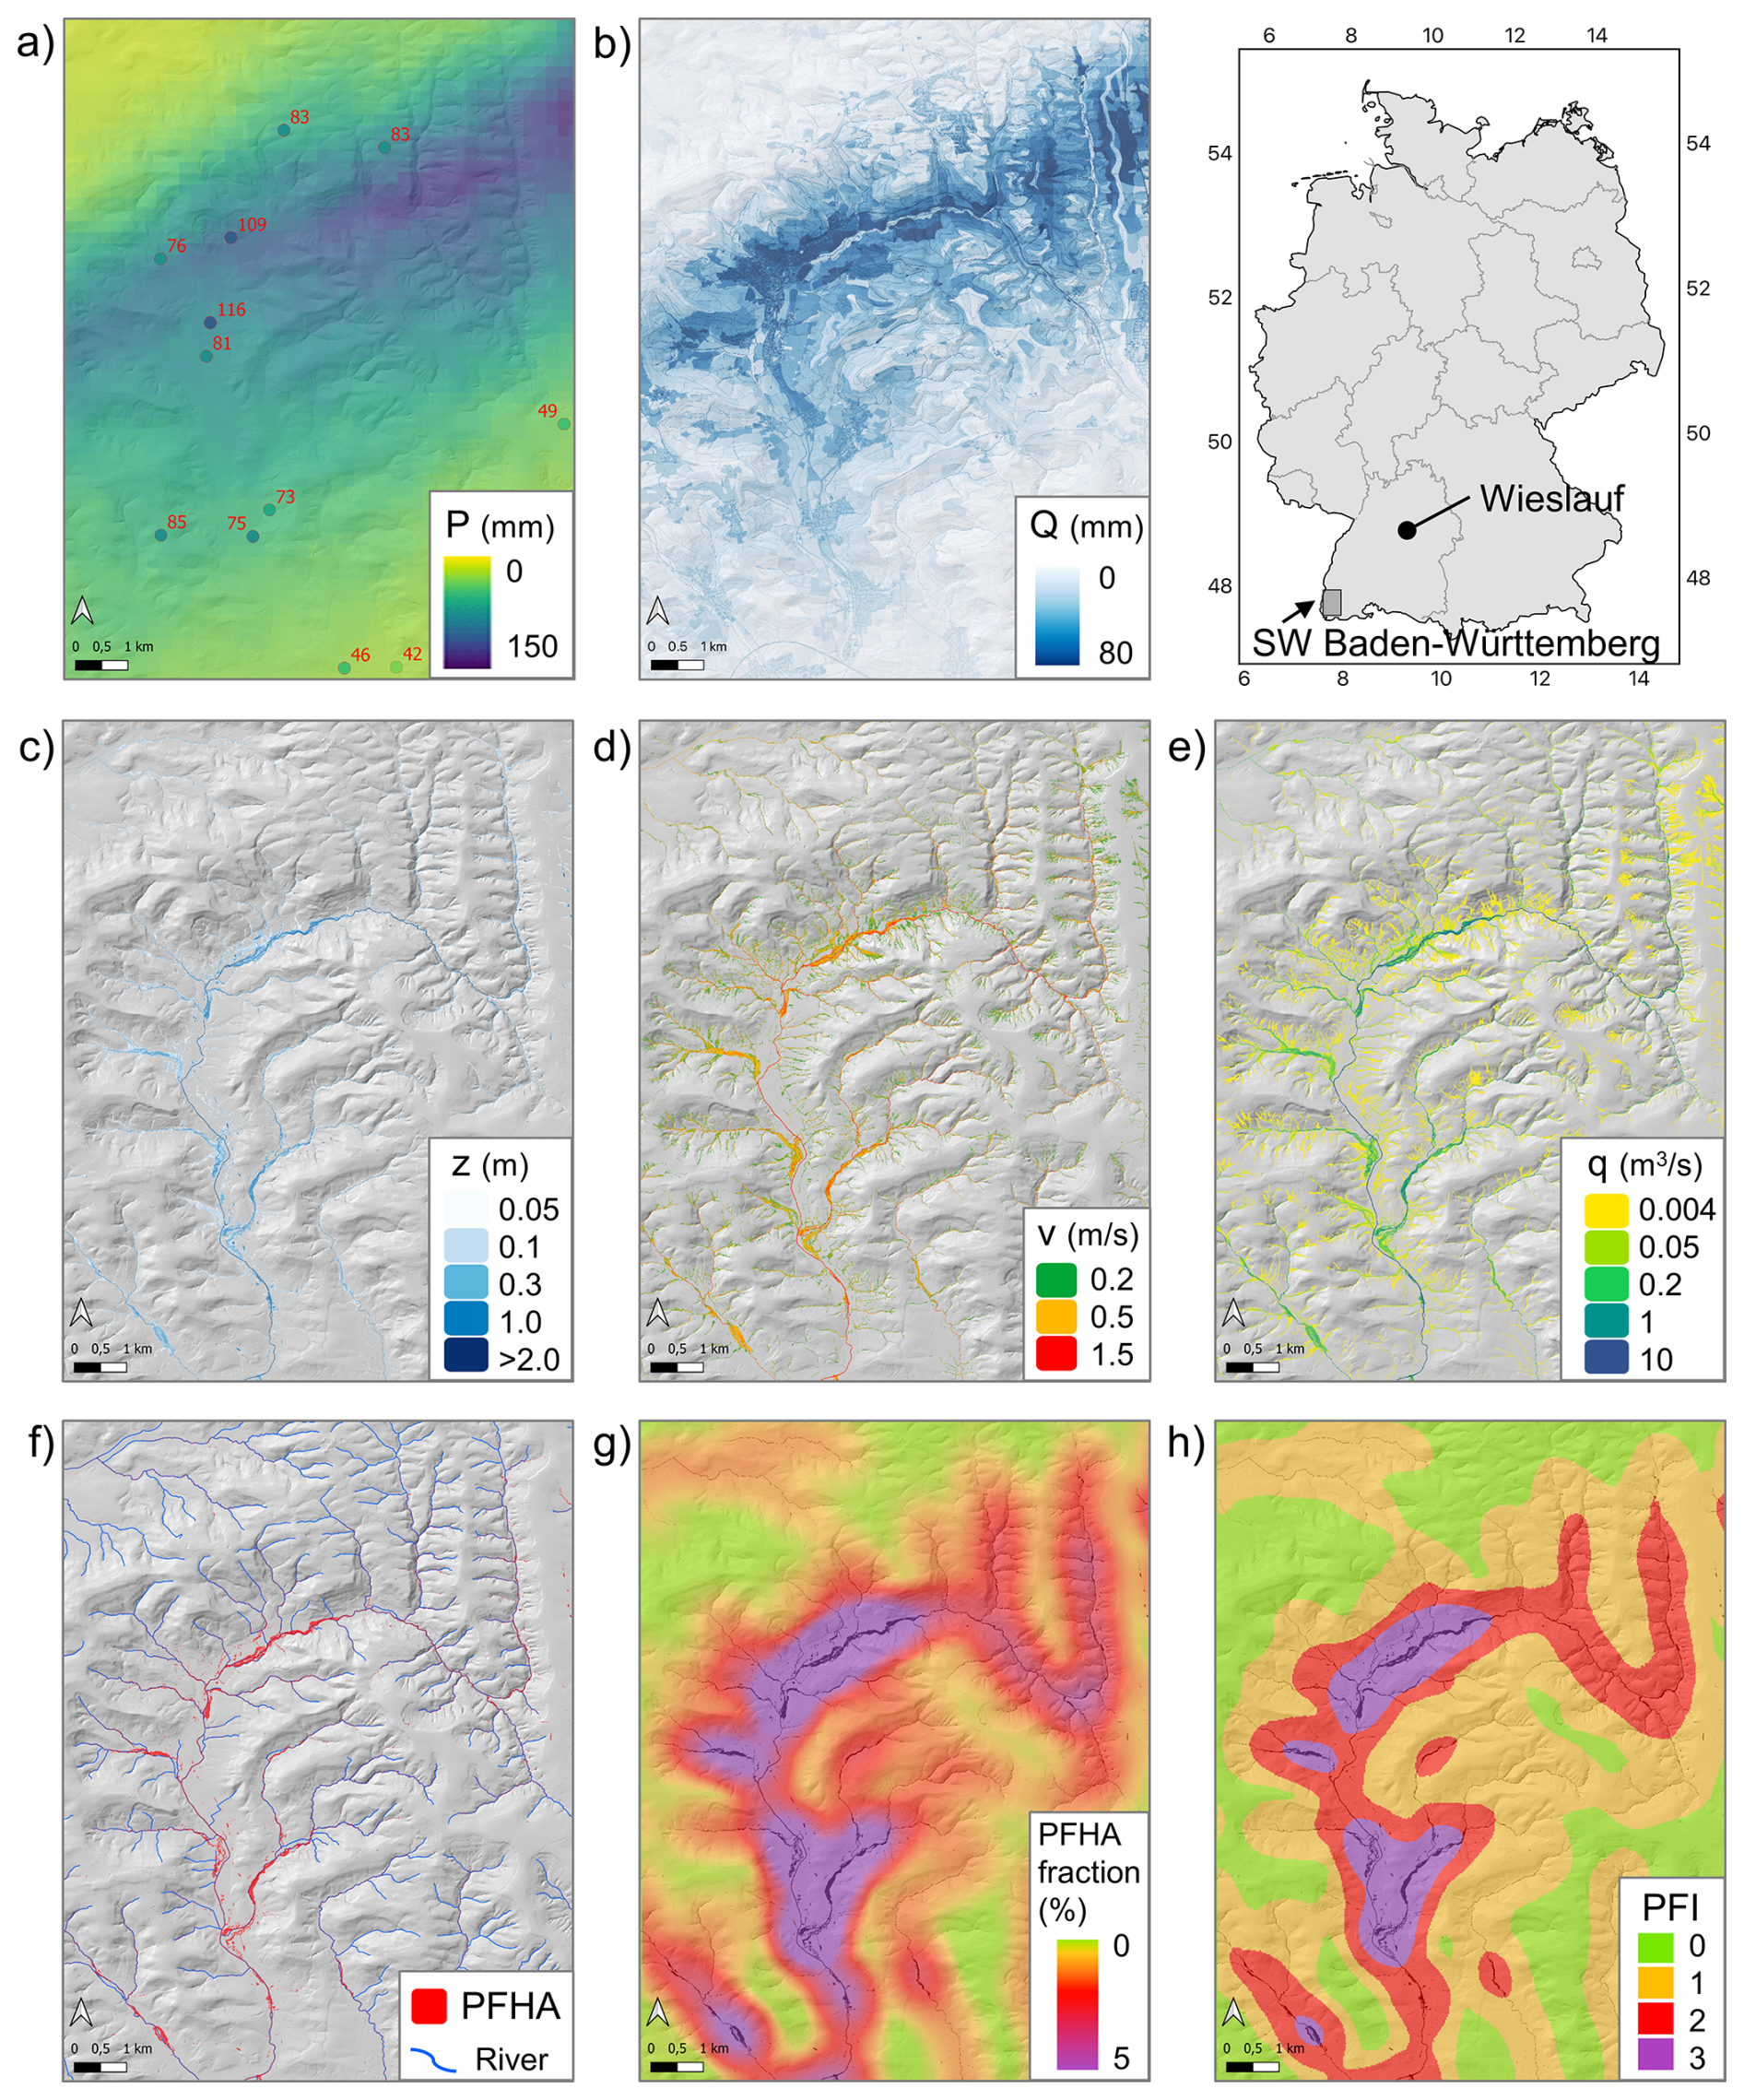
Figure 4Hindcasting the flash flood event in the Wieslauf catchment on 2 June 2024 with (a) total event radar-based QPE including measurements at stations at reported total event rainfall, (b) total overland flow, (c) maximum water depth (z) of the surface runoff with (d) related maximum velocity (v), (e) maximum specific surface runoff (q), (f) resulting extend of the PFHA, (g) PFHA fraction and (h) PFI using a moving 2 km2 circular reference area. Spatial resolution is 5 m. The SW Baden-Württemberg region also marked in the location overview panel is the focus regions of the analysis presented in Sect. 4.2.
The radar-derived quantitative precipitation estimates (QPE) of the event with a spatial resolution of 250 m and a temporal resolution of 5 min were summed up for the period between 15:30 and 21:30 UTC and compared with observation of private weather stations (not utilized for generating the radar-based QPE) in the region and weather stations of the DWD (Fig. 4a). The station's maximum event sum of 110–120 mm aligns well with the estimated QPE maximum of 130–140 mm. The overall quantity and geographical distribution of the region over 80 mm, as determined by radar-based QPE, were accurately represented, with minor underestimations in the northwest and southeast (Fig. 4a). The convective rainfall event progressed from northeast to southwest, traversing the map extent in 4 h, with two separate peaks in intensity.
Utilizing the hydrological model RoGeR, we simulated the generation of overland flow (infiltration and saturation excess) with high initial soil moisture conditions (as simulated by RoGeR's water balance module for the event date caused by an extensive wet period of about 2 weeks directly preceding the event) at a spatial resolution of 5 m and a temporal resolution of 5 min. Figure 4b illustrates the total overland flow generation, with elevated values in regions of peak rainfall, as well as high values associated with urban settlements, roadways, and certain soil types.
Figure 4 also illustrates the outcomes of the 2D hydrodynamic simulation utilizing the surface runoff from the hydrological model, maintaining identical spatial and temporal resolution. The DEM was adjusted to facilitate flow in all creeks and rivers in accordance with the delineated stream network. All buildings were considered specifically in the DEM to facilitate surface runoff around buildings. The maximum water depth (Fig. 4c), maximum flow velocity (Fig. 3d), and maximum specific surface runoff (Fig. 4e) exhibit the characteristic pattern of surface runoff in valleys and concave slopes, (the underlying hillshade in grey depicting the terrain features). The considerable rainfall event caused overland flow on the hillslope (Fig. 4b), which drained into the Wieslauf River, causing it to breach its banks and generate significant fluvial flooding along the river's main stem in the lower catchment area. According to the definition of the PFHA (Eq. 1), their extent is mapped in Fig. 4f. The resulting PFHA fraction (Fig. 4g) and PFI (Fig. 4h), employing a dynamic 2 km2 circular reference area without an accumulation threshold, illustrates a large region with a PFI of 3 (very large hazard) and extensive areas with a PFI of 2 (considerable to large hazard), attributable to the event's extensive spatial extend. The settlements experiencing the most significant damage and fatalities were situated in the highest PFI, however considerable damage to forest roads and bridges was also observed in PFI 2, which is to be expected, since there is still a certain fraction of the area classified as PFHA.
For two hot spot regions within the Wieslauf catchments we have information on observed maximum water levels available, which can give a hint towards the credibility of the PFHA classification. The data was collected a few days after the extreme event and is mainly based on flood marks. In Fig. S1 in the Supplement the estimated maximum water depths are plotted jointly with the simulated maximum water depth. While for locations further away from the Wieslauf river the match between reconstructed and simulated maximum water depth is very good, the model simulations strongly (more than 1 m) underestimate the flooded regions close by the river bank. Due to the extremely wet pre conditions, the Wieslauf river already was experiencing a moderate fluvial flood event (5–10-year event) at the onset of the pluvial flood event. This led to the effect that at certain regions along the river flooded and build up effect was occurring. Since in the 2D hydrodynamic simulation the initial water depth in the river was set to zero, however, this effect could not be simulated. Still the PFHA thresholds are widely reached in the hydrodynamic model simulation, resulting in the highest PFI values in the region.
4.2 PFI hazard mapping (flash flood hazard maps)
The second example illustrating the potential of the PFI is the creation of a PFI or flash flood hazard map. The objective is to determine PFHA based on a defined amount and intensity of rainfall for a specified return period for an extensive area. In regions susceptible to pluvial flooding, the PFI should be high, indicating possible hazard when heavy rainfall events occur. The hazard maps offer an initial indication of whether towns need to implement further measures to prepare for pluvial flooding. To simulate the PFHA, we utilized the already existing overland flow generation maps created for the entire state of Baden-Württemberg to assist the states pluvial flood risk assessment (LUBW, 2016).
The overland flow generation maps were produced using the RoGeR model, based on 1 h rainfall events with varying return times (we selected a 100-year event for our example) and median initial soil moisture conditions throughout summer. The overland flow generation maps for the designated area in SW Baden-Württemberg (refer to location and extent in Fig. 4) is presented in Fig. 5a. The regions exhibiting elevated levels of overland flow are situated in the western lowlands and the hilly terrains west of the Black Forest. The Black Forest itself shows low values of overland flow generation despite higher precipitation, as the predominantly forested soils are highly permeable and runoff generation is primarily dominated by subsurface stormflow, particularly in winter (Bachmair and Weiler, 2012). Utilizing the identical 2D hydrodynamic model AccRo, now with an accumulation threshold of 10 km2 to only capture pluvial flooding, we simulated the PFHA (Fig. 5b). The PFI was determined and illustrated in Fig. 5c using the identical 2 km2 circular reference area. The PFI identifies certain places with a high hazard, while numerous areas possess a PFI of 0, indicating no danger to pluvial flooding.
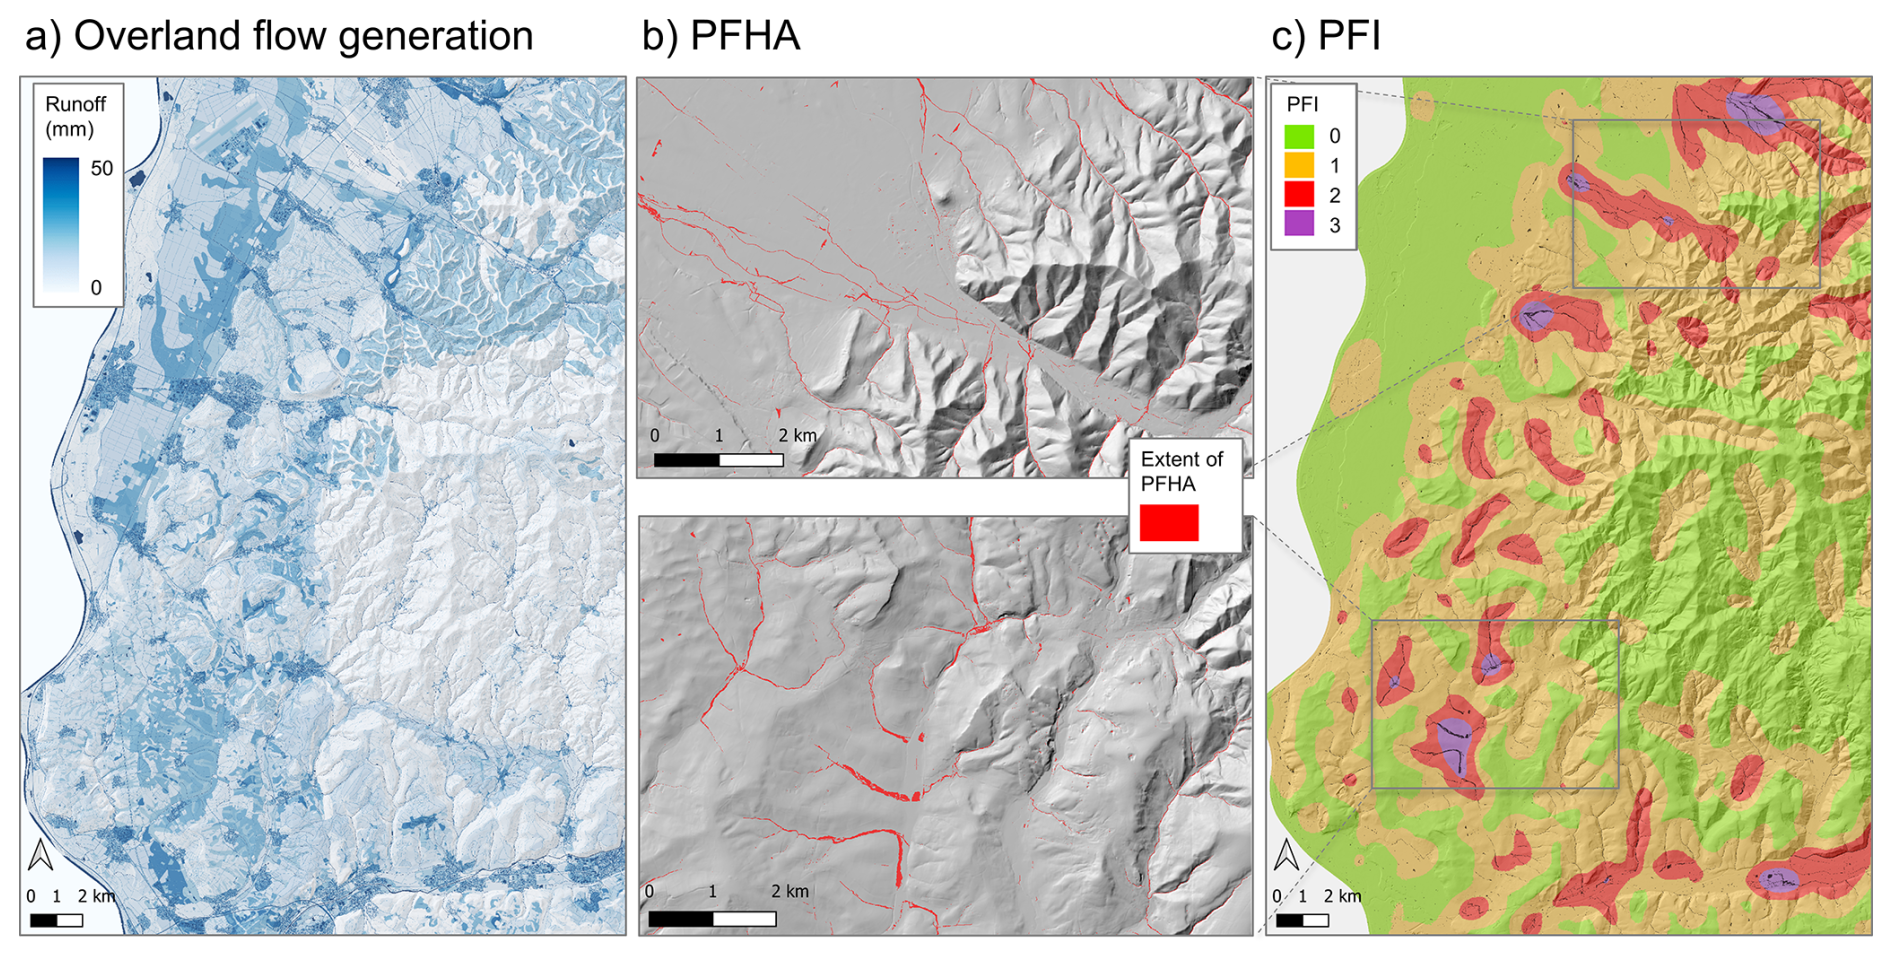
Figure 5The three steps to derive PFI hazard maps: (a) overland flow generation for a 1 h precipitation event with a return period of 100 years simulated with a hydrological model, (b) the resulting PFHA in two selected areas using a 2D hydraulic model with an accumulation threshold of 10 km2 and (c) the resulting PFI using a moving 2 km2 circular reference area. Spatial resolution is 5 m.
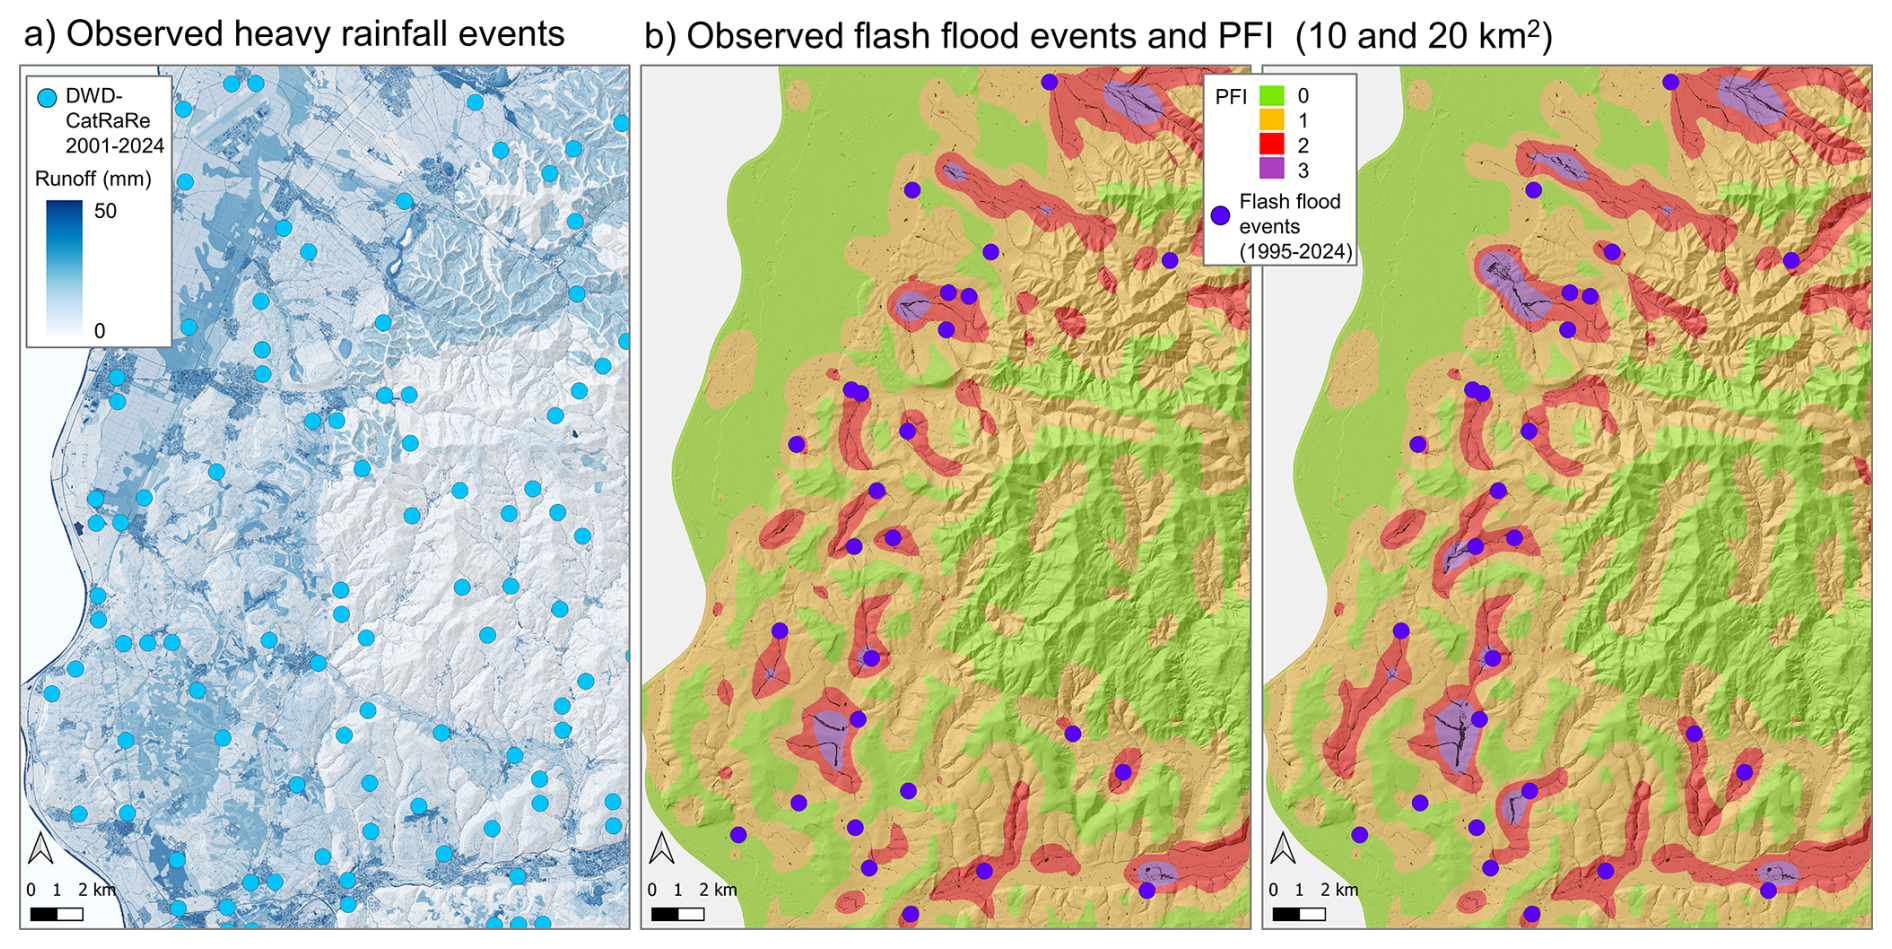
Figure 6Comparison of the PFI hazard map with (a) observations of heavy precipitations events with a duration less than 4 h from the DWD-CatRaRe database and (b) the locations of flash floods in comparison with the PFI with an accumulation threshold of (left) 10 km2 and (right) 20 km2.
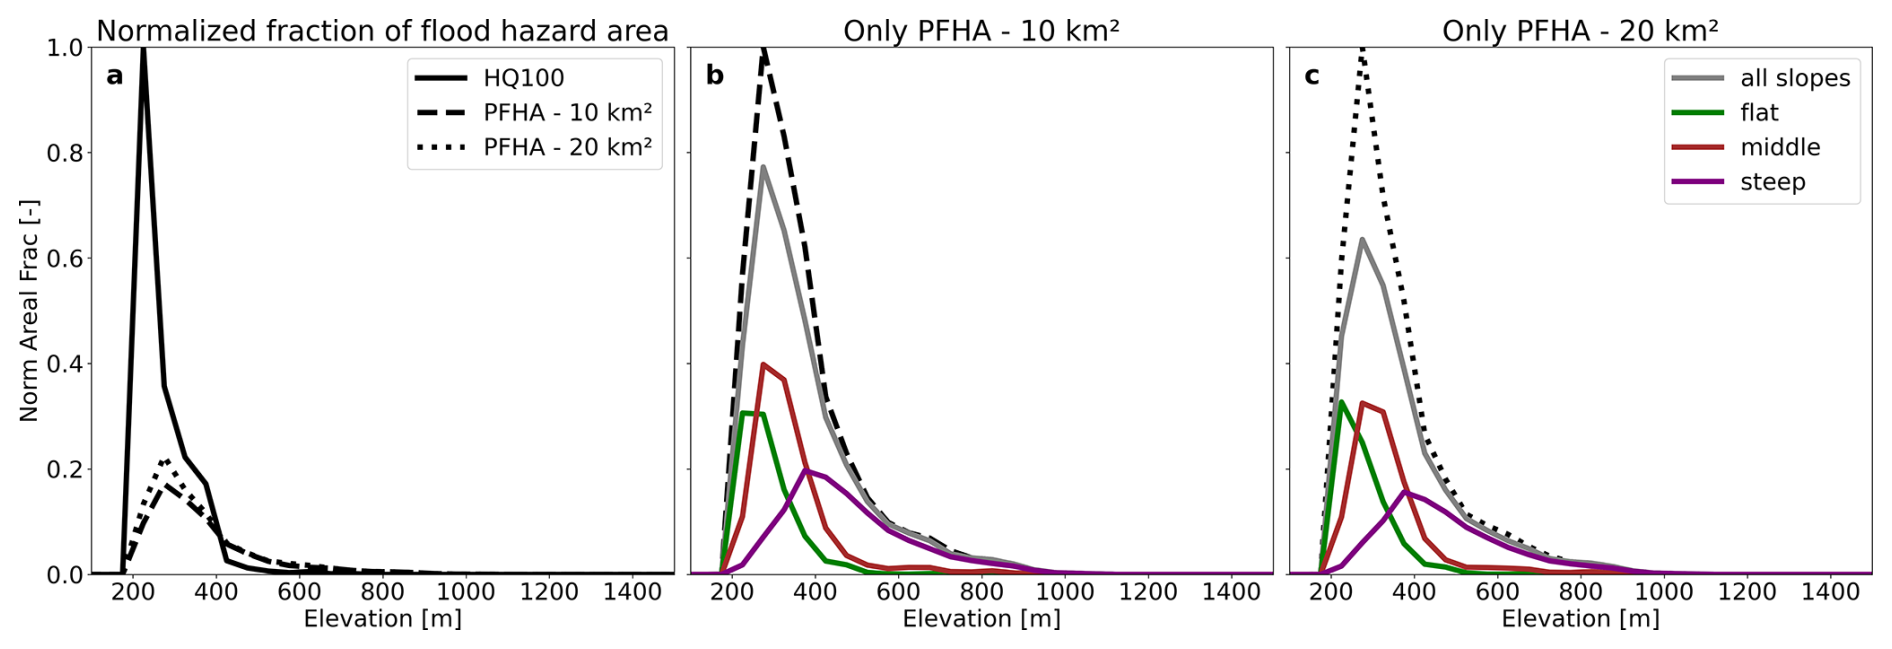
Figure 7Comparison of PFHA with HQ100 flood extent. Panel (a) shows the normalized (by the maximum number of HQ100 cells over all elevation bands) fraction of HQ100 as wells as PFHA fractions (for two different accumulation thresholds) over the different elevation bands. Panels (b) and (c) show the normalized (by the maximum number of PFHA cells over all elevation bands) PFHA fraction for 10 and 20 km2, respectively. The stippled/dotted black line represent the distribution of PFHA fractions depicted in panel a. The grey line represents the distribution of the PFHA fraction outside of HQ100 areas, independent of cell slope. The coloured lines depict the same, but classified by the cells gradient.
Direct validation of the PFI hazard maps is challenging due to the absence of long-term data of pluvial floods. One possibility, however, is to compare it with recorded heavy rainfall events. A quantitative data accessible is the radar-derived mapping of heavy precipitation occurrences from the DWD in the CatRaRe database (Lengfeld et al., 2021). We picked events from Version 2025.01 spanning the years 2001 to 2024 determined from RADKLIM-RW. In order to only include rainfall events potentially causing pluvial floods, we only considered shorter events (event duration less than 4 h) exceeding a 5-year return period. Figure 6a depicts the selected rainfall events against the overland flow generation in the background. As anticipated for events with a low return period during an observation span of 22 years, the events plot relatively regularly and exhibit no discernible spatial pattern. On top of the heavy precipitation data, we successfully augmented an existing database concerning the locations of flash flood incidents that caused damage to structures and roads. The dataset was originally compiled by the state authorities in Baden-Wurttemberg (LUBW, 2016) and has meanwhile been updated to encompass the period from 1995 to 2024. Since the database only provides the information in which municipality an event occurred, but does not include any information on the severity or spatial extend of the flooding, we use the centre coordinates of the affected municipalities to juxtapose the flash flood incidents with the PFI in Fig. 6b. To evaluate the impact of different accumulation thresholds on replicating the PFHA, we contrasted the original configuration of 10 km2 with a revised configuration of 20 km2. The geographical distribution of flash flood incidents during the past 30 years as recorded in the state's data base correlates well with areas of elevated PFI, especially when investigating the PFI with a 20 km2 accumulation threshold. All observed flash flood incidents occur in regions classified as PFI 2 and 3. Moreover, it is highly relevant that no occurrences were recorded in regions with a PFI of 0, although several intense rain events were recorded in these regions (Fig. 6a). It is evident that several extreme rainfall events occur in regions with a low PFI and no observation of flash floods (see below). Therefore, the hydrological processes with the specific spatial pattern of overland flow generation and/or the terrain inhibits significant effects on the accumulation of surface runoff, resulting in the absence of simulated PFHA.
Although it becomes clear, that the majority of PFHA and hence also PFI hazard areas are occurring in or close to the valley bottom regions of the study area, they are not necessarily confined to rivers and broader floodplains. To proof this, we used the publically available HQ100 extend map (accessed via the LUBW web server) for the region and compared the fraction of PFHA within this HQ100 flood zone (Fig. 7). For a direct comparison we rasterized the HQ100 data to the PFHA extend and resolution using QGIS, so a direct 1 to 1 comparison is possible. It becomes obvious that in the lower regions of the study area the HQ100 flood extend is much larger than the PFHA, which is a consequence of the applied accumulation thresholds. For higher elevated regions, however, we have relatively more PFHA than HQ100 cells (Fig. 7a). If only PFHA cells outside the HQ100 zone are analysed (bold lines in Fig. 7b and c), we see that actually a large fraction of PFHA is located outside the HQ100 zone. Especially for higher elevated areas (above ∼ 450 m) almost all PFHA occurrences are outside HQ100 zones. Since the PFHA cells in the elevation band are largely bound to relatively steep gradients it can be concluded, that here mainly the thresholds for v and/or q play the major role. An overview of the spatial patterns of HQ100 over the full SW Baden-Württemberg region is given in Fig. S2. Here we also depict the PFHA and HQ100 areas for the two selected regions depicted in Fig. 5. Also from this analysis it becomes obvious that PFHA and HQ100 regions substantially differ.
The PFI maps shown in Figs. 5 and 6 were generated using a weighted moving circular buffer with a 2 km2 area. To assess the sensitivity of spatial PFI distributions to buffer size, we also produced maps using 3 and 4 km2 buffers (Fig. S3). The weighting scheme preserves the dominant PFI patterns across all three buffer sizes; only minor, localized shifts between PFI 1 and PFI 2 occur. Because these small variations do not alter the overall warning potential, the aggregation of local PFHA data into mesoscale PFI values can be considered robust.
The Pluvial Flood Index (PFI) was developed as a straightforward, dimensionless regional-scale index primarily for public communication. The aim is to provide information regarding pluvial flash flood hazards for early warning and the evaluation of flash flood hazards, extending beyond a simple heavy rainfall alert. To guarantee that the PFI, as a classified index, possesses substantial relevance and that relevant flash flood scenarios are precisely evaluated utilizing the PFI, the scientifically sound estimation of the Pluvial Flood Hazard Areas (PFHA) employed for the PFI classification is of paramount importance. The suggested thresholds for calculating the PFI from the PFHA fraction (Table 1) needs further evaluation. Nonetheless, the comparisons and instances in this study, along with other previous assessments of more historical occurrences (Krumm et al., 2025), demonstrate a somewhat solid and functional classification.
The PFI shares similarities with existing flood or landslide warning approaches that utilize rainfall thresholds (e.g., DWD, MeteoSwiss) or those that integrate rainfall thresholds with soil moisture indices (e.g., Brigandì et al., 2017). However, it directly evaluates the extent of pluvial flooding and is hence more spatially explicit. Other spatially explicit methodologies, such as the flood hazard index (FHI) (Kazakis et al., 2015; Kabenge et al., 2017) or the Flash-Flood Potential Index (FFPI) (Popa et al., 2019), rely solely on various static causal elements or Neural-Network Model and are considerably more challenging to assess and implement in flood forecasting systems.
To apply the PFHA/PFI concept as a sound estimate to identify pluvial flood hazards it is essential that all important hydrological and hydrodynamic processes that contribute to flash floods are incorporated in the base line data to derive PFHA and PFI. This requires a model chain consisting of rainfall forecasts (seen as a warning system), a hydrological model and a hydrodynamic model. Given that several current fluvial flood forecasting systems already include the initial two systems, future emphasis will be on establishing a suitable connection with hydrodynamic models or alternative methodologies that facilitate the prediction of PFHA through the generation of overland flow. Nonetheless, the hydrological models need to consider the relevant runoff generation processes in an adequate spatial resolution. Numerous federal states possess appropriate time-efficient models for area-disaggregated runoff generation calculations that account for infiltration excess, such as the state-wide RoGeR model in Baden-Württemberg (Steinbrich et al., 2021). The hydrological model LARSIM, which is already widespread for operational flood-forecasting is an appropriate alternative (Bremicker et al., 2013). LARSIM includes an adequate dynamic infiltration module and it has proven to perform well for pluvial floods, and similar to RoGeR (Haag et al., 2022b). LARSIM models with a dynamic infiltration module are available for the German federal states of Baden-Württemberg, Rhineland-Palatinate, Hesse, North Rhine-Westphalia and parts of Bavaria as well as for Luxembourg and the French part of the Rhine catchment (Haag et al., 2022b).
The PFHA/PFI concept can serve as the key information in order to provide an end user-tailored large-scale flash flood warning systems in the future. Such systems necessitate the effective simulation of the PFI across extensive regions. In addition to the existing hydrological models, there is a need for large-scale, computationally efficient models for runoff concentration and 2D-hydrodynamic simulations. Indeed, they present a challenge for operational calculations; however, recent advancements in high-resolution 2D hydrodynamic modelling (Khosh Bin Ghomash et al., 2025; Apel et al., 2024, 2022; Buttinger-Kreuzhuber et al., 2022) and rapid alternative methods such as AccRo (Leistert et al., 2026) are now available.
Beside operational pluvial flood forecasting and warning, the PFI can also be used for extensive evaluations of pluvial flash flood susceptibility. This extensive comparative evaluation facilitates the prioritization of precautionary measures specific to pluvial flooding, including the development of comprehensive pluvial flood hazard maps at the municipal or village level (refer to the existing methodology in Baden-Württemberg) and the formulation of alarm and deployment strategies for flash floods. To ensure that the PFI serves these applications optimally, the PFI can additionally be linkable to more detailed specialized information like detailed hazard maps of PFHA of a settlement.
The PFI hazard map presented in Sect. 4.2 can be readily expanded to encompass larger regions, provided that a suitable hydrological model has been established and assessed. In this context, hydrodynamic simulations pose fewer challenges, as they are required solely for particular scenarios, thereby mitigating concerns regarding the rapid execution of such models.
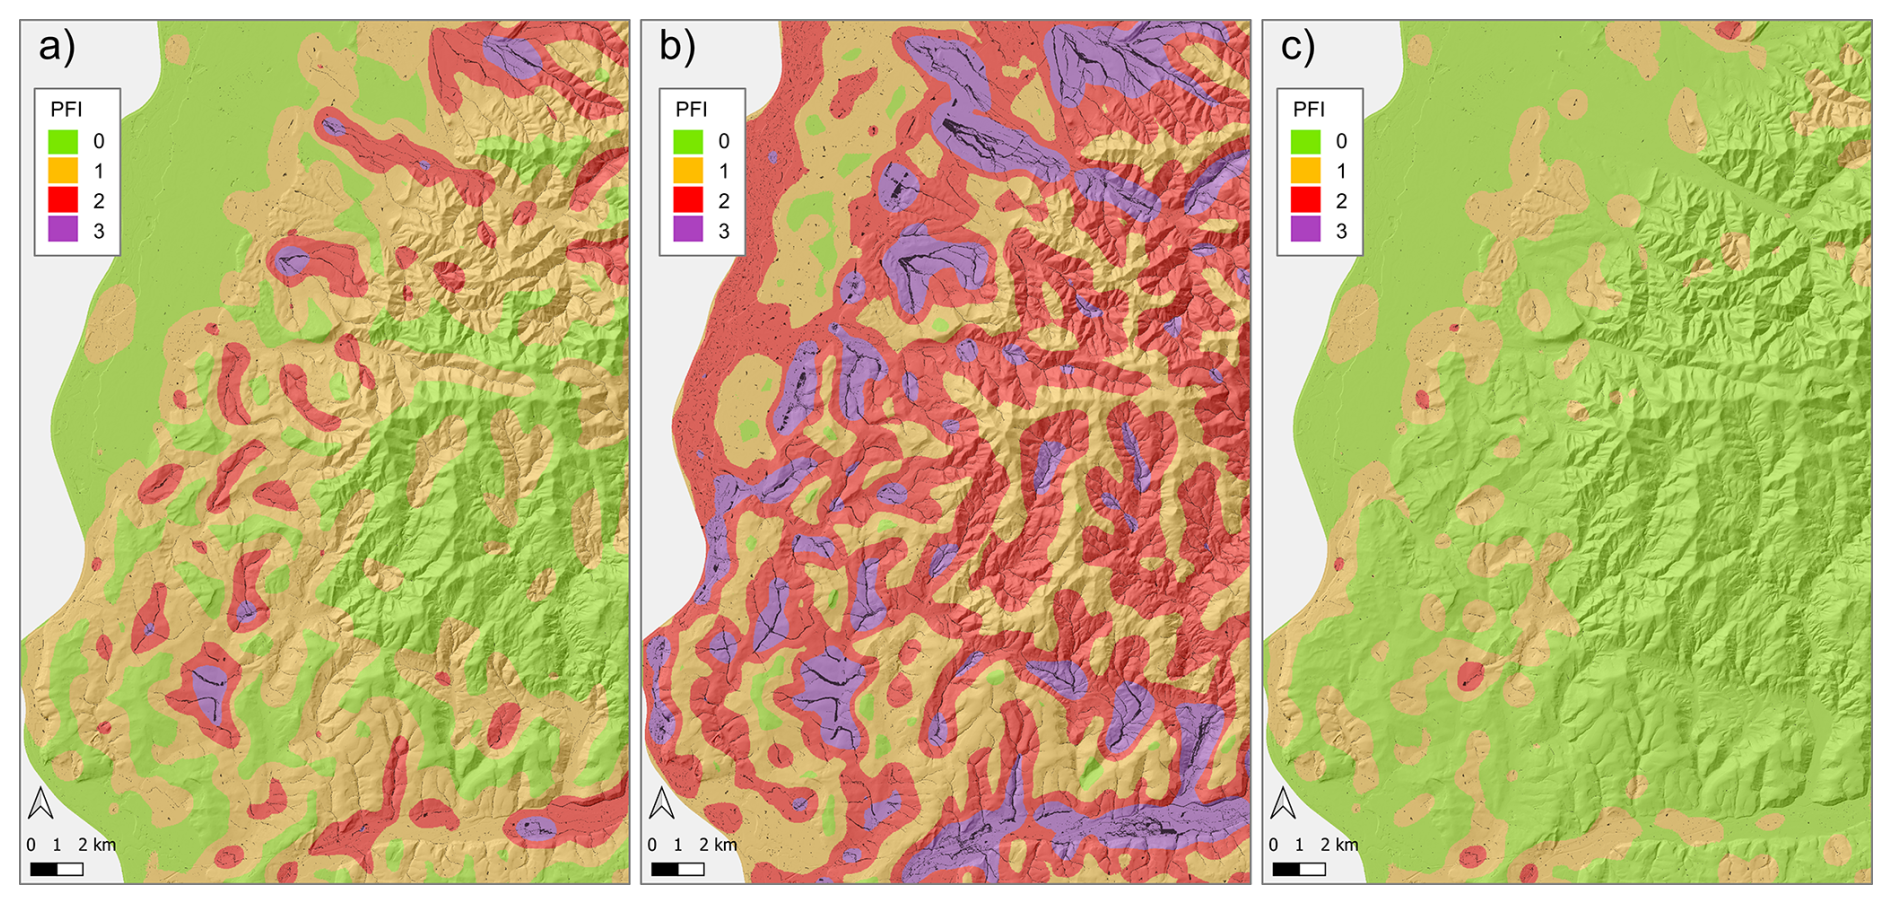
Figure 8Comparison of the PFI hazard map using (a) simulated surface runoff and (b) precipitation estimates as input. Accumulation threshold for both maps is set to 10 km2. In panel (c) additionally a PFI hazard map based on surface runoff but with the river network as infiltration spots instead of a fixed accumulation threshold is shown.
Still, it is key that both, the hydrological as well as the hydraulic processes have been considered previous to the definition of the PFHA and PFI. To demonstrate the lack of including the process of runoff generation into the hazard analysis, we compiled the PFI for the previously introduced region in SW Baden-Württemberg using model surface runoff based on the Model RoGeR as described in Sect. 4.2 (Fig. 8a) as well as using directly the precipitation input (Fig. 8b). The latter setup is currently proposed for the nationwide pluvial flood maps in Germany (Wimmer and Hovenbitzer, 2025). Here basically all major valley structures would be classified as hazard areas, generating a large overlap with fluvial flood hazard maps. As a result, such maps based on data ignoring major hydrological processes clearly do not represent pluvial flooding, but rather demonstrate the potential of a fast 2D hydrodynamic model without taking into account the processes and scales relevant to pluvial floods.
We further compared our approach of defining fixed accumulation thresholds with the Swiss approach of defining each water body as having infinite water uptake capacity (Fig. 8c). It becomes obvious that especially the flood hazard areas in the upstream parts of the smaller creeks are disappearing in the Swiss approach. However, often the overflow from the small creeks in combination with blocked culverts and forest paths often play an important role in redirecting water into settlement structures. Comparing panels (a) and (c) in Fig. 8, however, also reveals regions, where there is no difference, again demonstrating that flood hazard regions defined via the PFI are not necessarily constrained to flood prone river beds.
The Swiss approach further depends on the used dataset to classify water bodies and, hence, is certainly less consistent on the regional to national scale as the PFI's proposed fixed accumulation threshold. Additionally, the national German and Swiss approaches only consider different classes of inundation depths when communicating pluvial flood hazard. We believe that the PFHA's proposed approach to defining areas where pedestrians or vehicles are at risk when water depth, flow velocity, or a combination of the two exceeds the defined thresholds is much easier to communicate and more straightforward. This finding is also supported when taking the elevation and elevation gradient of PFHA areas into consideration.
Further evaluation of the approach is required, taking into account a wide range of events, locations, and options for comparing with damage data. The preliminary comparisons appear promising (Krumm et al., 2025), but more events and a comparable event database are required to improve the evaluation. We need nationwide databases of historical flash flood events. The initial compilation by Gaume et al. (2009) for Europe triggered many approaches and analyses (for example, the HiOS database of Kaiser et al., 2021), but certain event documentations are frequently lacking, such as information about damages, local observed rainfall intensities and amounts, or flooding extent; or the entire database is not publicly available due to data restrictions imposed by the insurance companies. Other online tools focus on meteorological occurrences of heavy rainfall and are less likely to provide a focused indication of pluvial floods, but they may serve as a starting point for further investigation into whether a heavy rainfall event triggered a pluvial flood or not.
Currently, the PFI only addresses pluvial hazards related to water depth and flow velocity, without other negative effects of pluvial floods such as erosion and sedimentation. Sediment has become increasingly important in fluvial flood analysis and modelling in recent years (for example, see Hamidifar et al., 2024). New approaches have been presented for detecting the damages of previous pluvial floods using satellite images, primarily due to changes in surface erosion or sedimentation (Cerbelaud et al., 2023). However, no hydro-sedimentary modelling system (e.g., Kourgialas and Karatzas, 2014) has been used for larger-scale pluvial flood real-time warning or hazard mapping to date.
Pluvial floods are flash floods resulting from localized, severe convective precipitation events. Climate change is expected to intensify the hydrological cycle, leading to increased heavy rainfall events and pluvial flood occurrence. The escalating threat of pluvial floods, exacerbated by urbanization and surface sealing, suggests a significant vulnerability to damage. The new mesoscale Pluvial Flood Index (PFI) is a versatile tool to address these hazards and improve forecasting and alerts. The PFI is a straightforward, comprehensible, and tangible measure. However, to be meaningful all hydrological and hydraulic factors have to be considered while establishing the baseline data to estimate pluvial flood hazard areas (PFHA) and subsequent PFI classification.
Pluvial floods are rare, local events that complicate the establishment of dependable return intervals. We believe that the absolute extent of the PFHA is more crucial than the occurrence probability of an event. Therefore, the PFI is based on the relative area fraction of the PFHA to a reference area, providing a comprehensible and highly flexible basis for assessing flash flood hazards. The dimensional index of the PFI is intended for a broad assessment of flash flood hazard, primarily for simple communication with the general public on a regional scale, whereas the underlying PFHA provide also detailed technical information about the extend and location of hazard areas. The PFHA and the PFI can serve as a fundamental approach for operational, scale-bridging flash flood warning systems, requiring effective hydrological and hydraulic simulations across large regions. It can also be used for extensive evaluations of pluvial flash flood susceptibility, facilitating the prioritization of precautionary measures specific to pluvial flooding.
The underlying datasets are available at FreiData under https://doi.org/10.60493/tjnp6-x5355 (Weiler et al., 2026). The code to calculate the PFI from the PFHA records is available on request.
The supplement related to this article is available online at https://doi.org/10.5194/nhess-26-2673-2026-supplement.
MW designed the study, and all authors carried it out and developed the PFI together. AS prepared the GIS data, HL and AH developed the model code and performed the simulations. MW prepared the manuscript, with contributions from all authors.
The contact author has declared that none of the authors has any competing interests.
Publisher's note: Copernicus Publications remains neutral with regard to jurisdictional claims made in the text, published maps, institutional affiliations, or any other geographical representation in this paper. The authors bear the ultimate responsibility for providing appropriate place names. Views expressed in the text are those of the authors and do not necessarily reflect the views of the publisher.
The publication is part of the project AVOSS – Impact-based prediction of heavy rain events and flash floods at different scales: prospects, uncertainties and limitations funded by the Federal Ministry for Research, Technology and Space (BMFTR) as part of the “Water Extreme Events” (WaX) initiative.
This research has been supported by the Bundesministerium für Forschung, Technologie und Raumfahrt as part of the Water Extremes (WaX) initiative (grant nos. 02WEE1629A and 02WEE1629F).
This open-access publication was funded by the University of Freiburg.
This paper was edited by Kai Schröter and reviewed by three anonymous referees.
Apel, H., Benisch, J., Helm, B., Vorogushyn, S., and Merz, B.: Fast urban inundation simulation with RIM2D for flood risk assessment and forecasting, Frontiers in Water, 6, 1310182, https://doi.org/10.3389/frwa.2024.1310182, 2024.
Apel, H., Vorogushyn, S., and Merz, B.: Brief communication: Impact forecasting could substantially improve the emergency management of deadly floods: case study July 2021 floods in Germany, Nat. Hazards Earth Syst. Sci., 22, 3005–3014, https://doi.org/10.5194/nhess-22-3005-2022, 2022.
Archer, D. R. and Fowler, H. J.: Characterising flash flood response to intense rainfall and impacts using historical information and gauged data in Britain, J. Flood Risk Manage., 11, S121–S133, https://doi.org/10.1111/jfr3.12187, 2018.
Bachmair, S. and Weiler, M.: Hillslope characteristics as controls of subsurface flow variability, Hydrol. Earth Syst. Sci., 16, 3699–3715, https://doi.org/10.5194/hess-16-3699-2012, 2012.
Bachmair, S., Weiler, M., and Nützmann, G.: Controls of land use and soil structure on water movement: Lessons for pollutant transfer through the unsaturated zone, J. Hydrol., 369, 241–252, https://doi.org/10.1016/j.jhydrol.2009.02.031, 2009.
Berkhahn, S., Fuchs, L., and Neuweiler, I.: An ensemble neural network model for real-time prediction of urban floods, J. Hydrol., 575, 743–754, https://doi.org/10.1016/j.jhydrol.2019.05.066, 2019.
Beven, K.: Robert E. Horton's perceptual model of infiltration processes, Hydrol. Process., 18, 3447–3460, https://doi.org/10.1002/hyp.5740, 2004.
BBK: Die unterschätzten Risiken „Starkregen“ und „Sturzfluten“ – Ein Handbuch für Bürger und Kommunen, Bundesamt für Bevölkerungsschutz und Katastrophenhilfe, Bonn, ISBN 978-3-939347-67-5, 2015 (in German).
Bonta, J. V. and Shipitalo, M. J.: Curve numbers for long-term no-till corn and agricultural practices with high watershed infiltration, J. Soil Water Conserv., 68, 487–500, https://doi.org/10.2489/jswc.68.6.487, 2013.
Borga, M., Anagnostou, E. N., Blöschl, G., and Creutin, J.-D.: Flash flood forecasting, warning and risk management: the HYDRATE project, Environ. Sci. Policy, 14, 835–844, https://doi.org/10.1016/j.envsci.2011.05.017, 2011.
Bremicker, M., Brahmer, G., Demuth, N., Holle, F. K., and Haag, I.: Räumlich hoch aufgelöste LARSIM Wasserhaushaltsmodelle für die Hochwasservorhersage und weitere Anwendungen, KW Korrespondenz Wasserwirtschaft, 6, 509–519, 2013 (in German).
Brigandì, G., Aronica, G. T., Bonaccorso, B., Gueli, R., and Basile, G.: Flood and landslide warning based on rainfall thresholds and soil moisture indexes: the HEWS (Hydrohazards Early Warning System) for Sicily, Adv. Geosci., 44, 79–88, https://doi.org/10.5194/adgeo-44-79-2017, 2017.
Buttinger-Kreuzhuber, A., Konev, A., Horváth, Z., Cornel, D., Schwerdorf, I., Blöschl, G., and Waser, J.: An integrated GPU-accelerated modeling framework for high-resolution simulations of rural and urban flash floods, Environ. Modell. Softw., 156, 105480, https://doi.org/10.1016/j.envsoft.2022.105480, 2022.
Cerbelaud, A., Blanchet, G., Roupioz, L., Breil, P., and Briottet, X.: Mapping pluvial flood-induced damages with multi-sensor optical remote sensing: A transferable approach, Remote Sensing, 15, 2361, https://doi.org/10.3390/rs15092361, 2023.
Environment Agency: Surface water: The biggest flood risk of all, Speech by Sir James Bevan KCMG, Chief Executive, Environment Agency, CIWEM Surface Water Management Conference, 17 October 2018, https://www.gov.uk/government/news/surface-water-the-biggest-flood-risk-of-all (last access: 21 May 2026), 2018.
Fiener, P., Auerswald, K., and Van Oost, K.: Spatio-temporal patterns in land use and management affecting surface runoff response of agricultural catchments – A review, Earth-Sci. Rev., 106, 92–104, https://doi.org/10.1016/j.earscirev.2011.01.009, 2011.
García-Ruiz, J. M., Regüés, D., Alvera, B., Lana-Renault, N., Serrano-Muela, P., Nadal-Romero, E., Navas, A., Latron, J., Martí-Bono, C., and Arnáez, J.: Flood generation and sediment transport in experimental catchments affected by land use changes in the central Pyrenees, J. Hydrol., 356, 245–260, https://doi.org/10.1016/j.jhydrol.2008.04.013, 2008.
Gaume, E., Bain, V., Bernardara, P., Newinger, O., Barbuc, M., Bateman, A., and Viglione, A.: A compilation of data on European flash floods, J. Hydrol., 367, 70–78, https://doi.org/10.1016/j.jhydrol.2008.12.028, 2009.
Grisa, T. M.: Relabeling Extreme Rainfall Events so the Public Understands Their Severity, in: Proceedings of the Water Environment Federation, WEFTEC 2013, Chicago, USA, Session 10 through Session 19, 1335–1345, https://www.accesswater.org/?id=-281633 (last access: 4 June 2026), 2013.
Guntu, R., Mohor, G. S., Thieken, A. H., Müller, M., and Kreibich, H.: Deciphering the drivers of direct and indirect damages to companies from an unprecedented flood event: A data-driven, multivariate probabilistic approach, Nat. Hazards Earth Syst. Sci., 26, 163–186, https://doi.org/10.5194/nhess-26-163-2026, 2026.
Haag, I., Krumm, J., Aigner, D., Steinbrich, A., and Weiler, M.: Hydrologische Vorhersagen – ein wichtiger Beitrag zum Schutz der Bevölkerung, Hydrol. Wasserbewirts., 66, 4–5, https://doi.org/10.5675/HyWa_2022.1_1, 2022a (in German with English abstract).
Haag, I., Krumm, J., Aigner, D., Steinbrich, A., and Weiler, M.: Simulation von Hochwasserereignissen in Folge lokaler Starkregen mit dem Wasserhaushaltsmodell LARSIM, Hydrol. Wasserbewirts., 66, 6–27, https://doi.org/10.5675/HyWa_2022.1_1, 2022b (in German with English abstract).
Hamidifar, H., Nones, M., and Rowinski, P. M.: Flood modeling and fluvial dynamics: A scoping review on the role of sediment transport, Earth-Sci. Rev., 253, 104775, https://doi.org/10.1016/j.earscirev.2024.104775, 2024.
Huntington, T. G.: Evidence for intensification of the global water cycle: Review and synthesis, J. Hydrol., 319, 83–95, https://doi.org/10.1016/j.jhydrol.2005.07.003, 2006.
Junghänel, T., Ostermöller, J., and Deutschländer, T.: Grids of return periods of heavy precipitation (design precipitation) over Germany (KOSTRA-DWD) version 2020, Deutscher Wetterdienst [data set], https://doi.org/10.5676/DWD/KOSTRA-DWD-2020, 2023.
Jury, W. A. and Horton, R.: Soil physics, John Wiley & Sons, ISBN: 978-0-471-05965-3, 2004.
Kabenge, M., Elaru, J., Wang, H., and Li, F.: Characterizing flood hazard risk in data-scarce areas, using a remote sensing and GIS-based flood hazard index, Nat. Hazards, 89, 1369–1387, https://doi.org/10.1007/s11069-017-3016-y, 2017.
Kaiser, M., Günnemann, S., and Disse, M.: Spatiotemporal analysis of heavy rain-induced flood occurrences in Germany using a novel event database approach, J. Hydrol., 595, 125985, https://doi.org/10.1016/j.jhydrol.2021.125985, 2021.
Kazakis, N., Kougias, I., and Patsialis, T.: Assessment of flood hazard areas at a regional scale using an index-based approach and Analytical Hierarchy Process: Application in Rhodope–Evros region, Greece, Sci. Total Environ., 538, 555–563, https://doi.org/10.1016/j.scitotenv.2015.08.055, 2015.
Khosh Bin Ghomash, S., Apel, H., Schröter, K., and Steinhausen, M.: Rapid high-resolution impact-based flood early warning is possible with RIM2D: a showcase for the 2023 pluvial flood in Braunschweig, Nat. Hazards Earth Syst. Sci., 25, 1737–1749, https://doi.org/10.5194/nhess-25-1737-2025, 2025.
Kipfer, A., Berger, C., Mani, P., Hulliger, R., Caduff, U., Dobmann, J., Gsteiger, P., Pauli, M., and Schneider, M.: Gefährdungskarte Oberflächenabfluss Schweiz, Technischer Bericht, https://www. bafu.admin.ch/dam/de/sd-web/DEm7R2xCdfPk/gefaehrdungska rte-oberflaechenabfluss-schweiz-technischer-bericht.pdf (last access: 8 June 2026), 2018 (in German).
Kourgialas, N. N. and Karatzas, G. P.: A hydro-sedimentary modeling system for flash flood propagation and hazard estimation under different agricultural practices, Nat. Hazards Earth Syst. Sci., 14, 625–634, https://doi.org/10.5194/nhess-14-625-2014, 2014.
Krumm, J., Haag, I., Leistert, H., Hänsler, A., Steinbrich, A., Schmit, M., and Weiler, M.: Konzeption, Ermittlung und Anwendungsmöglichkeiten des Sturzflutindexes (SFI), Universität Freiburg, https://doi.org/10.6094/UNIFR/246016, 2024 (in German).
Krumm, J., Haag, I., Teltscher, K., Hänsler, A., Leistert, H., Schmit, M., Steinbrich, A., and Weiler, M.: Der Sturzflutindex (SFI) und seine Anwendung auf rezente Überflutungsereignisse in vier Bundesländern (The Pluvial Flood Index (PFI) and its application to recent inundation events in four federal states in Germany), Hydrol. Wasserbewirts., 69, 337–348, https://doi.org/10.5675/HyWa_2025.6_4, 2025.
Kunstmann, H., Fröhle, P., Hattermann, F. F., Marx, A., Smiatek, G., and Wanger, C.: Wasserhaushalt im Klimawandel, in: Klimawandel in Deutschland, edited by: Brasseur, G. P., Jacob, D., and Schuck-Zöller, S., Springer Spektrum, Berlin, Heidelberg, https://doi.org/10.1007/978-3-662-66696-8_16, 2023.
Landtag von Baden-Württemberg: Schäden durch Hochwasser und Starkregen im Rems-Murr-Kreis, Kleine Anfrage, Drucksache 17/6981, https://www.landtag-bw.de/resource/blob/266880/b2558a15b221b074deafec7a59ab0893/17_6981_D.pdf (last access: 8 June 2026), 2024 (in German).
Lange, J., Leibundgut, C., and Simmer, I.: Surface runoff and sediment dynamics in arid and semi-arid regions, Int. Contrib. Hydrogeol., 23, 115–115, 2003.
Leistert, H., Hänsler, A., Schmit, M., Steinbrich, A., and Weiler, M.: Accumulation-based Runoff and Pluvial Flood Estimation Tool (AccRo v.1.0), Geosci. Model Dev., 19, 2023–2037, https://doi.org/10.5194/gmd-19-2023-2026, 2026.
Lengfeld, K., Walawender, E., Winterrath, T., and Becker, A.: CatRaRE: A Catalogue of radar-based heavy rainfall events in Germany derived from 20 years of data, Meteorol. Z., 30, 469–487, https://doi.org/10.1127/metz/2021/1088, 2021.
Lengfeld, K., Winterrath, T., Junghänel, T., Hafer, M., and Becker, A.: Characteristic spatial extent of hourly and daily precipitation events in Germany derived from 16 years of radar data, Meteorol. Z., 28, 363–378, https://doi.org/10.1127/metz/2019/0964, 2019.
Lindsay, J. B. and Dhun, K.: Modelling surface drainage patterns in altered landscapes using LiDAR, Int. J. Geogr. Inf. Sci., 29, 397–411, https://doi.org/10.1080/13658816.2014.975715, 2015.
Liu, X.: Airborne LiDAR for DEM generation: some critical issues, Prog. Phys. Geogr., 32, 31–49, https://doi.org/10.1177/0309133308089496, 2008.
LUBW: Leitfaden Kommunales Starkregenrisikomanagement in Baden-Württemberg, 60 pp., ISBN 978-3-88251-391-2, https://www.lubw.baden-wuerttemberg.de/wasser/starkregenrisikomanagement (last access: 21 May 2026), 2016 (in German).
Martínez-Gomariz, E., Gómez, M., and Russo, B.: Experimental study of the stability of pedestrians exposed to urban pluvial flooding, Nat. Hazards, 82, 1259–1278, https://doi.org/10.1007/s11069-016-2242-z, 2016.
Martínez-Gomariz, E., Gómez, M., Russo, B., and Djordjević, S.: Stability criteria for flooded vehicles: A state-of-the-art review, J. Flood Risk Manage., 11, 817–826, https://doi.org/10.1111/jfr3.12262, 2018.
Oberle, P., Kron, A., Kerlin, T., Nestmann, F., and Ruiz Rodriguez, E.: Diskussionsbeitrag zur Fließwiderstandsparametrisierung zur Simulation der Oberflächenabflüsse bei Starkregen, Wasserwirtschaft, 111, 12–21, https://doi.org/10.1007/s35147-021-0811-x, 2021 (in German).
Popa, M. C., Peptenatu, D., Drăghici, C. C., and Diaconu, D. C.: Flood Hazard Mapping Using the Flood and Flash-Flood Potential Index in the Buzău River Catchment, Romania, Water, 11, 2116, https://doi.org/10.3390/w11102116, 2019.
Rawls, W. J., Ahuja, L. R., Brakensiek, D. L., and Shirmohammadi, A.: Infiltration and soil water movement, in: Handbook of Hydrology, edited by: Maidment, D. R., McGraw-Hill, New York, Chap. 5, 5-1–5-51, 1992.
Ries, F., Kirn, L., and Weiler, M.: Experimentelle Untersuchung der Abflussbildung bei Starkregen, Hydrol. Wasserbewirts., 64, 221–236, https://doi.org/10.5675/HyWa_2020.5_1, 2020 (in German with English abstract).
Saksena, S. and Merwade, V.: Incorporating the effect of DEM resolution and accuracy for improved flood inundation mapping, J. Hydrol., 530, 180–194, https://doi.org/10.1016/j.jhydrol.2015.09.069, 2015.
Schwemmle, R., Leistert, H., Steinbrich, A., and Weiler, M.: RoGeR v3.0.5 – a process-based hydrological toolbox model in Python, Geosci. Model Dev., 17, 5249–5262, https://doi.org/10.5194/gmd-17-5249-2024, 2024.
Seibert, S. P. and Auerswald, K.: Hochwasserminderung im ländlichen Raum: ein Handbuch zur quantitativen Planung, Springer Nature, 236 pp., https://doi.org/10.1007/978-3-662-61033-6, 2020 (in German).
Shand, T. D., Cox, R. J., Blacka, M. J., and Smith, G. P.: Project 10: appropriate safety criteria for vehicles, Australian Rainfall and Runoff (AR&R), Revision Projects, Report Number P10/S2/020, https://arr.ga.gov.au/arr-guideline/revision-projects/revision-project-reports/project-10-safety-criteria-for-people/ARR_Project_10_Stage2_Report_Final.pdf (last access 8 June 2026), 2011.
Singh, A., Guntu, R., Sairam, N., Shahi, K. R., Buch, A., Fischer, M., Dhanya, C. T., and Kreibich, H.: FLEMOflash – Flood Loss Estimation MOdels for companies and households affected by flash floods, Nat. Hazards Earth Syst. Sci., 26, 103–118, https://doi.org/10.5194/nhess-26-103-2026, 2026.
Steinbrich, A., Leistert, H., and Weiler, M.: Model-based quantification of runoff generation processes at high spatial and temporal resolution, Environ. Earth Sci., 75, 1423, https://doi.org/10.1007/s12665-016-6234-9, 2016.
Steinbrich, A., Leistert, H., and Weiler, M.: RoGeR – ein bodenhydrologisches Modell für die Beantwortung einer Vielzahl hydrologischer Fragen, Korrespondenz Wasserwirtschaft, 14, https://doi.org/10.3243/kwe2021.02.004, 2021.
Stewart, R. D., Bhaskar, A. S., Parolari, A. J., Herrmann, D. L., Jian, J., Schifman, L. A., and Shuster, W. D.: An analytical approach to ascertain saturation-excess versus infiltration-excess overland flow in urban and reference landscapes, Hydrol. Process., 33, 3349–3363, https://doi.org/10.1002/hyp.13562, 2019.
Tarboton, D. G.: Rainfall Runoff Processes, Civil and Environmental Engineering Faculty Publications, Utah State University, Paper 2570, https://digitalcommons.usu.edu/cee_facpub/2570 (last access: 8 June 2026), 2003.
Vojtek, M.: Indicator-based approach for fluvial flood risk assessment at municipal level in Slovakia, Sci. Rep., 13, 5014, https://doi.org/10.1038/s41598-023-32239-7, 2023.
Wasko, C., Nathan, R., Stein, L., and O'Shea, D.: Evidence of shorter more extreme rainfalls and increased flood variability under climate change, J. Hydrol., 603, 126994, https://doi.org/10.1016/j.jhydrol.2021.126994, 2021.
Weiler, M., Hänsler, A., Zimmer, J., and Moser, M.: Nutzung von Radardaten im Starkregenrisikomanagement in Baden-Württemberg, Wasserwirtschaft, 109, 63–67, https://doi.org/10.1007/s35147-019-0311-4, 2019 (in German).
Weiler, M., Leistert, H., and Hänsler, A.: Data - PFI - DefinitionPaper, FreiData [data set], https://doi.org/10.60493/tjnp6-x5355, 2026.
Wimmer, L. and Hovenbitzer, M.: Introducing a Nationwide High-Resolution Pluvial Flood Map: A New Tool for Risk Assessment and Emergency Management in Germany, Abstr. Int. Cartogr. Assoc., 9, 43, https://doi.org/10.5194/ica-abs-9-43-2025, 2025.
Xia, J., Teo, F. Y., Lin, B., and Falconer, R. A.: Formula of incipient velocity for flooded vehicles, Nat. Hazards, 58, 1–14, https://doi.org/10.1007/s11069-010-9639-x, 2011.
Zhang, X., Zhu, J., Wendroth, O., Matocha, C., and Edwards, D.: Effect of macroporosity on pedotransfer function estimates at the field scale, Vadose Zone J., 18, 1–15, https://doi.org/10.2136/vzj2018.08.0151, 2019.
- Abstract
- Introduction
- Relevant processes controlling the generation of pluvial floods
- Defining the pluvial flood index (PFI)
- Results
- Discussion
- Conclusion
- Code and data availability
- Author contributions
- Competing interests
- Disclaimer
- Acknowledgements
- Financial support
- Review statement
- References
- Supplement