the Creative Commons Attribution 4.0 License.
the Creative Commons Attribution 4.0 License.
 | 10 Jun 2026
Development of flood vulnerability functions for cultural heritage buildings and artworks for damage assessment in art cities
Claudia De Lucia
The assessment of flood-related losses to cultural heritage (CH) remains one of the most underexplored areas in flood risk management, largely due to the complexity of CH assets and their multiple, often intangible, values. In this study, extensive field data collection and archival research on artwork restoration costs were undertaken to support a synthetic approach for developing vulnerability models for both the CH buildings and artworks across three primary CH asset types: places of worship, museums, and libraries/archives. The methodology was applied to the historic city of Florence (Italy), enabling the derivation of mean and percentile vulnerability curves from a sample of 48 inspected CH buildings. For a 500-year flood scenario, estimated average losses amount to approximately EUR 2.5 million for the CH buildings and EUR 3 million for artworks per asset, with total damages to CH in the city reaching approximately EUR 527 million. While direct monetary loss estimates, i.e., restoration costs are subject to considerable uncertainty, the model results align well with available ex-post data, particularly for places of worship. These findings demonstrate that flood-related monetary losses to CH assets are far from negligible when compared to other damage categories, such as residential buildings, and therefore warrant increasing attention from the scientific and policy-making communities.
- Article
(7084 KB) - Full-text XML
-
Supplement
(314 KB) - BibTeX
- EndNote


Floods are among the costliest natural hazards, causing substantial economic losses – amounting to USD 20.4 billion in 2023 – and claiming 7763 lives worldwide (CRED, 2024). These alarming figures have intensified research efforts in flood risk analysis (Díez-Herrero and Garrote, 2020; Morante-Carballo et al., 2022), with particular attention given to the assessment of flood-related damages (Gerl et al., 2016).
Cultural heritage (CH) warrants special consideration in this context, as it contributes significantly to social cohesion and sustainable development (UNESCO et al., 2010). The vulnerability of CH to natural hazards is often exacerbated by material degradation due to ageing and the frequent use of organic materials – such as paper, textiles, paintings, and wood – which are particularly susceptible to water damage (Deschaux, 2017; Sevieri et al., 2020).
In recent decades, numerous disasters have impacted CH. For instance, the August 2002 flood in Prague affected 45 libraries, damaging or destroying over 600 000 works (Deschaux, 2017). In 2008, a major flood in the World Heritage Site (WHS) of Shibam City, Yemen, caused ground subsidence, as well as cracking and partial collapse of several mud houses (Salazar et al., 2024). Similarly, in 2011, the WHS of Ayutthaya, Thailand, was inundated for over four weeks (Vojinovic et al., 2016). More recently, in September 2022, the northern Marche region of Italy experienced a severe flood, resulting in extensive damage to cultural sites (De Lucia et al., 2024).
Several studies have addressed flood risk assessments of CH at multiple scales, ranging from global analyses to evaluations of individual sites. Vulnerability analyses – whether conducted at the global level (Arrighi, 2021) or at national and regional levels (Figueiredo et al., 2020; Bertolin and Sesana, 2023; Arrighi et al., 2023) – are typically based on site typology classifications. In contrast, Figueiredo et al. (2021) developed component-based vulnerability functions for two churches in Portugal, using detailed fieldwork. Vulnerability assessments at an intermediate, city scale, remain less common, despite their ability to evaluate multiple cultural sites with high spatial resolution (Salazar et al., 2024). Recent studies have succeeded in assigning vulnerability levels at this scale by analyzing historical records and cadastral data (Arrighi et al., 2018a; Trizio et al., 2021).
Quantifying flood-induced damages to CH is a complex task. Vecvagars (2006) categorized CH value into “use value” (i.e., market-related) and “non-use value” (i.e., non-market-related). Use value can be further subdivided into extractive and non-extractive types. Moreover, physical losses to CH resulting from contact with floodwater (direct impacts) can be quantified in terms of restoration costs for both artworks and CH buildings (Romão et al., 2020). However, such economic assessments are inherently limited: cultural assets may suffer irreversible loss, and restoration efforts may span decades (Benassi and Ciatti, 2016; De Lucia et al., 2024). Furthermore, floods can lead to indirect losses, such as reduced tourism due to prolonged closures (Arrighi et al., 2022). CH also includes intangible or non-use values – such as historical, social, spiritual, and evidential significance – which are notably difficult to monetize (Romao and Paupério, 2021).
Existing damage models can be grouped into two main categories: empirical and synthetic models. Empirical models are based on data from past flood events and are typically site-specific, limiting their transferability (Amadio et al., 2019). Synthetic models, by contrast, are based on expert assumptions about damage mechanisms, though they still require calibration and validation for accuracy (Merz et al., 2010; Dottori et al., 2016; Figueiredo et al., 2021; Carisi et al., 2018).
Damage assessments of CH – whether based on empirical or synthetic models – generally employ one of three main approaches: indicator-based assessments, damage matrices, or depth-damage vulnerability functions. The indicator-based approach enables rapid, semi-quantitative risk assessments across various hazards and scales. Indicators can be tailored to specific contexts, offering insight into susceptibility, coping capacity, and resilience. However, challenges remain in validating and weighting these indicators (Birkmann, 2006; Salazar et al., 2024; Ravan et al., 2023). Damage matrices offer a simpler method, combining CH exposure and vulnerability to deliver stepwise damage levels based on hazard intensity (Menoni et al., 2016; Kappes et al., 2012; Arrighi et al., 2023).
Vulnerability functions relate expected damage to a single variable – typically, maximum water depth (Amadio et al., 2019). While such functions are widely used across sectors (e.g., housing, economic infrastructure, agriculture), their application to CH remains limited. This is due to the unique nature of heritage sites, which complicates generalization (Arrighi et al., 2022). Additionally, these functions usually express damage as a percentage of total cultural value (Figueiredo et al., 2021; Salazar et al., 2023).
This study aims to develop new vulnerability functions specifically tailored to cultural heritage (CH) buildings and artworks, considering direct economic flood losses associated with restoration activities. By integrating extensive fieldwork with statistical analysis of existing datasets, common damage patterns were identified across several types of cultural heritage buildings. These were used to derive mean and percentile vulnerability functions accounting for damage to interior finishes. Similar functions were also defined for artworks across three CH typologies: places of worship, museums, and libraries/archives.
To the best of our knowledge, this is the first study to undertake a comprehensive analysis of restoration activities and their associated costs, enabling the quantification of direct economic losses in the context of flooding. Additionally, a distribution of unit damage per flooded volume of CH (EUR m−3) is derived through statistical analysis of estimated losses, allowing the assessment of overall city-scale damage, including for CH buildings not inspected in detail. A Cost Reliability Index is introduced to account for uncertainties in restoration costs, particularly those arising from temporary exhibitions. The methodology is applied to the art city of Florence, focusing on selected buildings located within its UNESCO World Heritage Site.
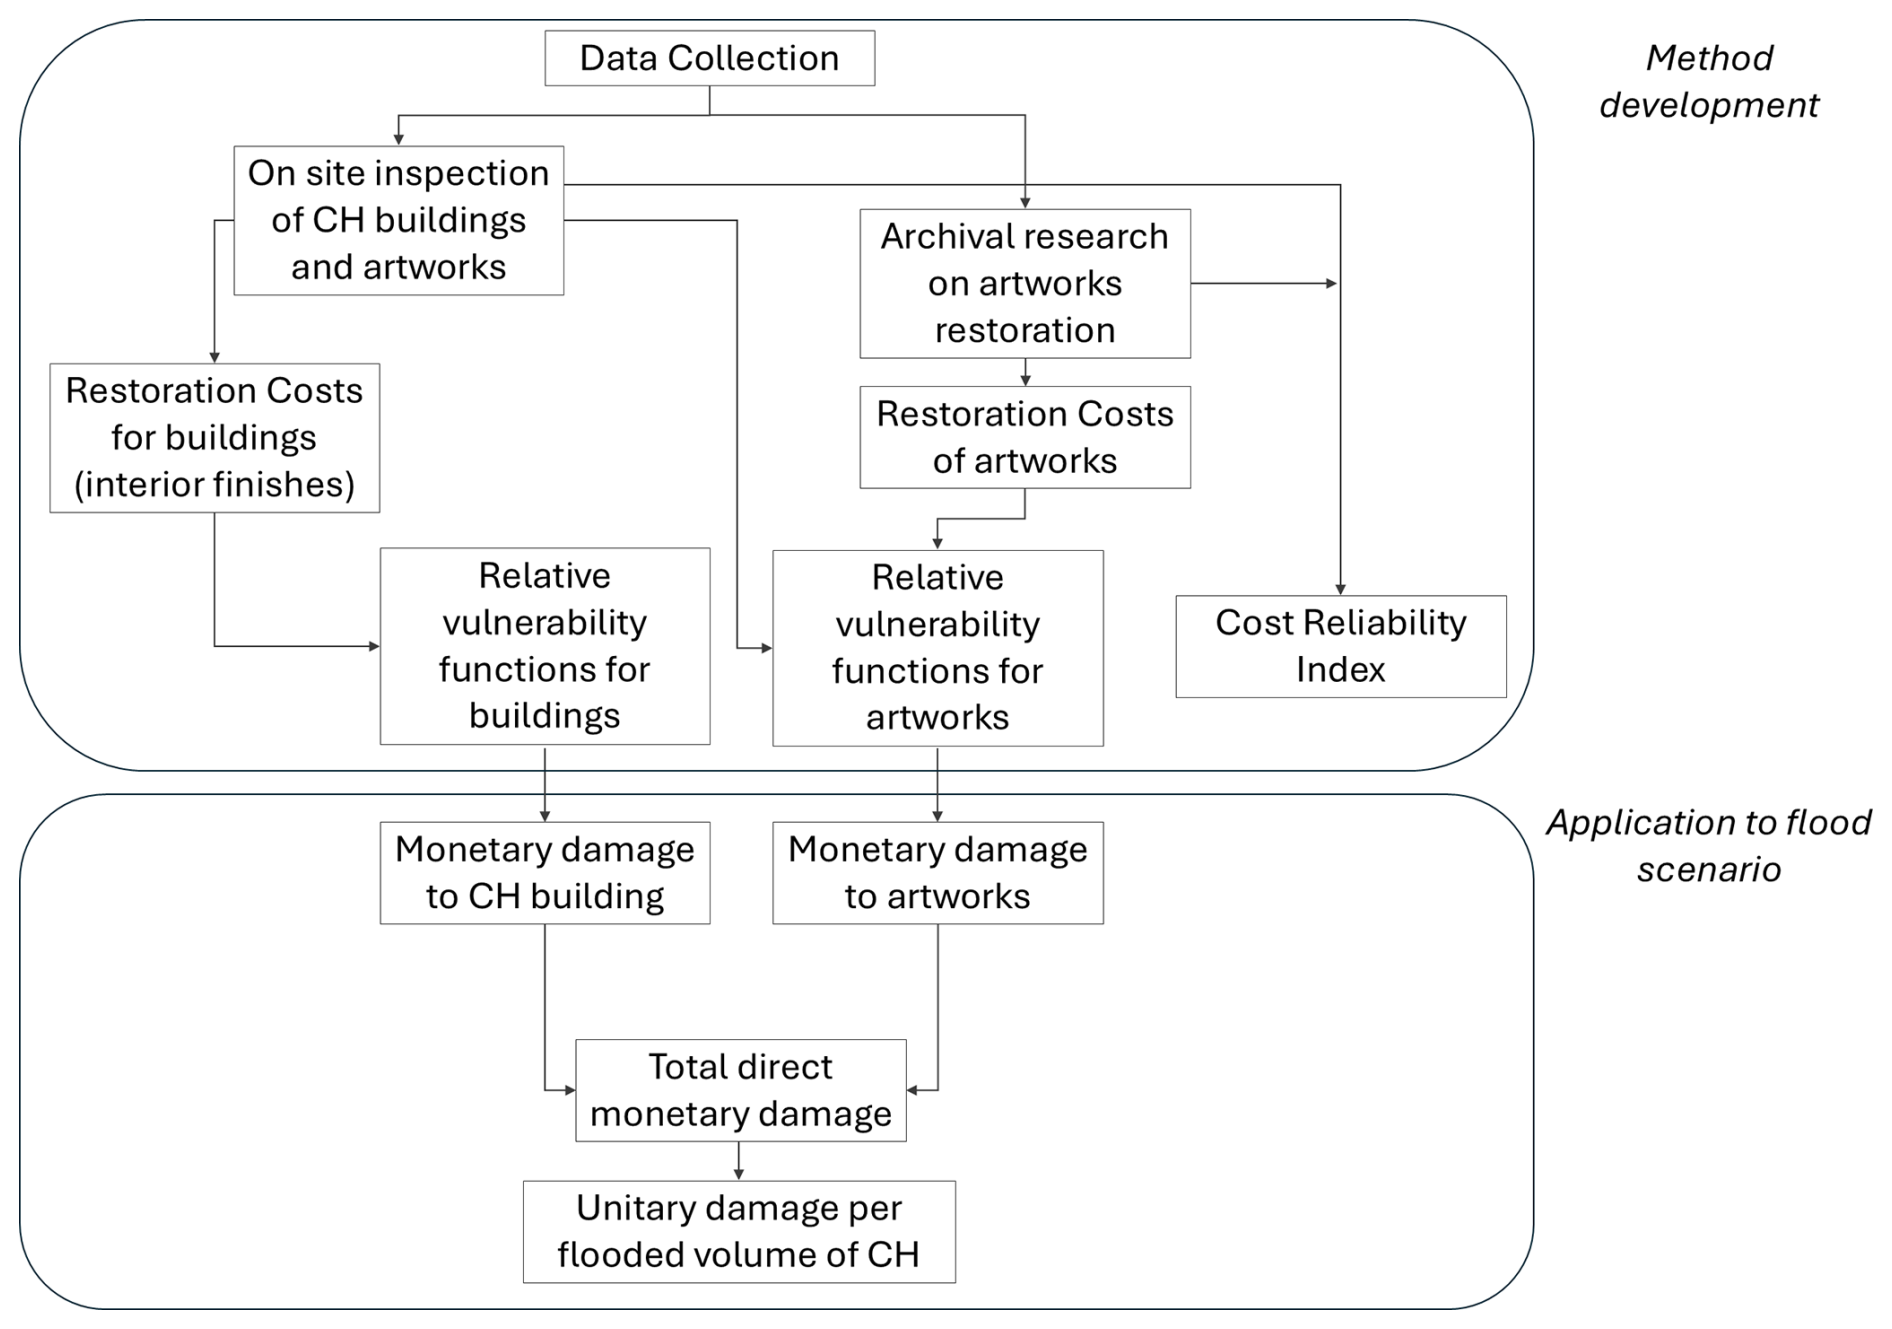
This section outlines the materials and methods employed in this study to develop vulnerability functions for cultural heritage and to apply them to the selected study area. In this work, we use the term CH site as a general designation for all types of cultural heritage, including both buildings and artworks. When referring to these specific components individually, we use the terms building and artwork, respectively.The methodological workflow is summarized in Fig. 1. Section 2.1 presents the essential data collected through field surveys, geospatial analysis, and archival research, which are necessary for assessing the flood vulnerability of cultural heritage sites. Section 2.2 details the investigation carried out to estimate restoration costs for both CH buildings and artworks. Section 2.3 and 2.4 constitute the core of the paper, as they present the development of vulnerability functions for the CH buildings and the artworks housed within them. Finally, Sect. 2.5 describes the method used to assess city-scale damage based on the previously developed vulnerability functions.
2.1 Data collection
The first step of the methodology involves data collection, aimed at gathering essential information to assess the vulnerability of both the interior finishes of the CH building and the exposed artworks. Initially, a polygon-type shapefile of the buildings identified as CH site was considered, and the area and perimeter of each building were evaluated within a GIS environment.
In addition, drawing inspiration from the survey forms developed by Molinari et al. (2014) and De Lucia et al. (2024) for assessing flood-related damages, a new survey form (Table 1) was designed. Compared to the survey forms by De Lucia et al. (2024), which were designed to assess damage to CH after flood events, we included more specific information to: (1) develop synthetic vulnerability functions for buildings, by collecting data on the location and elevation of openings through which water may enter; and (2) develop synthetic vulnerability functions for artworks by gathering information on their position, material and elevation This form was completed through interviews with cultural heritage managers and through field inspections.
Table 1Survey form for data collection about exposure and vulnerability of cultural heritage sites
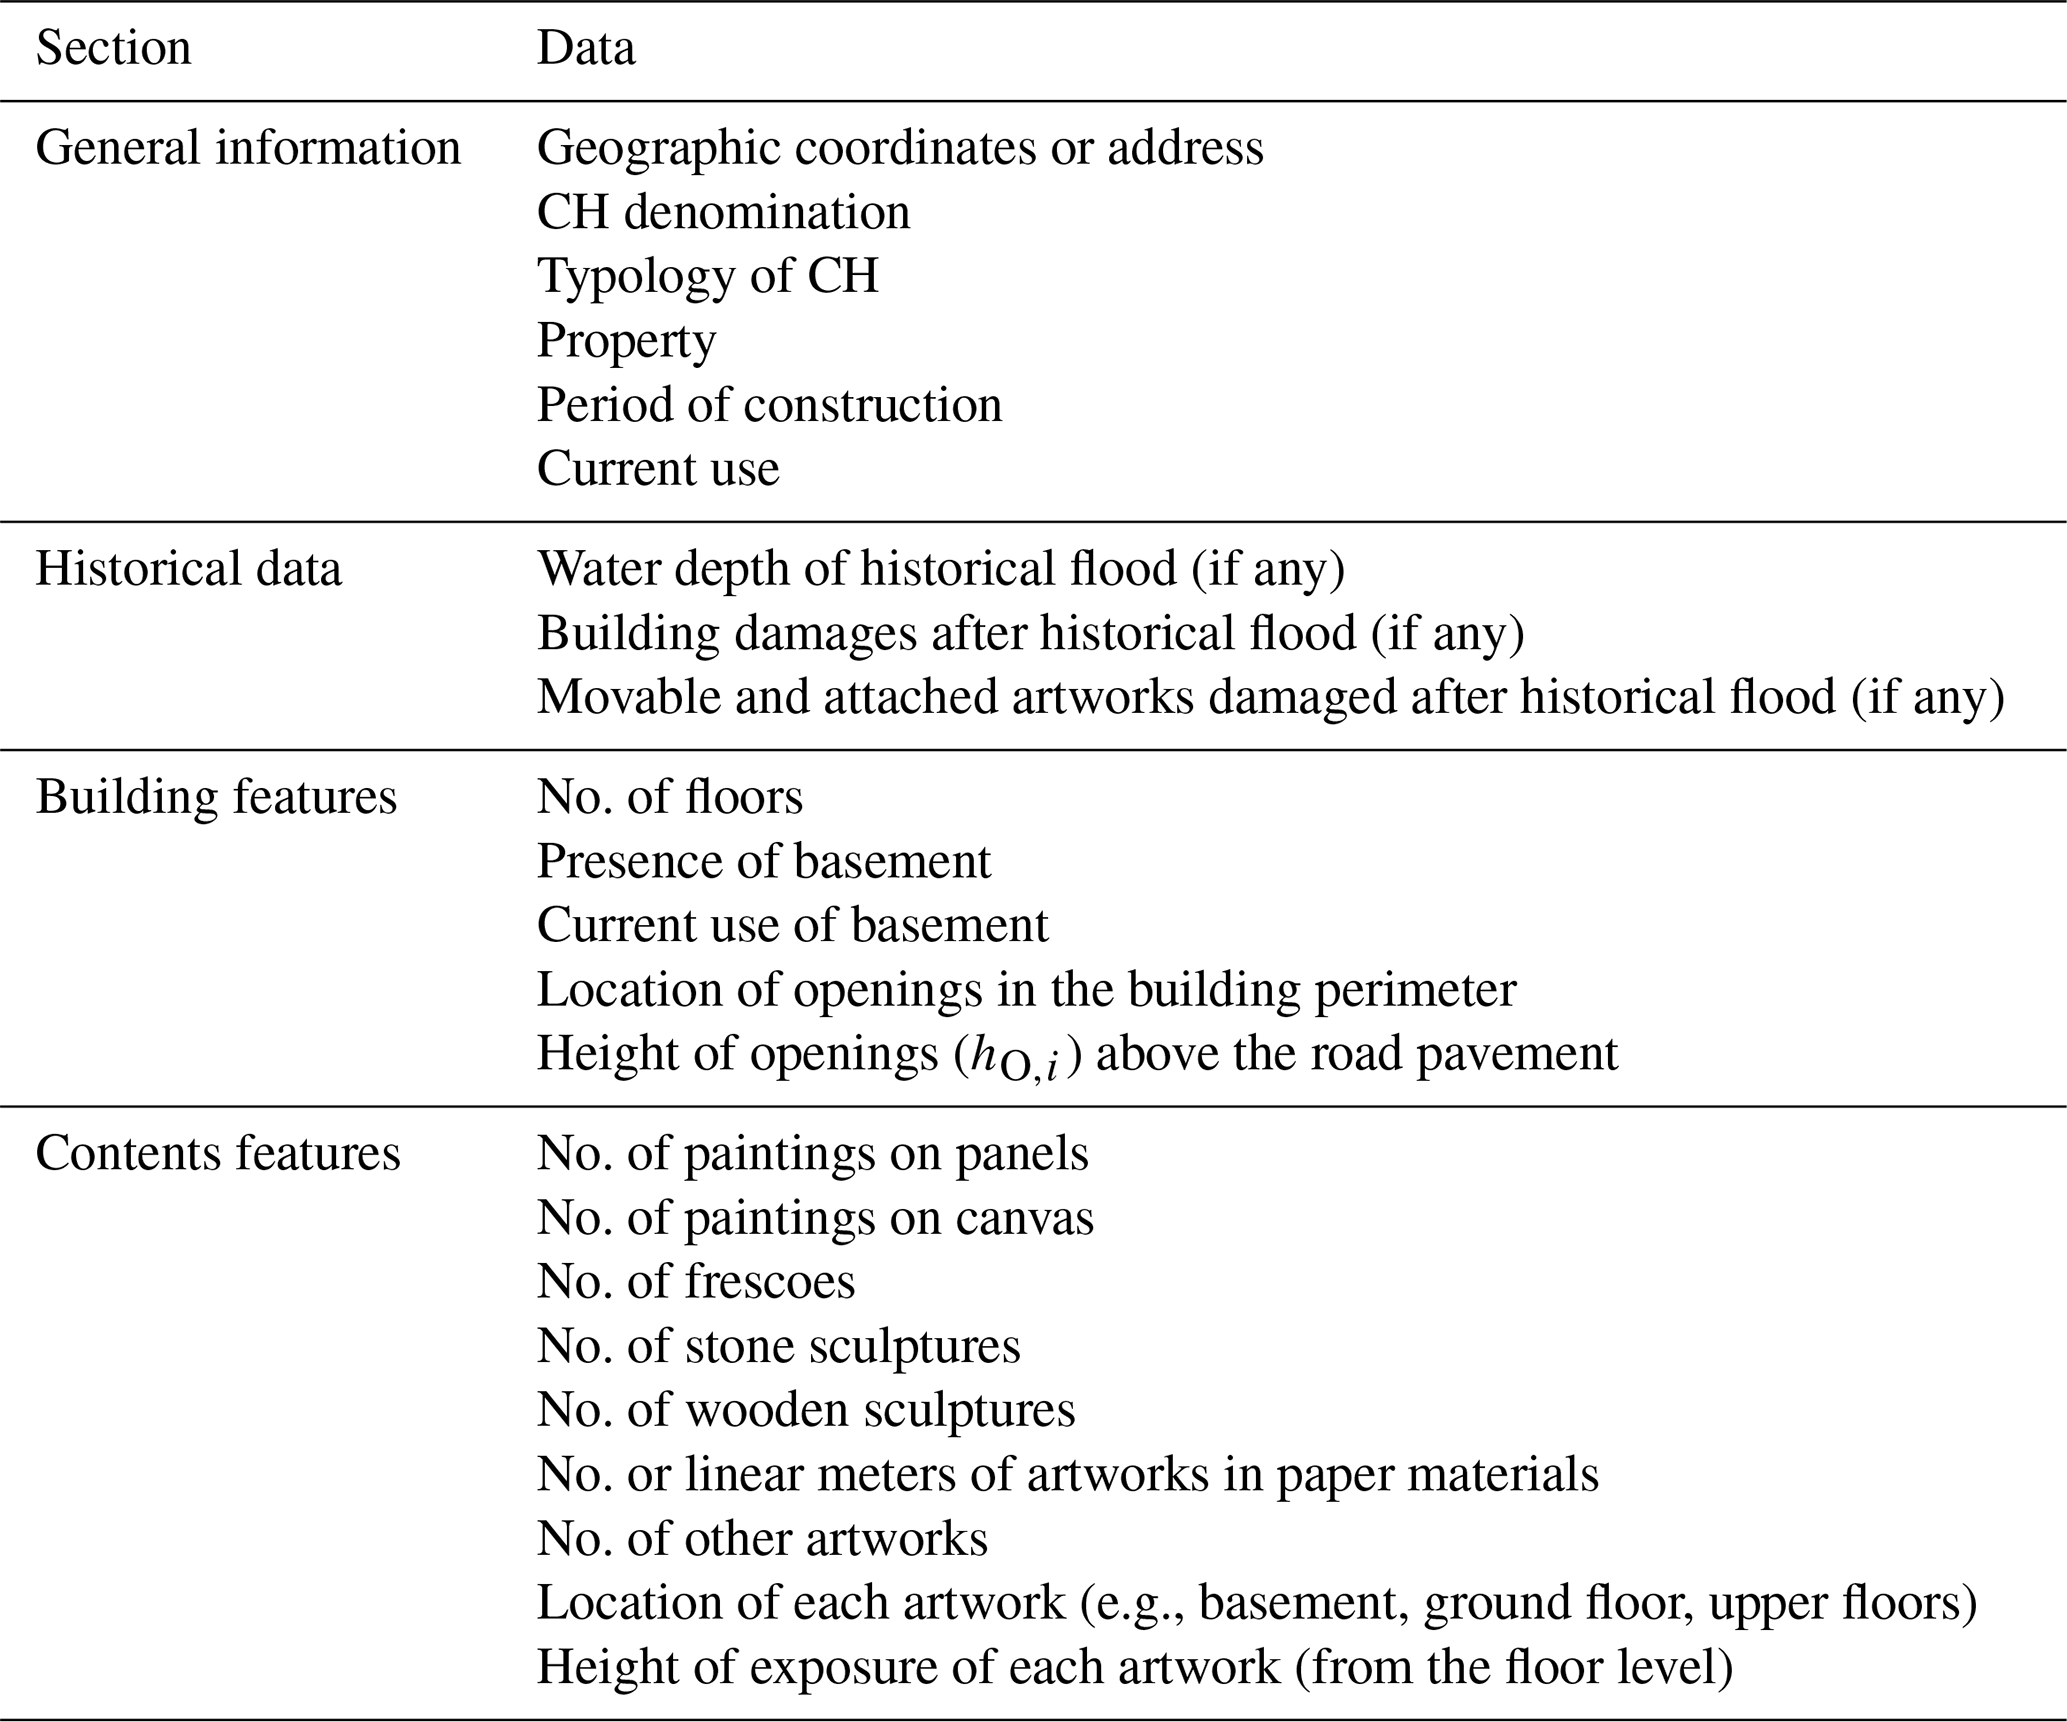
In addition to general information about the CH sites and historical records of past flood events (where available), detailed data were collected on both the buildings and their valuable contents. For each building, particular attention was given to documenting the presence and current use of basements, noting whether they contain any artworks, as well as identifying all openings along the building perimeter that connect interior spaces to the exterior. These openings include main doors, windows, basement air vents, and basement windows. Their locations were mapped, and the height of each opening above street level was measured using a standard measuring tape.
Furthermore, for each flood-prone floor of the asset, the number, location, and type of movable or attached artworks were recorded. The materials and techniques used in these artworks play a key role in determining their vulnerability (Figueiredo et al., 2021). The “content features” section of the survey focused primarily on the most common artwork types: panel or canvas paintings, frescoes, stone or wooden sculptures, and paper-based items. Additional types, such as furniture or textiles, were recorded but classified under “Other artworks.”
Where feasible, the height of exposure for each artwork was measured from the floor level to the base of the artwork. In cases where the floor had multiple levels, these differences were recorded, and the exposure height of artworks was referenced to the lowest level.
Finally, to establish a link between artwork vulnerability and restoration costs, archival research was conducted. Invoices from art conservators – issued following previous flood events – were reviewed in local archives. This analysis enabled the identification of the key procedures involved in restoring flood-damaged artworks. The invoices were categorized by artwork typology, and for each category, the most common restoration operations were documented.
Although limiting the range of artwork types reduces the survey's completeness, this was the only viable option due to the scarcity of archival data on the restoration of other artworks for cost assessment.
2.2 Restoration cost
To estimate the monetary damage of floodwater on cultural heritage (CH) sites, it is essential to identify the key restoration operations required for both CH buildings and artworks. Therefore, in this work the monetary damage for CH is defined as the restoration costs required for both CH buildings and artworks. For the sake of simplicity, and since structural damage is rarely observed in case of flooding (De Lucia et al., 2024), this study considers the damage to interior finishes of the building (Custer and Nishijima, 2015). The primary restoration tasks include plaster and finishing renovation (comprising cleaning, disinfection treatments, and painting), floor replacement, and the replacement of electrical and plumbing systems.
The unit costs for plaster and floor replacement (denoted as R1 and R2, respectively) are based on actual price lists, while the costs for electrical and plumbing system replacement (R3 and R4, respectively) are derived from default values proposed by Dottori et al. (2016). All costs are expressed per unit of building area (m2), allowing for cost estimation without detailed assumptions regarding the specific system characteristics. Dottori et al. (2016) also introduce a multiplicative factor (FL) to adjust the default values, with FL > 1 applied to high-quality residential buildings. For the CH buildings, the multiplicative factor is assumed to be equal to 4, due to the peculiar characteristics of the material, conservative constraints, and the requirement for particularly skilled labour.
Artwork restoration costs are similarly derived from available price lists, except for paper-based items (e.g., books and manuscripts), for which total restoration costs were provided by expert conservators (Alessandro Sidoti, personal communication, 2024). It is further assumed that restoration procedures and costs for wooden sculptures and panel paintings are comparable; thus, the same restoration parameters are applied to both categories.
The total unit restoration cost for the kth artwork type RCA,k (excluding paper materials) is calculated using Eq. (1). Equation (1) consists of nine terms, representing the unit prices of different restoration operations. Since not all operations are relevant for every type of artwork, terms corresponding to non-applicable operations are set equal to zero when evaluating the total unit restoration cost of a specific artwork.
where the nine terms represent the unit prices of different restoration operations:
-
C1,k: Preliminary operations, including preliminary cleanings of incoherent or partially adherent deposits, preliminary protection of paint surface, and pre-consolidation.
-
C2,k: Cleaning procedures, encompassing physical, chemical and mechanical cleaning. It also includes biocleaning treatments, that control microbial growth and prevent further colonizations (Ranalli and Zanardini, 2021); for panel paintings, it also includes cleaning the reverse of the support.
-
C3,k: Consolidation, referring to the treatment to restore the cohesion and adhesion of one or all the layers of painting (Cultural Heritage Agency of the Netherlands).
-
C4,k: Back consolidation, which involves restoration of the supporting wood, removing rigid restraints that hinder the natural flexibility of panels and reintegrating the missing part of the support (Dardes and Rothe, 1998); this term applies only to wooden panel paintings ( for other artwork types).
-
C5,k: In-filling, i.e. the filling of the paint layer disruption and distortions with a mixture of an inert bulking material and an adhesive binding medium (Cultural Heritage Agency of the Netherlands). For stone sculptures, it also comprehends the operations of micro filling.
-
C6,k: Lining interventions, i.e. the process of adding textile support to provide structural reinforcement (Shah et al., 2024) and to address planar deformations of canvas paintings ( for all artwork types expect canvas paintings).
-
C7,k: Detachment operations of paintings from wall supports, applicable only to frescoes ( for all other types of artworks).
-
C8,k: Pictorial restoration, that is the recovery of the aesthetical qualities of the artwork (Cultural Heritage Agency of the Netherlands).
-
C9,k: Surface protection operations, which involves varnishing, in order to saturate the surface, enhance tonal and colour contrasts and to provide a thin protective layer (Cultural Heritage Agency of the Netherlands). for frescoes.
Anyway, in addition to the size and typology of the artworks, RCA,k may also depend on material's condition and state of conservation – i.e. asset-related physical factors – as well as hazard-related factors, such as the level of floodwater contamination, the amount of water the artwork was submerged in, the duration of contact with water, and the pressure exerted by the water (Figueiredo et al., 2021; Deschaux, 2017). Due to the high variability in unit prices, the minimum and maximum cost is calculated for each treatment. For books, manuscripts and photographs, the minimum and maximum cost is expressed in Euros per linear meters. The restoration cost of a single book or a single photograph is obtained by dividing the cost per linear meter by the average number of books or photographs that can fit within a meter of shelf space. The minimum and maximum value of the restoration costs for each artwork type establishes a range of values to assess practically monetary damage assuming that an artwork is flooded. Such monetary values also support (i) the estimation of maximum potential damage in a CH building (see Eq. 7) and (ii) the development of vulnerability functions assuming the occurrence of different flood depths in the building (Sect. 2.4).
2.3 Building vulnerability assessment
The vulnerability analysis focuses on the interior finishes of the building, which is assumed (i) uniform in terms of material along the height of a floodable floor and (ii) of exceptionally high-quality with respect to residential construction. The objective of this section is to define the building vulnerability function through a what-if analysis based on a simulated, step-by-step inundation of the building (Figueiredo et al., 2021). At each step, the corresponding level of relative damage depends on unit restoration costs, building geometry, and the distribution of building systems. The resulting vulnerability function expresses the relationship between relative damage and the water depth outside the building.
The key parameters characterizing the building geometry, regardless of the CH type, include the total area (Ab), perimeter (P), and the lowest height of openings (HO) with respect to the road pavement, defined as the minimum value among the qth measured opening heights (hO,q) during data collection. If a building has more than one floodable floor, a separate HO value is identified for each floor.
The analysis is based on the following assumptions:
-
Damage to finishes and plaster increases linearly with water depth (w).
-
The flooring is considered fully damaged once the water level exceeds the height of the openings (w>HO);
-
The water depth varies from 0 to Hmax, which represents the maximum assumed water depth inside the building and is defined as
-
According to the assumptions of Dottori et al. (2016), damage to electrical and plumbing systems depends on water depth and increases in a stepwise manner. Dottori et al. (2016) introduce threshold heights that correspond to different levels of system damage, identifying three thresholds for both systems. Specifically, for plumbing:
-
Below the first threshold, no damage is expected.
-
At the second threshold, elements such as showers may be affected.
-
At the third threshold, components like toilet bowls and bidets may be damaged.
In this study, only two threshold levels are considered for plumbing systems, as public cultural buildings are assumed not to contain full bathrooms.
-
The absolute damage for the ith CH building RCB,i is calculated as a function of water depth (w), considering only damage to the interior finishes of the CH building. The total restoration cost is obtained by summing the damages incurred on each floodable floor j (Eq. 2).
where gi,j are step functions, introduced by Dottori et al. (2016). Specifically:
Where n is the number of floodable floors, x1, x4 and x5 are the threshold heights established by Dottori et al. (2016) to describe damages to electrical system, while x2 and x3 are the critical heights associated with the plumbing system.
Finally, the absolute damage is divided by the restoration cost resulting for Hmax, obtaining the relative damage for each CH building (Eq. 6).
2.4 Artworks vulnerability assessment
This section presents the vulnerability assessment of artworks, with the objective of defining specific vulnerability curves. A new step-by-step what-if inundation simulation is applied to each CH site, focusing exclusively on evaluating the damage to movable and attached artworks. In this analysis, vulnerability functions are determined by several factors, including the quantity and typology of artworks, their corresponding unit restoration costs, dimensions, and height of exposure.
Exposure height is recorded during the data collection phase, as described in Sect. 2.1. Where direct measurement is not feasible, exposure heights are estimated for each artwork typology.
Once the exposure heights have been established, artworks within each asset are classified into seven levels, corresponding to predefined water depth intervals (0, 0.5, 1, 1.5, 2, 3, 4 m). Flood level thresholds were defined to balance detail and efficiency, with finer intervals where artefacts are most concentrated (0–2 m) and broader intervals where fewer works are displayed, including a final category above 4 m. For each inundation step, the number and typology of artworks exposed to water are recorded.
Two broad categories of artworks are considered: large-sized and small-sized. Large-sized artworks include frescoes covering entire walls or shelves of books and manuscripts arranged along the perimeter of a room. For these extensive items, especially collections of paper-based materials, it is assumed that the asset is linearly distributed in height (Salazar et al., 2023), and damage is estimated as a function of both water depth and building perimeter. At each increment of water depth, the affected area (or linear meters of damaged material) is quantified based on the building's perimeter.
Conversely, small-sized artworks typically lack precise dimensional data, and direct measurement is often impractical. In such cases, it is assumed that each artwork is represented as a point, and is fully damaged once the water level exceeds its height of exposure. The average surface area potentially exposed to floodwater is estimated for each artwork typology through a statistical analysis conducted at the site scale. Data for this analysis are drawn from the General Catalog of Cultural Heritage, developed by the Italian Ministry of Culture (https://catalogo.beniculturali.it/, last access: 1 June 2026), which includes detailed surveys and dimensions for numerous artworks. From the catalog, a sample of 394 artwork sheets (out of 500 examined) with complete “dimension” fields was selected, and average surface areas were calculated for each artwork typology. Equation (7) allows for the evaluation of monetary damage (EUR), accounting for both large- and small-sized artworks, using the number and type of items, their estimated areas, and unit restoration costs across different flooded floors for a given water depth (w). The restoration cost of artworks for the ith cultural site, is given by:
where
-
j represents the floodable floor, and n is the total number of floodable floors.
-
k denotes the type of artwork, and m is the number of artworks categories.
-
is the total number of large-sized artworks and is the total number of small-sized artworks of the same type, exposed for a flood depth w based on on-site inspections.
-
pi denotes the length of the segment of the building perimeter (in the case of frescoes) or the linear extent (in the case of shelves) occupied by large-sized artworks.
-
Ak,j is the average area of small-sized artwork type k on floor j, and RCk,j is the maximum unit restoration cost for artworks (EUR m−2) of type k on floor j.
If a CH site contains exclusively large-sized artworks, the second term in the brackets of Eq. (7) becomes zero, and the resulting damage increases linearly with water depth. Conversely, if the asset contains only small-sized artworks, the first term is zero, and the corresponding vulnerability curve assumes a stepwise form. When both large-sized and small-sized artworks are present, the resulting vulnerability function combines linear and stepwise components, alternating between continuous and discrete increases in damage.
By assuming the water depth w at each building reaches the maximum level Hmax, the maximum potential damage to the artworks of the ith CH site, denoted as ) can be estimated.
The relative damage for artworks for each CH site and flood depth (w) is then computed by dividing the monetary damage RCA,i(w) by the corresponding maximum potential damage, as shown in Eq. (8).
As explained in Sect. 2.2, restoration costs are estimated exclusively for the most common types of artworks – namely, paintings on canvas or panels, frescoes, wooden or stone sculptures, and paper-based materials, due to the limited availability of archival data for cost assessment (Van den Burg and Seymour, 2023). However, during the survey, additional artworks composed of other materials – such as metal or plaster sculptures, wooden furnishings, and textile objects – were also recorded under the category “Other artworks.” These items may contribute to a higher level of overall damage in a CH site.
Moreover, some CH sites regularly host temporary exhibitions, which may lead to variations in the number and typology of artworks present over time. To quantify the uncertainty associated with temporary exhibitions and the absence of archival data and restoration cost data for certain artwork types, a new index is introduced: the Cost Reliability Index (CRI). This index is assigned to each cultural building and is defined in Eq. (9).
The CRI aggregates two components: (i) the percentage of items classified as “Other artworks,” and (ii) the percentage of days per year the building hosts temporary exhibitions.
Where for ith CH site, NO,i is the number of items in “Other artworks”, NT,i is the total number of artworks, and dT,i is the number of days per year of temporary exhibition.
The CRI is used as a measure of uncertainty in estimating restoration costs for artworks. It is classified into three categories (good, fair, and poor) to represent the reliability of damage estimates. When the CRI is poor (i.e., greater than 0.3), the corresponding vulnerability function is excluded from the calculation of percentile vulnerability functions for artworks, as it is considered unreliable. As an example, a CRI value of 0.5 corresponds either to spaces used for temporary exhibitions for at least six months per year (where no a priori assessment of the types of artworks is possible) or to cases in which 50 % of the exposed artworks belong to the “other artworks” category.
2.5 Evaluation of the damage for a flood scenario
By applying the vulnerability functions introduced in Sect. 2.3 and 2.4 (Eqs. 2 and 7), the total restoration cost (artworks + building) for the ith site (RC) can be estimated for a flood event with an annual exceedance probability of , corresponding to a return period TR.
The overall city-scale damage for a scenario with return period TR is then computed by summing the total restoration costs of all cultural site:
Where Q is the total number of cultural sites considered.
Similarly, the maximum potential site-scale damage is determined by summing the maximum restoration cost for each cultural site, assuming water depth reaches the maximum level (Hmax)
3.1 Geographic and historical setting
This method is applied to the CH of the historical city center of Florence (Fig. 2a), located in central Italy, which has been recognized as a UNESCO World Heritage since 1982. The UNESCO World Heritage Committee has acknowledged that the Historic Centre of Florence is the result of long-lasting creativity, whose influence has profoundly shaped architecture and fine arts of Italy and Europe (https://whc.unesco.org/en/list/174/, last access: 1 June 2026).
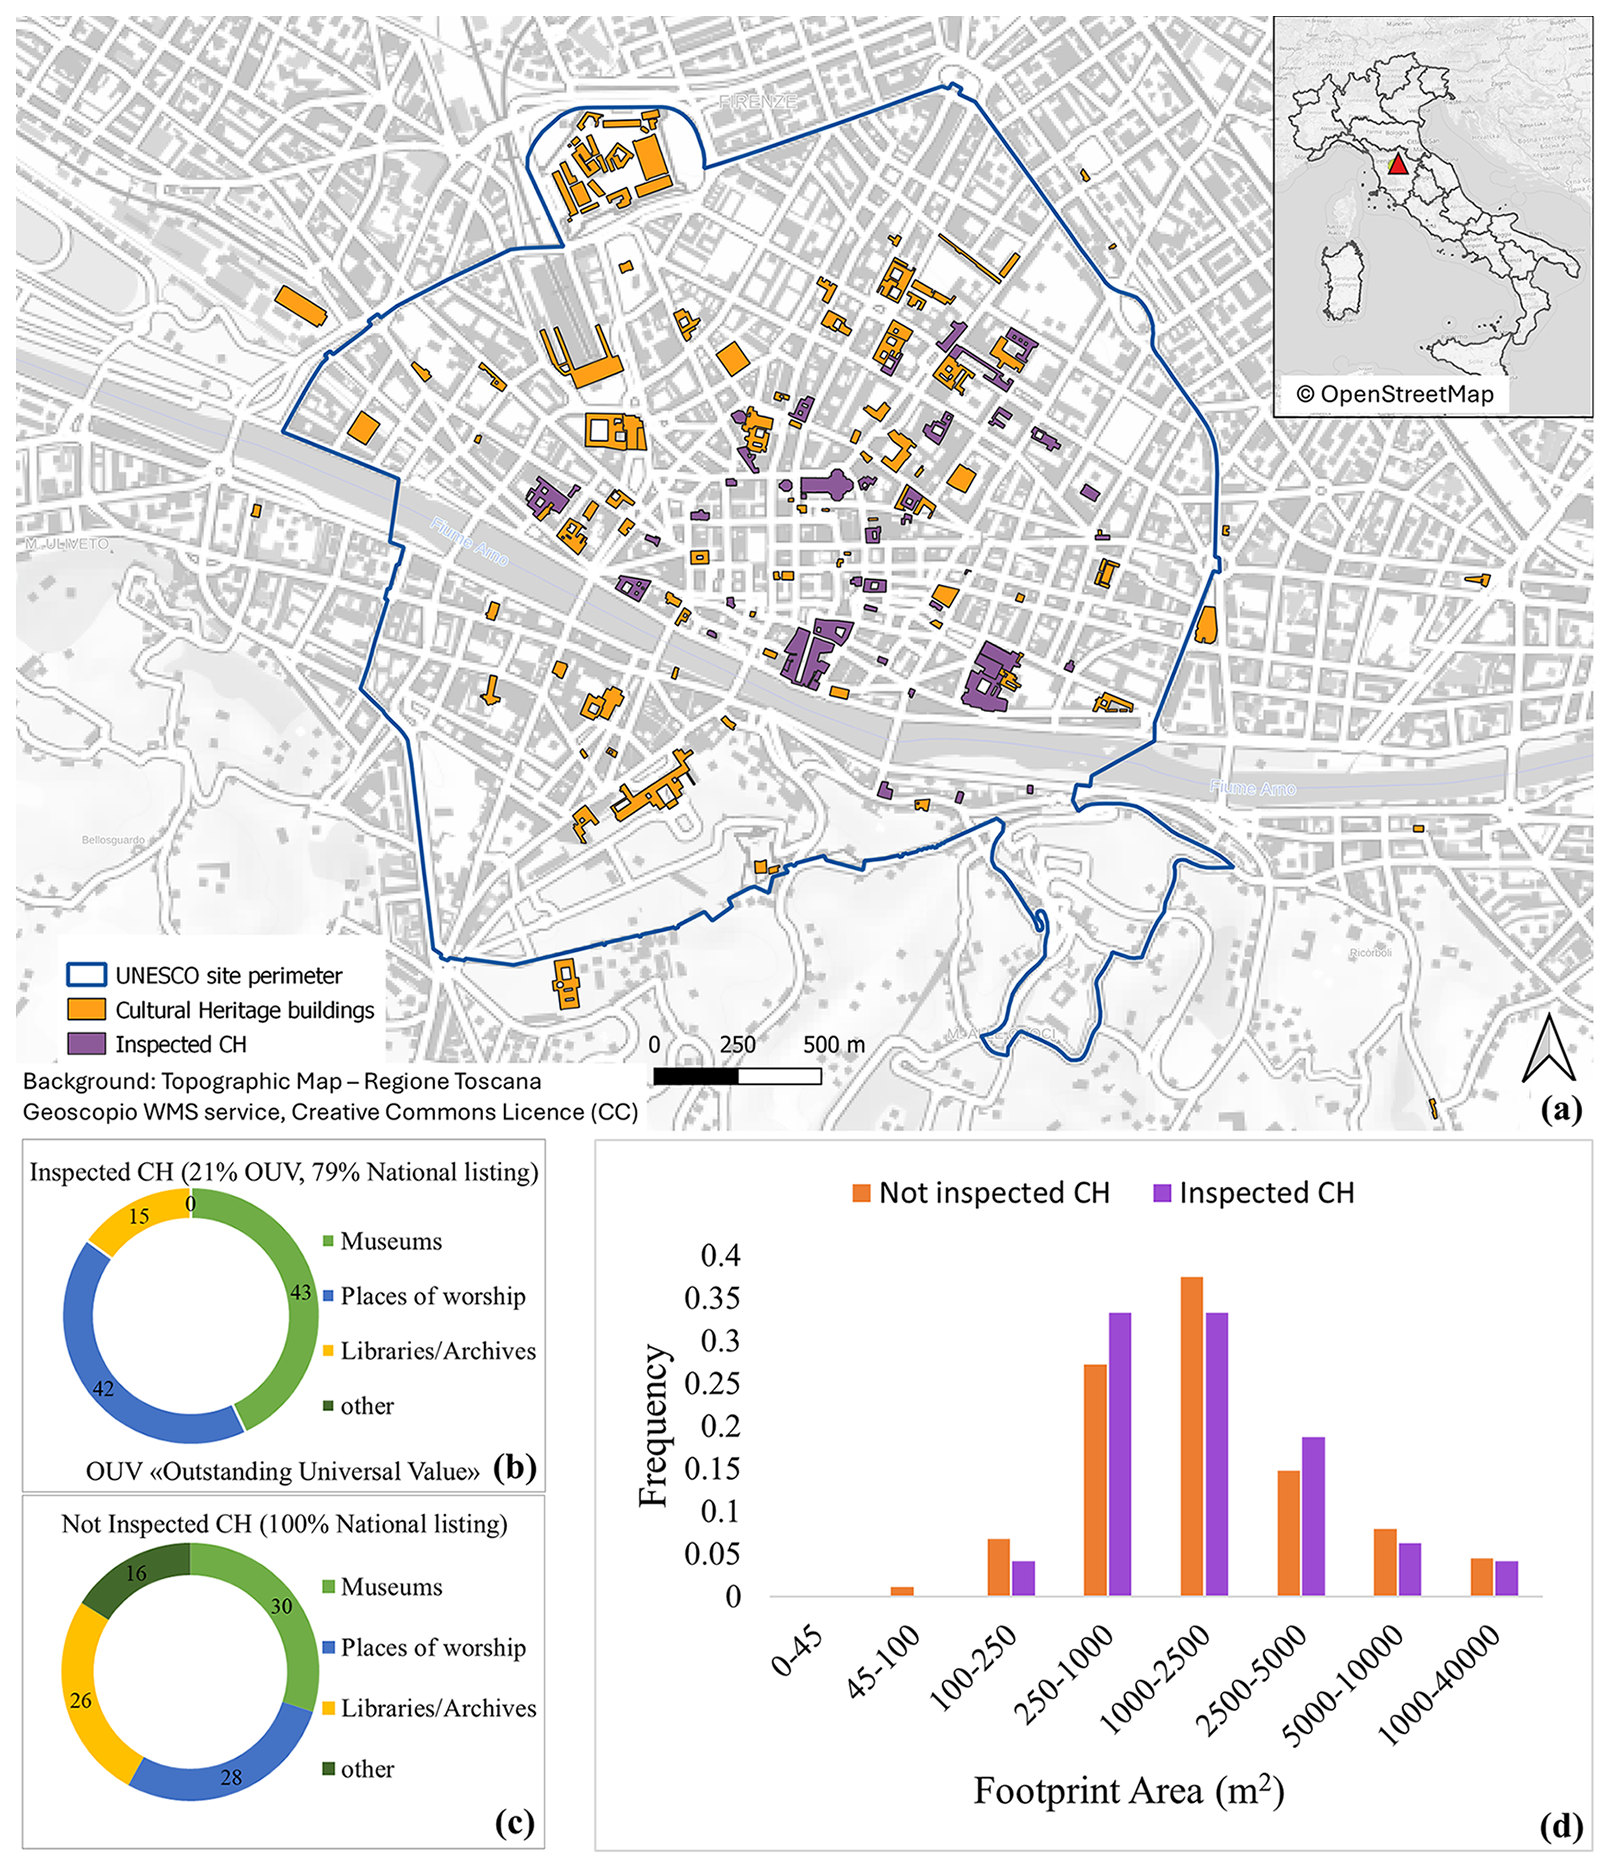
Figure 2Florence study area, cultural heritage buildings and those inspected for the development of vulnerability functions (a). Characteristics of inspected vs not inspected CH in terms of typology and protection status (b, c) and distribution of footprint area (d). Background map is based on data from OpenStreetMap. © OpenStreetMap contributors, licensed under the Open Database License (ODbL).
Florence has been periodically affected by flooding since at least the twelfth century. The most catastrophic event occurred in November 1966, causing extensive damage to the city's cultural heritage and economic activities (Galloway et al., 2020).
3.2 Inspection and parameters assumption
The Northern Apennine District provides a polygon shapefile identifying 175 buildings within the city of Florence, all classified as cultural heritage (CH) (Orange and purple buildings in Fig. 2). CH not exposed to floods was excluded from the dataset (30 buildings out of 175). To support the assessment of cultural assets' vulnerability, cultural heritage managers of assets within the UNESCO area were invited to contribute key information (Table 1), however, only of them provided a feedback to our request of access and information. Among the managers who were available to support the research, we observed a highly heterogeneous sample in terms of institutional affiliation and risk awareness, including directors of sites of Outstanding Universal Value, directors of local museums, and church custodians. Ultimately, the model described in the preceding sections was applied to a subset of 48 sites, encompassing museums (43 %), places of worship (42 %), libraries/archives (15 %) (Purple buildings in Fig. 2a, c). For the development of vulnerability functions for the buildings, i.e., to estimate the restoration costs for interior finishes and systems, we group the sample into two classes based on the presence of basement and its hydraulic connectivity with the road surface. For the development of vulnerability functions for the artworks inside the buildings we consider three classes: museums, places of worship, libraries/archives.
Libraries and archives, although subject to different accessibility and regulatory conditions, are grouped together due to their similar storage systems (i.e., shelving) and the nature of their collections, which are primarily paper-based. Places of worship, by contrast, constitute a separate group for vulnerability analysis despite their internal diversity. They share several key features, including the presence of frescoes and wall decorations, similar types of artworks (e.g., panel paintings and wooden sculptures), and comparable display arrangements. The surveyed sample of places of worship includes 15 churches, 2 oratories, 1 baptistery, and 1 Jewish temple. The percent distribution of CH types in the surveyed sample, reflects pretty well the types not included in our detailed analysis (30 % museums, 28 % places of worship, 26 % libraries/archives, 16 % other, e.g., theatres or train stations) (Fig. 2b, c). Moreover, the mean and median statistics of the footprint area of the CH building align well in the two samples (mean = 2250 m2, median = 1292 m2, mean = 2652 m2, median = 1433 m2, in the surveyed and not surveyed samples respectively) (Fig. 2d).
The restoration costs associated with buildings were estimated using the vulnerability model proposed by Dottori et al. (2016), incorporating a multiplicative factor (FL) of 4. This factor accounts for the high construction quality of historical buildings, the regulatory and conservation constraints involved in their restoration, and the need for compatible materials and specialized skilled labor.
The restoration cost of artworks in a CH asset is calculated with Eq. (7), assuming the following hypothesis:
-
For panels, canvas, wooden or stone sculptures, the maximum unit price for restoration is assumed; for paper-based materials the average restoration cost for a linear meter is utilized.
-
Concerning the damage assessment of paper materials, it is assumed that shelves are arranged along the perimeter from floor level up to a height of 3 m, with 0.5 m spacing between them. Otherwise, books, if limited in number, are stored at 1.80 m from the pavement and the number of books or photographs that can fit within a meter of shelf space is assumed respectively equal to 35 (ISTAT, 2016) and 1035 (D'Alconzo et al., 2022).
-
When direct exposure measurement is not possible, it is supposed that the base of paintings (whether on canvas, panels, or frescoes) is positioned at 1.20 m above floor level. Otherwise, wooden and stone sculptures are placed on a 1 m-high base.
To estimate the average size of the artworks a sample of 394 artwork sheets (out of 500 examined), complete in the “dimension” fields, was selected. The sample included 115 paintings on canvas, 174 paintings on panel, 33 frescoes, 24 wooden sculptures, 48 stone sculptures. Finally, the overall site-scale damage is assessed for a scenario with a 500-years return period. The 1D/2D hydraulic model outlined by Arrighi et al. (2022) is applied to simulate the event's propagation and to estimate the expected water depth within the CH buildings.
4.1 Site characteristics and flood damage analysis
Among the 48 cultural heritage sites examined, 42 % are places of worship, 43 % are museums, and 15 % are libraries. A majority of these sites (41 out of 48) have a basement, 34 % of which are used to store artworks. Notably, some museums – such as the Marino Marini Museum – are located in former places of worship, where crypts have been repurposed to house parts of the permanent collection or temporary exhibitions. In most cases, however, museum basements are used to store artworks that are not part of the public display. By contrast, only 4 out of 20 places of worship and 2 out of 7 libraries utilize their basements for artwork storage.
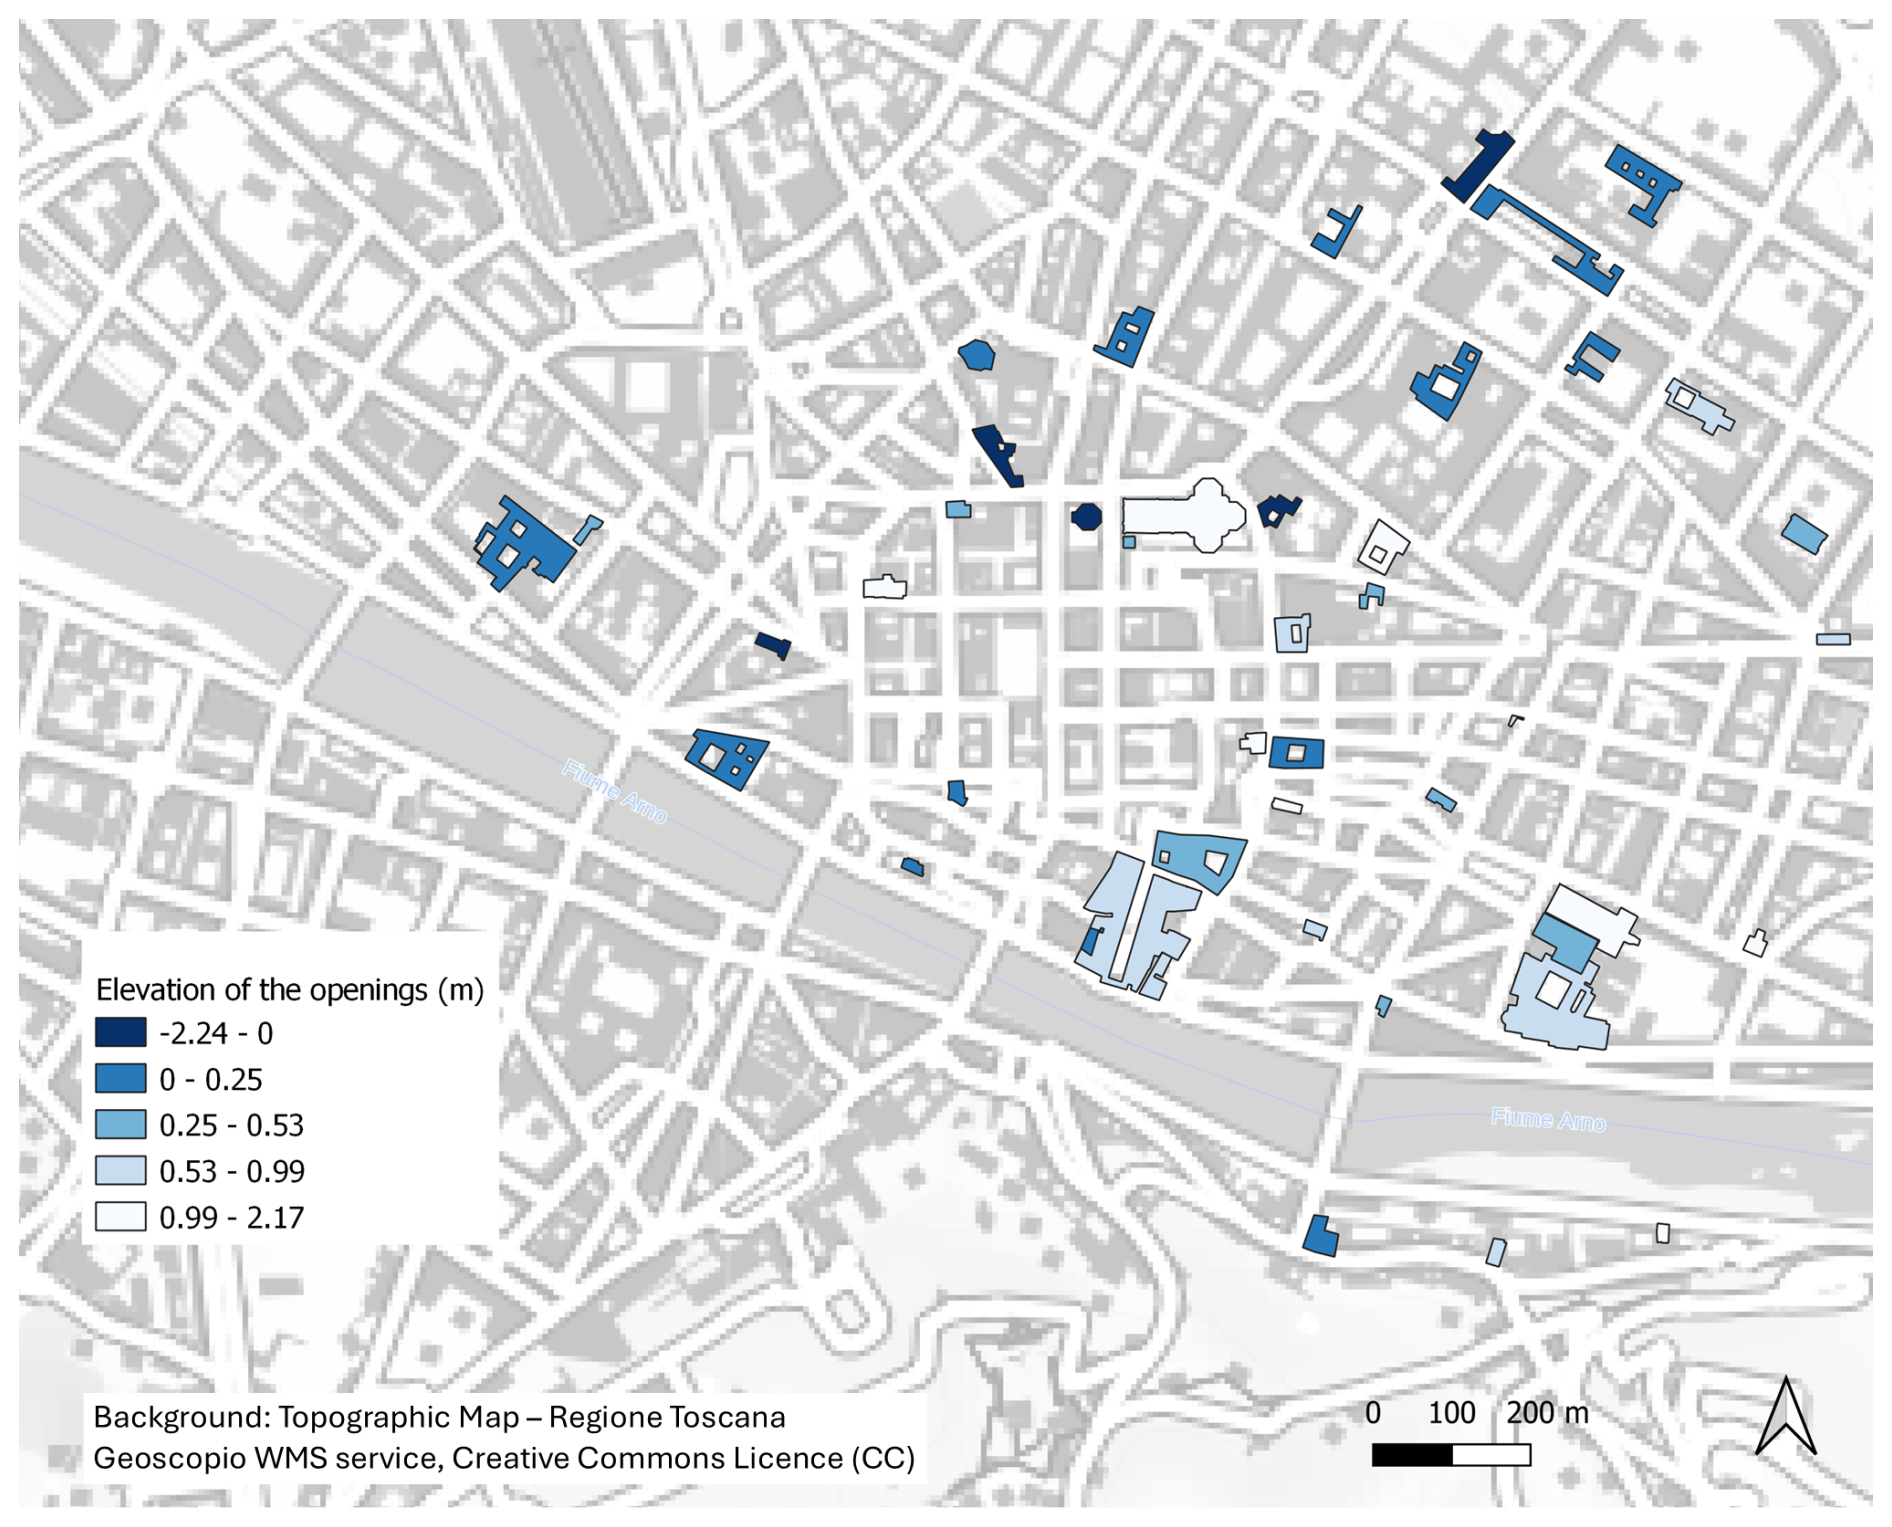
Figure 3Elevation of the cultural heritage building openings HO above the road pavement after on-site measurements. Background map is based on data from OpenStreetMap. © OpenStreetMap contributors, licensed under the Open Database License (ODbL).
In the majority of the inspected cultural heritage buildings, the ground floor is elevated above street level. On average, the elevation of the main entrance is approximately 0.54 m. This average increases to 0.72 m for places of worship and decreases to 0.33 m for museums. The highest recorded elevation among the surveyed sites is 2.17 m, observed at the Santa Croce Church. Figure 3 presents the measured elevations of building openings above road pavement for the inspected sites.
The elevation of these openings is a critical factor in determining flood exposure, as it directly influences the flood depth threshold used to define zero-damage levels in vulnerability functions.
In Florence, typical places of worship are Catholic churches, generally characterized by a central nave extending from the entrance to the main altar, flanked by multiple side chapels that often house altarpieces. Alternatively, oratories are usually organized around a central atrium featuring an altar and a finely crafted wooden choir that runs along much of the interior perimeter. Conversely, all surveyed museums are housed in historic palaces. However, due to the considerable variety in their exhibitions and internal configurations, it is not possible to define a “typical” museum structure for Florence.
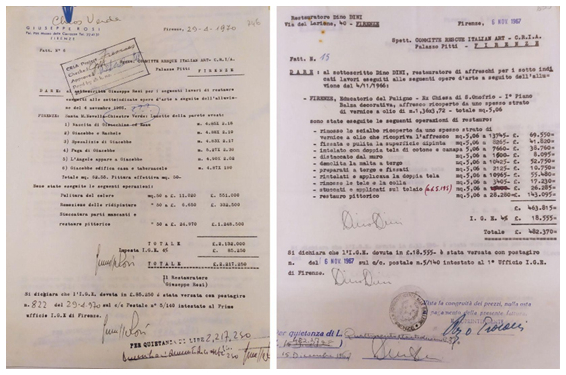
Figure 4An example of invoices issued by restorers after flooding 1966, stored in CRIA archive.
Following the field investigations, the research focused on a detailed analysis of damage caused by historical flood events. The CRIA archive (Committee to Rescue Italian Art, 2025) contains extensive documentation on the 1966 flood in Florence, including photographs (over 900), videos, and written records. Restoration invoices issued after the event were examined and categorized by artwork type – primarily paintings on canvas, paintings on wooden panels, and wooden sculptures. Figure 4 provides an example of these invoices related to restoration work carried out post-flood. The list of restoration activities documented for flood-damaged artworks was used to update restoration costs to present-day values, enabling the estimation of contemporary repair costs based on historical data.
Table 2Restoration operations, relative costs (pricing 2025) and average dimensions of the main typologies of artworks. In bold the value used for the following elaborations.
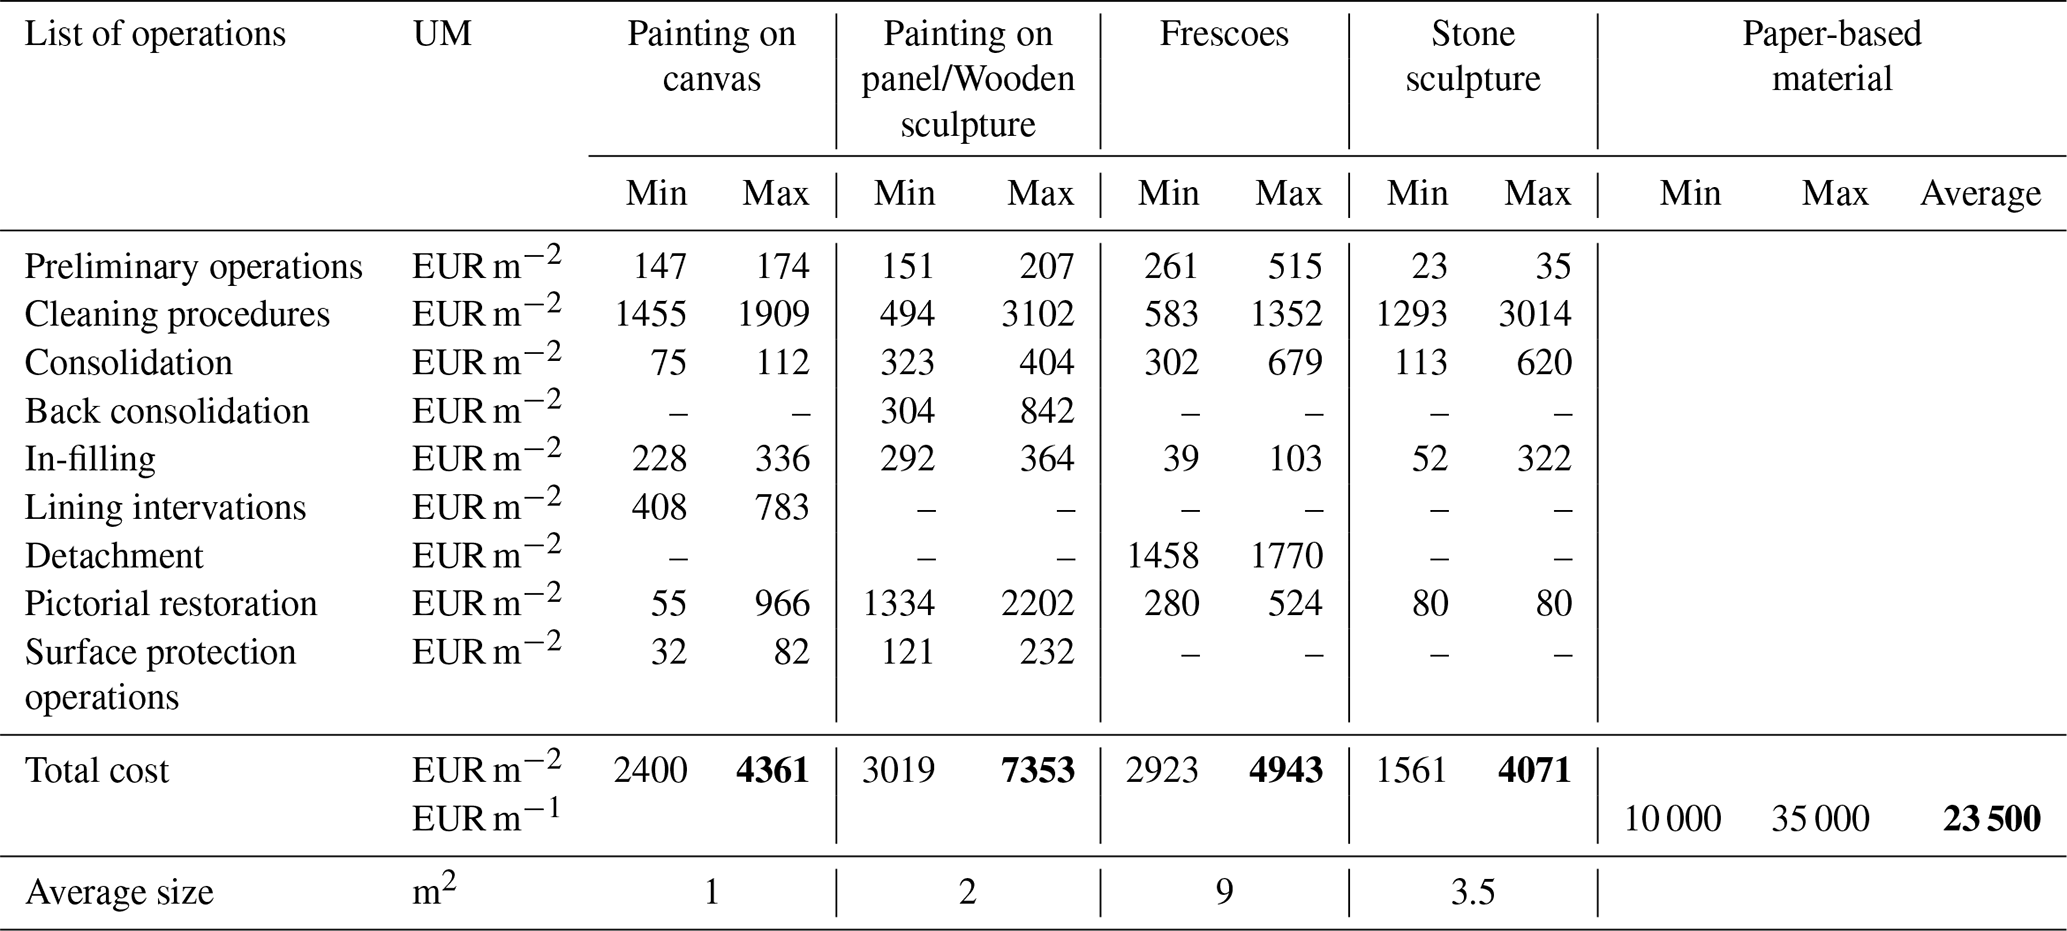
Table 2 presents the unit restoration costs from price list of 2025, and average sizes for various types of artworks, as calculated using the methodology described in Sect. 2.2. As anticipated, books and paper-based materials are the most expensive to restore, with costs reaching EUR 23 500 per linear meter of shelf space. This finding aligns with post-disaster assessments from the 1966 flood in Florence, where even 36 years later, approximately 50 %–60 % of the damaged books remained unrestored (Arrighi et al., 2018a).
Similarly, restoration costs for panel paintings and wooden sculptures are notably high. This can be attributed to the inherent susceptibility of wood to hydric expansion, as well as its vulnerability to decay from fungal and insect infestations (Figueiredo et al., 2021).
4.2 Building's vulnerability functions
The building analysis yields a specific vulnerability function for each CH building. These functions typically exhibit a combination of two growth patterns: a linear progression, reflecting damage to finishes and plaster, and a stepwise increase, associated with damage to floors and utility systems. Two vulnerability patterns, independent of CH types, are identified in the study area. These patterns reflect different inundation behaviors depending on the presence of a basement and its hydraulic connectivity to the road surface, along which the flood propagates. Figure 5 presents the two distinct vulnerability patterns, each accompanied by an average function (solid black line), the 25th percentile (orange dashed line), and the 75th percentile (blue dashed line).
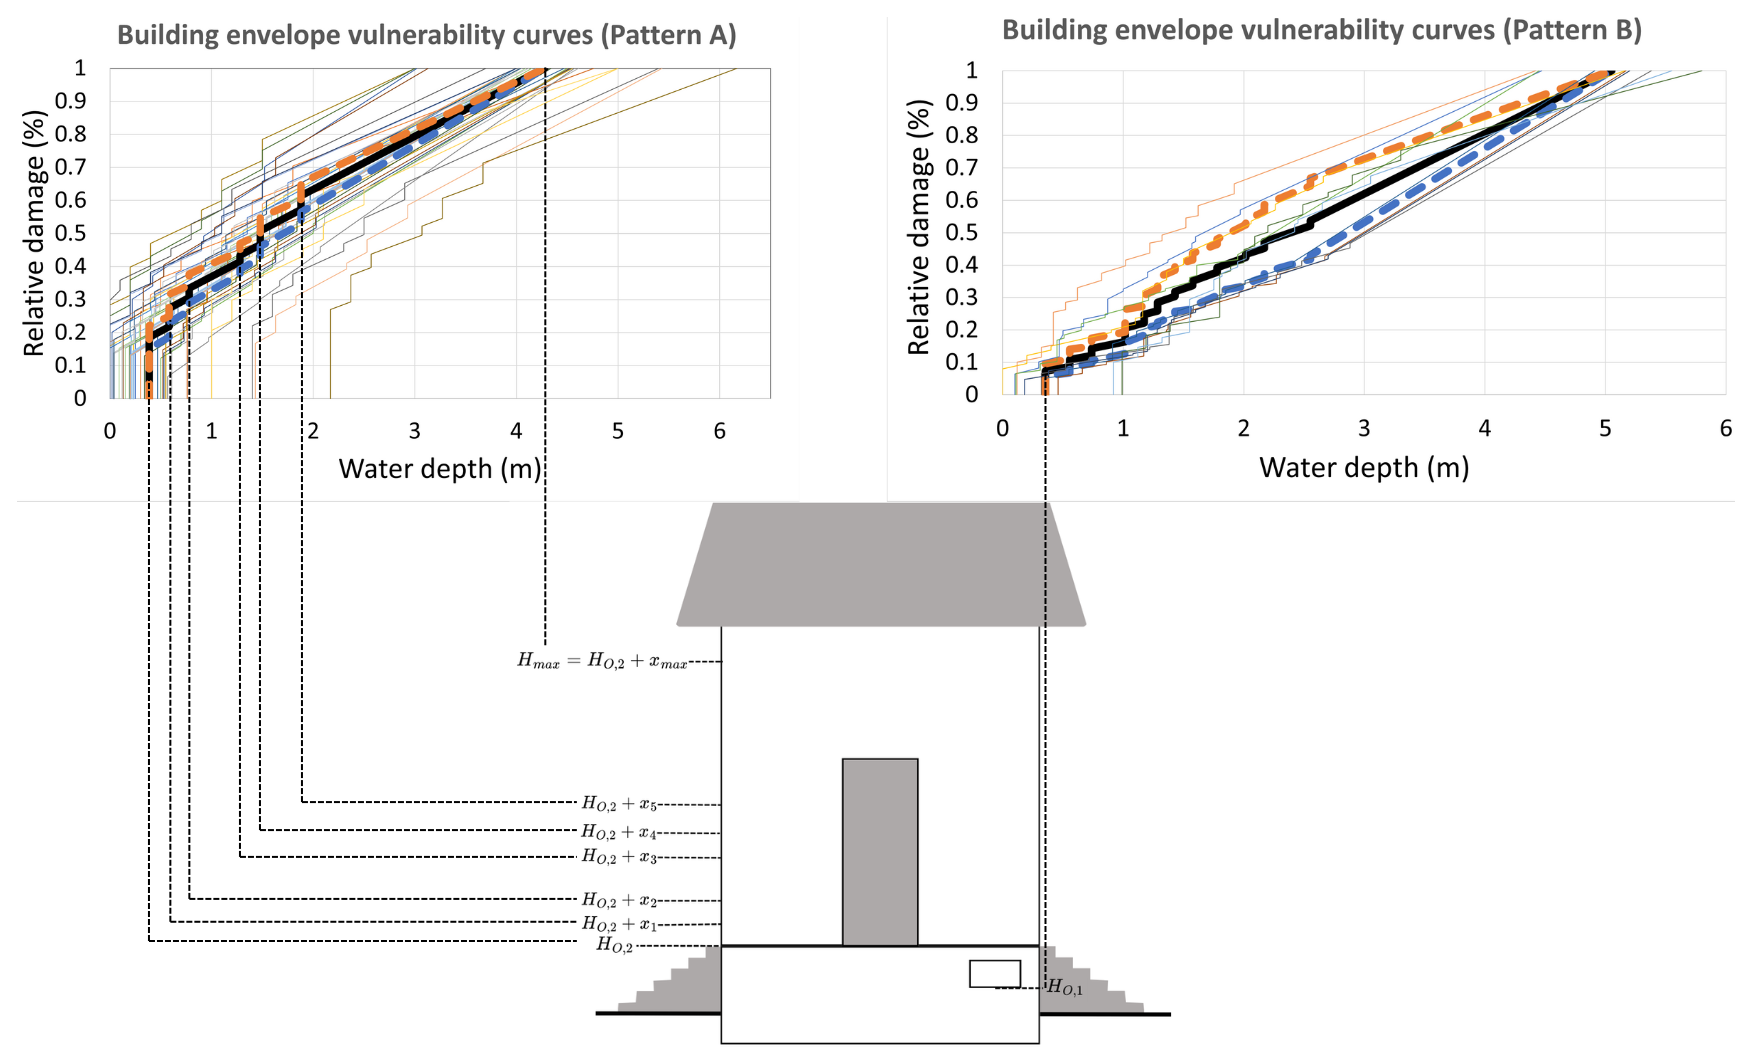
Figure 5CH Building vulnerability functions: Pattern A (on the left) and Pattern B (on the right). The bold black, orange and blue curves are the average, 75th and 25th percentile vulnerability functions.
Pattern A (left) is characterized by six steps and represents damage scenarios for buildings either without basements or with basements that flood simultaneously with the ground floor. This occurs when basement openings are either absent or positioned above the elevation of the main entrance – typically in buildings with multi-level ground floors. The first step of the function corresponds to the point at which floodwaters reach the lowest opening, thereby affecting the floor. On average, this occurs at a water depth of 0.39 m, resulting in approximately 18 % relative damage to the building. The extent of damage at this initial stage tends to increase with the building's surface area.
Subsequent steps in Pattern A correspond to progressive damage to electrical and plumbing systems. When the electrical system is fully compromised – typically at an average water depth of m – the relative damage reaches approximately 62 %.
In contrast, Pattern B (right) corresponds to buildings where the basement floods before the ground floor due to basement openings located below the elevation of the main entrance or any ground-floor openings. In this scenario, damage is assumed to occur equally at each level. Accordingly, Pattern B functions are derived by summing two identical stepwise curves, each shifted along the x-axis by , representing the elevation difference between ground-floor and basement openings. As a result, the vulnerability curve for Pattern B includes twelve steps – six for each level.
As shown in Fig. 5, buildings following Pattern B begin to sustain damage when water reaches the lowest basement opening, at an average depth of 0.36 m. Typically, when water depth reaches 2.55 m, the electrical systems on both levels are entirely compromised, and approximately 54 % of the interior finishes of the building is damaged.
Only 10 CH buildings fall under Pattern B. Due to the low elevation of their basement openings relative to the street level, the first damage step for most of these buildings occurs at water depths below 0.5 m. The sole exception is the National Library of Florence, where the basement windows are located 0.99 m above street level, requiring a greater flood depth to trigger initial damage. The average and percentile vulnerability functions for the CH building are also displayed as Supplement of the manuscript.
4.3 Artworks' vulnerability functions
The vulnerability assessment of artworks, as described in Sect. 2.4, yields a vulnerability function for each cultural site. These functions account for both movable and immovable artworks, illustrating how damage increases with rising water depth. Figure 6 groups the resulting vulnerability functions into three categories based on asset type: archives/libraries, places of worship, and museums. In each graph, the black line represents the average vulnerability curve, while the blue dashed line and orange dashed line represent the 25th and 75th percentiles, respectively. Only cultural site with a Cost Reliability Index (CRI) value below 0.3 are included in the figure.
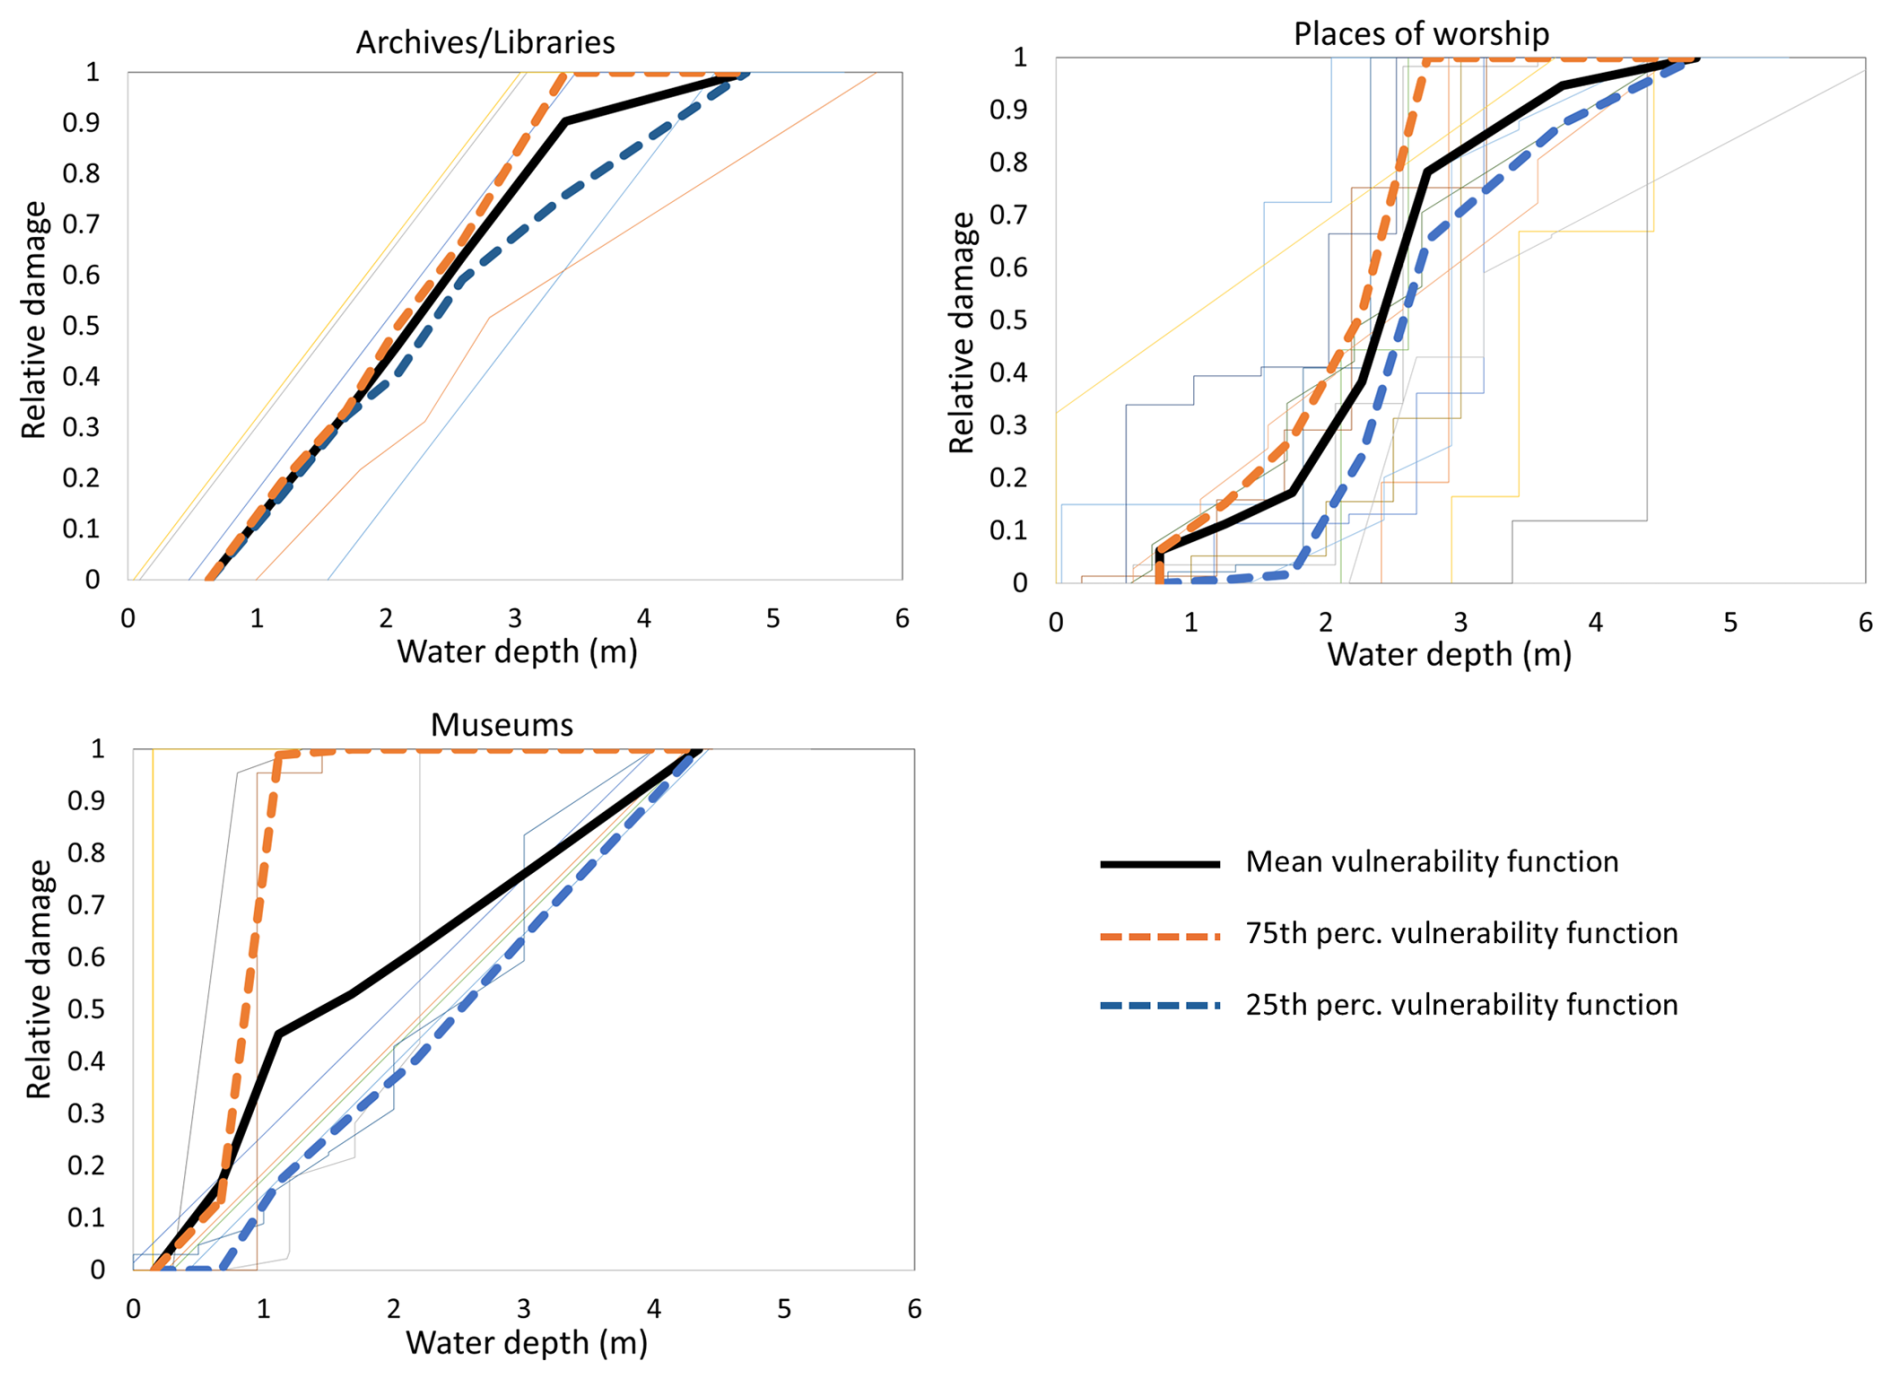
Figure 6Artworks vulnerability functions for libraries/archives (top left), places of worship (top right) and museums (bottom left). The bold black, orange and blue curves are the average, 75th and 25th percentile vulnerability functions.
Figure 6 (top right panel) presents the vulnerability curves for places of worship in the city of Florence. Approximately 69 % of these curves exhibit a stepwise growth pattern, while the remaining curves display a combined trend of linear progression and stepwise increase. This mixed behavior reflects the coexistence of large-scale artworks, such as frescoes, and smaller movable objects, including paintings on canvas and sculptures. On average, no damage is recorded until the external water depth reaches approximately 0.77 m, after which the relative damage increases rapidly to 6.2 %. A significant inflection occurs at around 1.75 m, where the damage rate increases sharply – from 0.12 to nearly 0.4. Complete damage is observed at a water depth of approximately 4.7 m. This depth–damage behavior aligns with the field data collected and supports findings from previous studies (Salazar et al., 2023; Figueiredo et al., 2021). Initially, elevated ground floors help delay damage; however, once floodwaters breach the entrances, ground-level artworks – such as marble fonts and wooden pews – are immediately affected. When internal water depth reaches around 1 m, artworks located at higher elevations, such as altar paintings, are also impacted, significantly increasing restoration costs.
In the “libraries/ archives” category, only five assets (shown in Fig. 6, top left panel) have a Cost Reliability Index (CRI) below 0.3. Among these, four exhibit a linear vulnerability trend, typical of assets whose interiors are predominantly lined with paper-based materials. Only one asset follows a combined linear and stepwise pattern: the Central National Library of Florence, which includes sculptures and paintings alongside its extensive collection of books, manuscripts, and periodicals.
In the museum category, multiple vulnerability patterns are observed, reflecting the diversity of museum types. This category includes sites ranging from galleries, which display large numbers of paintings or sculptures, to cenacles and historic palaces entirely decorated with frescoes. In galleries, the vulnerability function typically shows a stepwise pattern, while fresco-covered spaces often follow a linear progression. A particularly notable case is represented by the yellow curve, which shows a single-step transition from zero to 100 % relative damage. This curve corresponds to the “Cappelle Medicee” museum, which houses the Medici Crypt, the burial site of the Grand Dukes and their families. Due to the exceptional historical and evidential value of the marble gravestones covering the crypt's floor, the museum is considered completely damaged as soon as floodwaters infiltrate the building (Historic England, 2008). An analysis of average vulnerability functions across the museum category reveals that relative damage increases rapidly up to a water depth of approximately 1.12 m, after which the rate of increase slows, as indicated by a decrease in the average slope of the function.
The average and percentile vulnerability functions for the artworks are also displayed as Supplement of the manuscript.
4.4 Monetary flood damage
The 2D hydraulic simulation developed by Arrighi et al. (2022) provides flood maps for various scenarios, enabling the estimation of water depth at each CH building. For demonstrative purposes, the 500-year return period scenario is used to assess flood damage. Figure 7a illustrates the flood depth in proximity to buildings. It is evident that cultural heritage (CH) buildings located near the river experience the greatest flood depths – on the order of 3–4 m above the road pavement in the S. Croce district (lower right area of Fig. 7a). Conversely, moving downstream and away from the river, flood depths at CH buildings decrease significantly.
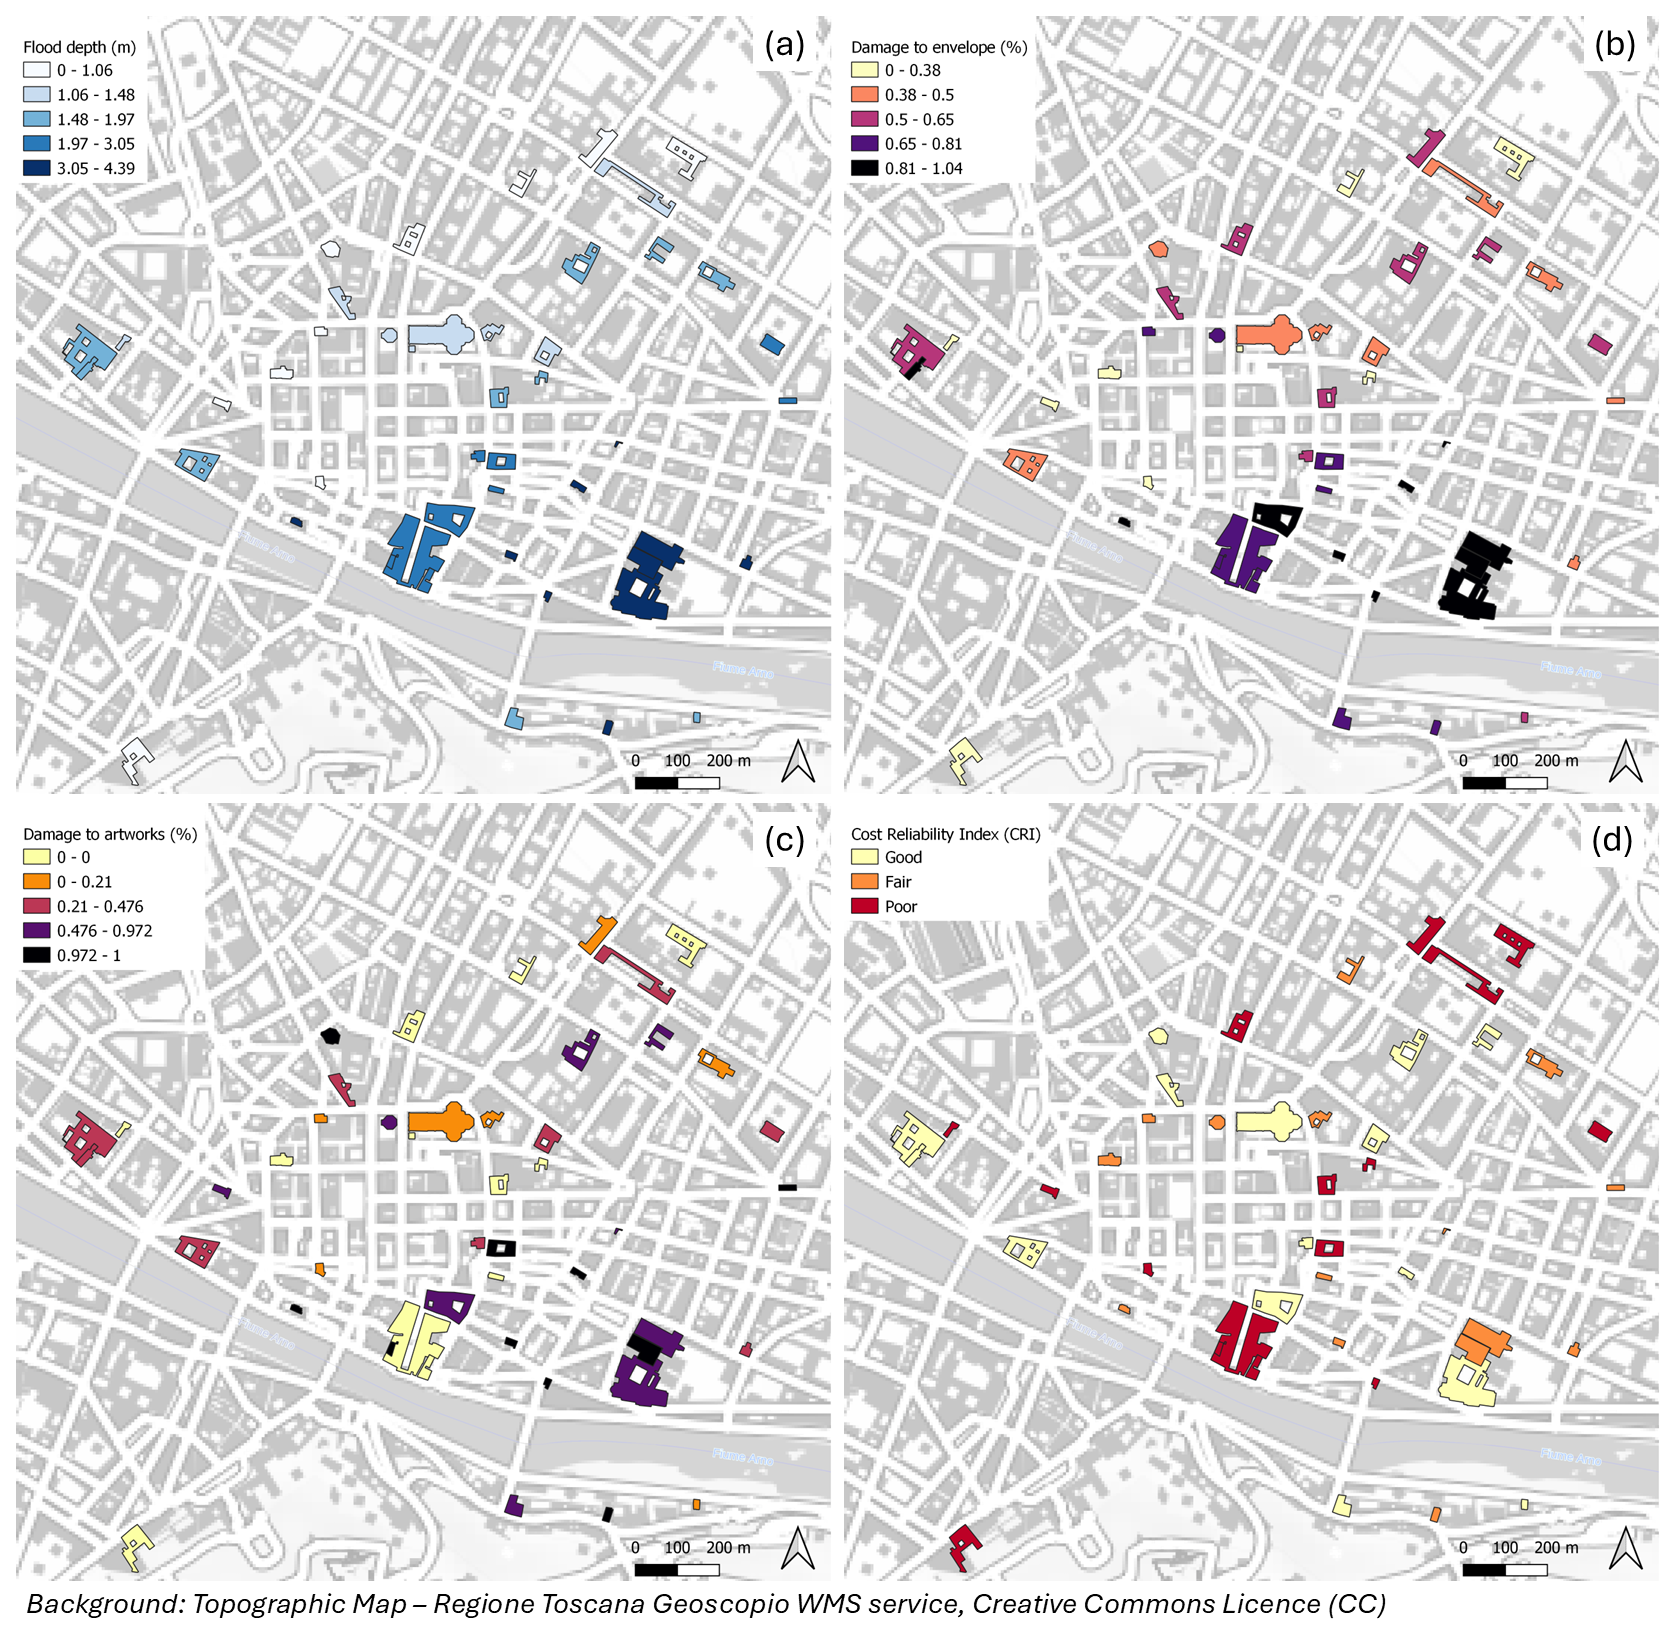
Figure 7Flood depths for the 500 years return period scenario (a), relative damage to the building envelope (b), relative damage to the artworks (c), Cost Reliability Index for artworks (d). Background maps are based on data from OpenStreetMap. © OpenStreetMap contributors, licensed under the Open Database License (ODbL).
The relative damage to building is shown in Fig. 7b. The most exposed assets, depicted in black and purple, exhibit losses exceeding 65 % under the analyzed flood scenario. Notably, the pattern of damage to building does not decrease in direct correlation with flood depth. This discrepancy arises from variations in architectural features, particularly the elevation of openings (see also Fig. 3 for comparison). This observation underscores the importance of on-site inspections to better determine the zero-damage thresholds of such historically unique buildings. For instance, many buildings close to the river possess elevated ground floors, mitigating damage, while those farther from the river often have entrances at or below road level, increasing their vulnerability.
Regarding the relative damage to artworks (Fig. 7c), the results are more variable due to the heterogeneous distribution of artworks, differences in material susceptibility, and their positioning within CH buildings. Notably, artworks in four cultural buildings – whose ground floors are elevated above street level – remain unaffected, despite their location in flooded areas under the 500-year return period scenario. Nevertheless, the S. Croce district, which hosts libraries, museums, and small churches, emerges as a significant cluster of potential artwork damage.
As detailed in the methodological section, restoration costs were estimated for common types of artworks (e.g., panel paintings, canvas paintings, books). However, limited archival data were available for other categories such as textiles or furniture. Additionally, some CH buildings host temporary exhibitions, introducing further uncertainty into damage assessments. Figure 7d highlights buildings containing artworks for which restoration costs could not be estimated, or which may host temporary exhibitions. They are represented in red in the figure, i.e., CRI > 0.3 poor reliability. In these cases, losses were calculated only for known items, potentially leading to an underestimation of total damage (in the case of undocumented materials).
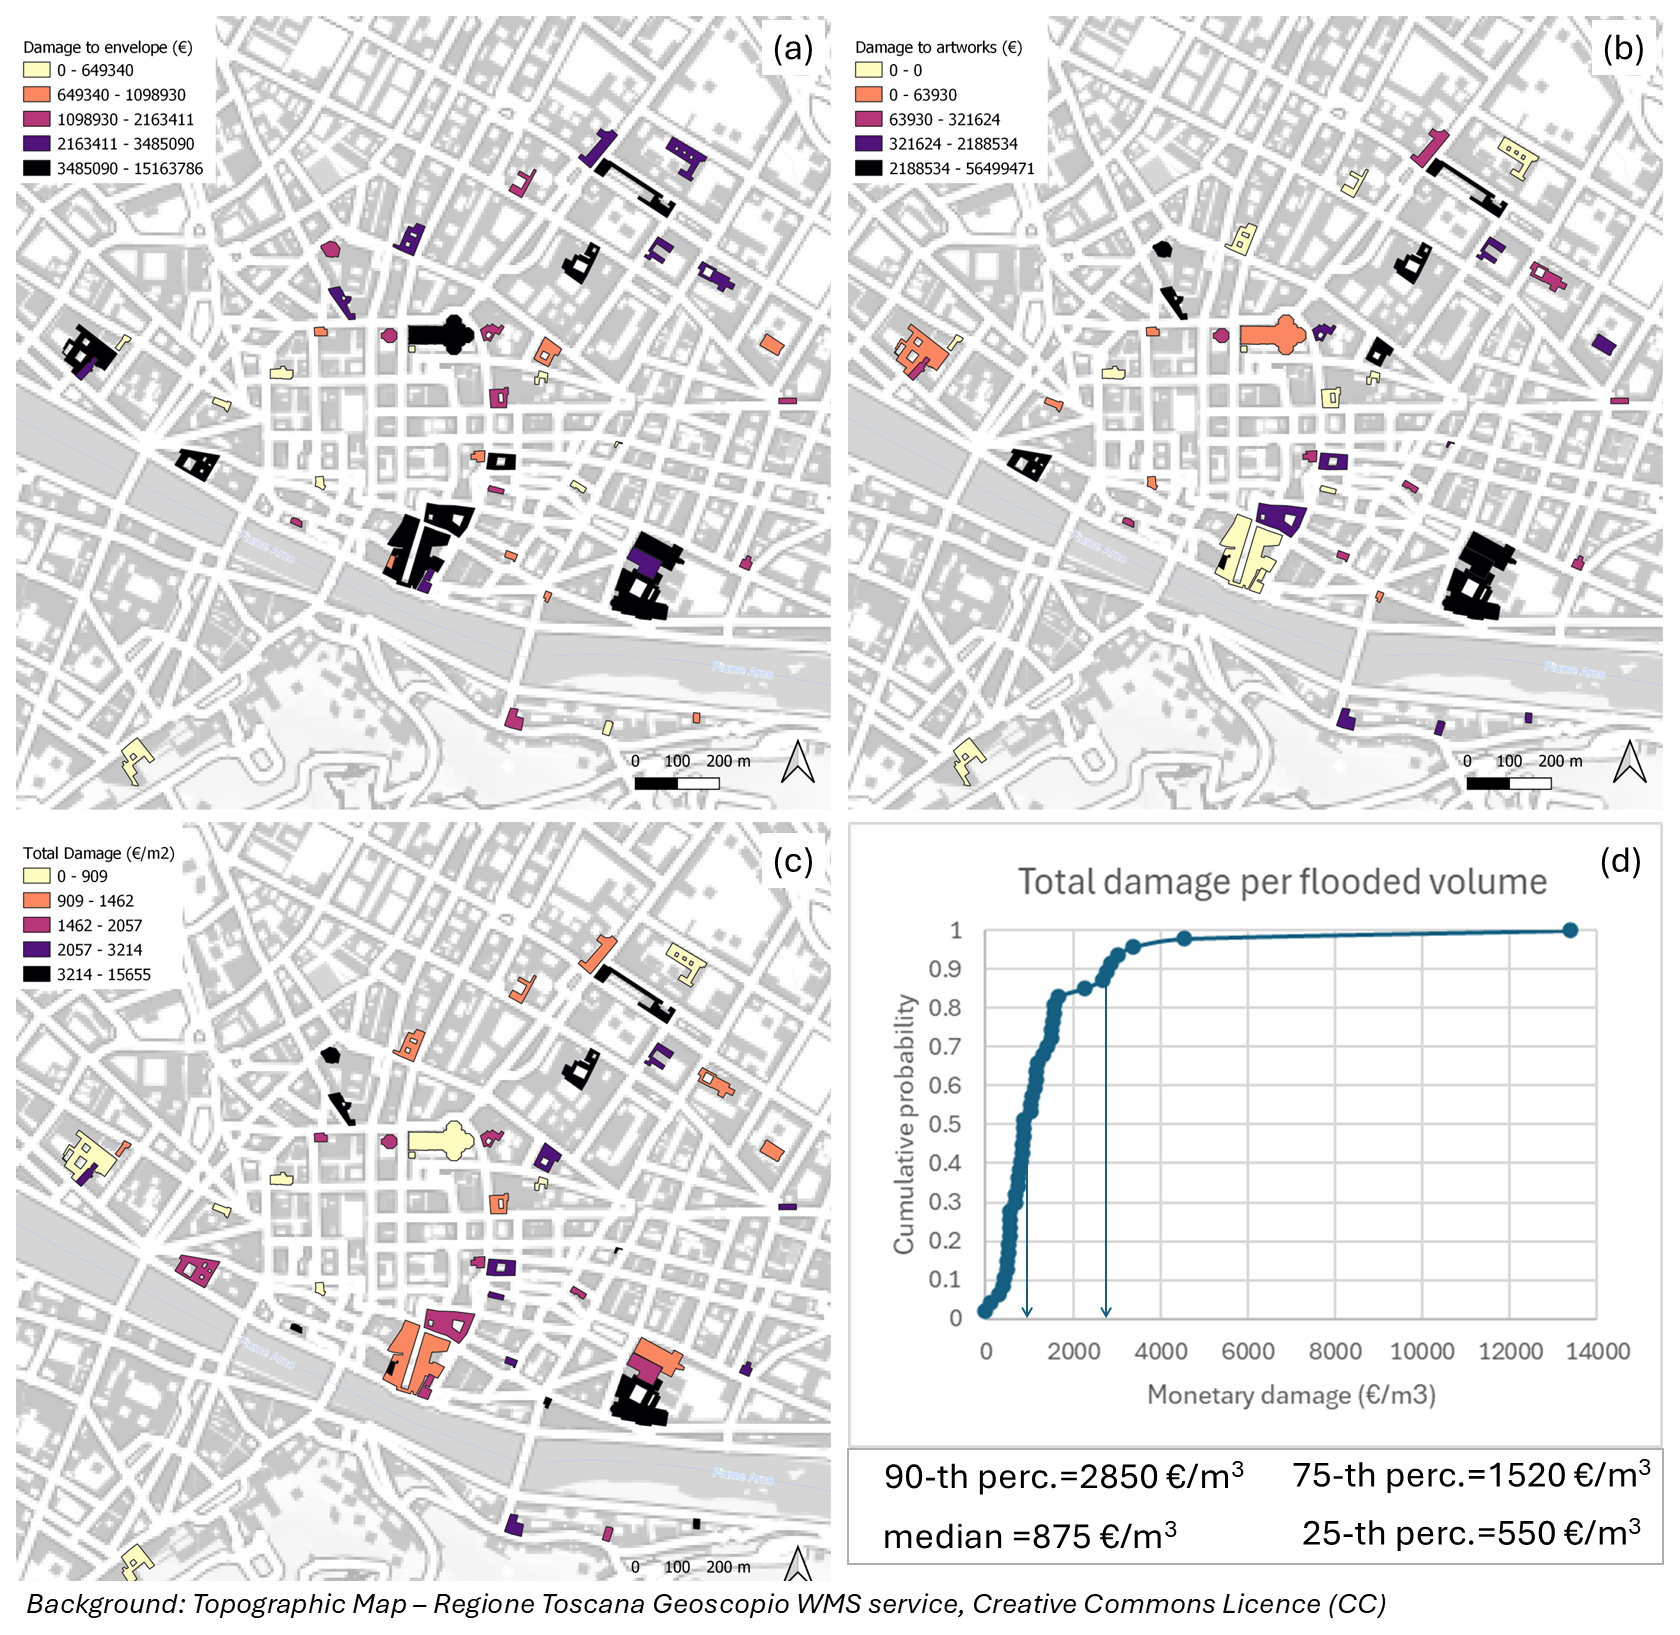
Figure 8Monetary damage to CH envelope (a), artworks (b), unitary surface damage (c) and unitary volume damage (d). Background maps are based on data from OpenStreetMap. © OpenStreetMap contributors, licensed under the Open Database License (ODbL).
Monetary damages are presented in Fig. 8 for buildings (Fig. 8a) and artworks (Fig. 8b). Damage to the buildings is primarily driven by the larger cultural heritage (CH) buildings in the study area, with the five most affected assets each exceeding EUR 5 million in estimated losses. The average monetary damage to buildings is approximately EUR 2.5 million per building, corresponding to around EUR 1400 m−2. The total estimated damage to buildings across the 48 assessed buildings amounts to approximately EUR 120 million.
Artwork-related damages are predominantly concentrated in libraries and certain museums, with the three most affected institutions – the National Library, the Archaeological Museum, and the university library – each incurring losses exceeding EUR 10 million. The Archaeological Museum, in addition to its vast collection of artefacts, houses, within its flood exposed levels, an extensive archive of books, as well as papyrus and parchment manuscripts (nearly 100 000 items), and photographs documenting archaeological campaigns since the 19th century (over 2 million, according to the museum manager). Therefore, all three of the most affected institutions contain paper-based materials, which are highly susceptible to water damage. The average monetary damage to artworks in CH buildings is estimated at EUR 3 million per asset, corresponding to approximately EUR 1110 m−2. The total estimated monetary damage for artworks is approximately EUR 150 million.
Figure 8c illustrates the combined damage (building and artworks) expressed as unit cost per square meter. Unitary total damages range from approximately EUR 500–700 to 2000–4000 m−2, with localized peaks exceeding EUR 10 000 m−2, thus spanning two orders of magnitude. By dividing the unitary total damage by the flood depth, a unit monetary damage per flooded volume of CH is obtained. The cumulative probability distribution of this metric is shown in Fig. 8d. The median and 75th percentile values for monetary damage per cubic meter of flooded volume are EUR 875 and 1520 m−3, respectively.
The total estimated damage for the 48 inspected CH buildings amounts to approximately EUR 270 million. Extending the median unit volumetric damage values to other, non-inspected but comparable CH buildings yields an additional rough estimate of EUR 257 million (EUR 447 million when considering the 75th percentile). This results in a total estimated monetary damage to cultural heritage within the municipality of approximately EUR 527 million. We note that these estimates do not account for: (i) artworks with unknown restoration costs, (ii) artworks in temporary exhibitions, and (iii) conservation and transportation costs.
4.5 Discussion
Site inspections, interviews with CH managers and measurements highlight the significant variability in the characteristics of buildings, presence of artworks and risk awareness across CH assets in the study area. The CH managers who participated in the study represented a heterogeneous group in terms of institutional affiliation and risk awareness, including directors of sites of Outstanding Universal Value, local museum directors, and church custodians. Within this group, awareness of flood risk varied widely, with some respondents fully informed and others entirely unaware. Although we cannot determine whether this introduces a bias, the sample of 48 sites encompasses a wide range of buildings and artworks, which we consider sufficient to represent the diversity of cultural heritage (CH) in terms of flood vulnerability the study area. Although the inspected sample covers only approximately one third of the exposed CH in the study area, the unsurveyed CH exhibits a similar distribution in terms of footprint area and building typology. This constitutes a general limitation of city-scale assessments, where time constraints and limited access to site managers inherently restrict the achievable sample size for on-site data collection. Future research may build upon this initial assessment by extending the inspected sample using the same methodology.
A particularly critical factor is the elevation of structural openings, which can significantly reduce flood exposure and associated vulnerability (Salazar et al., 2024). However, for large monumental buildings with extensive footprints, inspecting the entire perimeter to determine the elevation of openings can be challenging. Moreover, on-site inspections are time-consuming and difficult to implement systematically across an entire historic city. As demonstrated by Figueiredo et al. (2021) in the case of two Portuguese churches, such detailed inspections are more feasible for a limited number of CH buildings.
Estimating monetary losses for cultural heritage remains one of the most complex aspects of flood risk assessment, primarily due to the diverse and layered nature of losses – both tangible and intangible. To the best of our knowledge, this study presents the first attempt to estimate artwork restoration costs by combining a synthetic approach with archival research. In particular, billing notes from conservators following the 1966 flood were analyzed to reconstruct typical restoration procedures and to align them with current price lists. However, validation data for artworks remains limited, as is generally the case for flood damage across many asset types, including residential buildings. In the absence of comprehensive damage records, estimating restoration costs based on restoration steps, required operations, and unit prices provides the most reliable approach. However, also archival research of the billing notes is challenging and makes the reconstruction of necessary restoration steps difficult. In absence of billing notes from past events, expert-based judgement (e.g., by conservators) could support the estimation of restoration costs. Damage records and restoration costs after flood events should be more systematically collected and shared to allow for model validation and further research advancements.
In fact, sufficient archival data was not available for less common artworks, such as textiles, furniture, or decorative arts, that are potentially highly vulnerable to floods. Moreover, the restoration cost estimates do not account for two critical components: (i) the conservation of artworks during the waiting period before restoration (e.g., storage in refrigerated environments with significant energy costs), and (ii) the safe transportation of large pieces – such as panel paintings – to restoration laboratories, which can be particularly costly and finally (iii) any administrative costs.
The vulnerability functions developed for both buildings and artworks across the 48 inspected CH buildings enabled the derivation of mean and percentile vulnerability curves. These may have broader applicability in other art cities or similar contexts. Despite the variability in building characteristics, the spread between the 25th and 75th percentile curves is relatively contained for the buildings. In contrast, a significantly wider spread is observed for artworks housed in churches and museums. This is understandable given the diversity in both the quantity and typology of artworks. In the case of churches, differences arise from the nature of the contents: some may contain only a simple crucifix mounted at a high elevation, while others are richly decorated with wall-mounted panel paintings. In such cases, the 25th and 75th percentile curves would reflect more and less impact scenarios, respectively.
With respect to the vulnerability functions developed by Figueiredo et al. (2021) for two churches in Portugal, this study adopts a similar synthetic-based approach for vulnerability analysis. However, whereas Figueiredo et al. (2021) assesses relative damage based on the relative value of components within the asset, this work derives relative damage from archival analysis of restoration operations, thereby accounting for quantitative values. Furthermore, thanks to extensive fieldwork – covering 48 heritage assets instead of only two – it was possible to derive mean and percentile vulnerability curves, which may have broader applications in other contexts.
Although a direct comparison between the vulnerability functions developed by Figueiredo et al. (2021) and those presented here is not entirely feasible, several commonalities can be observed: (i) churches with elevated entrances tend to suffer no damage at low water depths; (ii) a stepwise damage pattern emerges due to the sequential exposure of artworks on the walls; (iii) approximately 60 % damage to immovable components is reached at a flood depth of around 2 m in the case of Igreja da Misericórdia (Figueiredo et al., 2021), which is comparable to the results of this study – 2 m in the average function for building type A, and 2.5 m in the average function for artworks in places of worship – thus confirming similar relative loss levels.
Regarding the vulnerability functions developed by Salazar et al. (2023), who adjust a baseline function using a vulnerability index, a comparable zero-damage threshold is observed for non-negligible flood depths (approximately 1 m in Salazar et al., and about 0.45 m in this study's average building curve). Although the relative vulnerability values reported by Salazar et al. are lower than those obtained in this work, it should be noted that their study does not include a quantitative analysis of restoration costs, making a direct comparison of relative losses challenging.
Monetary damage estimations remain uncertain, particularly due to the scarcity of historical restoration data for less common artworks. Additionally, many CH buildings host temporary exhibitions, which can vary in both exposure and vulnerability over time. This variability has been addressed through the use of a Cost Reliability Index. An effort to validate total damage estimates was made for places of worship using post-event data from the Marche Region (De Lucia et al., 2024). Official assessments reported losses of EUR 1.5 million for a church in Cantiano (approx. 2 m flood depth) and EUR 2 million for one in Pergola (approx. 3 m flood depth). In our study area, the average total damage for 19 CH buildings classified as places of worship is EUR 1.5 million, ranging from EUR 0.5 million for flood depths below 1 m to EUR 1.5 million for depths around 3 m. Peaks above EUR 3 million were recorded for the cathedral and two other major churches, which are not directly comparable to those in the Marche Region. These findings support the accuracy of the vulnerability model in capturing the correct order of magnitude for monetary losses, thereby enabling its integration into broader impact assessments typically used in cost-benefit analyses and decision-making.
Compared to qualitative CH risk assessments conducted at national or regional levels (Figueiredo et al., 2020; Garrote and Escudero, 2020; Arrighi et al., 2023), the approach presented here is better suited for historically significant urban centers. It also supports the identification of targeted mitigation strategies and the potential development of insurance premiums for individual CH assets or municipalities.
The estimated losses for all CH buildings, including those extrapolated using unitary volume damage (EUR 527 million) – are relatively small compared to the projected indirect economic losses from reduced tourism during the same flood scenario (EUR 1.8 billion; Arrighi et al., 2022) or to the total direct losses for standard buildings in the inundated area (EUR 6.1 billion; Arrighi et al., 2018b). Nevertheless, the combined impact of indirect losses and the direct losses to CH buildings (as estimated in this study) represents approximately 40 % of the total damage to standard buildings, making CH-related losses a non-negligible component of flood risk in art cities – one that is often overlooked in conventional risk assessments.
The main limitations of this work lie in the scarcity of validation data for CH assets such as museums and libraries, and in the acknowledgment that the current cost estimates do not cover expenses for safe, long-term storage or transportation of artworks – costs that may persist for months or even years.
In this study, an unprecedented data collection effort was undertaken to document the characteristics of cultural heritage (CH) buildings, the presence and typology of artworks, and the associated restoration costs. This work addresses critical research gaps in the estimation of direct, tangible flood damage to CH. In addition to extensive on-site surveys and archival research, a synthetic approach was employed to derive relative vulnerability functions and estimate monetary losses.
The main contributions of this study are as follows:
-
Quantification of restoration operations and associated costs for common artwork categories, including paintings on canvas and wooden panels, wooden sculptures, frescoes, stone sculptures, and paper-based materials (e.g., books and manuscripts);
-
Development of asset-specific relative vulnerability functions for CH buildings assets (only losses to interior finishes), with mean and percentile (25th–75th) vulnerability curves derived from data on 48 inspected buildings representative of the heritage of the study area;
-
Development of asset-specific relative vulnerability functions for artworks in CH buildings, with mean and percentile curves defined for libraries/archives, museums, and places of worship;
-
Monetary assessment of direct flood-related losses to CH in the city of Florence, expressed in terms of restoration costs, for a 500-year recurrence interval flood scenario. This excludes irreparable losses, artworks with unknown restoration costs, as well as transportation, storage, and conservation costs.Statistical derivation of median and percentile values of unit damage per flooded volume of CH (median = EUR 875 m−3; 25th percentile = EUR 550 m−3; 75th percentile = EUR 1520 m−3) combining CH buildings and artworks. These values can be used as order-of-magnitude estimates in areas where detailed CH surveys are not available.
Although the monetary estimates are partially validated using ex-post damage data, significant uncertainties remain – particularly concerning the damage estimation for less common artwork types. Future research should focus on improving data availability and methodological robustness in this area.
Data related to information collected at the CH sites may contain sensitive details; therefore, only aggregated data are provided in the Supplement.
The supplement related to this article is available online at https://doi.org/10.5194/nhess-26-2653-2026-supplement.
CDL and CA equally contributed to the work. CA and CDL contributed to conceptualization, data curation, formal analysis, methodology, investigation, writing (draft, review and editing). CA contributed to funding acquisition and supervision.
The contact author has declared that neither of the authors has any competing interests.
Publisher's note: Copernicus Publications remains neutral with regard to jurisdictional claims made in the text, published maps, institutional affiliations, or any other geographical representation in this paper. The authors bear the ultimate responsibility for providing appropriate place names. Views expressed in the text are those of the authors and do not necessarily reflect the views of the publisher.
The authors would like to thank the reviewers for their valuable comments and suggestions, which helped improve the quality of this manuscript. A sincere acknowledgment goes to Dr. Carlo Francini (UNESCO Office in Florence) for his support during data collection.
This study was carried out within the RETURN Extended Partnership and received funding from the European Union Next-GenerationEU (National Recovery and Resilience Plan – NRRP, Mission 4, Component 2, Investment 1.3 – D.D. 1243 2/8/2022, PE0000005).
This paper was edited by Mihai Niculita and reviewed by Xavier Romão and two anonymous referees.
Amadio, M., Scorzini, A. R., Carisi, F., Essenfelder, A. H., Domeneghetti, A., Mysiak, J., and Castellarin, A.: Testing empirical and synthetic flood damage models: the case of Italy, Nat. Hazards Earth Syst. Sci., 19, 661–678, https://doi.org/10.5194/nhess-19-661-2019, 2019.
Arrighi, C.: A global scale analysis of river flood risk of UNESCO world heritage sites, Frontiers in Water, 3, 764459, https://doi.org/10.3389/frwa.2021.764459, 2021.
Arrighi, C., Brugioni, M., Castelli, F., Franceschini, S., and Mazzanti, B.: Flood risk assessment in art cities: The exemplary case of Florence (Italy), J. Flood Risk Manag., 11, S616–S631, https://doi.org/10.1111/jfr3.12226, 2018a.
Arrighi, C., Rossi, L., Trasforini, E., Rudari, R., Ferraris, L., Brugioni, M., Franceschini, S., and Castelli, F.: Quantification of flood risk mitigation benefits: A building-scale damage assessment through the RASOR platform, J. Environ. Manage., 207, 92–104, https://doi.org/10.1016/j.jenvman.2017.11.017, 2018b.
Arrighi, C., Carraresi, A., and Castelli, F.: Resilience of art cities to flood risk: A quantitative model based on depth-idleness correlation, J. Flood Risk Manag., 15, e12794, https://doi.org/10.1111/jfr3.12794, 2022.
Arrighi, C., Ballio, F., and Simonelli, T.: A GIS-based flood damage index for cultural heritage, Int. J. Disaster Risk Reduction, 90, 103654, https://doi.org/10.1016/j.ijdrr.2023.103654, 2023.
Benassi, S. and Ciatti, M.: Notizia del restauro dell'Ultima Cena di Giorgio Vasari, OPD Restauro, 28, 372–372, 2016.
Bertolin, C. and Sesana, E.: Natural hazards affecting cultural heritage: assessment of flood and landslide risk for the 28 existing Norwegian stave churches, International Journal of Building Pathology and Adaptation, (ahead-of-print), https://doi.org/10.1108/IJBPA-03-2022-0042, 2023.
Birkmann, J.: Indicators and criteria for measuring vulnerability: theoretical bases and requirements, in: Measuring vulnerability to natural disasters, edited by: Birkmann, J., United Nations University Press, 55–77 pp., https://collections.unu.edu/view/UNU:2795#viewMetadata (last access: 1 June 2026), 2006.
Carisi, F., Schröter, K., Domeneghetti, A., Kreibich, H., and Castellarin, A.: Development and assessment of uni- and multivariable flood loss models for Emilia-Romagna (Italy), Nat. Hazards Earth Syst. Sci., 18, 2057–2079, https://doi.org/10.5194/nhess-18-2057-2018, 2018.
Committee to Rescue Italian Art: https://cria.itatti.harvard.edu/, last access: 29 August 2025.
CRED: 2023 Disasters in number, CRED, Brussels, https://files.emdat.be/reports/2023_EMDAT_report.pdf (last access: 1 June 2026), 2024.
Custer, R. and Nishijima, K.: Flood vulnerability assessment of residential buildings by explicit damage process modelling, Nat. Hazards, 78, 461–496, https://doi.org/10.1007/s11069-015-1725-7, 2015.
D'Alconzo, P., Schiaffini, I., and Levi, D.: Fototeche e archivi fotografici nelle università italiane, Forum Editrice Universitaria Udinese, ISBN 9788832833805, 2022.
Dardes, K. and Rothe, A. (Eds.): The Structural Conservation of Panel Paintings: Proceedings of a Symposium at the J. Paul Getty Museum, 24–28, April 1995, Getty Publications, 1998.
De Lucia, C., Amaddii, M., and Arrighi, C.: Tangible and intangible ex post assessment of flood-induced damage to cultural heritage, Nat. Hazards Earth Syst. Sci., 24, 4317–4339, https://doi.org/10.5194/nhess-24-4317-2024, 2024.
Deschaux, J.: Flood-related impacts on cultural heritage, in: Floods, Elsevier, 53–72, https://doi.org/10.1016/B978-1-78548-268-7.50004-3, 2017.
Díez-Herrero, A. and Garrote, J.: Flood risk analysis and assessment, applications and uncertainties: A bibliometric review, Water, 12, 2050, https://doi.org/10.3390/w12072050, 2020.
Dottori, F., Figueiredo, R., Martina, M. L. V., Molinari, D., and Scorzini, A. R.: INSYDE: a synthetic, probabilistic flood damage model based on explicit cost analysis, Nat. Hazards Earth Syst. Sci., 16, 2577–2591, https://doi.org/10.5194/nhess-16-2577-2016, 2016.
Figueiredo, R., Romao, X., and Paupério, E.: Flood risk assessment of cultural heritage at large spatial scales: Framework and application to mainland Portugal, J. Cult. Herit., 43, 163–174, https://doi.org/10.1016/j.culher.2019.11.007, 2020.
Figueiredo, R., Romao, X., and Paupério, E.: Component-based flood vulnerability modelling for cultural heritage buildings, Int. J. Disast. Risk Re., 61, 102323, https://doi.org/10.1016/j.ijdrr.2021.102323, 2021.
Galloway, G. E., Seminara, G., Blöschl, G., García, M. H., Montanari, A., and Solari, L.: Reducing the flood risk of art cities: the case of Florence, J. Hydraul. Eng., 146, 02520001, https://doi.org/10.1061/(ASCE)HY.1943-7900.0001741, 2020.
Garrote, J. and Escudero, C.: A framework proposal for regional-scale flood-risk assessment of cultural heritage sites and application to the castile and Leon region, Water, 12, 329, https://doi.org/10.3390/w12020329, 2020.
Gerl, T., Kreibich, H., Franco, G., Marechal, D., and Schröter, K.: A review of flood loss models as basis for harmonization and benchmarking, PloS one, 11, e0159791, https://doi.org/10.1371/journal.pone.0159791, 2016.
Historic England: Conservation Principles, Policies and Guidance, https://historicengland.org.uk/imagesbooks/publications/conservation-principles-sustainablemanagement-historic (last access: 19 August 2024), 2008.
ISTAT: La lettura in Italia – Anno 2015, https://www.istat.it/it/files/2016/01/Lettura-libri_2015.pdf (last access: 29 August 2025), 2016.
Kappes, M. S., Papathoma-Koehle, M., and Keiler, M.: Assessing physical vulnerability for multi-hazards using an indicator-based methodology, Appl. Geogr., 32, 577–590, https://doi.org/10.1016/j.apgeog.2011.07.002, 2012.
Menoni, S., Molinari, D., Ballio, F., Minucci, G., Mejri, O., Atun, F., Berni, N., and Pandolfo, C.: Flood damage: a model for consistent, complete and multipurpose scenarios, Nat. Hazards Earth Syst. Sci., 16, 2783–2797, https://doi.org/10.5194/nhess-16-2783-2016, 2016.
Merz, B., Kreibich, H., Schwarze, R., and Thieken, A.: Review article “Assessment of economic flood damage”, Nat. Hazards Earth Syst. Sci., 10, 1697–1724, https://doi.org/10.5194/nhess-10-1697-2010, 2010.
Molinari, D., Menoni, S., Aronica, G. T., Ballio, F., Berni, N., Pandolfo, C., Stelluti, M., and Minucci, G.: Ex post damage assessment: an Italian experience, Nat. Hazards Earth Syst. Sci., 14, 901–916, https://doi.org/10.5194/nhess-14-901-2014, 2014.
Morante-Carballo, F., Montalván-Burbano, N., Arias-Hidalgo, M., Domínguez-Granda, L., Apolo-Masache, B., and Carrión-Mero, P.: Flood Models: An Exploratory Analysis and Research Trends, Water, 14, 2488, https://doi.org/10.3390/w14162488, 2022.
Ranalli, G. and Zanardini, E.: Advanced Biocleaning System for Historical Wall Paintings, in: Microorganisms in the Deterioration and Preservation of Cultural Heritage, edited by: E. Joseph, Springer, Cham, https://doi.org/10.1007/978-3-030-69411-1_10, 2021.
Ravan, M., Revez, M. J., Pinto, I. V., Brum, P., and Birkmann, J.: A Vulnerability Assessment Framework for Cultural Heritage Sites: The Case of the Roman Ruins of Tróia, Int. J. Disaster Risk Science, 14, 26–40, https://doi.org/10.1007/s13753-023-00463-4, 2023.
Romao, X. and Paupério, E.: An indicator for post-disaster economic loss valuation of impacts on cultural heritage, Int. J. Archit. Herit., 15, 678–697, https://doi.org/10.1080/15583058.2019.1643948, 2021.
Romão, X., Paupério, E., Monserrat, O., Rousakis, T., and Montero, P.: Assets at risk and potential impacts: 3.6 – cultural heritage, in: Science for Disaster Risk Management: Acting Today, Protecting Tomorrow, edited by: A. Casajus Valles, M. Marin Ferrer, K. Poljanšek and I. Clark, Publications Office of the European Union, Luxembourg, 503–525, https://doi.org/10.2760/571085, 2020.
Salazar, L. G. F., Romão, X., and Figueiredo, R.: A Hybrid Approach for the Assessment of Flood Vulnerability of Historic Constructions and Their Contents, in: International Conference on Structural Analysis of Historical Constructions, Cham, Springer Nature Switzerland, 1117–1133, https://doi.org/10.1007/978-3-031-39450-8_91, 2023.
Salazar, L. G. F., Figueiredo, R., and Romão, X.: Flood vulnerability assessment of built cultural heritage: Literature review and identification of indicators, Int. J. Disaster Risk Re., 104666, https://doi.org/10.1016/j.ijdrr.2024.104666, 2024.
Sevieri, G., Galasso, C., D'Ayala, D., De Jesus, R., Oreta, A., Grio, M. E. D. A., and Ibabao, R.: A multi-hazard risk prioritisation framework for cultural heritage assets, Nat. Hazards Earth Syst. Sci., 20, 1391–1414, https://doi.org/10.5194/nhess-20-1391-2020, 2020.
Shah, N., Seymour, K., Poulis, J. A., and Mosleh, Y.: A Comparative Study of Bond Strength, Reversibility, and Projected Long-Term Durability of Lining Techniques for the Structural Stabilisation of Canvas Paintings, Stud. Conserv., 1–18, https://doi.org/10.1080/00393630.2024.2391685, 2024.
Trizio, F., Torrijo, F. J., Mileto, C., and Vegas, F.: Flood risk in a Heritage City: Alzira as a case study, Water, 13, 1138, https://doi.org/10.3390/w13091138, 2021.
UNESCO, ICCROM, ICOMOS, and IUCN: Managing disaster risks for world heritage, Paris, France, https://whc.unesco.org/en/managing-disaster-risks/ (last access: 1 June 2026), 2010.
Van den Burg, J. and Seymour, K.: Series Paintings Conservation: six brochures on conservation of works of painted art, Cultural Heritage Agency of the Netherlands, https://english.cultureelerfgoed.nl/publications/publications/2023/01/01/consolidation-of-paint-and-ground (last access: 29 August 2025), 2023.
Vecvagars, K.: Valuing damage and losses in cultural assets after a disaster: concept paper and research options (No. 4979), Naciones Unidas Comisión Económica para América Latina y el Caribe (CEPAL), https://www.cepal.org/en/publications/4979-valuing-damage-and-losses-cultural-assets-after-disaster-concept-paper-and (last access: 1 June 2026), 2006.
Vojinovic, Z., Hammond, M., Golub, D., Hirunsalee, S., Weesakul, S., Meesuk, V., Medina, N., Sanchez, A., Kumara, S., and Abbott, M.: Holistic approach to flood risk assessment in areas with cultural heritage: a practical application in Ayutthaya, Thailand, Nat. Hazards, 81, 589–616, https://doi.org/10.1007/s11069-015-2098-7, 2016.