the Creative Commons Attribution 4.0 License.
the Creative Commons Attribution 4.0 License.
 | 05 Jun 2026
Quantifying the current and future likelihood of the 2022 extreme wildfire weather conditions in France with anthropogenic climate change
Shengling Zhu
Renaud Barbero
François Pimont
Benjamin Renard
In 2022, southwestern France experienced an exceptional wildfire season, recording a burned area 14 times higher than the 2006–2023 average. Here, we assess the rarity (return period) of the fire weather conditions observed in 2022 and how anthropogenic climate change (ACC) has already altered and will continue to alter the probability of fire weather conditions associated with the three largest wildfires (Landiras-1: 12 552 ha; Landiras-2: 7124 ha; La Teste-de-Buch: 5709 ha). Drawing from the daily Fire Weather Index (FWI) computed from two reanalysis datasets (1959–2023) and a nationwide wildfire record dataset (2006–2023), we first sought to quantify the rarity of those conditions across a range of spatial (local vs. regional) and temporal (fire duration vs. 30 d window) scales. Our results demonstrate that the rarity of FWI conditions is generally the highest at local and fire duration scales with the associated return periods increasing from 6 to 34 years, from 22 to 38 years, and from 6 to 101 years when moving from the coarsest to the finest spatiotemporal scale for the Landiras-1, Landiras-2, and La Teste-de-Buch wildfires, respectively. Using climate simulations from the Coupled Model Intercomparison Project Phase 6 (CMIP6), we examined how ACC has modified and will modify the probability of such fire weather conditions over the period 1950–2100. The multi-model median suggests that, in 2022, FWI conditions of the same exceedance probability as the 2022 wildfire-related conditions were approximately 2–10 times more likely under anthropogenic and natural forcings combined than under the natural-forcing-only climate, depending on the spatiotemporal scale, with considerable inter-model spread. By the end of the century under the Shared Socioeconomic Pathway 2-4.5 (SSP2-4.5), these FWI conditions are projected to become roughly 1 to 2 orders of magnitude more probable, with still large inter-model uncertainty. Our study underlines the growing influence of ACC on the risk of extreme wildfires in France across a range of scales.
- Article
(7133 KB) - Full-text XML
-
Supplement
(9100 KB) - BibTeX
- EndNote


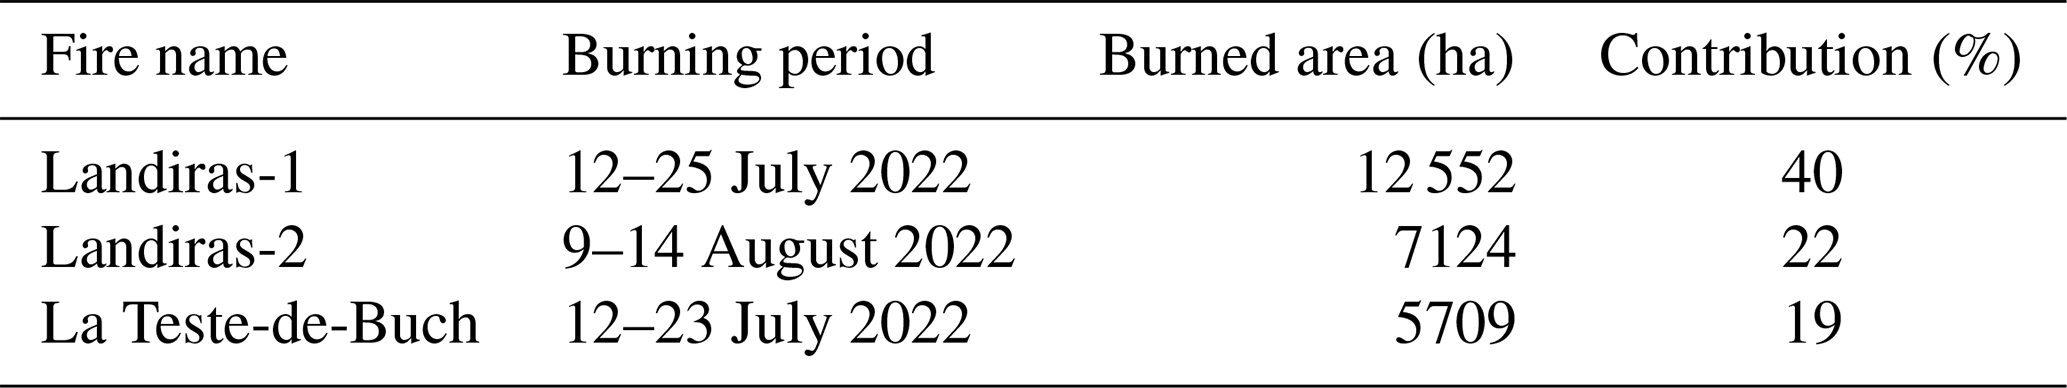
The past decade has witnessed a number of unprecedented extreme wildfires across parts of the world (e.g. Australia in 2019–2020, Canada in 2023, or California in 2020 and 2025), causing widespread impacts on societies, ecological environments, and human life. In 2022, southwestern Europe also faced an extreme fire season due to a persistent anticyclonic anomaly (Faranda et al., 2023) causing widespread soil moisture deficit (Bevacqua et al., 2024), and record burned area in some regions (Rodrigues et al., 2023) including parts of France. At the national level, more than 55 000 ha of forests and other natural vegetation were burned (IGN and MASA, 2025) – an area 6–7 times larger than the average over the preceding decade. In southwestern (SW) France specifically, the burned area was even more than 14 times larger than the regional average (Fig. 1b). This extensive burned area resulted in substantial biomass losses in Atlantic pine forests (Vallet et al., 2023) and was largely driven by a small number of large wildfires. In particular, three events alone accounted for more than 45 % of the total annual burned area in France in 2022 and over 80 % of that in SW France. On 12 July 2022, two wildfires started simultaneously within the Gironde department: La Teste-de-Buch wildfire burned approximately 5709 ha over 12 d, while the second one in Landiras burned 12 552 ha over 14 d, due to frequent wind shifts causing spread in multiple directions (Office National des Forêts, personal communication, October 2025). After this wildfire (hereafter Landiras-1) was brought under control, it reignited 15 d later, on 9 August 2022 (hereafter Landiras-2), and spread over six days, driven by northerly winds. When combined, the Landiras-1+2 wildfire burned over 19 676 ha, which makes it the largest wildfire in France since the Landes forest fire of August 1949 (Sarrau and Yagoub, 2025).
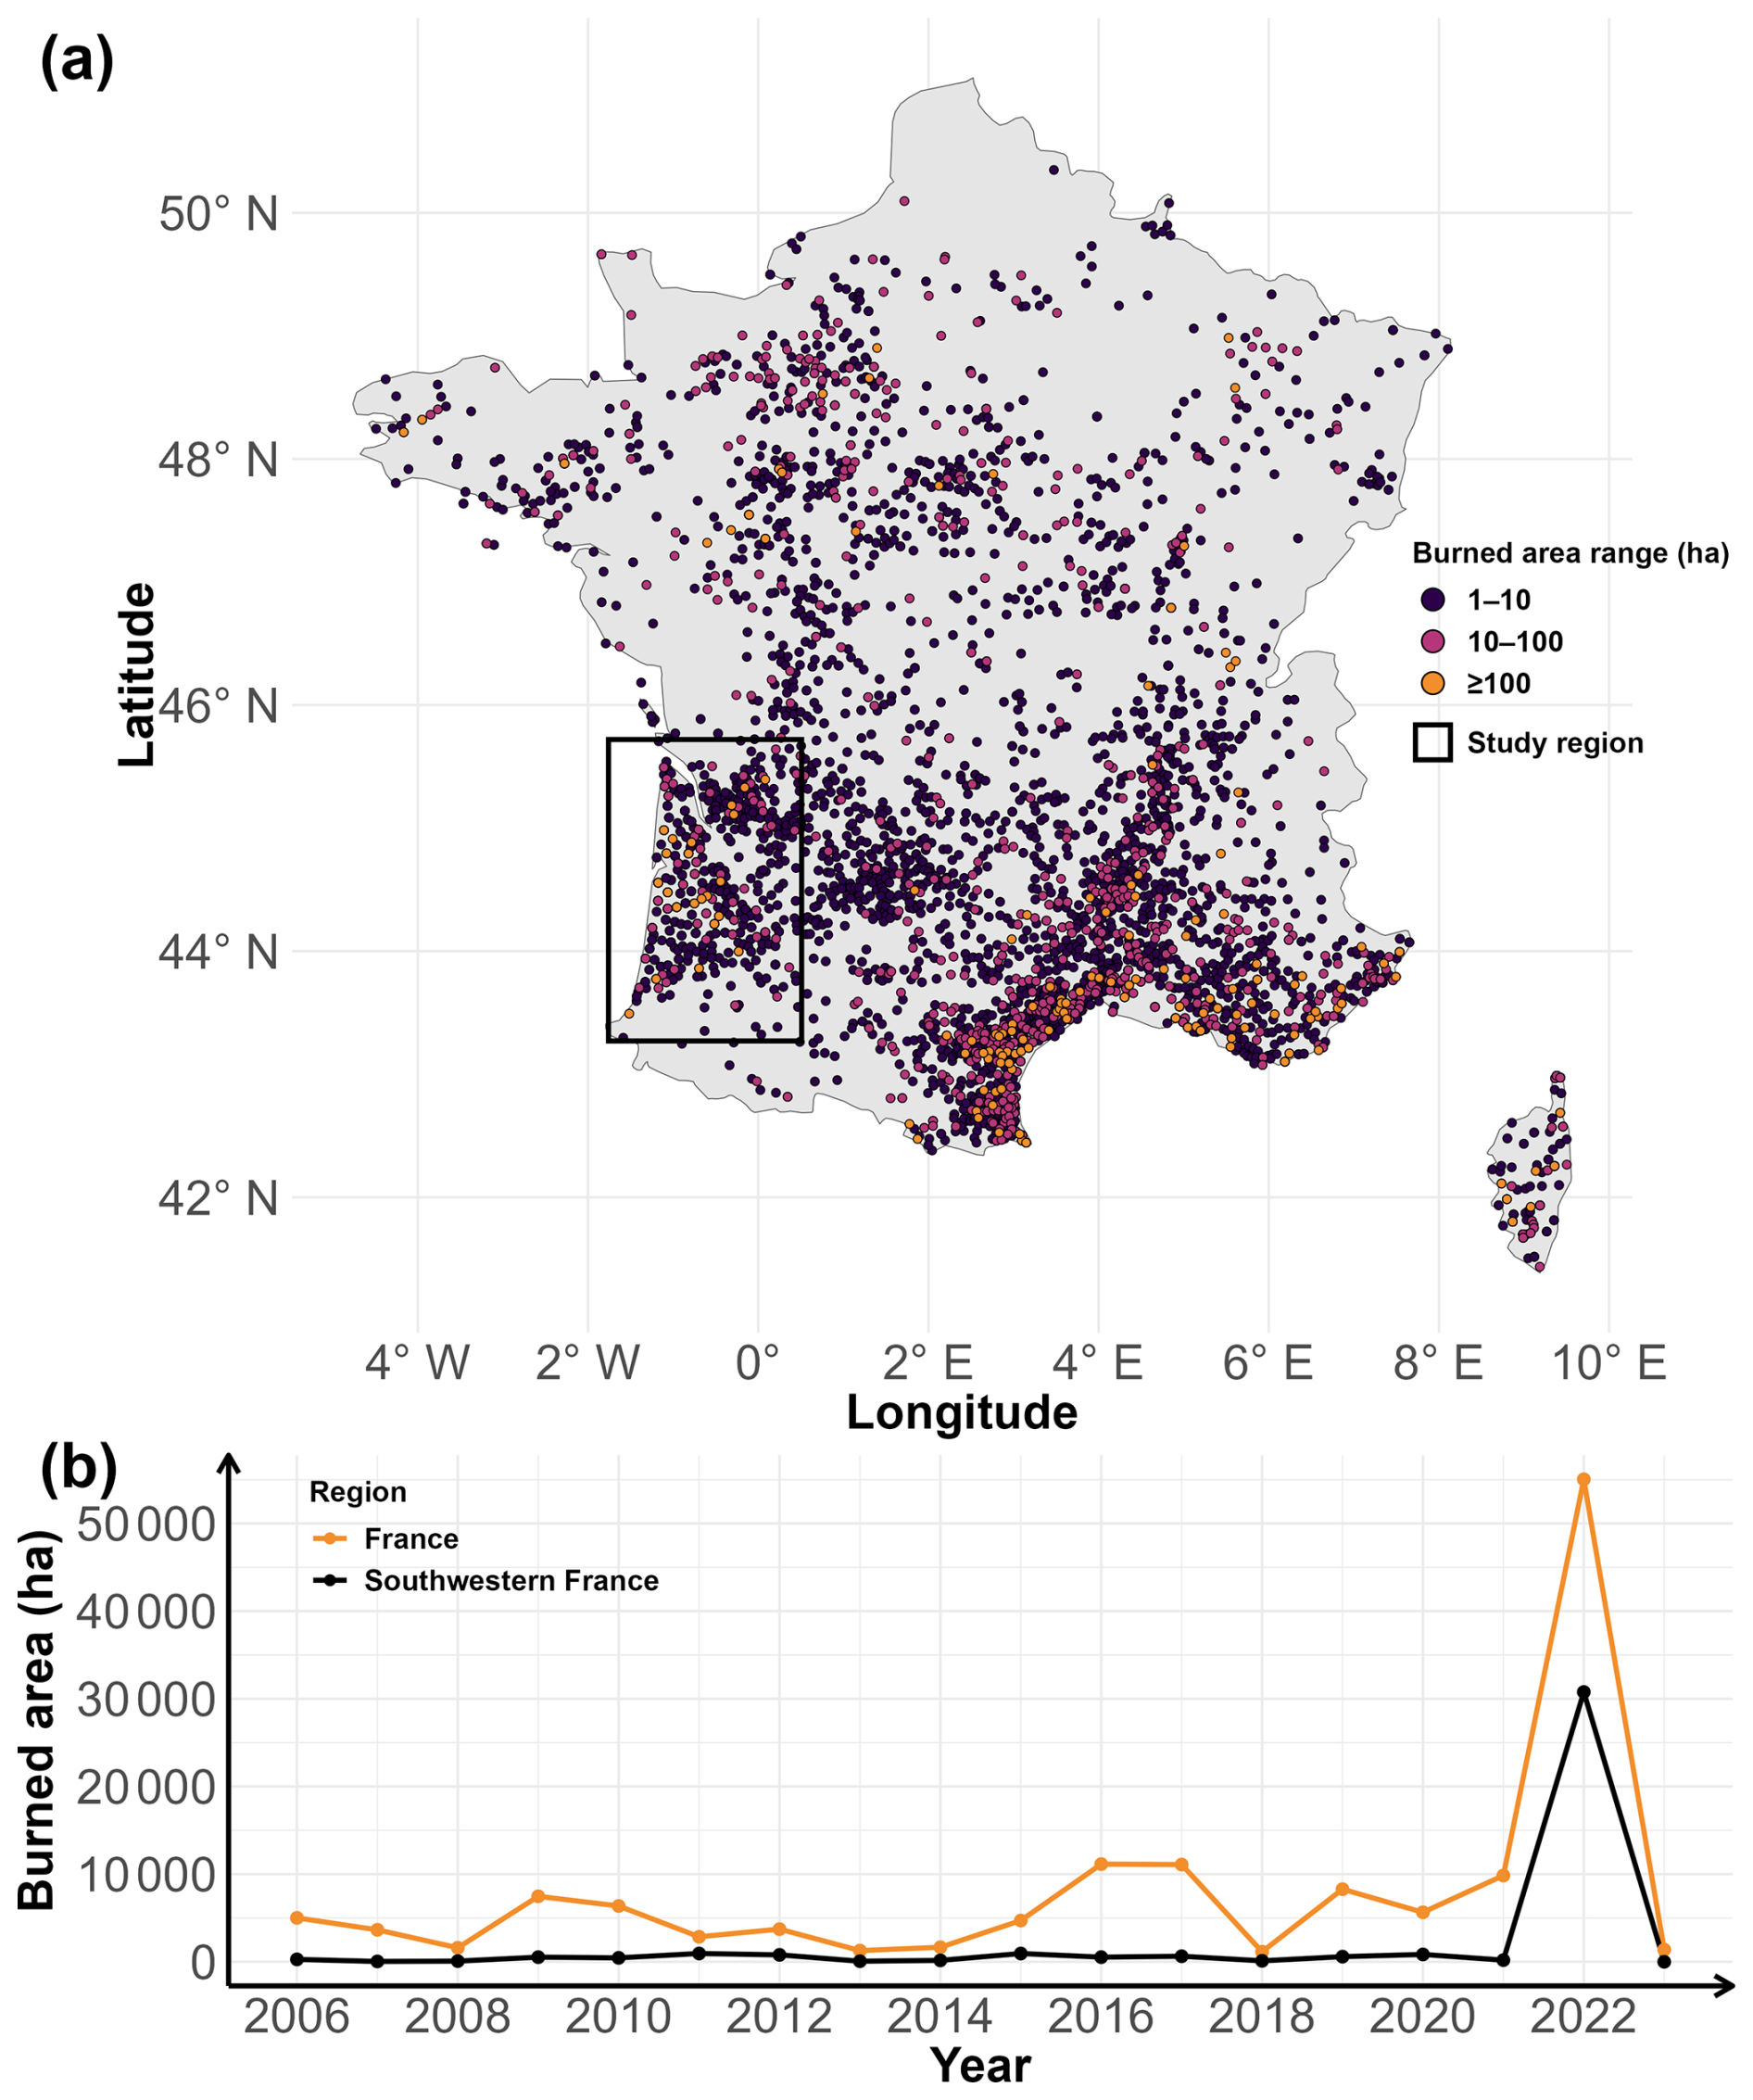
Figure 1(a) Wildfires ≥1 ha recorded in the BDIFF database from 2006 to 2023. Color denotes burned area (BA) classes and the black box delineates the southwestern France region ( km2). (b) Total burned area during the warm season (May–September) for France (orange line) and the southwestern region (black line).
Those wildfires in SW France provided a glimpse of future projections across the region, featuring a spatial expansion of the potential fire niche with climate change towards western and northern latitudes (Fargeon et al., 2020), a fire niche historically limited to the southeastern Mediterranean region. The 2022 fire season was indeed concomitant with a broader context of global and regional climate warming. Copernicus data indicated that July 2022 was among the three warmest Julys recorded globally, exceeding the 1991–2020 average by about 0.38 °C. In France, Météo-France recorded an average annual temperature of 14.5 °C, approximately 2.9 °C higher than the 1959–2000 baseline. This warmer atmosphere and elevated atmospheric aridity have contributed to a reduced fuel moisture content, thereby increasing landscape flammability.
Attribution analysis is essential to better understand how global warming is currently altering the likelihood of extreme events and associated impacts (Perkins-Kirkpatrick et al., 2024). Quantifying the likelihood of such impacts may enhance awareness and encourage adaptation efforts. Attribution studies employ both observational and simulated climate datasets to quantify the extent to which human emissions alter the probability of a given extreme weather event. So far, most of those studies have typically focused on meteorological events such as heatwaves (Perkins-Kirkpatrick and Lewis, 2020; Vautard et al., 2020), droughts (Chiang et al., 2021; Hari et al., 2020), or extreme rainfall (Tradowsky et al., 2023; Wang et al., 2023). However, fire weather conditions (combining multiple meteorological variables) have received less attention, although a number of efforts have been made in the western US (Abatzoglou and Williams, 2016; Williams et al., 2019; Brown et al., 2023), Canada (Kirchmeier-Young et al., 2019a), Australia (van Oldenborgh et al., 2021), and France (Barbero et al., 2020; Lanet et al., 2024). Recently, Lanet et al. (2024) conducted an attribution study of the 2022 fire season in SW France using multiple standardized climate indices. Their findings suggest that climate change doubled the likelihood of the climate conditions observed during the month of July. However, the analysis was performed over relatively broad spatial (the entire SW region of France) and temporal (the whole month of July) scales, while attribution scores have been shown to be sensitive to the selection of spatial and temporal scales (Angélil et al., 2018; Kirchmeier-Young et al., 2019b; Leach et al., 2020). Finally, the attribution scores were limited to the year 2022, with no projections on how those conditions might change in the future. Such projections may help plan adaptation strategies.
Building on prior attribution studies, we use here a complementary multi-scale framework to (i) provide a broader context of the spatiotemporal variability of fire weather conditions across France over the whole observational period from 1959 to 2023, (ii) quantify fire weather anomalies conducive to the 2022 wildfires, (iii) estimate return periods (RPs) of fire weather conditions associated with the three largest wildfires, considering a combination of different and complementary spatial and temporal scales, and (iv) estimate the extent to which those fire weather conditions have become, in 2022, more or less likely under anthropogenic-plus-natural forcings than under the natural-forcing-only climate, and how this contrast is likely to further increase in the future.
2.1 Wildfire data
We used the BDIFF (Base de Données sur les Incendies de Forêts en France, IGN and MASA, 2025) dataset, a forest-fire record for France (2006–2023), providing date, location, and burned area (BA; ha). Despite some consistency issues in low fire activity regions (Pimont et al., 2023a), BDIFF has been shown to be reliable for estimating regional total BA, including SW France, and has been used in previous studies (Pimont et al., 2021, 2023b). We selected wildfires ≥1 ha occurring during the warm season (May to September, see Fig. 1a) following Pimont et al. (2021). We also classified wildfires into three size classes (small: 1–10 ha; medium: 10–100 ha; large: ≥100 ha) as shown in Fig. 1a. Note that large wildfires were mostly concentrated in southern France, in particular along the Mediterranean coast and SW France (Fig. 1a). In 2022, national BA reached approximately 55 000 ha, with the SW region accounting for over half of this total (Fig. 1b) due to three major wildfires. Table 1 provides the name, starting and ending dates as well as the extent of each of those wildfires.
Table 1The three largest wildfires in southwestern France in 2022. The last column indicates their respective contribution to total burned area in southwestern France in 2022.
2.2 Fire weather observations
Fire weather conditions were estimated with the Fire Weather Index (FWI), a composite index based on four daily meteorological observations – maximum air temperature, relative humidity, wind speed, and precipitation. Originally developed in Canada by Van Wagner (1987) for northern boreal forest conditions, the FWI has been used across various countries and climatic regions to track wildfire activity, including in Europe (Giannaros et al., 2021; Hetzer et al., 2024) and in France (Barbero et al., 2020; Pimont et al., 2023a, b). Daily meteorological variables used to calculate the FWI were obtained from SAFRAN (Système d'Analyse Fournissant des Renseignements Atmosphériques à la Neige), a French reanalysis product available at a daily resolution on an 8 km grid from 1959 to 2023 (Vidal et al., 2010). The analyses were repeated using ERA5 reanalysis at a slightly coarser resolution of 25 km. The results were similar for both datasets (see Figs. S1–S3 in the Supplement). The FWI was calculated using the cffdrs package in R (Wang et al., 2017).
2.3 Spatiotemporal variability of fire weather
In climate sciences, empirical orthogonal function (EOF) is often employed to examine large spatiotemporal datasets and identify the main modes of climate variability. In this study, an EOF was applied to a matrix with seasonal FWI values (averaged from May to September, corresponding to the traditional wildfire season) for each grid cell across France, structured as an nyear×ngrid matrix, where nyear is the number of years and ngrid the number of grid cells. After data normalization and eigenvalue decomposition, the matrix was decomposed into a few dominant spatial modes (EOFs), together with their corresponding time-varying coefficients, known as principal components (PCs). Each PC constitutes a time series that illustrates the interannual variability of its corresponding EOF (von Storch and Zwiers, 1999).
2.4 Fire weather conducive to wildfires in SW France
To quantify the relationship between local FWI conditions and wildfire events, we extracted for each wildfire the daily FWI time series from the nearest SAFRAN grid cell, over a window extending from 90 d before to 90 d after the wildfire start. Note that BDIFF does not provide the wildfire perimeter and that multiple grid cells may potentially intersect with the actual wildfire perimeter. However, this effect should be limited given the size of the SAFRAN grid cell (64 km2) and the inherent spatial autocorrelation of FWI. To quantify the departure from the FWI climatology (i.e. normal conditions), we removed the seasonality by computing deviations from the local mean seasonal cycle and expressed them as percentage anomalies. Finally, we stratified the sample by wildfire size and averaged FWI within predefined wildfire extent classes (small, medium, large) to relate the amplitude of FWI anomalies to wildfire size. In addition, analyses were performed on all years (2006–2023) and then on the year 2022 only.
2.5 Fire weather simulations
The Coupled Model Intercomparison Project Phase 6 (CMIP6) provides a comprehensive and standardized ensemble of multi-model climate simulations, enabling improved understanding of climate change driven by natural internal variability and external radiative forcings under various past, present, and future scenarios (Eyring et al., 2016). Here, we used simulations from the Detection and Attribution Model Intercomparison Project (DAMIP) and the Scenario Model Intercomparison Project (ScenarioMIP) (Gillett et al., 2016; O'Neill et al., 2016), a sub-project of CMIP6. DAMIP provides simulations for historical periods (up to 2014, with extensions to 2020 in some cases) under anthropogenic and natural forcing scenarios (Gillett et al., 2016). ScenarioMIP provides climate projections informed by future emissions and land-use scenarios, primarily driven by Shared Socioeconomic Pathways (SSPs) (O'Neill et al., 2016; Riahi et al., 2017). For historical simulations, we used the “historical” and the DAMIP “hist-nat” experiments. The “historical” experiment covers 1850–2014 and includes all observed external forcings – greenhouse gases, aerosols, solar variability, and volcanic eruptions. In contrast, the “hist-nat” experiment includes only natural external forcings (total solar irradiance and volcanic stratospheric aerosol injections) over 1850–2020. For future climate projections, we used the “ssp245” experiment, representing a medium mitigation scenario, and the “ssp245-nat” experiment. Similar to their historical counterparts, the “ssp245” experiment includes both anthropogenic and natural forcings, whereas the “ssp245-nat” experiment includes only natural forcings. Not all CMIP6 models provide all the meteorological outputs needed to compute the FWI (see Sect. 2.2). Hence, we used the following models: IPSL-CM6A-LR, CanESM5, MIROC6, and NorESM2-LM. Each CMIP6 model is analyzed at its native spatial resolution. For each model, we used a single member (r1i1p1f1) in both the ALL and NAT experiments. This choice was primarily motivated by data availability: for NorESM2-LM, only one realization was publicly available for the ssp245-nat experiment in the CMIP6 archive. For consistency, we used a single member for all four models.
2.6 Probability of exceedance of 2022 extreme wildfires across spatial and temporal scales
We quantified the expected return periods of fire weather conditions associated with the three largest fires in 2022 to assess the rarity of these conditions. This estimation requires three steps: (1) characterizing fire weather conditions associated with each wildfire across spatial and temporal scales; (2) fitting an appropriate statistical distribution; (3) calculating the exceedance probability (or return period) of the fire weather conditions defined in step 1 based on the distribution fitted in step 2.
The choice of temporal and spatial scales is the most critical step due to their impact on attribution scores (Leach et al., 2020; Kirchmeier-Young et al., 2019b). Moreover, refining or broadening scales may provide different and complementary insights for wildfire managers. In the temporal dimension, we may either opt for a 30 d window centered on the fire occurrence as in Lanet et al. (2024) or focus on fire duration from ignition to suppression, a period more representative of the burning conditions. In the spatial dimension, we may either select a single grid cell (8 km with SAFRAN or 25 km with ERA5) co-located with the wildfire location or consider a broader regional bounding box as done in Lanet et al. (2024) to improve the signal-to-noise ratio. Here, in order to analyze the sensitivity of the results to these assumptions, we used the four possible combinations of these different resolutions. For each wildfire, we derived the daily FWI time series corresponding to both spatial resolutions over the full period (1 January 1959–31 December 2023). We then applied a moving average (MA) to each time series, using both a 30 d window and a D-day window – where D equals the fire duration (Landiras-1: 14 d; Landiras-2: 6 d; La Teste-de-Buch: 12 d). The annual maxima of these MA time series were then extracted to fit the historical distribution using the generalized extreme value (GEV) theory. Finally, based on the fitted distributions, we calculated the exceedance probabilities and corresponding return periods of the observed FWI during the three largest wildfires in 2022 according to each spatiotemporal scale. Note that the annual maxima of the MA-FWI time series were used only as annual extreme inputs for fitting the GEV distribution, and do not represent the fire weather conditions of any individual wildfire. The FWI level observed during each wildfire is therefore distinct from the annual maxima used in the GEV fitting.
2.7 The contribution of anthropogenic climate change
To quantify the impact of anthropogenic climate change (ACC), we employed a commonly used approach to calculate the exceedance probability of each wildfire-related FWI (Barbero et al., 2020), following the procedure applied in the previous section to the 1959–2023 SAFRAN observations. Here, SAFRAN is used only to estimate the exceedance probability of the observed event (pOBS). We then compared the exceedance probabilities under two scenarios: (i) the ALL scenario, including all anthropogenic and natural forcings (hereafter pALL), and (ii) the NAT scenario, which includes only natural forcings (hereafter pNAT). For the GEV distribution fitted to the ALL-scenario simulated annual maxima of the MA-FWI time series, we inverted its cumulative distribution function (CDF), FALL(x), to find for each year, the FWI level in the ALL scenario such that . We then applied this year-specific FWIALL threshold to the GEV distribution fitted to the NAT-scenario simulated annual maxima of the MA-FWI time series – using its CDF FNAT(x) – to compute . Note that FWIALL is year-dependent and represents the FWI level in the ALL climate with the same exceedance probability as the observed 2022 wildfire-related FWI; the analysis is thus probability-based rather than based on a fixed absolute FWI threshold. Because the attribution metric relies on the within-model ratio between pALL and pNAT, no spatial downscaling was required.
As the FWI is assumed to be non-stationary with global warming, we used here a non-stationary GEV model where the location and scale parameters may vary with year according to a GAMLSS framework (Generalized Additive Models for Location, Scale and Shape), to capture smooth nonlinear relationships (Stasinopoulos and Rigby, 2007; Rigby et al., 2019). The covariate effects on the location and log-scale parameters are represented using penalized cubic regression splines in the evgam package, with at most five basis functions for each smooth term, and smoothing parameters selected by restricted maximum likelihood (REML; Youngman, 2022). As opposed to what has been done previously in Sect. 2.6 where we sought to estimate the probability of exceedance over the full observational period available without any assumptions, we did use here a non-stationary GEV to make the return periods explicitly time-dependent. Based on the GAMLSS fits, we estimated for each year the GEV distribution of annual maxima FWI under the ALL and NAT scenarios and computed the ratio , commonly referred to as the risk ratio (RR). This metric has been widely used in event-attribution studies to quantify how many times as likely an extreme event is to occur under the ALL scenario compared to the NAT scenario (Philip et al., 2020; Paciorek et al., 2018). Additionally, we employed the fraction of attributable risk (), which reflects, when positive, the proportion of risk attributable to ACC (Philip et al., 2020; Lloyd and Oreskes, 2018; Bellprat et al., 2019).
To quantify the sampling uncertainty surrounding RR and FAR, a parametric bootstrap approach was implemented as follows:
-
Generate new samples of ALL and NAT scenarios from the estimated non-stationary GEVs.
-
Re-estimate the non-stationary GEVs based on these new samples and compute the RR and the FAR.
-
Repeat steps 1–2 100 times to derive model-specific parametric confidence intervals.
Finally, attribution scores (RR and FAR) from individual models were aggregated across models using a multi-model median. In that case, we pooled together the 100 bootstrap replicates from each of the four models. This pooled ensemble range is intended to reflect both within-model sampling uncertainty and the spread across models. The full computation workflow – from the CMIP6 annual maxima MA-FWI to the RR/FAR calculation – is summarized in Fig. 2.
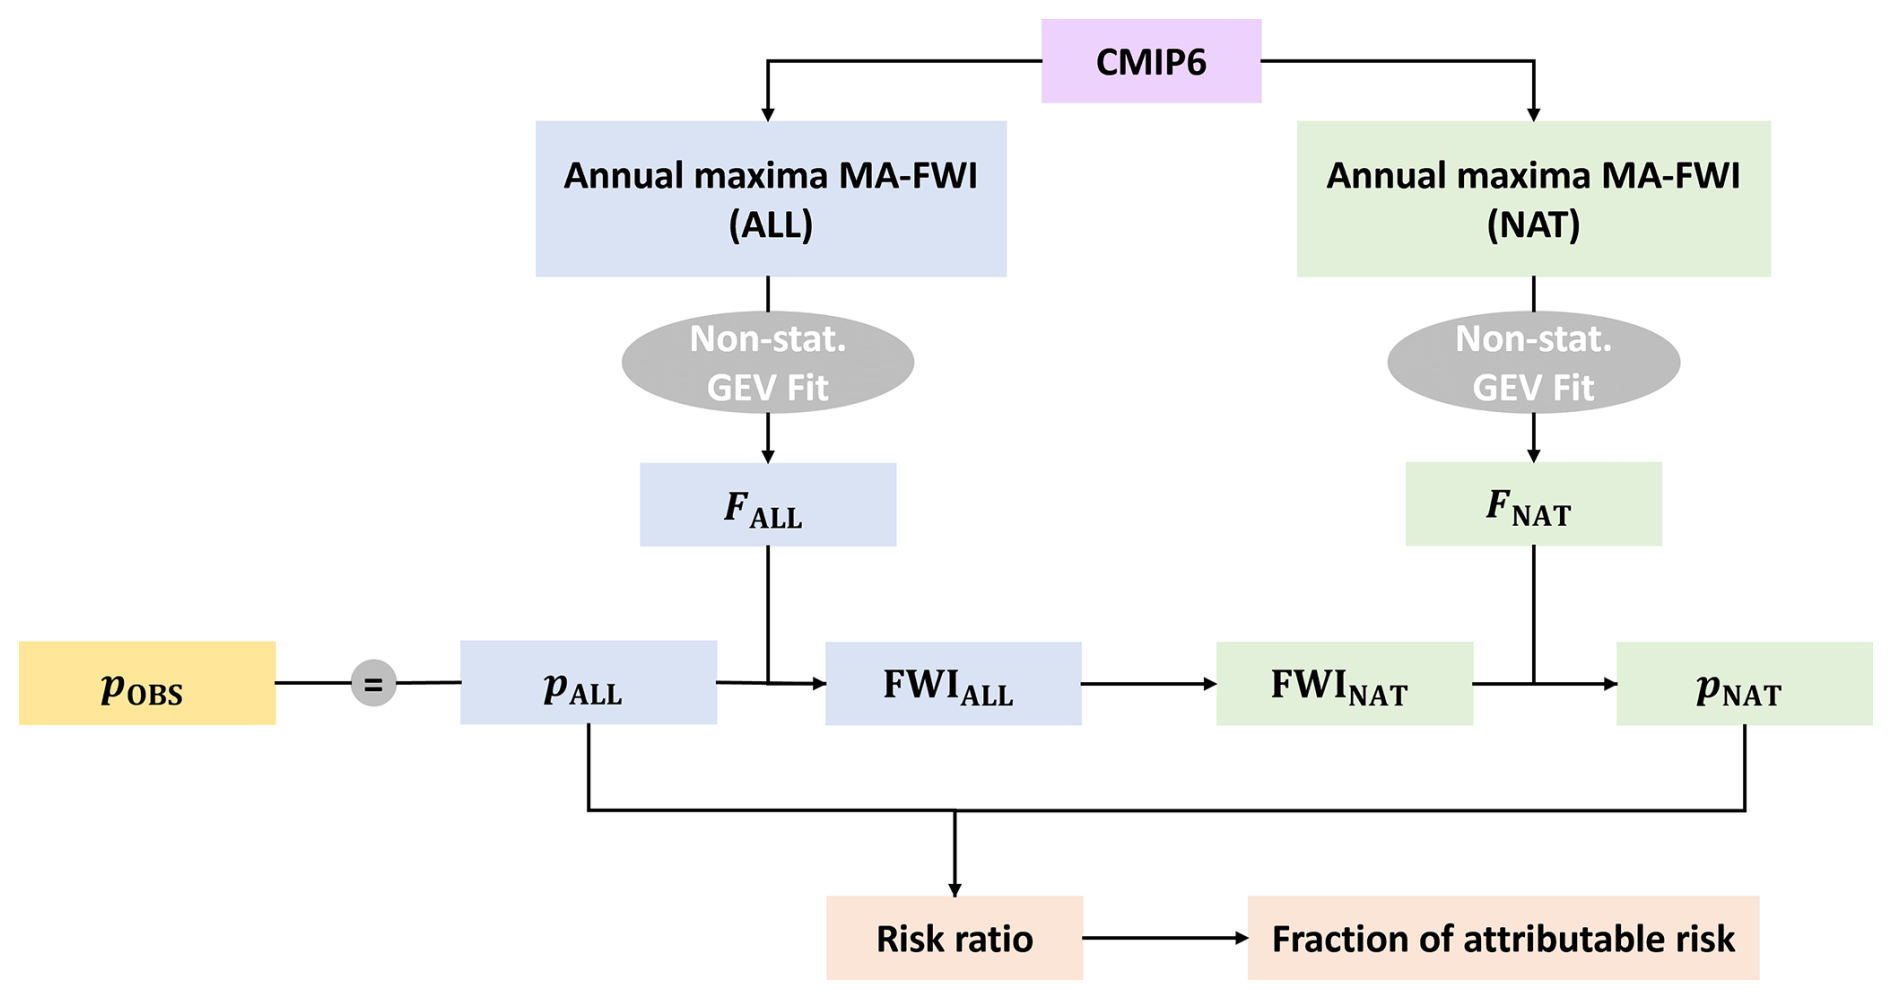
Figure 2Schematic workflow used to estimate exceedance probabilities (denoted by p) under ALL and NAT forcings from CMIP6 annual maxima moving-average FWI (MA-FWI): a non-stationary GEV fit provides the cumulative distribution functions (CDFs) FALL(x) and FNAT(x) (where F denotes the fitted GEV CDF); FWIALL is obtained by inverting FALL such that , and pNAT is then computed as 1−FNAT(FWIALL).
Figure 3 illustrates the first two dominant modes of May–September FWI variability over the 1959–2023 period, with the EOF loadings (left panels) and their corresponding PCs (right panels). The loadings characterize the spatial structure of a given mode, identifying regions where FWI anomalies vary either in phase (same sign) or in opposition. The PCs reflect the temporal evolution of each mode, highlighting years during which the associated spatial structure is either amplified or dampened. In other words, the initial FWI time series in a specific grid cell featuring a high positive loading will strongly look like the associated PC. A negative loading will in turn indicate that the FWI time series varies in opposition to the PC. Together, the first two modes explain about 75 % of the total variance (61.69 % and 12.75 % for EOF-1 and EOF-2, respectively). EOF-1 exhibits positive loadings throughout France, albeit with smaller coefficients along the Mediterranean (Fig. 3a). This mode presents a strong interannual variability with an upward underlying trend, featuring an increasing frequency of higher FWI years in recent decades with global warming (Fig. 3b). We found that PC-1 was strongly correlated with both temperature and rainfall anomalies over a large portion of western Europe (see Fig. S4). Note that the highest amplitude is seen in 2022, followed by 1976, a notoriously warm and dry year in France. By contrast, after removing the influence of PC-1, EOF-2 shows a slightly unbalanced north–south dipole, with a near-zero band straddling central France. In other words, when positive FWI anomalies occur preferentially in the south, negative anomalies are seen in the north and vice versa. This mode of variability correlates with a larger continental-scale dipole in rainfall anomalies, as well as with temperature anomalies south of 45° N (see Fig. S5). Like the first mode, the second mode presents a long-term trend (Fig. 3d), reflecting an increasing occurrence of years with higher FWI in southern France and lower FWI in northern France. Note that the following modes were not analyzed due to their little variance explained and their lack of consistency across space.
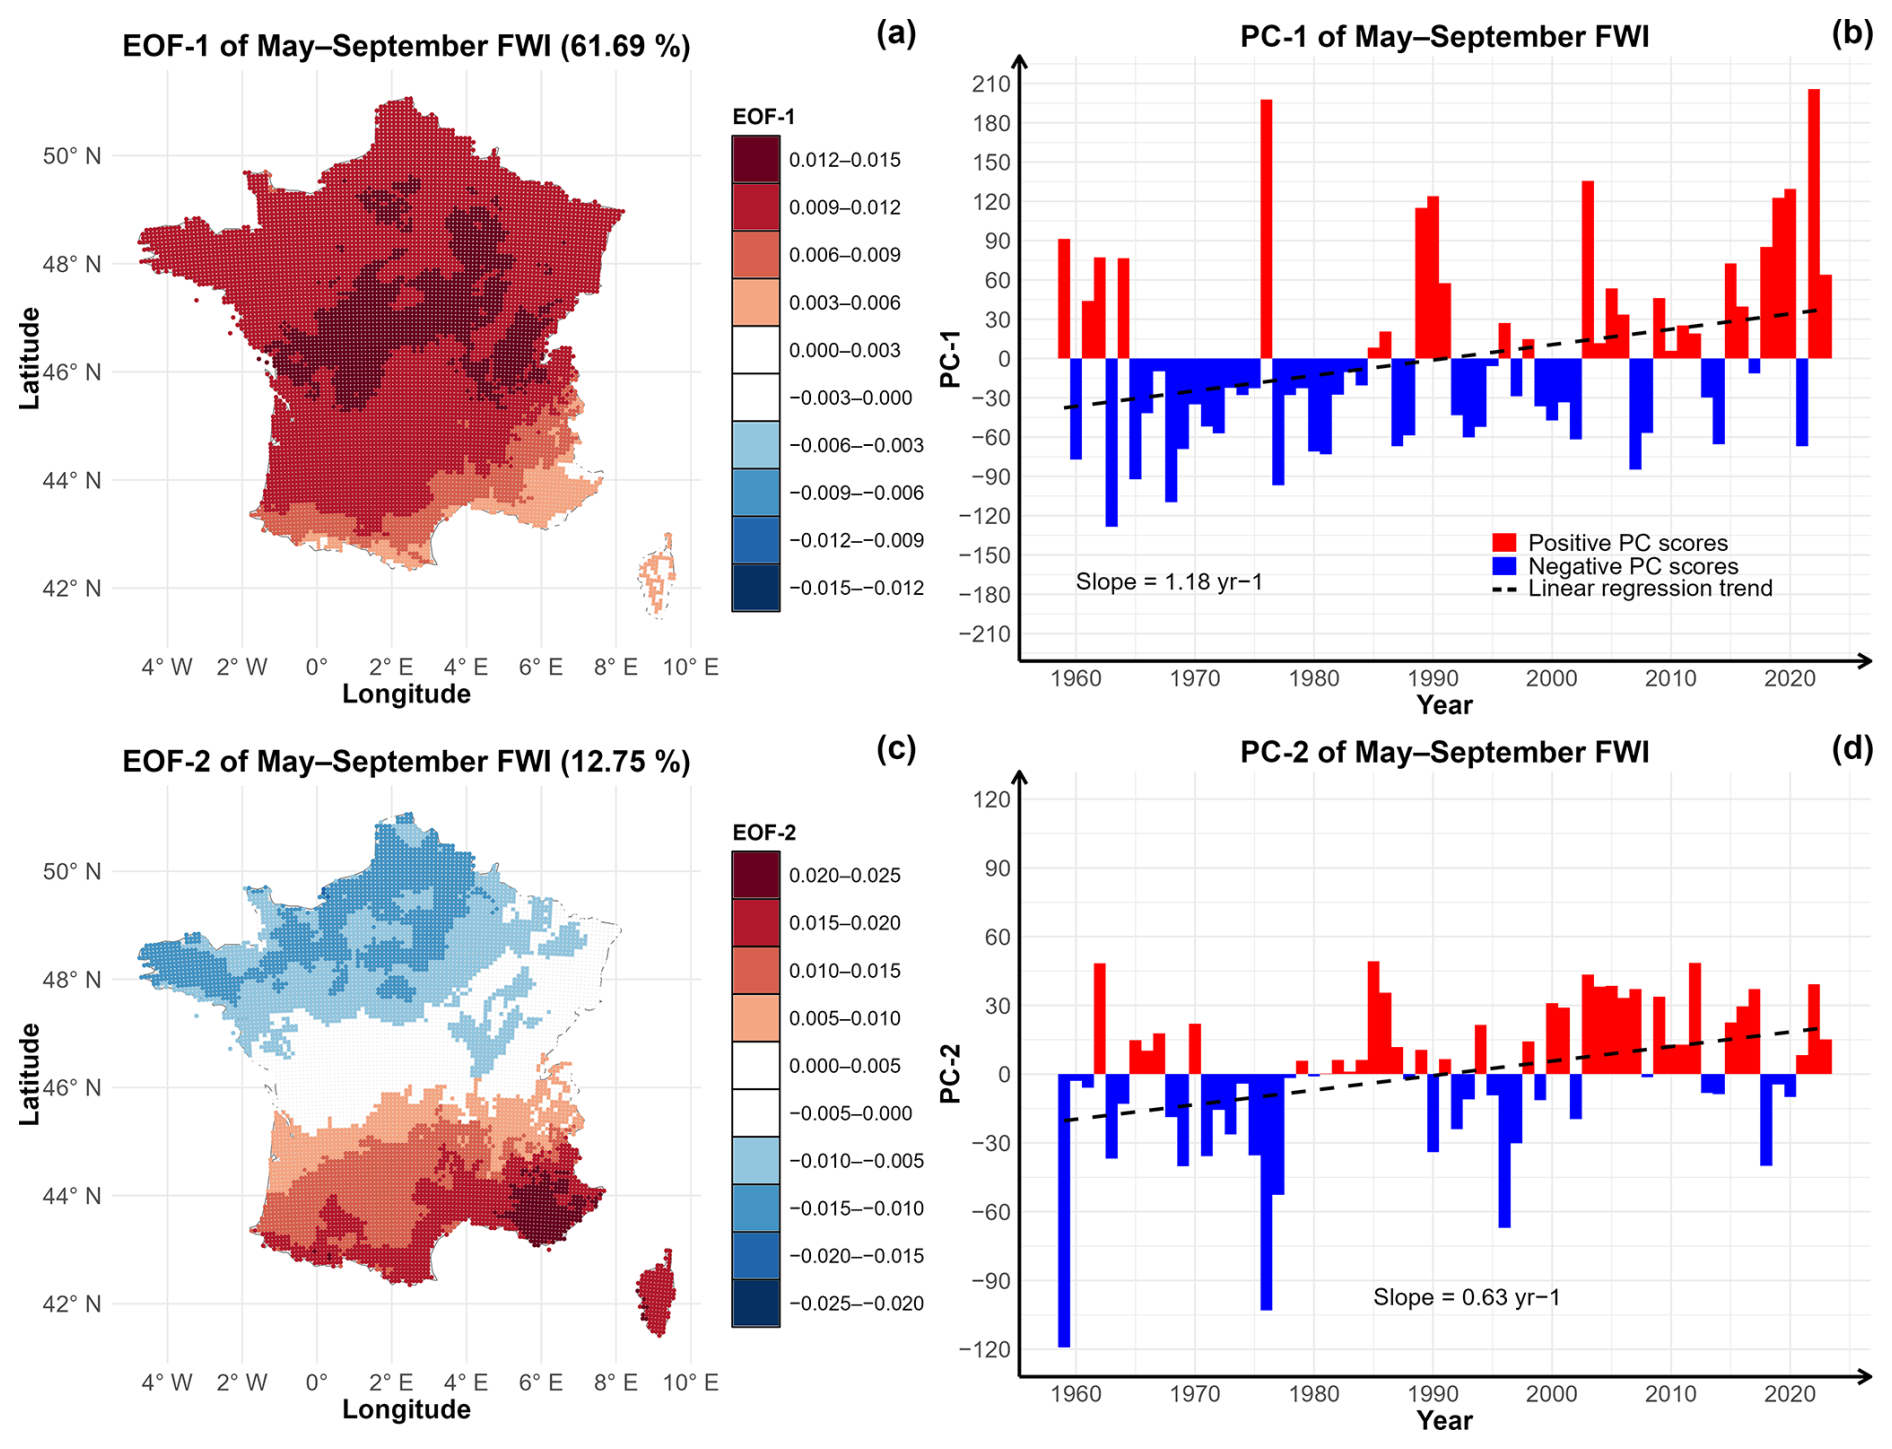
Figure 3Leading two modes of mean May–September Fire Weather Index (FWI) over France from 1959 to 2023. (a) First empirical orthogonal function (EOF) (variance explained 61.69 %) with (b) its corresponding principal component (PC-1) time series. (c) Second EOF (variance explained 12.75 %) with (d) its corresponding PC-2 time series.
We then restricted our attention to local FWI conditions associated with actual wildfires across SW France. Figure 4a shows that, on average, FWI increases until the wildfire day and decreases in the following days, with higher FWI values for larger wildfires. Figure 4c shows positive anomalies three months before wildfires (note that 100 % indicates that FWI was twice as high as expected from average local conditions), reaching 71 %, 106 %, and 155 % for small, medium, and large fires, respectively. These persistent pre-wildfire positive anomalies may reflect not only prolonged antecedent hot and dry conditions, but also, to some extent, an earlier seasonal onset of the fire weather season. A similar signal was observed in 2022 (Fig. 4b and d), but FWI anomalies were that time higher during the previous months and were 119 %, 137 %, and 180 % higher than mean conditions on the starting days of small, medium and large wildfires, respectively (Fig. 4d).
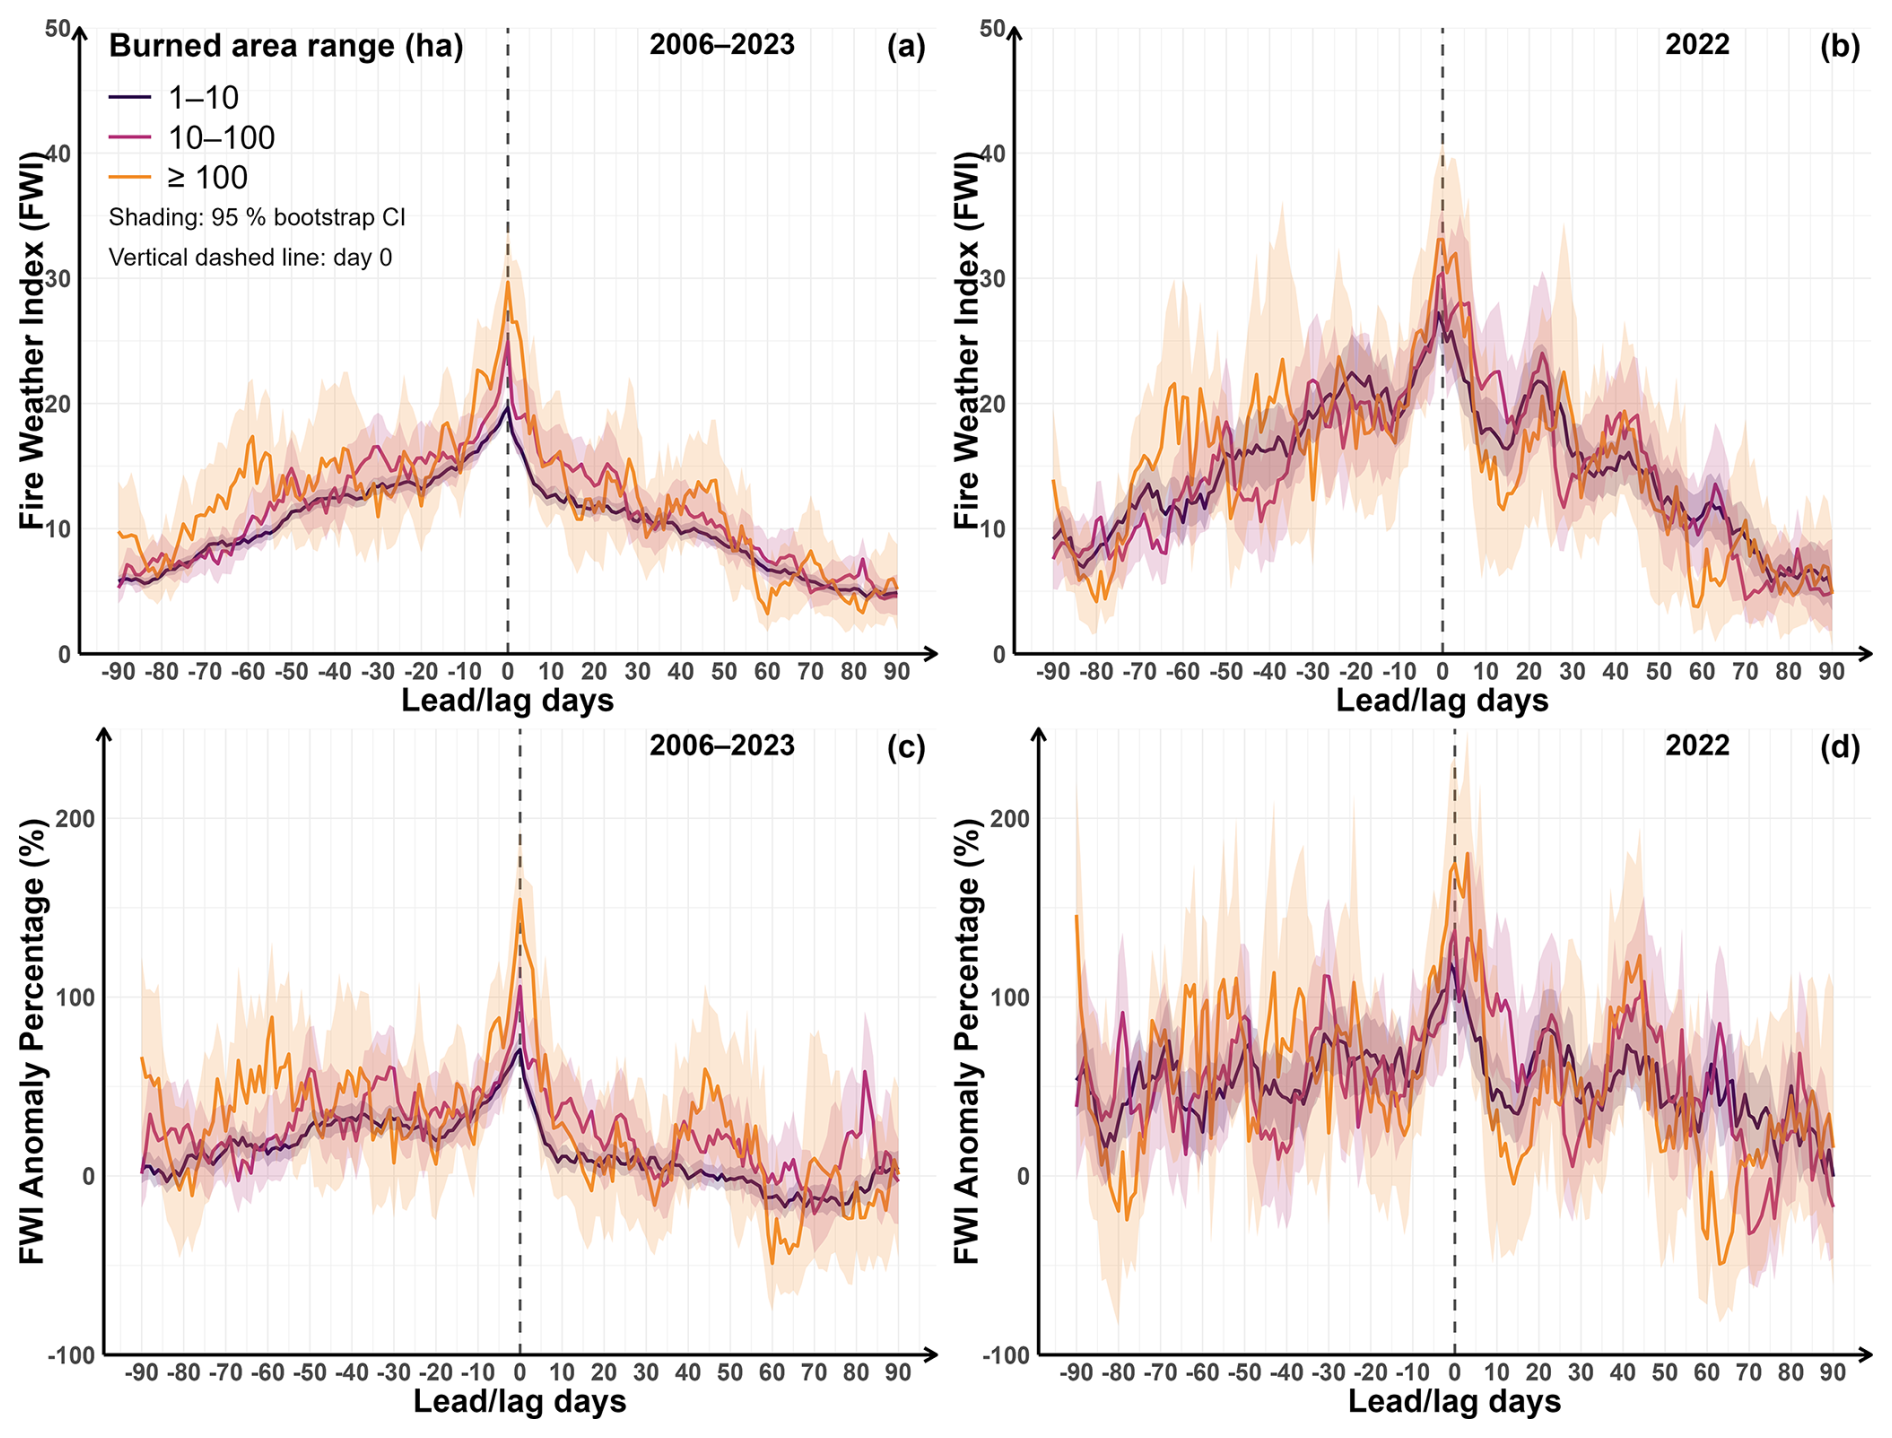
Figure 4Lead–lag time series of FWI (a, b) and percent anomalies (c, d) relative to wildfire dates for three fire size classes over 2006–2023 (a, c) and 2022 only (b, d) in SW France. Anomalies were computed relative to the long-term (1959–2023) mean local seasonal cycle. Curves denote the three burned-area classes: BA = 1–10 ha, BA = 10–100 ha, and BA ≥ 100 ha, as indicated in the legend. Shaded bands indicate 95 % bootstrap confidence intervals. The x axis shows lead/lag days from −90 to +90 relative to the wildfire starting day (day 0; vertical dashed line).
We then examined the return periods (RPs) of the three largest wildfires of 2022. Figure 5 (left panels) indicates that the annual maxima of the moving-average (MA) FWI are consistently highest when computed at the finest spatiotemporal resolution (i.e. the fire-duration window at the 64 km2 SAFRAN grid cell fire level). These annual maxima decrease when the temporal window is lengthened to 30 d or when FWI conditions are spatially averaged over SW France region ( km2). This pattern holds for all three wildfires (Fig. 5, left panels). In every case, the absolute maximum occurs in 2022, underscoring the exceptional FWI conditions during that year. Overall, the rarity of those conditions also increases with the resolution (Fig. 5, right panels), with the best-estimate RPs increasing from ≈6 to ≈34 years, from ≈22 to ≈38 years, and from ≈6 to ≈101 years when moving from the coarsest to the finest spatiotemporal scale for Landiras-1 (Fig. 5b), Landiras-2 (Fig. 5d), and La Teste-de-Buch (Fig. 5f) wildfires, respectively, illustrating how sensitive the RPs are to the chosen scales.
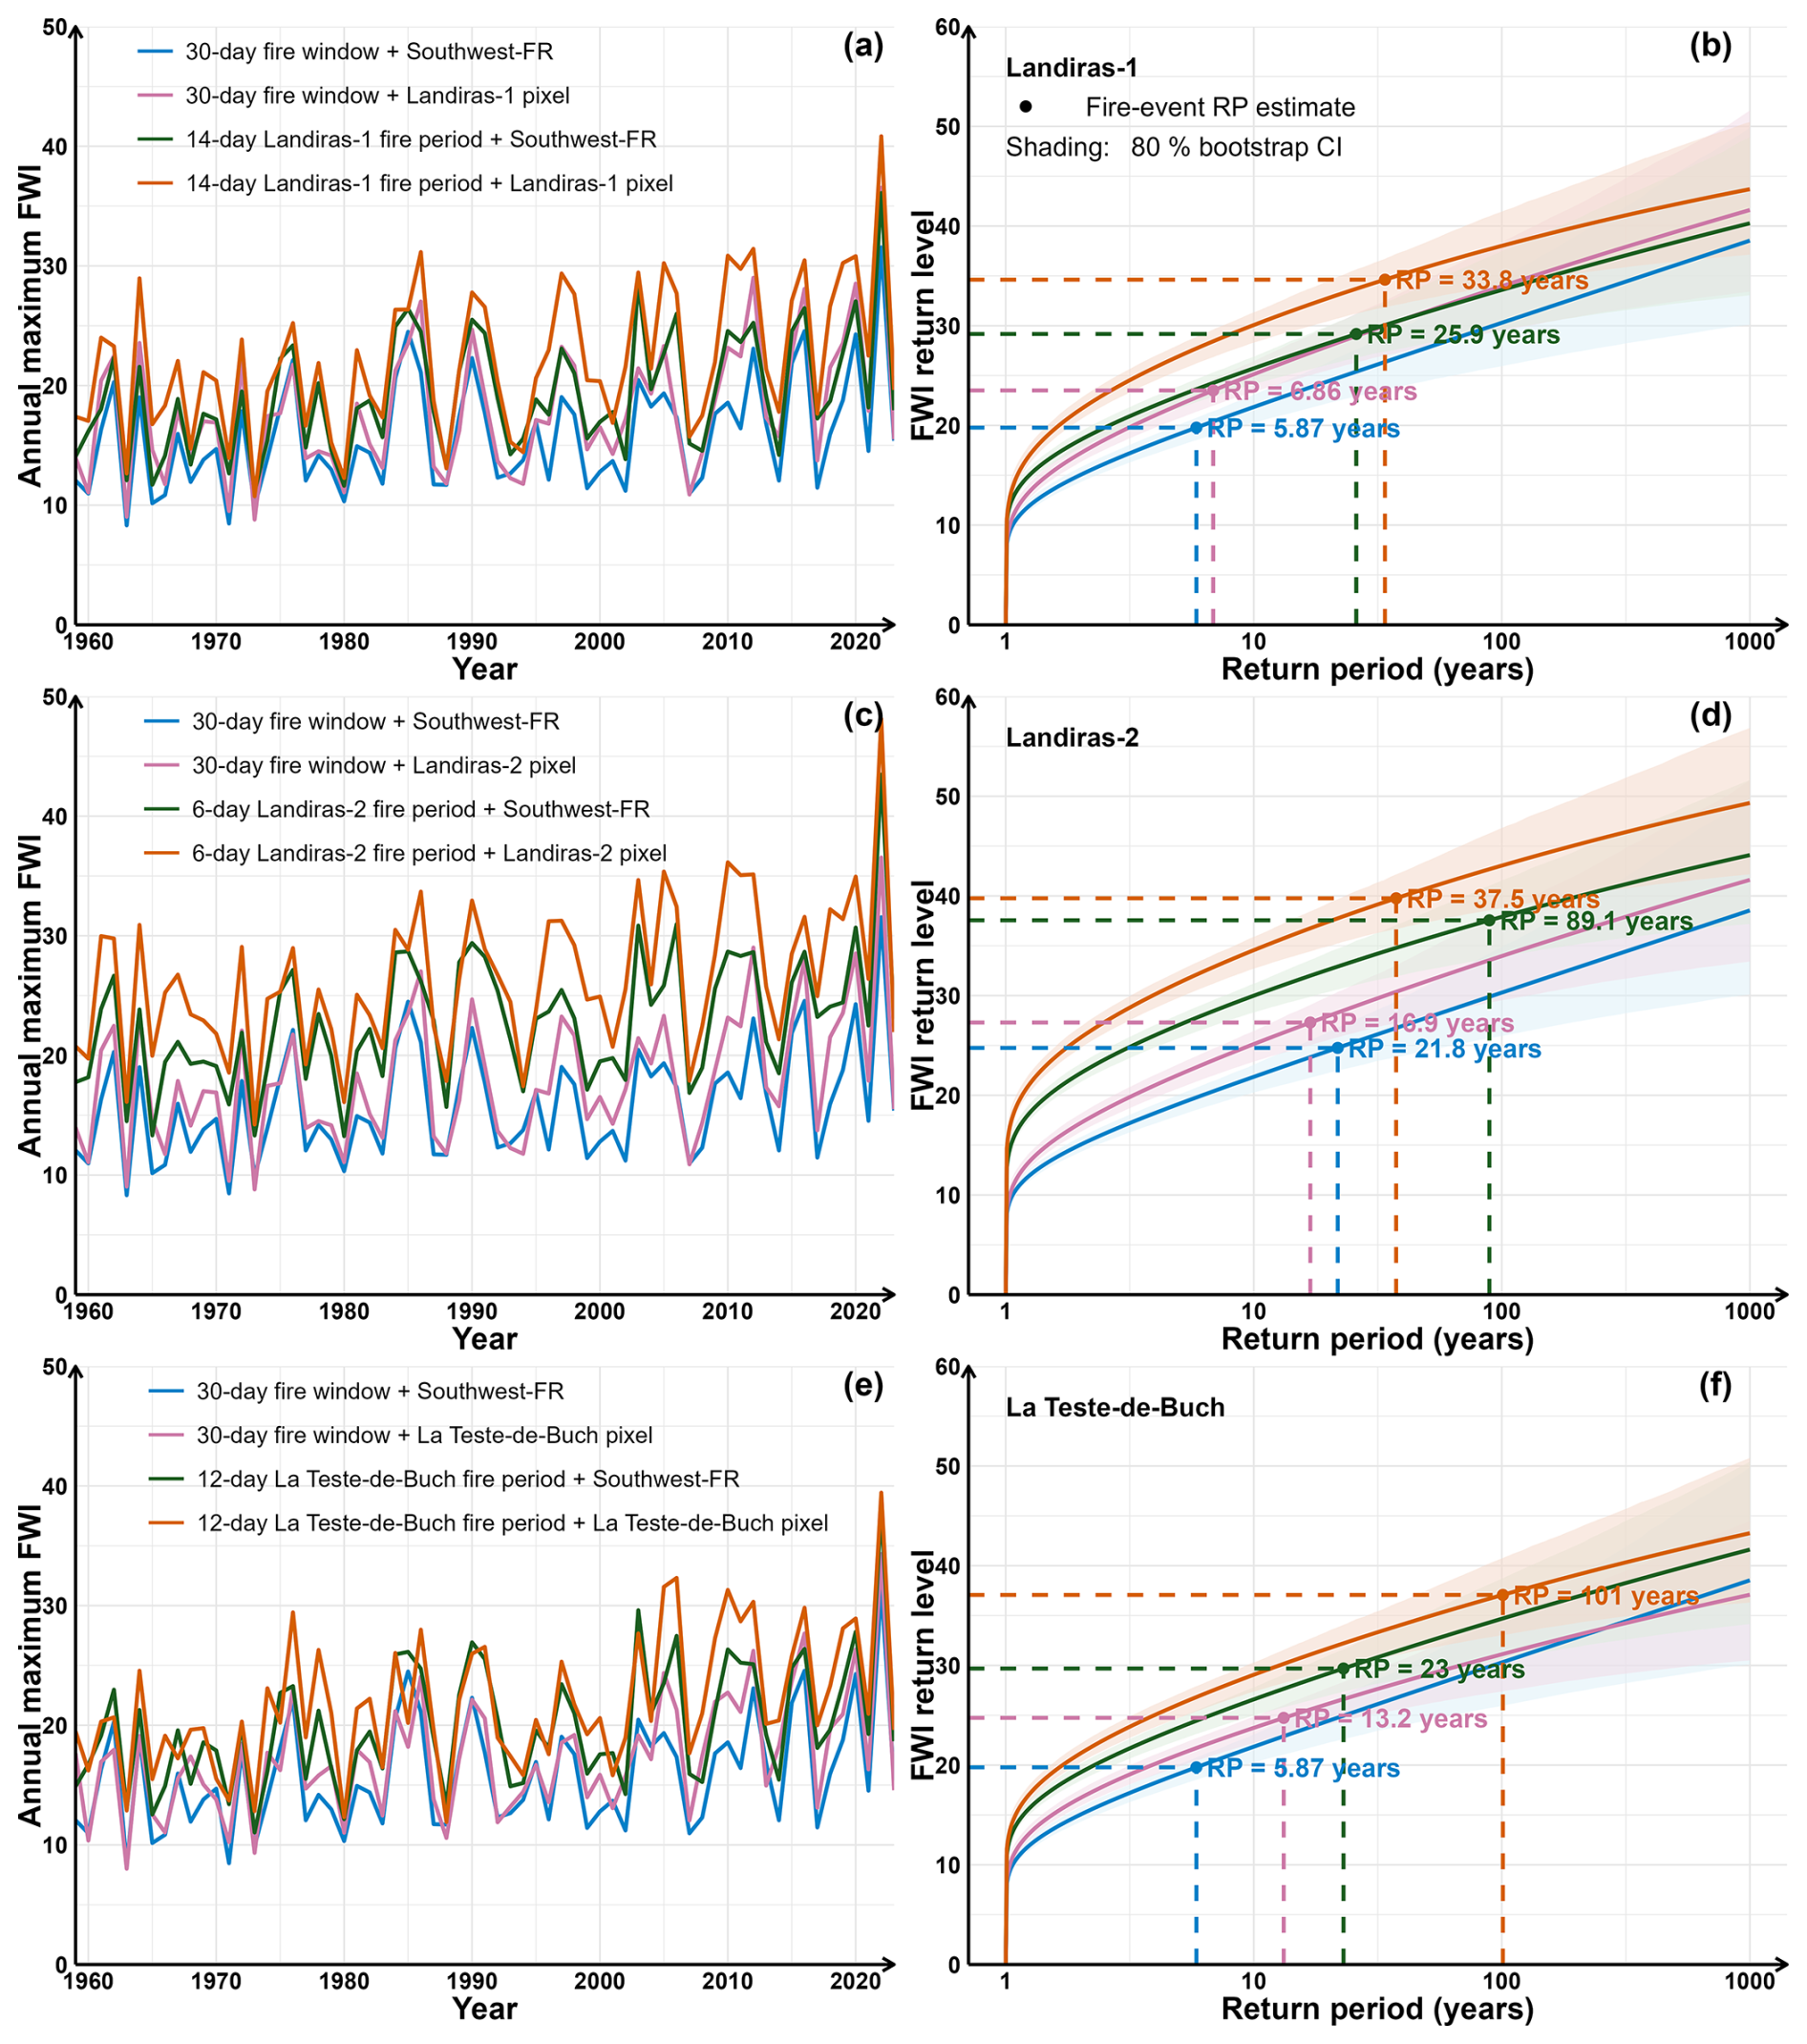
Figure 5Annual maxima of moving-averaged FWI at multiple spatiotemporal scales (left) and return-levels (right) associated with Landiras-1 (a, b), Landiras-2 (c, d), and La Teste-de-Buch (e, f). Return levels on the right (logarithmic x axis from 1 to 103 years) were estimated by fitting a GEV distribution to the annual-maximum moving-averaged FWI. Shaded envelopes indicate 80 % parametric-bootstrap confidence intervals. Dashed lines indicate the estimated return periods of the FWI level observed for each wildfire according to the chosen scale.
Finally, we examined how ACC altered the probability of those FWI conditions. Figure 6 illustrates, for one model (NorESM2-LM, r1i1p1f1) and one spatiotemporal set-up (local and fire duration), how pNAT varies relative to the reference probability pALL (=pOBS by construction). In this spatiotemporal set-up, pNAT slightly exceeds pALL until the 1970s although pALL remains within the bootstrapping confidence interval. After the 1970s, pNAT becomes systematically lower than pALL and tends toward zero after the 2040s, reflecting the growing inability of the NAT climate to produce FWI conditions that remain at the same extreme quantile in the warming ALL climate. We then computed the risk ratio (RR) for the Landiras-1 wildfire (Fig. 7) using all models. The RR exhibits a consistent increase from the late 20th century for each model and across all temporal and spatial scales. The multi-model ensembles exceed the reference line RR=1 (indicating that pNAT=pALL) around 1970–1980, with earlier emergences for finer resolutions (Fig. 7d). In 2022, three of the four models yield best-estimated RR>1 across spatiotemporal scales: IPSL-CM6A-LR ≈1.5–3, CanESM5 ≈6–20, and NorESM2-LM ≈2–130; by contrast, MIROC6 presents an RR<1 (≈0.4–0.6). The multi-model median RR lies between ≈2 and 10 in 2022 across the four scales. In the latter half of the century, this ratio increases by 1 to 2 orders of magnitude. Note the large confidence intervals within and across models and scales, reflecting the strong sensitivity to internal variability, parameter uncertainty and model uncertainty. Also, RR scores may sometimes exceed 10 000 as from the mid-to-late 21st century due to very low pNAT approaching zero as shown in Fig. 6.
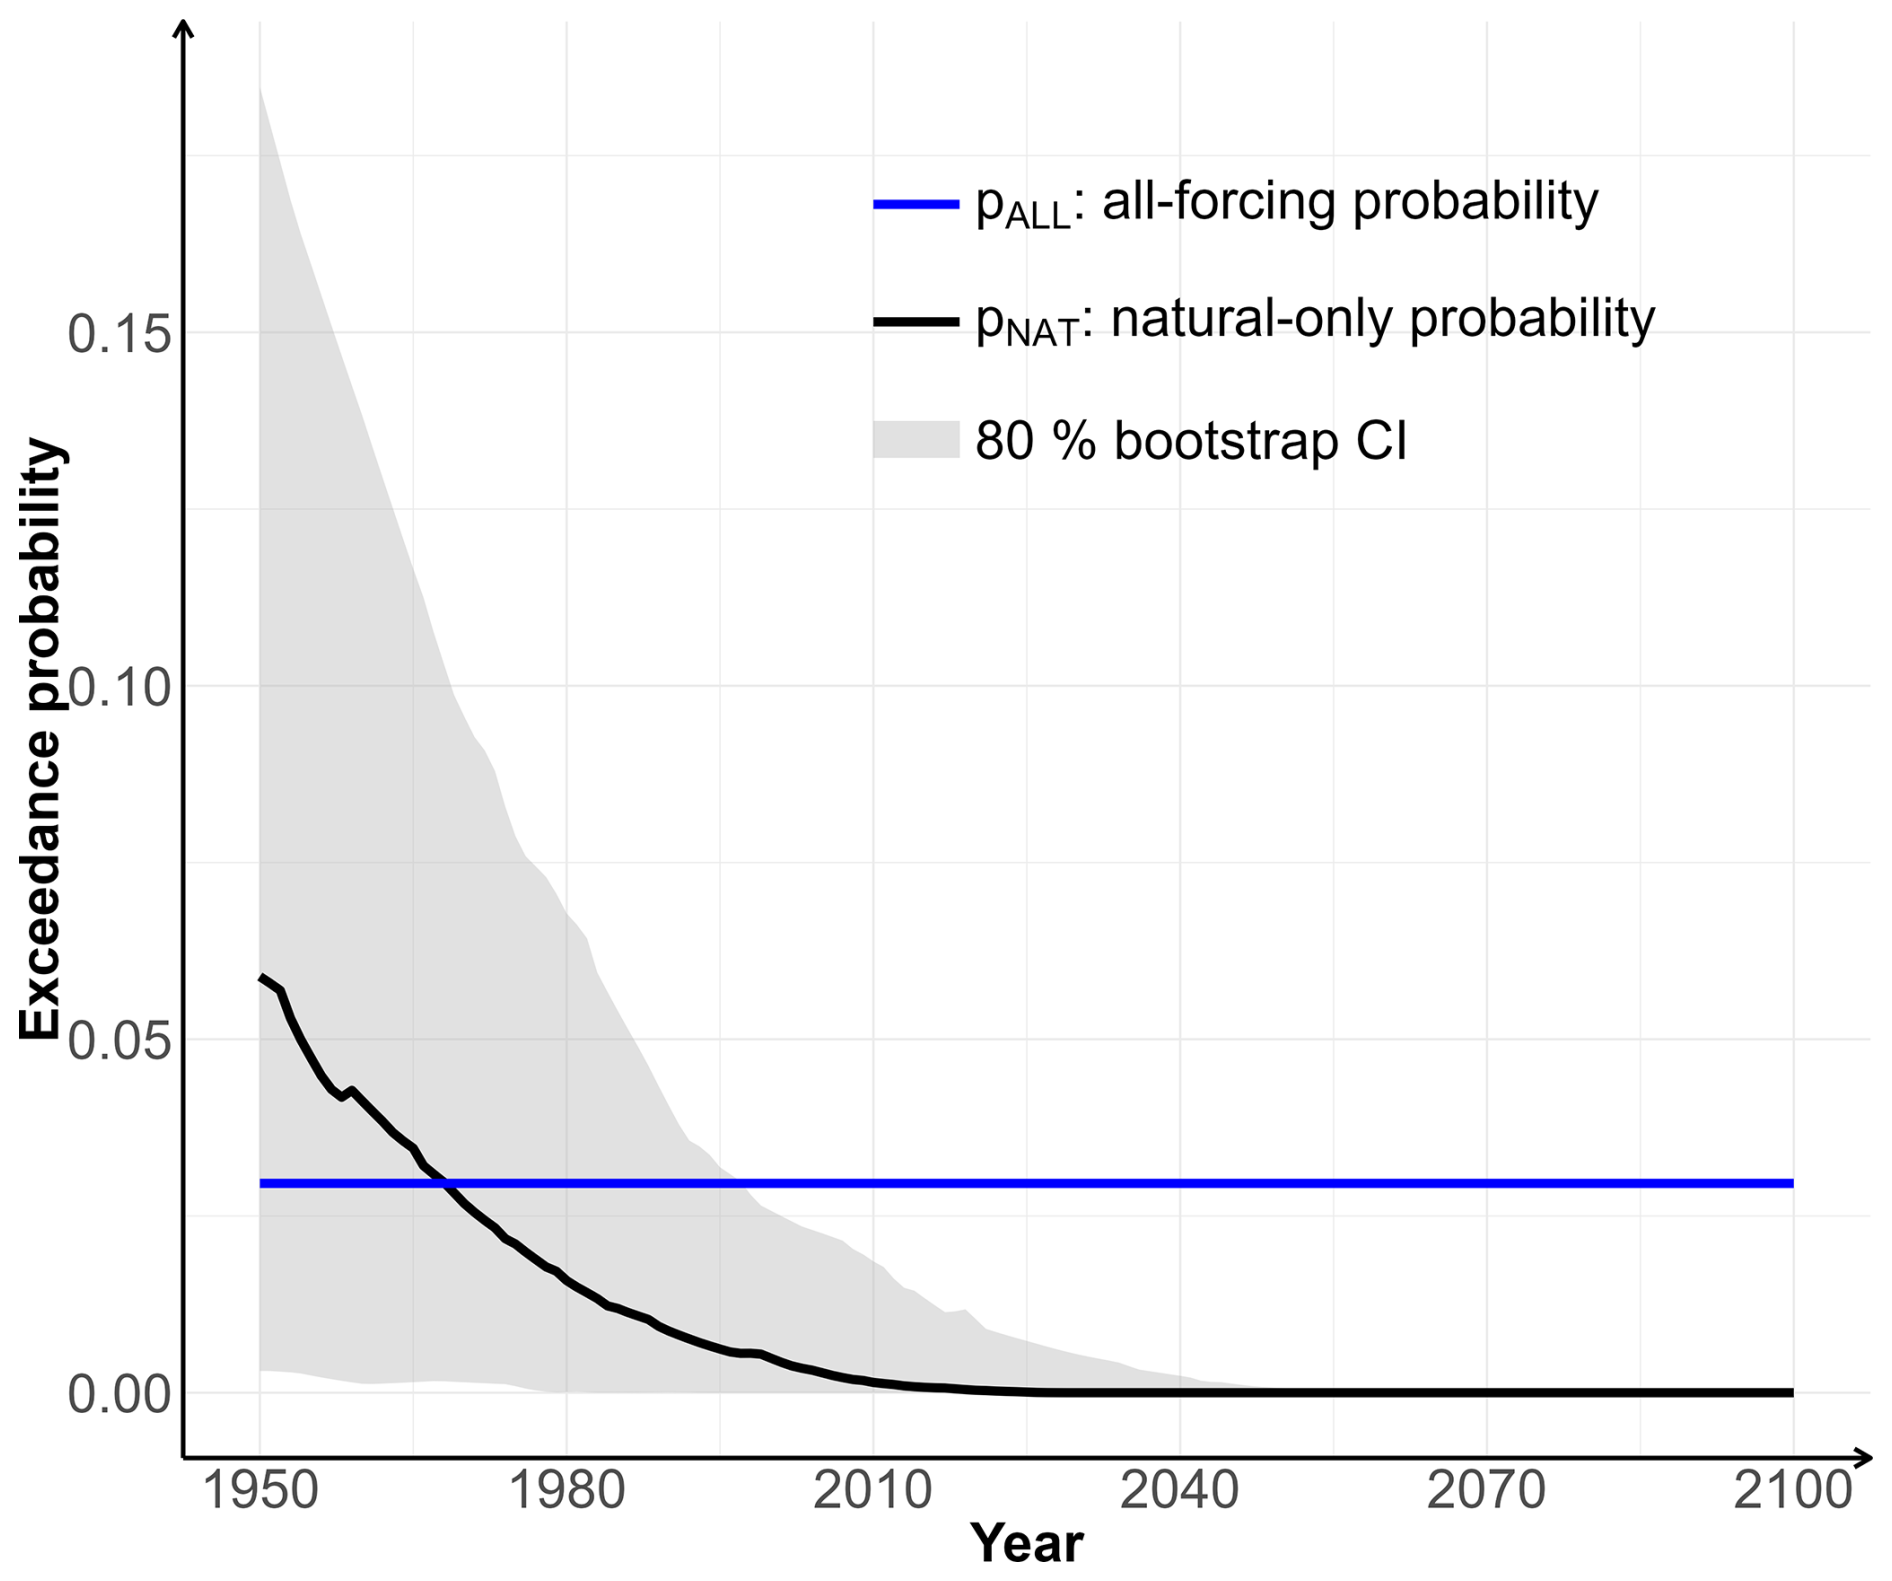
Figure 6Example of the NAT-only exceedance probability for the Landiras-1 wildfire weather conditions (local and fire-duration set-up) using NorESM2-LM (r1i1p1f1): the NAT-only exceedance probability pNAT (black; median) is shown relative to the reference probability pALL=pOBS (blue) that does not change with time. Shaded envelope indicates the 80 % parametric-bootstrap confidence interval.
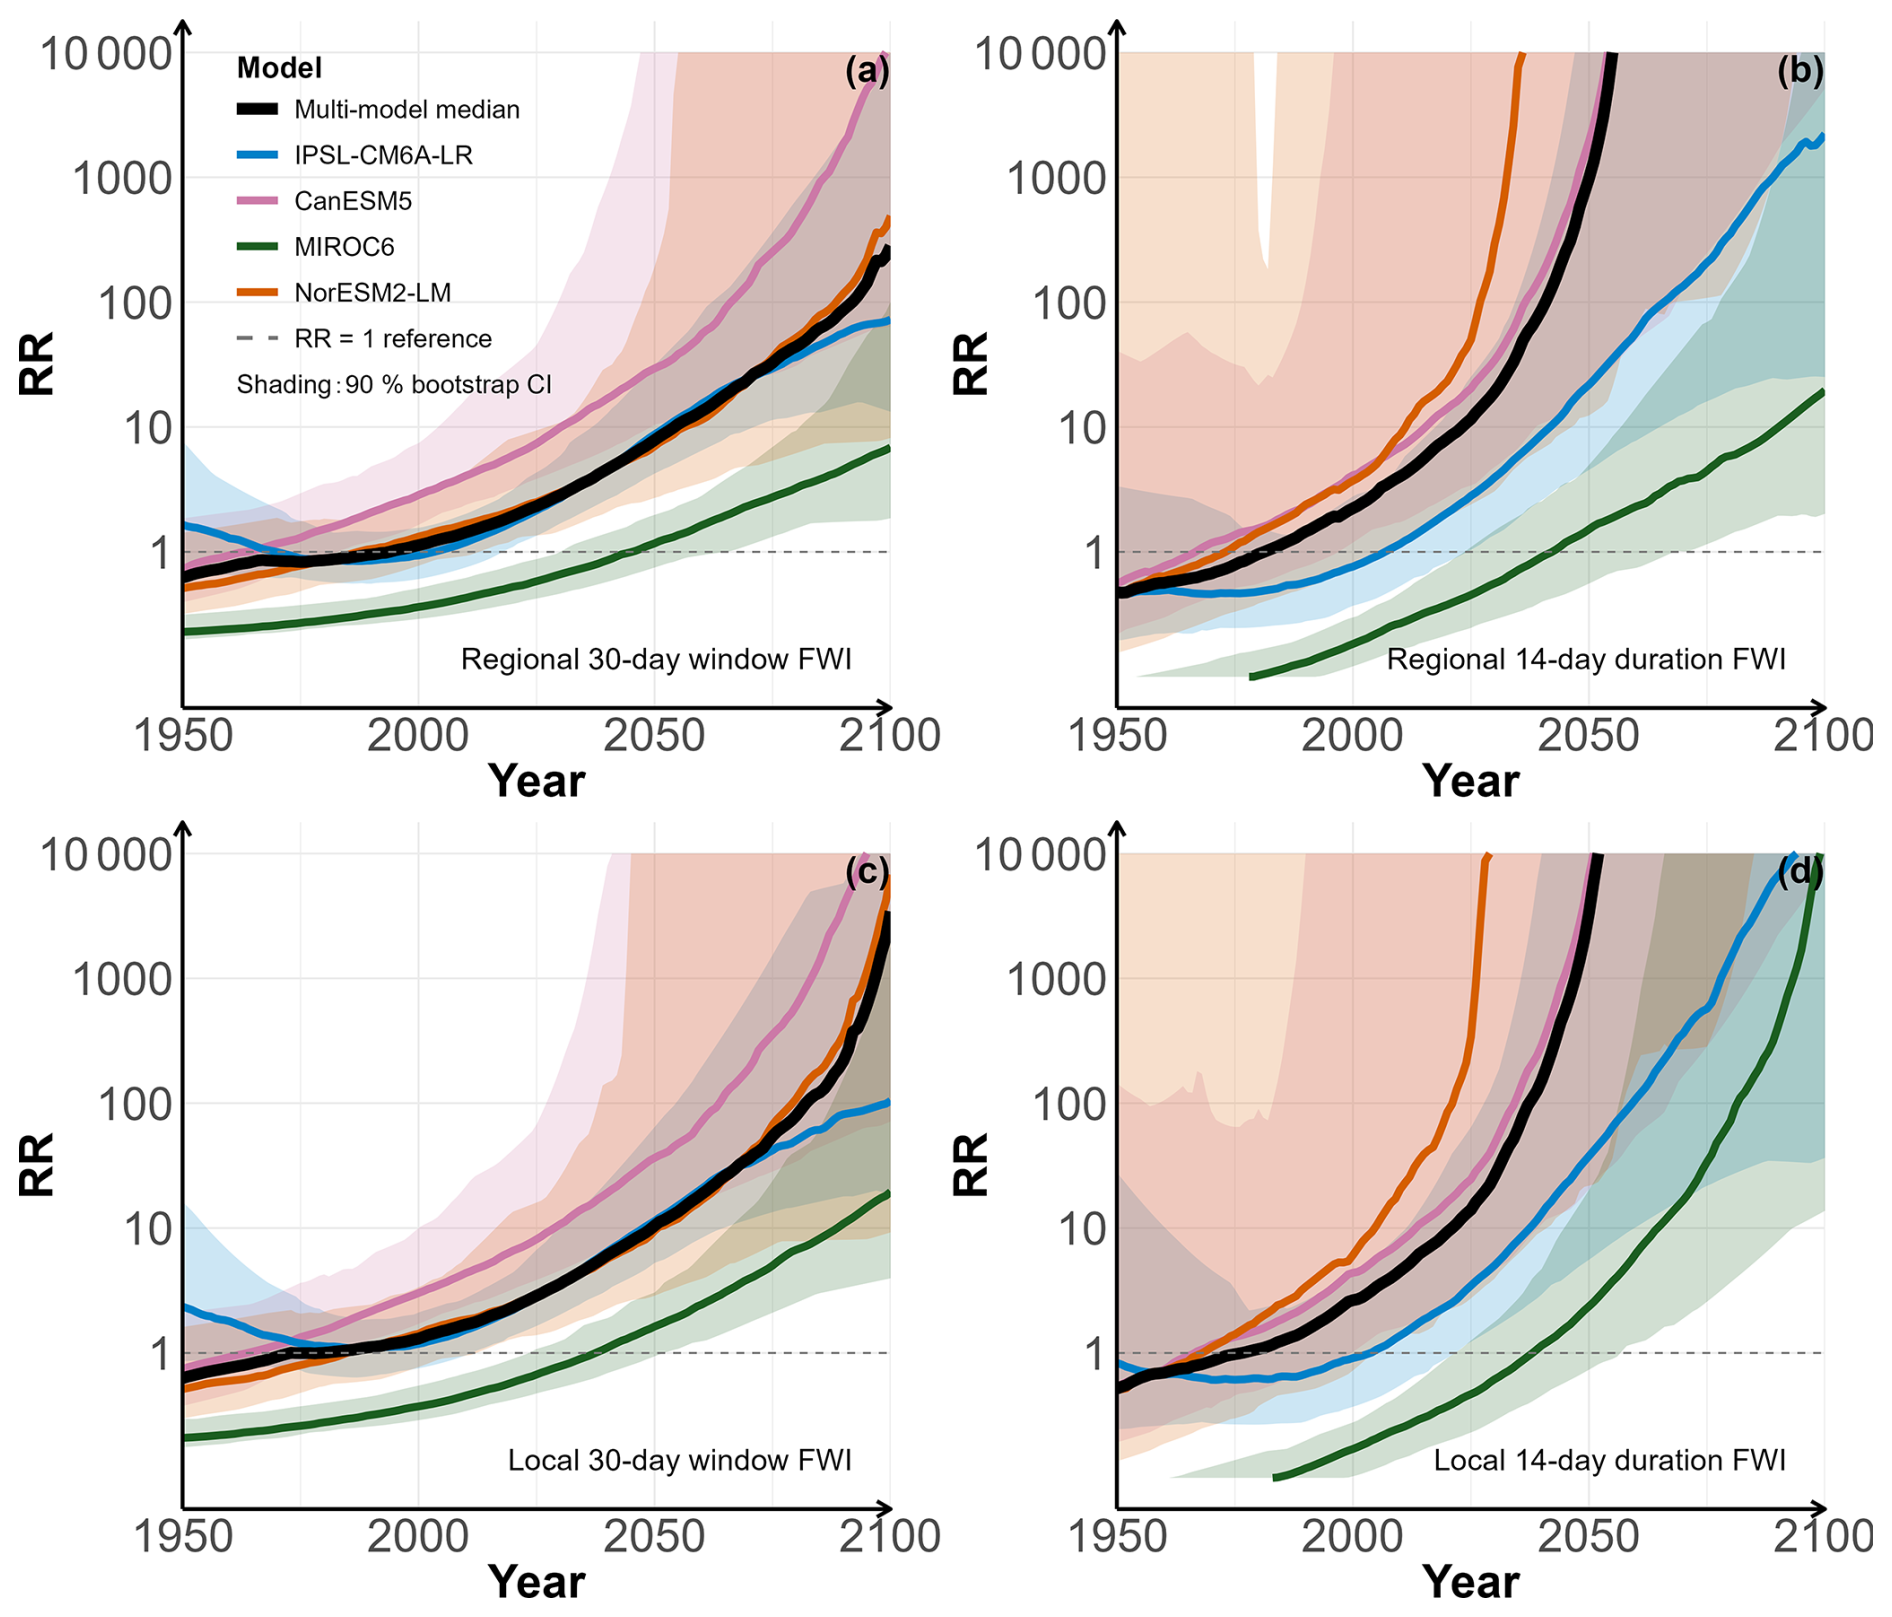
Figure 7Risk ratio (RR) of FWI conditions of the same exceedance probability as those associated with the Landiras-1 wildfire, from four CMIP6 models (IPSL-CM6A-LR, CanESM5, MIROC6, NorESM2-LM) and the multi-model median (black) across different scales: (a) regional over 30 d window; (b) regional over 14 d event duration; (c) local over 30 d window; (d) local over 14 d event duration. Shaded envelopes denote 90 % parametric-bootstrap confidence intervals for individual models. All panels use a logarithmic y axis. The horizontal dashed line indicates RR = 1 (no anthropogenic influence).
Using the finest spatiotemporal set-up (local over fire duration), we found that ACC contributed approximately 78 %, 73 %, and 79 % to the FWI conditions associated with Landiras-1, Landiras-2 and La Teste-de-Buch wildfires respectively, and will approach 100 % by mid-21st century (Fig. 8) with very large uncertainty until 2070s. Note that the signals for Landiras-1 and La Teste-de-Buch are very similar, as the two events occurred approximately over the same period.
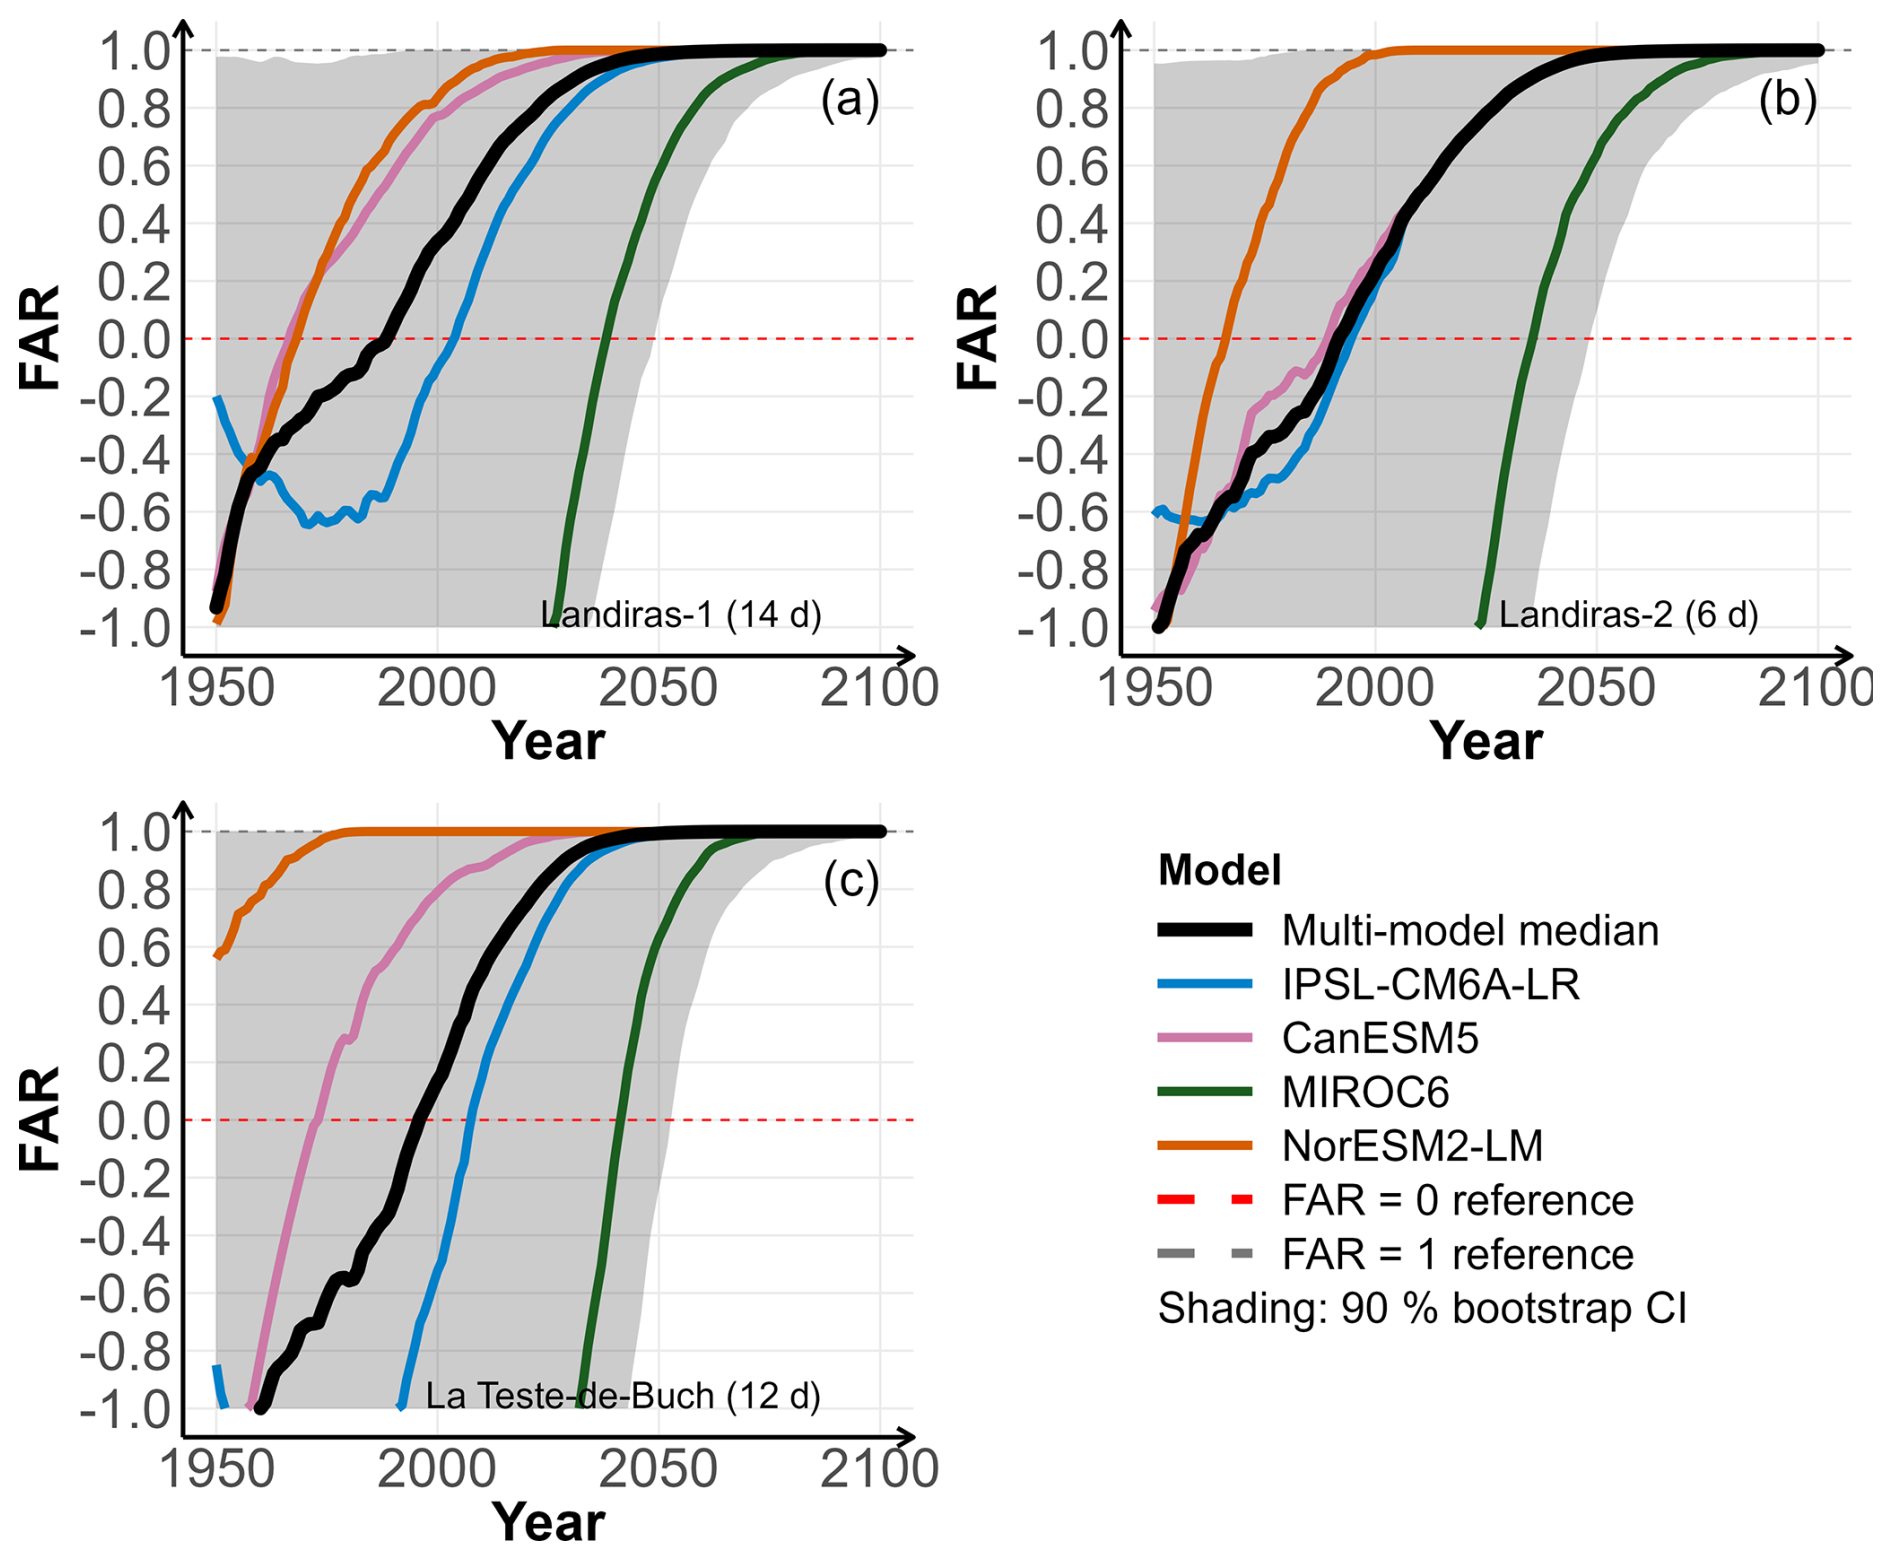
Figure 8Fraction of attributable risk (FAR, ) using the local FWI over the event-duration window for (a) Landiras-1 (14 d), (b) Landiras-2 (6 d), and (c) La Teste-de-Buch (12 d). The black curve shows the multi-model median across models. The y axis is truncated to ; horizontal dashed lines indicate FAR = 0 (no anthropogenic contribution) and FAR = 1 (fully attributable). The shaded envelope indicates the 90 % pooled ensemble uncertainty range for the multi-model median, obtained by pooling the bootstrap replicates from the four models and taking the 5th and 95th percentiles of the pooled distribution. This approach captures both within-model sampling uncertainty and inter-model spread.
The spatiotemporal variability of the observed warm-season (May–September) FWI during 1959–2023 has been synthesized into two leading modes. The first mode (∼61.69 % of variance explained) shows strong interannual variability due to an alternation between warmer/drier and cooler/wetter years throughout France. This mode also features an increased frequency of years with positive FWI anomalies over time. This evolution is consistent with the long-term trend in temperature (Ribes et al., 2022) and drought (Bevacqua et al., 2024) in France, collectively contributing to increased fire weather conditions as observed more broadly in the Mediterranean region (Ruffault et al., 2020; Hetzer et al., 2024), Europe (Giannaros et al., 2021), and globally (Jain et al., 2022). The second mode (accounting for ∼12.75 % of variance) reveals a north–south dipole. This north–south contrast in climate anomalies probably relates to the summer North Atlantic Oscillation, which is, during negative phases, generally associated with blocking events producing cooler/wetter conditions in northern Europe and warmer/drier conditions in the south (Bladé et al., 2012; Wang et al., 2011; Liu et al., 2025). An underlying long-term trend with more frequent warmer/drier years in the south in recent years was also evident, in agreement with precipitation decreases in southern Europe and slightly wetter conditions in the north as documented in observations (Ruffault et al., 2018; Bevacqua et al., 2024; Tradowsky et al., 2023) as well as in future simulations (Giannaros et al., 2021). Interestingly, both PC-1 and PC-2 scores indicate that the year 2022 represented a combination of these two leading modes, with unprecedented FWI anomalies over a large portion of France and, orthogonal to that mode, a latitudinal dipole with higher (lower) FWI in the southern (northern) half of the country.
The exceptionally high FWI values observed in 2022 in SW France, whether sampled locally or regionally, were conducive to a series of wildfires, with larger wildfires associated with larger FWI anomalies. We found that FWI levels reached their highest amplitude on the day of ignition (or the week surrounding it), boosted by either synoptic-scale heat waves or local wind bursts, as shown in previous studies over southern Europe (Ruffault et al., 2020) and France (Barbero et al., 2020; Pimont et al., 2021). We estimated that the conditions observed locally during the three largest wildfires were expected, on average, to occur once every 34, 38, and 101 years for the Landiras-1, Landiras-2, and La Teste-de-Buch wildfires, respectively. The last estimate, relying on extrapolation beyond the observational record, naturally involves substantial uncertainty.
Across spatial scales, Landiras-1 and La Teste-de-Buch wildfires exhibited higher RPs at the local scale than at the regional scale, reflecting the well-known effect of spatial averaging on dampening extremes (Leach et al., 2020; Angélil et al., 2018; Kirchmeier-Young et al., 2019b). We note that the region is flat, suggesting that those spatial differences cannot be attributed to terrain-related factors. However, Landiras-2 displayed the opposite pattern, with regional RPs exceeding local RPs. This inversion may be due to the fact that Landiras-2 was a rekindling of the Landiras-1 wildfire and was driven mainly by smoldering peat rather than by fire weather conditions. Also, we noticed that some precipitation occurred locally on 13–14 August, depressing the local FWI during the 9–14 August interval. Furthermore, even though the regional-scale FWI had a longer return period, the FWI associated with Landiras-2 was still higher in absolute terms at the local scale. Across temporal scales, all three wildfires exhibited higher RPs during the fire-duration window than during the 30 d window, indicating that short-duration, but more acute FWI driven by daily or synoptic meteorological variations also contributed strongly to these wildfires. Note that the wide confidence intervals around the RPs illustrate the uncertainty inherent in GEV fits with limited sample sizes.
Our results indicated that anthropogenic warming has, since the early twenty-first century, markedly increased the probability of occurrence of FWI conditions associated with those wildfires. This is consistent with a growing body of fire-attribution research at the global scale (Jones et al., 2022; Abatzoglou et al., 2025) and at regional scales across parts of the US (Queen et al., 2025; Brown et al., 2023; Williams et al., 2019), Canada (Kirchmeier-Young et al., 2019a, 2024), Australia (van Oldenborgh et al., 2021), the Arctic (Descals et al., 2022), Portugal (Senande-Rivera et al., 2025), and France (Barbero et al., 2020; Lanet et al., 2024). This increase is evident across temporal and spatial scales in the multi-model median, although its magnitude and timing differ substantially among models. Likewise, the timing at which the RR exceeds 1 and remains above that threshold is broadly consistent with the emergence of anthropogenic signals in simulated fire weather indices since the late twentieth century in southern Europe (Abatzoglou et al., 2019). Our study suggests that the multi-model median probability of such conditions increased by approximately 2–10 times in 2022 and is projected to increase by roughly 1 to 2 orders of magnitude by the end of the twenty-first century under a medium-level radiative forcing scenario. However, the pooled ensemble uncertainty range indicates substantial uncertainty across and within models (see Fig. S6). This validates, across different metrics, fire weather indices, and spatiotemporal scales, the results obtained by Lanet et al. (2024) using a soil-moisture index. Interestingly, despite the large spread in RPs across scales, the attribution scores were not found to change substantially across regional and local scales, suggesting that the rarity of FWI conditions does not necessarily relate to the magnitude of the anthropogenic forcing (Cattiaux and Ribes, 2018). Although inter-model differences were evident in terms of amplitude and timing (i.e. the date at which the RR emerges above 1), due to model sensitivity to greenhouse gas emissions, all models point to a substantial increase in 2022-like conditions in future decades, consistent with previous projections of FWI (Fargeon et al., 2020) or FWI-derived fire activity (Pimont et al., 2023b) in France. Also, MIROC6 was found to cross the RR=1 line later than other models, supporting the findings of Lanet et al. (2024) who detected a lower climate change signal in MIROC6. This probably relates to the lower climate sensitivity of MIROC6 (Tatebe et al., 2019; Forster et al., 2021) due to the radiative forcing of aerosols (Smith et al., 2020) and cloud feedback (Hirota et al., 2022). Finally, our study shows that approximately 70 % of the risk that fire weather conditions reach the levels observed during those wildfires can be attributed to ACC (more than the 49 % found in Lanet et al. (2024) over broader spatial and temporal scales, and the nearly half contribution reported by Barbero et al. (2020) at a multi-decadal scale for Mediterranean France) and that this estimate will reach 100 % by the 2050s. These conclusions apply to other large wildfires (Landiras-2 and La Teste-de-Buch) as well.
We note that the methodology developed here has some limitations. First, our analysis was based solely on meteorological forcing and therefore lacks information on fuels (e.g. forest cover, fuel breaks, and horizontal/vertical continuity). The use of a statistical model that accounts for some of these features (e.g. Firelihood; Pimont et al., 2021) would produce more realistic estimates. Previous studies have also shown that some wildfires are driven primarily by wind, whereas others are driven by the dryness of climate conditions (Ruffault et al., 2020). Further efforts are thus needed to resolve the respective contributions of fuel moisture and wind forcing, based, for instance, on sub-indices of the FWI (e.g. Fine Fuel Moisture Code (FFMC), Duff Moisture Code (DMC), and Drought Code (DC)) and complementary atmospheric drivers such as the vapor pressure deficit (VPD) and wind speed, as recently implemented in a probabilistic framework (Castel-Clavera et al., 2025). Second, our analysis does not explicitly consider ignition sources and their spatiotemporal variability. In France, approximately 95 % of ignitions are related to human activities (Ganteaume and Guerra, 2018), and the realized fire activity therefore reflects the interplay between human pressure and fire weather conditions. As a simple approximation, the “fire start probability” could be expressed as a monotonically increasing function of the FWI (i.e. an ignition probability conditional on fire weather) using a probabilistic framework such as the Firelihood model (Pimont et al., 2021) combining FWI with land use and land cover information. Also, our event-attribution analysis was based on three large wildfires in southwestern France. Extending the analysis to the French Mediterranean, which recently experienced the second largest wildfire in France since 1949 (early August 2025; approximately 17 000 ha burned at Ribaute), would be of interest. Although the spread of this wildfire was facilitated by hot and dry conditions alongside strong winds, wildfires in that region are generally associated with higher FWI levels that are expected, on average, once every year or so. Regarding climate simulations, we note that only a single ensemble member (r1i1p1f1) was used for each model. Using additional members would obviously reduce internal variability. Further work is also needed to improve the multi-model averaging by introducing weights based on each model's skill over the historical period (Gallo et al., 2025). Finally, we used the SSP2-4.5 scenario in CMIP6, corresponding to a medium level of radiative forcing. Using higher-forcing scenarios (e.g. SSP5-8.5) would yield much higher RR in the future.
The three wildfires examined here burned over multiple days, each undergoing several complete nocturnal cycles. Overnight burning is relatively new in France, where the vast majority of wildfires were historically extinguished within a single day. Further research is thus needed to elucidate (i) the role of nighttime conditions in overnight burning and the extent to which the so-called nighttime barrier is likely to weaken under ACC (Balch et al., 2022), and (ii) the relative contributions of nighttime aridity vs. seasonal drought (Luo et al., 2024), as well as the potential role of other meteorological variables such as wind speed (Chiodi et al., 2025). Such analyses may complement the information provided by traditional daytime-based indicators (e.g. FWI) used in climate–fire or attribution studies.
This study aimed at quantifying how ACC has already, and will further, alter the probability of fire weather conditions associated with the three largest wildfires of 2022 across France (Landiras-1, Landiras-2, La Teste-de-Buch). First, we found that warm-season (May–September) FWI gradually intensified over 1959–2023, especially in southern France, making the landscape more and more flammable. Second, we found that return periods of FWI associated with extreme wildfires observed in 2022 were scale-dependent and may range for instance from about 6 (at monthly and regional scales) to more than 101 years (at fire-duration and local scales) for La Teste-de-Buch wildfire. Finally, attribution metrics indicated that FWI conditions of comparable rarity to those observed during the wildfires were substantially less likely under the natural-forcing-only climate, and that anthropogenic climate change made those conditions approximately 2–10 times more likely in 2022. Under a moderate-emissions pathway, those FWI conditions are projected to become roughly 1 to 2 orders of magnitude more probable by the end of the century, although substantial uncertainty remains across and within models.
The code used in this study is available from the first author upon reasonable request.
Wildfire records were obtained from the Base de Données sur les Incendies de Forêts en France (BDIFF) at https://www.data.gouv.fr/en/datasets/base-de-donnees-sur-les-incendies-de-forets-en-france-bdiff/ (IGN and MASA, 2025). Daily meteorological variables from the SAFRAN atmospheric reanalysis over France (Vidal et al., 2010) were retrieved from the Météo-France open-data services (https://meteo.data.gouv.fr, last access: 30 May 2026). ERA5 reanalysis fields were downloaded from the Copernicus Climate Data Store (CDS). For reproducibility, we cite the CDS dataset used in this study: ERA5 hourly data on single levels from 1940 to present (Copernicus Climate Change Service (C3S), 2018) (https://doi.org/10.24381/cds.adbb2d47). CMIP6 simulations (historical, DAMIP, and ScenarioMIP) were obtained from the Earth System Grid Federation (ESGF) archive (https://esgf-node.llnl.gov/search/cmip6/, last access: 30 May 2026), following the CMIP6 and MIP design descriptions (Eyring et al., 2016; Gillett et al., 2016; O'Neill et al., 2016).
The supplement related to this article is available online at https://doi.org/10.5194/nhess-26-2637-2026-supplement.
SZ performed all analyses and wrote the first draft of the manuscript. SZ, RB, FP, and BR jointly contributed to the study design, the interpretation of the results, and the writing and revision of the manuscript.
The contact author has declared that none of the authors has any competing interests.
Publisher's note: Copernicus Publications remains neutral with regard to jurisdictional claims made in the text, published maps, institutional affiliations, or any other geographical representation in this paper. The authors bear the ultimate responsibility for providing appropriate place names. Views expressed in the text are those of the authors and do not necessarily reflect the views of the publisher.
SZ gratefully acknowledges the support of the Sud Provence-Alpes-Côte d'Azur (PACA) region and the Société du Canal de Provence (SCP) for his doctoral project.
This paper was edited by Jean-Baptiste Filippi and reviewed by Thomas Janssen and one anonymous referee.
Abatzoglou, J. T. and Williams, A. P.: Impact of anthropogenic climate change on wildfire across western US forests, P. Natl. Acad. Sci. USA, 113, 11770–11775, https://doi.org/10.1073/pnas.1607171113, 2016. a
Abatzoglou, J. T., Williams, A. P., and Barbero, R.: Global emergence of anthropogenic climate change in fire weather indices, Geophys. Res. Lett., 46, 326–336, https://doi.org/10.1029/2018GL080959, 2019. a
Abatzoglou, J. T., Kolden, C. A., Cullen, A. C., Sadegh, M., Williams, E. L., Turco, M., and Jones, M. W.: Climate change has increased the odds of extreme regional forest fire years globally, Nat. Commun., 16, 6390, https://doi.org/10.1038/s41467-025-61608-1, 2025. a
Angélil, O., Stone, D., Perkins-Kirkpatrick, S., Alexander, L. V., Wehner, M., Shiogama, H., Wolski, P., Ciavarella, A., and Christidis, N.: On the nonlinearity of spatial scales in extreme weather attribution statements, Clim. Dynam., 50, 2739–2752, https://doi.org/10.1007/s00382-017-3768-9, 2018. a, b
Balch, J. K., Abatzoglou, J. T., Joseph, M. B., Koontz, M. J., Mahood, A. L., McGlinchy, J., Cattau, M. E., and Williams, A. P.: Warming weakens the night-time barrier to global fire, Nature, 602, 442–448, https://doi.org/10.1038/s41586-021-04325-1, 2022. a
Barbero, R., Abatzoglou, J. T., Pimont, F., Ruffault, J., and Curt, T.: Attributing increases in fire weather to anthropogenic climate change over France, Front. Earth Sci., 8, 1–11, https://doi.org/10.3389/feart.2020.00104, 2020. a, b, c, d, e, f
Bellprat, O., Guemas, V., Doblas-Reyes, F. J., and Donat, M. G.: Towards reliable extreme weather and climate event attribution, Nat. Commun., 10, 1732, https://doi.org/10.1038/s41467-019-09729-2, 2019. a
Bevacqua, E., Rakovec, O., Schumacher, D. L., Kumar, R., Thober, S., Samaniego, L., Seneviratne, S. I., and Zscheischler, J.: Direct and lagged climate change effects intensified the 2022 European drought, Nat. Geosci., 17, 1100–1107, https://doi.org/10.1038/s41561-024-01559-2, 2024. a, b, c
Bladé, I., Liebmann, B., Fortuny, D., and van Oldenborgh, G. J.: Observed and simulated impacts of the summer NAO in Europe: implications for projected drying in the Mediterranean region, Clim. Dynam., 39, 709–727, https://doi.org/10.1007/s00382-011-1195-x, 2012. a
Brown, P. T., Hanley, H., Mahesh, A., Reed, C., Strenfel, S. J., Davis, S. J., Kochanski, A. K., and Clements, C. B.: Climate warming increases extreme daily wildfire growth risk in California, Nature, 621, 760–766, https://doi.org/10.1038/s41586-023-06444-3, 2023. a, b
Castel-Clavera, J., Pimont, F., Opitz, T., Ruffault, J., Barbero, R., Allard, D., and Dupuy, J.: A comparative analysis of fire-weather indices for enhanced fire activity prediction with probabilistic approaches, Agr. Forest Meteorol., 361, 110315, https://doi.org/10.1016/j.agrformet.2024.110315, 2025. a
Cattiaux, J. and Ribes, A.: Defining single extreme weather events in a climate perspective, B. Am. Meteorol. Soc., 99, 1557–1568, https://doi.org/10.1175/BAMS-D-17-0281.1, 2018. a
Chiang, F., Mazdiyasni, O., and AghaKouchak, A.: Evidence of anthropogenic impacts on global drought frequency, duration, and intensity, Nat. Commun., 12, 2754, https://doi.org/10.1038/s41467-021-22314-w, 2021. a
Chiodi, A. M., Potter, B. E., Larkin, N. K., and Harrison, D. E.: Multifactor change in western U.S. nighttime fire weather, J. Climate, 38, 2305–2315, https://doi.org/10.1175/JCLI-D-24-0473.1, 2025. a
Copernicus Climate Change Service (C3S): ERA5 hourly data on single levels from 1940 to present, reanalysis product, Copernicus Climate Change Service (C3S) Climate Data Store (CDS) [data set], https://doi.org/10.24381/cds.adbb2d47, 2018. a
Descals, A., Gaveau, D. L. A., Verger, A., Sheil, D., Naito, D., and Peñuelas, J.: Unprecedented fire activity above the Arctic Circle linked to rising temperatures, Science, 378, 532–537, https://doi.org/10.1126/science.abn9768, 2022. a
Eyring, V., Bony, S., Meehl, G. A., Senior, C. A., Stevens, B., Stouffer, R. J., and Taylor, K. E.: Overview of the Coupled Model Intercomparison Project Phase 6 (CMIP6) experimental design and organization, Geosci. Model Dev., 9, 1937–1958, https://doi.org/10.5194/gmd-9-1937-2016, 2016. a, b
Faranda, D., Pascale, S., and Bulut, B.: Persistent anticyclonic conditions and climate change exacerbated the exceptional 2022 European-Mediterranean drought, Environ. Res. Lett., 18, 034030, https://doi.org/10.1088/1748-9326/acbc37, 2023. a
Fargeon, H., Pimont, F., Martin-StPaul, N., De Caceres, M., Ruffault, J., Barbero, R., and Dupuy, J.-L.: Projections of fire danger under climate change over France: where do the greatest uncertainties lie?, Climatic Change, 160, 479–493, https://doi.org/10.1007/s10584-019-02629-w, 2020. a, b
Forster, P., Storelvmo, T., Armour, K., Collins, W., Dufresne, J.-L., Frame, D., Lunt, D. J., Mauritsen, T., Palmer, M. D., Watanabe, M., Wild, M., and Zhang, H.: The Earth's energy budget, climate feedbacks, and climate sensitivity, in: Climate Change 2021: The Physical Science Basis. Contribution of Working Group I to the Sixth Assessment Report of the Intergovernmental Panel on Climate Change, edited by: Masson-Delmotte, V., Zhai, P., Pirani, A., Connors, S. L., Péan, C., Berger, S., Caud, N., Chen, Y., Goldfarb, L., Gomis, M. I., Huang, M., Leitzell, K., Lonnoy, E., Matthews, J. B. R., Maycock, T. K., Waterfield, T., Yelekçi, O., Yu, R., and Zhou, B., Chap. 7, Cambridge University Press, Cambridge, UK and New York, NY, USA, https://doi.org/10.1017/9781009157896.009, 923–1054, 2021. a
Gallo, C., Dieppois, B., Quilcaille, Y., Chiriacò, M. V., Fulé, P. Z., Drobyshev, I., San-Miguel-Ayanz, J., Blackett, M., and Eden, J. M.: Future impacts of climate change on global fire weather: insight from weighted CMIP6 multimodel ensembles, J. Climate, 38, 6445–6462, https://doi.org/10.1175/JCLI-D-24-0540.1, 2025. a
Ganteaume, A. and Guerra, F.: Explaining the spatio-seasonal variation of fires by their causes: the case of southeastern France, Appl. Geogr., 90, 69–81, https://doi.org/10.1016/j.apgeog.2017.11.012, 2018. a
Giannaros, T. M., Kotroni, V., and Lagouvardos, K.: Climatology and trend analysis (1987–2016) of fire weather in the Euro Mediterranean, Int. J. Climatol., 41, E491–E508, https://doi.org/10.1002/joc.6701, 2021. a, b, c
Gillett, N. P., Shiogama, H., Funke, B., Hegerl, G., Knutti, R., Matthes, K., Santer, B. D., Stone, D., and Tebaldi, C.: The Detection and Attribution Model Intercomparison Project (DAMIP v1.0) contribution to CMIP6, Geosci. Model Dev., 9, 3685–3697, https://doi.org/10.5194/gmd-9-3685-2016, 2016. a, b, c
Hari, V., Rakovec, O., Markonis, Y., Hanel, M., and Kumar, R.: Increased future occurrences of the exceptional 2018–2019 Central European drought under global warming, Sci. Rep.-UK, 10, 12207, https://doi.org/10.1038/s41598-020-68872-9, 2020. a
Hetzer, J., Forrest, M., Ribalaygua, J., Prado-López, C., and Hickler, T.: The fire weather in Europe: large-scale trends towards higher danger, Environ. Res. Lett., 19, 084017, https://doi.org/10.1088/1748-9326/ad5b09, 2024. a, b
Hirota, N., Michibata, T., Shiogama, H., Ogura, T., and Suzuki, K.: Impacts of precipitation modeling on cloud feedback in MIROC6, Geophys. Res. Lett., 49, e2021GL096523, https://doi.org/10.1029/2021GL096523, 2022. a
IGN and MASA: Base de Données sur les Incendies de Forêts en France (BDIFF), data.gouv.fr [database], https://www.data.gouv.fr/en/datasets/base-de-donnees-sur-les-incendies-de-forets-en-france-bdiff/ (last access: 30 May 2026), 2025. a, b, c
Jain, P., Castellanos-Acuna, D., Coogan, S. C., Abatzoglou, J. T., and Flannigan, M. D.: Observed increases in extreme fire weather driven by atmospheric humidity and temperature, Nat. Clim. Change, 12, 63–70, https://doi.org/10.1038/s41558-021-01224-1, 2022. a
Jones, M. W., Abatzoglou, J. T., Veraverbeke, S., Andela, N., Lasslop, G., Forkel, M., Smith, A. J. P., Burton, C., Betts, R. A., van der Werf, G. R., Sitch, S., Canadell, J. G., Santín, C., Kolden, C., Doerr, S. H., and Le Quéré, C.: Global and regional trends and drivers of fire under climate change, Rev. Geophys., 60, e2020RG000726, https://doi.org/10.1029/2020RG000726, 2022. a
Kirchmeier-Young, M. C., Gillett, N. P., Zwiers, F. W., Cannon, A. J., and Anslow, F. S.: Attribution of the influence of human-induced climate change on an extreme fire season, Earth's Future, 7, 2–10, https://doi.org/10.1029/2018EF001050, 2019a. a, b
Kirchmeier-Young, M. C., Wan, H., Zhang, X., and Seneviratne, S. I.: Importance of framing for extreme event attribution: the role of spatial and temporal scales, Earth's Future, 7, 1192–1204, https://doi.org/10.1029/2019EF001253, 2019b. a, b, c
Kirchmeier-Young, M. C., Malinina, E., Barber, Q. E., Perdomo, K. G., Curasi, S. R., Liang, Y., Jain, P., Gillett, N. P., Parisien, M. A., Cannon, A. J., Lima, A. R., Arora, V. K., Boulanger, Y., Melton, J. R., Vliet, L. V., and Zhang, X.: Human driven climate change increased the likelihood of the 2023 record area burned in Canada, npj Climate and Atmospheric Science, 7, 316, https://doi.org/10.1038/s41612-024-00841-9, 2024. a
Lanet, M., Li, L., Ehret, A., Turquety, S., and Treut, H. L.: Attribution of summer 2022 extreme wildfire season in Southwest France to anthropogenic climate change, npj Climate and Atmospheric Science, 7, 267, https://doi.org/10.1038/s41612-024-00821-z, 2024. a, b, c, d, e, f, g, h
Leach, N. J., Li, S., Sparrow, S., van Oldenborgh, G. J., Lott, F. C., Weisheimer, A., and Allen, M. R.: Anthropogenic influence on the 2018 summer warm spell in Europe: the impact of different spatio-temporal scales, B. Am. Meteorol. Soc., 101, S41–S46, https://doi.org/10.1175/BAMS-D-19-0201.1, 2020. a, b, c
Liu, Q., Bader, J., Jungclaus, J. H., and Matei, D.: More extreme summertime North Atlantic Oscillation under climate change, Communications Earth and Environment, 6, 474, https://doi.org/10.1038/s43247-025-02422-x, 2025. a
Lloyd, E. A. and Oreskes, N.: Climate change attribution: when is it appropriate to accept new methods?, Earth's Future, 6, 311–325, https://doi.org/10.1002/2017EF000665, 2018. a
Luo, K., Wang, X., de Jong, M., and Flannigan, M.: Drought triggers and sustains overnight fires in North America, Nature, 627, 321–327, https://doi.org/10.1038/s41586-024-07028-5, 2024. a
O'Neill, B. C., Tebaldi, C., van Vuuren, D. P., Eyring, V., Friedlingstein, P., Hurtt, G., Knutti, R., Kriegler, E., Lamarque, J.-F., Lowe, J., Meehl, G. A., Moss, R., Riahi, K., and Sanderson, B. M.: The Scenario Model Intercomparison Project (ScenarioMIP) for CMIP6, Geosci. Model Dev., 9, 3461–3482, https://doi.org/10.5194/gmd-9-3461-2016, 2016. a, b, c
Paciorek, C. J., Stone, D. A., and Wehner, M. F.: Quantifying statistical uncertainty in the attribution of human influence on severe weather, Weather Clim. Extrem., 20, 69–80, https://doi.org/10.1016/j.wace.2018.01.002, 2018. a
Perkins-Kirkpatrick, S. E. and Lewis, S. C.: Increasing trends in regional heatwaves, Nat. Commun., 11, 3357, https://doi.org/10.1038/s41467-020-16970-7, 2020. a
Perkins-Kirkpatrick, S. E., Alexander, L. V., King, A. D., Kew, S. F., Philip, S. Y., Barnes, C., Maraun, D., Stuart-Smith, R. F., Jézéquel, A., Bevacqua, E., Burgess, S., Fischer, E., Hegerl, G. C., Kimutai, J., Koren, G., Lawal, K. A., Min, S.-K., New, M., Odoulami, R. C., Patricola, C. M., Pinto, I., Ribes, A., Shaw, T. A., Thiery, W., Trewin, B., Vautard, R., Wehner, M., and Zscheischler, J.: Frontiers in attributing climate extremes and associated impacts, Frontiers in Climate, 6, 1455023, https://doi.org/10.3389/fclim.2024.1455023, 2024. a
Philip, S., Kew, S., van Oldenborgh, G. J., Otto, F., Vautard, R., van der Wiel, K., King, A., Lott, F., Arrighi, J., Singh, R., and van Aalst, M.: A protocol for probabilistic extreme event attribution analyses, Adv. Stat. Clim. Meteorol. Oceanogr., 6, 177–203, https://doi.org/10.5194/ascmo-6-177-2020, 2020. a, b
Pimont, F., Fargeon, H., Opitz, T., Ruffault, J., Barbero, R., Martin-StPaul, N., Rigolot, E., Rivière, M., and Dupuy, J.-L.: Prediction of regional wildfire activity in the probabilistic Bayesian framework of Firelihood, Ecol. Appl., 31, e02316, https://doi.org/10.1002/eap.2316, 2021. a, b, c, d, e
Pimont, F., Dupuy, J.-L., Ruffault, J., Rigolot, E., Opitz, T., Legrand, J., and Barbero, R.: Projections des effets du changement climatique sur l'activité des feux de forêt au 21ème siècle : Rapport final [Projections of the effects of climate change on forest fire activity in the 21st century: Final report], Technical Expertise Report hal-04149936, INRAE, https://hal.inrae.fr/hal-04149936, in French. HAL Id: hal-04149936 (version 1; deposited 2023-11-16), https://doi.org/10.17180/gpdj-xb05, 2023a. a, b
Pimont, F., Ruffault, J., Opitz, T., Fargeon, H., Barbero, R., Castel-Clavera, J., Martin-StPaul, N., Rigolot, E., and Dupuy, J.: Future expansion, seasonal lengthening and intensification of fire activity under climate change in southeastern France, Int. J. Wildland Fire, 32, 4–14, https://doi.org/10.1071/WF22103, 2023b. a, b, c
Queen, L. E., Dean, S., Stone, D., Jain, P., Renwick, J., Melia, N., and Imada, Y.: Fingerprint of anthropogenic climate change detected in long-term western North American fire weather trends, Communications Earth and Environment, 6, 387, https://doi.org/10.1038/s43247-025-02372-4, 2025. a
Riahi, K., van Vuuren, D. P., Kriegler, E., Edmonds, J., O'Neill, B. C., Fujimori, S., Bauer, N., Calvin, K., Dellink, R., Fricko, O., Lutz, W., Popp, A., Cuaresma, J. C., Samir, K., Leimbach, M., Jiang, L., Kram, T., Rao, S., Emmerling, J., Ebi, K., Hasegawa, T., Havlik, P., Humpenöder, F., da Silva, L. A., Smith, S., Stehfest, E., Bosetti, V., Eom, J., Gernaat, D., Masui, T., Rogelj, J., Strefler, J., Drouet, L., Krey, V., Luderer, G., Harmsen, M., Takahashi, K., Baumstark, L., Doelman, J., Kainuma, M., Klimont, Z., Marangoni, G., Lotze-Campen, H., Obersteiner, M., Tabeau, A., and Tavoni, M.: The Shared Socioeconomic Pathways and their energy, land use, and greenhouse gas emissions implications: an overview, Global Environ. Chang., 42, 153–168, https://doi.org/10.1016/j.gloenvcha.2016.05.009, 2017. a
Ribes, A., Boé, J., Qasmi, S., Dubuisson, B., Douville, H., and Terray, L.: An updated assessment of past and future warming over France based on a regional observational constraint, Earth Syst. Dynam., 13, 1397–1415, https://doi.org/10.5194/esd-13-1397-2022, 2022. a
Rigby, R. A., Stasinopoulos, D. M., Heller, G. Z., and De Bastiani, F.: Distributions for Modeling Location, Scale, and Shape: Using GAMLSS in R, Chapman and Hall/CRC, Boca Raton, https://doi.org/10.1201/9780429298547, 2019. a
Rodrigues, M., Cunill Camprubí, À., Balaguer-Romano, R., Coco Megía, C. J., Castañares, F., Ruffault, J., Fernandes, P. M., and Resco de Dios, V.: Drivers and implications of the extreme 2022 wildfire season in Southwest Europe, Sci. Total Environ., 859, 160320, https://doi.org/10.1016/j.scitotenv.2022.160320, 2023. a
Ruffault, J., Curt, T., Martin-StPaul, N. K., Moron, V., and Trigo, R. M.: Extreme wildfire events are linked to global-change-type droughts in the northern Mediterranean, Nat. Hazards Earth Syst. Sci., 18, 847–856, https://doi.org/10.5194/nhess-18-847-2018, 2018. a
Ruffault, J., Curt, T., Moron, V., Trigo, R. M., Mouillot, F., Koutsias, N., Pimont, F., Martin-StPaul, N., Barbero, R., Dupuy, J.-L., Russo, A., and Belhadj-Khedher, C.: Increased likelihood of heat-induced large wildfires in the Mediterranean Basin, Sci. Rep.-UK, 10, 13790, https://doi.org/10.1038/s41598-020-70069-z, 2020. a, b, c
Sarrau, J. and Yagoub, M. M.: Documentation of Historical Forest Fires and Hazard: Case of Gironde and Les Landes, France, ISPRS Ann. Photogramm. Remote Sens. Spatial Inf. Sci., X-G-2025, 771–778, https://doi.org/10.5194/isprs-annals-X-G-2025-771-2025, 2025. a
Senande-Rivera, M., Insua-Costa, D., and Miguez-Macho, G.: Climate change aggravated wildfire behaviour in the Iberian Peninsula in recent years, npj Climate and Atmospheric Science, 8, 19, https://doi.org/10.1038/s41612-025-00906-3, 2025. a
Smith, C. J., Kramer, R. J., Myhre, G., Alterskjær, K., Collins, W., Sima, A., Boucher, O., Dufresne, J.-L., Nabat, P., Michou, M., Yukimoto, S., Cole, J., Paynter, D., Shiogama, H., O'Connor, F. M., Robertson, E., Wiltshire, A., Andrews, T., Hannay, C., Miller, R., Nazarenko, L., Kirkevåg, A., Olivié, D., Fiedler, S., Lewinschal, A., Mackallah, C., Dix, M., Pincus, R., and Forster, P. M.: Effective radiative forcing and adjustments in CMIP6 models, Atmos. Chem. Phys., 20, 9591–9618, https://doi.org/10.5194/acp-20-9591-2020, 2020. a
Stasinopoulos, D. M. and Rigby, R. A.: Generalized Additive Models for Location Scale and Shape (GAMLSS) in R, J. Stat. Softw., 23, 1–46, https://doi.org/10.18637/jss.v023.i07, 2007. a
Tatebe, H., Ogura, T., Nitta, T., Komuro, Y., Ogochi, K., Takemura, T., Sudo, K., Sekiguchi, M., Abe, M., Saito, F., Chikira, M., Watanabe, S., Mori, M., Hirota, N., Kawatani, Y., Mochizuki, T., Yoshimura, K., Takata, K., O'ishi, R., Yamazaki, D., Suzuki, T., Kurogi, M., Kataoka, T., Watanabe, M., and Kimoto, M.: Description and basic evaluation of simulated mean state, internal variability, and climate sensitivity in MIROC6, Geosci. Model Dev., 12, 2727–2765, https://doi.org/10.5194/gmd-12-2727-2019, 2019. a
Tradowsky, J. S., Philip, S. Y., Kreienkamp, F., Kew, S. F., Lorenz, P., Arrighi, J., Bettmann, T., Caluwaerts, S., Chan, S. C., De Cruz, L., de Vries, H., Demuth, N., Ferrone, A., Fischer, E. M., Fowler, H. J., Goergen, K., Heinrich, D., Henrichs, Y., Kaspar, F., Lenderink, G., Nilson, E., Otto, F. E. L., Ragone, F., Seneviratne, S. I., Singh, R. K., Skålevåg, A., Termonia, P., Thalheimer, L., van Aalst, M., Van den Bergh, J., Van de Vyver, H., Vannitsem, S., van Oldenborgh, G. J., Van Schaeybroeck, B., Vautard, R., Vonk, D., and Wanders, N.: Attribution of the heavy rainfall events leading to severe flooding in Western Europe during July 2021, Climatic Change, 176, 90, https://doi.org/10.1007/s10584-023-03502-7, 2023. a, b
Vallet, L., Schwartz, M., Ciais, P., van Wees, D., de Truchis, A., and Mouillot, F.: High-resolution data reveal a surge of biomass loss from temperate and Atlantic pine forests, contextualizing the 2022 fire season distinctiveness in France, Biogeosciences, 20, 3803–3825, https://doi.org/10.5194/bg-20-3803-2023, 2023. a
van Oldenborgh, G. J., Krikken, F., Lewis, S., Leach, N. J., Lehner, F., Saunders, K. R., van Weele, M., Haustein, K., Li, S., Wallom, D., Sparrow, S., Arrighi, J., Singh, R. K., van Aalst, M. K., Philip, S. Y., Vautard, R., and Otto, F. E. L.: Attribution of the Australian bushfire risk to anthropogenic climate change, Nat. Hazards Earth Syst. Sci., 21, 941–960, https://doi.org/10.5194/nhess-21-941-2021, 2021. a, b
Van Wagner, C. E.: Development and Structure of the Canadian Forest Fire Weather Index System, Tech. Rep. 35, Canadian Forestry Service, Ottawa, ON, Canada, https://ostrnrcan-dostrncan.canada.ca/entities/publication/d96e56aa-e836-4394-ba29-3afe91c3aa6c (last access: 30 May 2026), 1987. a
Vautard, R., van Aalst, M., Boucher, O., Drouin, A., Haustein, K., Kreienkamp, F., van Oldenborgh, G. J., Otto, F. E. L., Ribes, A., Robin, Y., Schneider, M., Soubeyroux, J.-M., Stott, P., Seneviratne, S. I., Vogel, M. M., and Wehner, M.: Human contribution to the record-breaking June and July 2019 heat waves in Western Europe, Environ. Res. Lett., 15, 094077, https://doi.org/10.1088/1748-9326/aba3d4, 2020. a
Vidal, J.-P., Martin, E., Franchistéguy, L., Baillon, M., and Soubeyroux, J.-M.: A 50-year high-resolution atmospheric reanalysis over France with the Safran system, Int. J. Climatol., 30, 1627–1644, https://doi.org/10.1002/joc.2003, 2010. a, b
von Storch, H. and Zwiers, F. W.: Statistical Analysis in Climate Research, Cambridge University Press, Cambridge, https://doi.org/10.1017/CBO9780511612336, 1999. a
Wang, G., Dolman, A. J., and Alessandri, A.: A summer climate regime over Europe modulated by the North Atlantic Oscillation, Hydrol. Earth Syst. Sci., 15, 57–64, https://doi.org/10.5194/hess-15-57-2011, 2011. a
Wang, L., Gu, X., Slater, L. J., Lai, Y., Zheng, Y., Gong, J., Dembélé, M., Tosunoğlu, F., Liu, J., Zhang, X., Kong, D., and Li, J.: Attribution of the record-breaking extreme precipitation events in July 2021 over central and eastern China to anthropogenic climate change, Earth's Future, 11, e2023EF003613, https://doi.org/10.1029/2023EF003613, 2023. a
Wang, X., Wotton, B. M., Cantin, A., Parisien, M.-A., Anderson, K., Moore, B., and Flannigan, M. D.: cffdrs: an R package for the Canadian forest fire danger rating system, Ecological Processes, 6, 5, https://doi.org/10.1186/s13717-017-0070-z, 2017. a
Williams, A. P., Abatzoglou, J. T., Gershunov, A., Guzman Morales, J., Bishop, D. A., Balch, J. K., and Lettenmaier, D. P.: Observed impacts of anthropogenic climate change on wildfire in California, Earth's Future, 7, 892–910, https://doi.org/10.1029/2019EF001210, 2019. a, b
Youngman, B. D.: evgam: An R package for generalized additive extreme value models, J. Stat. Softw., 103, 1–26, https://doi.org/10.18637/jss.v103.i03, 2022. a