the Creative Commons Attribution 4.0 License.
the Creative Commons Attribution 4.0 License.
 | 04 Jun 2026
Monitoring the displacement of large alpine rock slope instabilities with L-band SAR interferometric techniques
Nina Jones
Federico Agliardi
Alessandro De Pedrini
Othmar Frey
Philipp Bernhard
Rafael Caduff
Christian Ambrosi
Andrea Manconi
Large rock slope instabilities develop over long periods and creep slowly over hundreds or thousands of years, until they undergo a “slow to fast” evolution towards catastrophic collapse. Capturing this transition is key to manage related risks, especially considering ongoing climate change scenarios and human activities, that are expected to strongly influence geohazards. However, this is a challenging task due to the complexity of the underlying processes. Long-term, area-wide monitoring of slope movements is essential to understand landslide dynamics and evolution. Despite being widely used for landslide investigations, C-band SAR interferometry datasets suffer from decorrelation in vegetated areas and fast movements, limiting displacement retrieval in alpine regions. Emerging L-band systems, with reduced temporal decorrelation, can complement higher-frequency data by enabling measurements also in vegetated areas and capturing larger displacements. This work aims at analysing the potential benefits and limitations of L-band SAR interferometry applied to alpine landslide monitoring and at understanding if these data can help in mitigating current shortcomings of C-band SAR interferometry. We explore three different scenarios of large alpine slope instabilities in the European Alps, that threaten important economic and societal assets. We perform site-specific analysis, validation and interpretation of L-band SAR interferometry products derived from ALOS-2 PALSAR-2 and SAOCOM-1 satellite imagery, as well as of terrestrial data acquired by the GAMMA L-band SAR (GLSAR) instrument. Our results highlight the contributions of L-band InSAR products to the practical characterisation and interpretation of large rock slope instabilities and provide important recommendations for the recently launched L-band satellite SAR missions ALOS-4 PALSAR-3 and NISAR, as well as for the future L-band satellite SAR mission ROSE-L.
- Article
(28522 KB) - Full-text XML
- BibTeX
- EndNote


Large-scale rock slope instability phenomena are widespread in mountain environments. They significantly influence the long-term topographic, hydrological and sediment transfer characteristics of alpine slopes and have a high potential to threaten human lives, urban settlements, transport infrastructure and other lifelines (Crosta et al., 2013a; Agliardi and Crippa, 2022). Ongoing changes in climatic conditions as well as human activity are expected to have a strong influence on geomorphological processes and to potentially increase the frequency and intensity of catastrophic mass wasting events (Huggel et al., 2011). Accurate investigation and monitoring of mountain processes are therefore considered among the most important current activities in the field of environmental sciences, as they allow to detect indications and/or precursors of changes potentially impacting ecosystems at regional and global scales (Mark and Fernández, 2017).
The European Alps (hereafter referred to as Alps) are a key region of interest, because of their natural, cultural and economic resources for about 14 million inhabitants, and their touristic value attracting approximately 120 million visitors every year (The Alpine Convention: http://www.alpconv.org/, last access: 25 September 2025). Large slope instabilities are widespread in the Alps and are characterised by different mechanisms depending on the lithological, structural and morpho-climatic context of the slopes concerned. Instabilities can creep slowly for thousands of years because of long-term damage accumulation processes and suddenly undergo a progressive evolution towards catastrophic collapses (Riva et al., 2018; Agliardi et al., 2019, 2020; Agliardi and Crippa, 2022). Due to their complexity, often including both creep behaviour and hydro-mechanical coupling (Crosta et al., 2017), the evolution towards failure events is difficult to anticipate. Furthermore, large landslides are usually characterised by complex styles of activity associated with separate slope sectors, expressed through different kinematics and strain partitioning into morpho/structural features (Crippa et al., 2020, 2021).
Surface deformation is a key indicator to assess spatial and temporal changes of landslide phenomena. For this reason, high resolution monitoring data of surface deformation is essential to investigate and interpret changes of landslide kinematics (Crosta et al., 2017; Loew et al., 2016). An important technique to monitor slope displacement is spaceborne Differential Synthetic Aperture Radar Interferometry (DInSAR; Wasowski and Bovenga, 2014). Since 2014, the availability of the ESA Copernicus Sentinel-1 mission has enhanced our capability to detect and monitor surface displacements also in landslide scenarios (Torres et al., 2012). Recently, an increasing number of authors have shown the potential for regional and national scale landslide monitoring by using different approaches exploiting the Sentinel-1 dataset (Barra et al., 2017; Manconi et al., 2018; Dehls et al., 2019; Raspini et al., 2018; Jones et al., 2023). Some intrinsic limitations of the Sentinel-1 system, however, hinder the nominal performance of standard and advanced spaceborne DInSAR methods in alpine settings, especially in cases where continuous monitoring is necessary to protect important economic and societal assets. The main limitations are related to (i) no information in areas affected by layover/shadow (Cigna et al., 2014), (ii) reduced or complete loss of displacement information in densely vegetated areas, as well as during periods of snow coverage, due to the scarce correlation of C-band SAR (wavelength ∼ 5.6 cm), (iii) scarce or null capability of detecting displacements occurring approximately along the satellite track direction (i.e., almost north-south direction), and (iv) inadequate revisit time of 6/12 d to follow the exponential evolution of surface displacements occurring prior to failure, due to phase ambiguity problems (Moretto et al., 2017; Manconi et al., 2018; Manconi, 2021).
Considering these limitations, the use of multiple datasets is envisaged for a more complete analysis of surface displacements of unstable slopes. In particular, L-band (wavelength ∼ 23.5 cm) satellites have the potential to complement the high frequency systems and, under certain conditions, provide information in vegetated areas and for comparatively large displacement rates (e.g., Strozzi et al., 2005; García-Davalillo et al., 2013; Nishiguchi et al., 2017; Ambrosi et al., 2018). ALOS-2 PALSAR-2 and SAOCOM-1 are currently two L-band satellite platforms with a good catalogue of data available over the Alps, however, the acquisition strategy is not systematic. In the case of specific slope instabilities prone to catastrophic failure and that are potentially dangerous for human activities and infrastructure, ground-based methods are the sole alternative to set up a continuous monitoring and early warning system. While in-situ instrumentation such as robotized total stations, GNSS, cameras and extensometers are prominently considered for such applications, terrestrial radar remote sensing systems are becoming increasingly popular for early warning and emergency scenarios (Casagli et al., 2010; Crosta et al., 2013b, 2017; Caduff et al., 2014; Caduff and Strozzi, 2017; Walter et al., 2020). Current terrestrial radar systems are bound to relatively high frequencies, with many of them operating at Ku-band. A few years ago, GAMMA developed a new L-band SAR instrument (the GAMMA L-band SAR, GLSAR) and performed campaigns that demonstrate repeat-pass SAR interferometry for ground motion retrieval from agile platforms (Frey et al, 2019, 2021). Meanwhile, an updated and more compact version has been developed, which can also be mounted on multicopter drones (Frey et al., 2025).
The recent launch of the NISAR SAR satellite mission (NASA-ISRO) in July 2025 and the planned Copernicus Sentinel Expansion ROSE-L SAR satellite mission (ESA) will change the perspective on the use of L-band DInSAR products in landslide application, by providing free SAR imagery with a frequent, regular global coverage. Nevertheless, the full potential of these data in the mapping, activity characterisation, monitoring and failure forecast of alpine rock slope instabilities has still not been quantified in detail, hindering the preparedness of future users to consider such datasets. In this work we perform a detailed analysis of ALOS-2 PALSAR-2 and SAOCOM-1 spaceborne and terrestrial GLSAR data to assess their potential for detecting and monitoring landslide occurrences in the Alps and provide an outlook for future L-band missions and instruments based on our findings.
We explore three different scenarios of large slope instabilities in the Alps that threaten important economic and societal assets, with the support of the authorities responsible for landslide monitoring programmes in the region of Lombardia (Italy), Canton Ticino (Switzerland) and Canton Grisons (Switzerland) (Fig. 1).
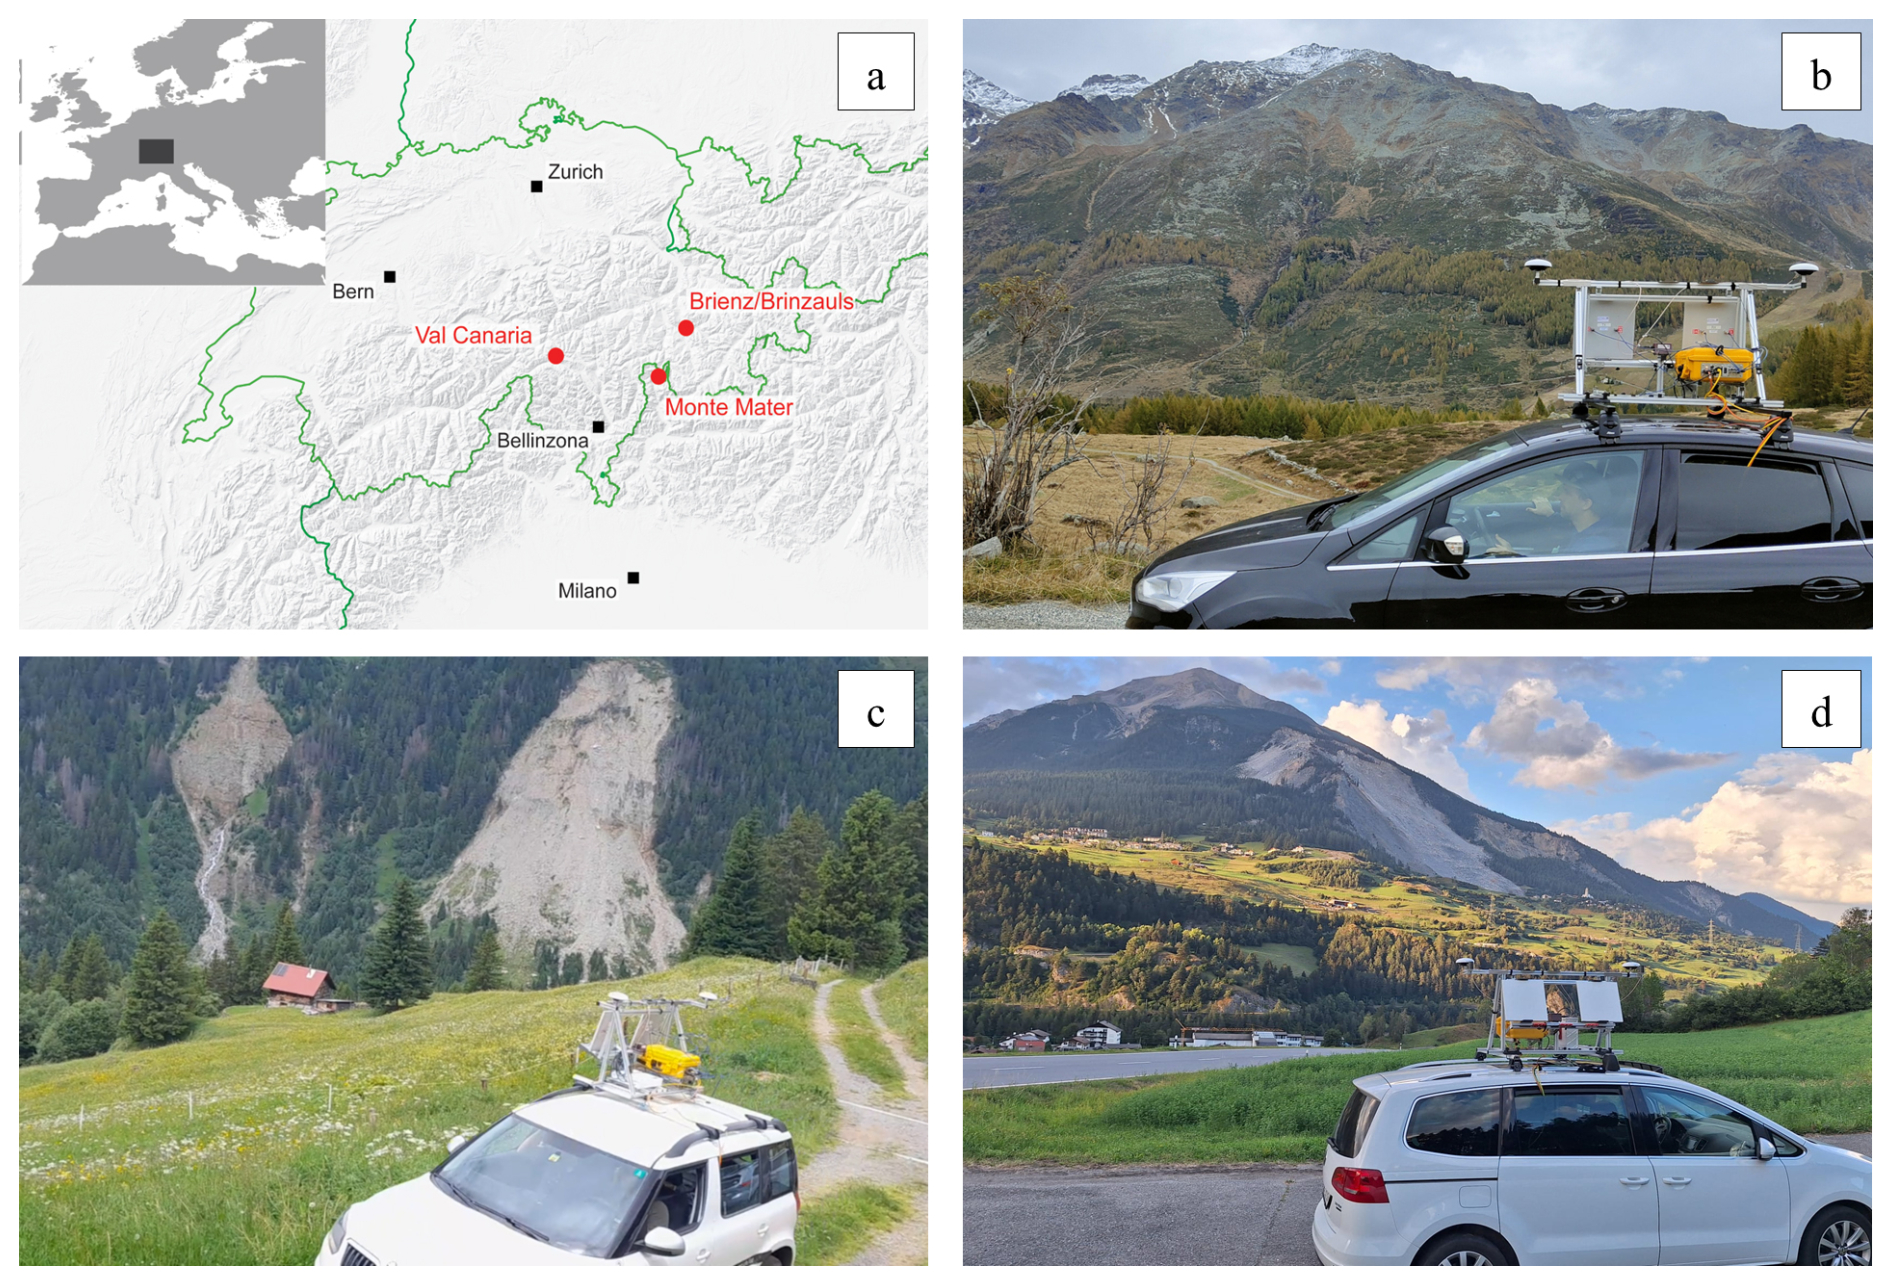
Figure 1(a) Spatial context of the three selected study sites in the European Alps. Val Canaria (Canton Ticino) and Brienz/Brinzauls (Canton Grison) are located in Switzerland, Monte Mater (Lombardia) is located in northern Italy. (b) The Monte Mater rock slope instability in Italy with the GAMMA L-band SAR (GLSAR) instrument mounted on a car in the foreground. (c) The Rütan dei Sass landslide in Val Canaria with the car-borne GLSAR instrument in the foreground (cf. Sect. 3.2). Note that the measuring antennas do not face towards the landslide for illustration purposes only. (d) The Brienz/Brinzauls landslide complex with the car-borne GLSAR instrument in the foreground. Note that the measuring antennas face towards the viewer for illustration purposes only.
2.1 Monte Mater, Lombardia, Italy
The Monte Mater rock slope instability is located in Valle Spluga (north-western Lombardia, Italy) and affects a 1300 m-high glacial valley flank over an approximate area of 3 km2 (Fig. 1b). The slope poses a threat to the village of Madesimo and the ski resort, which represents a significant asset in the area. The area was recognised as active based on inspection of Persistent Scatterer Interferometry (PSI) data and then monitored since 2011 by ARPA Lombardia (i.e., the public agency in charge of landslide monitoring and early warning in Lombardia) through periodical Ku-band Ground-Based (GB) DInSAR and GNSS measurements. Since 2017, the area was investigated in detail by combining in-situ geological, geomorphological and monitoring data and targeted DInSAR products derived from C-band Sentinel-1 imagery (Crippa et al., 2020). The study allowed identifying the nature and rates of the processes underlying the observed movements and provided a conceptual model to support the interpretation of the monitoring data. An active deep-seated gravitational slope deformation (DSGSD) affects the entire slope from toe to ridge, with translational global kinematics and estimated displacement rates of < 3 cm a−1. Two large landslides are nested within the DSGSD with partly rotational movements, strongly damaged rock masses and seasonally variable rates of up to 3–5 mm per month. In the upper part, scree and periglacial deposits move at faster rates up to 10 mm per month.
Monte Mater is an emblematic example of a challenging slope instability for all DInSAR techniques, due to its heterogeneity, variable rates of motion (in space and time) and environmental setting. The common loss of signal coherence in vegetated slope sectors, satellite line-of-sight (LOS) effects on the detection of some components of slow movements, atmospheric effects limiting the number of usable interferograms to analyse temporal trends of displacements and the difficulty of capturing processes occurring at different rates all contribute to the challenges of performing a detailed analysis of the local slope kinematics to support risk management for this class of phenomena. To discriminate processes characterised by different mechanisms and displacement rates, reconstruct segmented sectors and identify temporal trends (linear, seasonal and non-linear), we complement existing interferometric datasets from C-band spaceborne and Ku-band GB SAR platforms with spaceborne and car-borne L-band measurements.
2.2 Val Canaria, Ticino, Switzerland
In Val Canaria, located near Airolo in the upper Leventina valley (Canton Ticino, Switzerland), several landslides affect weak, steeply northwest-dipping metasediments of the Gotthard massif cover, which comprise mainly carbonate and gypsum rocks and display karst phenomena (Seno and Thüring, 2006). The landslides consist of failed and disrupted rock masses on both sides of the valley, with a total involved volume of about 80 million m3. This area is very close to the Gotthard transit corridor, an important infrastructure for road and rail connections between central and southern Europe. In the last twenty years, two main instabilities have been observed, which are well documented by geodetic measurements. These include the rockfall of Ce on the left flank and the rockslide of Rütan dei Sass on the right flank. Both phenomena threaten to dam the Garegna torrent, with the consequent formation of flood waves endangering the cantonal road, highway and railway located in the valley bottom.
Monitoring data for Val Canaria's left flank, following the collapse on 27 October 2009 downstream of Ce that involved about 360 000 m3, include terrestrial DInSAR, GNSS, total station measurements, and terrestrial laser scanning data. Actual displacements are on the order of 10 cm a−1. On the right flank of Val Canaria, the active deep rockslide of the Rütan dei Sass involves a total volume of 10 Mm3 (Fig. 1c). This landslide has been monitored since 1992 with geodetic GNSS and theodolite measurements, which show displacements mainly on the order of few cm a−1. During landslide acceleration following heavy rainfall periods, however, a maximum displacement of 50 to 80 cm d−1 can be observed. Generally, the landslide has a retrogressive tendency, with the accumulation of numerous rockfalls that occur at the main scarp since 2015 and progressively cover the front of the rockslide. The last of these events occurred in 2018, involving a total volume of 170 000 m3. Currently, numerous tension cracks are present in the detachment zone, defining an estimated unstable volume of about 8000 to 10 000 m3. In 2023 to 2024, the geodetic measurements recorded annual displacements between 20 and 30 cm that highlight the active state.
2.3 Brienz/Brinzauls, Grisons, Switzerland
A large landslide complex affects the southern flank of Piz Linard (located in Canton of Grisons, Switzerland) and involves the village of Brienz/Brinzauls, hereafter referred to as Brienz (Fig. 1d). This site is extremely relevant in terms of landslide hazard and risk potential, because it affects an entire slope with direct consequences for the Brienz village, its population and the transportation infrastructures. The landslide recently experienced a rapid acceleration of surface displacements leading to the evacuation of the village at the beginning of May 2023 and a slope failure event with a mass wasting of about 1.2 Mm3 on 15 June 2023. In July 2023, the population of Brienz returned to their homes but were evacuated again in November 2024. In January 2026, after 62 weeks, the evacuation order was lifted, as the mountain movements detected above the village have stabilized.
An extensive in-situ monitoring network has been progressively developed to measure surface deformation of the Brienz landslide complex. This includes a combination of periodic surveys and permanent GNSS stations with a total of more than 80 points, as well as tens of reflectors measured with a robotized total station in operation since 2011 (Manconi et al., 2024a). In addition, surface displacements are also continuously monitored with a permanently installed GB radar (Loew et al., 2024). Surface velocities on the order of several m a−1 are currently reported. These conditions are not ideal for the use of DInSAR, especially for systematic monitoring applications. We investigate this site in detail with particular focus on the accurate identification of surface velocities affecting the different landslide subdomains, also in areas affected by rapid accelerations, the analysis of the surface velocities in 3D, by combining different SAR data sources (satellite and terrestrial), and the identification of strategies for the systematic use of L-band DInSAR products within the current monitoring programme.
We investigate landslide kinematics at the three study sites using standard and advanced DInSAR techniques based on spaceborne L-band datasets from ALOS-2 PALSAR-2 and SAOCOM-1 satellites as well as terrestrial L-band measurements acquired by the car-borne GLSAR. At the time of the results generation, spaceborne L-band data was available until the end of 2023 for ALOS-2 PALSAR-2 and the end of 2024 for SAOCOM-1. A minimum of two car-borne GLSAR measurements exist for each site, with more than 10 measurements available for Brienz.
3.1 ALOS-2 PALSAR-2
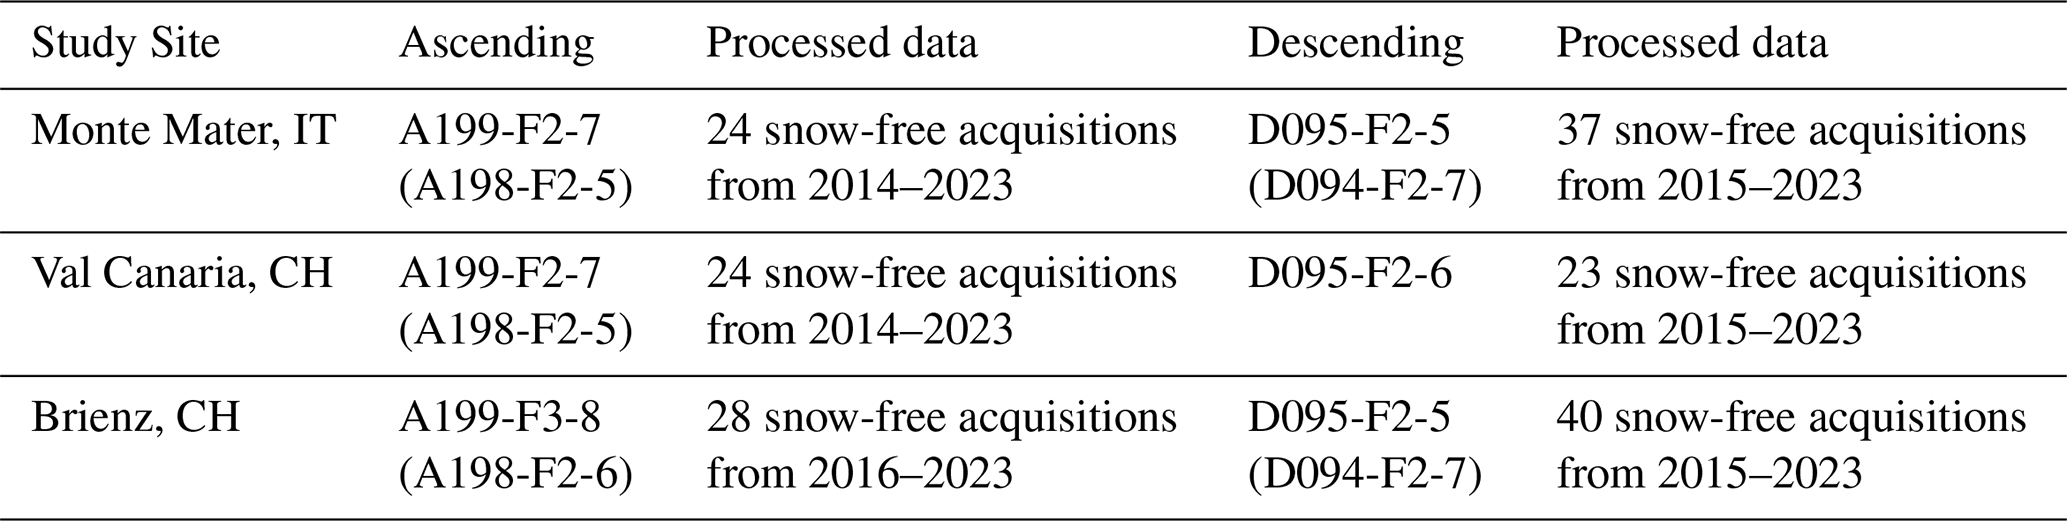
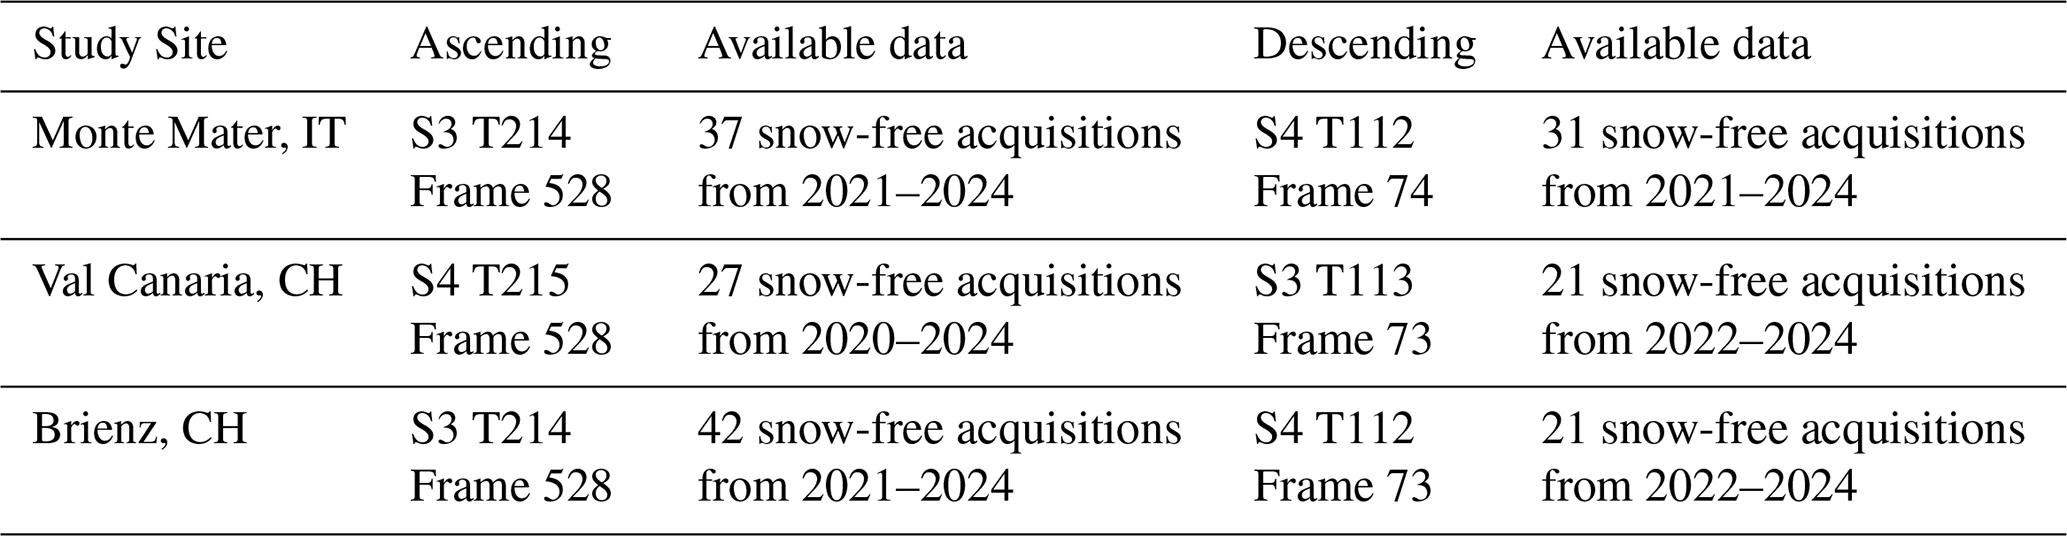
ALOS-2 PALSAR-2 provides L-band data with variable revisit times in Stripmap and ScanSAR mode, both of which are used for this work (Strozzi et al., 2022). Considering the ALOS-2 PALSAR-2 archive over Switzerland, suitable Stripmap mode data stacks in ascending orbit were systematically acquired over most of the Alps, while only specific regions (e.g., including the Brienz study site) were covered systematically by descending orbits. ScanSAR data, however, was acquired in systematic data stacks in descending orbit over the entire Swiss Alps and neighbouring regions, and only sporadically in ascending orbit. For this reason, in this work we combine snow-free Stripmap and ScanSAR data in DInSAR analyses for landslide velocity mapping. The three key study regions are each covered by ascending and descending ALOS-2 PALSAR-2 orbits as shown in Fig. 2. Table 1 lists the orbits and number of acquisitions used for this study. Lists of the ALOS-2 PALSAR-2 acquisitions used in the analysis at each study site are provided in Tables A1, B1, C1 and C2.
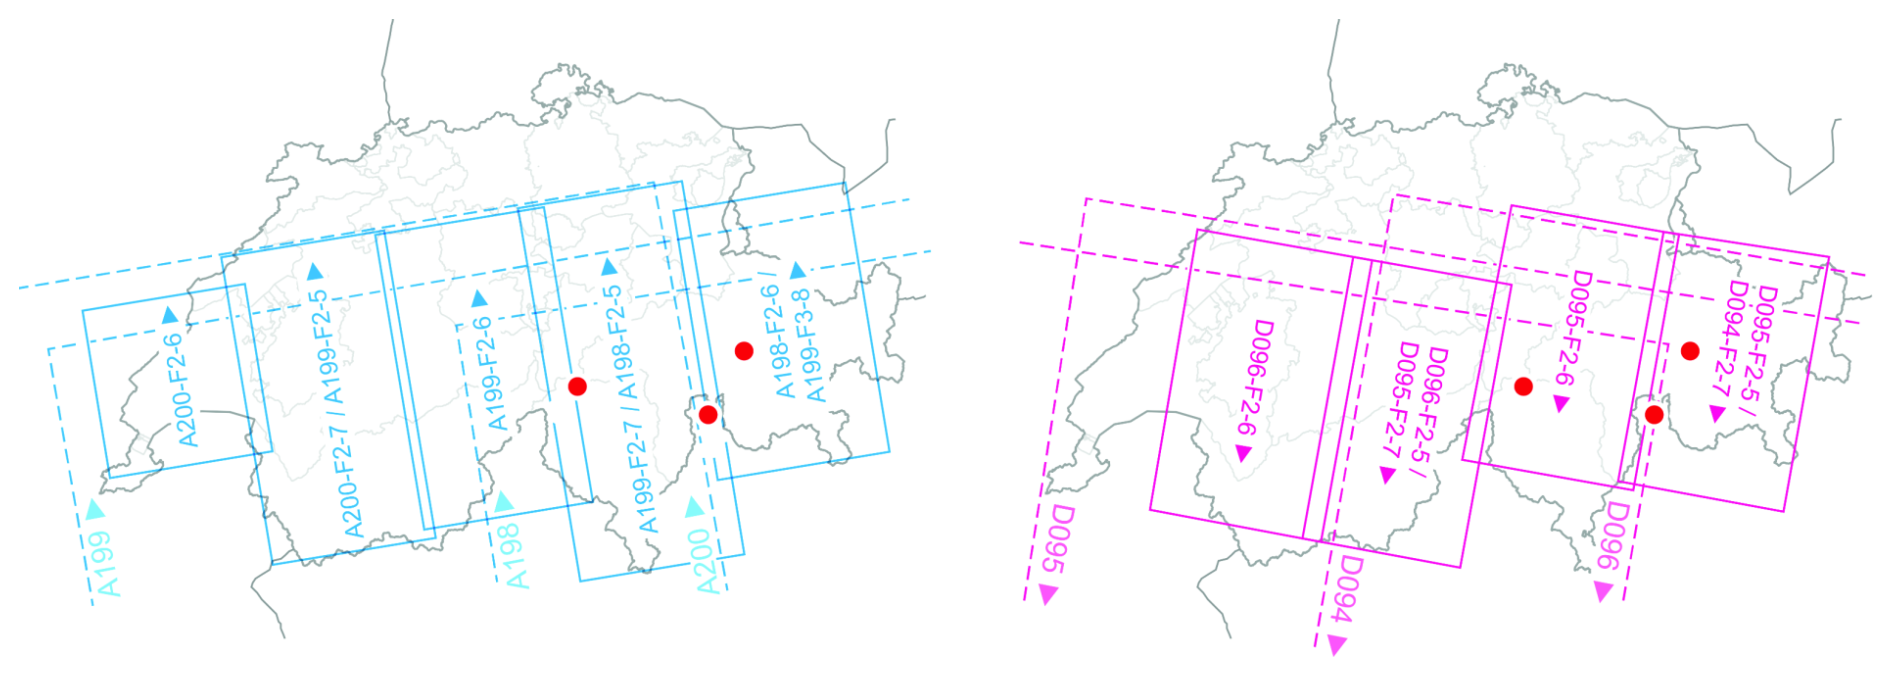
Figure 2Ascending (left) and descending (right) ALOS-2 PALSAR-2 orbits covering the three study regions, which are marked by red dots. ScanSAR orbits are outlined with dashed lines, Stripmap orbits with continues lines.
Table 1Processed ALOS-2 PALSAR-2 data per study site. Orbits in brackets are available as illustrated in Fig. 2 but are not used in the analysis.
3.2 SAOCOM-1
SAOCOM-1 provides L-band single, dual or quad polarization SAR data with a revisit time of 8/16 d (SAOCOM: https://earth.esa.int/eogateway/missions/saocom/, last access: 27 February 2025). We use Stripmap mode data, which are regularly acquired over the Alps. Individual SAOCOM-1 Stripmap scenes are approximately 70 km wide and data acquisitions started at the end of 2020, however, regular acquisitions every 16 or 32 d along ascending and descending orbits are only available since 2023. SAOCOM-1 has a much larger orbital tube than other current satellite SAR missions, such as ALOS-2 PALSAR-2 and Sentinel-1, with perpendicular baselines partly exceeding 1000 m. In addition, inaccuracies in the annotated state vectors of the input single look complex images introduce errors in the baseline calculation, which in turn leave a residual phase contribution in the interferogram. Despite this, very promising DInSAR results can be achieved with SAOCOM-1 Stripmap data (Strozzi et al., 2024; De Luca et al., 2025). The three key study regions are each covered by an ascending and descending SAOCOM-1 orbit as shown in Fig. 3. Table 2 lists the orbits and number of acquisitions used for this study. Lists of the SAOCOM-1 acquisitions used in the analysis at each study site are provided in Tables A1, B1, C1 and C2.
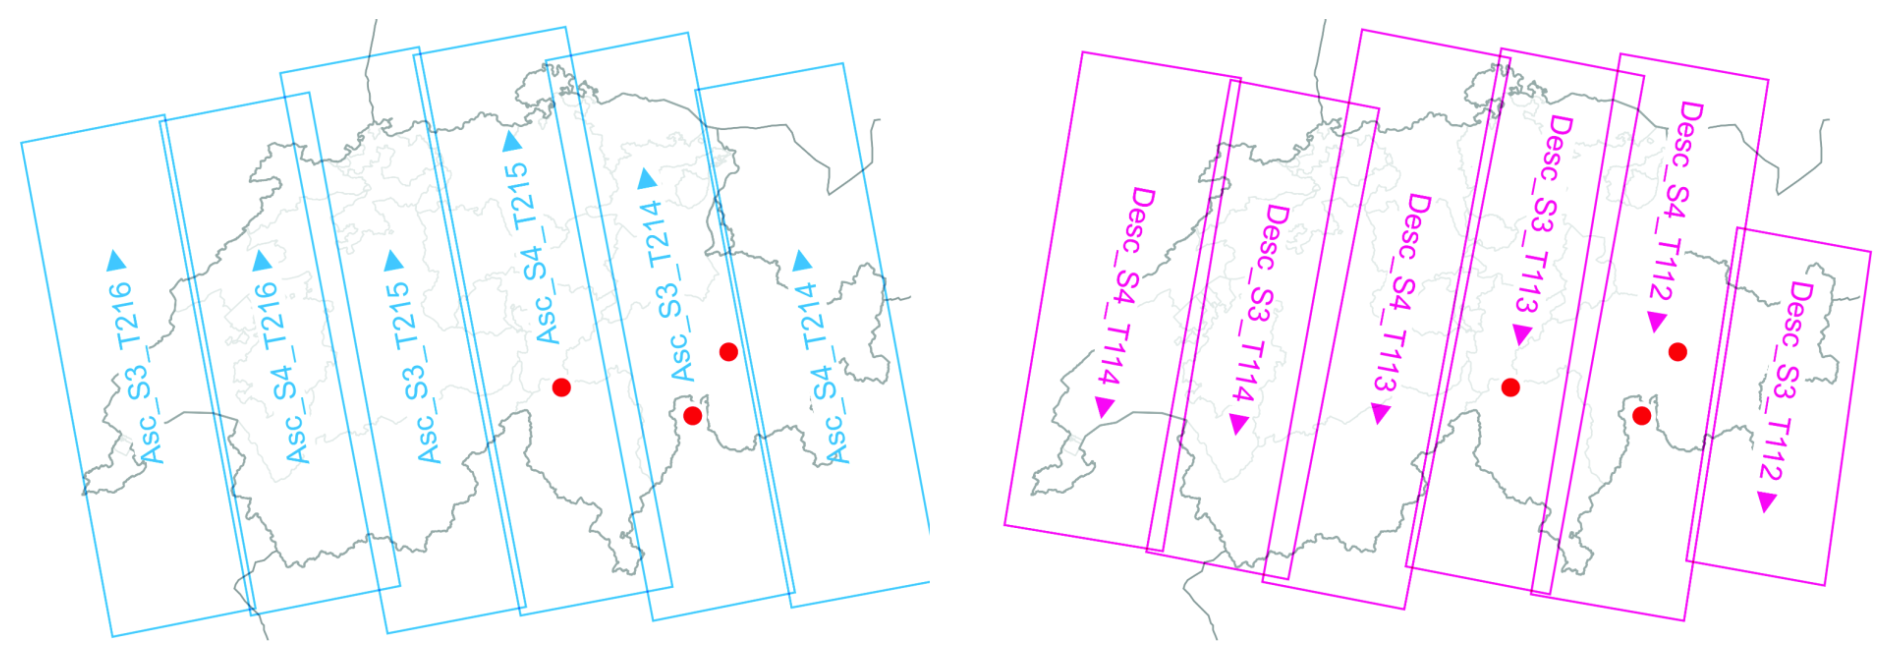
Figure 3Ascending (left) and descending (right) SAOCOM-1 orbits covering the three study regions, which are marked by red dots.
3.3 GAMMA L-band SAR instrument
The GAMMA L-band SAR (GLSAR) instrument can be mounted on terrestrial rail-, car-, or airborne platforms and acquires radar images at L-band with a maximum bandwidth of 200 MHz within 1.2–1.4 GHz (Frey et al., 2019, 2021, 2023, 2024, 2025). For terrestrial analyses at the three study sites, the GLSAR was used in the car-borne configuration to perform repeat-pass interferometry to retrieve LOS displacements on the slope of interest affected by ground motion (Fig. 1b–d). Only 100 MHz bandwidth around a centre frequency of 1.325 GHz were used due to regulatory restrictions. The car-borne SAR system setup includes a GNSS-aided inertial navigation system (INS) and a local ad-hoc GNSS reference station to precisely determine the sensor trajectory during the SAR data acquisition. Using this 3-D sensor trajectory and a digital elevation model of the scene, geocoded single-look complex (GEOSLC) SAR images are produced with a parallelized time-domain back-projection (TDBP) algorithm (Frey et al., 2009) implemented for NVIDIA GPUs (Frey et al., 2014). This ensures that the SAR image is georeferenced with high geodetic accuracy and that topography-corrected differential interferograms can readily be computed from the GEOSLCs. Two measurements each were acquired at Monte Mater on 14 October 2024 and 10 June 2025 and at Val Canaria on 3 July and 23 September 2024. More than 10 measurements are available at Brienz between 2020 and 2024 (Table C3), of which we consider those acquired on 16 and 23 September 2023.
We employ standard and advanced DInSAR methods for ground motion detection and landslide velocity mapping based on the input data as outlined in Sect. 3. Multiple studies have investigated the potential and limitations of these techniques, using mainly C-band Sentinel-1 data (Darvishi et al., 2018; Crippa et al., 2020; Jones et al., 2023; Manconi et al., 2018, 2024a; Strozzi et al., 2018, 2020). In the following work, we analyse the potential of L-band data for DInSAR uses and aim to complement results from higher frequency data. Specifically, we mainly apply PSI to detect ground motion from satellite data on a scale of few centimetres per year (Ferretti et al., 2001; Wegmüller et al., 2003; Bianchini et al., 2013; Cigna et al., 2012). In regions of faster movement and poor coverage with PSI, additional methods such as standard DInSAR, stacking and Small Baseline Subset (SBAS) are applied (Lundgren et al., 2001; Berardino et al., 2002; Schmidt and Bürgmann, 2003; Werner et al., 2012). Where available, we combine data from both ascending and descending orbits for maximum spatial coverage of the three key study regions.
4.1 Persistent Scatterer Interferometry
PSI allows surface movement to be detected at millimetre scale accuracy. The method is based on the selection of temporally coherent pixels termed Persistent Scatterers (PS) to measure surface displacement in a stack of unwrapped differential interferograms (Ferretti et al., 2001; Wegmüller et al., 2003; Colesanti and Wasowski, 2006). Resulting displacement maps allow the extraction of time series for individual points at high resolution and accuracy (Crosetto et al., 2009). As PS are typically smaller than the resolution cell size, PSI is a suitable method also for sensors with large spatial baselines such as SAOCOM-1. We perform PSI according to the Interferometric Point Target Analysis (IPTA) algorithm, which selects PS in two approaches (Wegmüller et al., 2003). A first selection is performed based on spectral diversity, followed by a second selection based on the intensity temporal variability. This approach exploits both the spectral and intensity properties of the input images. The resulting PS are merged into a single comprehensive candidate list and used in a subsequent point target quality analysis in differential interferograms, which filters PS based on selected spatial and/or temporal coherence thresholds. The displacement at these point locations is then derived in an iterative two-dimensional regression process and in reference to a point of known or assumed zero displacement. This reference point is selected manually in areas considered to be stable. The final geocoded displacement map allows extraction of velocity time series for individual points to show the temporal evolution of displacement in specific areas of interest.
4.2 Standard DInSAR
Standard DInSAR encompasses the generation of differential interferograms by extracting the difference in phase information of two SAR images covering largely the same area and acquired at different times (Bürgmann et al., 2000). By removal of the topographic phase through use of an external DEM, a value of surface displacement along the satellite's LOS is derived in the resulting image (Wasowski and Bovenga, 2014). Removal of atmospheric disturbances is performed empirically with a high pass filter which attenuates the low-frequency elevation-dependent atmospheric components and preserves the high-frequency components of the landslide motion. Absolute displacement values in the LOS direction are extracted through phase unwrapping of the modulo 2π ambiguity, typically by applying a minimum cost flow algorithm (Costantini, 1998; Werner and Wegmüller, 2002). A reference point of known or assumed zero displacement is used for processing and typically chosen in stable rock outside the identified moving area. Unwrapping procedures can introduce errors particularly in regions of high topographic relief, such as the Alps (Berardino et al., 2002; Darvishi et al., 2018). Areas of low coherence due to fast movement or vegetation/snow cover may not be successfully unwrapped in differential interferograms and can introduce an over- or underestimation of surface movement in subsequent displacement maps. By choosing specific, small areas of interest for unwrapping procedures, associated errors can be minimised. While unwrapped differential interferograms are used as the input for advanced DInSAR methods, we also considered wrapped differential interferograms for the inspection of areas for which PSI does not provide information, e.g. in gaps caused by interferometric decorrelation due to large motion. Wrapped differential interferograms show the derived surface displacement as coloured fringe cycles on the order of a 2π ambiguity, relating to half the satellite wavelength (i.e., 11.8 cm for L-band sensors).
4.3 DInSAR Stacking
Stacking approaches combine unwrapped differential interferograms of variable temporal and spatial baselines over a specific period of interest to obtain average displacement maps within that time frame (Lundgren et al., 2001). Constraints on the spatial baselines are not strictly necessary but can be applied to increase overall coherence. Stacking is particularly suitable for seasonal and annual deformation analyses and typically requires the exclusion of winter images in the Alps due to extensive snow cover and resulting loss of coherence. This approach ensures sufficiently high coherence but introduces data gaps in the resulting displacement time series. Stacking is a popular complementary method to DInSAR techniques that detect millimetre-scale movements such as PSI and has been applied in an extensive study of C-band Sentinel-1 data at Brienz (Manconi et al., 2024a).
4.4 Small Baseline Subset
SBAS combines unwrapped differential interferograms of small spatial and temporal baselines to ensure that spatial coherence is maintained (Berardino et al., 2002; Wasowski and Bovenga, 2014). This is particularly critical for sensors with large and variable spatial baselines such as SAOCOM-1. SBAS is particularly suitable for seasonal displacement analyses but can also be implemented to study longer-term displacement. As for PSI, reference points of known or assumed zero displacement are defined for each of the three study regions. Displacement values are extracted from the stacks of unwrapped differential interferograms in reference to this (stable) point and displayed in displacement maps and time series, showing the progressive change in LOS surface deformation for the assessed time period. Masking is applied to remove areas of low coherence, e.g., due to snow/vegetation cover or very fast movements that exceed the phase aliasing threshold of . Large-scale spatial filtering removes errors related to large-scale atmospheric effects.
4.5 GAMMA L-band SAR instrument
Terrestrial DInSAR data is acquired through use of the car-borne GLSAR system (see Sect. 3.3). It is employed locally on one or several days and measures surface displacement within a time interval of a few hours, days or longer time frames, depending on the velocity of the observed mass movement. A minimum of two independent acquisitions is required to compute topography-corrected differential interferograms. As for satellite data, DInSAR data displays ground movement in wrapped format and displacement maps are generated after phase unwrapping. A reference point of known or assumed zero displacement is used for processing and typically chosen in stable rock outside the identified moving area. Removal of atmospheric disturbances is performed empirically with a high pass filter which attenuates the low-frequency atmospheric components (mainly range and elevation dependent) and preserves the high-frequency components of the landslide motion.
5.1 Monte Mater, Lombardia, Italy
The PSI results at the Monte Mater study site for descending ALOS-2 PALSAR-2 and SAOCOM-1 data are illustrated in Fig. 4. The landslide is clearly identified, with areas depicted as red when moving away from the satellite and as blue when moving towards the satellite. The point density is slightly higher in SAOCOM-1, particularly in the upper parts of the slope, due to its higher temporal sampling rate of acquisitions within a shorter observation time interval. However, SAOCOM-1 also shows higher levels of noise in the surrounding stable areas. This is due to the shorter observation time interval of SAOCOM-1 (2021–2024) compared to ALOS-2 PALSAR-2 (2015–2023). The Monte Mater site is very well illuminated by satellite data of the descending orbit. For the ascending orbit, the satellite LOS and the direction of motion are approaching a perpendicular direction. Large areas are affected by layover, especially in SAOCOM-1 images, and motion is observed towards the satellite. The PSI results at the Monte Mater study site for ascending ALOS-2 PALSAR-2 and SAOCOM-1 data are illustrated in Fig. A1.
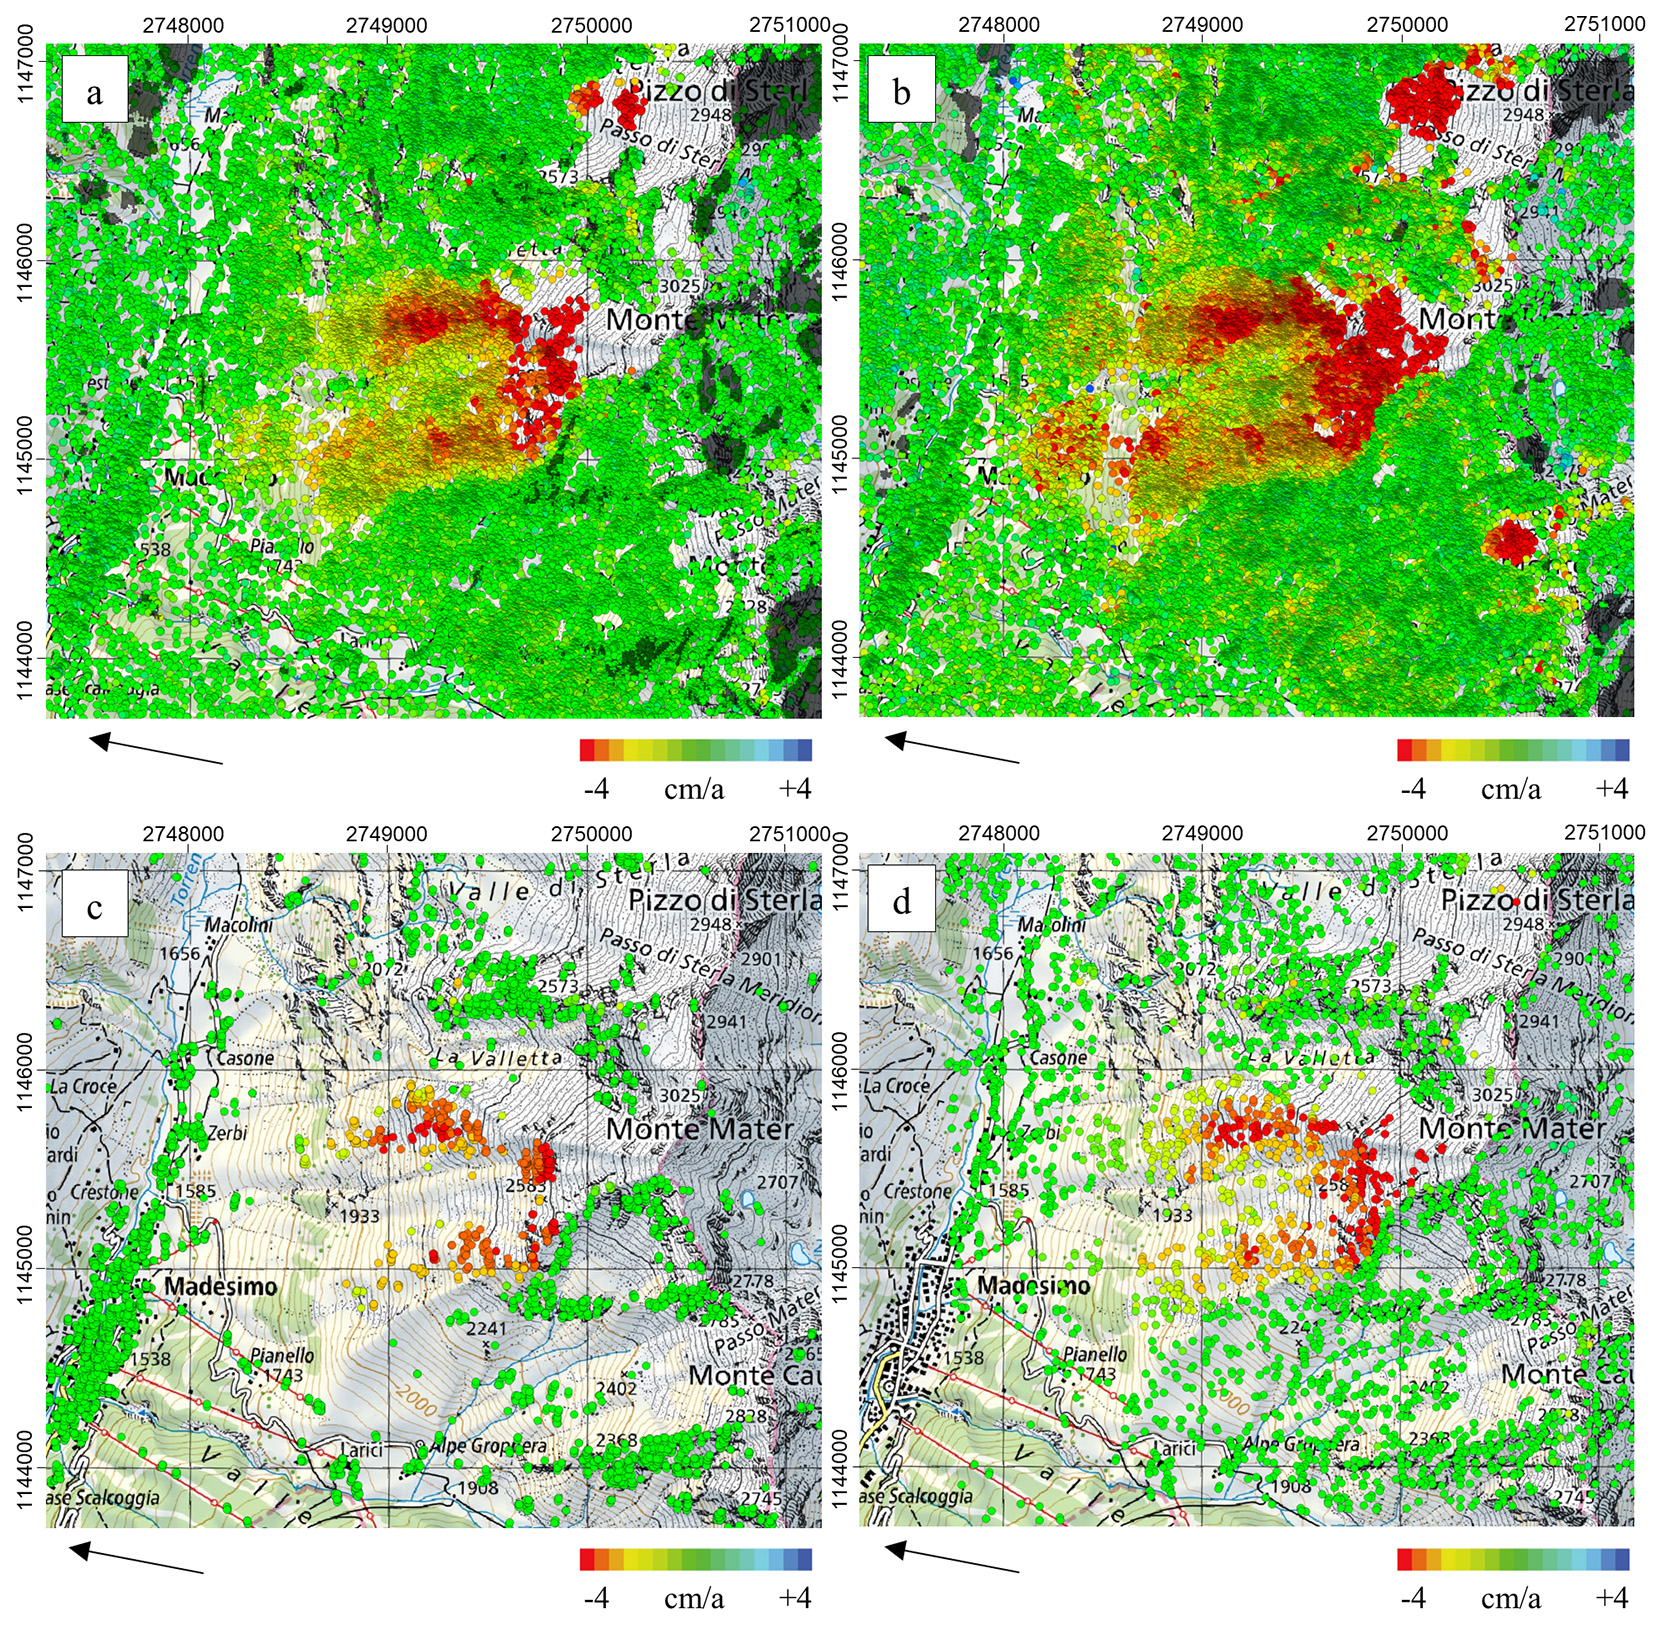
Figure 4Results of PSI analysis at Monte Mater with ALOS-2 PALSAR-2 for the time period 2015–2023 (a), SAOCOM-1 for the time period 2021–2024 (b), Sentinel-1 for the time period 2018–2022 from the European Ground Motion Service (c; EGMS; https://egms.land.copernicus.eu/) and SqueeSAR for the time period 2015–2017 (d; Crippa et al., 2021). The arrows indicate the satellite LOS direction for the descending orbit. Layover/shadow is shown in black. Image background is the Swiss National Map.
C-band datasets using Sentinel-1 acquisitions at this site are available through the European Ground Motion Service (EGMS: https://egms.land.copernicus.eu/; last access: 22 April 2025) for the period 2018–2022 and from SqueeSAR for the period 2015–2017 (Crippa et al., 2021), and are illustrated in Fig. 4c and d. The high density of PS in L-band and their spatial continuity, granted by a higher interferogram coherence in all the landcover conditions, allow a better delineation of the kinematic domains forming the Monte Mater landslide complex, especially the southern nested rockslide and the upper part of the DSGSD. L-band data also better illuminate the internal heterogeneity and toe activity of the nested landslides.
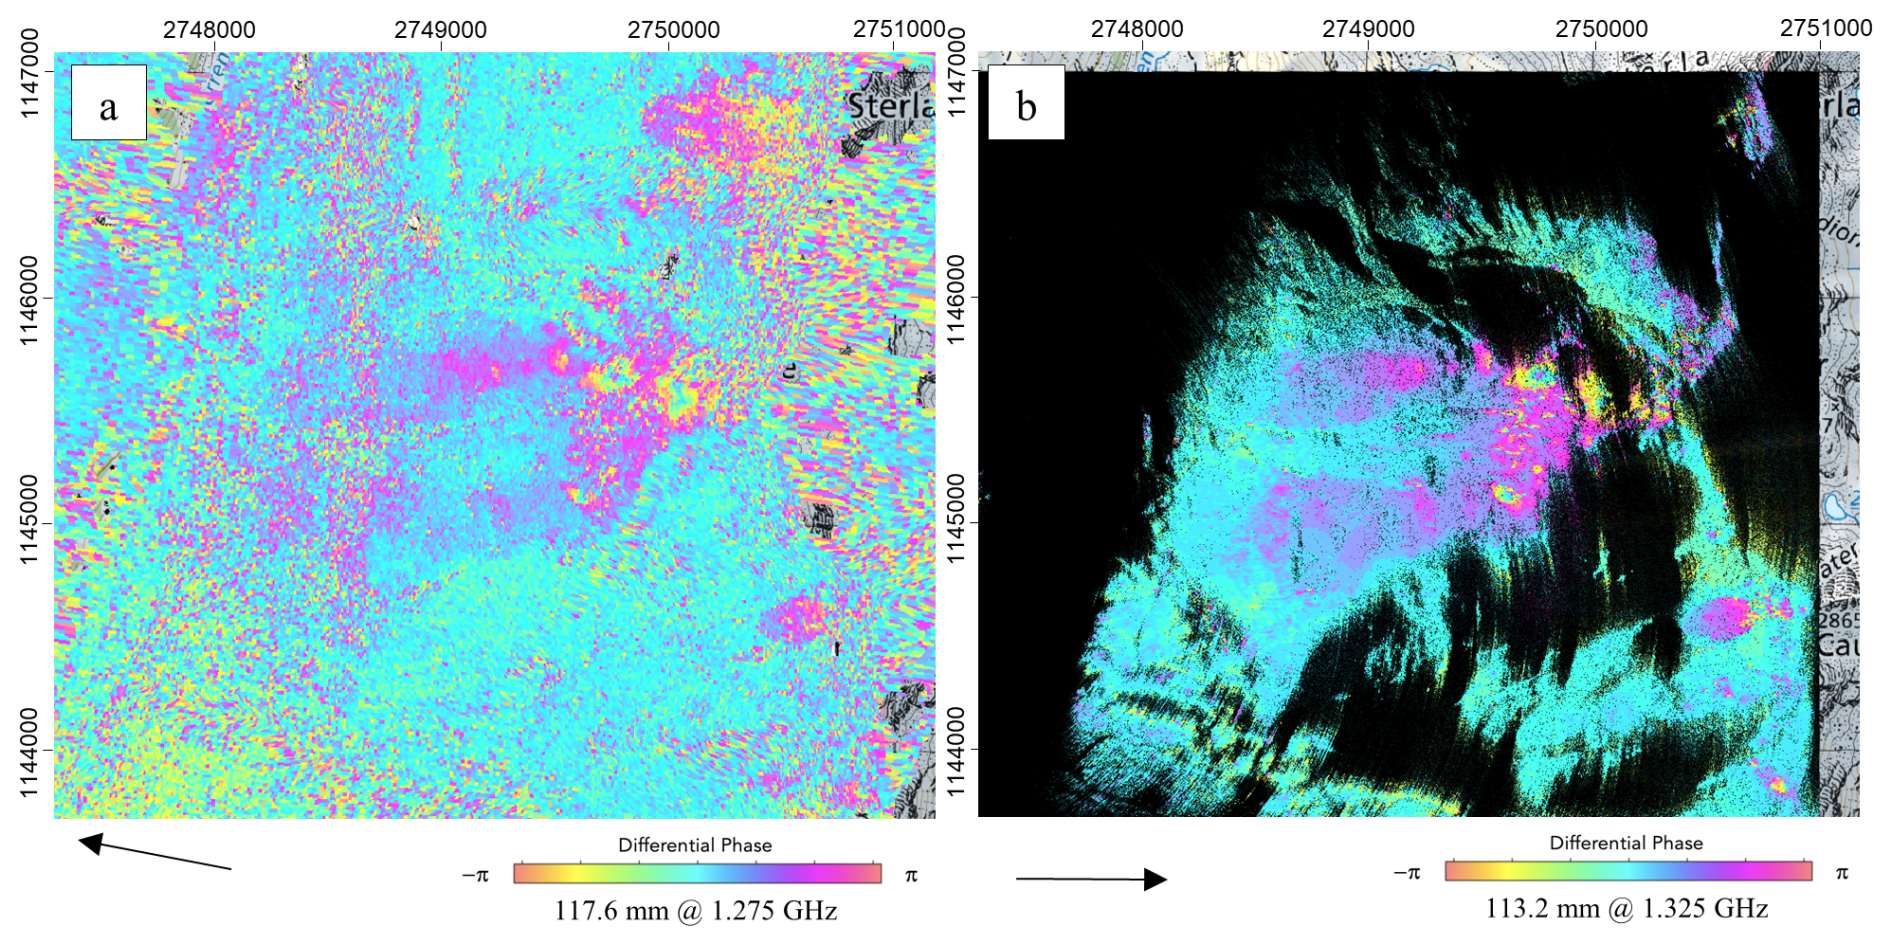
Figure 5Descending SAOCOM-1 interferogram over 14 October 2024–11 June 2025 (a) and car-borne GLSAR interferogram over 14 October 2024–10 June 2025 (b) at Monte Mater. The arrows indicate the satellite and terrestrial LOS directions. Layover/shadow is shown in transparent (a) and black (b). Image background is the Swiss National Map.
A wrapped differential interferogram for descending SAOCOM-1 data from 14 October 2024 to 11 June 2025 is shown in Fig. 5a and supports and complements the PSI results. Despite a temporal baseline of 240 d, very high coherence is maintained, allowing to retrieve spatially distributed information. This translates into the ability to capture different associated processes acting on different temporal rates. In particular, the L-band wrapped differential interferogram clearly indicates high displacement rates in the upper parts of the slope as visualised by multiple fringe cycles or even decorrelation. Terrestrial measurements of the Monte Mater landslide were acquired on 14 October 2024 and 10 June 2025 with the car-borne GLSAR. Several repeat-pass SAR measurements were acquired on each day within a total time span of approximately one hour. The averaged interferogram is shown in Fig. 5b and indicates good overall coherence. The landslide is clearly identified and, as for descending SAOCOM-1 data from nearly the same period in Fig. 5a, indicates high displacement rates in the upper parts of the slope, but with higher spatial resolution and from a different look direction.
5.2 Val Canaria, Ticino, Switzerland
Satellite L-band PSI results at the Val Canaria study site are illustrated in Fig. 6a and b, with SAOCOM-1 overlain on ALOS-2 PALSAR-2, for ascending and descending orbits. The results show overall high point coverage with some data gaps remaining on both sides of the valley. SAOCOM-1 generally increases the point density compared to ALOS-2 PALSAR-2, due to its higher temporal sampling rate of acquisitions within a shorter observation time interval. This is particularly apparent in descending orbit, where several moving areas are detected. PSI results for only ALOS-2 PALSAR-2 and SAOCOM-1 are provided in Figs. B1 and B2. Sentinel-1 C-band PSI results, available through Geoportale Ticino (https://map.geo.ti.ch/; last access: 22 April 2025), are presented in Fig. 6c and d and provide very limited coverage. Especially in forested sectors the landslide detection and characterisation are scarce.
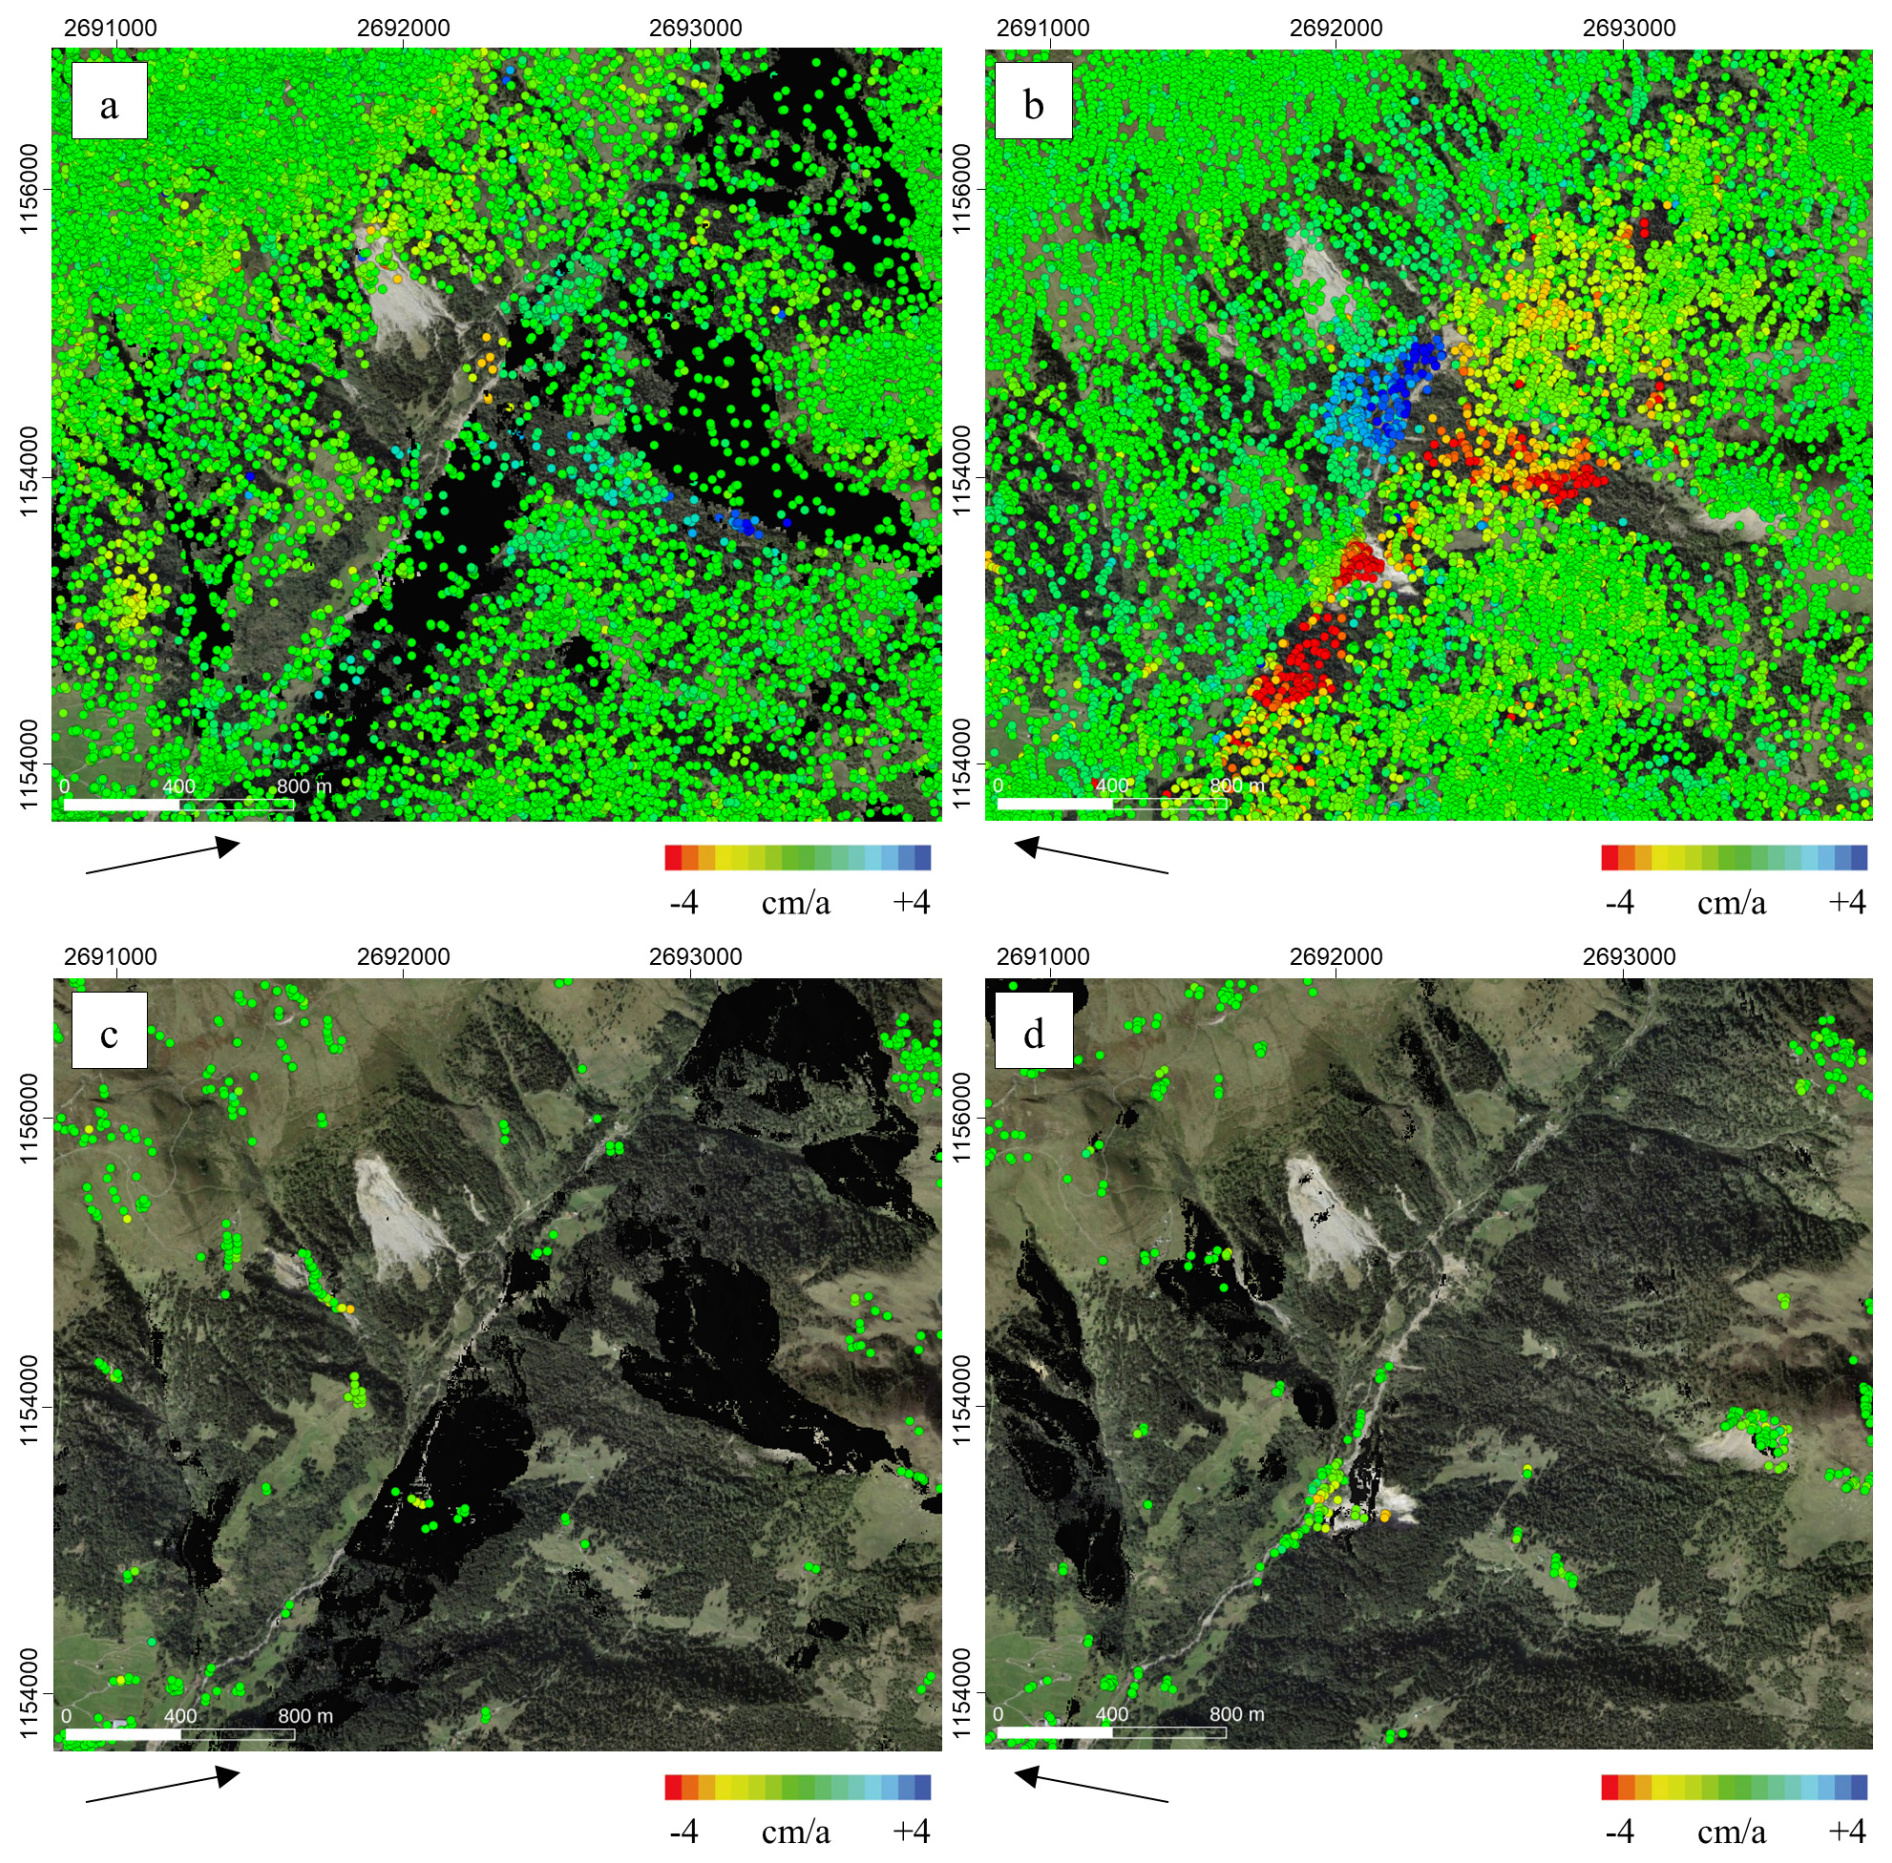
Figure 6Results of PSI analysis at Val Canaria with ascending SAOCOM-1 for the time period 2020–2024 overlain on ALOS-2 PALSAR-2 for the time period 2014–2023 (a), with descending SAOCOM-1 for the time period 2022–2024 overlain on ALOS-2 PALSAR-2 for the time period 2015–2023 (b) and with ascending (c) and descending (d) Sentinel-1 for the time period 2015–2019 (Geoportale Ticino: https://map.geo.ti.ch/). The arrows indicate the satellite LOS direction. Layover/shadow is shown in black. Image background is SWISSIMAGE.
The main landslide of interest on the southeast-facing slope of the study site is only partly detected in descending orbit and not at all in ascending orbit. This data gap and lack of displacement information likely indicate conditions of high velocities that cannot be resolved with the PSI technique even at L-band, as the underlying orthophoto shows a scree slope that is partly free of vegetation at this location. SAOCOM-1 wrapped differential interferograms as illustrated in Fig. 7 support the PSI results and confirm high displacement rates on the affected slope, with a minimum of one fringe cycle per temporal baseline.
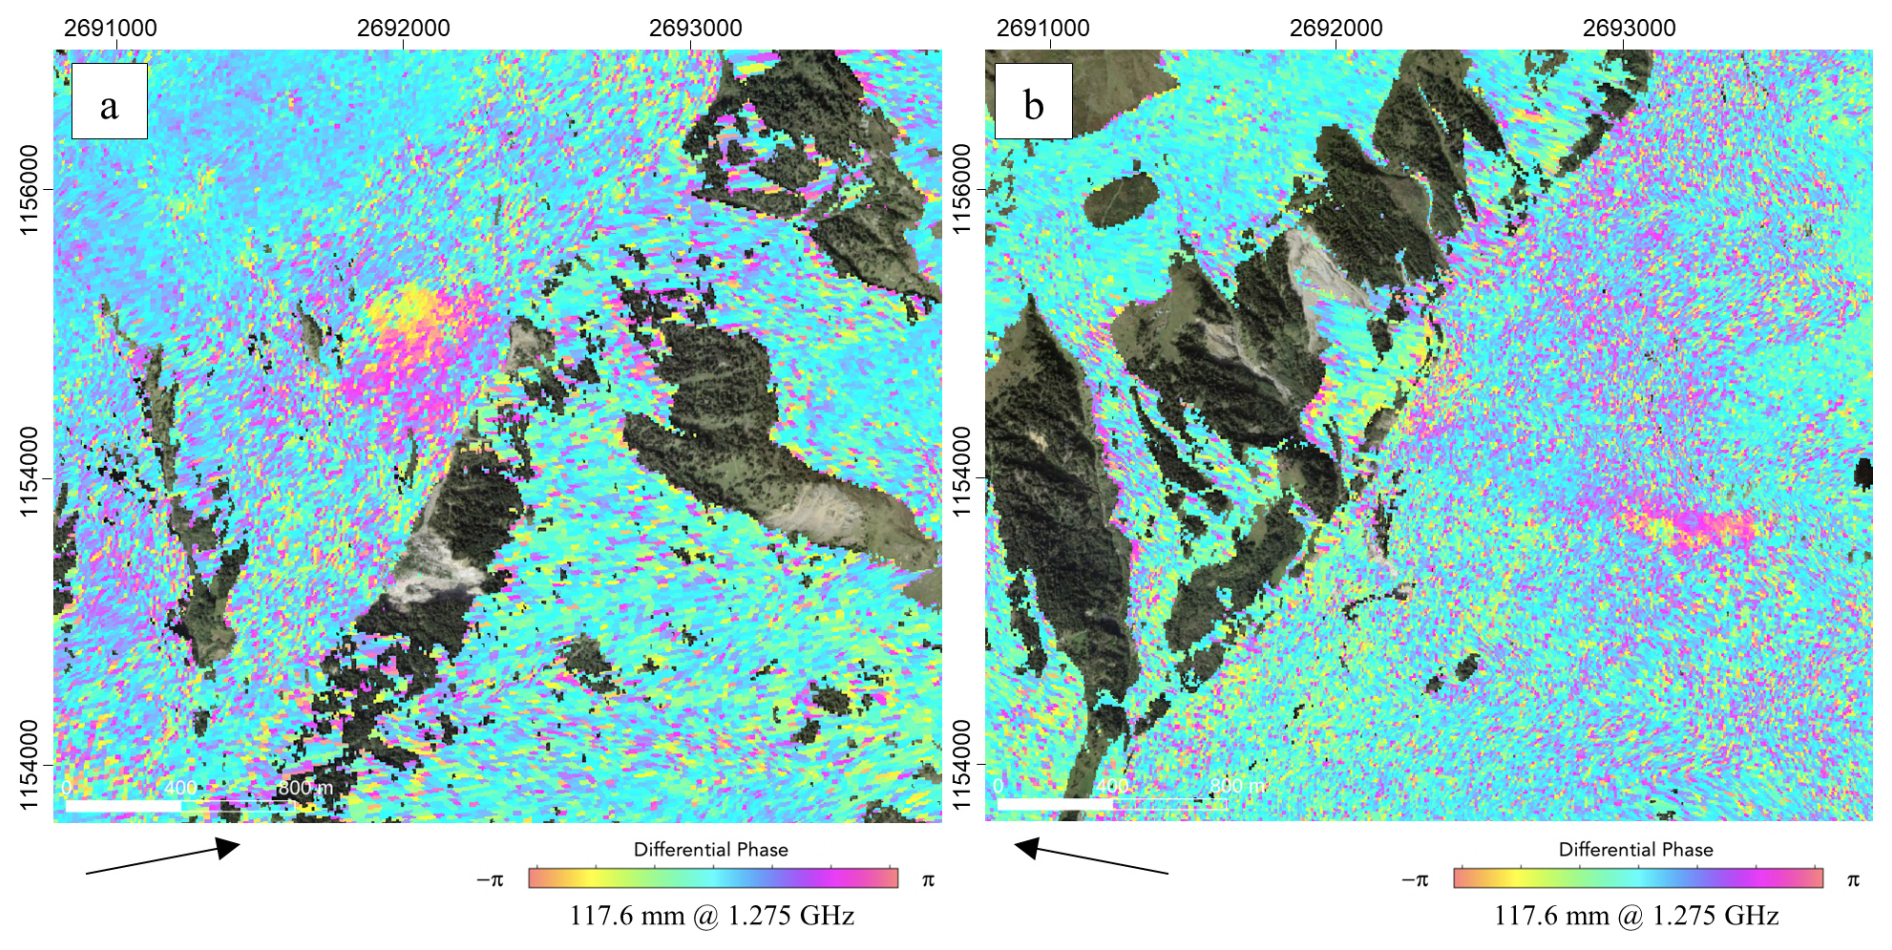
Figure 7Ascending SAOCOM-1 interferogram over 24 July–12 October 2024 (a) and descending SAOCOM-1 interferogram over 25 August 2022–7 October 2023 (b) at Val Canaria. The arrows indicate the satellite terrestrial LOS directions. Areas of layover/shadow are shown as transparent. Image background is SWISSIMAGE.
To complement the PSI results and fill data gaps related to fast surface movements, alternative advanced DInSAR techniques are considered. Ascending SAOCOM-1 data was used for SBAS with perpendicular baselines shorter than 750 m and acquisition time intervals of less than 270 d to enable the detection of higher velocities while maintaining coherence. The results highlight that part of the southeast-facing slope at Val Canaria moves with estimated velocities of > 20 cm a−1, clearly exceeding the detectable threshold with PSI (Fig. 8a). A corresponding LOS displacement time series (Fig. 13e discussed in Sect. 6.2) indicates non-linear motion that appears to have accelerated in 2021 and 2024. Terrestrial measurements of the southeast-facing slope were acquired on 3 July and 23 September 2024 with the car-borne GLSAR. The displacement map is shown in Fig. 8b and indicates good overall coherence and velocities on the order of 10 cm in nearly three months. The landslide is clearly detected with a sharp delineation of its upper extent, as also visible for the SAOCOM-1 SBAS results of Fig. 8a.
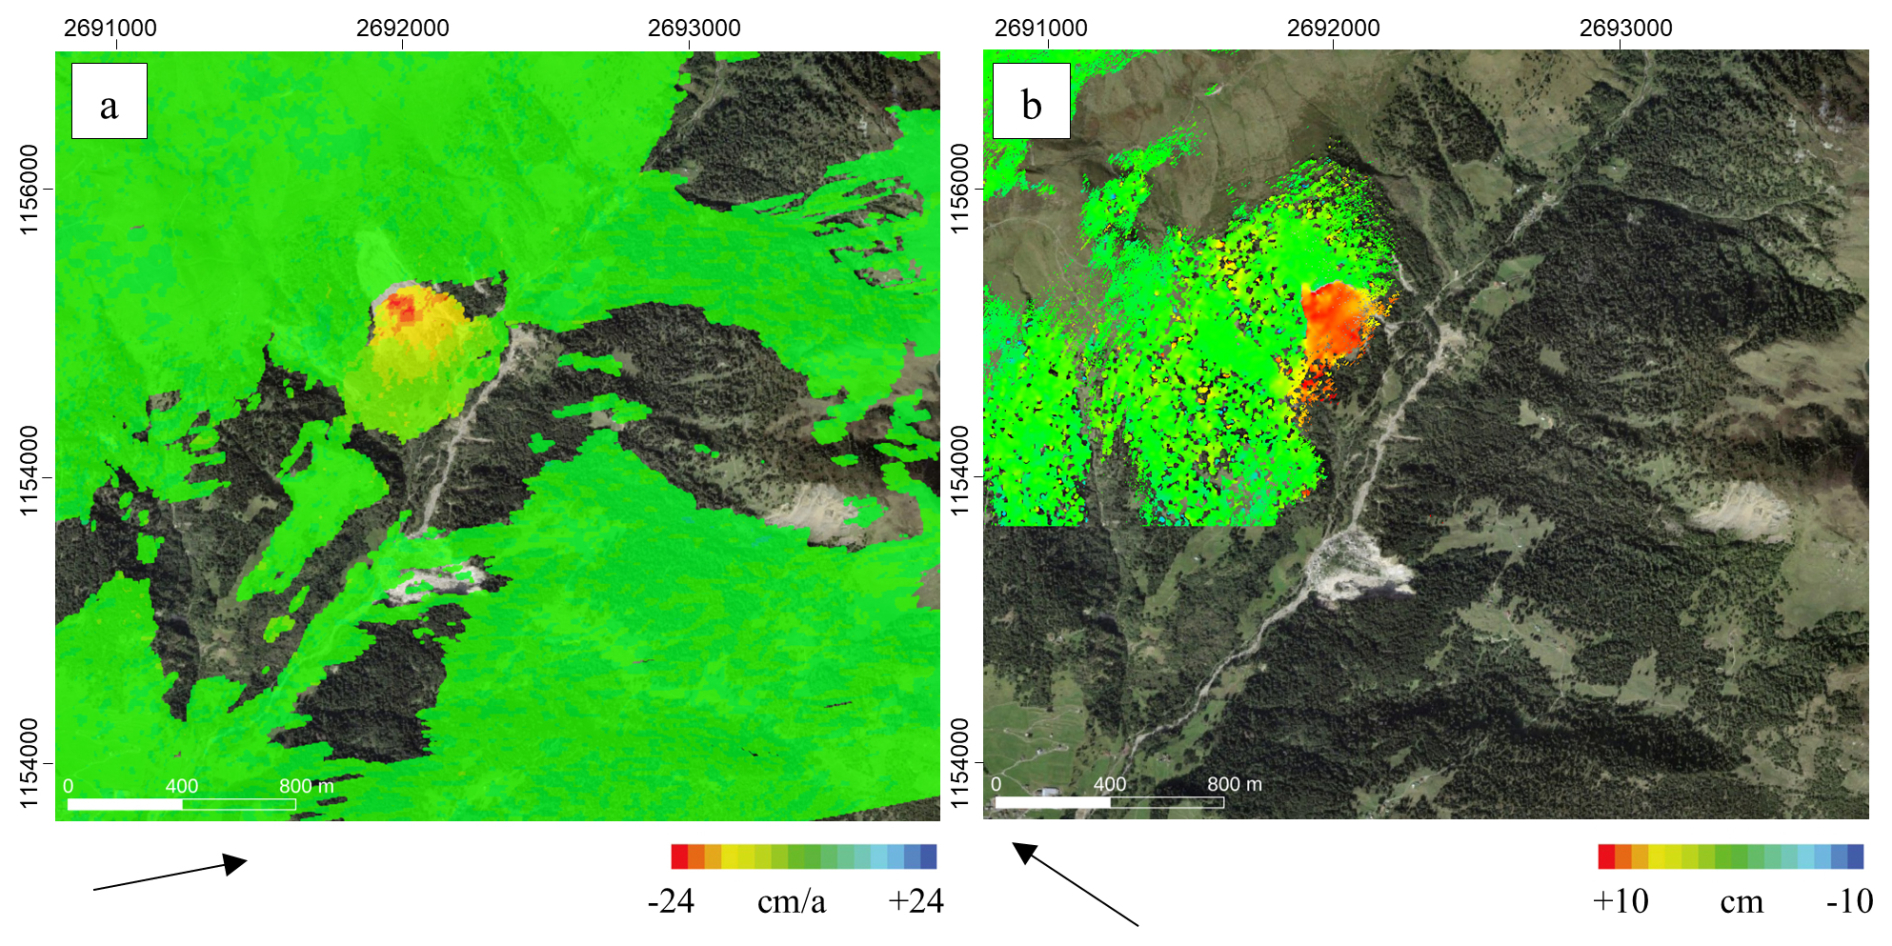
Figure 8SBAS results from ascending SAOCOM-1 for the time period 2020–2024 (a) and car-borne GLSAR LOS displacement map between 3 July and 23 September 2024 (b). The arrows indicate the satellite and terrestrial LOS directions. Areas of layover/shadow are shown as transparent. Image background is SWISSIMAGE.
5.3 Brienz/Brinzauls, Grisons, Switzerland
ALOS-2 PALSAR-2 PSI results at the Brienz study site are shown in Fig. 9a and b for ascending and descending orbits. The point density is overall very high, with two large moving areas detected further northwest near Lantsch/Lenz as well as to the east of Brienz. The Brienz landslide itself, however, which includes the slopes above and surrounding the village of Brienz, remains a significant data gap. This is due to the very fast surface displacement observed here that cannot be resolved with PSI even at L-band. SAOCOM-1 PSI results do not provide additional information despite the satellite's higher temporal sampling rate, as shown in Fig. C1. Overall, they are noisier and contain less information at higher altitudes compared to ALOS-2 PALSAR-2, due to the shorter total observation interval, lower data availability (e.g., when comparing with the Monte Mater study site) and use of winter data without snow cover over Brienz at low altitudes. C-Band cannot provide further information under forested areas and in rapidly decorrelating slopes, as shown with Sentinel-1 PSI results in Fig. 9c and d for ascending and descending orbits (Strozzi et al., 2022). Additionally, due to the near-polar flight path of both satellites, the detection sensitivity on the overall south-facing orientation of the slope is generally lower.
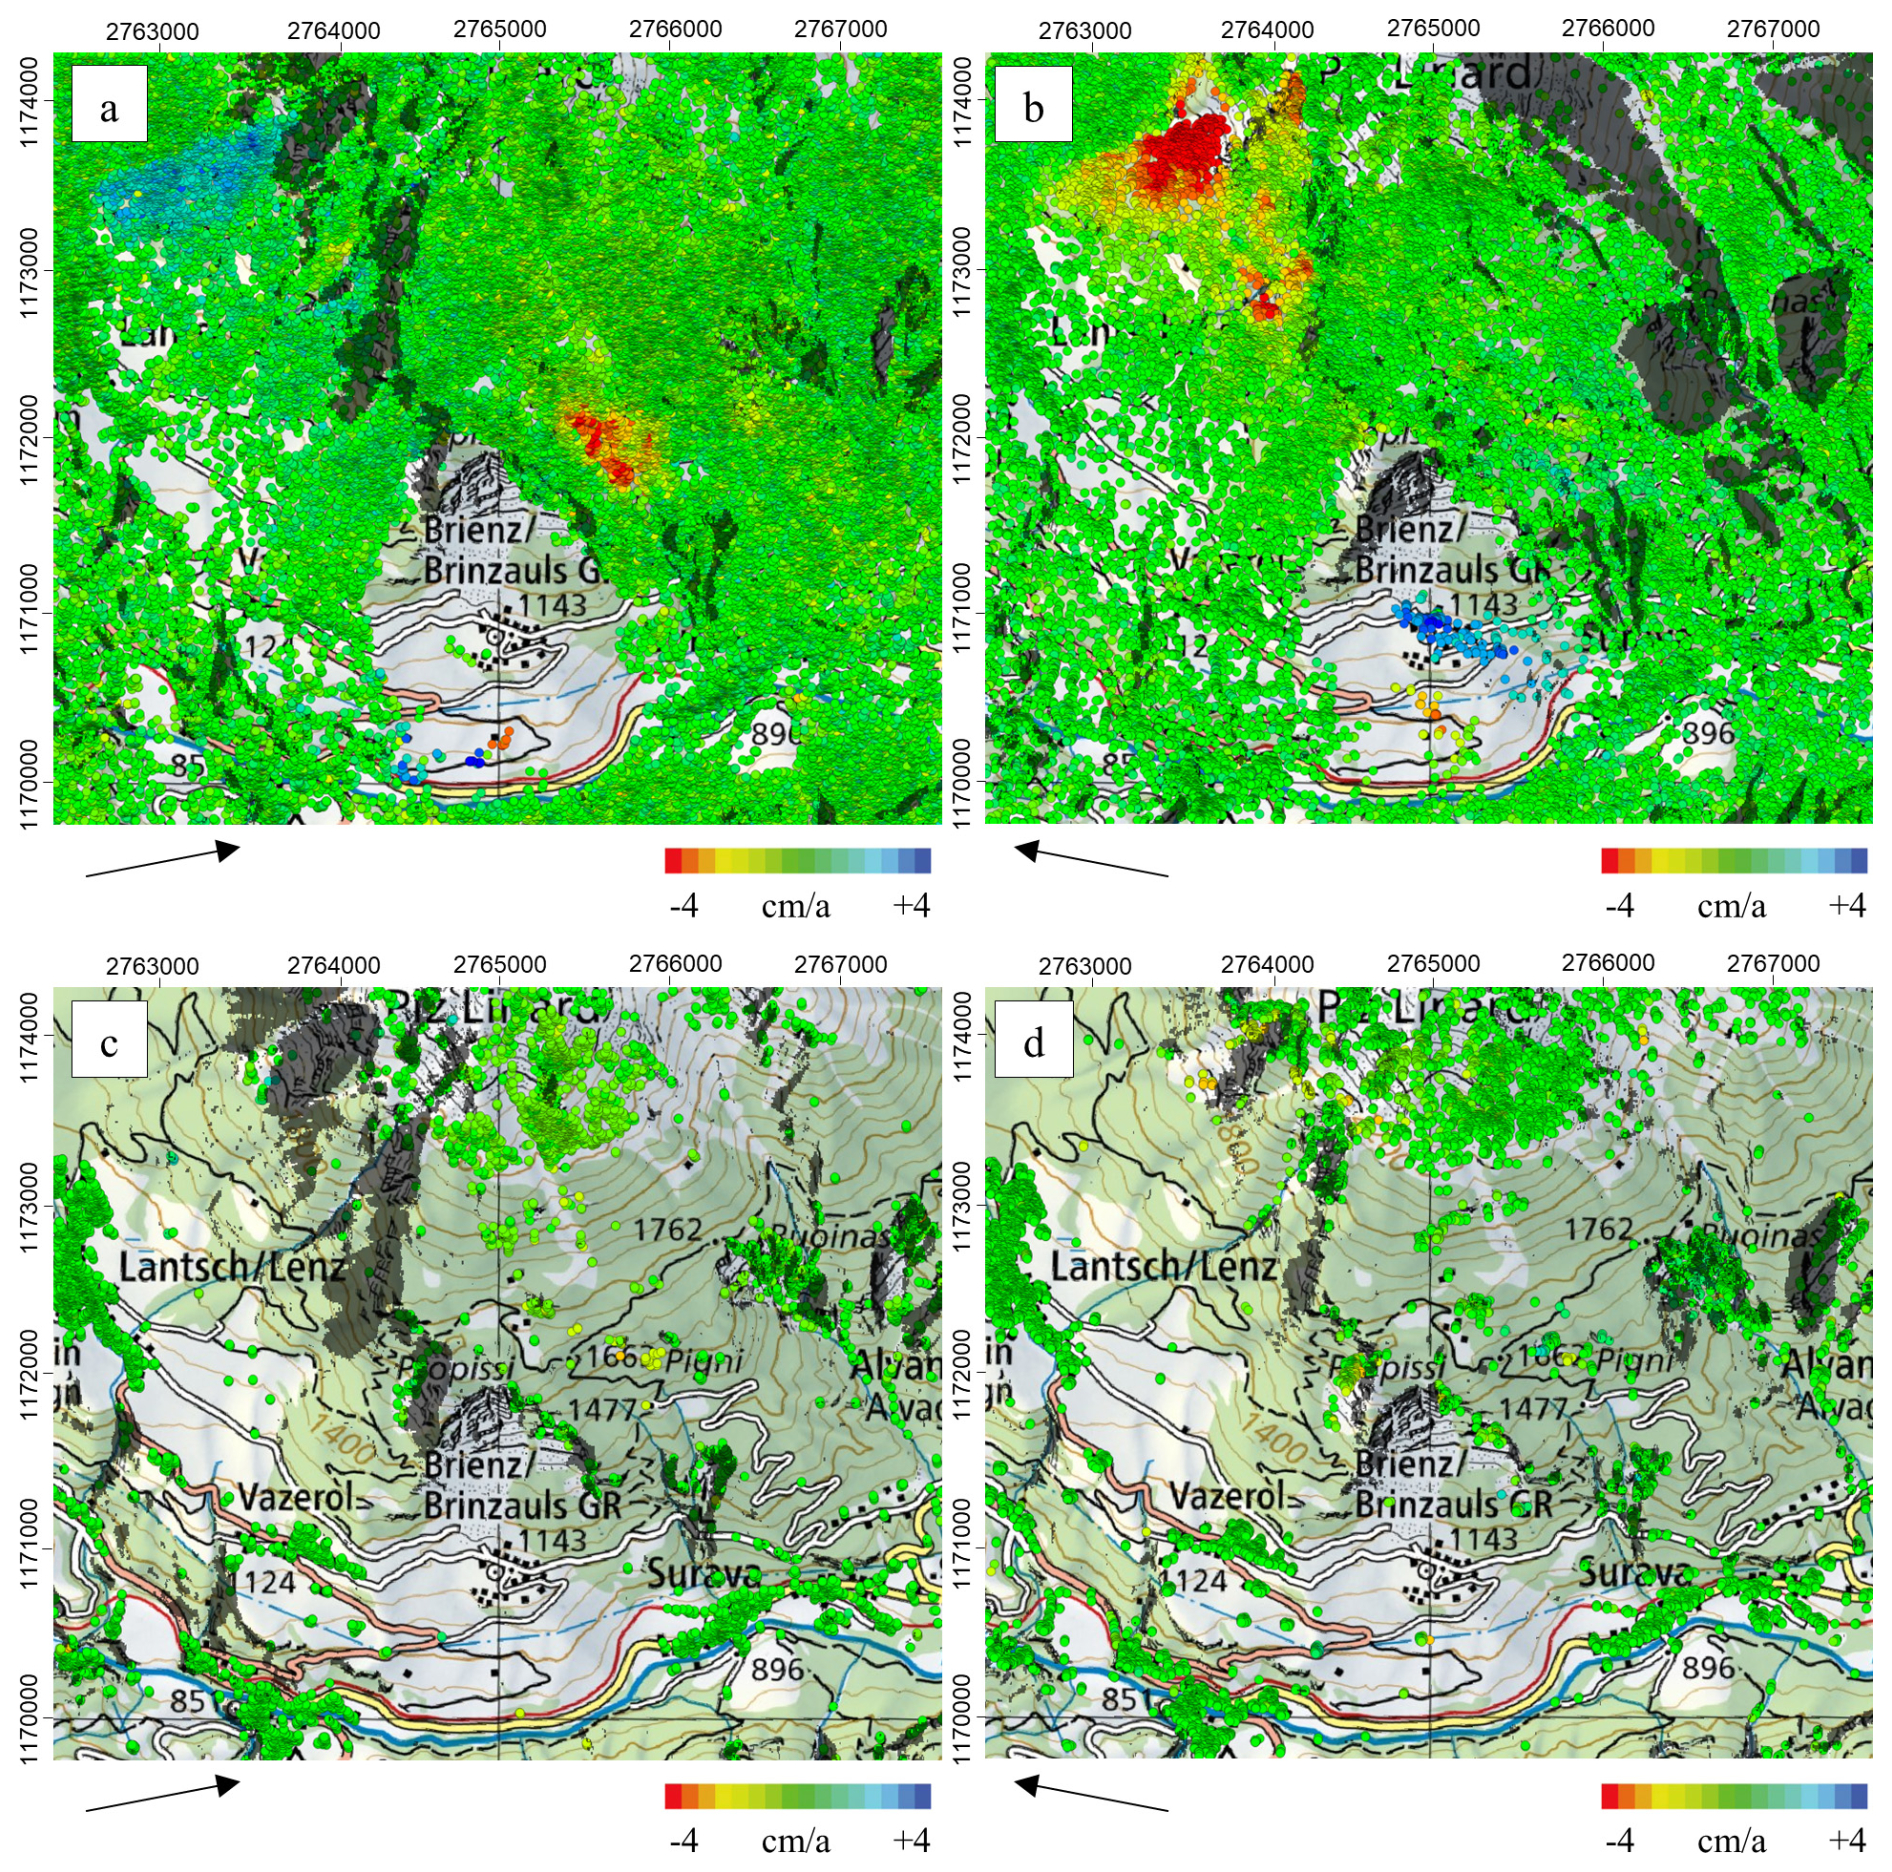
Figure 9Results of PSI analysis at Brienz with ascending ALOS-2 PALSAR-2 for the time period 2019–2023 (a), descending ALOS-2 PALSAR-2 for the time period 2015–2023 (b) and with ascending (c) and descending (d) Sentinel-1 for the time period 2015–2021. The arrows indicate the satellite LOS direction. Layover/shadow is shown in black. Image background is the Swiss National Map.
Due to the limitations of PSI for the detection of high displacement rates, alternative advanced DInSAR techniques such as stacking are required. SBAS is not possible here as both L-band satellite sensors do not provide a temporally continuous series of differential interferograms, due to partly very long spatial or temporal baselines as well as decorrelation in winter because of snow cover. Stacking enables the detection of fast displacements by considering several differential interferograms over a specified time frame to obtain an average displacement rate and reduce random noise. Differential interferograms in 2024 from ascending SAOCOM-1 track S3 T214, with nearly consistent 16 d acquisitions, and descending ALOS-2 PALSAR-2 track 095-F2-5, with temporal baselines of mostly 14 d as well as some 28 d and longer intervals, are most suitable for this technique. Table C2 lists the differential interferograms used in the analysis. The stacking results in Fig. 10 show that ascending SAOCOM-1 and descending ALOS-2 PALSAR-2 data give a good overview of the LOS displacement over the lower part of the Brienz landslide. Large data gaps remain in the upper parts of the slope, however, due to very high local movement rates as well as layover and shadowing effects.
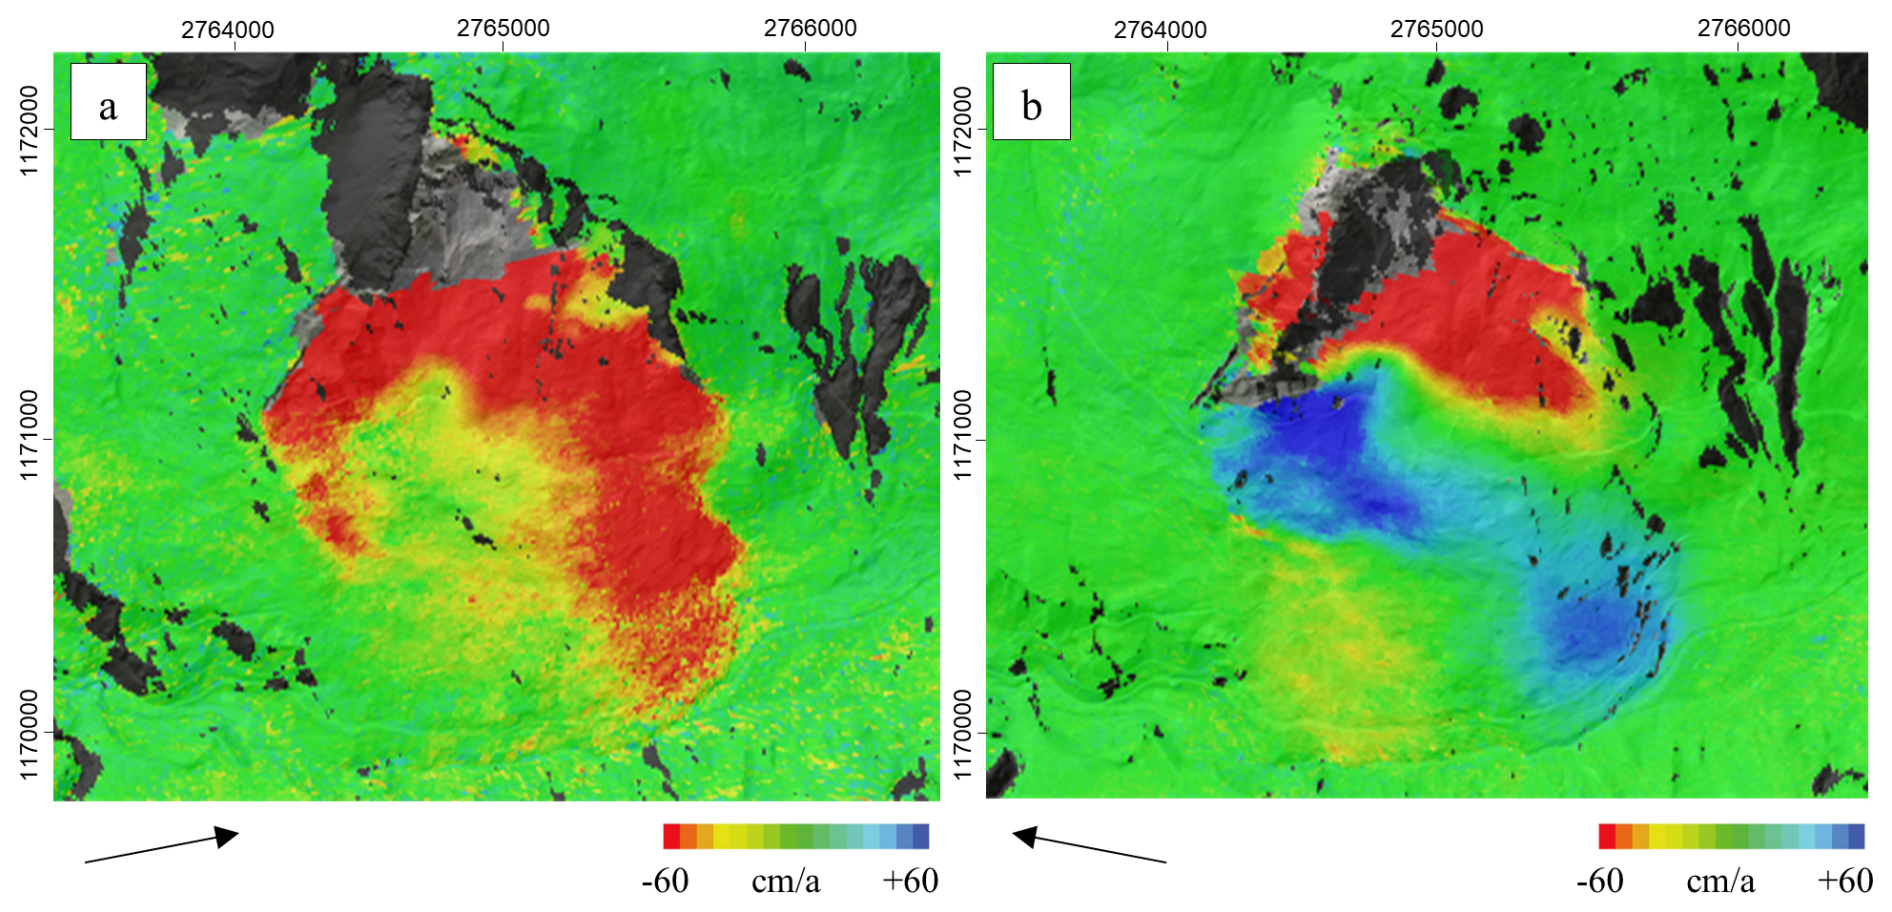
Figure 10Results of DInSAR stacking analysis in 2024 at Brienz with ascending 16 d SAOCOM-1 (a) and descending 14/28 d ALOS-2 PALSAR-2 (b). Table C2 lists the differential interferograms used in the analysis. The arrows indicate the satellite LOS direction. Layover/shadow is shown in black. Image background is SWISSIMAGE.
Terrestrial repeat-pass SAR measurements of the Brienz landslide were acquired > 10 times between 2020 and 2024 with the car-borne GLSAR as listed in Table C3. Considering the acquisitions from 16 and 23 September 2023, i.e. after the rockfall in June 2023, the resulting differential interferogram with a temporal baseline of one week clearly outlines the landslide and indicates different compartments of varying displacement rates within the moving area (Fig. 11a). Compared to a differential interferogram of two weeks obtained for descending ALOS-2 PALSAR-2 (Fig. 11b), the overall coherence of the GLSAR-derived interferogram is higher. The line of sight of the car-borne SAR acquisition aligns very well with the north-south orientation of the landslide's motion vector field, whereas this is not the case for the spaceborne acquisitions. Furthermore, in the satellite observations, areas at higher altitudes are obscured by layover or shadows, while visibility from the ground in this sector is very good. The GLSAR interferogram also corresponds very well with the results of digital image correlation (DIC) on high-resolution multi-temporal digital terrain models (DTM) created from airborne surveys along the north-south direction (Manconi et al., 2024a). The GLSAR results thus enable the detection of coherent displacement in the fastest moving parts of the landslide at higher altitudes and clearly highlight the complementary potential of terrestrial L-band measurements to the available satellite L-band data. Both datasets show displacement of at least one fringe cycle during a temporal period of one and two weeks, respectively, confirming that movement rates exceed the threshold detectable with the PSI technique.
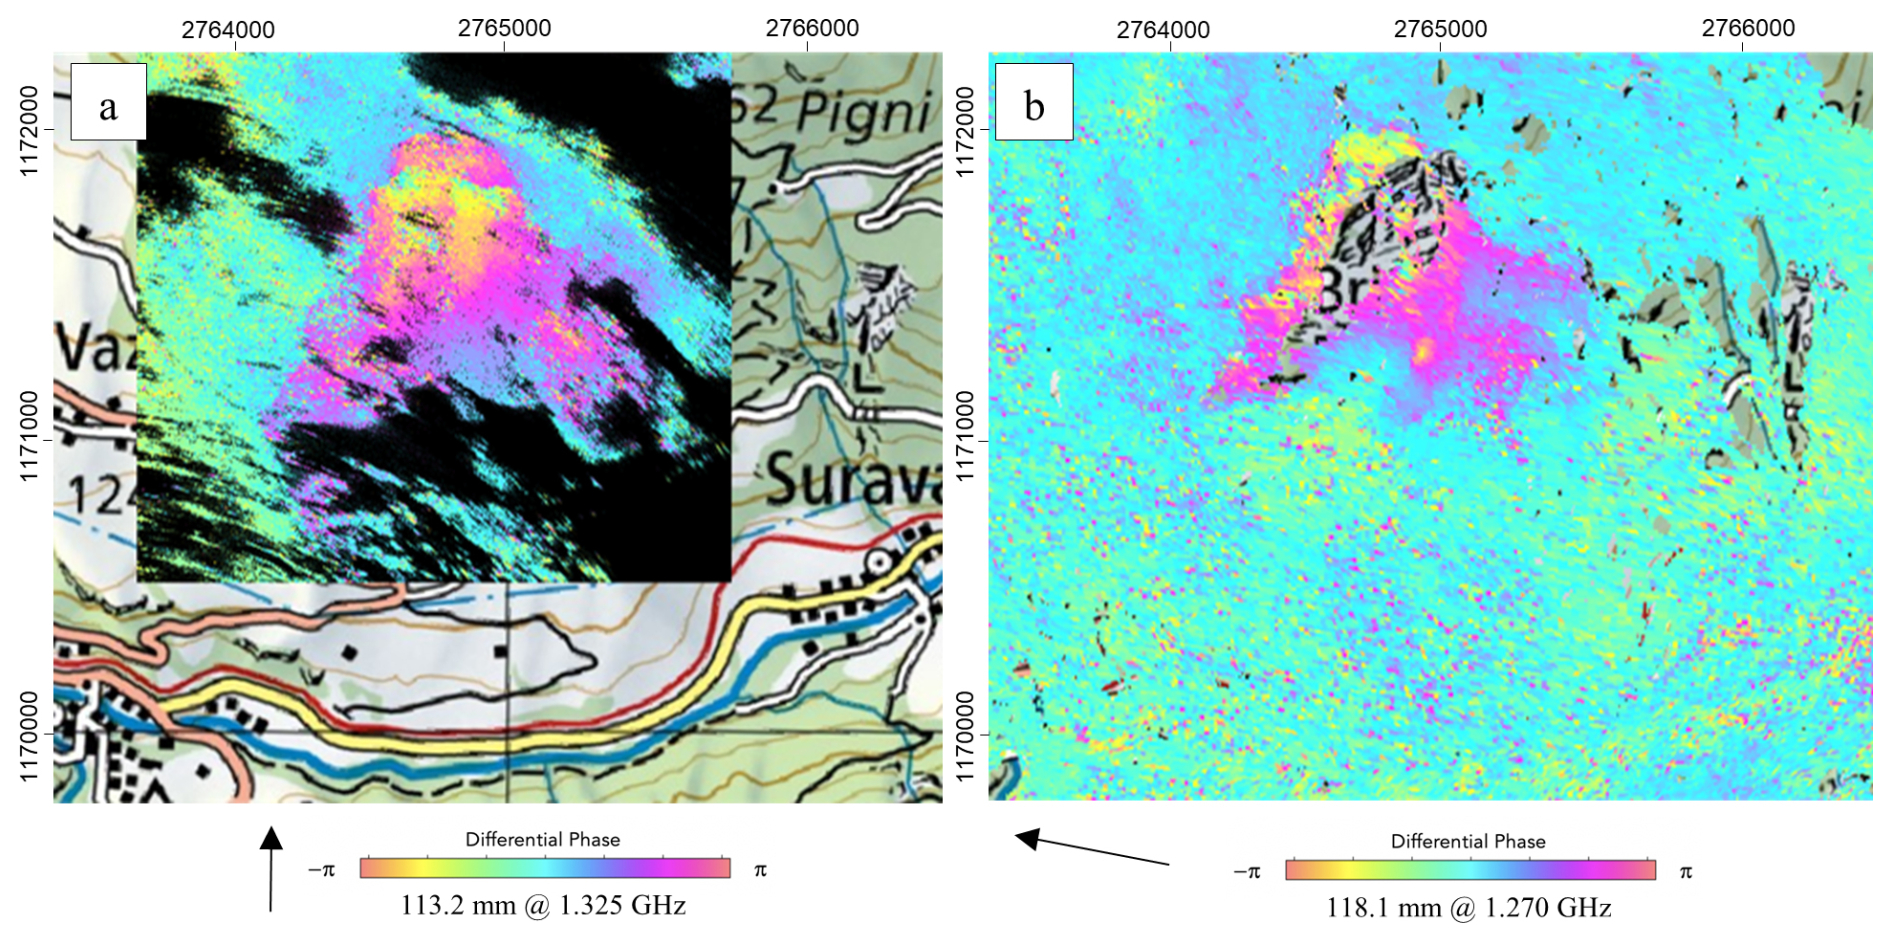
Figure 11Interferograms for car-borne GLSAR data acquired on 16 and 23 October 2023 (a) and descending ALOS-2 PALSAR-2 data acquired on 7 and 21 September 2023 (b). The arrows indicate the terrestrial and satellite LOS directions. Layover/shadow is shown in black. Image background is the Swiss National Map.
6.1 L-band versus C-band
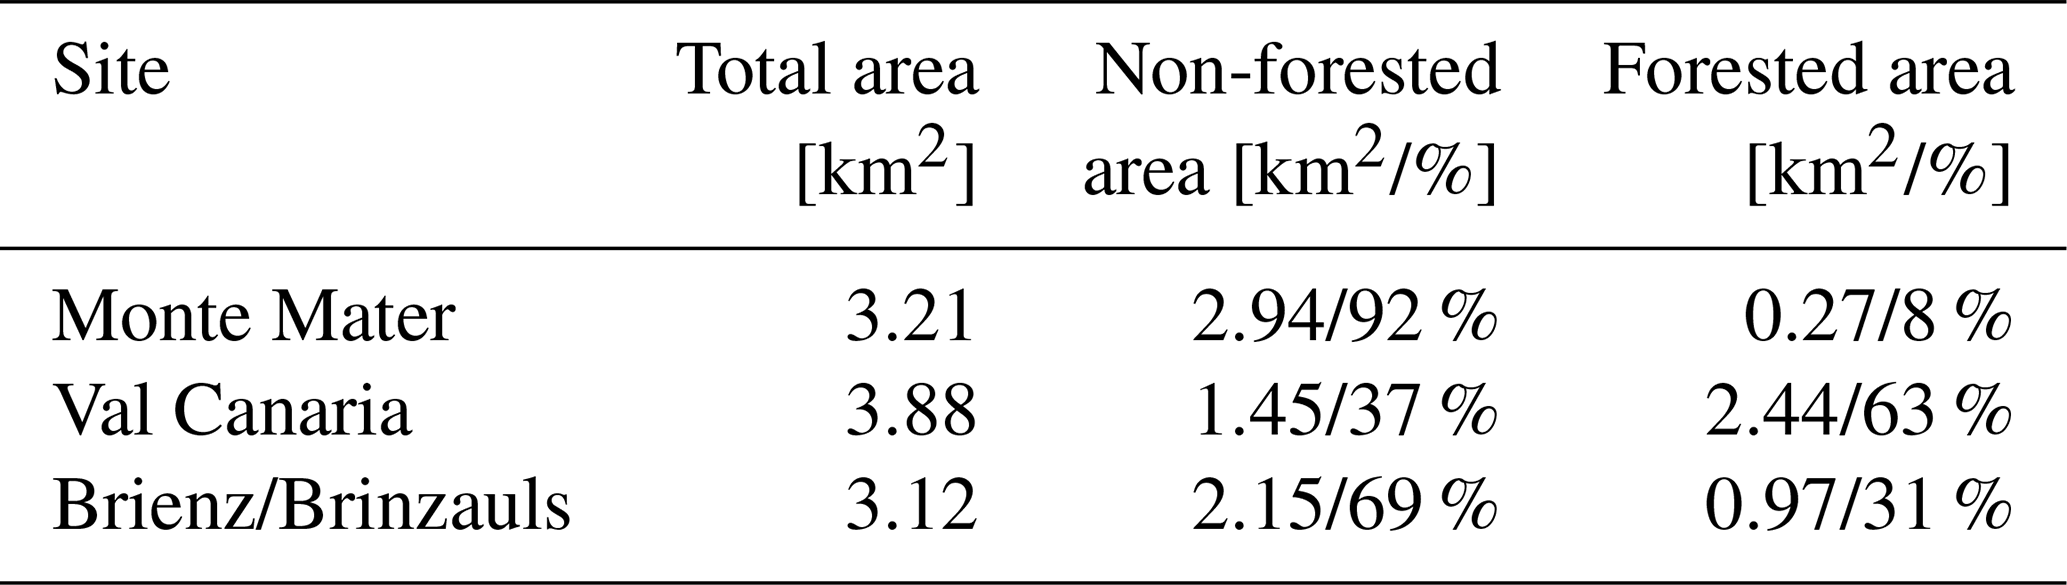
C-band datasets using Sentinel-1 acquisitions are available at the three test sites through the European Ground Motion Service (EGMS; https://egms.land.copernicus.eu/), Geoportale Ticino (https://map.geo.ti.ch/) and independent studies (Crippa et al., 2021; Strozzi et al., 2022). The comparison of C- and L-band datasets across the three alpine study sites highlights pronounced differences in displacement detection. Histograms of PS density were computed for all the considered datasets for forested and non-forested terrain and are presented in Fig. 12. Size and percentage of forested and non-forested terrain per area (Table 3 and Figs. A2, B3 and C2) are based on the CORINE Land Cover (CLC, https://land.copernicus.eu/en/products/corine-land-cover/, last access: 31 March 2026). As also apparent in Fig. 1, forest cover is predominant in Val Canaria (63 %), more limited in Brienz/Brinzauls (31 %), and sparse in the alpine environment of Monte Mater (8 %). The histograms of PS density confirm that L-band acquisitions consistently provide much higher PS densities, in some cases up to twenty times greater than C-band, depending on the satellite platform, orbit direction, and number of images available in the multi-temporal stacks.
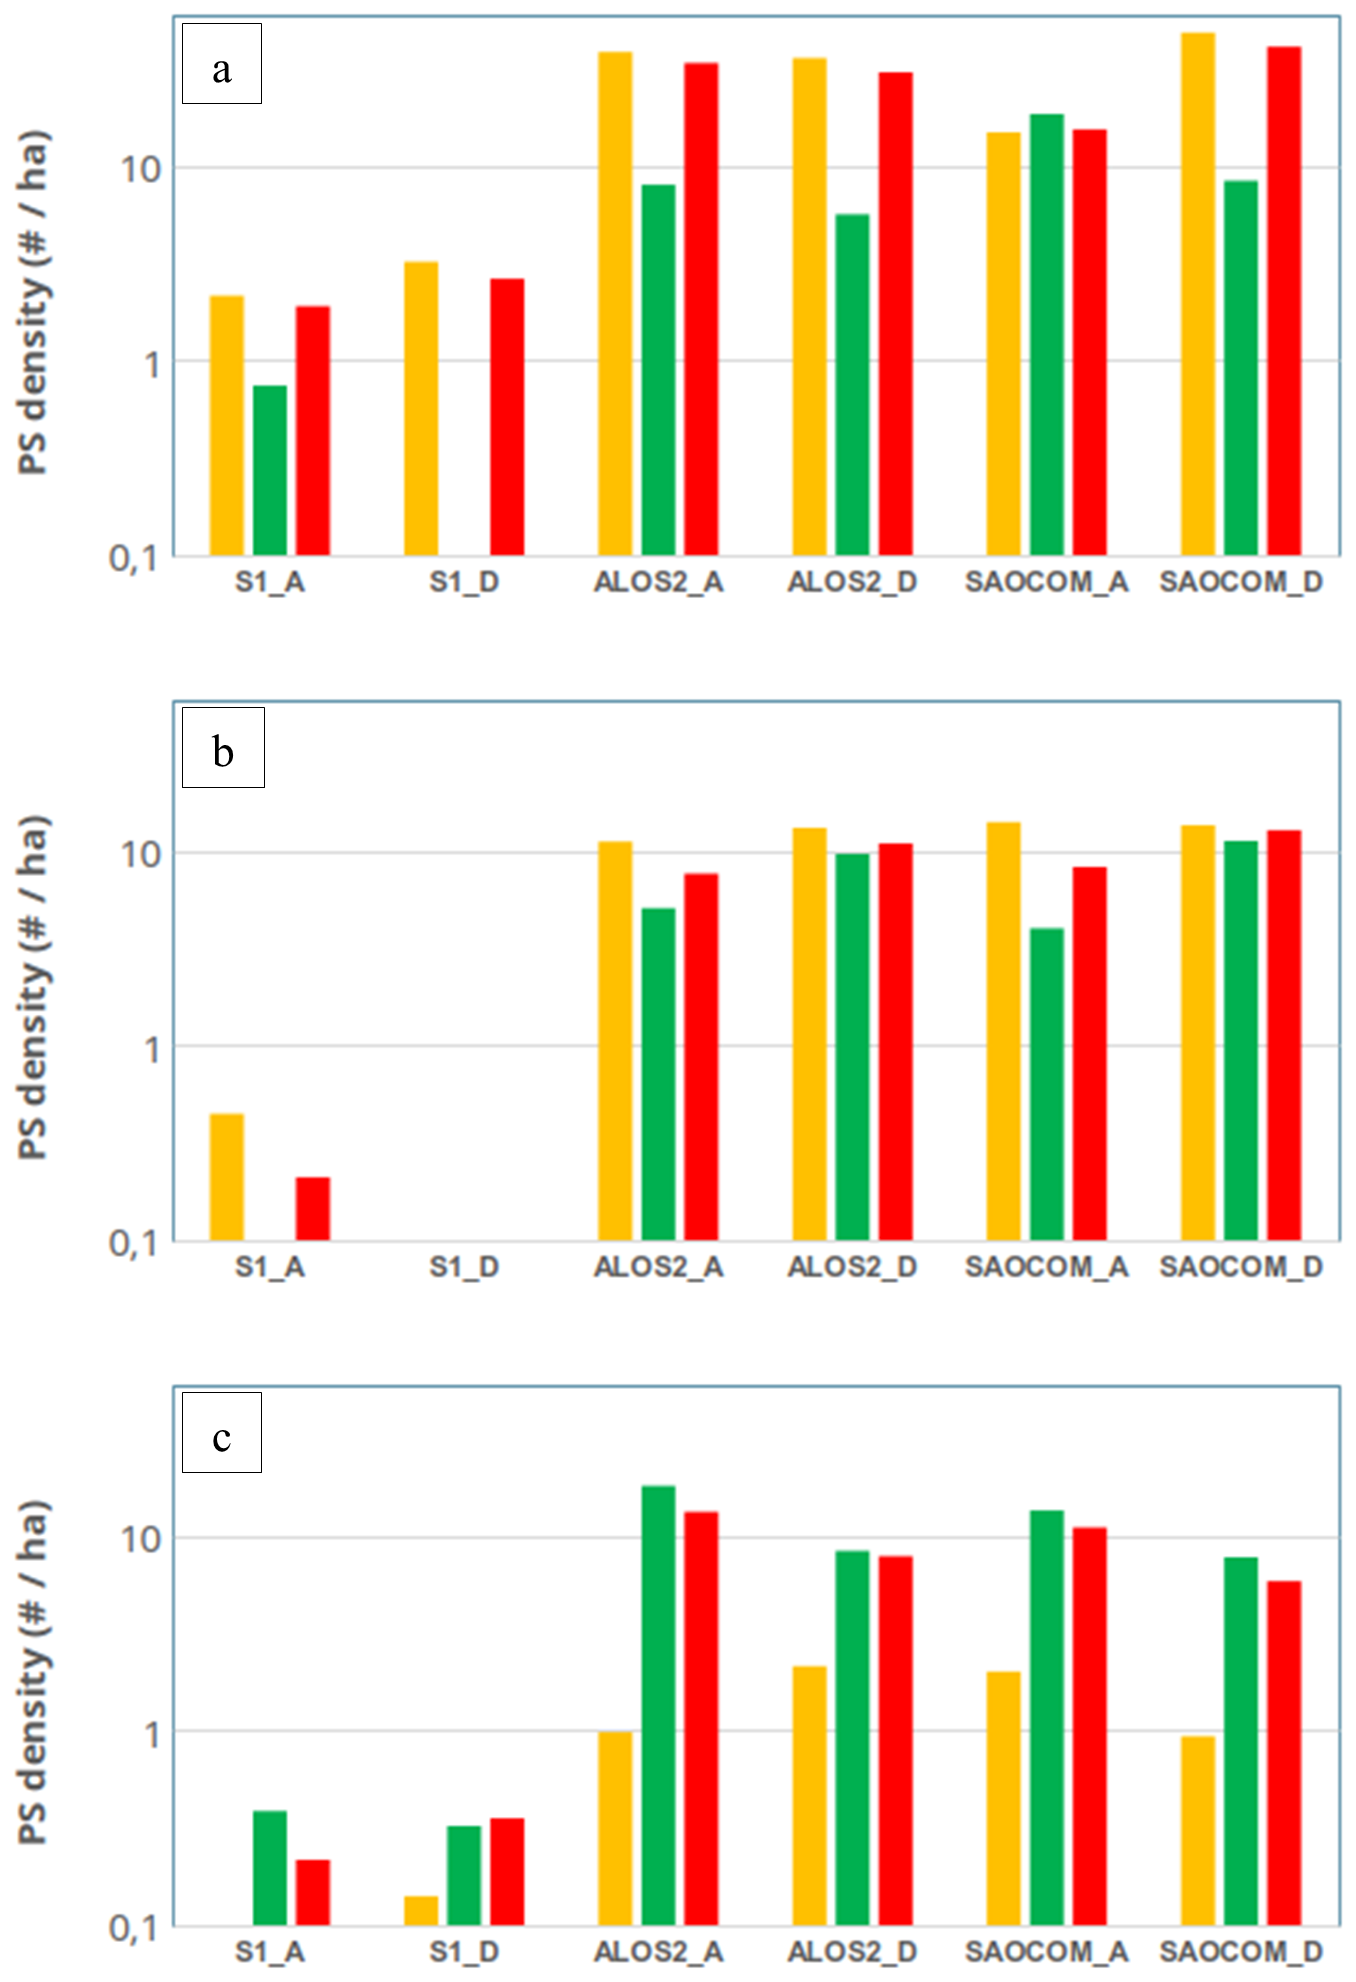
Figure 12PS densities for products derived from Sentinel-1 (S1), ALOS-2 PALSAR-2 (ALOS2) and SAOCOM-1 (SAOCOM) in ascending (A) and descending (D) orbits in non-forested, forested and total SAR-visible areas for (a) the Monte Mater, (b) the Val Canaria and (c) the Brienz areas.
Table 3Size and percentage of non-forested/forested terrain per area in which the PS density is calculated for each test site.
At Monte Mater in northern Italy, the contrast is particularly striking. In unforested terrain, the PS density of L-band products exceeds that of C-band by a factor of up to 20, while in forested areas the density remains 10–15 times higher. This increase in point density at L-band allows the moving area of the DSGSD and its internal kinematic compartments to be resolved with a spatial continuity that is impossible to achieve with C-band products, which display only scattered clusters of points.
In Val Canaria, the limitations of C-band are even more apparent. Sentinel-1 analyses yield very low point densities overall and no solution at all on vegetated slopes, leaving the mapped landslides essentially undetected. In contrast, L-band acquisitions from ALOS-2 PALSAR-2 and SAOCOM-1 provide dense PS coverage throughout the SAR-visible portions of the slope, with average densities approximately five times higher than those of C-band. The improvement is consistent across both forested and non-forested areas, demonstrating that L-band maintains coherence where C-band fails. In addition, the higher temporal sampling rate of SAOCOM-1 compared to ALOS-2 translates directly into a denser point distribution and better definition of slope sectors with more rapid motion.
The Brienz/Brinzauls landslide illustrates both the advantages and the limits of the approach. C-band analyses show sparse coverage and the large moving areas to the north-west near Lantsch/Lenz and east of Brienz remain undetected. L-band datasets, by contrast, clearly reveal these zones with a significantly higher PS density, especially in forested areas. The reason of lower point densities in non-forested areas is because these areas are also the ones in the central body of the landslide experiencing the highest velocities in the period of observation. Where displacements reached very high values, coherence is lost in both frequency bands and no PSI points are retrieved. This reflects a fundamental limit of the PSI technique rather than a wavelength effect: once velocities exceed a certain threshold, neither C- nor L-band can provide stable measurements. Due to the limitations of PSI for the detection of high displacement rates, alternative techniques such as standard DInSAR or stacking can be employed. Here again, with its superior coherence across all temporal baselines, L-band can better retrieve spatially distributed information and capture various processes acting at different velocities.
6.2 Monitoring Performance
Terrestrial data are used to characterise the ability of time series of displacements derived from C- and L-band multitemporal DInSAR products to follow the evolution of surface displacements at specific locations, where in-situ monitoring data is available. At Monte Mater, validation is possible due to 10 GNSS benchmarks maintained by ARPA Lombardia, with standard errors of 3–5 mm in horizontal and 6–10 mm in vertical components, and a Ku-band GB-DInSAR system positioned 1.4–3.4 km from the slope, with a range resolution of 1.5 m and azimuth resolution of 5.8–11.5 m. To extract the PSI time series, we defined circular sampling areas with a 50 m radius centred on the GB-DInSAR/GNSS benchmarks. For comparison, considering the uncertainties related to different LOS (satellite versus terrestrial DInSAR) and the slope-parallel trends of GNSS measurements, all datasets were projected along the steepest slope (Notti et al., 2014). For sectors moving at less than 5 cm a−1, L-band PSI provides displacement time series in close agreement to GNSS and GB-DInSAR, capturing multi-year accelerations that began in 2022 (Fig. 13a). C-band time series are more affected by sparse coverage and fail to reproduce these non-linear trends. At intermediate velocities of about 10 cm a−1, SAOCOM-1 PSI continues to follow the slightly non-linear behaviour measured by GB-DInSAR, although intra-annual variations are not fully resolved (Fig. 13b). At higher velocities (i.e., ∼ 20 cm a−1), all satellite PSI products underestimate motion: C-band captures only about 25 % of the true displacement, while L-band recovers around 50 % and shows only a weak indication of non-linear acceleration (Fig. 13c). Tables of the theoretical velocity thresholds as discussed in Manconi (2021) are included in Appendix D. The thresholds indicate the maximum theoretical velocity along the LOS that can be detected by each satellite and thus express each sensor's upper velocity limits.
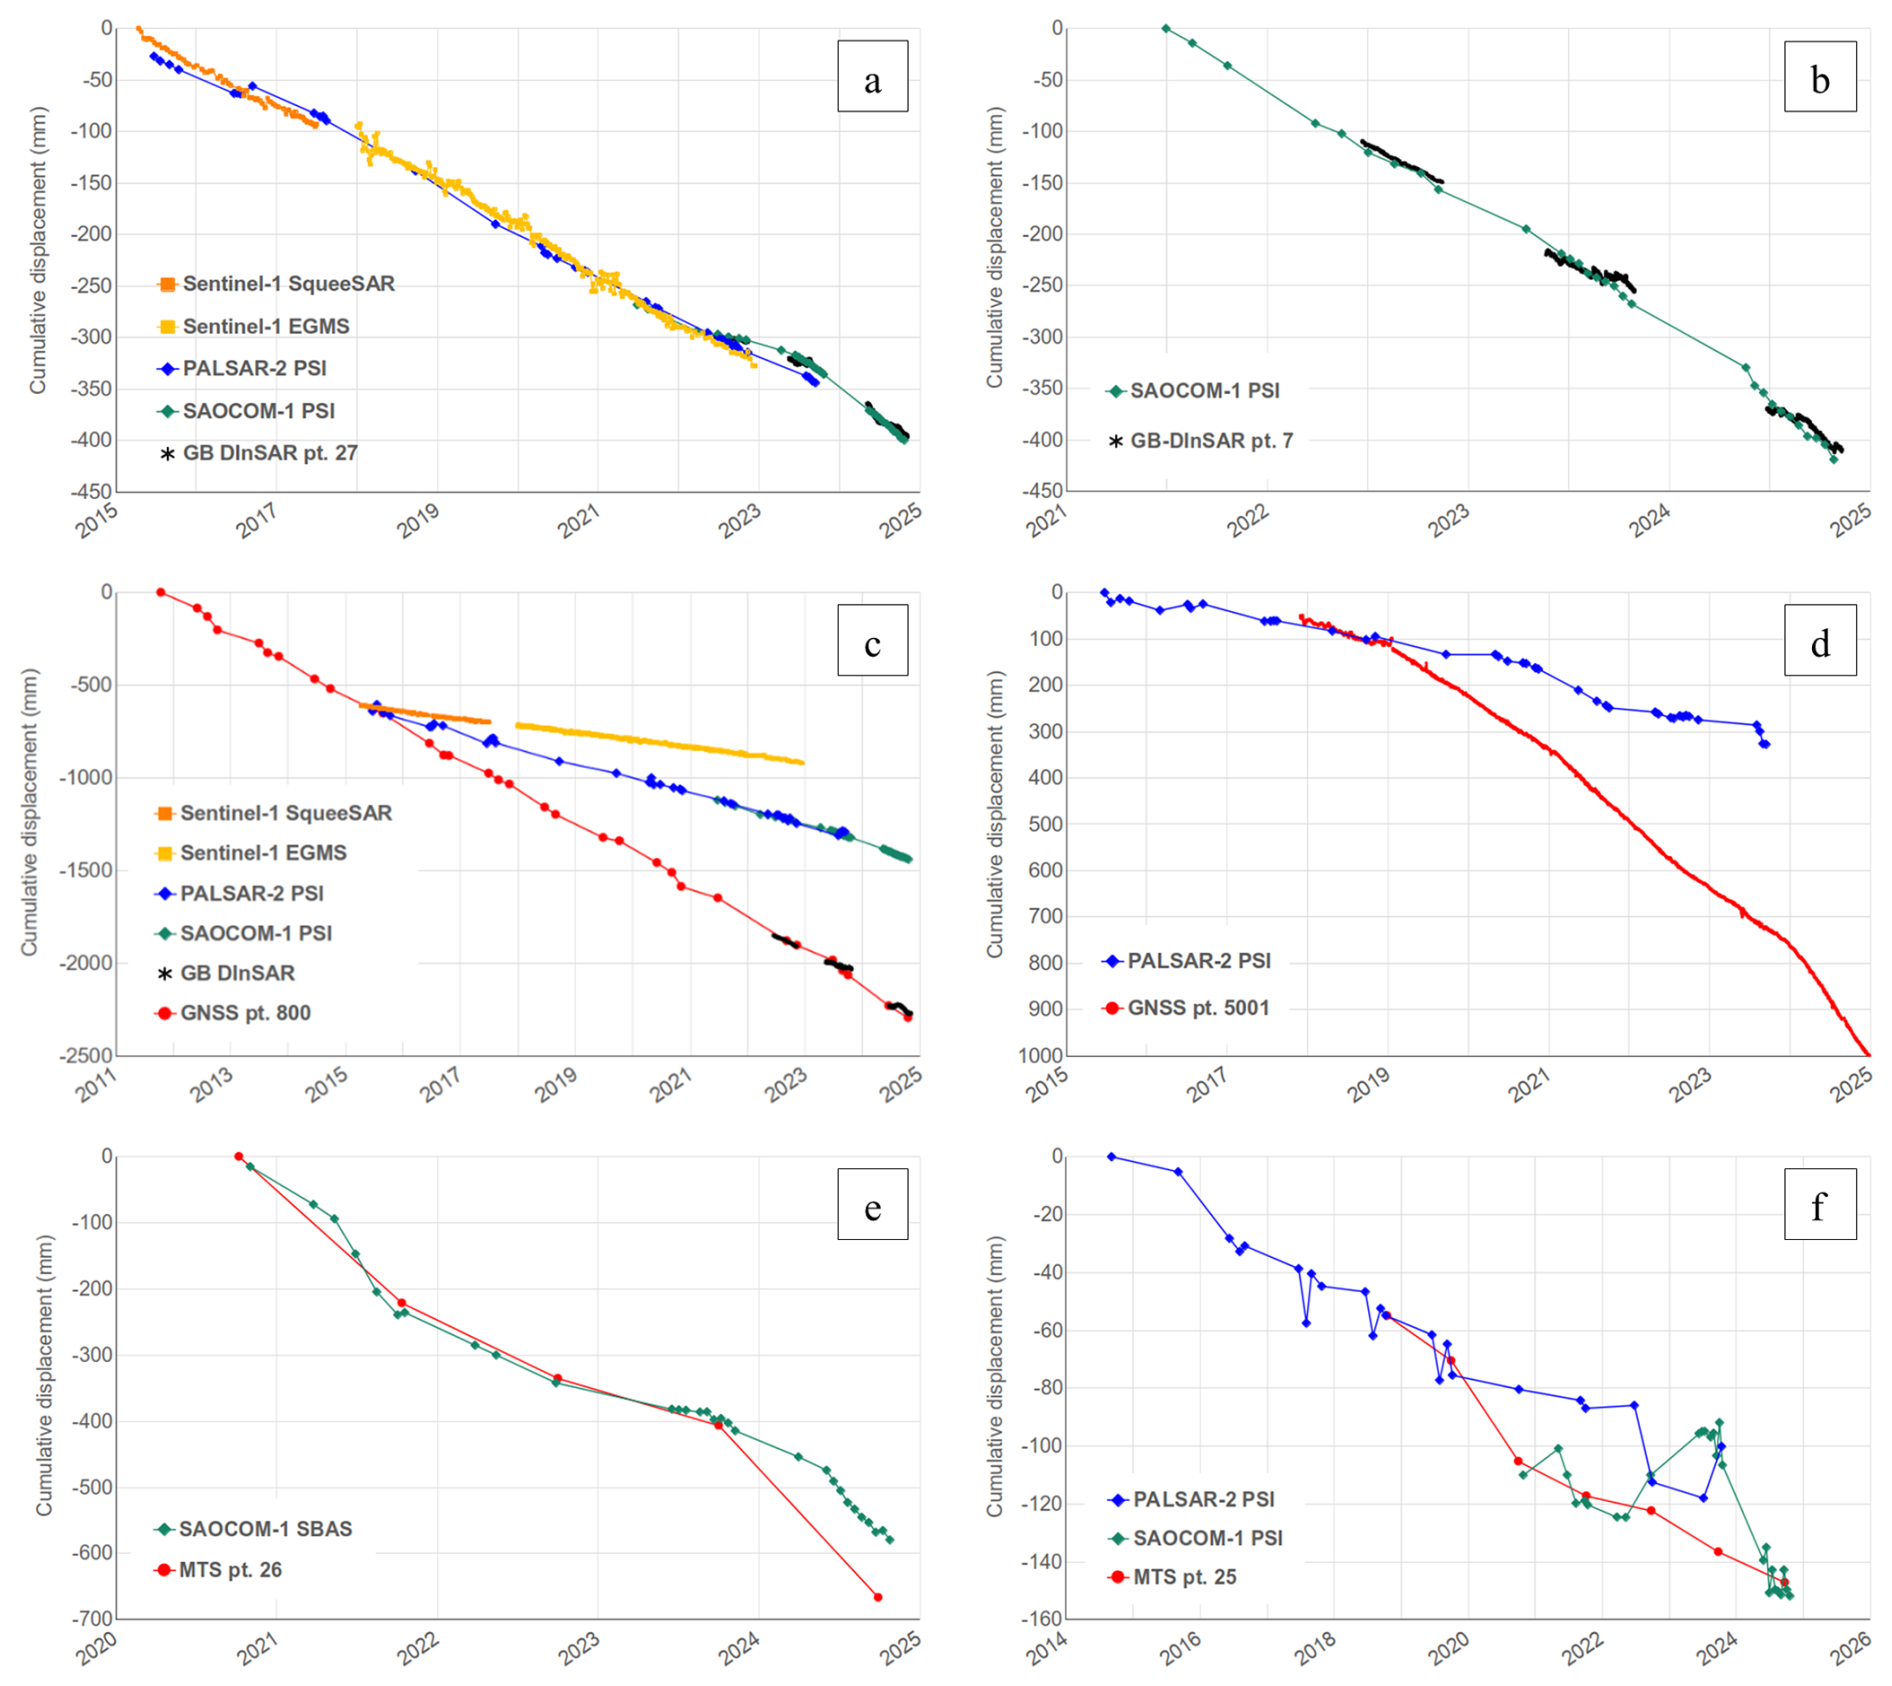
Figure 13Time series of displacements, extracted and averaged in circular sampling areas (R = 50 m) for different satellite C- and L-band multitemporal DInSAR datasets. (a) Slow-moving, deep-seated rockslide at GB DInSAR pt. 27 at Monte Mater (rates < 5 cm a−1); (b) shallow debris covering the Monte Mater DSGSD head at GB DInSAR pt. 7, moving at rates ∼ 10 cm a−1; (c) shallow debris slide in the upper part of the Monte Mater DSGSD at GNSS pt. 800, moving at long-term rates > 20 cm a−1; (d) GNSS pt. 5001 at Brienz village; (e) MTS pt. 26 over the fast moving central part of the Rütan dei Sass rockfall in Val Canaria (long-term rates ∼ 20 cm a−1); (f) MTS pt. 25 in the upper slow part of the Rütan dei Sass rockfall in Val Canaria (rates ∼ 1 cm a−1). At Monte Mater all datasets are projected along the steepest slope, for Brienz and Val Canaria the in-situ data are converted towards the satellite LOS. For Brienz values are shown in reverse direction for illustrative purposes.
At Brienz/Brinzauls, three continuous GNSS stations are located in the lower part of the slope, but only one point meets the predefined criteria for validation (PSI measurements within a 50 m buffer around the in-situ measurement). In 2018–2019, for LOS rates of motion of about 5 cm a−1, the L-band time series matches GNSS displacements projected onto the SAR LOS (Fig. 13d), confirming the reliability of the method under moderate velocities. After 2019, however, slope acceleration reached several metres per year, well beyond the measurable range of PSI. L-band results then strongly underestimate the real displacements and the fastest slope sectors yielded no PSI points at all. Here, the dense terrestrial network of GNSS, GB-DInSAR, and car-borne GLSAR provided the critical information, recording highly non-linear accelerations and mapping internal slope compartments with velocities of up to several metres per year.
The Rütan dei Sass rockfall in Val Canaria allows further quantitative assessment through annual Motorized Total Station (MTS) surveys, carried out since 2013. We have selected two MTS benchmarks: pt. 26 in the fast-moving central part of the landslide, where results from the SAOCOM-1 SBAS analysis are available (Fig. 8) and pt. 25 in the upper part of the landslide, which provides a high number of slow moving ALOS-2 PALSAR-2 and SAOCOM-1 PS data (Fig. 6). The satellite data is averaged within a radius of 50 m around each MTS target. The displacements observed in the geodetic measurements are then projected onto the SAR LOS to enable an effective comparison. At pt. 26, the SAOCOM-1 SBAS displacement time series aligns very well with the MTS measurements in LOS between 2020 and 2023 (Fig. 13e). Nevertheless, the strong acceleration between 2023 and 2024, although detected with the SAOCOM-1 SBAS analysis, is underestimated. Phase unwrapping errors in the interferograms spanning this time period are likely the reason of the discrepancy. At pt. 25 the slow displacement rates measured by MTS (15 mm a−1 between 2018 and 2024 and 10 mm a−1 between 2020 and 2024) compare well with those observed by ALOS-2 PALSAR-2 and SAOCOM-1 (12 mm a−1 between 2014 and 2024 and 9 mm a−1 between 2020 and 2024, respectively). However, the time series of Fig. 13f show more noise and general deviations, e.g., in the period from October 2019 to October 2020, when a significant acceleration detected by the MTS was not recorded by ALOS-2 PALSAR-2, and in 2022 and 2023, when SAOCOM-1 showed a misalignment compared to the MTS data. Displacement rates of about 9 mm a−1 correspond to the expected detection accuracy threshold for L-band (Ng et al., 2012), while the accuracy for single measurements is on the order of 15 mm (Nishiguchi et al., 2017).
6.3 Towards Multi-Frequency Integration
The results and validation thereof clearly illustrate the advantages and limitations of satellite and terrestrial L-band datasets for DInSAR techniques in alpine environments. Each of the three study sites highlights important aspects of our findings and provides insight into the monitoring and early warning capabilities of current and future L-band SAR missions.
The Monte Mater study site in Italy highlights the high potential of L-band to act as complementary data to the widely available C-band Sentinel-1 datasets. While some information can be extracted from C-band PSI results due to the relatively slow motion of the landslide and limited vegetation cover, the point coverage remains too scarce to clearly outline the full extent of the moving area. L-band results from ALOS-2 PALSAR-2 and SAOCOM-1 strongly complement the C-band data as their point density remains high even in areas of dense vegetation and fast movements. L-band PSI thus enables an understanding of the full extent of the Monte Mater landslide and its compartments through identification of different velocities within the moving area.
The Val Canaria study site in Switzerland is a very good example of the obvious limitations of C-band to detect fast movements in vegetated areas and the clear need for lower frequency datasets with high temporal sampling rates. No information can be extracted from Sentinel-1 PSI results at Val Canaria, while L-band PSI provides a good solution and indication of local displacement. The influence of a higher temporal sampling rate of available acquisitions becomes apparent here through the different results obtained with ALOS-2 PALSAR-2 and SAOCOM-1. The higher temporal sampling rate of SAOCOM-1 gives an overall higher point density compared to ALOS-2 PALSAR-2 and thus allows better detection of displacement also in fast regions of slope movement. Despite this, gaps remain which are related to the limited velocity range generally detectable with PSI. These can be filled with the use of differential interferograms and other advanced DInSAR techniques such as SBAS. The high temporal sampling rate of SAOCOM-1 allows generation of a displacement time series from SBAS results that clearly shows non-linear motion and seasonal variations in the landslide's velocity. These findings suggest that with a sufficiently high temporal sampling, satellite-based L-band data can provide a good understanding of inter-annual changes in displacement rates and may act as valuable information in monitoring programmes.
The Monte Mater and Val Canaria landslides further confirm the potential of terrestrial L-band measurements as acquired with the GLSAR instrument. The displacement maps obtained with the car-borne instrument are very similar to the satellite-based results, even in Val Canaria despite difficult local conditions, such as a rough road along which the car is driven to acquire measurements of the opposite slope. These findings support the high robustness of terrestrial measurements and show the reciprocal validation potential of satellite- and ground-based data studies.
The Brienz study site in Switzerland strongly highlights the potential of multi-sensor and multi-approach studies to obtain a good understanding of very fast-moving landslides with complex local kinematics. Again, the limitations of C-band and advantages of L-band are illustrated by comparing the PSI point coverage of each frequency, where ALOS-2 PALSAR-2 and SAOCOM-1 show distinctly higher point densities than Sentinel-1 and enable the identification of large areas of motion in the surrounding region. The limitations of PSI regardless of the sensor wavelength, however, are also apparent, as the Brienz landslide itself cannot be detected with this technique even at L-band. A multi-technique approach through use of differential interferograms and other advanced DInSAR techniques is thus necessary to gain an understanding of the landslide kinematics. In particular, the use of offset-tracking approaches could add valuable insight into the analysis of the Brienz landslide (Manconi et al., 2024b). Additionally, these findings show the current limitations of a purely satellite-based analysis, as the fastest areas of the landslide in the upper parts of the slope, where velocities exceed several metres per year, cannot be resolved with the given temporal sampling rate of approx. two weeks. These areas are coherently detected with terrestrial L-band measurements acquired with the GLSAR, however, which are conducted within a time frame of one week and provide valuable additional information on the upper parts of the landslide. The car-borne GLSAR clearly allows identification of the landslide outline at these higher altitudes as well as of internal compartments with high velocities of several metres per year. Satellite data available with sub-daily revisit times and at sub-metric spatial resolutions can also be a viable alternative to manage slope instability operational scenarios (Manconi et al., 2024b).
Our comparative analyses at Monte Mater, Val Canaria, and Brienz/Brinzauls demonstrate the added value of L-band interferometry for both the detection and monitoring of slope instabilities in alpine environments. The PS densities achieved at L-band are systematically higher than at C-band, by a factor of five in forested terrain to a factor of more than twenty in favourable conditions. This improvement directly translates into more complete spatial coverage and the ability to delineate kinematic compartments that remain unresolved in C-band datasets. The case of Val Canaria is particularly relevant. While Sentinel-1 offers negligible coverage in forested areas, ALOS-2 and SAOCOM-1 provide dense scatterer distributions across both vegetated and non-vegetated slopes, enabling detection of slope sectors that had previously gone unrecognised. At Brienz, PSI at both frequencies fails to capture the core of the landslide once velocities exceed measurable thresholds. These results confirm and extend earlier observations of C-band limitations in alpine terrain, providing quantitative evidence that L-band coherence and scatterer density can systematically overcome vegetation-related decorrelation. The monitoring capabilities of L-band are more dependent on velocity and acquisition frequency. For slow slope movements below ∼ 5 cm a−1, L-band PSI time series are consistent with GNSS and GB-DInSAR, including the ability to resolve multi-year accelerations. SAOCOM-1, with its higher temporal sampling, is able to track displacements of ∼ 10 cm a−1, although intra-annual variability observed by GB-DInSAR is not fully captured. At higher velocities, all satellite PSI products underestimated motion: C-band recovered only about 25 % and L-band about 50 % of the true displacement at Monte Mater, with similar patterns observed in Brienz. These findings highlight a fundamental limitation of interferometric monitoring in rapidly deforming environments, where terrestrial measurements remain essential for reliable early warning.
Together, our findings indicate that C- and L-band missions should be viewed as complementary rather than competing assets. Sentinel-1 provides broad regional coverage for baseline detection of slow and steady instabilities, while L-band sensors are indispensable for resolving displacements in vegetated areas and at moderate velocities. Nevertheless, the relatively low revisit frequency of current L-band missions continues to limit their usefulness for detecting rapid or short-term displacement phenomena. The launch of NISAR in 2025 and ROSE-L later this decade will provide, for the first time, free and regular L-band coverage at the global scale. Our results suggest that these missions will substantially enhance the capacity for regional landslide mapping and site-specific monitoring in the Alps. By systematically exploiting L-band's improved coherence and velocity detection range, it will be possible to achieve more accurate assessments of slope activity, long-term kinematic trends, and the influence of changing climatic drivers. However, the intrinsic limitations of interferometry at high displacement rates mean that satellite observations must be embedded within multi-sensor monitoring frameworks to ensure effective early warning and risk reduction.
Table A1List of L-band satellite acquisitions used in the PSI analysis of Monte Mater. ALOS-2 PALSAR-2 ScanSAR data are shown in italics. Additionally, the mean SAR look vector incidence angle (lv_theta) and mean SAR look vector orientation (azimuth) angle (lv_phi) are included per sensor.
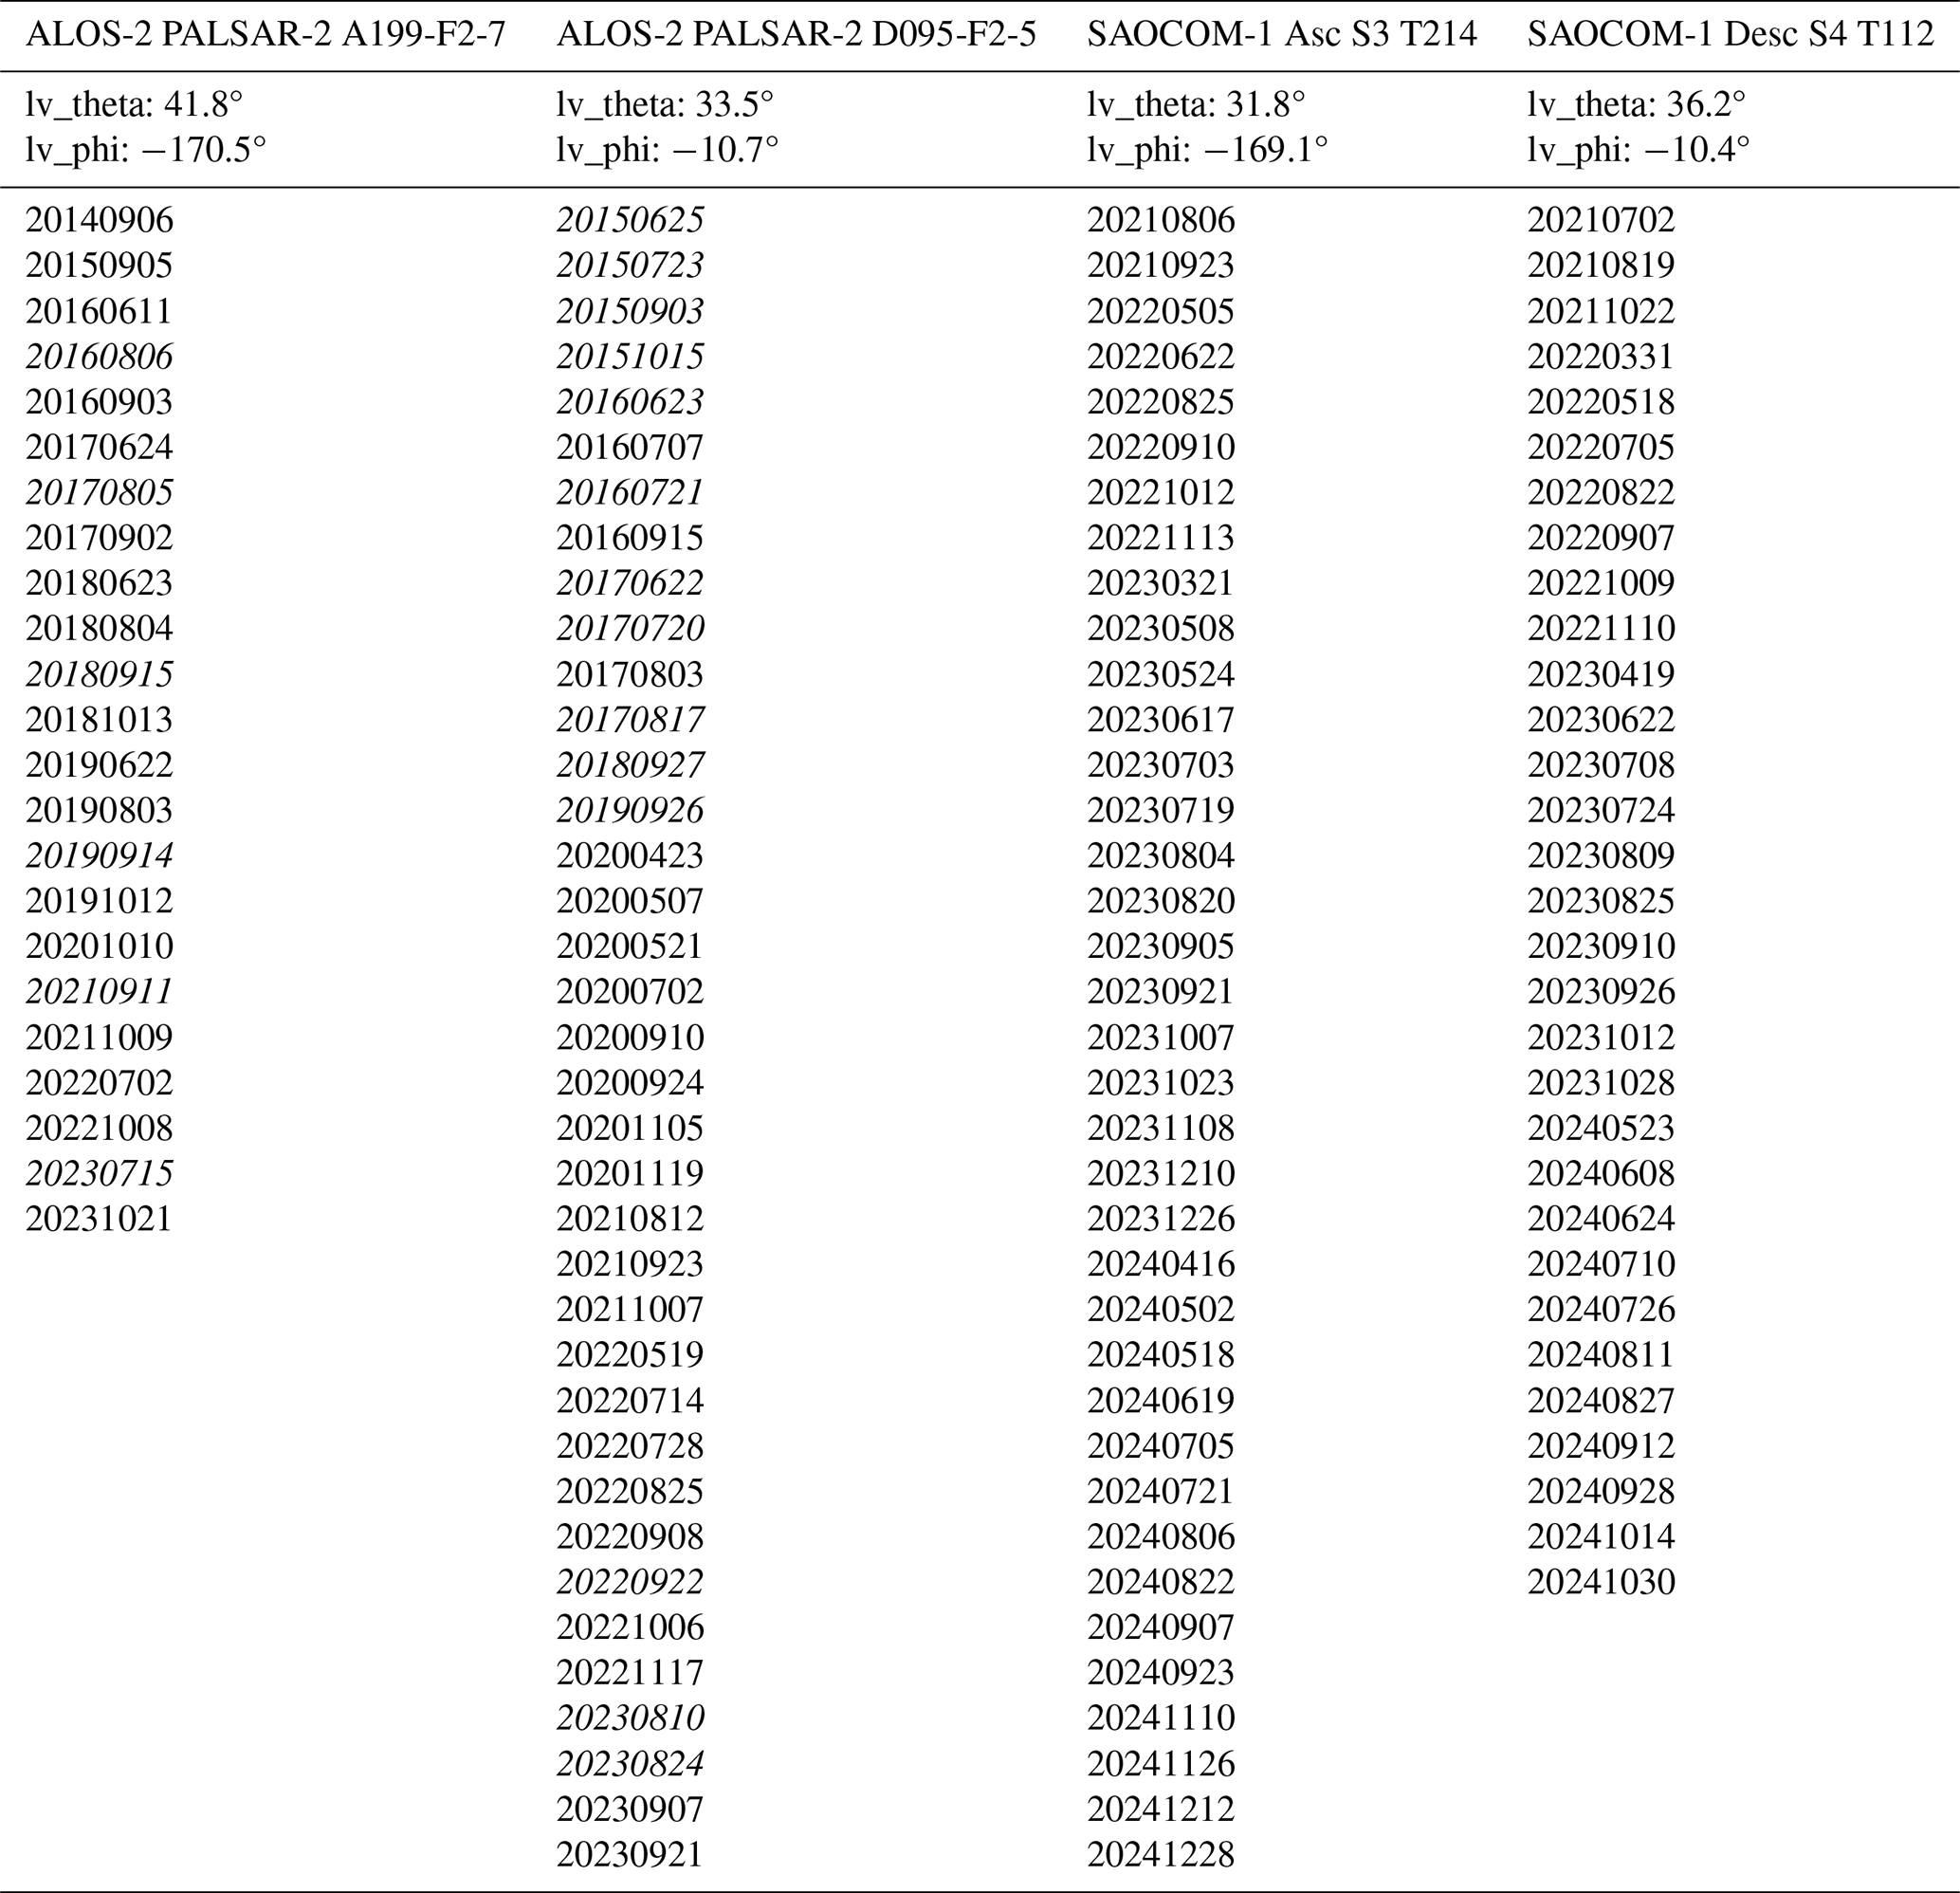
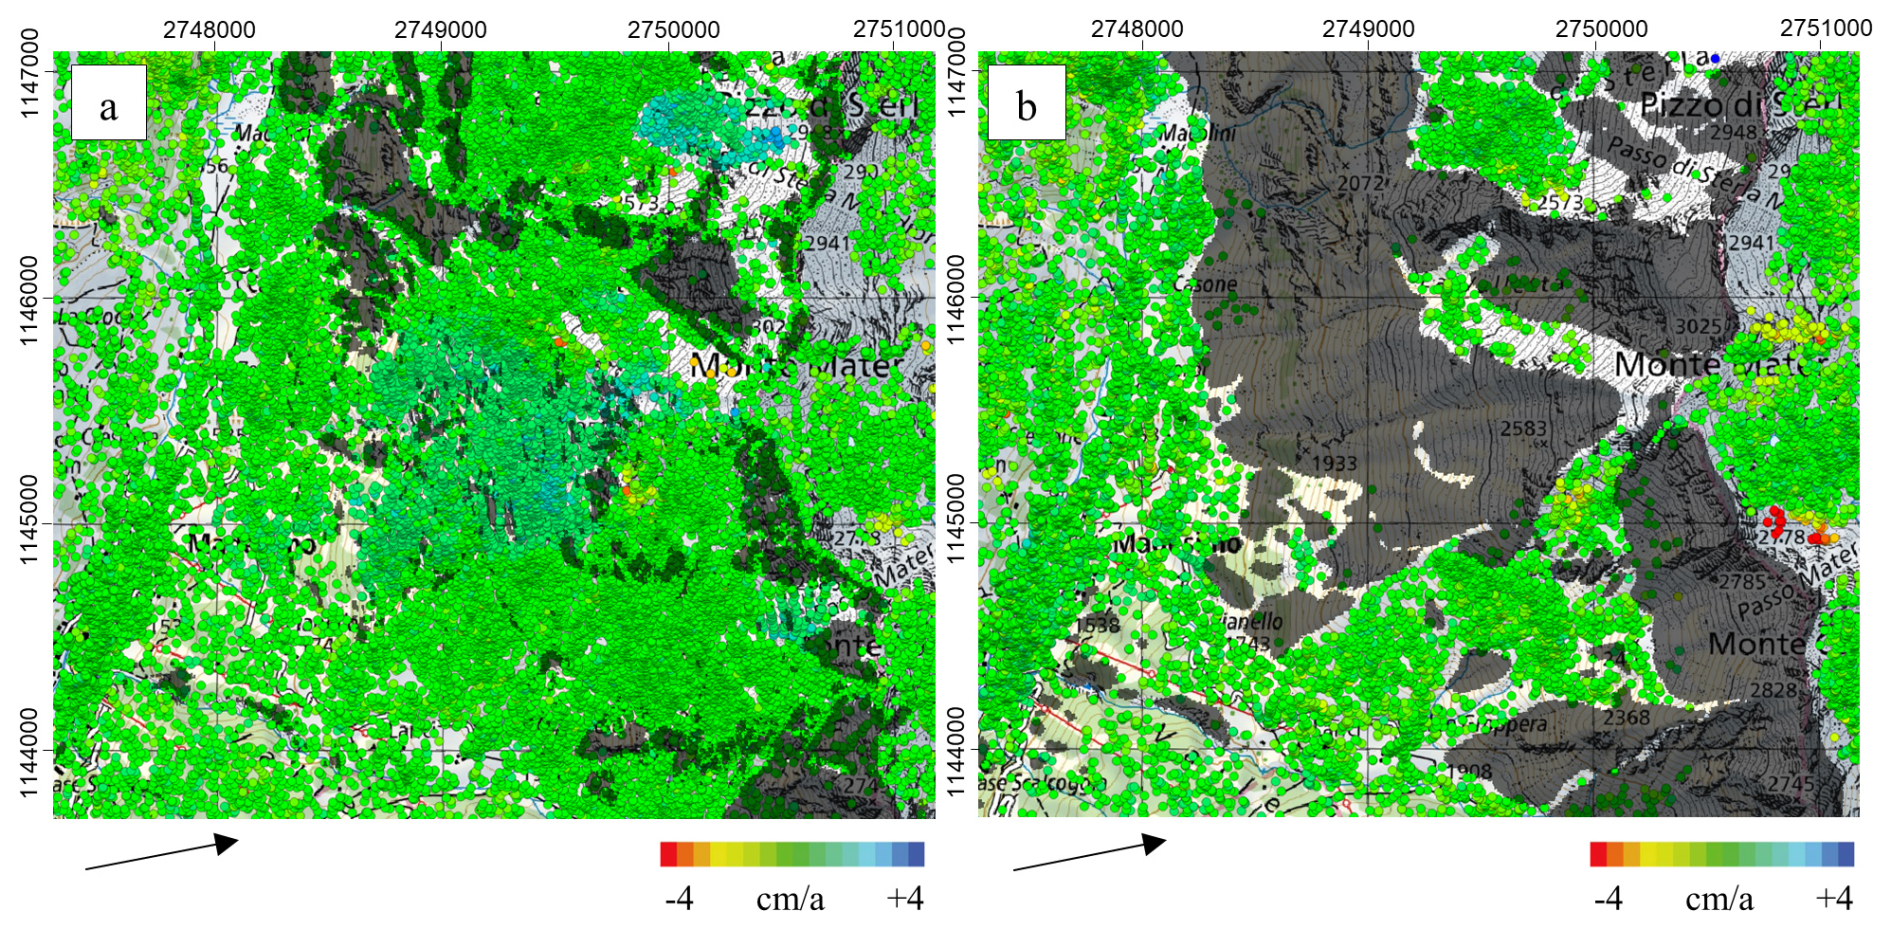
Figure A1Results of PSI analysis at Monte Mater with ascending ALOS-2 PALSAR-2 for the time period 2014–2023 (a) and SAOCOM-1 for the time period 2021–2024 (b). The arrows indicate the satellite LOS direction. Layover/shadow is shown in black. Image background is the Swiss National Map.
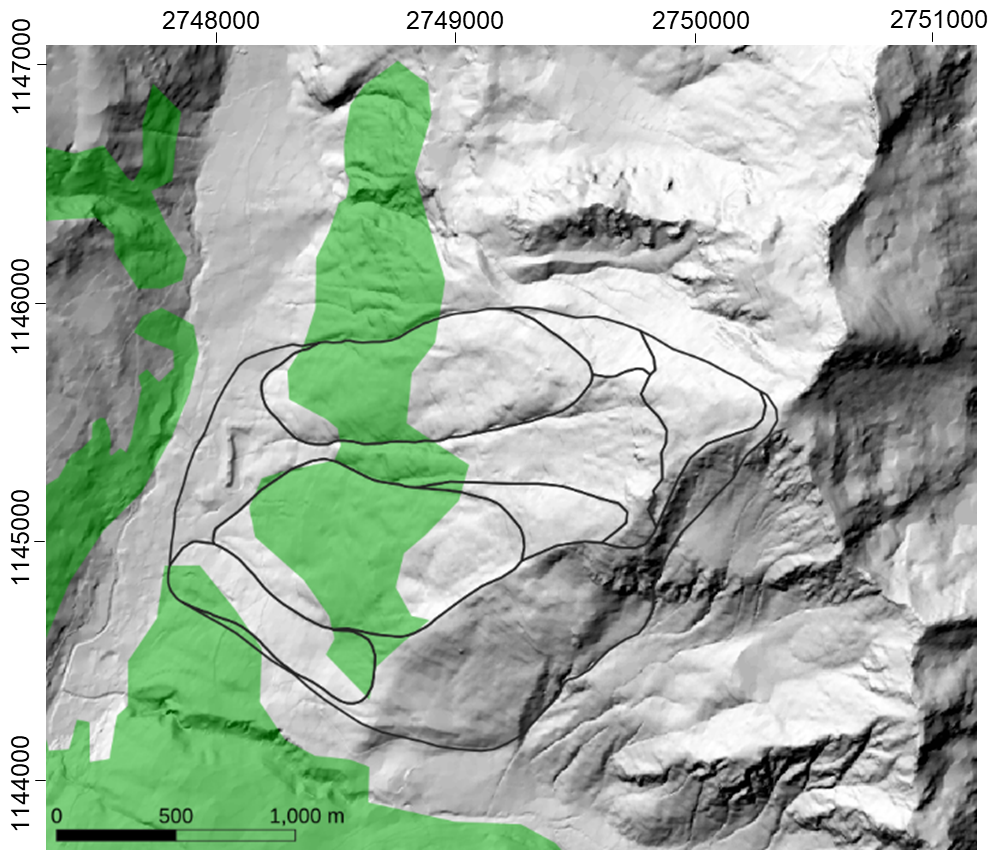
Figure A2Forest cover (green) from the CORINE Forest Land (CLC, https://land.copernicus.eu/en/products/corine-land-cover/) and outlines of the landslide complex (black; Crippa et al., 2020) at Monte Mater. Image background is the DEM shaded relief.
Table B1List of L-band satellite acquisitions used in the PSI analysis of Val Canaria. ALOS-2 PALSAR-2 ScanSAR data are shown in italics. Additionally, the mean SAR look vector incidence angle (lv_theta) and mean SAR look vector orientation (azimuth) angle (lv_phi) are included per sensor.
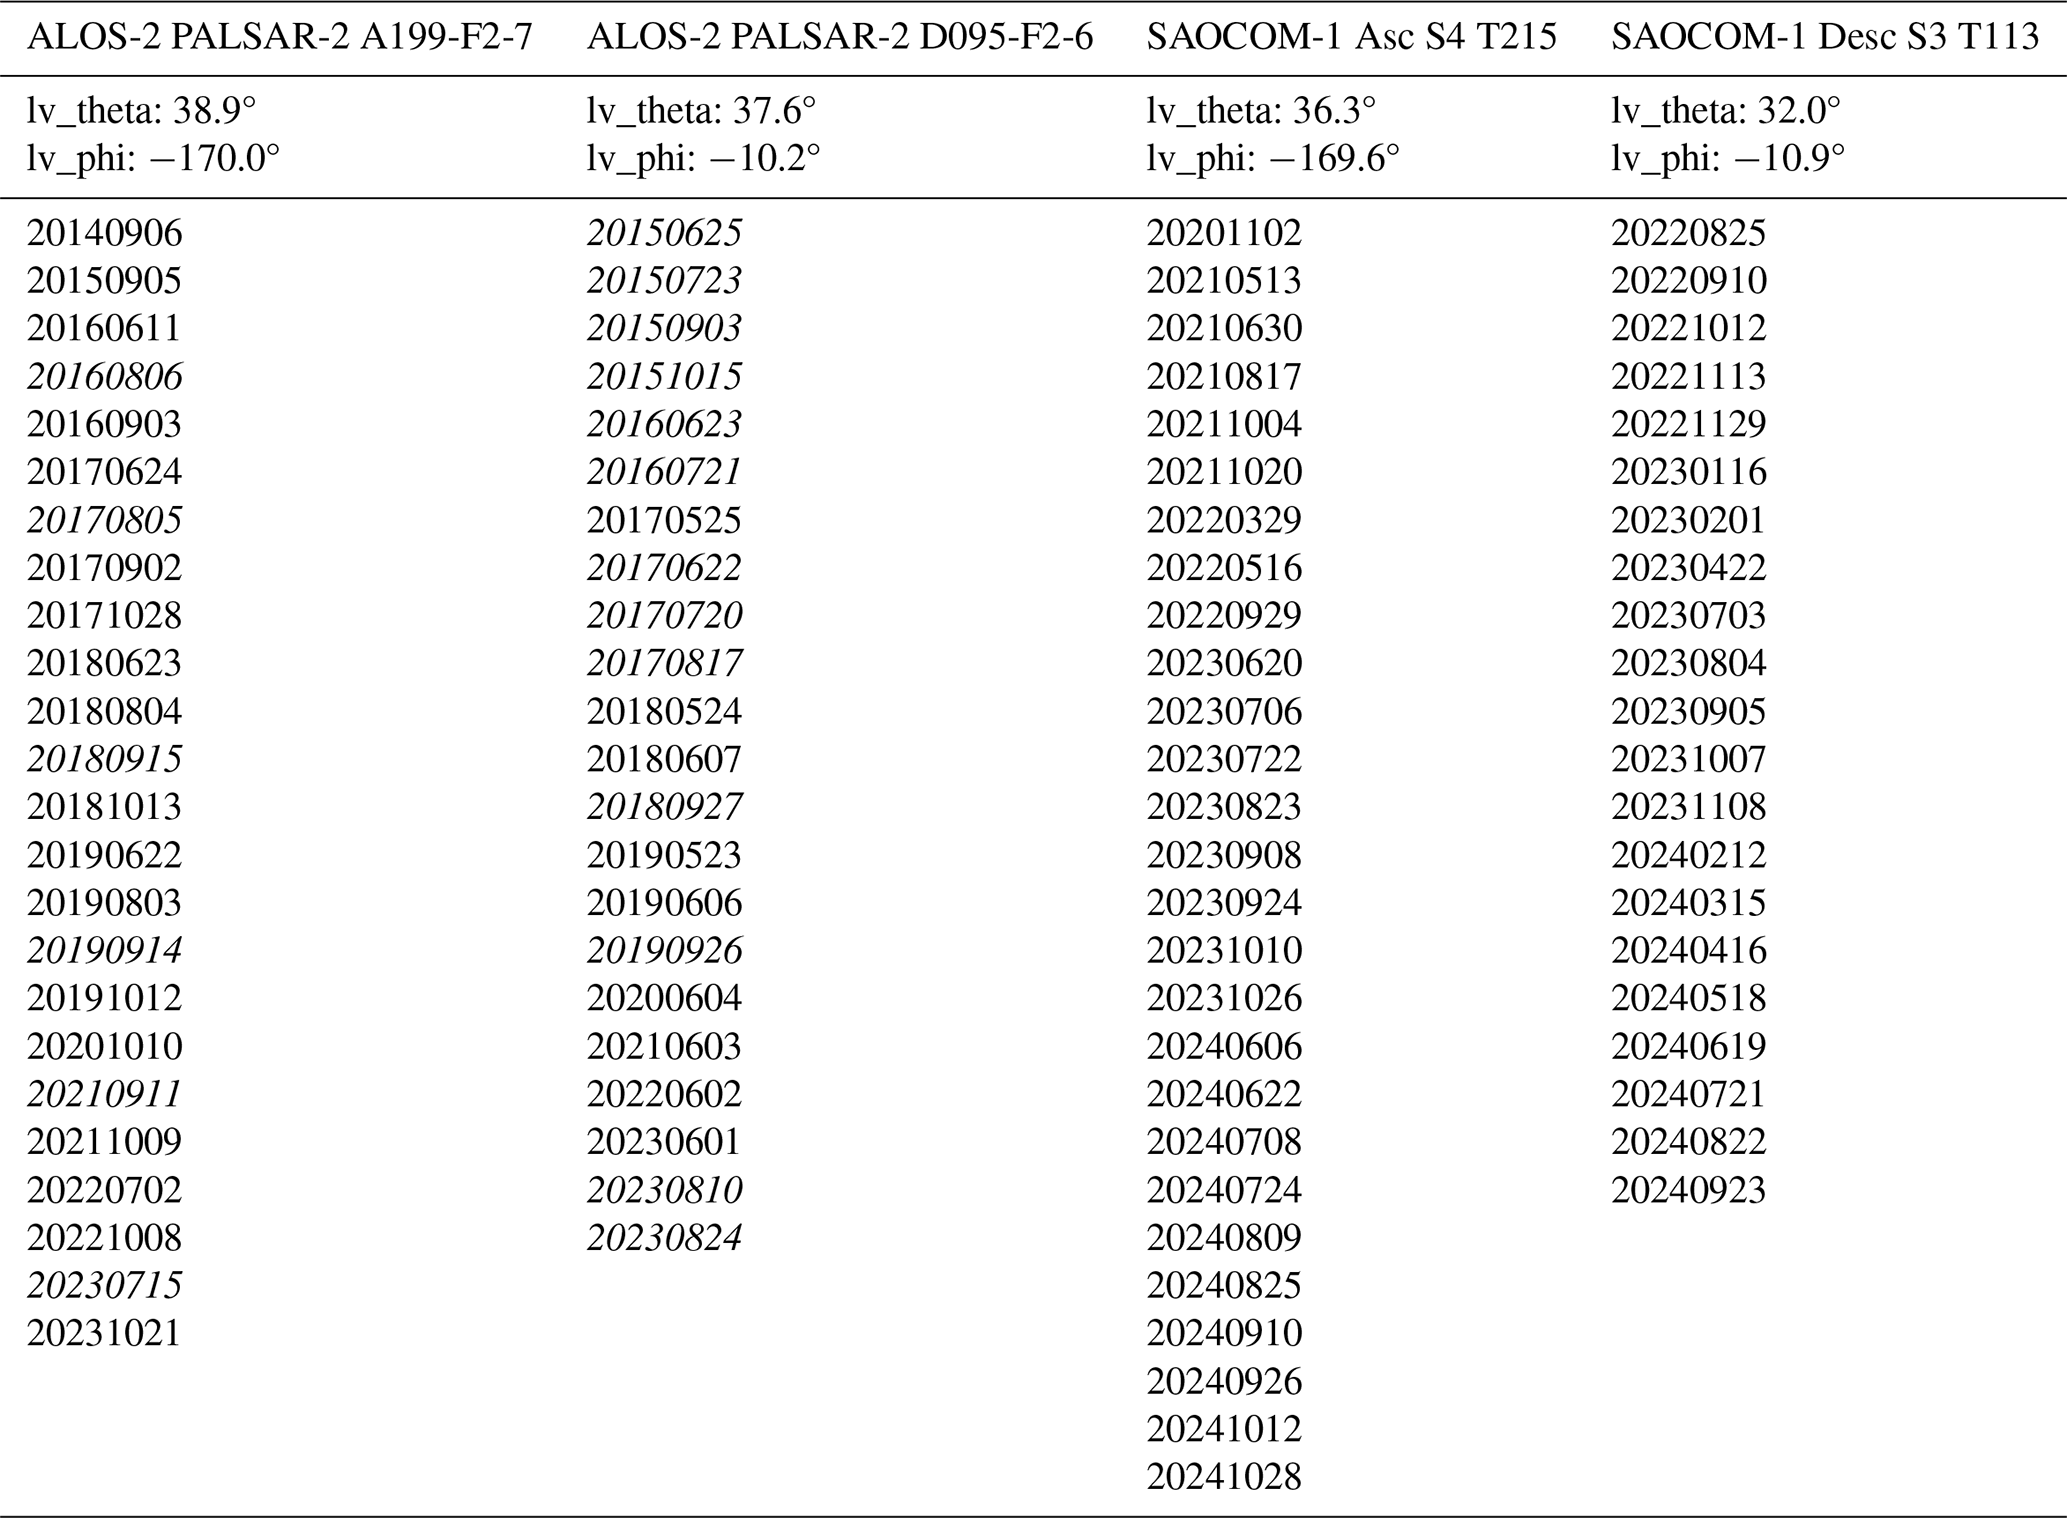
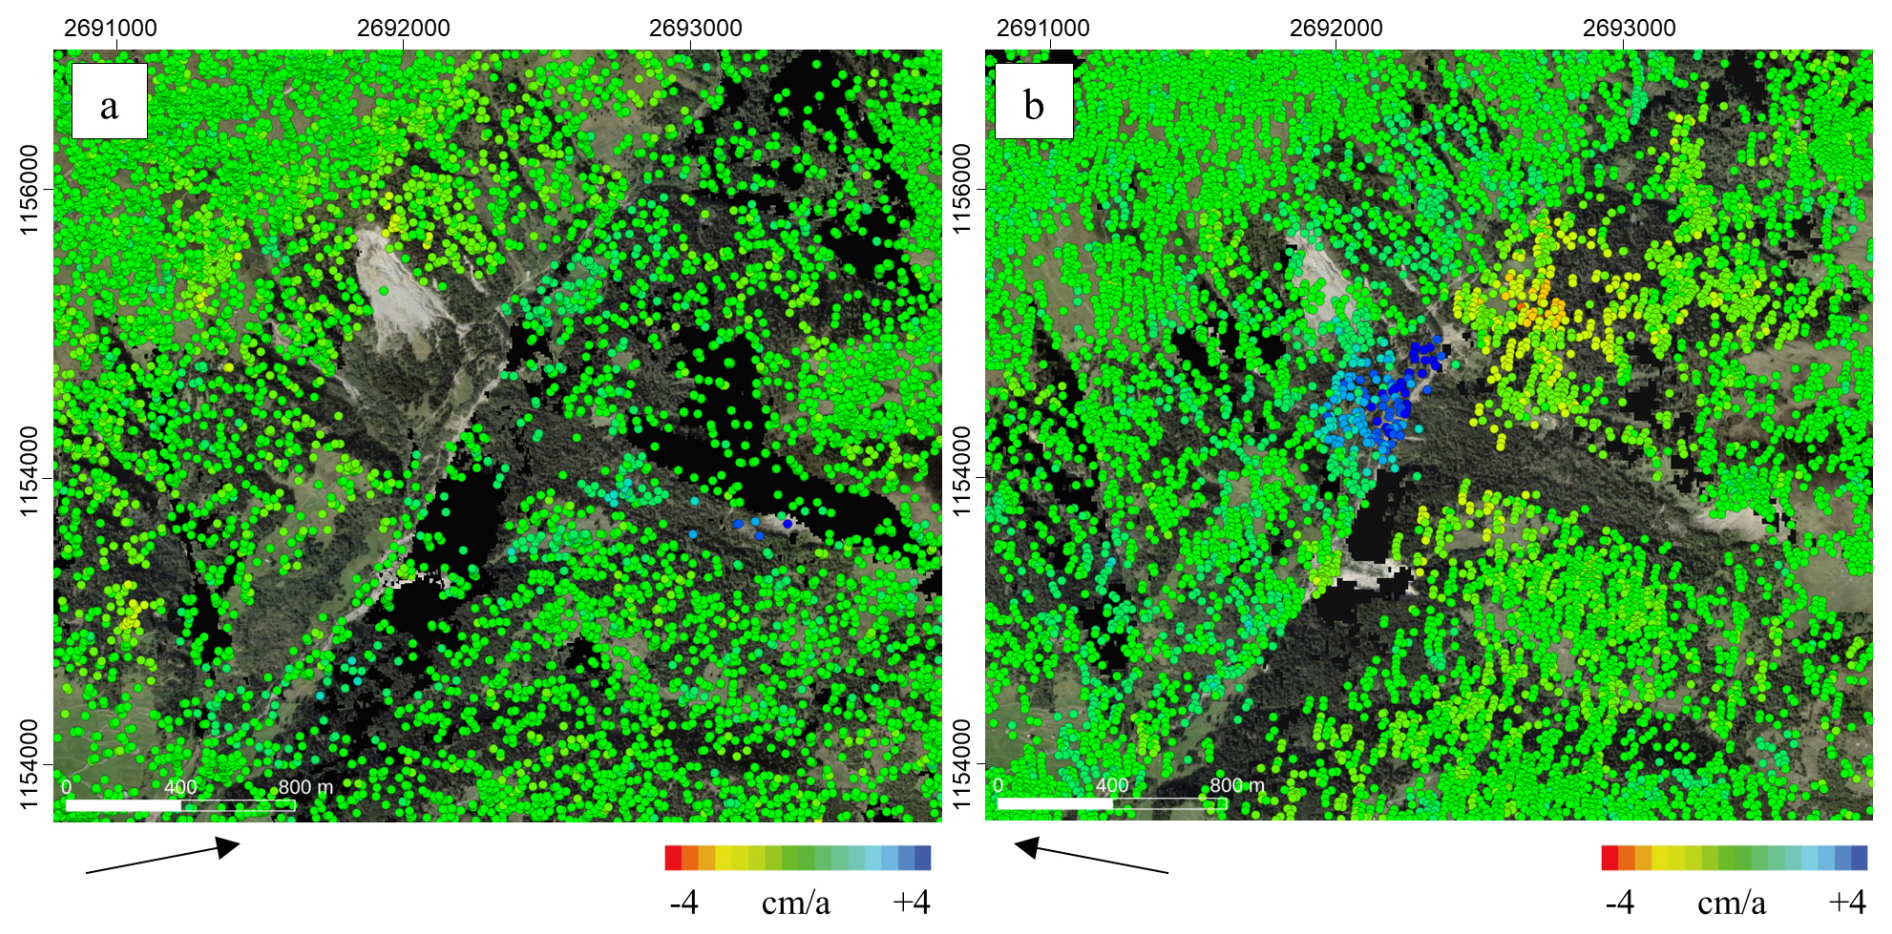
Figure B1Results of PSI analysis at Val Canaria with ascending ALOS-2 PALSAR-2 for the time period 2014–2023 (a) and descending ALOS-2 PALSAR-2 for the time period 2015–2023 (b). The arrows indicate the satellite LOS direction. Layover/shadow is shown in black. Image background is SWISSIMAGE.
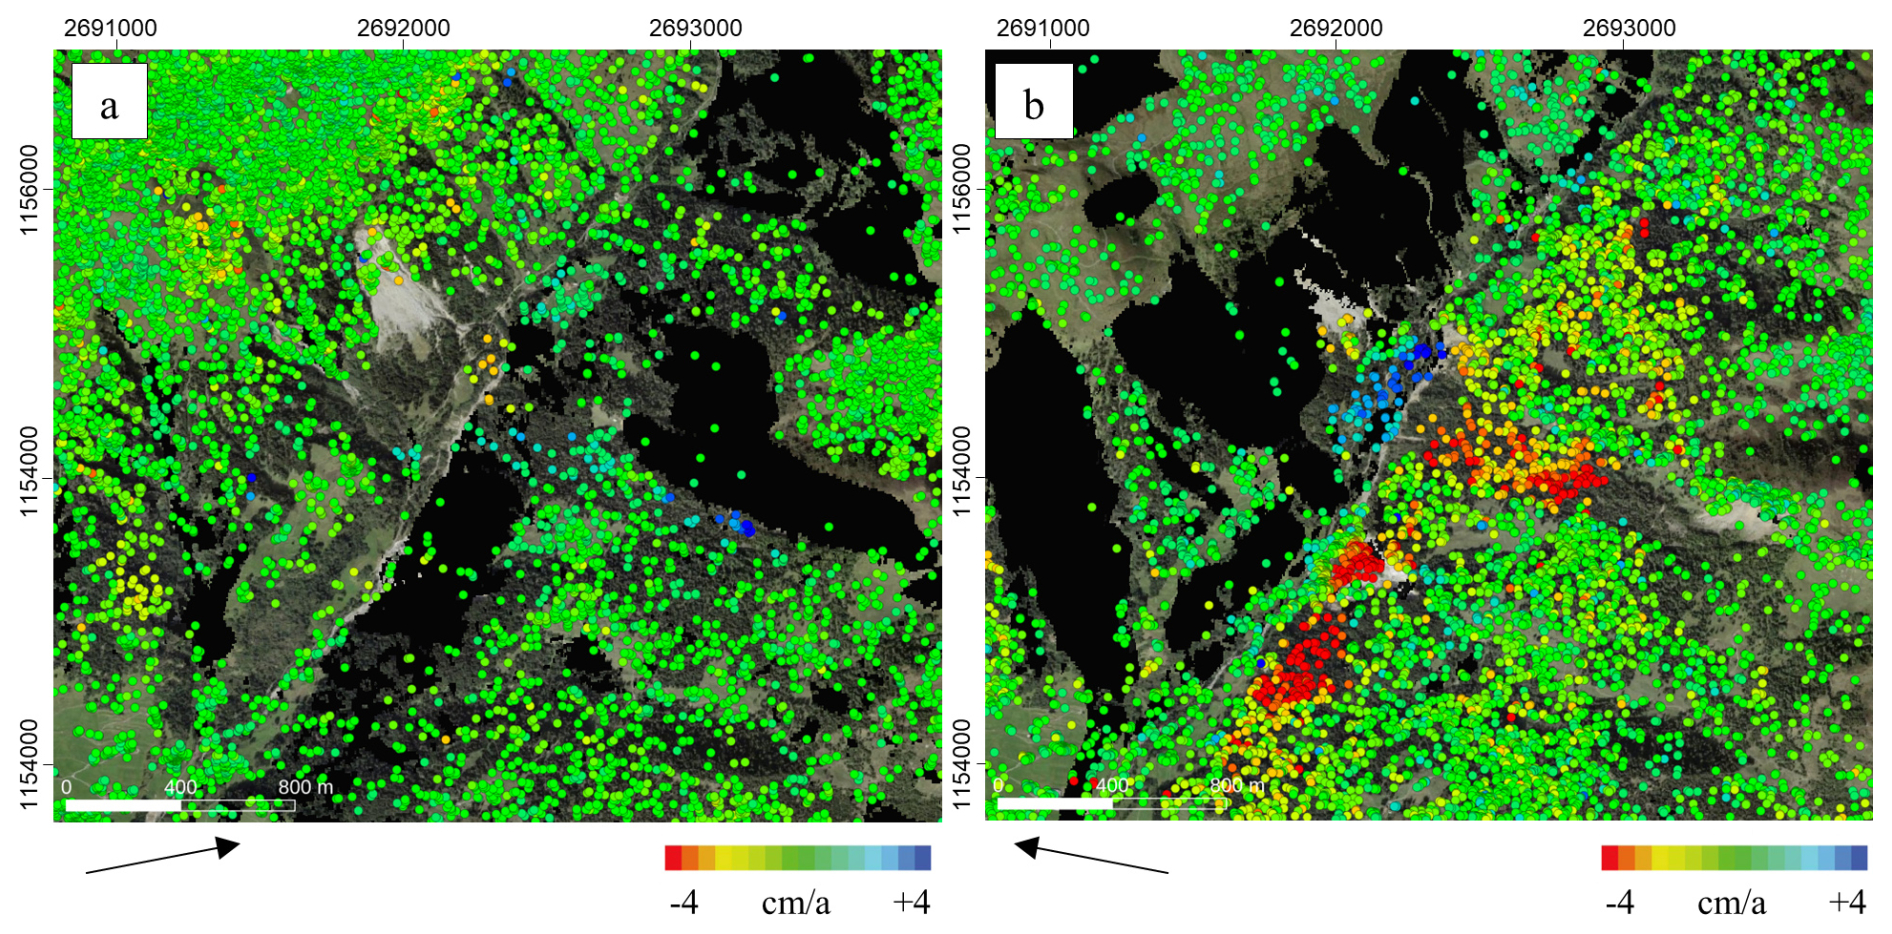
Figure B2Results of PSI analysis at Monte Mater with ascending SAOCOM-1 for the time period 2020–2024 (a) and descending SAOCOM-1 for the time period 2022–2024 (b). The arrows indicate the satellite LOS direction. Layover/shadow is shown in black. Image background is SWISSIMAGE.
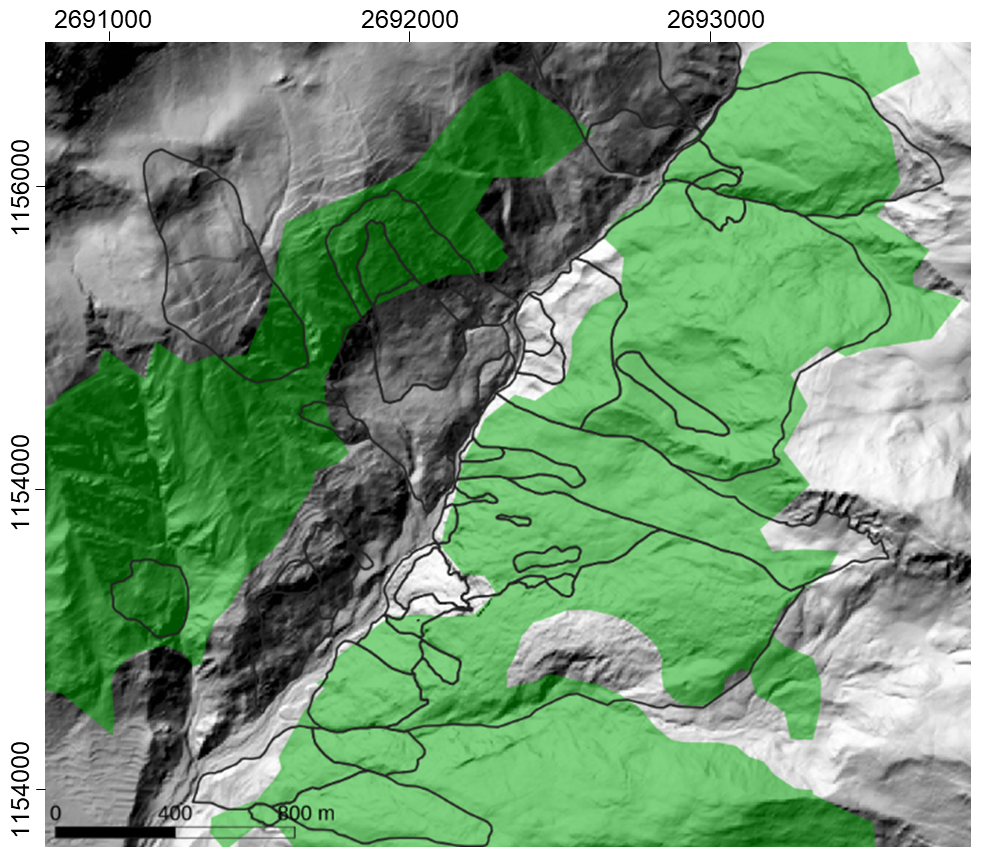
Figure B3Forest cover (green) from the CORINE Land Cover (CLC, https://land.copernicus.eu/en/products/corine-land-cover/) and inventoried slope instabilities (black; Alessandro De Pedrini, personal communication, 2025) in the Val Canaria. Image background is the DEM shaded relief.
Table C1List of L-band satellite acquisitions used in the PSI analysis of Brienz/Brinzauls. ALOS-2 PALSAR-2 ScanSAR data are shown in italics. Additionally, the mean SAR look vector incidence angle (lv_theta) and mean SAR look vector orientation (azimuth) angle (lv_phi) are included per sensor.
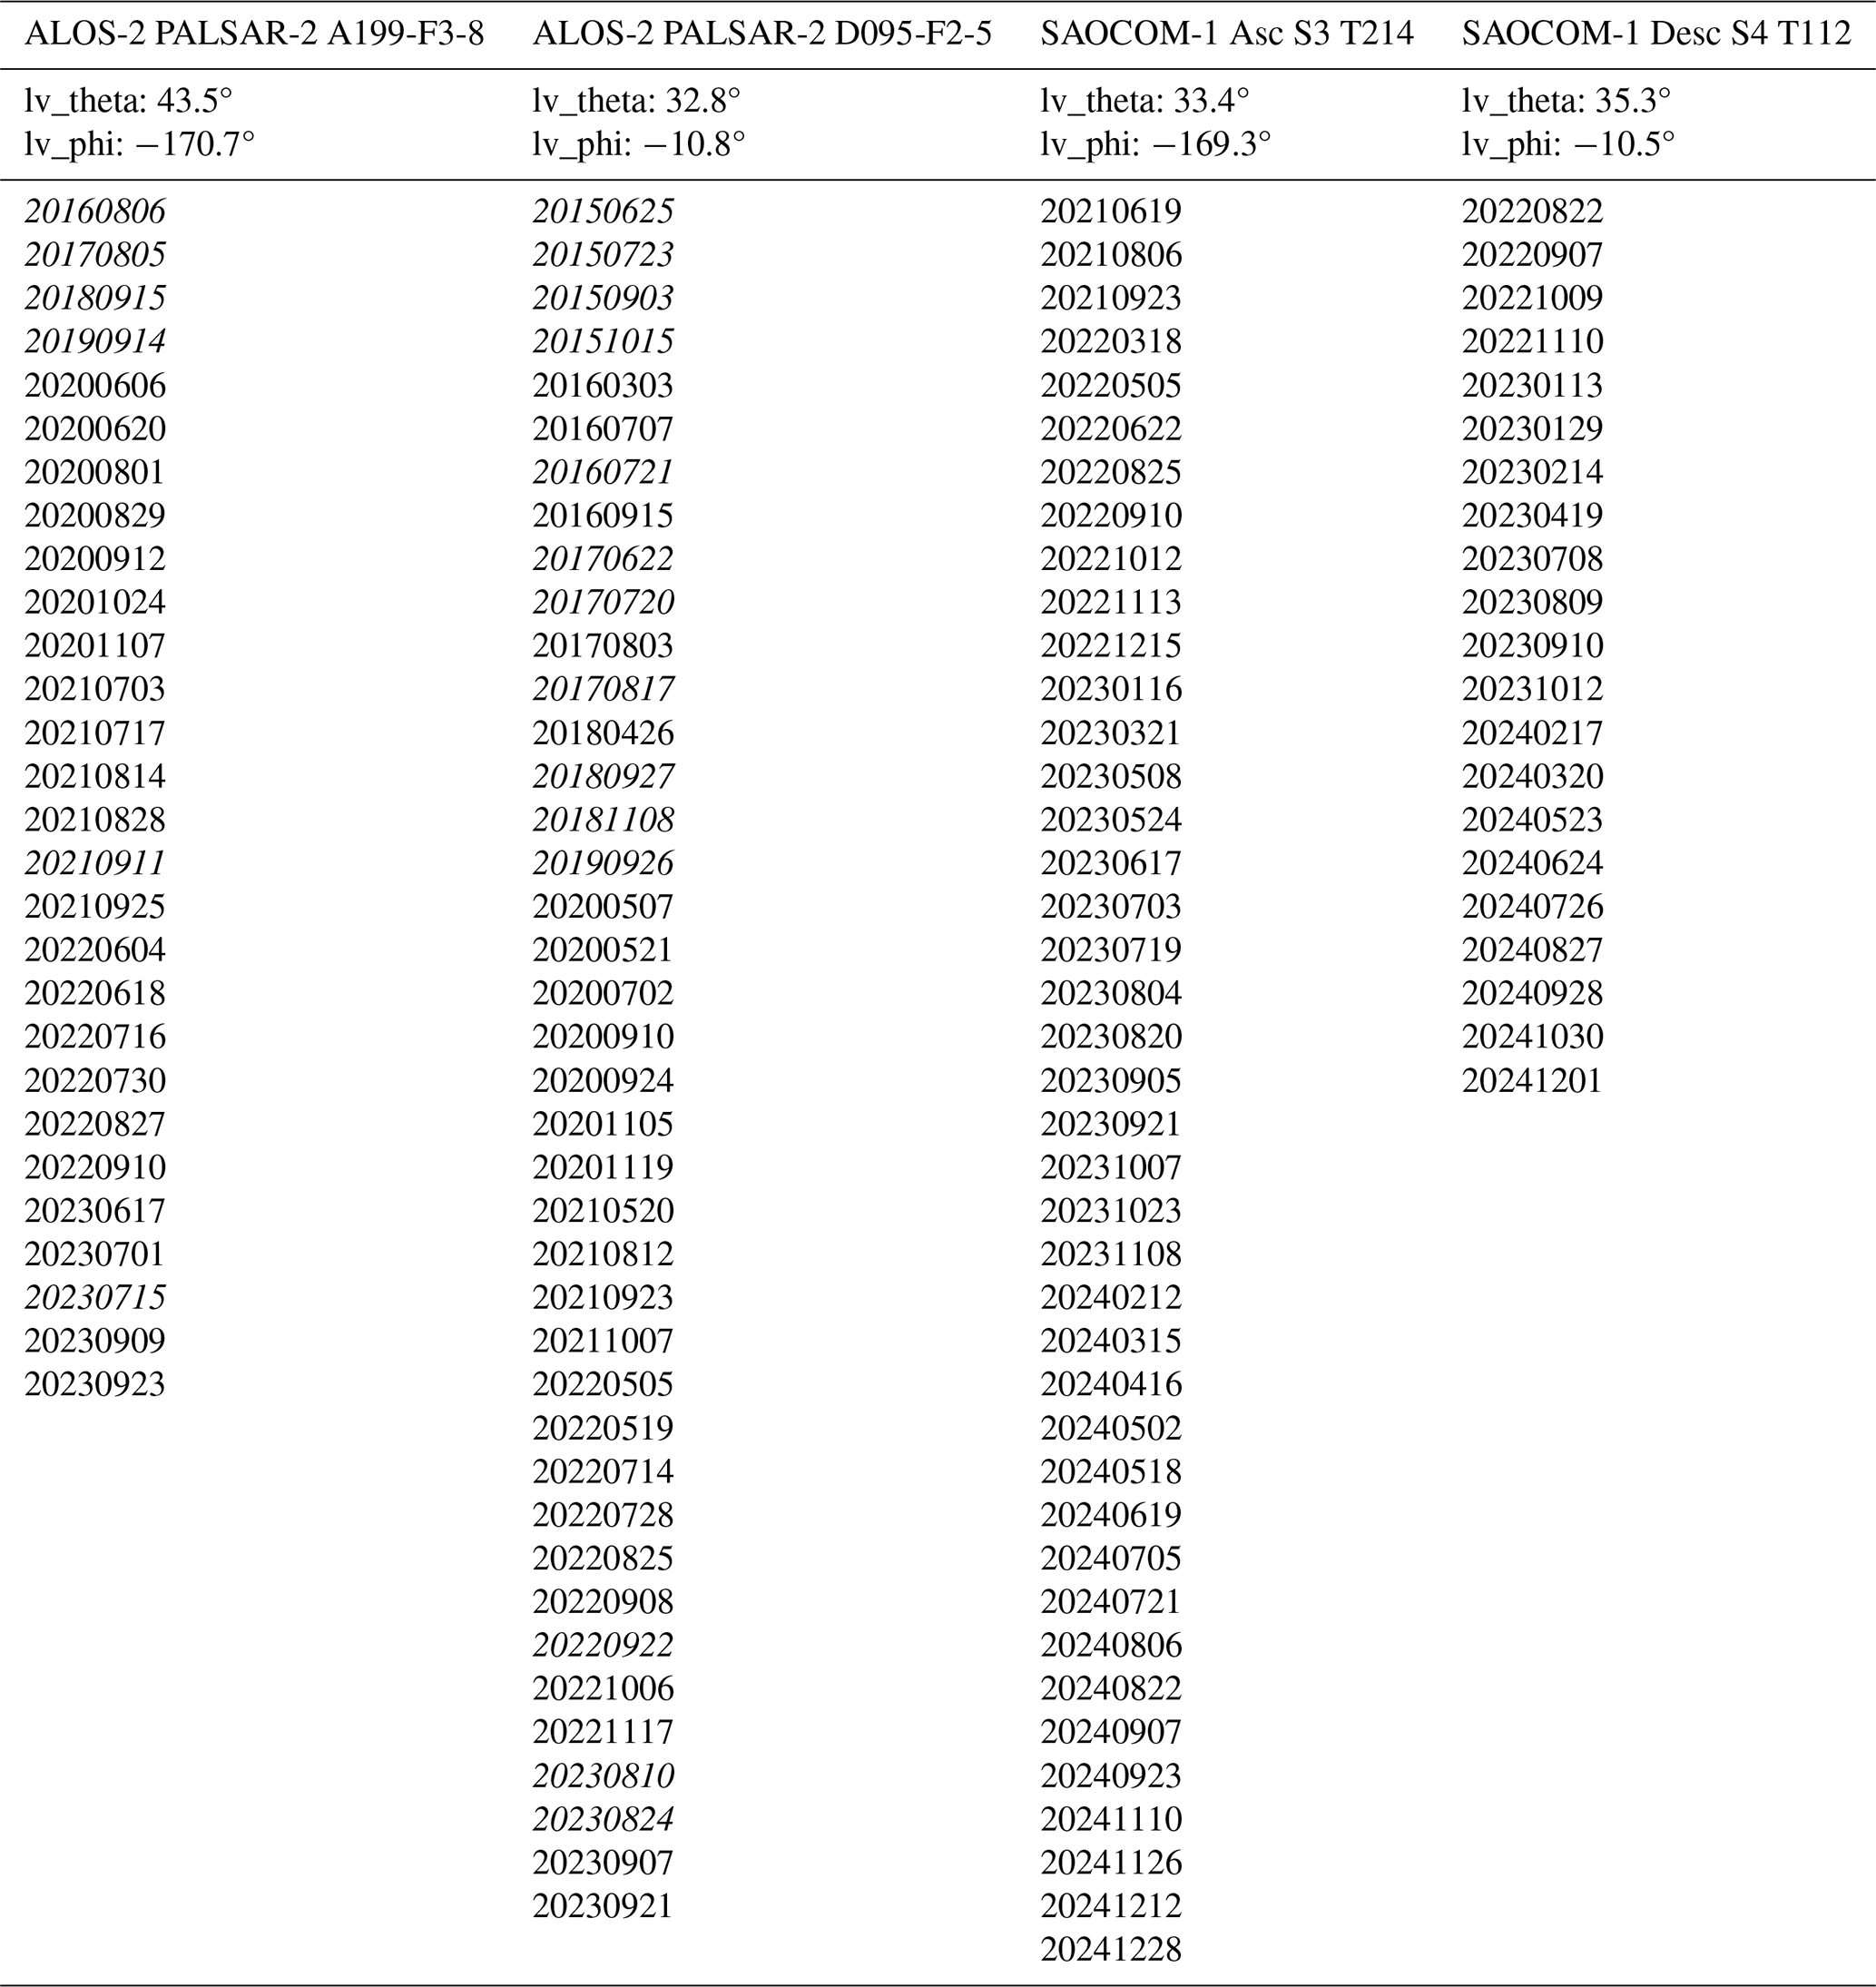
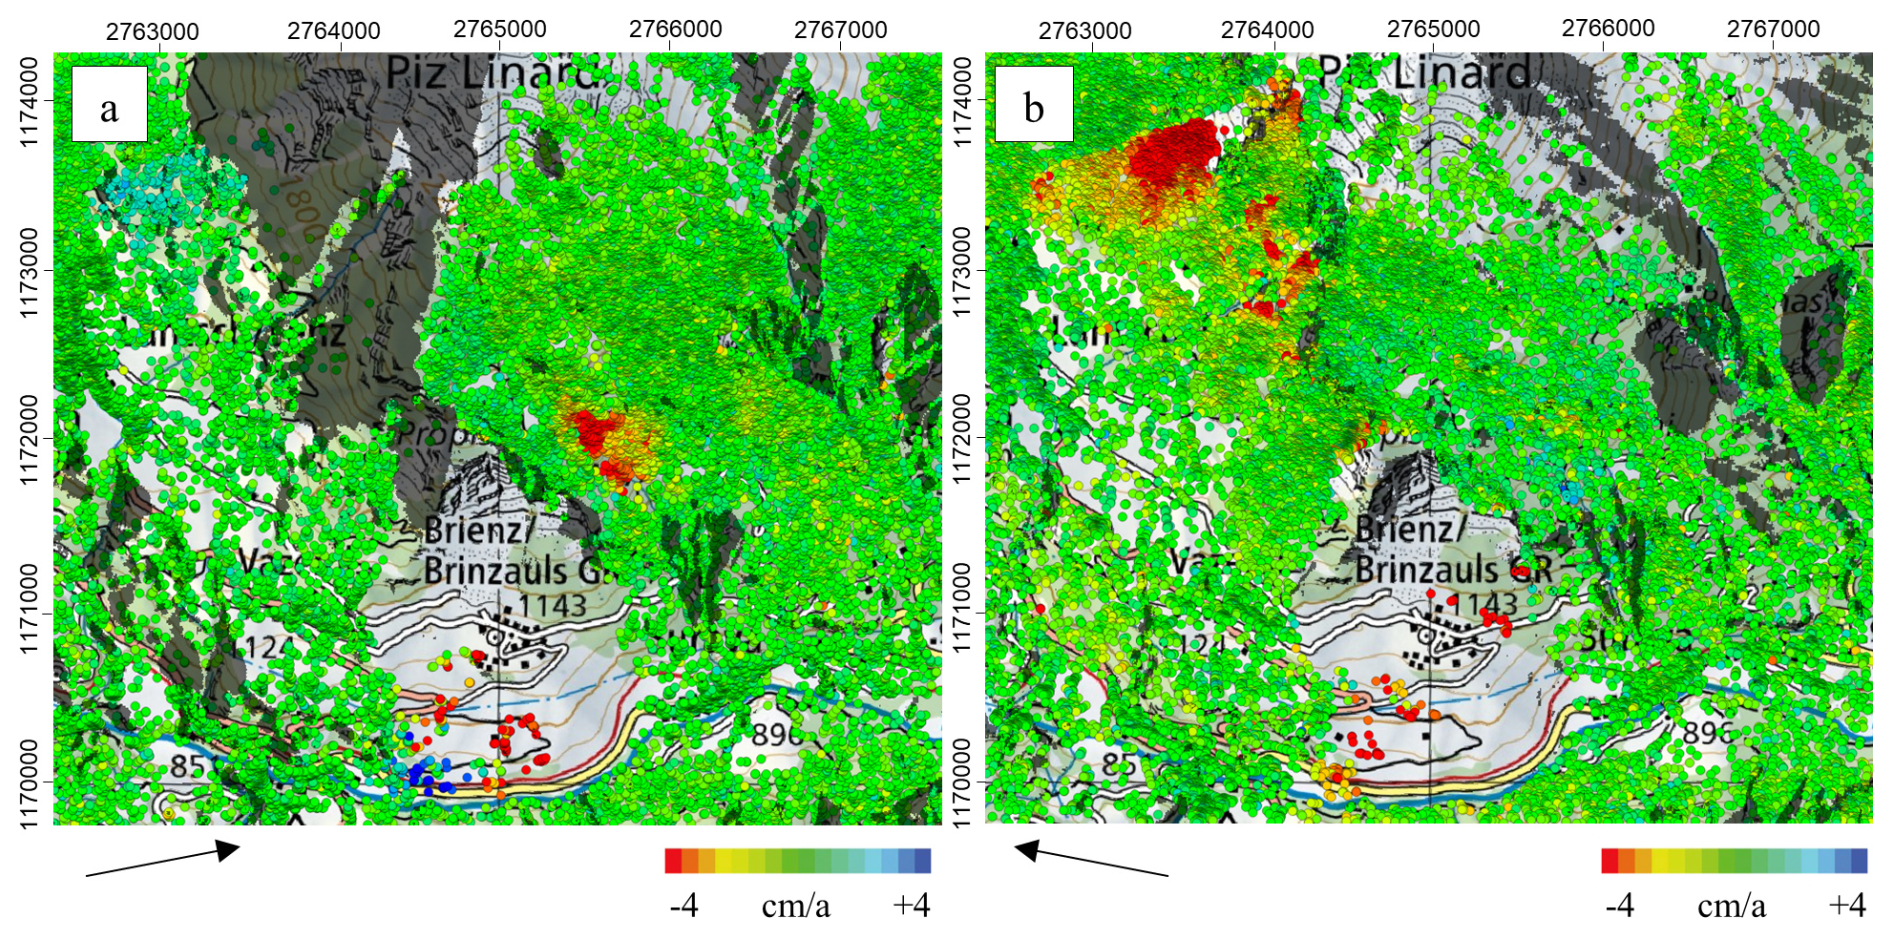
Figure C1Results of PSI analysis at Brienz with ascending SAOCOM-1 for the time period 2021–2024 (a) and descending SAOCOM-1 for the time period 2022–2024 (b). The arrows indicate the satellite LOS direction. Layover/shadow is shown in black. Image background is the Swiss National Map.
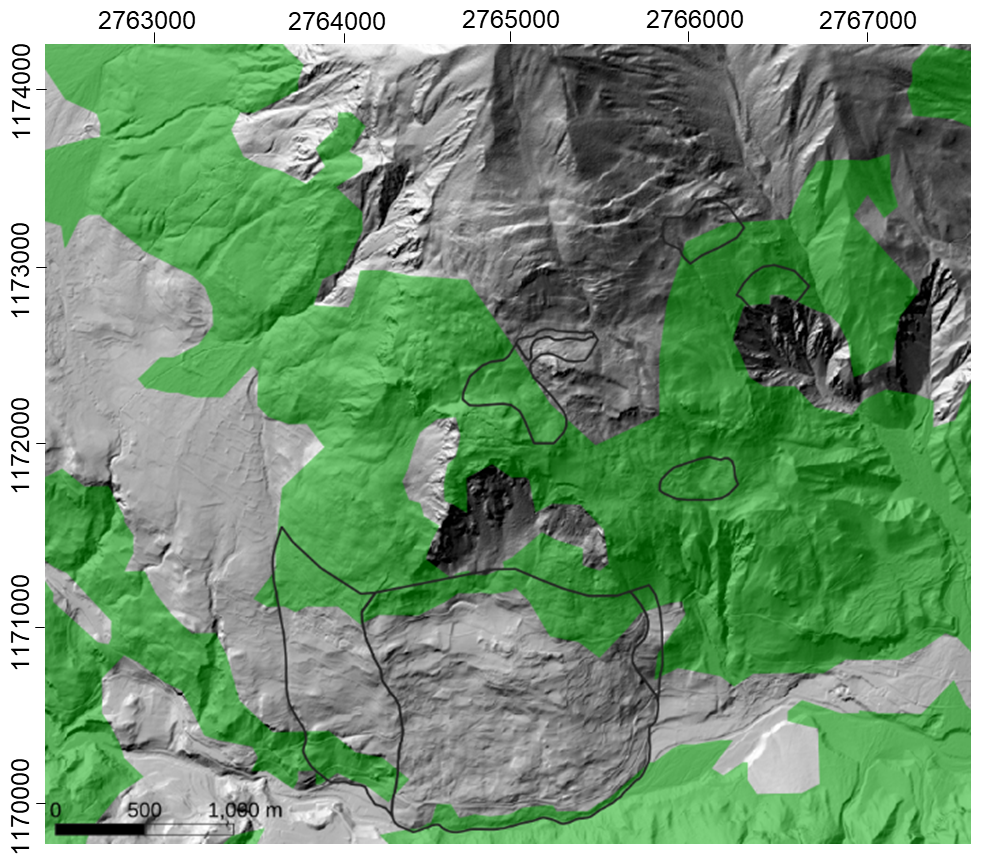
Figure C2Forest cover (green) from the CORINE Land Cover (CLC, https://land.copernicus.eu/en/products/corine-land-cover/) and outlines of landslide hazards (black; Geoportal Canton Grisons, https://map.geo.gr.ch, last access: 27 February 2026) at Brienz/Brinzauls. Image background is the DEM shaded relief.
Table C2Ascending SAOCOM-1 and descending ALOS-2 PALSAR-2 differential interferograms used for stacking at the Brienz study site.
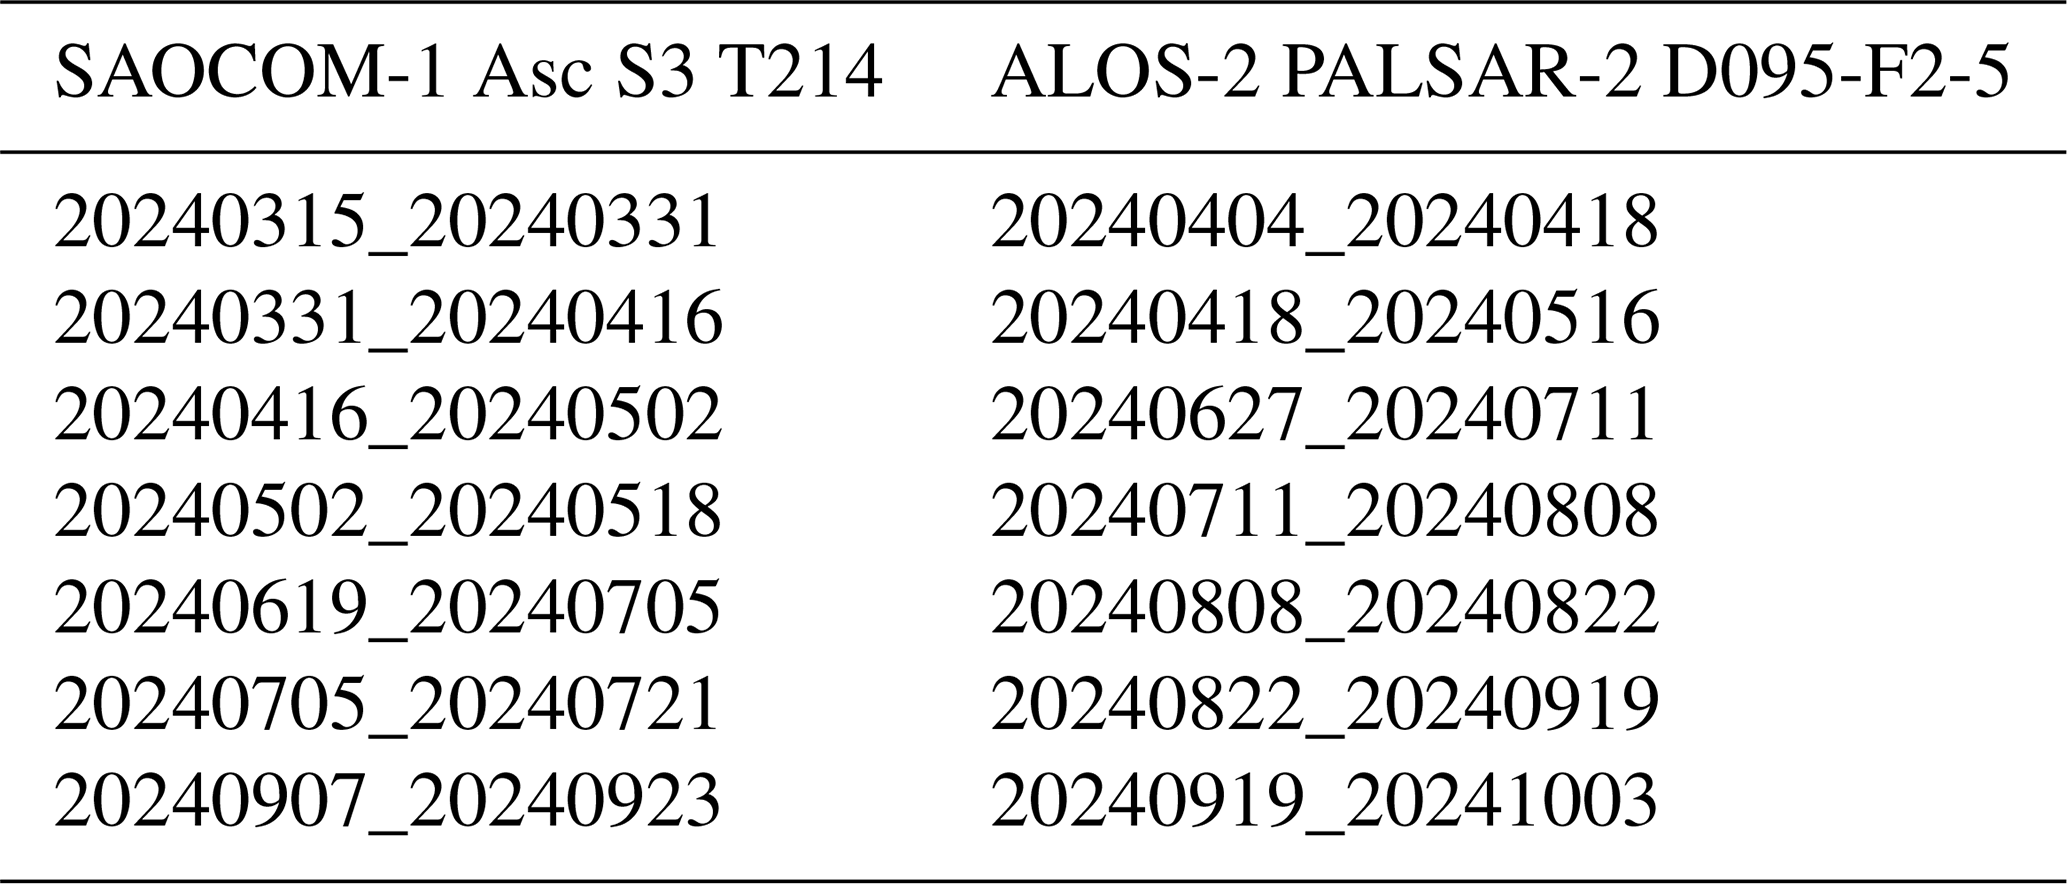
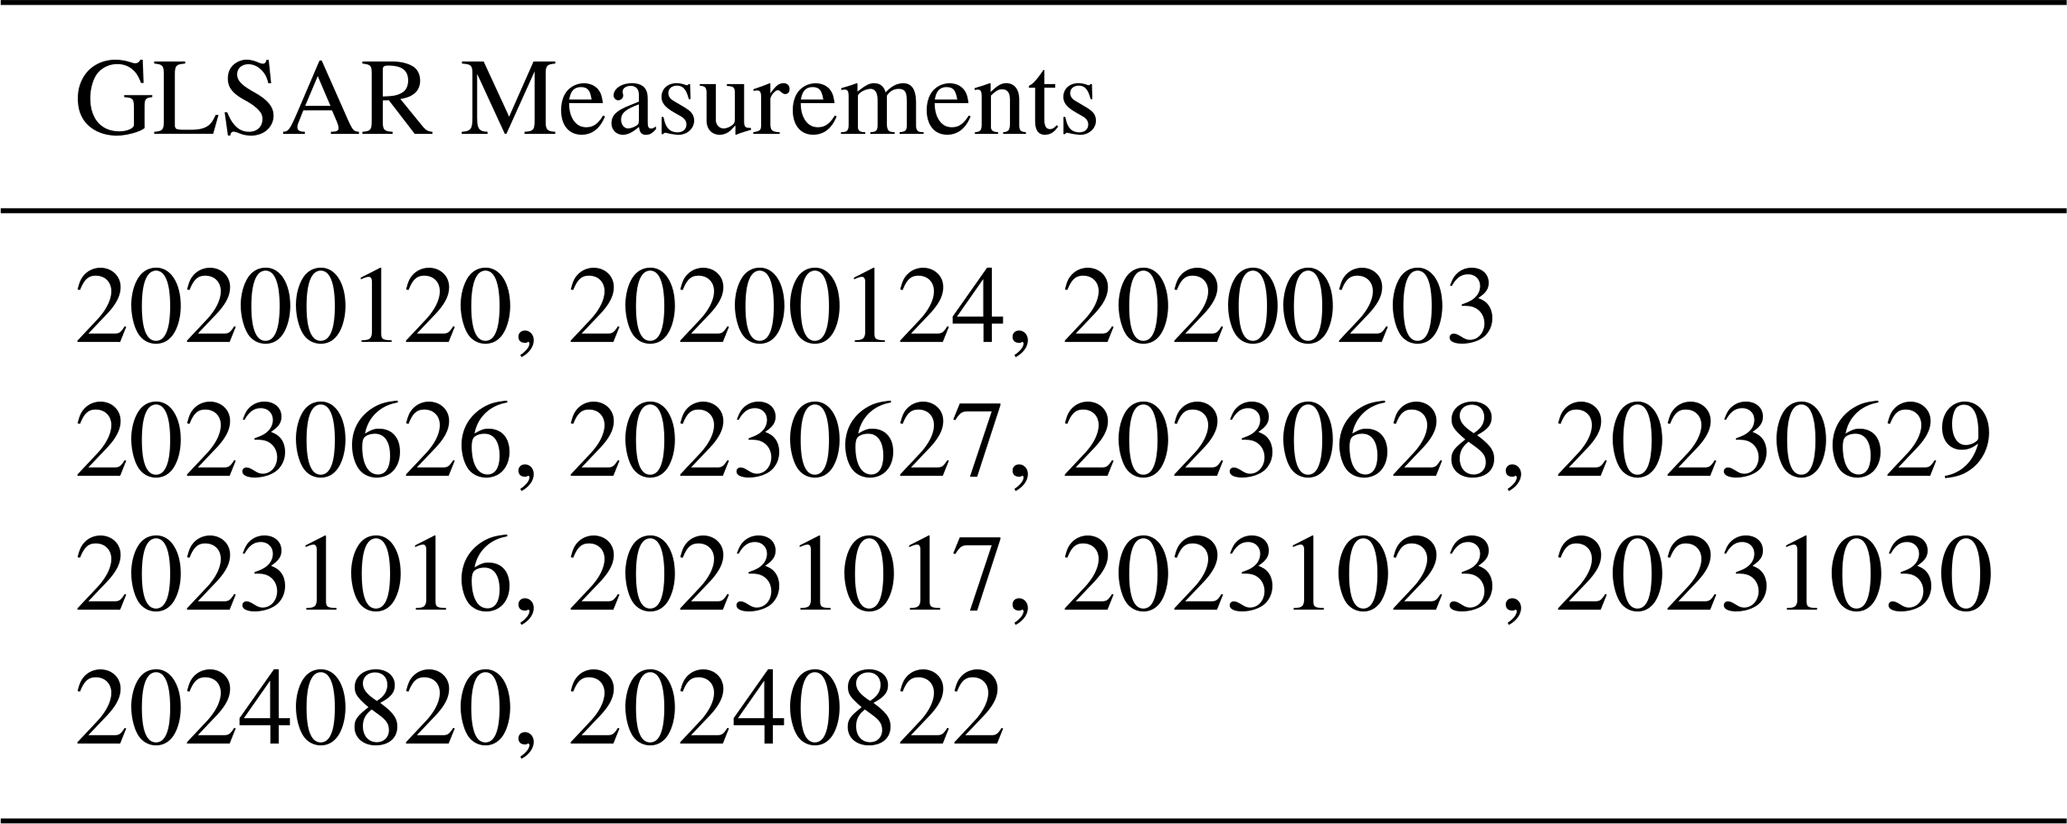
Table D1Theoretical velocity thresholds for standard DInSAR per sensor, calculated based on nominal wavelengths and revisit times (Manconi, 2021). These temporal phase aliasing thresholds refer to the case where the displacement of the target under investigation exceeds the threshold value of between two consecutive satellite acquisitions.
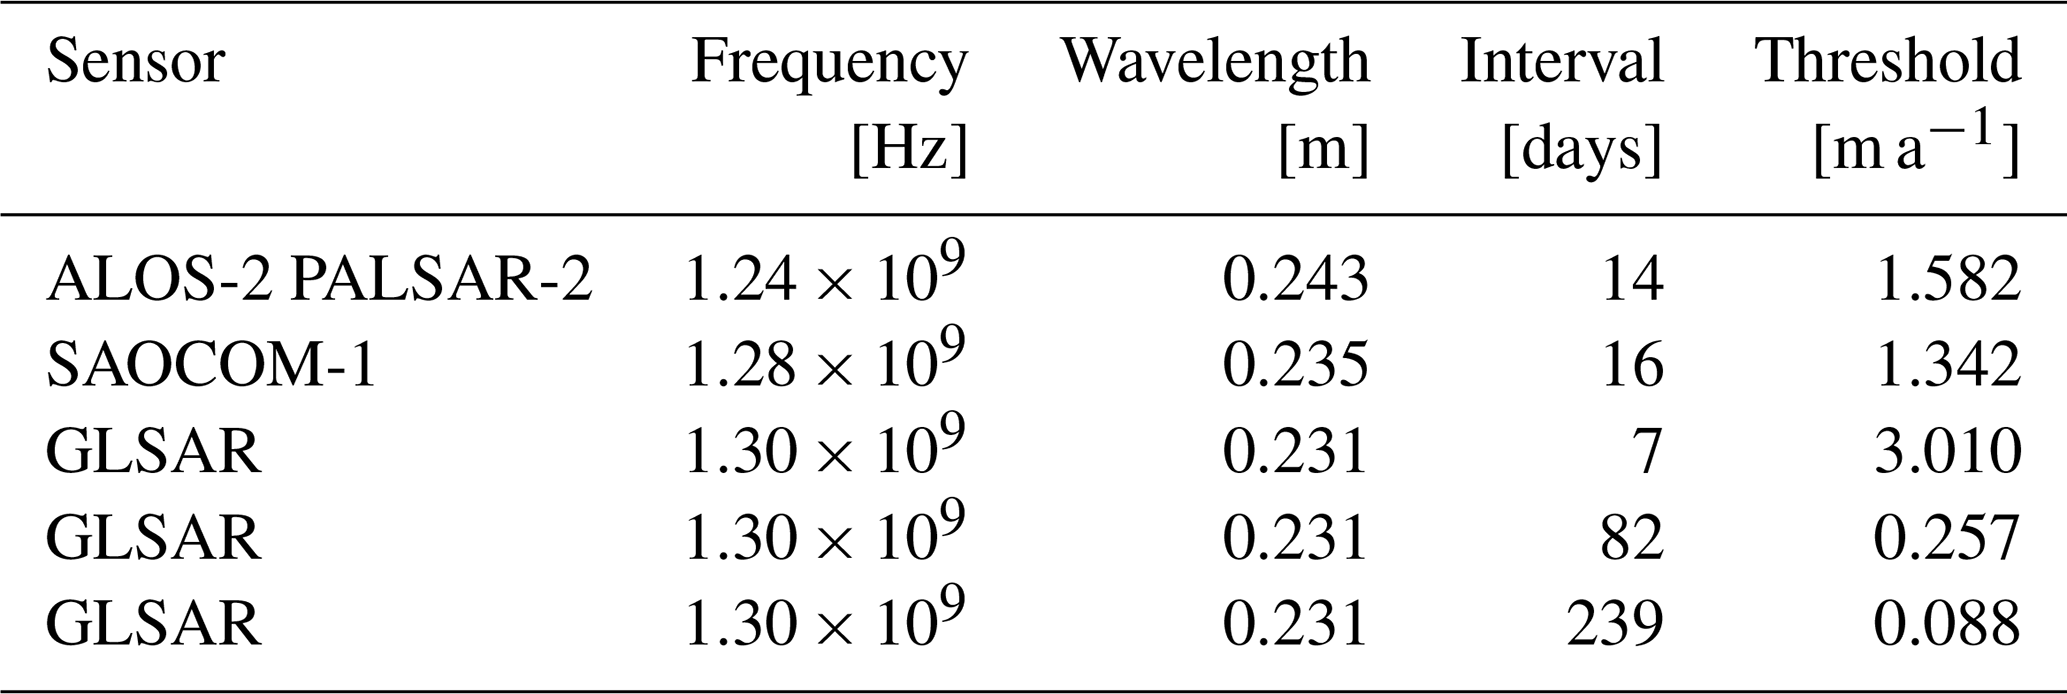
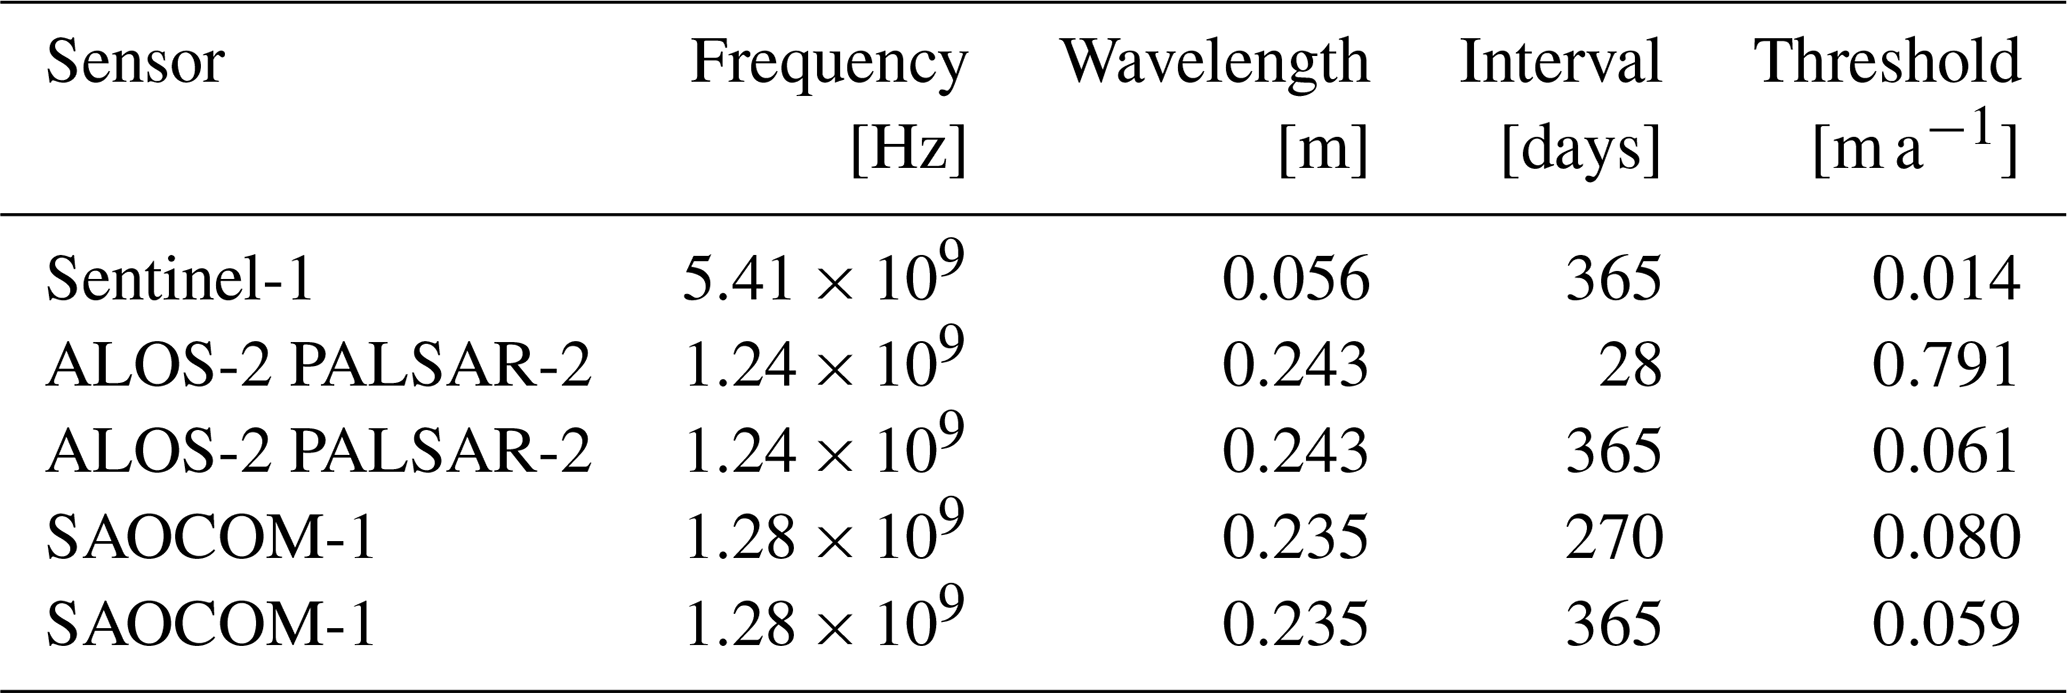
Table D2Theoretical velocity thresholds considering 28 d ALOS-2 PALSAR-2 used in the Brienz DInSAR stacking analysis (cf. Fig. 10), 270 d SAOCOM-1 used in the Val Canaria SBAS analysis (cf. Fig. 8) and 365 d intervals used for PSI analyses, calculated based on nominal wavelengths and revisit times (Manconi, 2021). These temporal phase aliasing thresholds refer to the case where the displacement of the target under investigation exceeds the threshold value of during the acquisition time intervals of the data used in each processing method.
The data generated by this work are available on request from the corresponding author.
Digital elevation models (DEM) at high spatial resolution are available for all three study sites through the regional or national authorities. For Monte Mater in Italy, the DTM 5X5, 2015 edition, is made available through Lombardia region's online geoportal Geoportale della Lombardia (https://www.geoportale.regione.lombardia.it/, last access: 17 April 2024). For the two Swiss sites at Val Canaria in Canton Ticino and Brienz in Canton Grisons, the 2 and 0.5 m resolution SwissAlti3D DEM is publicly available through swisstopo of the Federal Office of Topography (swissALTI3D: https://www.swisstopo.admin.ch/de/hoehenmodell-swissalti3d/, last access: 17 April 2024). Swiss National Map and SWISSIMAGE are publicly available through swisstopo of the Federal Office of Topography.
T.S. and A.M. conceived the study. T.S., N.J. and P.B. performed the satellite DInSAR processing. O.F. and R.C. performed the terrestrial measurements and DInSAR processing. F.A., A.D.P., C.A. and A.M. designed the validation methodology and interpreted the results. T.S. and N.J. wrote the paper. F.A., A.D.P., O.F., P.B., R.C., C.A. and A.M. reviewed the manuscript.
The contact author has declared that none of the authors has any competing interests.
Publisher's note: Copernicus Publications remains neutral with regard to jurisdictional claims made in the text, published maps, institutional affiliations, or any other geographical representation in this paper. The authors bear the ultimate responsibility for providing appropriate place names. Views expressed in the text are those of the authors and do not necessarily reflect the views of the publisher.
This work is supported by the MODULATE project (MOnitoring lanDslides with mUltiplatform L-Band rAdar Techniques) within the framework of the ESA's Earth Observation Science for Society component of the FutureEO-1 Segment 2 Programme (grant no. 4000143903/24/I-DT-bgh). We thank Thibault Taillade (ESA) for support and discussions and ARPA Lombardia, Regione Lombardia, Canton Ticino and Canton Grisons for providing validation data. ALOS-2 PALSAR-2 data are ©JAXA. SAOCOM-1 data are ©CONAE.
This research has been supported by the MODULATE project (MOnitoring lanDslides with mUltiplatform L-Band rAdar Techniques) within the framework of the ESA’s Earth Observation Science for Society component of the FutureEO-1 Segment 2 Programme (grant no. 4000143903/24/I-DT-bgh).
This paper was edited by Mihai Niculita and reviewed by two anonymous referees.
Agliardi, F. and Crippa, C.: Deep-Seated Gravitational Slope Deformations, Treatise on Geomorphology, 183–199, https://doi.org/10.1016/b978-0-12-818234-5.00182-6, 2022.
Agliardi, F., Riva, F., Barbarano, M., Zanchetta, S., Scotti, R., and Zanchi, A.: Effects of tectonic structures and long-term seismicity on paraglacial giant slope deformations: Piz Dora (Switzerland), Eng. Geol., 263, 105353, https://doi.org/10.1016/j.enggeo.2019.105353, 2019.
Agliardi, F., Scuderi, M. M., Fusi, N., and Collettini, C.: Slow-to-fast transition of giant creeping rockslides modulated by undrained loading in basal shear zones, Nat. Commun., 11, https://doi.org/10.1038/s41467-020-15093-3, 2020.
Ambrosi, C., Strozzi, T., Scapozza, C., and Wegmüller, U.: Landslide hazard assessment in the Himalayas (Nepal and Bhutan) based on Earth-Observation data, Eng. Geol., 237, 217–228, https://doi.org/10.1016/j.enggeo.2018.02.020, 2018.
Barra, A., Monserrat, O., Crosetto, M., Cuevas-Gonzalez, M., Devanthéry, N., Luzi, G., and Crippa, B.: Sentinel-1 Data Analysis for Landslide Detection and Mapping: First Experiences in Italy and Spain, Advancing Culture of Living with Landslides, 201–208, https://doi.org/10.1007/978-3-319-53487-9_23, 2017.
Berardino, P., Fornaro, G., Lanari, R., and Sansosti, E.: A new algorithm for surface deformation monitoring based on small baseline differential SAR interferograms, IEEE T. Geosci. Remote, 40, 2375–2383, https://doi.org/10.1109/tgrs.2002.803792, 2002.
Bianchini, S., Herrera, G., Mateos, R., Notti, D., Garcia, I., Mora, O., and Moretti, S.: Landslide Activity Maps Generation by Means of Persistent Scatterer Interferometry, Remote Sens., 5, 6198–6222, https://doi.org/10.3390/rs5126198, 2013.
Bürgmann, R., Rosen, P. A., and Fielding, E. J.: Synthetic Aperture Radar Interferometry to Measure Earth's Surface Topography and Its Deformation, Annu. Rev. Earth Planet. Sci., 28, 169–209, https://doi.org/10.1146/annurev.earth.28.1.169, 2000.
Caduff, R. and Strozzi, T.: Terrestrial Radar Interferometry Monitoring During a Landslide Emergency 2016, Ghirone, Switzerland, Advancing Culture of Living with Landslides, 301–309, https://doi.org/10.1007/978-3-319-53487-9_34, 2017.
Caduff, R., Schlunegger, F., Kos, A., and Wiesmann, A.: A review of terrestrial radar interferometry for measuring surface change in the geosciences, Earth Surf. Proc. Land., 40, 208–228, https://doi.org/10.1002/esp.3656, 2014.
Casagli, N., Catani, F., Del Ventisette, C., and Luzi, G.: Monitoring, prediction, and early warning using ground-based radar interferometry, Landslides, 7, 291–301, https://doi.org/10.1007/s10346-010-0215-y, 2010.
Cigna, F., Bianchini, S., and Casagli, N.: How to assess landslide activity and intensity with Persistent Scatterer Interferometry (PSI): the PSI-based matrix approach, Landslides, 10, 267–283, https://doi.org/10.1007/s10346-012-0335-7, 2012.
Cigna, F., Bateson, L. B., Jordan, C. J., and Dashwood, C.: Simulating SAR geometric distortions and predicting Persistent Scatterer densities for ERS-1/2 and ENVISAT C-band SAR and InSAR applications: Nationwide feasibility assessment to monitor the landmass of Great Britain with SAR imagery, Remote Sens. Environ., 152, 441–466, https://doi.org/10.1016/j.rse.2014.06.025, 2014.
Colesanti, C. and Wasowski, J.: Investigating landslides with space-borne Synthetic Aperture Radar (SAR) interferometry, Eng. Geol., 88, 173–199, https://doi.org/10.1016/j.enggeo.2006.09.013, 2006.
Costantini, M.: A novel phase unwrapping method based on network programming, IEEE T. Geosci. Remote, 36, 813–821, https://doi.org/10.1109/36.673674, 1998.
Crippa, C., Franzosi, F., Zonca, M., Manconi, A., Crosta, G. B., Dei Cas, L., and Agliardi, F.: Unraveling Spatial and Temporal Heterogeneities of Very Slow Rock-Slope Deformations with Targeted DInSAR Analyses, Remote Sens., 12, 1329, https://doi.org/10.3390/rs12081329, 2020.
Crippa, C., Valbuzzi, E., Frattini, P., Crosta, G. B., Spreafico, M. C., and Agliardi, F.: Semi-automated regional classification of the style of activity of slow rock-slope deformations using PS InSAR and SqueeSAR velocity data, Landslides, 18, 2445–2463, https://doi.org/10.1007/s10346-021-01654-0, 2021.
Crosetto, M., Bremmer, C., Monserrat, O., and Hanssen, R. F.: Ground motion monitoring using SAR interferometry: quality assessment, European Geologist, 26, 12–15, 2009.
Crosta, G. B., Frattini, P., and Agliardi, F.: Deep seated gravitational slope deformations in the European Alps, Tectonophysics, 605, 13–33, https://doi.org/10.1016/j.tecto.2013.04.028, 2013a.
Crosta, G. B., di Prisco, C., Frattini, P., Frigerio, G., Castellanza, R., and Agliardi, F.: Chasing a complete understanding of the triggering mechanisms of a large rapidly evolving rockslide, Landslides, 11, 747–764, https://doi.org/10.1007/s10346-013-0433-1, 2013b.
Crosta, G. B., Agliardi, F., Rivolta, C., Alberti, S., and Dei Cas, L.: Long-term evolution and early warning strategies for complex rockslides by real-time monitoring, Landslides, 14, 1615–1632, https://doi.org/10.1007/s10346-017-0817-8, 2017.
Darvishi, M., Schlögel, R., Kofler, C., Cuozzo, G., Rutzinger, M., Zieher, T., Toschi, I., Remondino, F., Mejia-Aguilar, A., Thiebes, B., and Bruzzone, L.: Sentinel-1 and Ground-Based Sensors for Continuous Monitoring of the Corvara Landslide (South Tyrol, Italy), Remote Sens., 10, 1781, https://doi.org/10.3390/rs10111781, 2018.
Dehls, J. F., Larsen, Y., Marinkovic, P., Lauknes, T. R., Stodle, D., and Moldestad, D. A.: INSAR.No: A National Insar Deformation Mapping/Monitoring Service In Norway – From Concept To Operations, IGARSS 2019 – 2019 IEEE International Geoscience and Remote Sensing Symposium, https://doi.org/10.1109/igarss.2019.8898614, 2019.
De Luca, C., Roa, Y. L. B., Bonano, M., Casu, F., Euillades, P., Euillades, L., Franzese, M., Manunta, M., Yasir, M., Onorato, G., Striano, P., Dini, L., Tapete, D., and Lanari, R.: SAOCOM-1 L-Band DInSAR Time Series Generation Through the P-SBAS Approach: Algorithm Extension and Products Analysis, IEEE J. Sel. Top. Appl., 18, 2680–2703, https://doi.org/10.1109/jstars.2024.3507554, 2025.
Ferretti, A., Prati, C., and Rocca, F.: Permanent scatterers in SAR interferometry, IEEE T. Geosci. Remote, 39, 8–20, https://doi.org/10.1109/36.898661, 2001.
Frey, O., Magnard, C., Ruegg, M., and Meier, E.: Focusing of Airborne Synthetic Aperture Radar Data From Highly Nonlinear Flight Tracks, IEEE T. Geosci. Remote, 47, 1844–1858, https://doi.org/10.1109/tgrs.2008.2007591, 2009.
Frey, O., Werner, C. L., and Wegmuller, U.: GPU-based parallelized time-domain back-projection processing for Agile SAR platforms, 2014 IEEE Geoscience and Remote Sensing Symposium, 1132–1135, https://doi.org/10.1109/igarss.2014.6946629, 2014.
Frey, O., Werner, C. L., and Coscione, R.: Car-borne and UAV-borne mobile mapping of surface displacements with a compact repeat-pass interferometric SAR system at L-band, 2019 IEEE International Geoscience and Remote Sensing Symposium, https://doi.org/10.1109/igarss.2019.8897827, 2019.
Frey, O., Werner, C. L., Manconi, A., and Coscione, R.: Measurement of surface displacements with a UAV-borne/car-borne L-band DInSAR system: system performance and use cases, 2021 IEEE International Geoscience and Remote Sensing Symposium IGARSS, 628–631, https://doi.org/10.1109/igarss47720.2021.9553573, 2021.
Frey, O., Werner, C., and Caduff, R.: Car-borne Mobile Mapping of Ground Motion by Means of Repeat-Pass SAR Interferometry: Case Studies and Application Development Based on L-Band and Ku-band SAR Data Acquisitions, 2023 IEEE International Geoscience and Remote Sensing Symposium, 1902–1905, https://doi.org/10.1109/igarss52108.2023.10283211, 2023.
Frey, O., Werner, C., and Caduff, R.: Simultaneous Car-Borne SAR Imaging at L-band and Ku-band for DInSAR-Based Mobile Mapping of Ground Motion in Alpine Terrain, EUSAR 2024 – 15th European Conference on Synthetic Aperture Radar, Munich, Germany, 1259–1264, ISBN: 978-3-8007-6286-6, 2024.
Frey, O., Werner, C., Leinss, S., Batt, T., Caduff, R., Dixon, T., Sadeghi Chorsi, T., Van Alphen, R., Schmitt, M., Eitel, M., Sica, F., Deeb, E. J., LeWinter, A. L., Filiano, D. L., Wagner, C. J., and Hoppinen, Z.: Multicopter-UAV- and car-borne repeat-pass SAR interferometry and SAR tomography with the compact Gamma SAR systems: first examples and use cases at S- and L-band, 2025 IEEE International Geoscience and Remote Sensing Symposium, 1374–1377, https://doi.org/10.1109/igarss55030.2025.11243477, 2025.
García-Davalillo, J. C., Herrera, G., Notti, D., Strozzi, T., and Álvarez-Fernández, I.: DInSAR analysis of ALOS PALSAR images for the assessment of very slow landslides: the Tena Valley case study, Landslides, 11, 225–246, https://doi.org/10.1007/s10346-012-0379-8, 2013.
Huggel, C., Clague, J. J., and Korup, O.: Is climate change responsible for changing landslide activity in high mountains?, Earth Surf. Proc. Land., 37, 77–91, https://doi.org/10.1002/esp.2223, 2011.
Jones, N., Strozzi, T., Rabatel, A., Ducasse, E., and Mouginot, J.: Surface Instability Mapping in Alpine Paraglacial Environments Using Sentinel-1 DInSAR Techniques, IEEE J. Sel. Top. Appl., 16, 19–37, https://doi.org/10.1109/jstars.2023.3287285, 2023.
Loew, S., Gschwind, S., Gischig, V., Keller-Signer, A., and Valenti, G.: Monitoring and early warning of the 2012 Preonzo catastrophic rockslope failure, Landslides, 14, 141–154, https://doi.org/10.1007/s10346-016-0701-y, 2016.
Loew, S., Schneider, S., Josuran, M., Figi, D., Thoeny, R., Huwiler, A., Largiadèr, A., and Naenni, C.: Early warning and dynamics of compound rockslides: lessons learnt from the Brienz/Brinzauls 2023 rockslope failure, Landslides, 22, 283–298, https://doi.org/10.1007/s10346-024-02380-z, 2024.
Lundgren, P., Usai, S., Sansosti, E., Lanari, R., Tesauro, M., Fornaro, G., and Berardino, P.: Modeling surface deformation observed with synthetic aperture radar interferometry at Campi Flegrei caldera, J. Geophys. Res., 106, 19355–19366, https://doi.org/10.1029/2001jb000194, 2001.
Manconi, A.: How phase aliasing limits systematic space-borne DInSAR monitoring and failure forecast of alpine landslides, Eng. Geol., 287, 106094, https://doi.org/10.1016/j.enggeo.2021.106094, 2021.
Manconi, A., Kourkouli, P., Caduff, R., Strozzi, T., and Loew, S.: Monitoring Surface Deformation over a Failing Rock Slope with the ESA Sentinels: Insights from Moosfluh Instability, Swiss Alps, Remote Sens., 10, 672, https://doi.org/10.3390/rs10050672, 2018.
Manconi, A., Jones, N., Loew, S., Strozzi, T., Caduff, R., and Wegmueller, U.: Monitoring surface deformation with spaceborne radar interferometry in landslide complexes: insights from the Brienz/Brinzauls slope instability, Swiss Alps, Landslides, 21, 2519–2533, https://doi.org/10.1007/s10346-024-02291-z, 2024a.
Manconi, A., Bühler, Y., Stoffel, A., Gaume, J., Zhang, Q., and Tolpekin, V.: Brief communication: Monitoring impending slope failure with very high-resolution spaceborne synthetic aperture radar, Nat. Hazards Earth Syst. Sci., 24, 3833–3839, https://doi.org/10.5194/nhess-24-3833-2024, 2024b.
Mark, B. G. and Fernández, A.: The significance of mountain glaciers as sentinels of climate and environmental change, Geography Compass, 11, https://doi.org/10.1111/gec3.12318, 2017.
Moretto, S., Bozzano, F., Esposito, C., Mazzanti, P., and Rocca, A.: Assessment of Landslide Pre-Failure Monitoring and Forecasting Using Satellite SAR Interferometry, Geosciences, 7, 36, https://doi.org/10.3390/geosciences7020036, 2017.
Ng, A. H.-M., Ge, L., Li, X., Abidin, H. Z., Andreas, H., and Zhang, K.: Mapping land subsidence in Jakarta, Indonesia using persistent scatterer interferometry (PSI) technique with ALOS PALSAR, Int. J. Appl. Earth Obs., 18, 232–242, https://doi.org/10.1016/j.jag.2012.01.018, 2012.
Nishiguchi, T., Tsuchiya, S., and Imaizumi, F.: Detection and accuracy of landslide movement by InSAR analysis using PALSAR-2 data, Landslides, 14, 1483–1490, https://doi.org/10.1007/s10346-017-0821-z, 2017.
Notti, D., Herrera, G., Bianchini, S., Meisina, C., García-Davalillo, J. C., and Zucca, F.: A methodology for improving landslide PSI data analysis, Int. J. Remote Sens., 35, 2186–2214, https://doi.org/10.1080/01431161.2014.889864, 2014.
Raspini, F., Bianchini, S., Ciampalini, A., Del Soldato, M., Solari, L., Novali, F., Del Conte, S., Rucci, A., Ferretti, A., and Casagli, N.: Continuous, semi-automatic monitoring of ground deformation using Sentinel-1 satellites, Sci. Rep., 8, https://doi.org/10.1038/s41598-018-25369-w, 2018.
Riva, F., Agliardi, F., Amitrano, D., and Crosta, G. B.: Damage-Based Time-Dependent Modeling of Paraglacial to Postglacial Progressive Failure of Large Rock Slopes, J. Geophys. Res.-Earth, 123, 124–141, https://doi.org/10.1002/2017jf004423, 2018.
Schmidt, D. A. and Bürgmann, R.: Time-dependent land uplift and subsidence in the Santa Clara valley, California, from a large interferometric synthetic aperture radar data set, J. Geophys. Res., 108, https://doi.org/10.1029/2002jb002267, 2003.
Seno, S. and Thüring, M.: Large landslides in Ticino, Southern Switzerland: Geometry and kinematics, Eng. Geol., 83, 109–119, https://doi.org/10.1016/j.enggeo.2005.06.027, 2006.
Strozzi, T., Farina, P., Corsini, A., Ambrosi, C., Thüring, M., Zilger, J., Wiesmann, A., Wegmüller, U., and Werner, C.: Survey and monitoring of landslide displacements by means of L-band satellite SAR interferometry, Landslides, 2, 193–201, https://doi.org/10.1007/s10346-005-0003-2, 2005.
Strozzi, T., Klimeš, J., Frey, H., Caduff, R., Huggel, C., Wegmüller, U., and Rapre, A. C.: Satellite SAR interferometry for the improved assessment of the state of activity of landslides: A case study from the Cordilleras of Peru, Remote Sens. Environ., 217, 111–125, https://doi.org/10.1016/j.rse.2018.08.014, 2018.
Strozzi, T., Caduff, R., Manconi, A., Wegmüller, U., and Ambrosi, C.: Monitoring slow-moving landslides in Switzerland with satellite SAR interferometry, Swiss Bull. Angew. Geol. 25, 85–99, 2020.
Strozzi, T., Caduff, R., Jones, N., Manconi, A., and Wegmuller, U.: L-Band StripMap-ScanSAR Persistent Scatterer Interferometry in Alpine Environments with ALOS-2 PALSAR-2, IGARSS 2022 – 2022 IEEE International Geoscience and Remote Sensing Symposium, 1644–1647, https://doi.org/10.1109/igarss46834.2022.9884743, 2022.
Strozzi, T., Jones, N., Caduff, R., and Wegmüller, U.: L-Band DInSAR Surface Motion Products in Alpine Regions with SAOCOM, IGARSS 2024 – 2024 IEEE International Geoscience and Remote Sensing Symposium, 10740–10743, https://doi.org/10.1109/igarss53475.2024.10642327, 2024.
Torres, R., Snoeij, P., Geudtner, D., Bibby, D., Davidson, M., Attema, E., Potin, P., Rommen, B., Floury, N., Brown, M., Traver, I. N., Deghaye, P., Duesmann, B., Rosich, B., Miranda, N., Bruno, C., L'Abbate, M., Croci, R., Pietropaolo, A., Huchler, M., and Rostan, F.: GMES Sentinel-1 mission, Remote Sens. Environ., 120, 9–24, https://doi.org/10.1016/j.rse.2011.05.028, 2012.
Walter, F., Amann, F., Kos, A., Kenner, R., Phillips, M., de Preux, A., Huss, M., Tognacca, C., Clinton, J., Diehl, T., and Bonanomi, Y.: Direct observations of a three million cubic meter rock-slope collapse with almost immediate initiation of ensuing debris flows, Geomorphology, 351, 106933, https://doi.org/10.1016/j.geomorph.2019.106933, 2020.
Wasowski, J. and Bovenga, F.: Investigating landslides and unstable slopes with satellite Multi Temporal Interferometry: Current issues and future perspectives, Eng. Geol., 174, 103–138, https://doi.org/10.1016/j.enggeo.2014.03.003, 2014.
Wegmüller, U., Werner, C., Strozzi, T., and Wiesmann, A.: Multi-temporal interferometric point target analysis, Analysis of Multi-Temporal Remote Sensing Images, 136–144, https://doi.org/10.1142/9789812702630_0015, 2003.
Werner, C. and Wegmüller, U.: Processing strategies for phase unwrapping for InSAR applications, EUSAR 2002 – 4th European Conference on Synthetic Aperture Radar, Cologne, Germany, 353–356, ISBN: 3-8007-2697-1, 2002.
Werner, C., Strozzi, T., and Wegmüller, U.: Deformation Time-Series of the Lost-Hills Oil Field using a Multi-Baseline Interferometric SAR Inversion Algorithm with Finite-Difference Smoothing Constraints, 2012 Fall Meeting, American Geophysical Union, San Francisco, CA, 3–7 December 2012, 2012.
- Abstract
- Introduction
- Study Areas
- Datasets
- Methods
- Results
- Discussion
- Conclusion and Outlook
- Appendix A: Monte Mater, Lombardia, Italy
- Appendix B: Val Canaria, Ticino, Switzerland
- Appendix C: Brienz/Brinzauls, Grisons, Switzerland
- Appendix D: Temporal phase aliasing thresholds per sensor
- Data availability
- Author contributions
- Competing interests
- Disclaimer
- Acknowledgements
- Financial support
- Review statement
- References