the Creative Commons Attribution 4.0 License.
the Creative Commons Attribution 4.0 License.
 | 19 Jan 2026
Econometric modelling for estimating direct flood damage to firms: a micro-scale approach using post-event records in Italy
Marta Ballocci
Daniela Molinari
Giovanni Marin
Marta Galliani
Alessio Domeneghetti
Giovanni Menduni
Simone Sterlacchini
Francesco Ballio
Managing flood risk is crucial for achieving global sustainability. Flood damage to firms' assets, in particular, imposes significant financial stress, necessitating efforts to minimize future consequences. However, current tools and knowledge for estimating flood damage to firms are inadequate, primarily due to a lack of high-quality damage data and the diversity of firm characteristics, complicating generalization. This study aims to improve understanding of micro-scale flood damage to firms in Italy through the analysis of empirical data, focusing specifically on direct damage. The dataset comprises 812 observed damage records collected after five flood events. Damage is categorized into building structure, stock, and equipment. The analysis reveals relationships between damage, economic sector, and water depth. Results indicate that damage increases at a rate less than proportional to the firm surface area and with water depth significantly explaining only stock damage. The quantification of damages across different sectors shows that healthcare facilities register the highest average damage to building structures, the commercial sector is most affected in terms of stock damage, and the manufacturing sector exhibits the greatest average damage to equipment. The derived damage model offers better predictive accuracy than foreign models in the Italian context. These findings aid in developing effective, tailored risk mitigation strategies and provide valuable insights for future research and policy aimed at reducing flood impacts on firms in Italy.
- Article
(7627 KB) - Full-text XML
-
Supplement
(511 KB) - BibTeX
- EndNote


This paper presents an empirical analysis of flood damage data related to Italian economic activities, aimed at developing a forecast model to estimate micro-scale direct flood damages to Italian firms.
Flood risk is one of the main concerns of policymakers aiming for a more sustainable future (see, e.g., the Sendai Framework for Disaster Risk Reduction, the UN Sustainable Development Goals, and the European Floods Directive). Europe has 18.7 % of its territory exposed to high flood hazard (Arrighi et al., 2013), while Italy has, respectively, 5.4 %, 10 % and 14 % of its territory exposed to hydro-geological risk in the high, medium and low probability hazard scenario (Trigila et al., 2021). Projected climate change scenarios indicate a rise in precipitation intensity that, without proper adaptation policies and measures, will results in higher flood risk with significant negative consequences (IPCC, 2022).
Managing flood risk is essential for protecting people and properties, preserving the environment, and minimizing economic impacts of floods on societies. Especially, damage to firms is a significant source of financial stress after floods. Reduced sales during and in the aftermath of the event, damaged stock, and disrupted equipment and machinery all affect business interruption and pose challenges to recovery, especially for uninsured or financially strained firms (Samantha, 2018).
The study of flood impacts on the different sectors that compose the built environment, and society is crucial to improve the information used by modelers and decision-makers to guide flood risk management. This includes prevention, protection, mitigation and risk-aware planning actions to reduce potential adverse consequences of floods (Bremond et al., 2018). In particular, the analysis of direct damages to economic activities provides insight into the quantification of costs across economic sectors and the interaction between damage and its explanatory variable (like hazard intensity and the characteristics of different economic activities) thereby enabling the implementation of adaptation measures to reduce avoidable costs. The assessment of damages is important to evaluate actions from the individual entrepreneur to the public decision-makers, enabling public or private preventive policies against damages. Knowledge and understanding of the specificities of each case permit to implement tailored measures to a specific economic sector, while preparedness is becoming increasingly important in managing the magnitude of impact that can be mitigated by population behaviour, incentivizing insurance policies and adaptive measures (Balbi et al., 2013).
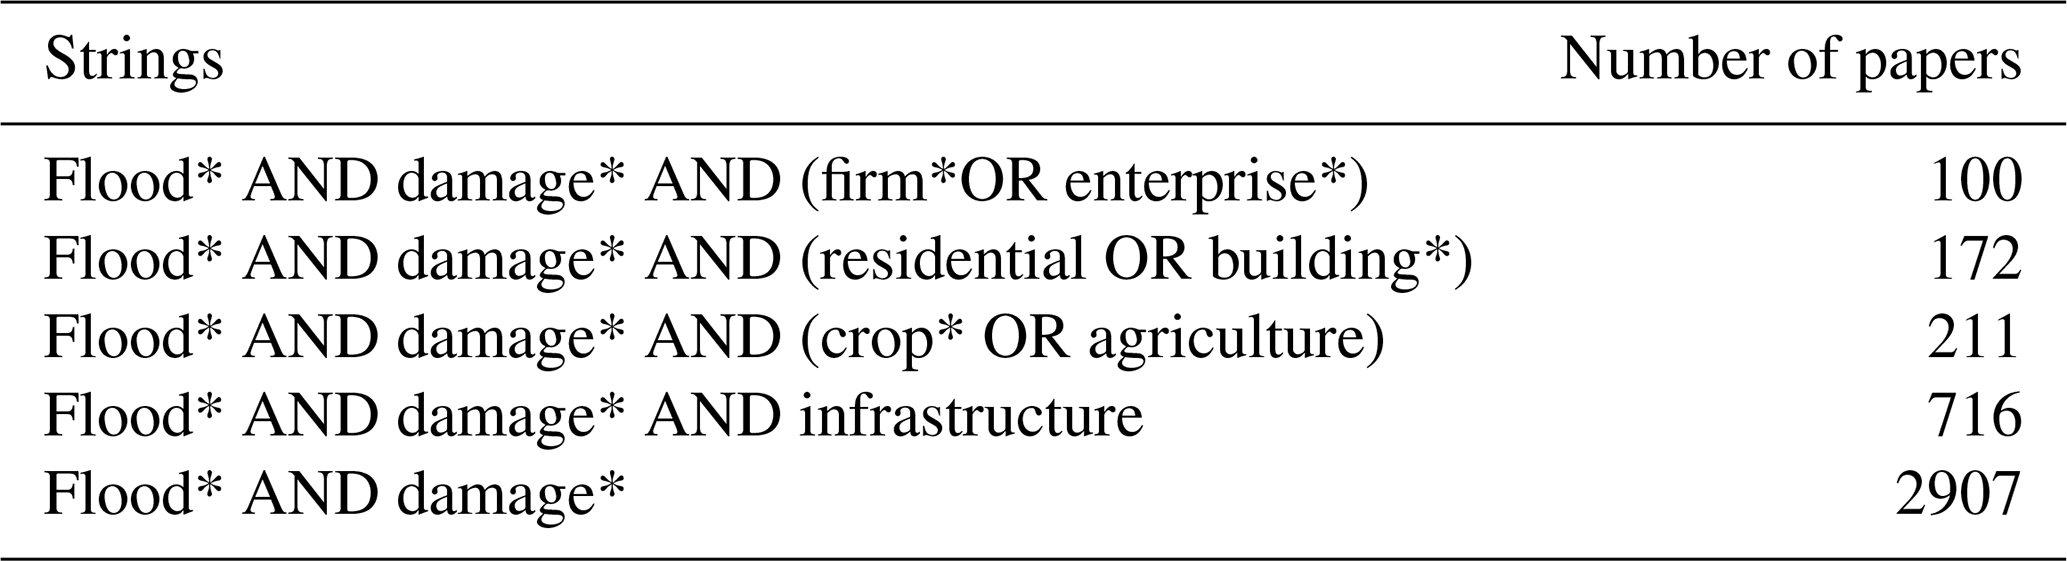
Although the business sector assumes a critical role, for both its importance for the economic well-being of society and the high losses it suffers in case of inundations, methods to assess damage to economic activities are much less developed and affected by higher uncertainty compared to other sectors, such as the residential (Gissing and Blong, 2004; Samantha, 2018; Zhou and Botzen, 2021). To provide an overview of the existing literature, Table 1 displays the number of papers retrieved from the Scopus database through queries conducted on the title, abstract, and keywords.
Studying the damage to the business sector means facing a complex problem, involving interconnections among several systems (e.g., society, the reference market, the financial system) as floods may have devastating effects not only on business survival but also on the economic and social fabric (Menoni et al., 2016; Wedawatta et al., 2014).
Damage to economic activities is generally distinguished in three different impacts: direct damages to capital goods, including moveable and unmoveable goods (structure of the building, equipment, stock), caused by contact with water; damages caused by business interruption to the affected economic activities inside the flooded area; indirect damages or costs suffered by business in the supply chain outside the flooded area, deriving from the supply interruption from firms in the flooded area (Danish Coastal Authority, 2017). The three impacts are strongly interconnected with each other.
Table 1Number of papers in Scopus by keywords in the title, abstract and keywords (LIMIT-TO (DOCTYPE, “ar”)) AND (LIMIT-TO (LANGUAGE, “English”)) AND (LIMIT-TO (EXACTKEYWORD, “Flood Damage”)) (last access: May 2024).
The analysis presented in this paper contributes to flood damage modelling for economic activities by proposing a model for the estimation of direct damage. More specifically, the aim of this work is to enhance modelling capability and knowledge of damage mechanisms, towards more reliable and comprehensive flood risk assessment.
The analysis is conducted by investigating empirical damage data collected in the aftermath of flood events through an econometric approach with a multiple regression model. Data refer to different floods that affected Italy in the last twenty years, all characterized by the common feature of being riverine and low-velocity floods. The analysis goes beyond considering water depth as the sole explanatory variable for damage. Notably, previous studies (Van Ootegem et al., 2015; Wagenaar et al., 2017; Endendijk et al., 2023) have utilized regression analysis to integrate non-hazard indicators, recognizing the importance of considering additional factors beyond water depth in understanding and modelling flood risk.
The analysis is carried out at the micro-scale (i.e., at the single economic activity level), (i) studying the relationship between damage (total, and subdivided by components: structure, equipment, stock), and their main explanatory variables (water depth, firm size, economic sector), and (ii) obtaining a preliminary estimation of flood damage for different categories of activity.
The results provide a forecast model for the total damage and a preliminary model for the single damage components. The prediction offers a clearer idea of which variables are statistically significant in determining differences in the amount of damage suffered by firms due to a flood event in Italy at the micro-scale.
The paper is organized as follows: Section 2 provides an overview of available damage models for the business sector in Europe and Italy, along with a discussion of their limitations, emphasizing the need for the current research. Section 3 describes the case studies and data used in this analysis. Section 4 presents the methodology underpinning the analysis. Sections 5 and 6 detail the results along with model validation. Section 7 compares the performance of existing models with the model proposed in this study, highlighting improvements over the current state of the art. Section 8 discusses the strengths and limitations of the present work, along with directions for further research. Section 9 provides concluding remarks.
The estimation of damages to economic activities includes both direct and indirect damage. Direct damages are usually assessed using a damage function that depends on hazard, vulnerability and exposure (Koks et al., 2015). On the other hand, indirect damages are commonly assessed using General Equilibrium Models or Input-Output models which measure how the effects of a disaster propagate throughout the economy over a period of time (Allaire, 2018). However, indirect flood damage assessment is beyond the scope of this analysis.
With respect to direct damages, two main approaches are commonly used: empirical estimations and synthetic models. Empirical estimations are typically based on data collected from past flood events, while a synthetic model uses assumptions about damage mechanisms (Dottori et al., 2016). Most past studies on damage to the firms have utilized empirical models. Despite the scarcity of observed damage data, which makes calibration and validation problematic (especially for contexts that differ from the original case study), empirical models are usually preferred when assessing firm damage. The wide heterogeneity of economic activities makes it difficult to analyse all damage mechanisms using a synthetic approach.
Examples of micro-scale models for assessing direct flood damage to economic activities can be found both in Europe and Italy (Amadio et al., 2016; Arrighi et al., 2013; Grelot and Richert, 2019; Kreibich et al., 2007; Martinez et al., 2018; Martínez-Gomariz et al., 2020; Penning-Rowsell et al., 2005), or outside Europe (Bari et al., 2021; Hasanzadeh Nafari et al., 2016; Hu et al., 2019; Hung and Diep, 2022; Kuroda et al., 2022; Li et al., 2018; Olmez and Deniz, 2023; Samantha, 2018; Scawthorn et al., 2006; Wedawatta et al., 2014).
In the European context, FLEMOcs (Kreibich et al., 2010) is an empirical model based on data collected in Germany, which estimates the loss ratio of buildings, equipment, goods, products and stock for four sectors: public and private services, industry, corporate services and trade. According to the model, losses depend on several hazard and vulnerability variables: water depth, economic sector, firm size, precautionary behaviour taken by firm owners and the level of contamination of water. In the UK, the Multicoloured Manual (Penning-Rowsell et al., 2005), includes synthetic damage functions to estimate the damage to different categories of non-residential properties, including economic activities (e.g., retail, office, distribution/logistics, manufacturing). Susceptibility functions proposed by the model relate damage to water depth, flood duration and firm surface. France developed national damage functions to assess damage to equipment, stock, and structure of economic activities, as a function of water depth and flood duration (Bremond et al., 2018; Grelot and Richert, 2019). In Spain, Martínez-Gomariz et al. (2020) developed national empirical flood depth-damage curved, based on actual data in Barcelona, for buildings, stock and inventories for the following economic sectors: warehouses, car parks, restaurants, general trading, homeowners associations, sport, education, hotels, industries, offices, health, workshops, dwellings, churches & singular buildings. Functions vary with the category of the activity, identified by the NACE code.
Consensus within literature highlights the importance of being cautious when attempting to transfer damage models within different countries, as it involves a notable degree of uncertainty, particularly within regions lacking sufficient data. Moreover, it is recommended to use models developed in regions similar to that of the initial application, because characteristics of floods, vulnerability or exposed elements and relative values are strongly context specific (Cammerer et al., 2013; Merz et al., 2010; Smith, 1994). This makes the use of foreign models in the Italian context very difficult due to scarcity of data for their validation (see Sect. 7).
Two main studies in Italy propose methods to assess the potential damage to economic activities. Arrighi et al. (2013) propose a method to assess direct damage to structures and contents of commercial activities at the scale of the census block, i.e. at the meso-scale, by developing stage-damage curves for the urban context of Florence. However, this model is strictly related to the exposure and vulnerability parameters of the city of Florence, therefore hardly transferable to a different context. Molinari et al. (2016) develop another approach, named Flood-IMPAT, to assess direct damage to the business sector, again at the meso-scale. They propose the net capital stock, supplied by the Italian Institute of Statistics (ISTAT), as a proxy indicator of the value of contents and structure of firms and uses the depth-damage functions by the International Commission for the Protection of the Rhine – ICPR (ICPR, 2001) to assess the damage, distinguishing by economic sector using the NACE code. Still, the authors highlight the limitation of using a foreign model, in terms of reliability of results, and the importance of implementing models that are specific for the context under investigation and that work at lower scales. Thus, available tools do not allow reliable estimation of damage to economic activities in Italy. Indeed, even the MOVIDA project (led by the Po River District Authority in collaboration with several Italian universities and research centres), representing one of the most recent attempts to define a procedure to estimate flood damage in the Italian context, refrained from estimating direct damage to economic activities, limiting the analysis to the estimation of their exposed value (Simonelli et al., 2022).
The dataset analysed in the present work is composed of 812 observed damage records to individual firms, collected after five flood events in Italy:
-
The flood occurred in the town of Lodi (Northern Italy), in November 2002, due to the overflow of the Adda river (Molinari et al., 2019, 2020).
-
The extensive flood that affected the Sardegna Region (Insular Italy) in November 2013. Collected data refer to the city of Olbia.
-
The flood occurred in the province of Modena (Northern Italy), in January 2014 (Carisi et al., 2018), caused by an embankment breach along the Secchia river. Data refer to three municipalities: Bastiglia, Bomporto, and Modena.
-
The flood of the Enza river in the Emilia Romagna Region (Northern Italy) in December 2017; affecting the town of Lentigione (Regione Emilia Romagna, 2018) (Tarpanelli et al., 2023).
-
The flood of the Misa river, in September 2023, in the Marche region (Central Italy). Data on affected economic activities regard the municipalities of Ostra, Senigallia and Trecastelli.
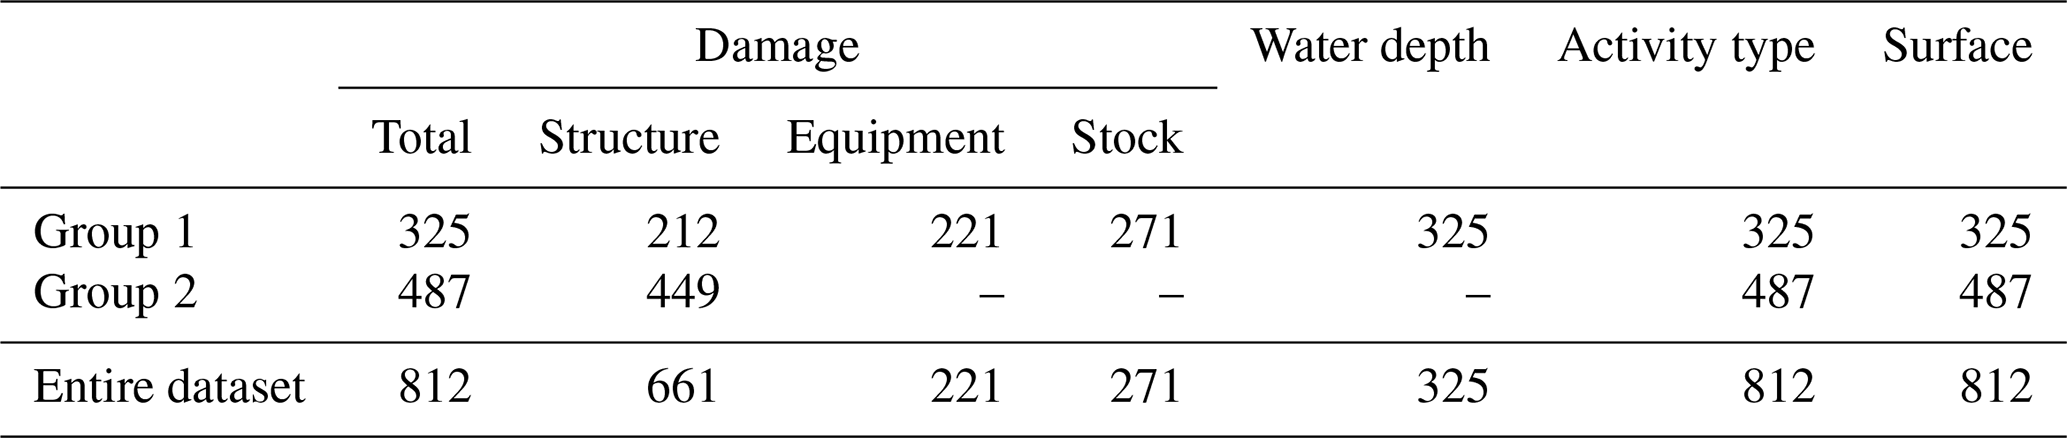
Data from the different case studies were merged in a unique dataset to obtain a larger data sample that could be representative of Italy's geographical diversity. Indeed, all case studies refer to riverine flood events. The dataset was then partitioned into two groups (see Table 2) according to the available information on observed damage and related explanatory variables.
Indeed, while all the data originate from declarations filled in by entrepreneurs in the aftermath of the floods to claim compensation of damages from the government, the level of detail of the information collected for the various case studies is different for two main reasons: (i) case studies refer to different years and regions, each with distinct regulations and standards for data collection, and (ii) the collected data were previously pre-processed by different authorities, ranging from local to regional, responsible for damage compensation. More specifically, a first group comprises 325 observations providing information on the total declared damage, its breakdown by components (structure, equipment, and stock), the estimated water depth at the premises location, the surface occupied by the economic activity, and the NACE code of the economic activity. For a second group, consisting of 487 observations, information is limited to the total amount of the damage, the damage to the structure, the surface, and the NACE code.
Table 2Number of observations per type of available information in the analysed dataset.
For Group 1, data referring to hazard (i.e., water depth) come from the hydraulic simulation of the flood events providing the perimeter of the flooded area and the spatial distribution of the water depth, for each case study (Amadio et al., 2019; Scorzini et al., 2018; Carisi et al., 2018; Gatti, 2016) For detailed information on the hydraulic model development, calibration, and validation, refer to the original cited sources. Thanks to the knowledge of the address of affected firms, it was possible to estimate the water depth at the firms' location. As explained before, the considered flood events are all characterized by low-velocity, riverine flooding, where spatial variability in water depth is minimal across the inundated area of a building. For this reason, a single representative water depth value – extracted at the building centroid – was considered sufficient to describe flood intensity at the firms' location, even for larger buildings.
Damage data refer to the full replacement or repair cost of damaged assets. This value is commonly used for detailed micro-scale analysis when depreciated values of assets (i.e., the value at the time the damage occurred) are not available (Allaire, 2018; Balbi et al., 2013). Depending on the case study, damage values are available for the different components of the economic activity. However, for the scope of the analysis, all the data were aggregated into the total damage and, when possible, into three main damage components: structure, equipment, and stock. “Structure” identifies the building in which the economic activity is located with the internal systems necessary for its functioning (e.g., electrical or heating system); “equipment” refers to machinery, furniture, vehicles, and tools necessary for the functioning of the firm; “stock” refers to raw materials, semi-finished and finished products. The choice of the three components is coherent with previous studies (Grelot and Richert, 2019; Kreibich et al., 2010; Schoppa et al., 2020; CGGD, 2018; Booysen et al., 1999). Indeed, it is expected that flood damage mechanisms are different among them, thus requiring different methods to assess damage. All the data were converted to 2022 prices using the consumer price index for comparability reasons.
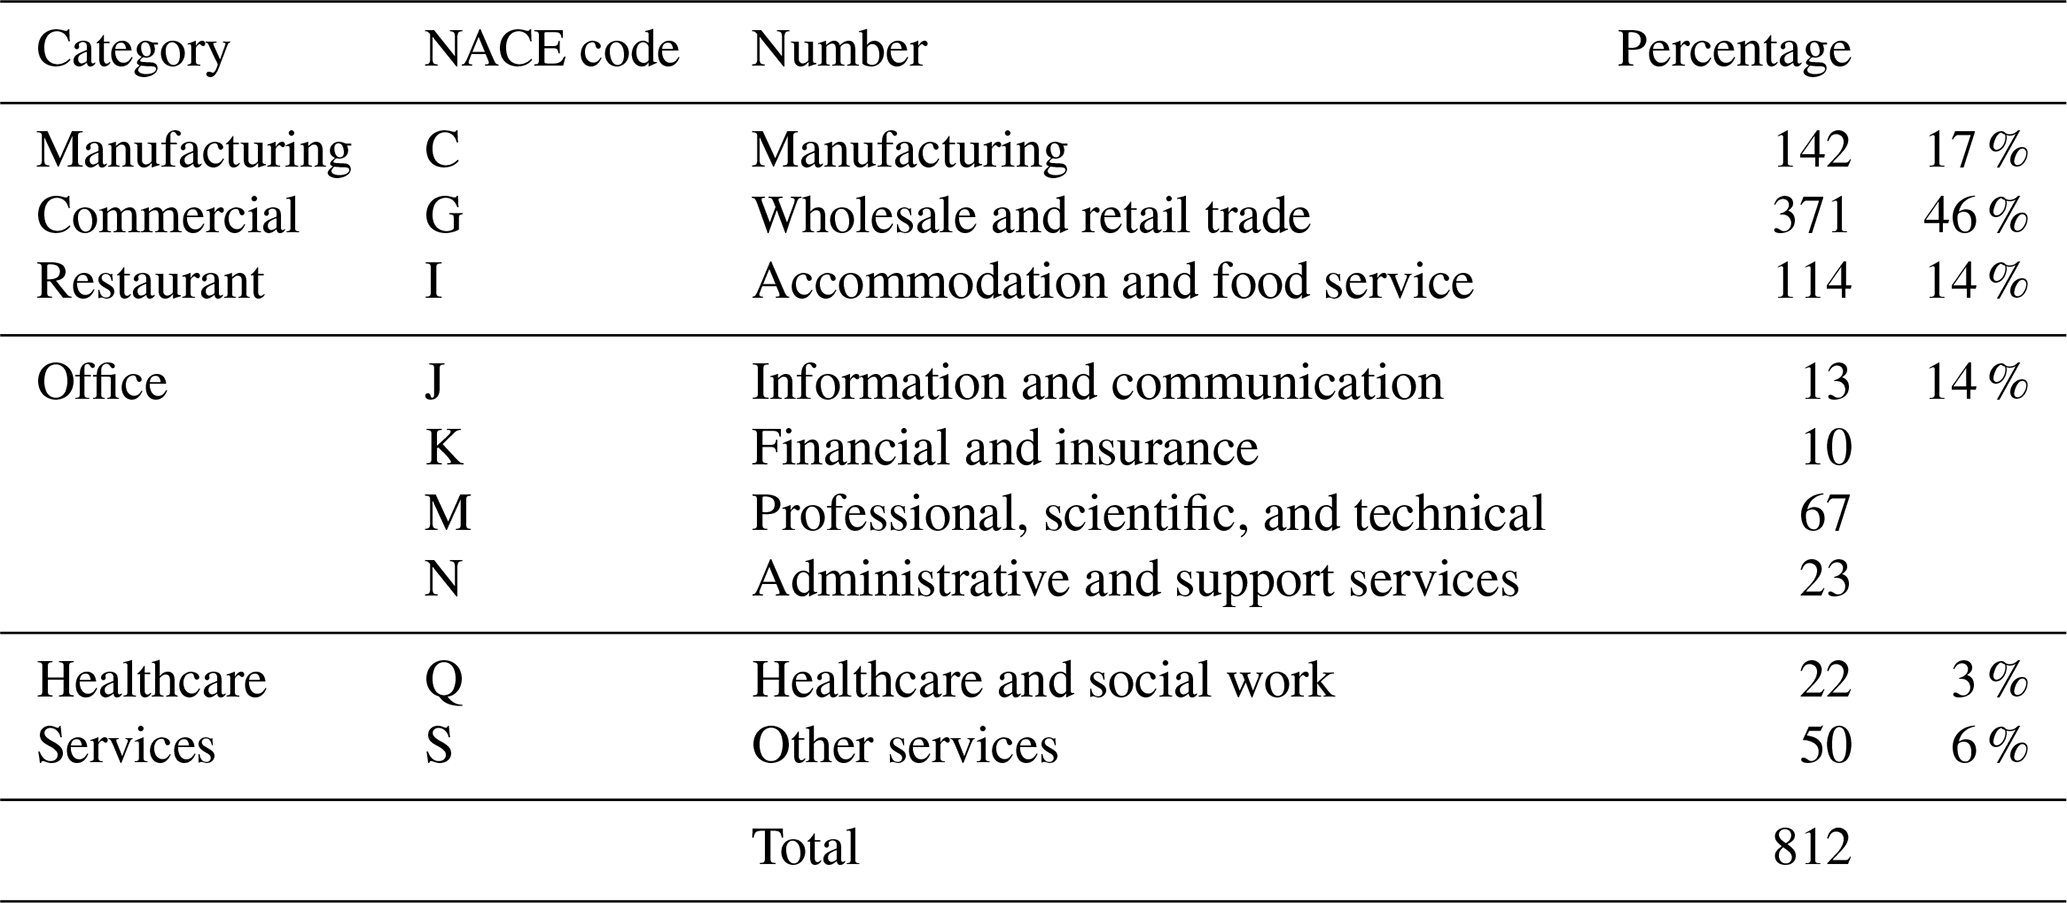
The NACE code is available at the first level. Although the use of the NACE nomenclature to represent the vulnerability of an activity has been questioned (Molinari et al., 2019; Kreibich et al., 2010), we decided to maintain this information to exploit statistical data on the business sector elaborated by ISTAT (that are organised through the NACE code) and to obtain a description of the economic activities that is shared at the European level (Bremond et al., 2018; Paprotny et al., 2020). The following sectors (C, G, I, J, K, M, N, Q, S) were included in the analysis (see Table 3). In detail, the sector G (wholesale and retail trade), C (manufacturing), I (accommodation and food service activities), Q (healthcare and social care) and S (other services activities) were considered and renamed for simplicity “Commercial”, “Manufacturing”, “Restaurant”, “Healthcare” and “Services”, respectively. The sectors J (information and communication), K (financial and insurance activities), M (professional, scientific, and technical activities) and N (administrative and support service activities) were aggregated in a unique category named “Office”, since it was assumed the office configuration as prevalent for all the activities referring to these NACE codes. Some sectors have been neglected as they are usually considered separate sectors of investigation in flood risk analysis (Merz et al., 2010) with respect to business activities. This is the case of category A (agricultural, forestry and fishing); sectors D (electricity, gas, steam, and air conditioning supply); E (water supply, sewerage, waste management and remediation activities); H (transporting and storage) that refer to infrastructures; O (public administration and defence, compulsory social security) and P (Education) that were considered part of the public sector and strategic infrastructures. Other sectors were instead neglected as they present specific peculiarities that impede a proper comparison; this is the case of sectors F (Construction) whose elements cannot be associated with a “typical” economic activity configuration of one/some premises with contents, and the category of real estate activities (L) because the damage and the exposed values could refer to the several properties owned or managed by the business, that could be spread in the territory, beyond the flooded areas. The NACE sectors B (extraction of minerals from quarries and mines) and R (arts and sports activities) were not investigated because of the limited number of available data.
Table 3 shows that 46 % of the flooded activities were Commercial, 17 % Manufacturing, 14 % Restaurant, 14 % Offices, 3 % Healthcare and 6 % Services.
The surface occupied by the economic activity is not always available in the original data. In case of its absence, it was approximated with the footprint area of the building in which the activity is located, obtained by Regional Topographic Databases, provided by public authorities (e.g., Regione Lombardia, Regione Sardegna etc.).
Table 3Number of economic activities per NACE code in the entire dataset.
The conceptual model at the basis of the analysis is reported in Eq. (1), where damage (d) is expressed as a function of three variables: activity type (N), activity surface (A) and water depth (WD). Such variables are identified in the literature as the most explicative of damage (Merz et al., 2010; Paprotny et al., 2020; Penning-Rowsell et al., 2005; Schoppa et al., 2020).
First, a correlation analysis was implemented to explore the relationship between the damage and the explanatory variables, as well as to detect potential multicollinearity among them. Then, a damage model was derived for each economic category included in the analysis. The analysis was carried out firstly for the total damage. Subsequently, we delved into an examination of damage by components, using the same approach as used for the total damage. However, only preliminary insights were obtained in this case because of the low size of the available data sample.
The damage value used in all the analyses is the unitary damage, obtained dividing the damage (D) by the surface of the economic activity Eq. (2), as better discussed in the following section:
5.1 Descriptive statistics
Figure 1 shows the distribution of the unitary total damage, the surface, and the water depth in the observed data. The unitary total damage (Fig. 1a) varies from a minimum value of approximately EUR 1 m−2 to a maximum value of approximately EUR 10 000 m−2, with the first quartile, Q1, equal to EUR 26 m−2, the third, Q3, equal to EUR 277 m−2, the median being EUR 91 m−2 and the average EUR 280 m−2. Figure 1b and c show statistics for the explanatory variables: the firm surface varies from approximately 5 to 70 000 m2, Q1 is 147 m2 and Q3 is 1055 m2, the median is 392 m2 and the average is 1100 m2; the water depth varies from around 0.05 m to around 3.00 m, with the first quintile, Q1, equal to 0.40 m and, the third quintile, Q3, equal to 1.00 m. the median and the average are approximately 0.70 m. As expected, values for the surface area and the total damage span over orders of magnitude, while water depths have relatively little variability, with 50 % of the data being concentrated in a small range (0.4–1 m).
Table 4 reports the average values of the unitary total damage and the firm surface by economic category, while their distribution is reported in Figs. 2 and 3. Detectable differences suggest that both the surface and the economic category may be relevant explanatory variables to be included in a damage model.
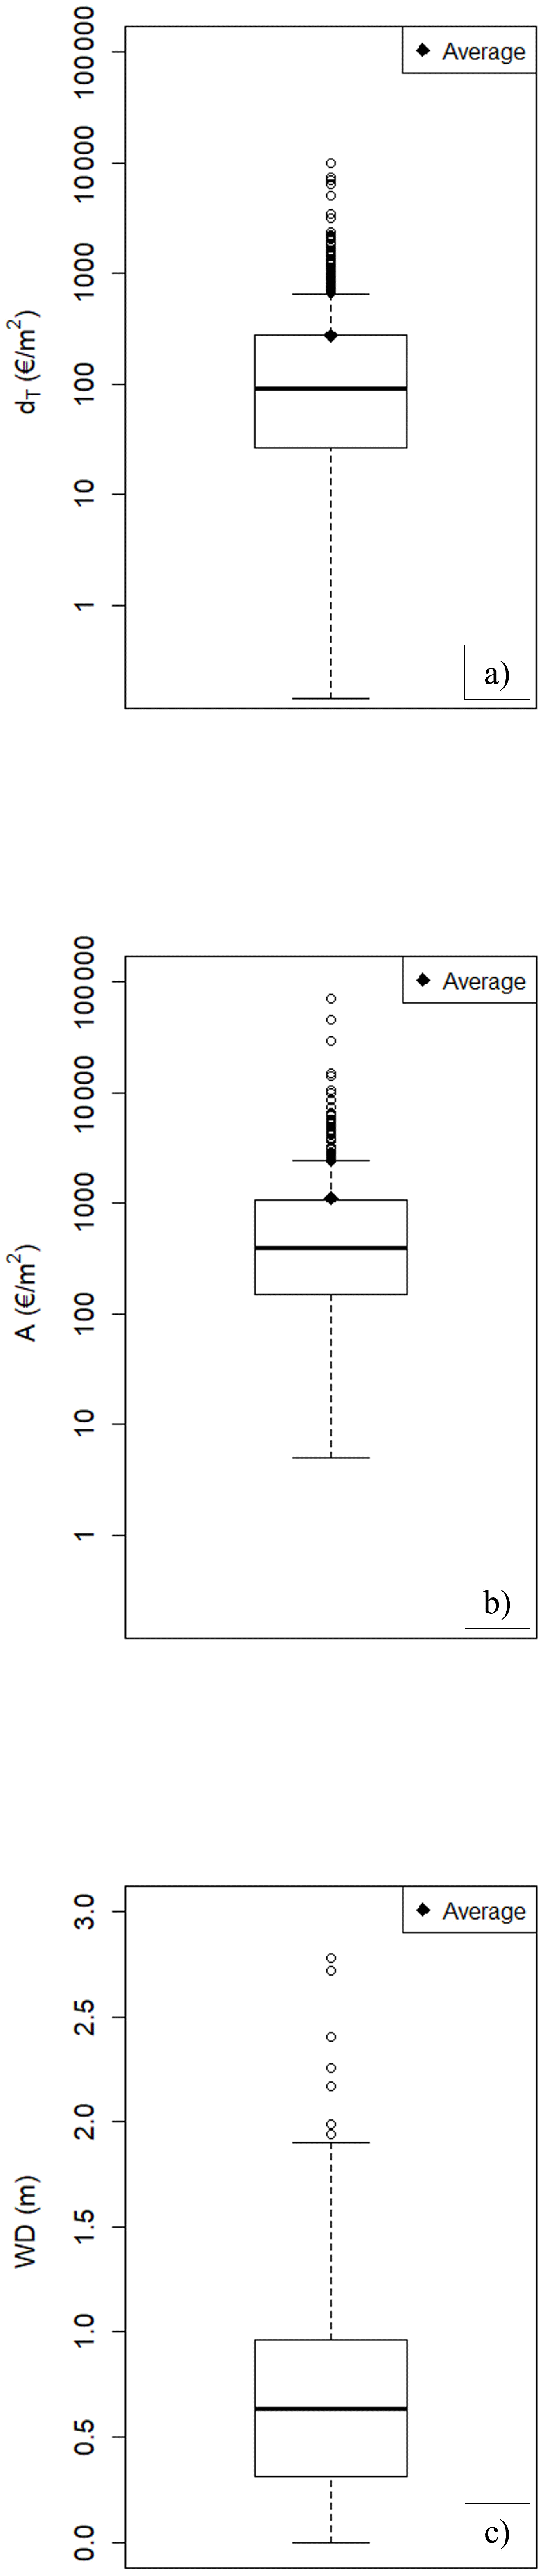
Figure 1(a) Distribution of the unitary total damage (dT), (b) the surface (A) and the (c) water depth (WD) in observed data. WD values refer to Group 1 only. The rhombus represents the average value. The central rectangular box represents the interquartile range (IQR), which spans from the first quartile (Q1) to the third quartile (Q3), including 50 % of the data. The black line inside the box represents the median (Q2). The “whiskers” (i.e. the two lines extending above and below the box) indicates the minimum and maximum values within the range equal to 1.5 times the IQR. Any data points beyond the whiskers (i.e., outliers) are plotted individually.
Table 4Average data values for the unitary total damage (dT), the total damage (DT), and the surface of economic activities (A) by economic category, for the entire dataset (group 1 and 2).
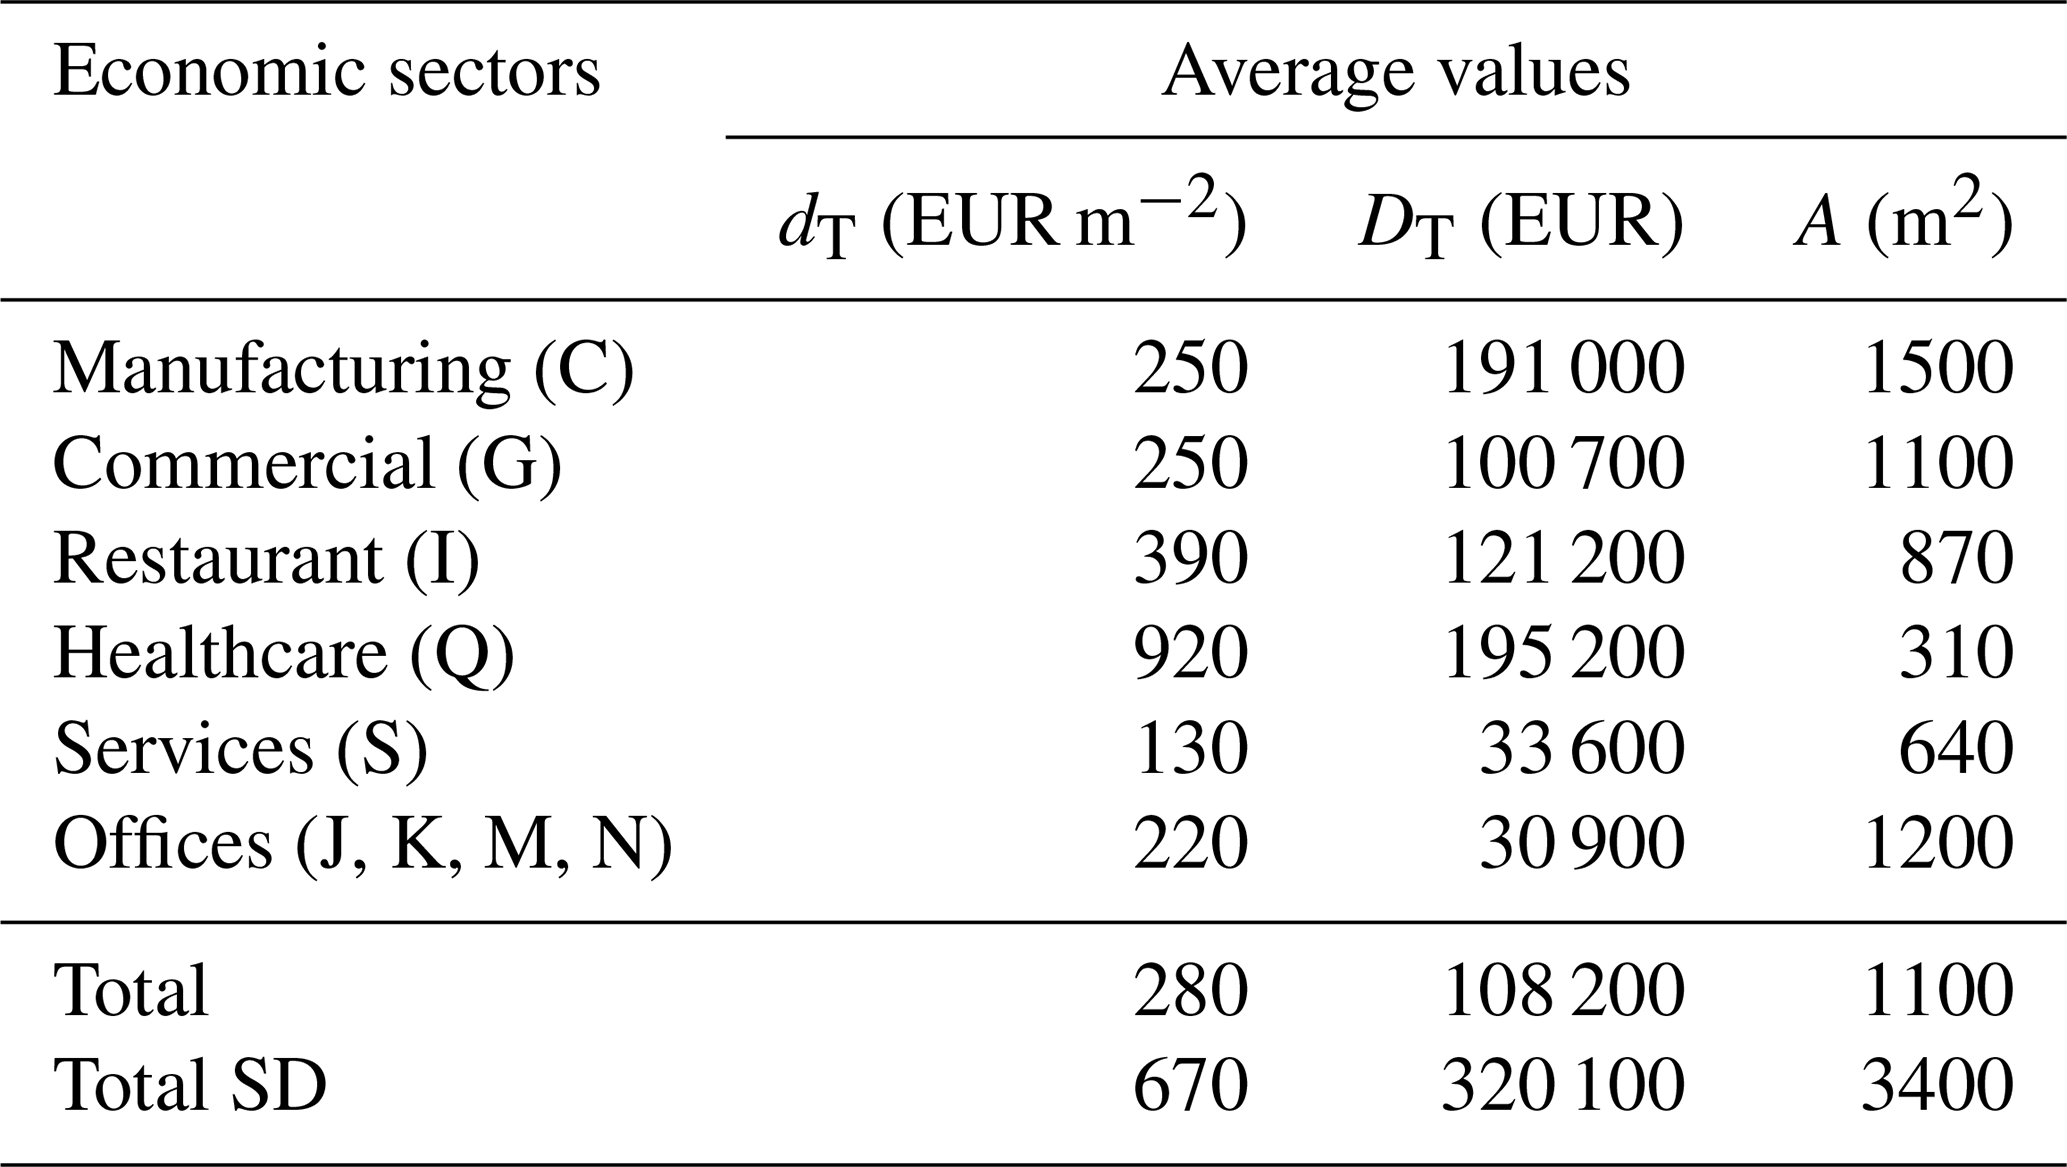
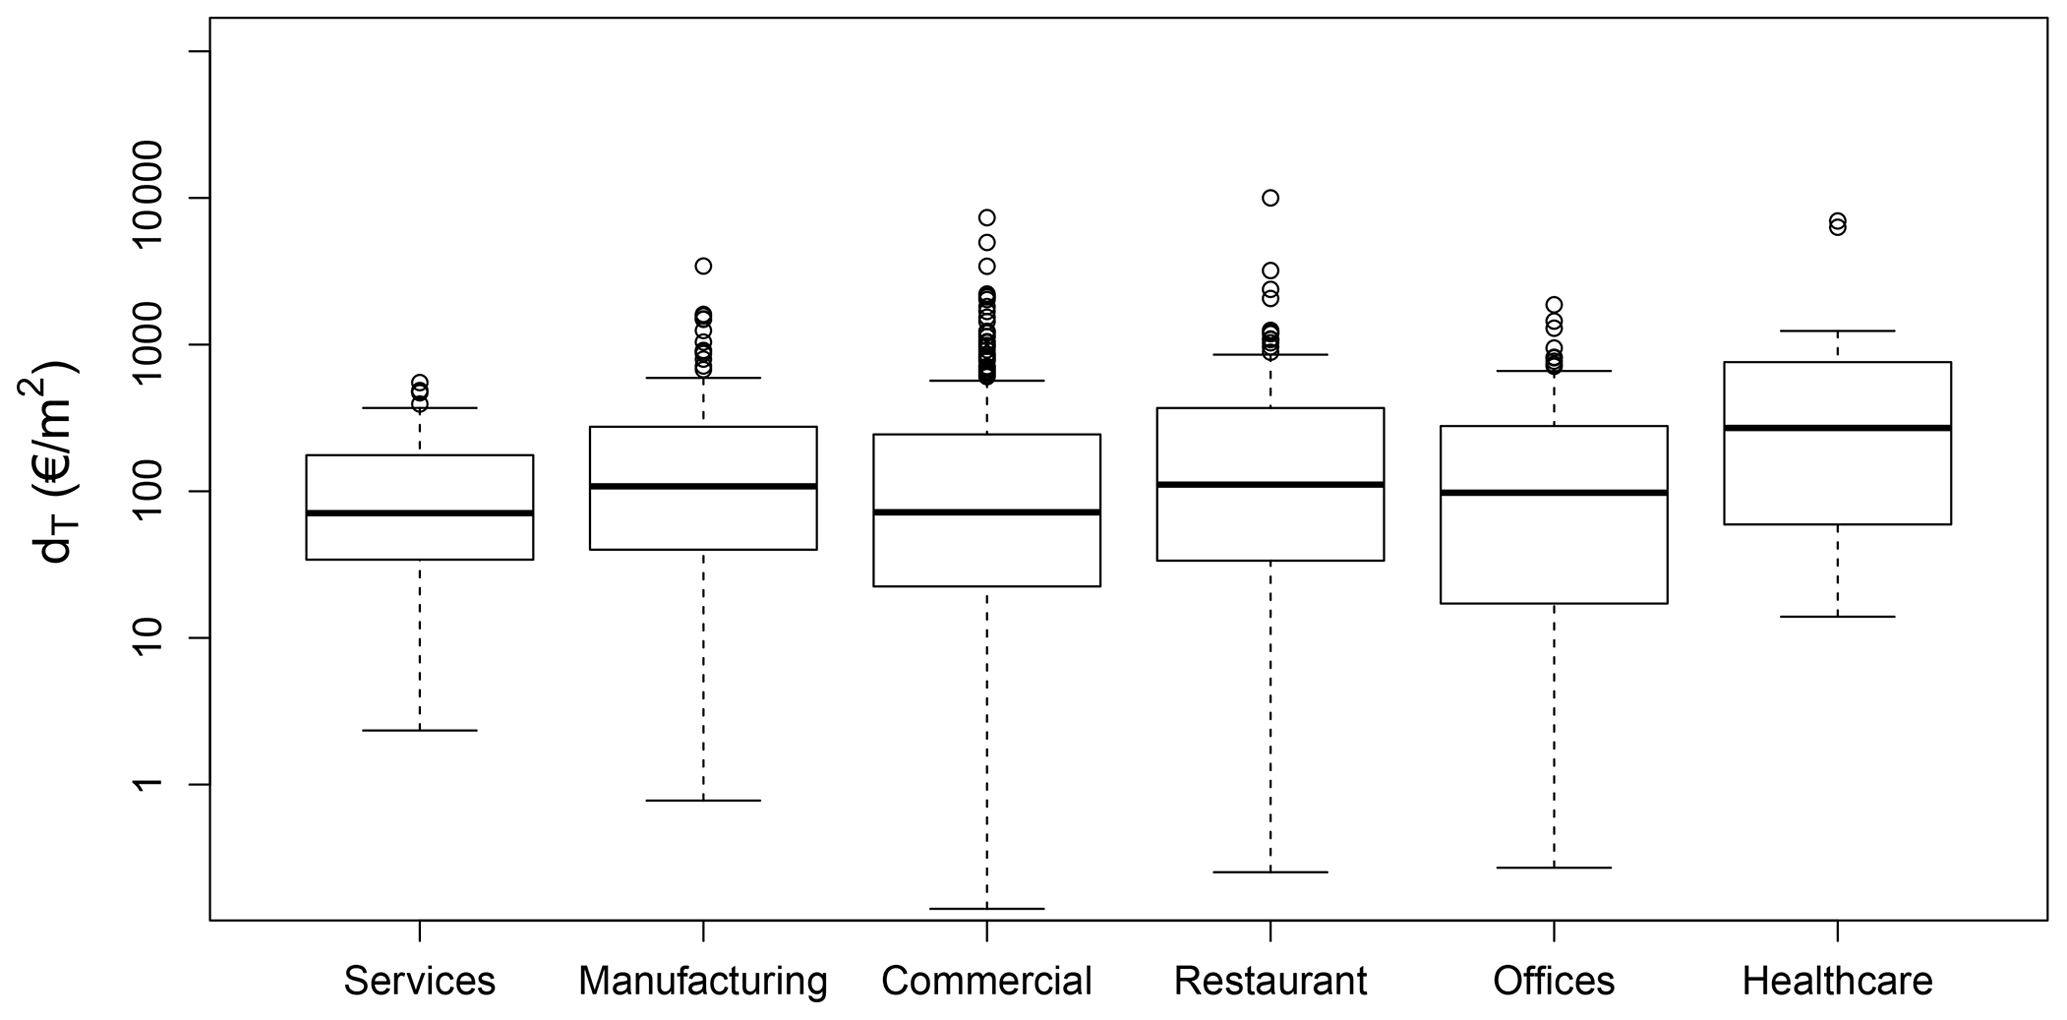
Figure 2Boxplots of the unitary total damage by economic category for the entire dataset (ln-scale).
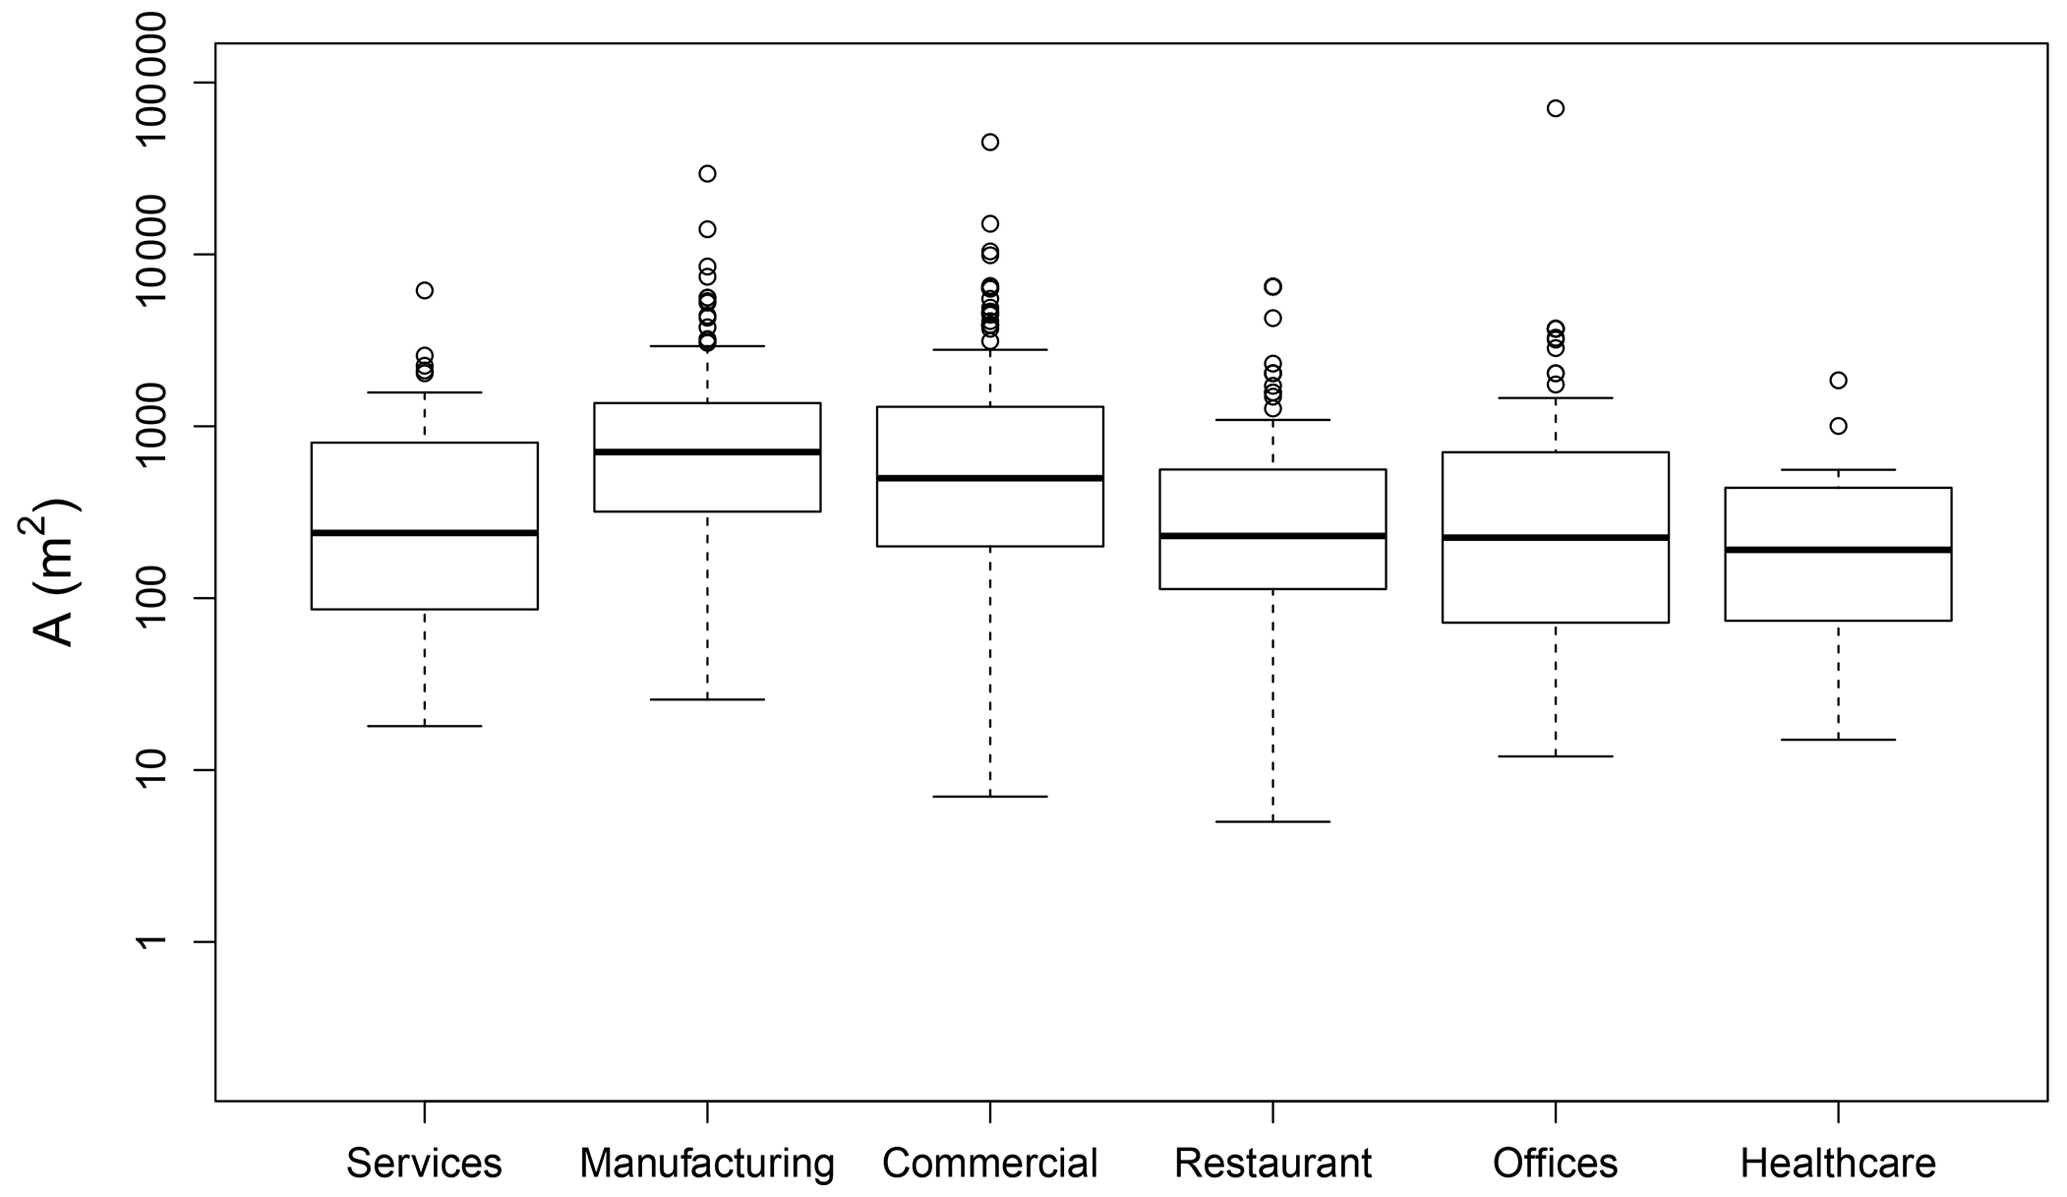
Figure 3Boxplot of the Surface (A) of the economic activities by economic category for the entire dataset (ln-scale).
5.2 Correlation analysis
The entire dataset was used to test the correlation between the unitary damage and the firm surface (Fig. 4a), and only group 1 for the correlation between the unitary damage and the water depth (Fig. 4b). Figure 4 plots, for each correlation, outcomes for a Loess (Locally Weighted Scatterplot Smoothing) regression, together with the confidence interval of the curve estimate. Notice that Loess is a non-parametric regression that fits a smooth curve to the data by considering the local density of the data points, thus suggesting possible non-linear trends between the variables.
Figure 4a shows a negative correlation between the unitary damage and the firm surface, indicating that damage increases less than proportionally with respect to the surface. Figure 4b shows a weak positive correlation between the damage and the water depth. The Loess curve is useful to identify a threshold of the positive correlation, with no effect on damages for water depth values smaller than 0.2 m. The damage-surface and damage-water depth correlations are, however, influenced by the existence of a negative correlation between the surface and the water depth (Fig. 4c); therefore, although the positive (although here weak) correlation between water depth and damage is physically sound, its statistical evidence may be masked by the water depth-surface collinearity in the dataset (which has no evident physical meaning).
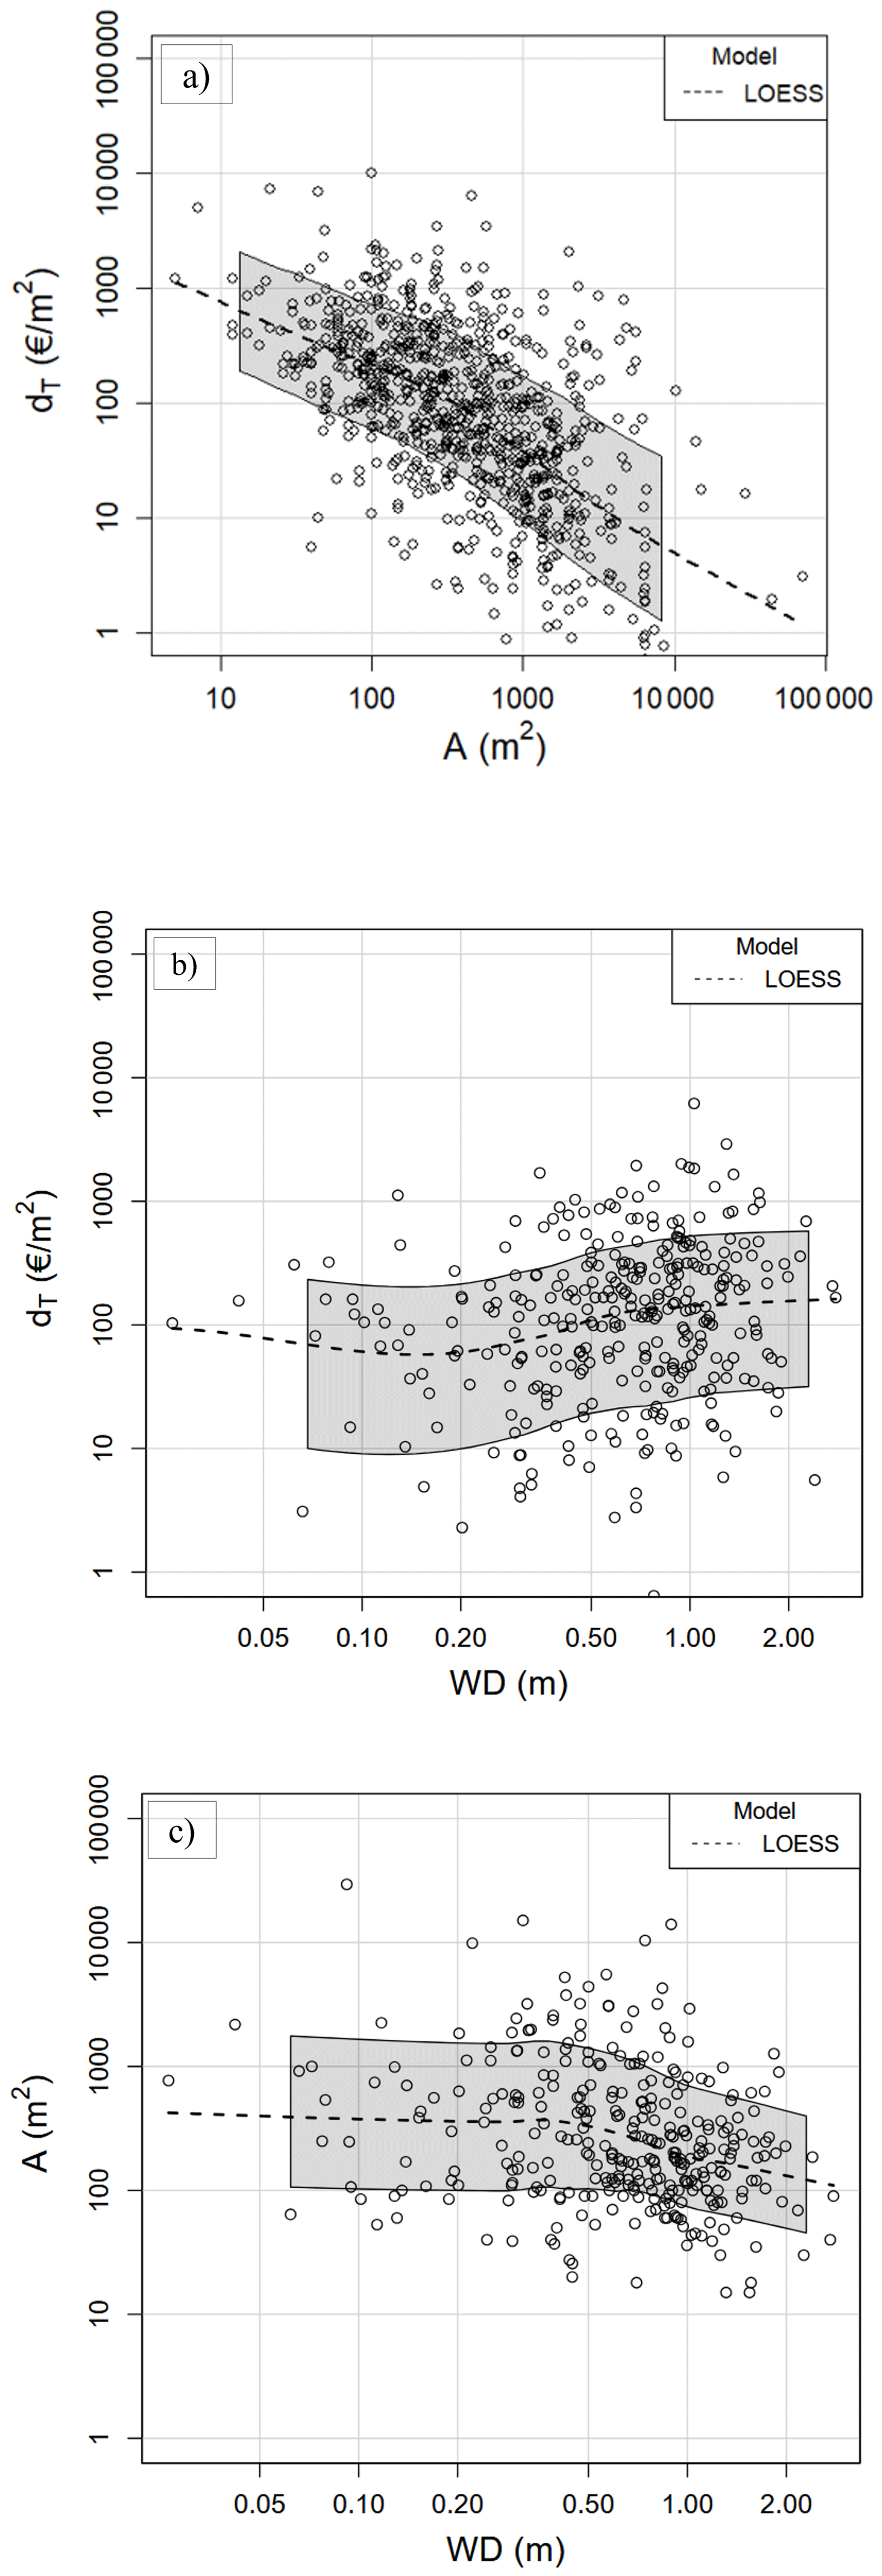
Figure 4(a) Unitary damage (dT) vs. firm surface (A), entire dataset. (b) Unitary damage (dT) vs. water depth (WD), group 1. (c) Firm surface (A) vs. water depth (WD), group 1. The dashed curve represents the results of the Loess regression. The grey shaded region shows the 95 % confidence interval of the LOESS estimate.
5.3 Forecast model
The following function has been assumed to describe the relationship between the unitary damage and the explanatory variables:
where:
-
DC is the dummy variable for the manufacture category.
-
DI is the dummy variable for the restaurant category.
-
Doff is the dummy variable for the offices category.
-
DQ is the dummy variable for the healthcare category.
-
DS is the dummy variable for the services category.
The decision to use a product function for damage estimation was primarily driven by the need to account for a relative independence of the firm's size and/or water depth on the damage. This implies that, according to Eq. (3), any variation in firm size or water depth will lead to a multiplicative effect in damage. The decision to use dummy variables to account for the variation in damage across economic sectors is driven by the limited size of the dataset, which is insufficient to create a separate econometric model for each sector. The model accordingly assumes the impact of surface and water depth on damage as uniform across all economic sectors.
The model assumes “commercial” as the reference category; therefore, no dummy variable is introduced for this category. If data pertain to another sector (say, manufacture), the corresponding dummy variable is equal to unity, while all the others are zero; consequently, amplifies (β3>0) or diminishes (β3<0) the reference constant , while all the other groups are neutral in the regression as they take unity values.
A logarithmic transform turns Eq. (3) into Eq. (4), to be estimated by Ordinary Least Squares (OLS) after adding u, the random error term, representing the unobserved factors that affect the damage but are not included in the model.
Log transformations of variables also have some statistical advantages in the case of skewed distributions as those in Fig. 1: by taking the natural logarithm of the values, the distribution becomes more symmetrical, allowing a more reliable calculation of some statistical measures (mean and standard deviation, test of normality, OLS assumptions, t test, R2) that assume the data are approximately normally distributed. Using log transformed variables the variability of both dependent and independent variables is reduced, and it permits to decrease the susceptibility of Ordinary Least Squares (OLS) estimates to extreme (outlying) values; thus, there is no need to eliminate them.
The forecast model was initially derived using only the data from Group 1, the dataset for which all explanatory variables are available. The results are provided in the first column (1) of Table 5, indicating the lack of statistical significance for water depth, likely because the variable does not vary enough to significantly influence the damage caused. Subsequently, water depth was dropped as explanatory variable, and the analysis was extended to the entire dataset (Group 1 and 2) to enhance model robustness. For the same reason, the K-fold cross-validation technique was implemented (Hasanzadeh Nafari et al., 2016). The dataset was divided into K subsets (folds) of approximately equal size, with K set to 10. The model was then trained and evaluated K times, each time using one of the folds as the test set and the remaining (K−1) folds as the training set. The second column (2) of Table 5 reports the average values of the estimated coefficients and performance metrics across the 10 folds, representing the results of model training and validation.
Results reveal a negative and statistically significant coefficient for the firm's surface (p<0.01), confirming the correlation observed in the previous section. In the model with Group 1, differences across sectors are evident only for damage to manufacturing, which is higher than the others. By adding observations (Groups 1 and 2), it becomes apparent that damage to offices (Doff) is also statistically significant. Specifically, the manufacturing (DC) category exhibits higher damage (by 88 %)1, while offices have lower damage (by 67 %) compared to the commercial category. Concerning the surface coefficient, for a 10 % increase in the size of the firm, the unitary damage decreases, on average, by around 8 %.
The goodness of fit, expressed by the adjusted R2 in Table 5, is 0.37, indicating that the model can explain 37 % of the total variance in damage. The coefficient of variation (CV) indicates that, on average, individual point errors are approximately two and a half times the mean of the response variable.
According to the analysis, the forecast model for the damage can be expressed as:
Table 5Results of the log-log regression with OLS for the unitary total damage; standard errors in brackets. The magnitude of the statistical significance of the explicative variables is expressed by the number of stars (*). A low p value (***), indicates greater evidence against the null hypothesis and thus greater statistical significance: ∗ p<0.1; p<0.05; p<0.01.
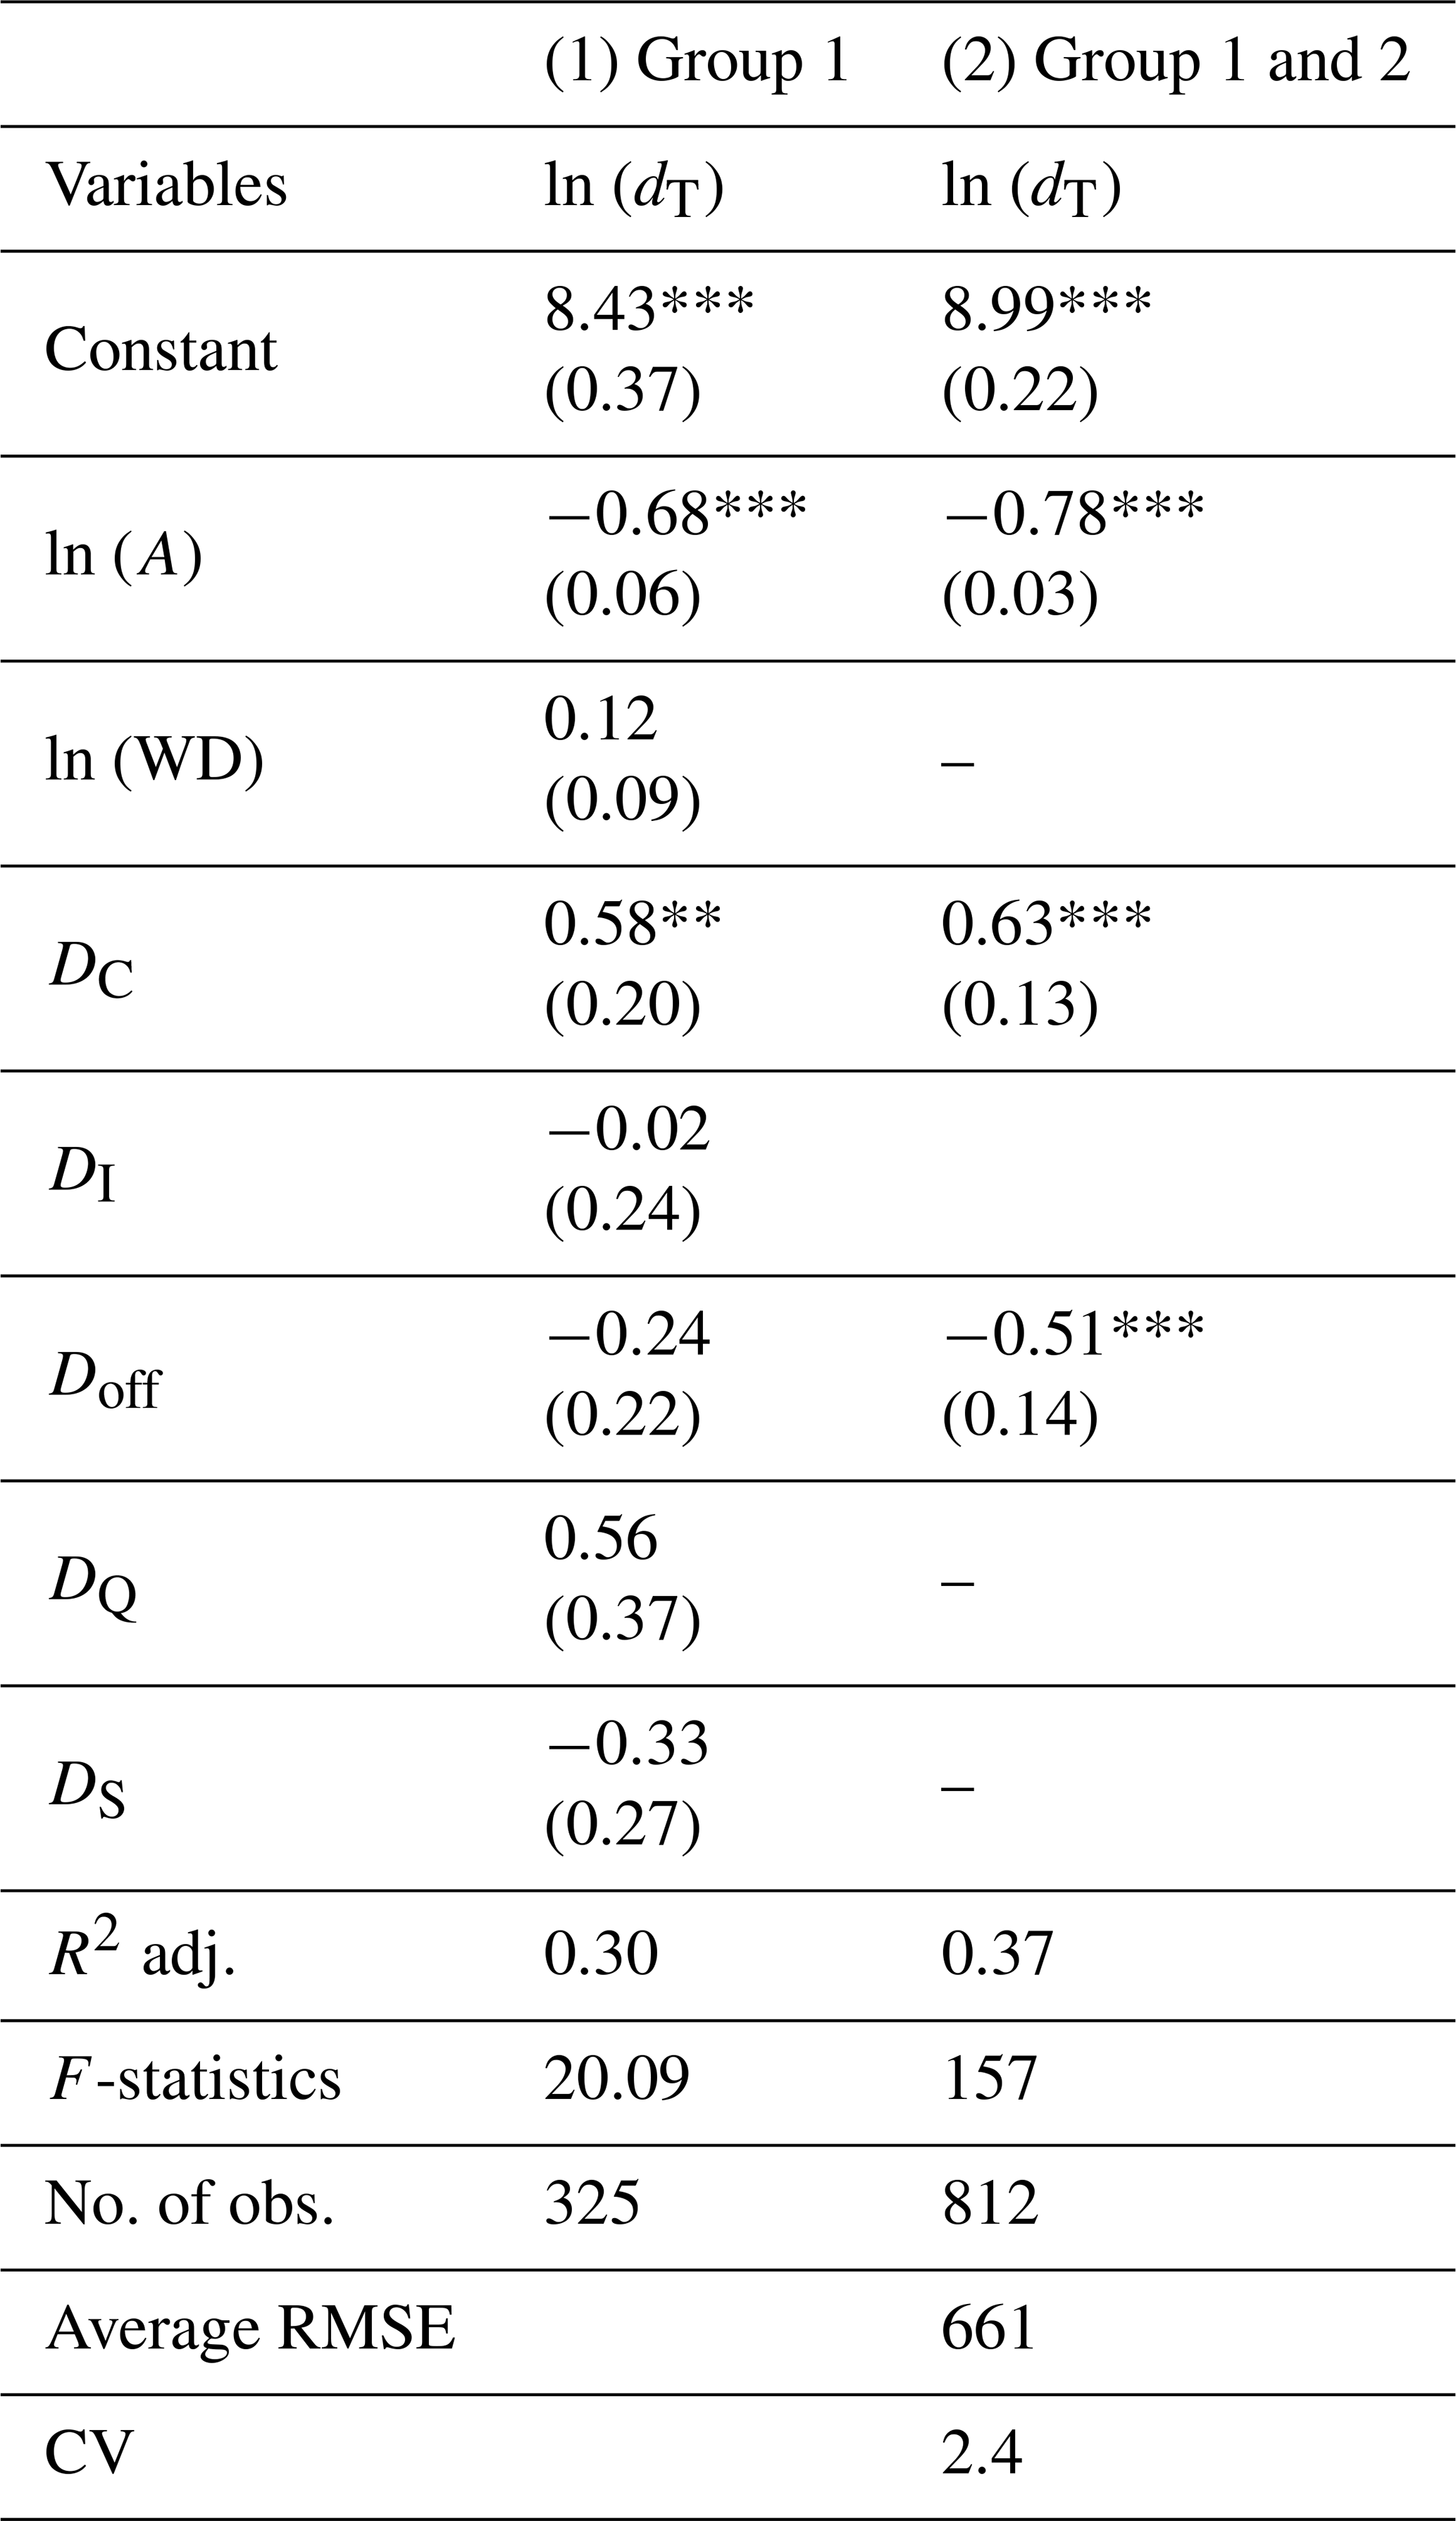
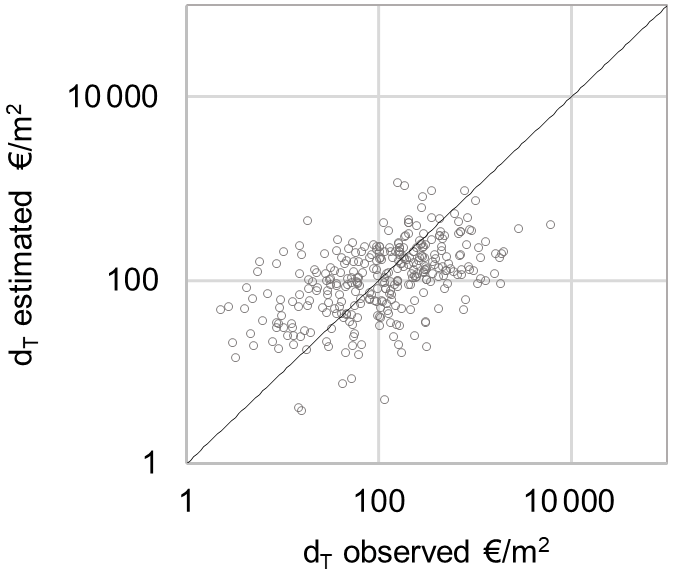
Figure 5Scatterplot of the observed versus estimated unitary total damage (EUR m−2). The black line is the bisector.
The scatterplot in Fig. 5 shows the comparison between the observed and the estimated total unitary damage: most points cluster around the bisector, indicating a good level of agreement between actual and predicted values; however, a high dispersion is observed across the range of damage values, consistently with the moderate R2, suggesting limited explanatory power of the model.
This paragraph replicates the analysis made in previous section, albeit with a distinction among the damage components.
6.1 Descriptive statistics
The analysed variables are the unitary damage to the building structure (dBS), stock (dS) and equipment (dE) in relation to the surface of the activity (A) and the water depths (WD):
Table 6 presents the average values of unitary damage by component and economic category, while their distribution is depicted in Fig. 6. Across all sectors, the highest average damage is observed for equipment, followed by stock and structure. Similar findings were reported by Samantha (2018). It is evident that for the unitary damage to the building structure and equipment, the highest median values are observed for the Healthcare, Offices, and Restaurant sectors, which have the lowest surface area (Fig. 3) and are often located in civil buildings. For damage to the stock, the highest median value is associated with the commercial category.
Table 6Average values of the damage by components and by economic sectors. Damage to the structure (BS) includes data from the entire dataset; damages for the equipment (E) and stock (S) include only the data of the Group 1. Total average (last line) refers to the average for all sectors for each damage component.
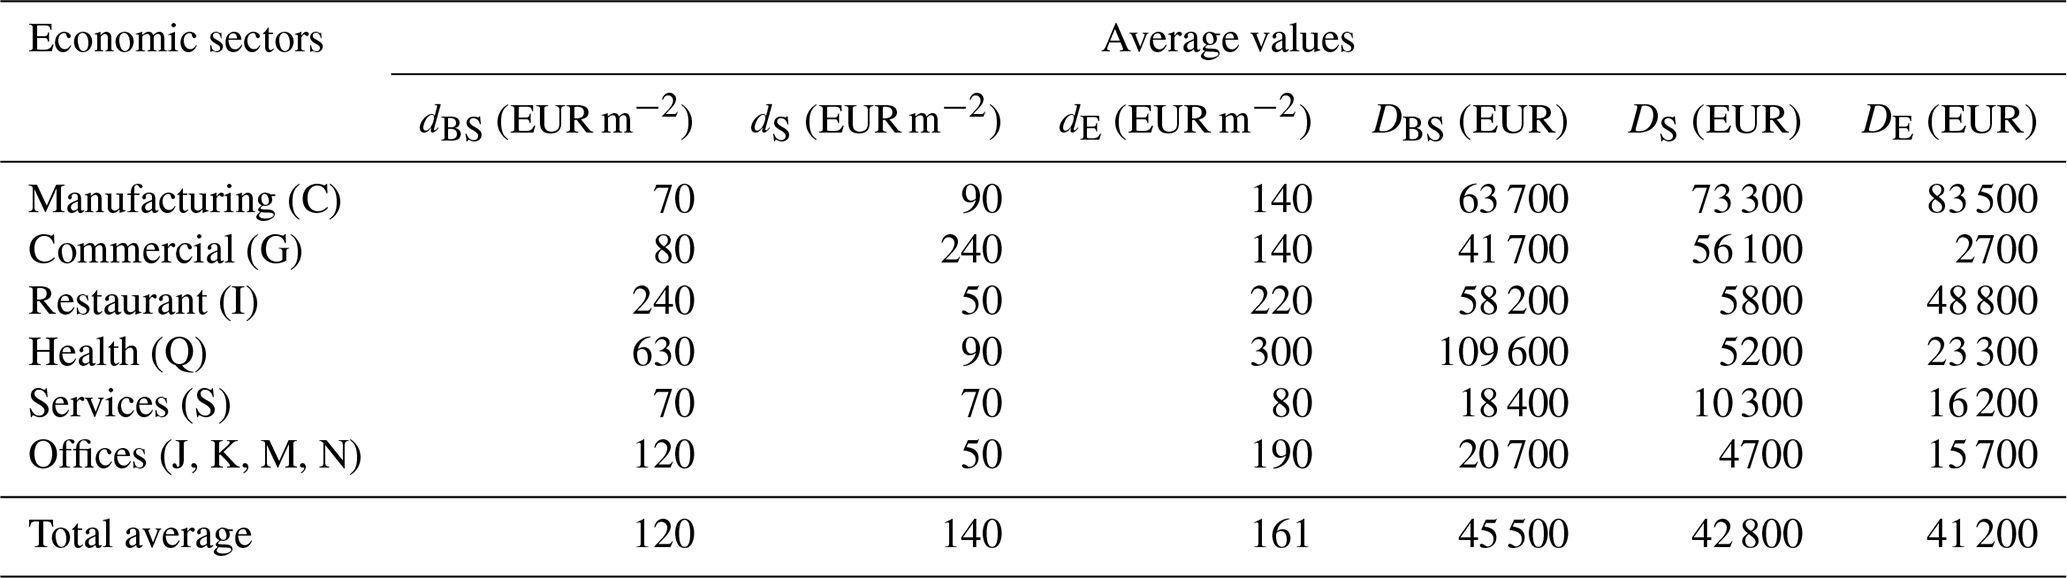
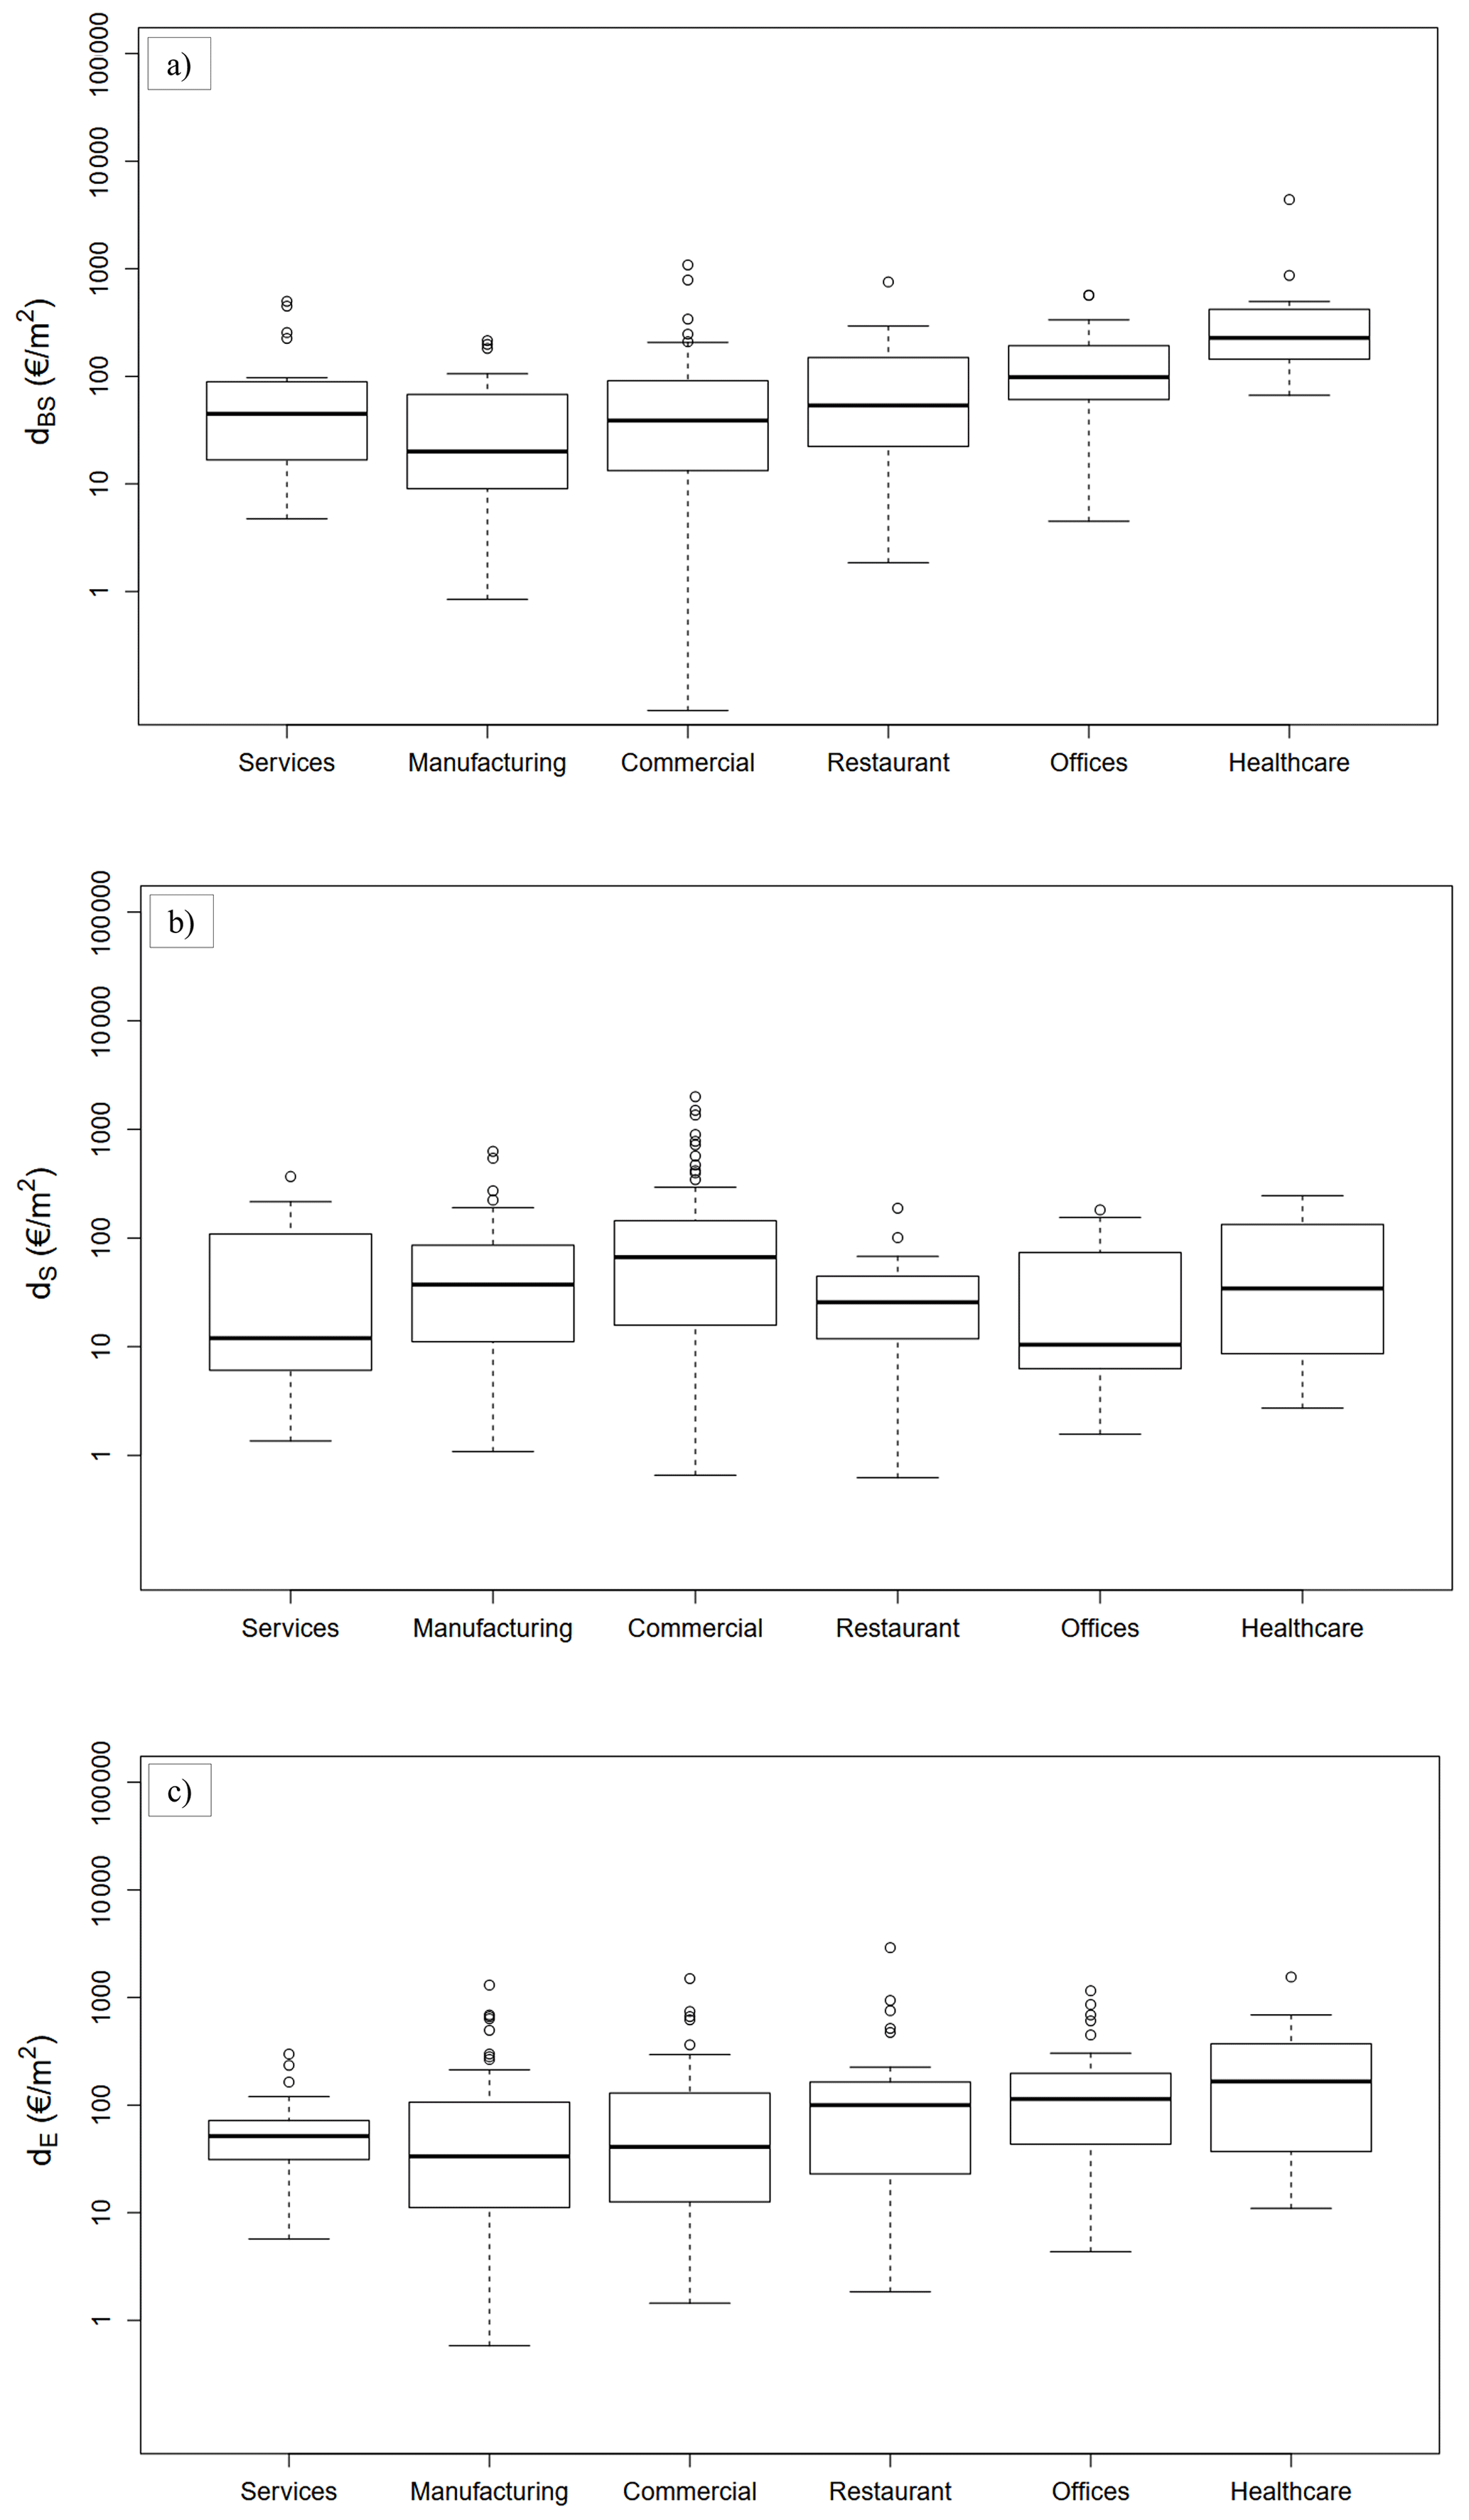
Figure 6Boxplot of the unitary damage by component and by economic category (ln-scale); (a) damage to the structure (dBS); (b) damage to the stock (dS); (c) damage to the equipment (dE).
6.2 Correlation analysis
Figures 7 and 8 illustrate the correlation between the unitary damage incurred for various components and the surface area of the firm, along with the water depth level. The correlation with the surface is negative for all the components, confirming the trend observed for the unitary total damage (Fig. 4). In Fig. 8, the Loess curve indicates a positive correlation with water depth, with the stock component showing the most pronounced dependence.
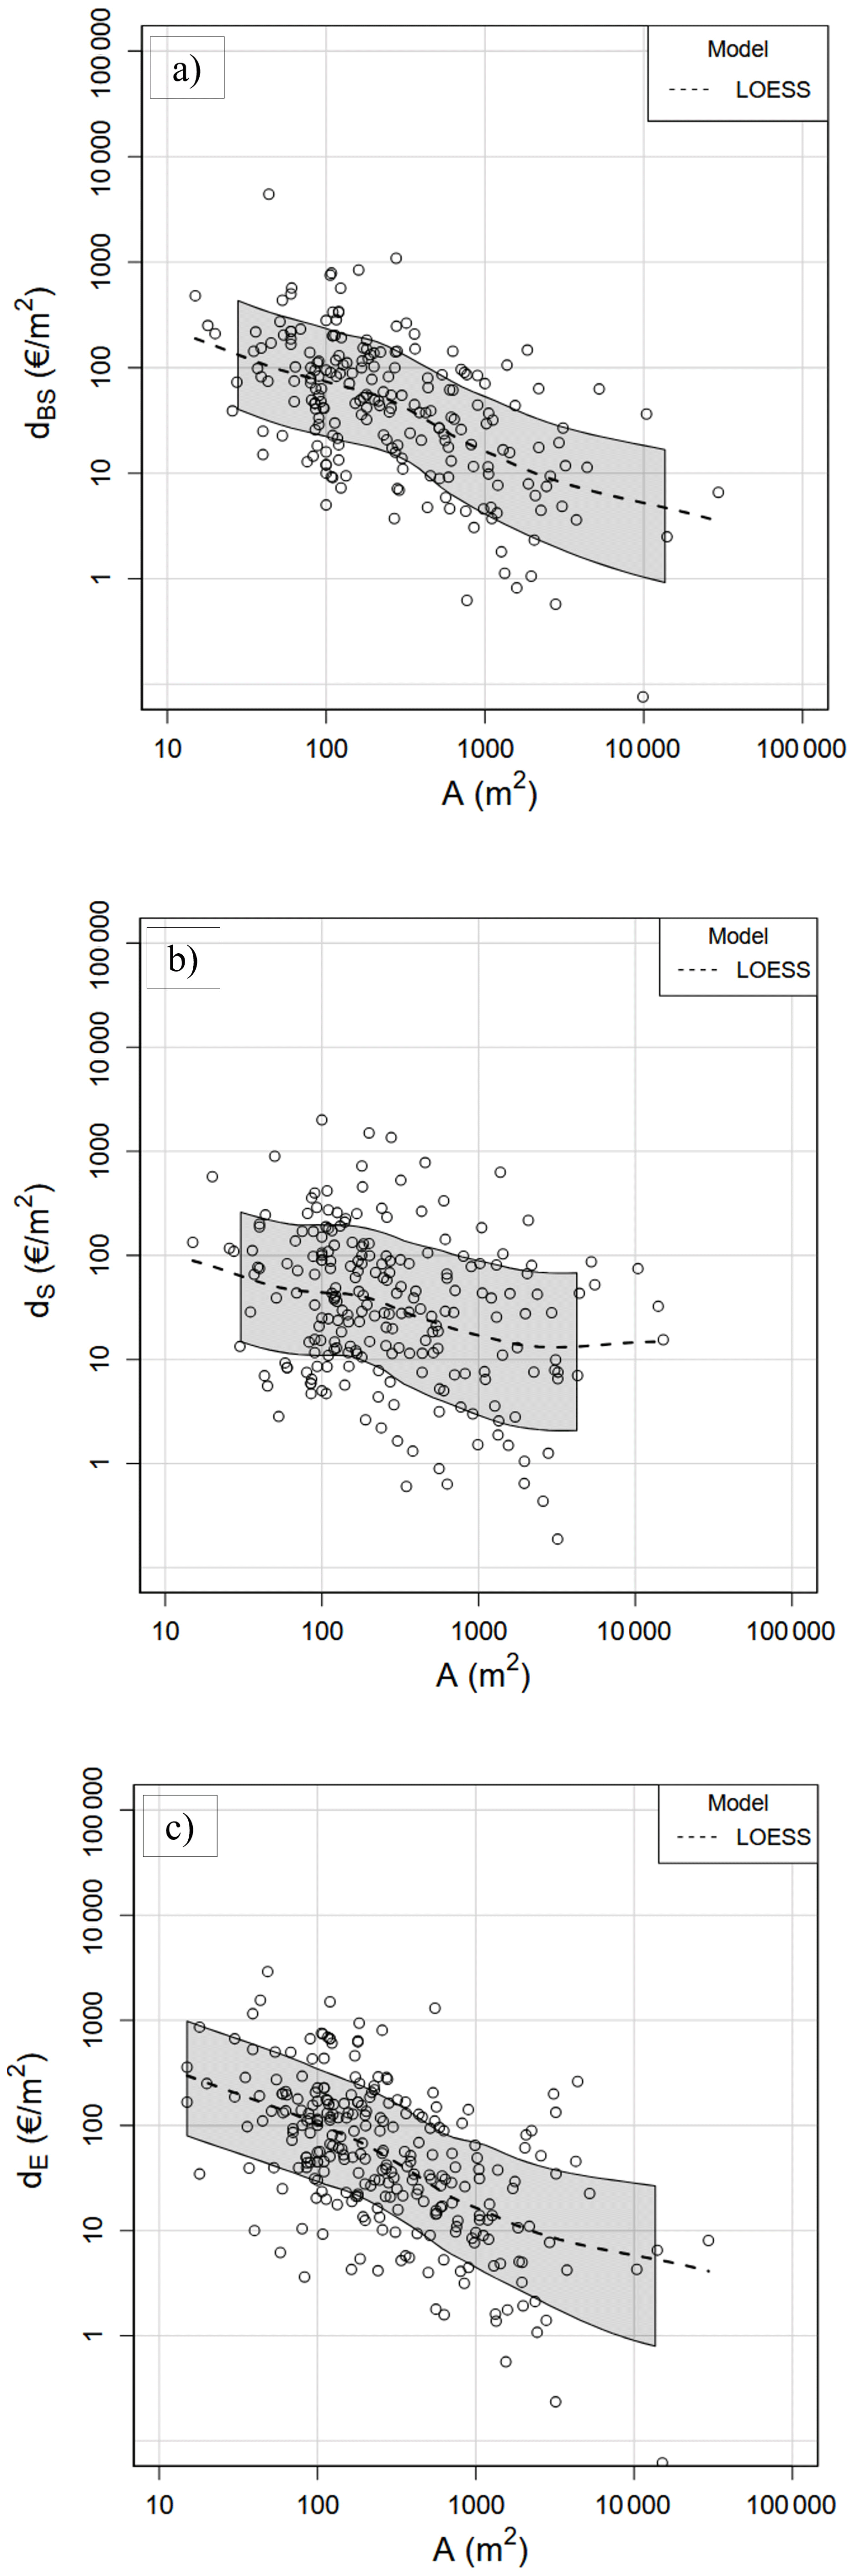
Figure 7Scatterplot of the unitary damage vs. firm surface. (a) Unitary damage to the structure (dBS). (b) Unitary damage to the stock (dS). (c) Unitary damage to the equipment (dE). The grey shaded region shows the 95 % confidence interval of the LOESS estimate.
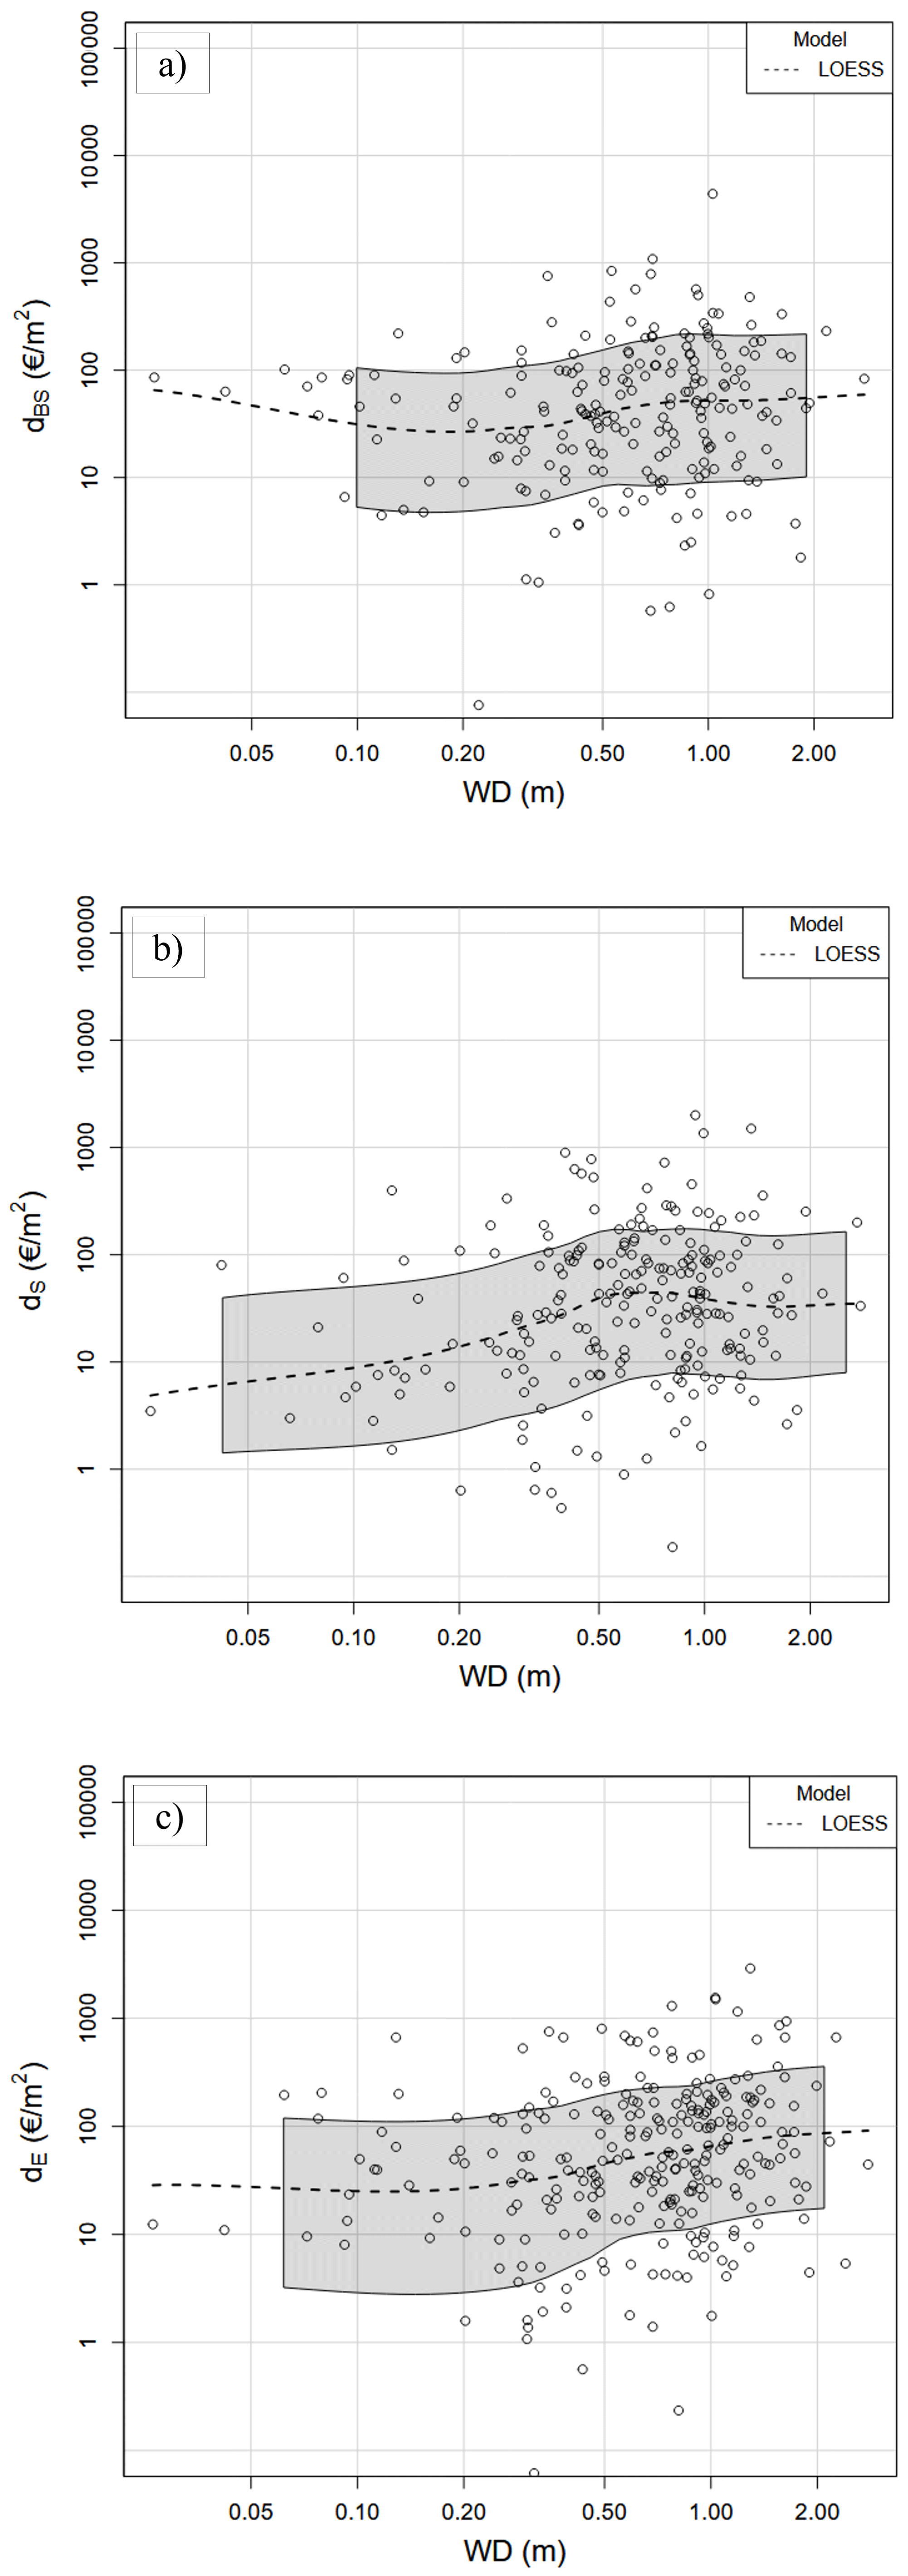
Figure 8Scatterplot of the unitary damage vs. the water depth (a) Unitary damage to the structure (dBS). (b) Unitary damage to the stock (dS). (c) Unitary damage to the equipment (dE). The grey shaded region shows the 95 % confidence interval of the LOESS estimate.
6.3 Forecast model
The functional relations tested for damage to components is analogous to that for the total damage:
Table 7 shows the results of the linear log-log regression model used to derive the forecast model. The analysis was performed without validation, using the whole dataset due to the limited number of observations. Specifically, columns (1), (3), (5) present the results of the initial regression, including all explanatory variables. Subsequently, columns (2), (4), (6) present the outcomes of a refined regression, considering only the variables with statistically significant coefficients.
The results align with the correlation analysis. The coefficients for the surface are negative and significant for all damage components, signifying that, as for the total damage, as the size of the firm increases, the unit damage decreases by an amount that depends on the A value. The coefficient of water depth is positive and significant only for stock damage, indicating that as the water depth increases, the unit damage increases by an amount that depends on the value of WD. In terms of differences between damage in different sectors, statistically significant variations are observed. For damage to structure, only the Healthcare category shows significantly higher average damage compared to the Commercial category. In the case of equipment damage, the Manufacturing category stands out with statistically higher damage than the Commercial category. Regarding stock damage, all sectors, except Manufacturing, exhibit lower average damage than the Commercial category.
The goodness of the fit expressed by the adjusted R2 varies from 0.26 to 0.36, meaning that the model explains from 26 % to 36 % of the variance of the unitary damage to the different components.
According to the analysis, the forecast model for the unitary damage to the components can be expressed as:
Table 7Result of the log-log regression model for each component of the damage: unitary damage to the structure (dBS), unitary damage to the stock (dS), unitary damage to the equipment (dE). Standard errors in brackets. The magnitude of the statistical significance of the explicative variables is expressed by the number of stars (*). A low p value (***), indicates greater evidence against the null hypothesis and thus greater statistical significance: ∗ p<0.1; p<0.05; p<0.01.
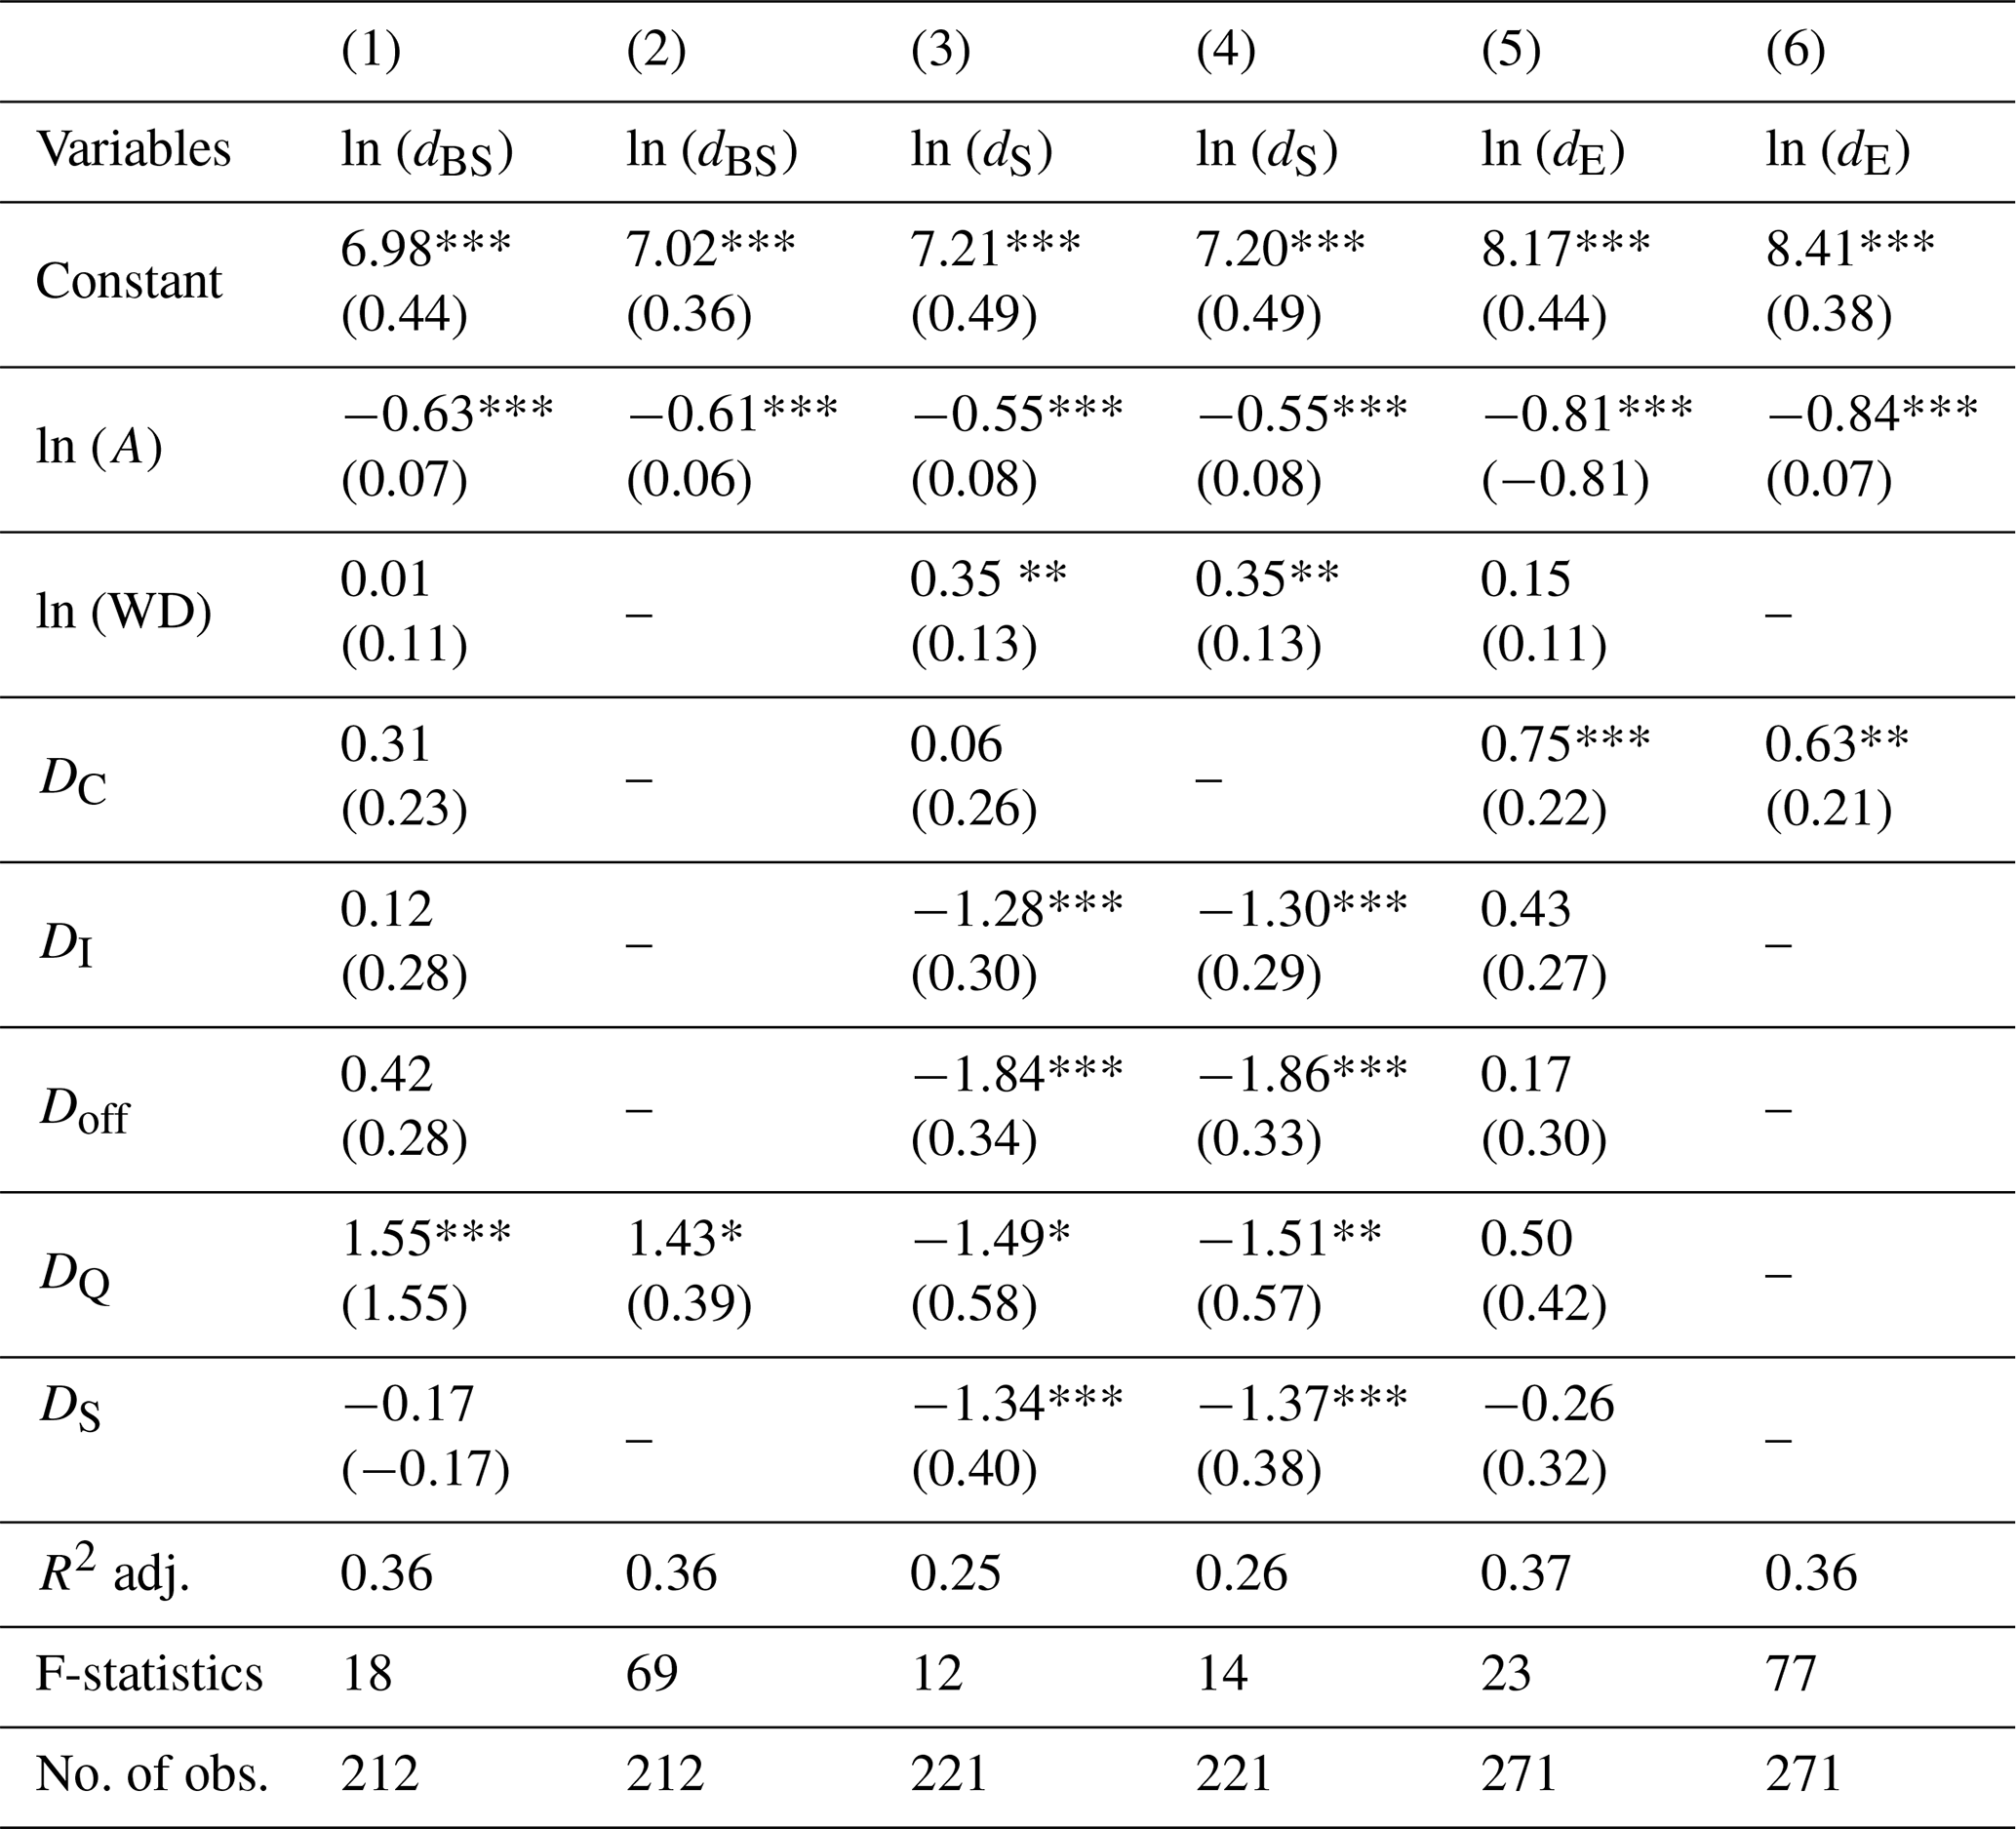
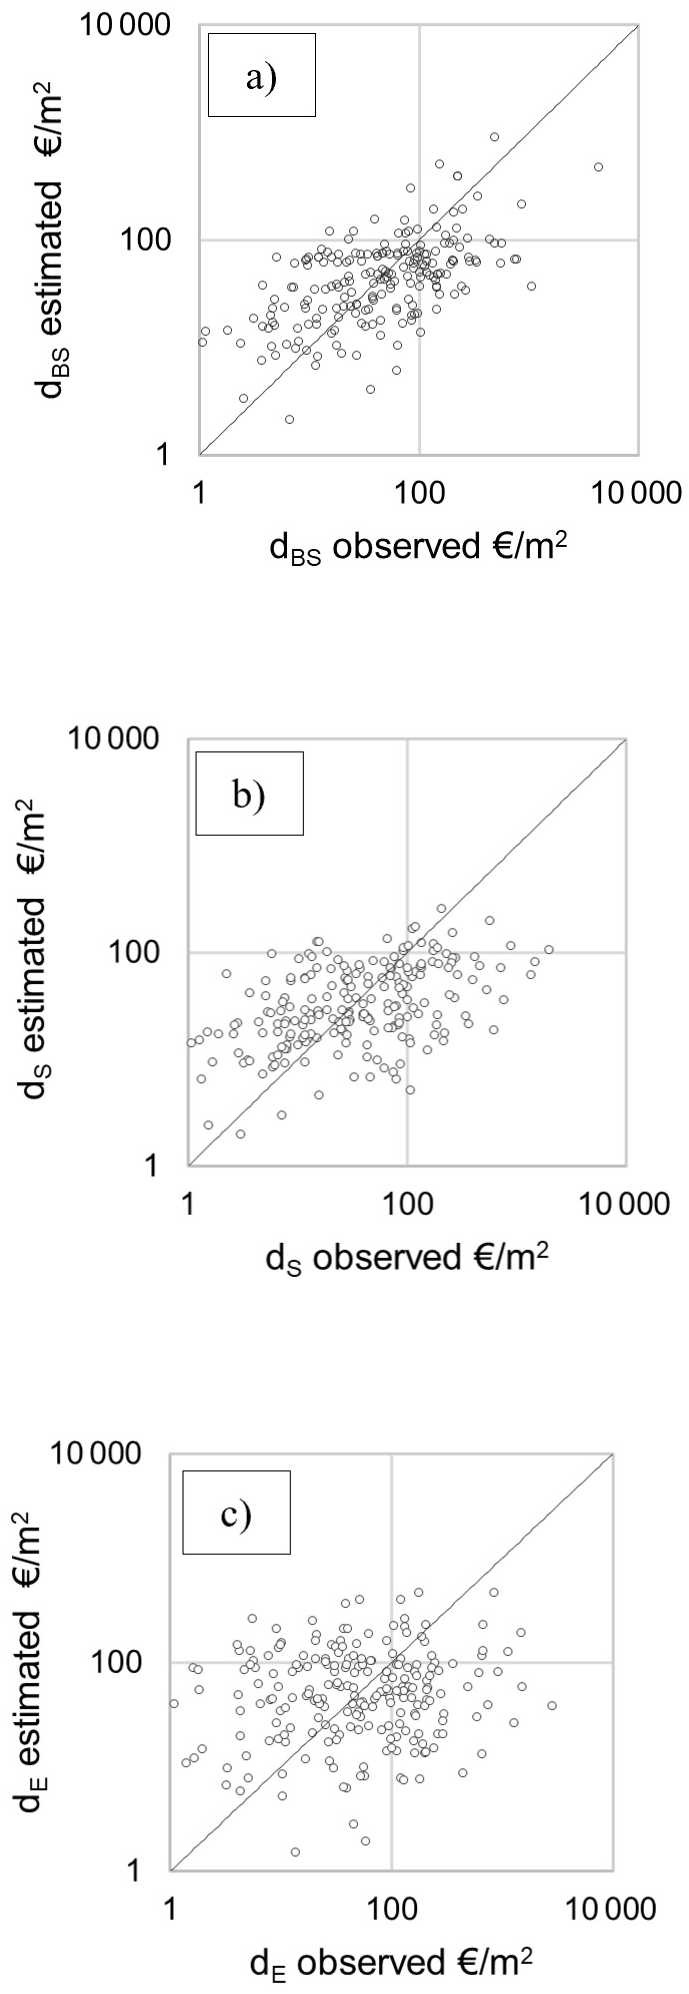
Figure 9Scatterplot of the observed versus estimated unitary damage (EUR m−2). (a) Unitary damage to the structure (dBS). (b) Unitary damage to the stock (dS). (c) Unitary damage to the equipment (dE). The dot red line is the bisector.
The scatterplots in Fig. 9 compare observed and estimated unitary damages across three asset sectors: structures (a), stock (b), and equipment (c). Overall, dispersion increases from (a) to (c), indicating a decreasing model performance across asset types. In the case of stock (b), there appears to be a tendency to overestimate smaller damages and underestimate larger ones. Structural damage (a) shows the closest fit overall, with most values distributed symmetrically around the bisector.
We conducted a comparison between the estimations provided by our model and those of existing models in Europe to determine added value with respect to the unsuitable implementation of foreign models. Specifically, the comparison was made with models discussed in Sect. 2, namely FLEMO-cs, the model included in the Multicoloured Manual (referred to as MCM hereafter), and the French model (Ministère de la Transition Écologique et de la Cohésion des Territoires, 2024). This comparison was conducted using data only from group 1, as foreign models typically require input values for water depth, which are available only for this dataset. Additionally, with the exception of the French model, the foreign models are relative, necessitating a preliminary estimation of the exposed value to achieve damage estimations that are comparable among all the models under consideration. To accomplish this task, we implemented the method based on the net capital stock proposed by Molinari et al. (2016) and further implemented in the MOVIDA project. This approach has two main limitations: (i) the uncertainty of estimated exposed values, and (ii) the possibility to compare only damage to structure and equipment, as net capital stock values are supplied by ISTAT only at the national level and without reference to stock; however, a distinction is made among the various NACE sectors. Nonetheless, it was not possible to compare all the models for all the sectors included in our model, as they are not always present in foreign models. Table 8 provides a synthesis of the main characteristics of compared models. With specific reference to the French model, even though it provides a direct estimation of damage and includes all sectors, the comparison was possible only for the damage to the structure component, as information on the number of employees required for the estimation of the damage to equipment is not present in our dataset. The comparison with available Italian models (Molinari et al., 2020; Arrighi et al., 2013) was not conducted for the following reasons. As discussed in Sect. 2, the model of Arrighi et al. is closely tied to the exposure and vulnerability parameters of the city of Florence. It relies on local real estate values specific to the city, making it difficult to compare with national net capital stock values.
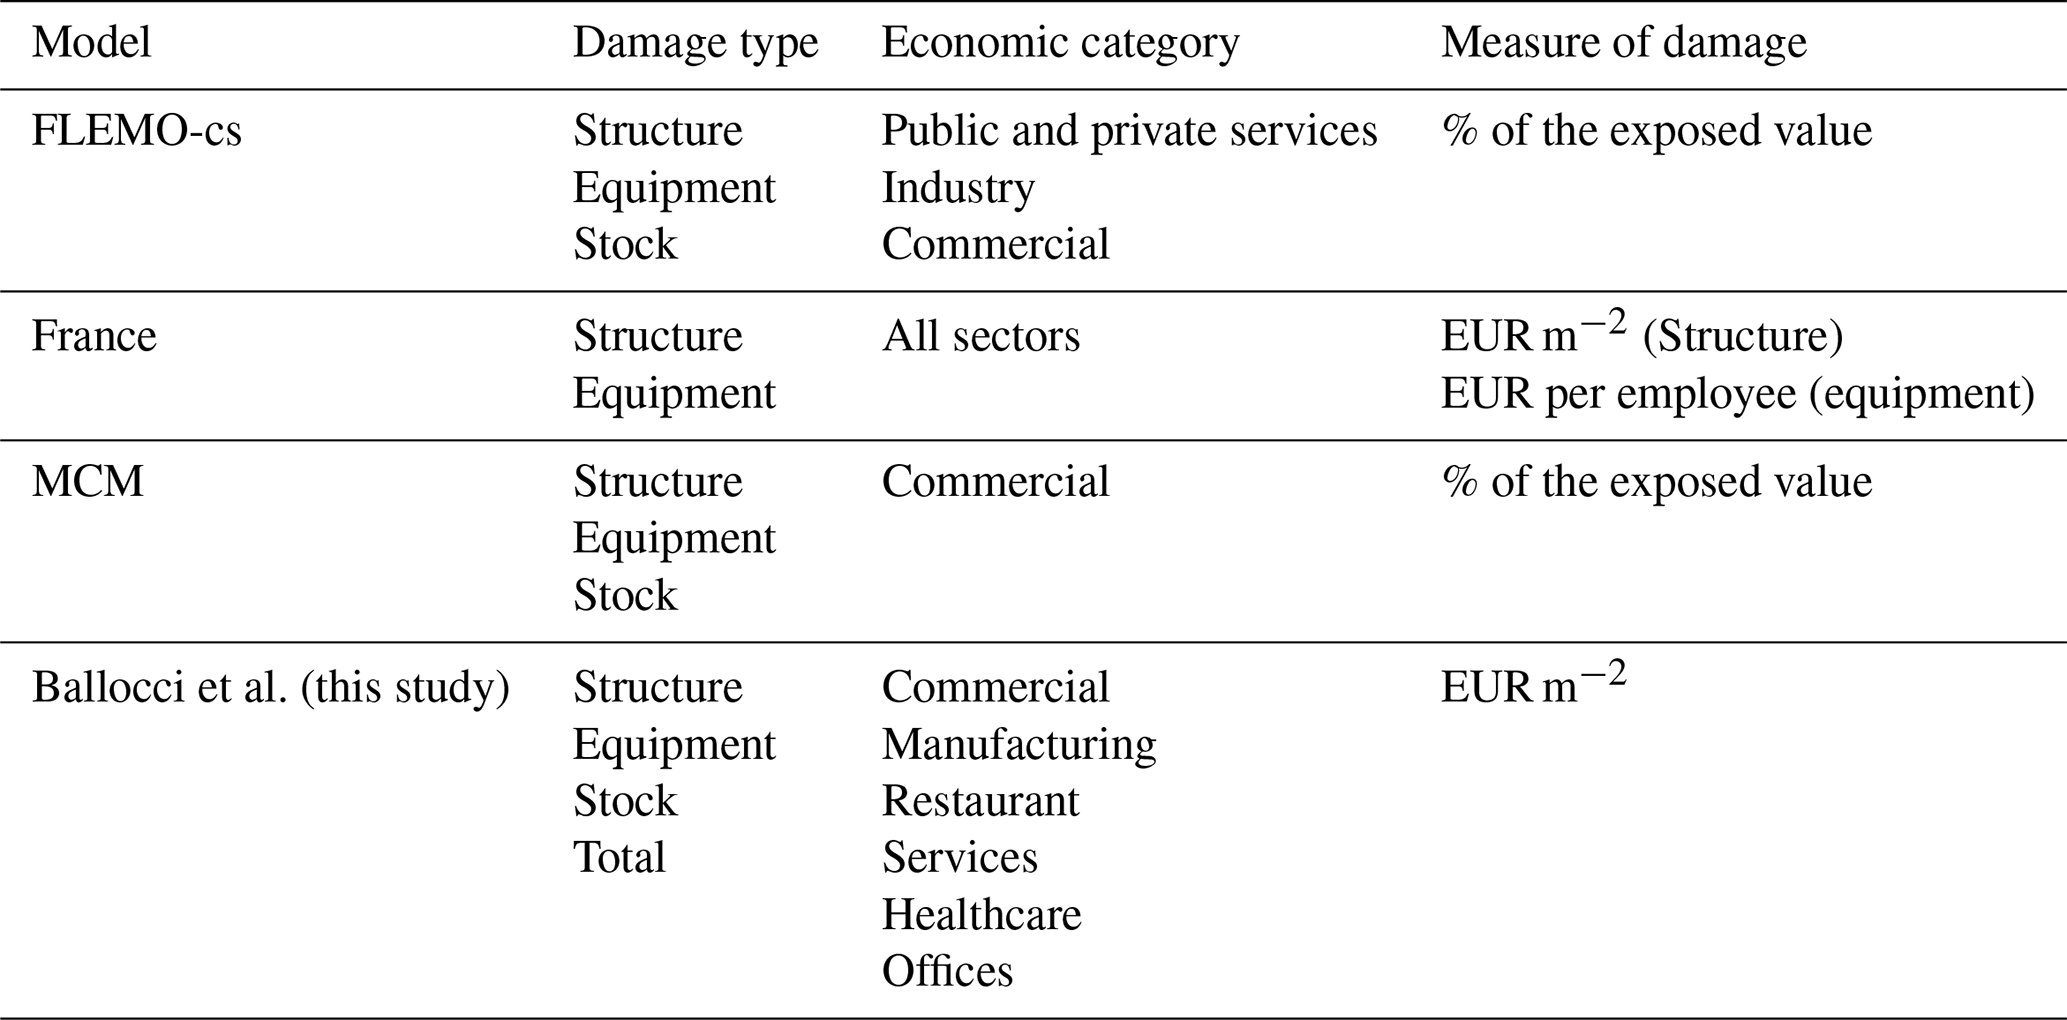
On the other hand, the model of Molinari et al. (2020) implements a foreign meso-scale model, rendering the comparison with our micro-scale model nonsensical a priori.
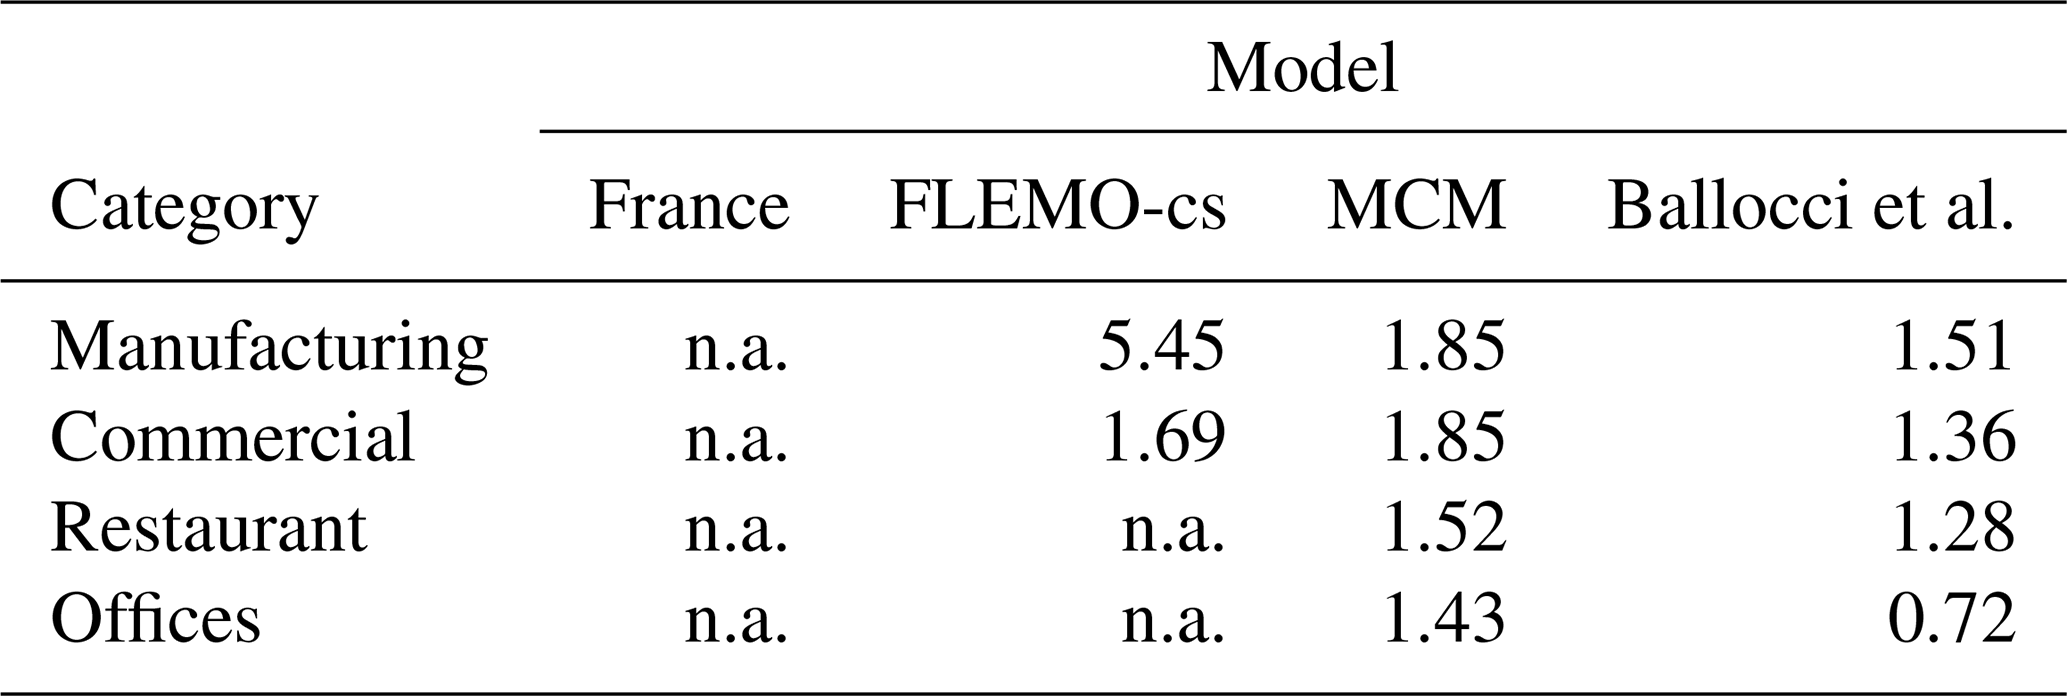
Tables 9 and 10 display the results of the comparison in terms of the RMSE calculated with reference to the logarithm of the unitary damage, considering the nature of our model that minimizes relative errors – i.e., percentage differences – rather than absolute errors, due to the log-transformation applied to the dependent variable. The findings underscore that our model exhibits the best performance, thereby enhancing the reliability of damage estimation for the Italian context. This result was expected, since the model was built on this data set. However, this comparison gives a measure of the reduction in uncertainty (error) that we would have had in the case of directly applying the other models to the Italian context.
Table 9RMSE of the logarithm of the unitary damage to the structure (EUR m−2). “n.a.” indicates that the model does not provide an estimation for the corresponding category.
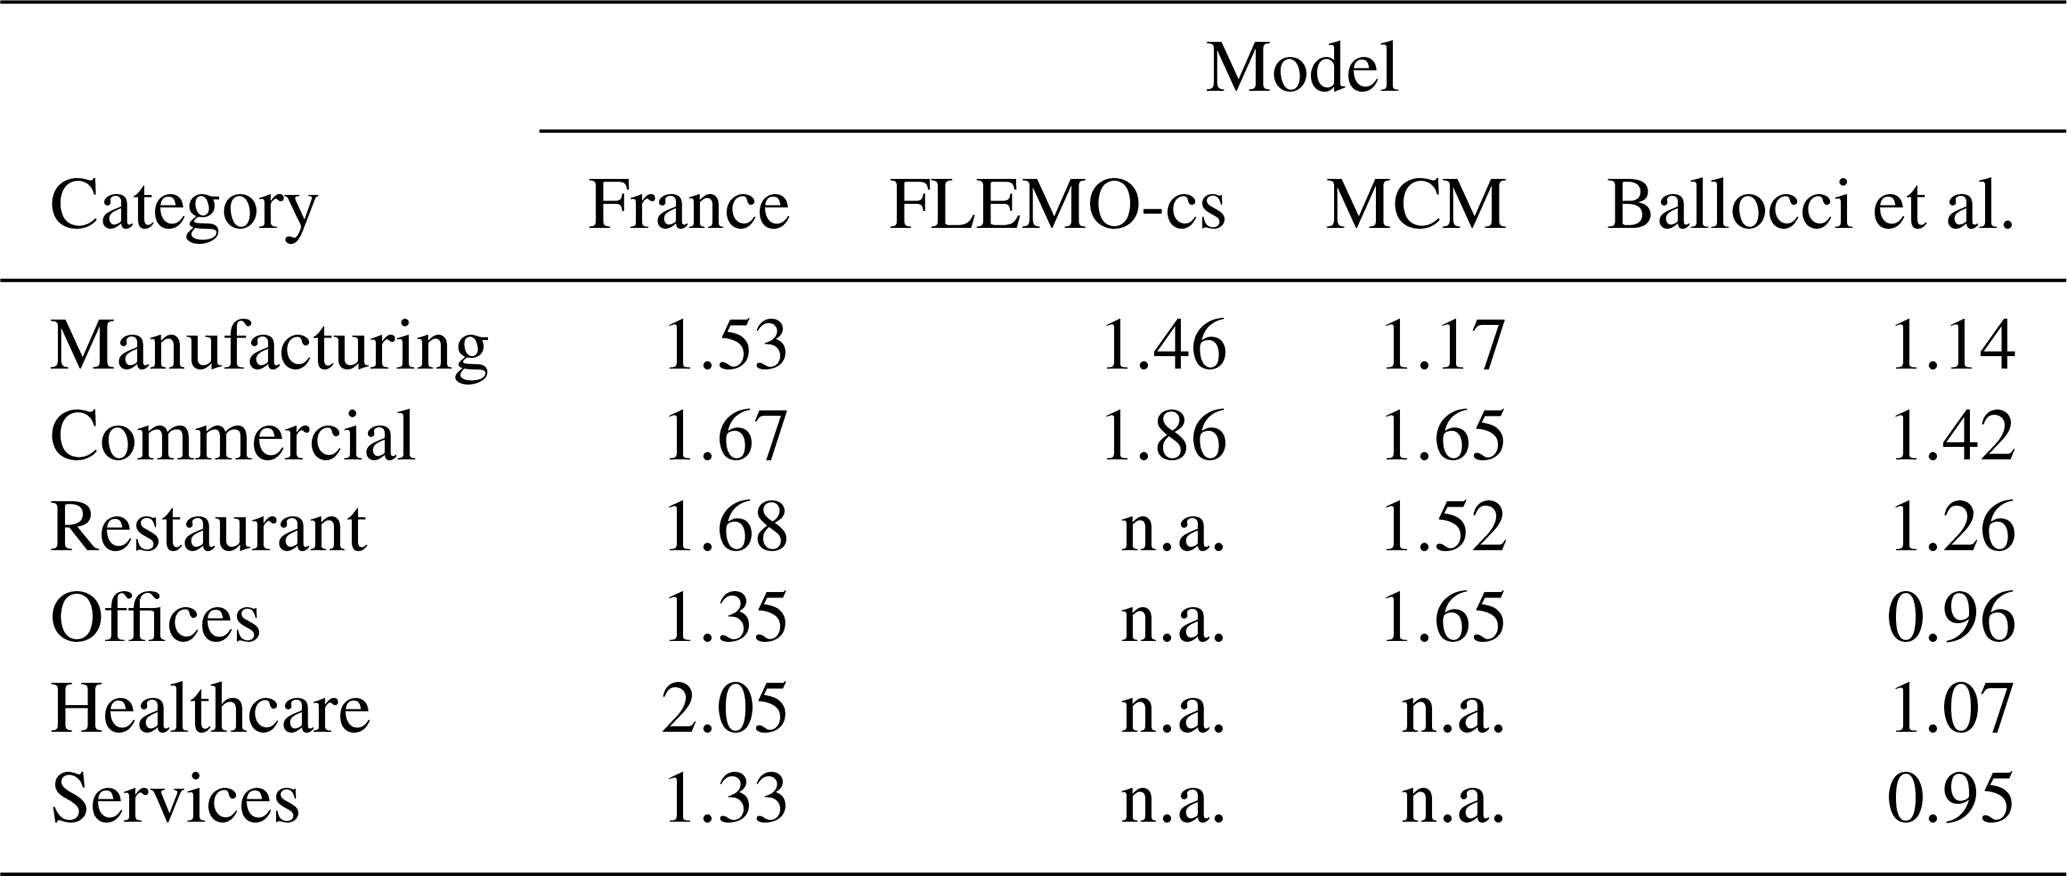
Table 10RMSE of the logarithm of the unitary damage to equipment (EUR m−2). “n.a.” indicates that the model does not provide an estimation for the corresponding category, or that our data do not allow the model implementation (i.e., French model). Only sectors for which at least one foreign model is available are reported.
The adopted modelling approach proved to be valuable for both comprehending the role of each explanatory variable in the definition of the damage to different business components and detecting differences among damages occurring in different business sectors.
Results indicate a significant impact of the firm's surface on the extent of damage, albeit with varying degrees for different damage components (structure, equipment, stock, and total). Notably, water depth exhibits a significant influence only on stock damage. It is worth noting that the limited variation in water depth within the data sample (with 50 % of values ranging between 0.40 and 1 m) may inhibit to establish a statistically significant relationship with the overall damage.
The study identifies Healthcare, Commercial, and Manufacturing as the most vulnerable sectors for building structure, stock, and equipment, respectively. Several factors may contribute to the higher damage in the manufacturing category. One possibility is the presence of more expensive and specialized equipment, which could be more susceptible to flooding compared to equipment in other sectors. Additionally, the manufacturing and commercial sectors may handle a greater quantity of goods, and the nature of these goods (such as food, electronics, or chemicals) could make them more sensitive to water damage, resulting in higher damage to stocks. As for the elevated damage to the structure in the Healthcare category, this could be attributed to the typically civil nature of the buildings where they are located, generally more vulnerable than industrial sheds. Overall, the observed variability underscores the importance of tailored risk management approaches for different business sectors.
However, despite an improvement in damage estimation reliability compared to the implementation of foreign models in the Italian context, the model's predictive capability is still considered unsatisfactory. The goodness of fit to the observed data indicates that the model can only account for around 37 % of the variance in total unitary damage and between 26 % and 36 % of the variance in individual components. Additionally, the root mean square error (RMSE) for total unitary damage is approximately double the average unitary damage. We attribute these limitations mainly to constraints within the available dataset. It is evident that crucial explanatory variables are missing, or in other words, the variables incorporated in the model might not be capturing all the relevant damage mechanisms. Moreover, as explained in Sect. 3, available data are characterized by varying levels of reliability, contingent upon the specific case study to which they refer, and thus, on the methods employed for their collection and evaluation. Another potential concern is the presence of a “selection bias” arising from the counterintuitive negative relationship between the building's surface area and water depth. This bias might be elucidated by an underrepresentation of small firms with shallow water depths in the dataset. Specifically, the dataset predominantly includes large firms (i.e., exceeding 80 m2) with water depths lower than the average value, resulting in high absolute damage (Fig. 4b). Conversely, small firms (below 80 m2) with water depths higher than the average value exhibit lower absolute damage (see Fig. A1). This suggests the possibility of missing values associated with small economic activities with low water depth. This absence of information could impact both correlations depicted in Fig. 4a and b. As a matter of fact, it is likely that larger firms, possessing more resources and personnel, are more inclined to report damages compared to smaller firms. The increased likelihood of larger firms engaging in the reporting process could stem from their ability to allocate resources to such endeavours and navigate through bureaucratic procedures. In contrast, smaller firms, constrained by limited resources and personnel, may find the process more burdensome, especially when there are low expectations of receiving compensation, leading to underrepresentation in the reported data. The knowledge about flooded companies that suffered damage but did not declare it could support the testing of the selection bias by means of the “Heckman model” (Heckman, 1979). The latter would be able to test if the likelihood of an observation to be within the sample is related to the characteristics of the firm and to correct the coefficients estimation for missing data. In addition, another potential source of uncertainty may lie in the estimation of surface area, which was not always available in the original dataset. In these cases, the surface was manually estimated through GIS analysis using topographic databases. While this allowed us to reconstruct missing values, it may have introduced further variability that interacts with water depth in affecting damage estimates.
Another possible limitation is related to the fact that the dataset relies on self-reported information collected shortly after flood events, it is subject to potential inaccuracies due to memory recall, subjective estimations of damages by business owners, or the pressure to report higher damages to access public compensation schemes.
Overall, our results point to the need of disposing of more complete and numerous data, specifically collected for the objective of damage modelling (Ballio et al., 2018; Pogliani et al., 2021). This could also lead to the possibility of performing different econometric analysis for different business sectors.
It is well known that micro-scale damage models exhibit significant dispersion with respect to observed data. This phenomenon applies even to residential buildings, which are characterized by less heterogeneity than economic activities and for which more reliable data generally exist (Molinari et al., 2020).
In terms of feasibility, our model overcomes the challenge of reliably estimating the value of exposed assets in Italy, as discussed in the previous section. On the contrary, as it provides estimates of damage in absolute terms, it also requires updating the estimated damage value to the current currency, posing a further obstacle to its exportability to foreign countries. The model can be applied to estimate damage to economic activities across the entire Italian territory in cases of riverine floods. It is derived from data collected from various regions of the country and relies on input data commonly available throughout Italy, such as the surface area of the activity and the NACE code. Importantly, its independence from the water depth enables damage estimation in the early aftermath of a flood, when only the perimeter of the flooded area is typically known, as well as in areas lacking 2D hydraulic modelling. The independence from hazard variables also implies that the model is not suitable for evaluating the effectiveness of hazard-focused risk reduction measures (e.g., levees, retention basins), except in the case the measure totally avoid the flooding of the firm (WD = 0).
Nonetheless, the model proves valuable for other key aspects of flood risk management – particularly in identifying the most vulnerable business sectors and estimating potential economic damages. These outputs can inform targeted adaptation strategies, such as the development of insurance instruments, emergency preparedness plans, and policies aimed at enhancing business resilience.
Moreover, the model outperforms existing foreign approaches when applied to the Italian context, as demonstrated by its lower average estimation error. Therefore, despite the absence of explicit hazard indicators, the total damage model offers reliable comparative insights that are useful for policymaking, especially in post-event and planning phases.
Given the inherent uncertainty of the model, however, we recommend its use primarily for comparative analyses – such as assessing relative risk levels across different areas – rather than for precise risk estimation at individual sites.
The analysis conducted in this study provides significant new insights into the direct damage caused by floods to economic activities in Italy. By employing an econometric approach to empirical damage data, the study enhances our understanding of the impact of explanatory variables on damage to different firm components (structure, stock, and equipment), and identifies variations in damages across different business sectors, enabling the adoption of tailored risk management approaches. The main findings indicate that firm size (in terms of surface area) has a consistent and significant influence on the unitary damage across all damage components while water depth is only statistically significant for stock damage. Additionally, different business sectors exhibit distinct vulnerability profiles, with healthcare, commercial, and manufacturing firms showing the highest average damage to structure, stock, and equipment, respectively. Furthermore, the study derives a forecast model that outperforms foreign models and can be utilized for comparative purposes across the entire Italian territory to estimate flood risk/damage, both in post-event scenarios and in the peace time, where riverine floods are of concern. These findings underscore the importance of context-specific modelling and highlight the need for comprehensive and systematically collected empirical data to improve our understanding of damage mechanisms and strengthen flood risk assessment, insurance design, and public compensation strategies.
A1 Selection bias
In Fig. A1 is represented the average total damage by class of water depth with the number of firms for small and large firms. The aim of this figure is to show that in our sample there is a prevalence of large firms, with a size larger than 80 m2, with shallow water depth, lower than 0.7 m, which have high absolute damage (EUR) and small firms with high water depths (higher than 0.7 m) which have lower absolute damage. This leads to the assumption that there could be missing values related to the small economic activity with low water depth. These possible existence of missing values could lead to a bias in the econometric model that could be tested with the “Heckman model”, if we had data on flooded companies that suffered damage but did not declare it by filling the form. The Heckman model would be able to test if the likelihood of an observation to be within the sample could be related to the characteristics of the firm.
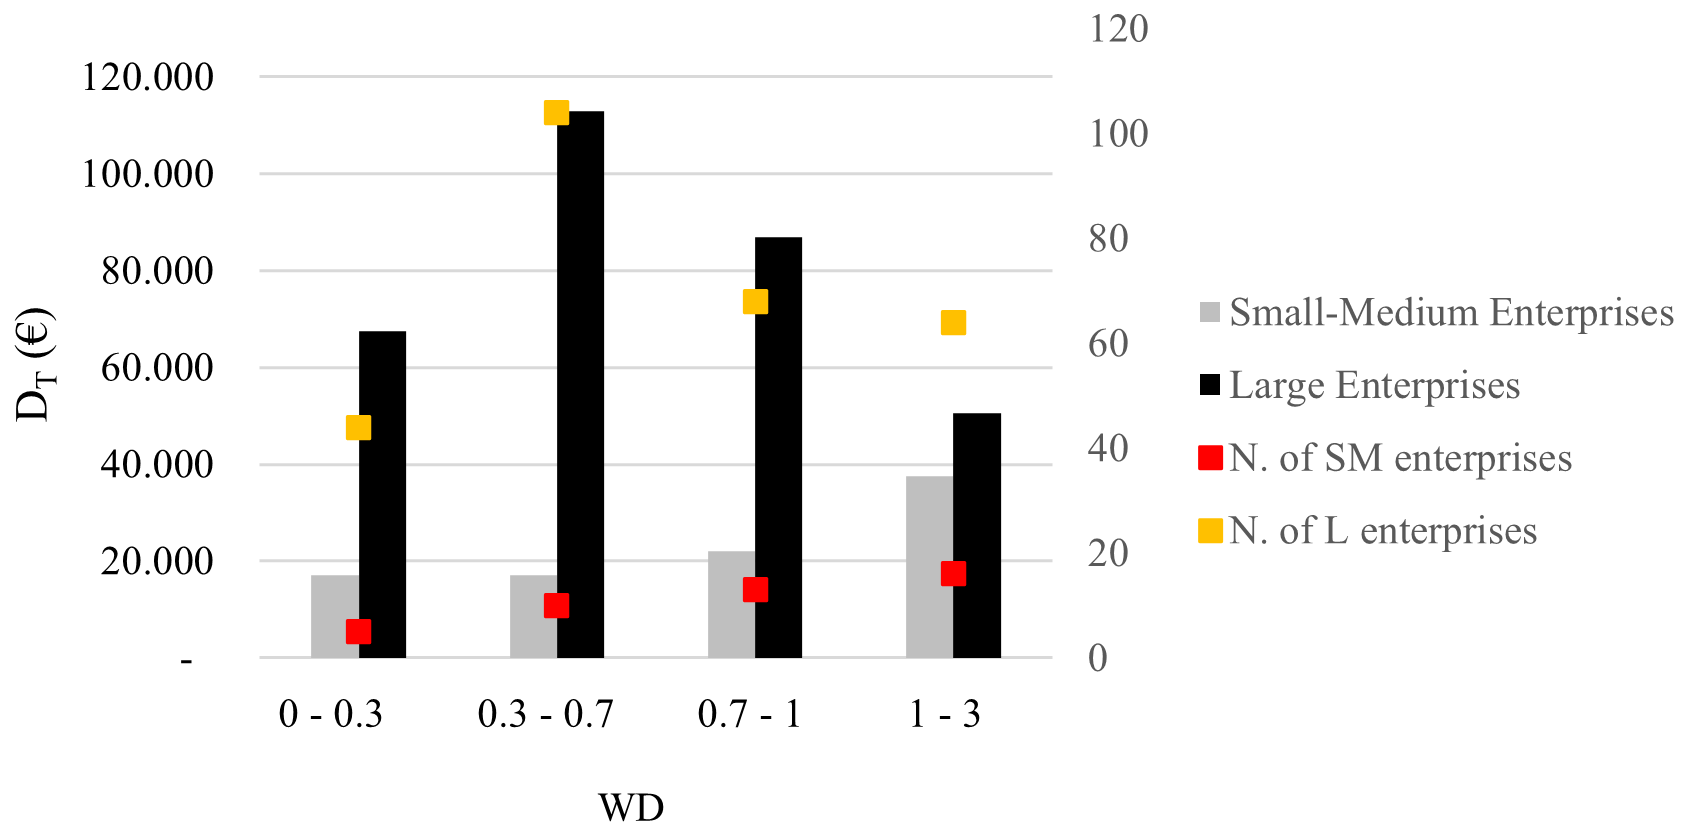
Figure A1Average total damage (DT) by class of water depth (0.0–0.3, 0.3–0.7, 0.7–1, 1–3 m) and by firm's dimension (small-medium with the surface <80 m2 and larger with the surface >80 m2).
The choice by firms to declare the existence of damage could depend on their own characteristics. Larger firms with more employees and turnover may have a higher likelihood of reporting damage than smaller businesses. Conversely, small firms with few staff may have fewer resources to employ in damage reporting especially if they suffered a small damage and the expectation of being compensated may discourage them due to the large bureaucracy. Using the Heckman model helps address this issue and correct the estimation for missing data related to small firms with low water depths.
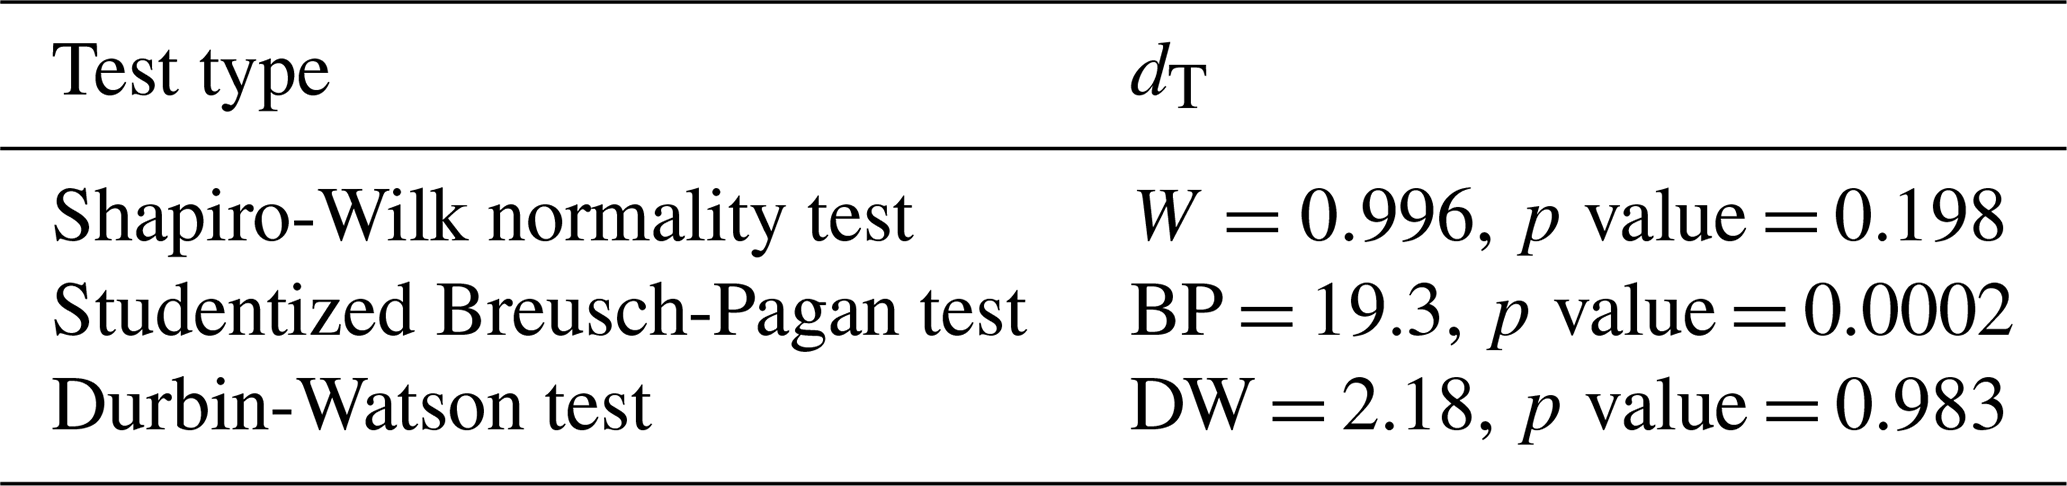
A2 OLS assumption validation total damage
Table A1 presents the results validating the OLS assumptions of the total damage model. The Shapiro-Wilk test suggests that the residuals follow an approximately normal distribution (p value >0.05). Heteroscedasticity is evident in the residuals, as indicated by the significantly low p value of the Breusch-Pagan test. However, there is no significant evidence of autocorrelation in the residuals, as indicated by the high p value of the Durbin-Watson test.
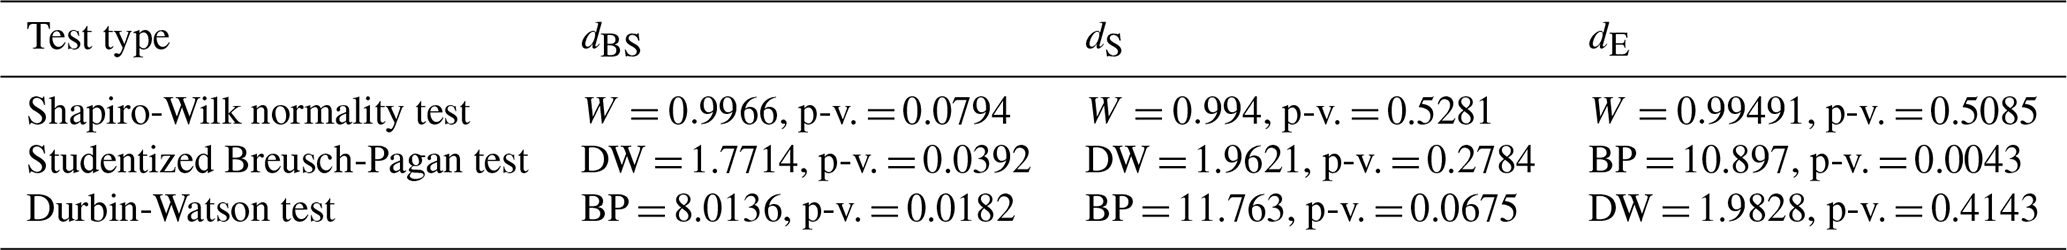
A3 OLS assumption validation damage by components
Table A2 presents the results validating the OLS assumptions of the damage model by components. For structure damage, the analysis indicates potential issues with slight heteroscedasticity and autocorrelation in the model residuals. Concerning stock damage, the residuals do not show significant autocorrelation and may exhibit some evidence of heteroscedasticity, although the latter is not highly significant. For equipment damage, the residuals do not show significant autocorrelation, but there is substantial evidence of heteroscedasticity.
Code and data sets used in this article are available upon request.
The supplement related to this article is available online at https://doi.org/10.5194/nhess-26-251-2026-supplement.
MB: data curation, research conceptualisation, data analysis, results investigation, writing-first draft, writing-review; DM: data curation, research conceptualization, supervision, results investigation, writing-first draft, writing-review; FB: research conceptualization, supervision, results investigation, writing-review; GM: research conceptualisation, supervision; MG, data curation, writing – first draft; AD data curation, writing review; GM: data curation, writing-review; SS: data curation, writing-review.
The contact author has declared that none of the authors has any competing interests.
Publisher's note: Copernicus Publications remains neutral with regard to jurisdictional claims made in the text, published maps, institutional affiliations, or any other geographical representation in this paper. The authors bear the ultimate responsibility for providing appropriate place names. Views expressed in the text are those of the authors and do not necessarily reflect the views of the publisher.
Authors wish acknowledge with gratitude Alessi Carisi and Marco Zazzeri for their initial support in data curation.
This paper was edited by Paolo Tarolli and reviewed by Benjamin Dewals and one anonymous referee.
Allaire, M.: Socio-economic impacts of flooding: A review of the empirical literature, Water Secur., 3, 18–26, https://doi.org/10.1016/j.wasec.2018.09.002, 2018.
Amadio, M., Mysiak, J., Carrera, L., and Koks, E.: Improving flood damage assessment models in Italy, Nat. Hazards, 82, 2075–2088, https://doi.org/10.1007/s11069-016-2286-0, 2016.
Amadio, M., Scorzini, A. R., Carisi, F., Essenfelder, A. H., Domeneghetti, A., Mysiak, J., and Castellarin, A.: Testing empirical and synthetic flood damage models: the case of Italy, Nat. Hazards Earth Syst. Sci., 19, 661–678, https://doi.org/10.5194/nhess-19-661-2019, 2019.
Arrighi, C., Brugioni, M., Castelli, F., Franceschini, S., and Mazzanti, B.: Urban micro-scale flood risk estimation with parsimonious hydraulic modelling and census data, Nat. Hazards Earth Syst. Sci., 13, 1375–1391, https://doi.org/10.5194/nhess-13-1375-2013, 2013.
Balbi, S., Giupponi, C., Olschewski, R., and Mojtahed, V.: The economics of hydro-meteorological disasters: approaching the estimation of the total costs, SSRN J., BC3 Working Paper Series 2013-12, https://doi.org/10.2139/ssrn.2317437, 2013.
Ballio, F., Molinari, D., Minucci, G., Mazuran, M., Arias Munoz, C., Menoni, S., Atun, F., Ardagna, D., Berni, N., and Pandolfo, C.: The RISPOSTA procedure for the collection, storage and analysis of high quality, consistent and reliable damage data in the aftermath of floods, J. Flood Risk Manag., 11, e12216, https://doi.org/10.1111/jfr3.12216, 2018.
Bari, M. A., Alam, L., Alam, M. M., Rahman, L. F., and Pereira, J. J.: Estimation of losses and damages caused by flash floods in the commercial area of Kajang, Selangor, Malaysia, Arab. J. Geosci., 14, 195, https://doi.org/10.1007/s12517-021-06503-x, 2021.
Booysen, H. J., Viljoen, M. F., and de Villiers, G. T.: Methodology for the calculation of industrial flood damage and its application to an industry in Vereeniging, Water SA, 25, 41–46, 1999.
Bremond, P., Grelot, F., and Tarrit, R.: Flood damage functions at national scale for activities: challenges and insights, Conference Abstracts 162, EGU General Assembly 2018, 2018.
Carisi, F., Schröter, K., Domeneghetti, A., Kreibich, H., and Castellarin, A.: Development and assessment of uni- and multivariable flood loss models for Emilia-Romagna (Italy), Nat. Hazards Earth Syst. Sci., 18, 2057–2079, https://doi.org/10.5194/nhess-18-2057-2018, 2018.
Cammerer, H., Thieken, A. H., and Lammel, J.: Adaptability and transferability of flood loss functions in residential areas, Nat. Hazards Earth Syst. Sci., 13, 3063–3081, https://doi.org/10.5194/nhess-13-3063-2013, 2013.
CGGD (Commissariat Général au Développement Durable – Ministère de la transition écologique et solidaire): Analyse multicritère des projets de prévention des inondations, Guide méthodologique 2018, March 2018.
Danish Coastal Authority: Development of a Model for the Assessment of Costs of Business Interruption, Technical report, Danish Coastal Authority, Denmark, 28 pp., 2017.
Dottori, F., Figueiredo, R., Martina, M. L. V., Molinari, D., and Scorzini, A. R.: INSYDE: a synthetic, probabilistic flood damage model based on explicit cost analysis, Nat. Hazards Earth Syst. Sci., 16, 2577–2591, https://doi.org/10.5194/nhess-16-2577-2016, 2016.
Endendijk, T., Botzen, W. J. W., de Moel, H., Aerts, J. C. J. H., Slager, K., and Kok, M.: Flood vulnerability models and household flood damage mitigation measures: An econometric analysis of survey data, Water Resour. Res., 59, e2022WR034192, https://doi.org/10.1029/2022WR034192, 2023.
Gatti, F.: Stima del rischio alluvionale per le attività economiche: il caso di studio di Olbia (OT), Master's degree thesis in Natural Science, Università degli Studi di Milano, Supervisor, Sterlacchini, S., Co-Supervisor: Zazzeri, M., 2016.
Gissing, A. and Blong, R.: Accounting for variability in commercial flood damage estimation, Aust. Geogr., 35, 209–222, https://doi.org/10.1080/0004918042000249511, 2004.
Grelot, F. and Richert, C.: floodam: Modelling Flood Damage functions of buildings, Manual for floodam v1.0.0, irstea, 59 pp., hal-02609309, 2019.
Hasanzadeh Nafari, R., Ngo, T., and Lehman, W.: Development and evaluation of FLFAcs – A new Flood Loss Function for Australian commercial structures, Int. J. Disaster Risk Reduct., 17, 13–23, https://doi.org/10.1016/j.ijdrr.2016.03.007, 2016.
Heckman, J. J.: Sample Selection Bias as a Specification Error, Econometrica, 47, 153–161, https://doi.org/10.2307/1912352, 1979.
Hu, X., Pant, R., Hall, J. W., Surminski, S., and Huang, J.: Multi-Scale Assessment of the Economic Impacts of Flooding: Evidence from Firm to Macro-Level Analysis in the Chinese Manufacturing Sector, Sustainability, 11, 1933, https://doi.org/10.3390/su11071933, 2019.
Hung, B. V. and Diep, N. N.: Assessment on the economic damage of trading households due to urban inundation, J. Water Clim. Change, 13, 1–12, https://doi.org/10.2166/wcc.2021.351, 2022.
International Commission for the Protection of the Rhine (ICPR): Rhine Atlas, ICPR, Koblenz, Germany, 2001.
IPCC: Climate Change 2022: Impacts, Adaptation, and Vulnerability. Technical Summary, IPCC_AR6_WGII_TechnicalSummary, https://www.ipcc.ch/report/ar6/wg2/downloads/report/IPCC_AR6_WGII_TechnicalSummary.pdf (last access: June 2024), 2022.
Koks, E. E., Bočkarjova, M., De Moel, H., and Aerts, J. C. J. H.: Integrated Direct and Indirect Flood Risk Modeling: Development and Sensitivity Analysis, Risk Anal., 35, 882–900, https://doi.org/10.1111/risa.12300, 2015.
Kreibich, H., Müller, M., Thieken, A. H., and Merz, B.: Flood precaution of companies and their ability to cope with the flood in August 2002 in Saxony, Germany, Water Resour. Res., 43, W03408, https://doi.org/10.1029/2005WR004691, 2007.
Kreibich, H., Seifert, I., Merz, B., and Thieken, A. H.: Development of FLEMOcs – a new model for the estimation of flood losses in the commercial sector, Hydrol. Sci. J., 55, 1302–1314, https://doi.org/10.1080/02626667.2010.529815, 2010.
Kuroda, N., Kajitani, Y., and Tatano, H.: Estimating fragility curves for asset damage in business sector caused by a flood disaster: A case of the heavy rain event of July 2018 in Japan, J. JSCE, 10, 494–505, https://doi.org/10.2208/journalofjsce.10.1_494, 2022.
Li, W., Wen, J., Xu, B., Li, X., and Du, S.: Integrated assessment of economic losses in manufacturing industry in Shanghai Metropolitan Area under an extreme storm flood scenario, Sustainability, 11, 126, https://doi.org/10.3390/su11010126, 2018.
Martinez, G., Spadaro, J., Chapizanis, D., Kendrovski, V., Kochubovski, M., and Mudu, P.: Health impacts and economic costs of air pollution in the metropolitan area of Skopje, Int. J. Environ. Res. Public Health, 15, 626, https://doi.org/10.3390/ijerph15040626, 2018.
Martínez-Gomariz, E., Forero-Ortiz, E., Guerrero-Hidalga, M., Castán, S., and Gómez, M.: Flood depth-damage curves for Spanish urban areas, Sustainability, 12, 2666, https://doi.org/10.3390/su12072666, 2020.
Menoni, S., Molinari, D., Ballio, F., Minucci, G., Mejri, O., Atun, F., Berni, N., and Pandolfo, C.: Flood damage: a model for consistent, complete and multipurpose scenarios, Nat. Hazards Earth Syst. Sci., 16, 2783–2797, https://doi.org/10.5194/nhess-16-2783-2016, 2016.
Merz, B., Kreibich, H., Schwarze, R., and Thieken, A.: Review article “Assessment of economic flood damage”, Nat. Hazards Earth Syst. Sci., 10, 1697–1724, https://doi.org/10.5194/nhess-10-1697-2010, 2010.
Ministère de la Transition Écologique et de la Cohésion des Territoires: L'évaluation économique des projets de gestion des risques naturels, https://www.ecologie.gouv.fr/politiques-publiques/levaluation-economique-projets-gestion-risques-naturels (last access: June 2024), 2024.
Molinari, D., Minucci, G., Mendoza, M. T., and Simonelli, T.: Implementing the European “Floods Directive”: the Case of the Po River Basin, Water Resour. Manage., 30, 1739–1756, https://doi.org/10.1007/s11269-016-1248-3, 2016.
Molinari, D., Minucci, G., Gallazzi, A., Galliani, M., Mendoza, M. T., Pesaro, G., Radice, A., Scorzini, A. R., Menoni, S., and Del Ballio, F.: Strumenti per la modellazione del danno alluvionale. Deliverable of the project Flood-IMPAT+ an Integrated Meso & Micro Scale Procedure to Assess Territorial Flood Risk, http://www.floodimpatproject.polimi.it (last access: June 2024), 2019.
Molinari, D., Scorzini, A. R., Arrighi, C., Carisi, F., Castelli, F., Domeneghetti, A., Gallazzi, A., Galliani, M., Grelot, F., Kellermann, P., Kreibich, H., Mohor, G. S., Mosimann, M., Natho, S., Richert, C., Schroeter, K., Thieken, A. H., Zischg, A. P., and Ballio, F.: Are flood damage models converging to “reality”? Lessons learnt from a blind test, Nat. Hazards Earth Syst. Sci., 20, 2997–3017, https://doi.org/10.5194/nhess-20-2997-2020, 2020.
Olmez, H. N. and Deniz, D.: Assembly-based flood repair cost and time models for industrial buildings in Turkey, Reliab. Eng. Syst. Saf., 238, 109444, https://doi.org/10.1016/j.ress.2023.109444, 2023.
Paprotny, D., Kreibich, H., Morales-Nápoles, O., Castellarin, A., Carisi, F., and Schröter, K.: Exposure and vulnerability estimation for modelling flood losses to commercial assets in Europe, Sci. Total Environ., 737, 140011, https://doi.org/10.1016/j.scitotenv.2020.140011, 2020.
Penning-Rowsell, E., Johnson, C., Tunstall, S., Tapsell, S., Morris, J., Chatterton, J., and Green, C.: The Benefits of Flood and Coastal Risk Management: A Handbook of Assessment Techniques, Middlesex University Press, London, ISBN 978-1-904750-51-2, 2005.
Pogliani, A., Bertulessi, M., Bignami, D. F., Boschini, I., Del Vecchio, M., Menduni, G., Molinari, D., and Zambrini, F.: A zero-order flood damage model for regional-scale quick assessments, Water, 13, 1292, https://doi.org/10.3390/w13091292, 2021.
Samantha, G.: The impact of natural disasters on micro, small and medium enterprises (MSMEs): A case study on 2016 flood event in western Sri Lanka, Procedia Eng., 212, 744–751, https://doi.org/10.1016/j.proeng.2018.01.096, 2018.
Scawthorn, C., Flores, P., Blais, N., Seligson, H., Tate, E., Chang, S., Mifflin, E., Thomas, W., Murphy, J., Jones, C., and Lawrence, M.: HAZUS-MH flood loss estimation methodology. II. Damage and loss assessment, Nat. Hazards Rev., 7, 72–81, https://doi.org/10.1061/(ASCE)1527-6988(2006)7:2(72), 2006.
Schoppa, L., Sieg, T., Vogel, K., Zöller, G., and Kreibich, H.: Probabilistic flood loss models for companies, Water Resour. Res., 56, e2020WR027649, https://doi.org/10.1029/2020WR027649, 2020.
Scorzini, A. R., Radice, A., and Molinari, D.: A New Tool to Estimate Inundation Depths by Spatial Interpolation (RAPIDE): Design, Application and Impact on Quantitative Assessment of Flood490 Damages, Water, 10, 1805, https://doi.org/10.3390/w10121805, 2018.
Simonelli, T., Zoppi, L., Molinari, D., and Ballio, F.: Invited perspectives: When research meets practice: challenges, opportunities, and suggestions from the implementation of the Floods Directive in the largest Italian river basin, Nat. Hazards Earth Syst. Sci., 22, 1819–1823, https://doi.org/10.5194/nhess-22-1819-2022, 2022.
Smith, D.: Flood damage estimation – A review of urban stage-damage curves and loss functions, Flood Hazard Research Centre Report, 20, 1994.
Tarpanelli, A., Bonaccorsi, B., Sinagra, M., Domeneghetti, A., Brocca, L., and Barbetta, S.: Flooding in the Digital Twin Earth: The case study of the Enza River levee breach in December 2017, Water, 15, 1644, https://doi.org/10.3390/w15091644, 2023.
Trigila, A., Iadanza, C., Lastoria, B., Bussettini, M., and Barbano, A.: Dissesto idrogeologico in Italia: pericolosità e indicatori di rischio – Edizione 2021, ISPRA, Rapporti 356/2021, 2021.
Van Ootegem, L., Verhofstadt, E., Van Herck, K., and Creten, T.: Multivariate pluvial flood damage models, Environ. Impact Assess. Rev., 54, 91–100, https://doi.org/10.1016/j.eiar.2015.05.005, 2015.
Wagenaar, D., de Jong, J., and Bouwer, L. M.: Multi-variable flood damage modelling with limited data using supervised learning approaches, Nat. Hazards Earth Syst. Sci., 17, 1683–1696, https://doi.org/10.5194/nhess-17-1683-2017, 2017.
Wedawatta, G., Ingirige, B., and Proverbs, D.: Small businesses and flood impacts: the case of the 2009 flood event in Cockermouth, J. Flood Risk Manag., 7, 42–53, https://doi.org/10.1111/jfr3.12031, 2014.
Zhou, F. and Botzen, W.: Firm level evidence of disaster impacts on growth in Vietnam, Environ. Resour. Econ., 79, 277–322, https://doi.org/10.1007/s10640-021-00562-0, 2021.
The percentage values refer to the estimated beta coefficient from the regression model. The transformation of the beta coefficients, to interpret a dummy variable when the dependent variable (Y) is in logarithmic, is the following: ).
- Abstract
- Introduction
- Flood damage to firms: state-of-the-art
- Data
- Method
- Results: total damage
- Results: damage to components
- Performance compared to foreign models
- Discussion
- Conclusions
- Appendix A
- Code and data availability
- Author contributions
- Competing interests
- Disclaimer
- Acknowledgements
- Review statement
- References
- Supplement