
the Creative Commons Attribution 4.0 License.
the Creative Commons Attribution 4.0 License.
 | 29 May 2026
The TSUSY Database: a global database of historical tsunami events and a tsunami-occurrence criterion based on historical earthquakes
David Galán Pérez
Iñigo Aniel-Quiroga
Albert Gallego
Ignacio Aguirre-Ayerbe
Mauricio González
Omar Quetzalcóatl
Jose A. Álvarez-Gómez
Luis Pedraz
Tsunamis are high-impact natural disasters capable of causing significant social, economic, and environmental losses. Despite advances in tsunami warning systems, accurately predicting tsunami occurrence remains a challenge due to the uncertainty associated with seismic rupture characteristics. This study develops a methodology that integrates historical earthquake records, numerical modelling and statistical analysis to derive a tsunami-occurrence criterion, expressed as a binary labelling threshold for identifying whether an earthquake generates a tsunami. As part of this methodology, a global simulation-based database (TSUSY Database) was constructed using earthquake focal mechanism data from the USGS database and validated against tsunami records from the NOAA catalogue, covering events from 1976 to 2023. Through numerical simulations, maximum wave heights were estimated for each event as the maximum value within the entire simulation domain, and used to define thresholds that label earthquakes as tsunamigenic or non-tsunamigenic, with the aim of balancing missed events and unnecessary alerts. By providing a simulation-based criterion for tsunami occurrence, the methodology supports the development of decision tools for real-time tsunami assessment and has been incorporated into an operational tsunami decision-support system that can assist Tsunami Warning Centres in their warning procedures.
- Article
(6587 KB) - Full-text XML
- BibTeX
- EndNote


Tsunamis are long-period sea waves, most commonly generated by earthquakes, that propagate as gravity waves and are characterized by their rapid propagation towards coastal areas. Their potential to cause significant social, economic, environmental and infrastructural impacts within minutes is well known and described in numerous publications (IOC, 2013; Aguirre-Ayerbe et al., 2018; Daskalaki et al., 2025). Some of the most recent examples of devastating earthquake-generated tsunamis include the 2004 Indian Ocean tsunami (Synolakis and Bernard, 2006; Wang and Liu, 2007; Satake, 2014) and the 2011 Tohoku tsunami in Japan (Løvholt et al., 2012; MarCom Working Group 122, 2014; Röbke and Vött, 2017). The consequences of these events were considerable, with a significant loss of life and extensive damage to coastal communities, ecosystems, and infrastructure.
Table 1Comparative analysis of parameters used for tsunami alerts by country, including the Estimated Wave Amplitude (EWA) and Estimated Time of Arrival (ETA).
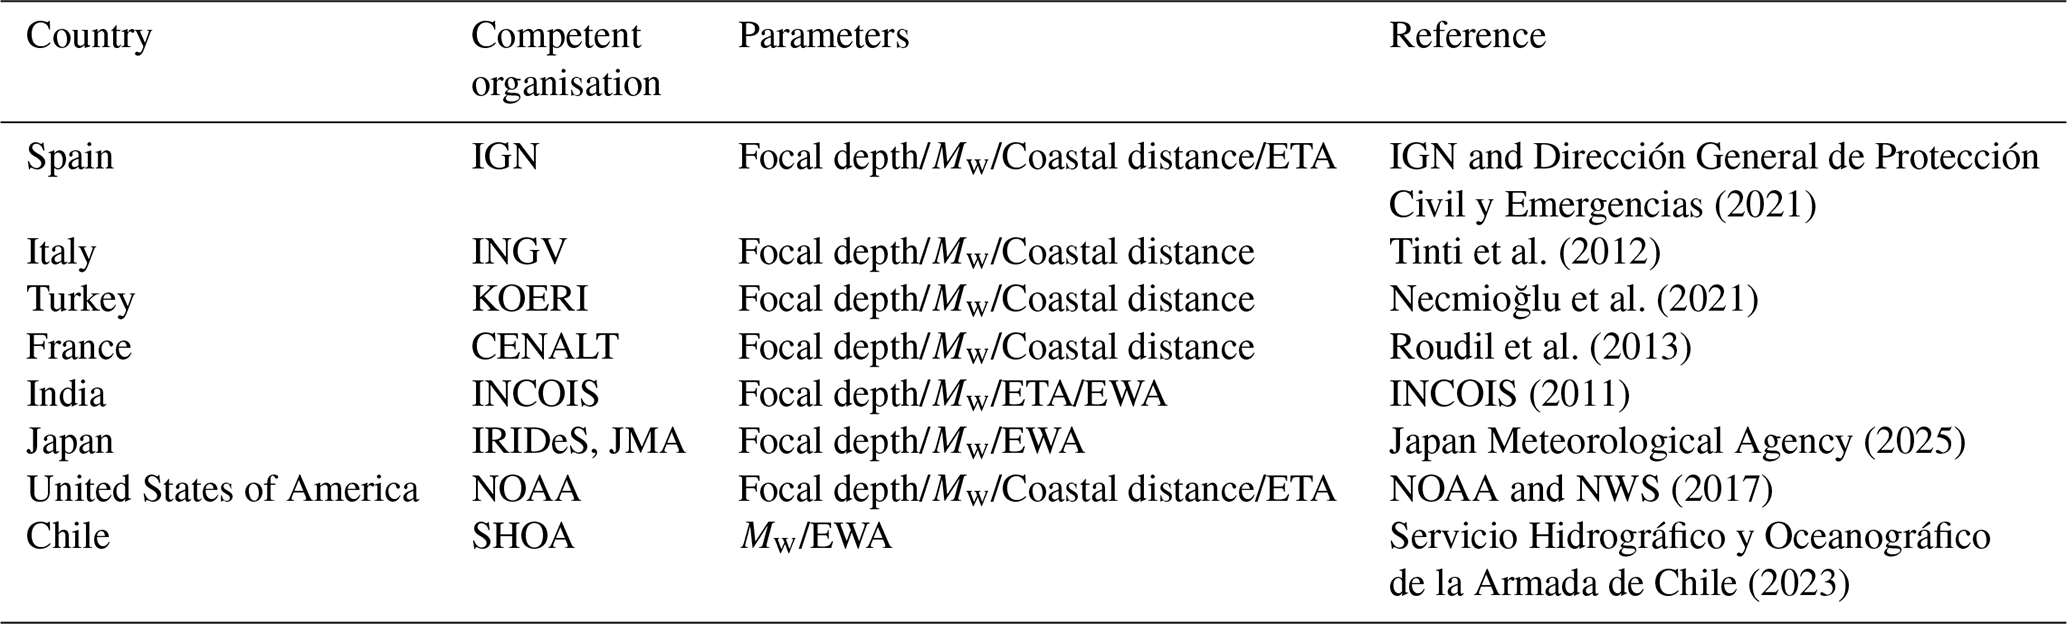
The short interval between the initial occurrence of a tsunami and coastal impact underscores the need for accurate early-warning systems and timely protective actions. Early warning systems are typically managed by national institutions that provide relevant information based on the data available during tsunami events (see some examples in Table 1). For instance, national institutions commonly determine the alert level based on earthquake parameters calculated after the earthquake occurs. These parameters – such as magnitude (Mw), focal depth, and distance to the coast – are not always included in public warning messages, but are used as part of the decision-making process. Additional data, such as Estimated Wave Amplitude (EWA) and Estimated Time of Arrival (ETA), are obtained at predefined tsunami forecast points (typically located along coastlines or at specific sites of interest) from pre-computed numerical scenarios or measured wave amplitudes from buoys or tidal gauges, and, increasingly by real-time (or faster-than-real-time) numerical simulations. This information is fundamental for decision-making but does not always provide a clear indication of tsunami occurrence because these values depend strongly on model assumptions, local bathymetry, and measurement availability.
The relationship between earthquake source parameters and tsunami warning levels is commonly formalized through Decision Matrices (DMs), which remain the most widely used framework to translate seismic information into tsunami alert levels. In this approach, events are classified using predefined thresholds of key parameters, such as moment magnitude and focal depth.
Beyond classical DMs, additional frameworks have been developed to complement or refine the warning decision process, particularly in systems relying on precomputed scenario databases (Selva et al., 2021). Among these approaches are the Envelope methods (ENVs), which estimate the expected tsunami impact by selecting the local maximum from a set of plausible scenarios, and the Best-Matching Scenarios (BMSs), which identify the scenarios that best fit the seismic and/or tsunami observations available during the early stages of an event. For instance, the operational implementation of the integrated tsunami forecast and warning system in Chile (SIPAT) applies the ENVs method (Catalan et al., 2020), while a similar approach can also be found in Harig et al. (2020). In contrast, the Joint Australian Tsunami Warning employs a scenario database based on the BMSs methodology (Allen and Greenslade, 2010).
Despite these methodological differences, most approaches share a common reliance on pre-computed scenario databases, which are central to both operational forecasting and research applications. In tsunami early warning systems, pre-computed scenarios are commonly used to generate potential event databases, as in BMSs. However, most of these resources are focused on tsunami characteristics rather than on the seismic events that generate them. For example, the Tsunami Inundation Database developed by UCLA (Tsunami Inundation Database Portal, 2024) provides simulated inundation maps for specific regions such as California, Oregon, Washington, Alaska, and Hawaii. Similarly, Igarashi et al. (2015) developed a tsunami simulation database for the Philippines, containing estimated arrival times and wave heights for different hypothetical earthquakes. At the operational level, several National Tsunami Warning Centres (NTWCs), including IGN (Spain), INGV (Italy), NOA (Greece), and IPMA (Portugal), also manage libraries of pre-simulated tsunami scenarios used in real-time warning. Despite these advances, a comprehensive global database of historical earthquakes linked to their tsunami-generating potential remains lacking.
Although these frameworks are conservative to guarantee public safety and confidence, this design may lead to false positives (alerts issued without a real threat) or false negatives (events not detected in time). Estimating the likelihood of a tsunami solely from initial earthquake parameters remains challenging, as it requires identifying which source-parameter thresholds reliably indicate tsunamigenic potential and defining a consistent criterion to label an event as tsunamigenic and, therefore, trigger an alert – particularly for small disturbances, where impacts are less evident.
This situation highlights a fundamental gap: while the occurrence of large tsunamis is evident from their impacts, the identification of events with subtle tsunami signatures is far less straightforward. Defining a threshold that separates a minor sea-level disturbance from an actual tsunami remains challenging, as does identifying which parameters – and which values of these parameters – can provide an objective basis for such classification. Current DMs attempt to address this issue through fixed thresholds; however, their necessarily conservative design, lead to false positives, particularly for small or deep earthquakes where the tsunami potential is uncertain.
To better illustrate the difference between false negatives and false positives, a well-known example of a false negative is the 27 February 2010 Maule earthquake in Chile (Soulé, 2014; CIGIDEN, 2016; Reuters, 2016). After the Mw 8.8 event, the initial tsunami warning was cancelled and many coastal communities were not instructed to evacuate, under the assumption that no significant tsunami would arrive. In reality, a destructive tsunami struck several towns along the coast, causing numerous fatalities and severe damage. This failure of the warning process, where a tsunami occurred despite no effective warning being maintained, is a clear illustration of a false negative.
Conversely, a contrasting example of a false positive occurred in the Comunitat Valenciana (Spain), where a tsunami-related pre-emergency protocol was briefly activated after a Mw 6.1 earthquake in Greece, prompting precautionary public messages and short-lived evacuations along parts of the coast, before authorities subsequently declared the tsunami risk over, according to official emergency communications (Generalitat Valenciana, 2015). Such false alarms can cause widespread panic and disruption, even in the absence of a real tsunami threat.
These examples underscore the need to improve methodologies in order to provide a complementary statistical criterion for tsunami occurrence. In this context, Selva et al. (2021) proposed the use of statistical thresholds based on percentiles of simulated wave heights (e.g., 85th, 95th, and 99th) as a way to formalise tsunami warning levels.
Building on this idea, the present study analyses historical earthquakes (1976–2023) and their associated tsunamis by combining earthquake parameterisation, numerical modelling, and statistical analysis. The objective is to derive a robust tsunami-occurrence criterion, expressed as a binary labelling threshold on simulated maximum wave heights, to identify whether an earthquake is tsunamigenic.
Based on this framework, a Tsunami System Database (TSUSY Database) is developed, from which a tsunami-occurrence threshold is derived and validated against the NOAA tsunami catalogue for the same period. This criterion provides a complementary tool to help reduce both missed events and unnecessary alerts, while generating a labelled dataset that supports model validation, comparative studies, and the training of AI-based predictive tools.
This paper is structured as follows. Section 2 describes the methodology, including data processing, numerical modelling, and the definition of the metric used to derive a tsunami-occurrence threshold. Section 3 presents the TSUSY Database and the results of the threshold derivation and potential tsunami or non-tsunami labelling. Section 4 discusses the comparison with the NOAA catalogue and the implications for tsunami warning practice.
2.1 Methodological approach
This study presents an end-to-end workflow that combines global earthquake records from USGS (1976–2023), tsunami observations from NOAA, and systematic numerical simulations to build the TSUSY Database and derive a tsunami-occurrence threshold based on simulated maximum wave heights. The procedure began by filtering the NOAA tsunami catalogue (1976–2023) and the USGS earthquake database (1976–2023) to retain only seismic sources with Mw≥6 and the rupture surface located in water. A first branch of the workflow built a tsunami–earthquake matching database by combining NOAA and USGS information through temporal and spatial consistency criteria (date and time within ±24 h, epicentral location, and event validity). In parallel, the filtered USGS events were used as sources for tsunami numerical modelling, and the resulting simulations were stored in the TSUSY Database. Finally, a tsunami-occurrence criterion was derived from the statistical analysis of the simulated maximum wave heights and calibrated against the matched NOAA–USGS events, providing a binary labelling of each earthquake as tsunamigenic or non-tsunamigenic. The numbered blocks in Fig. 1 correspond to Sect. 2.2–2.6, where each step is described in detail.
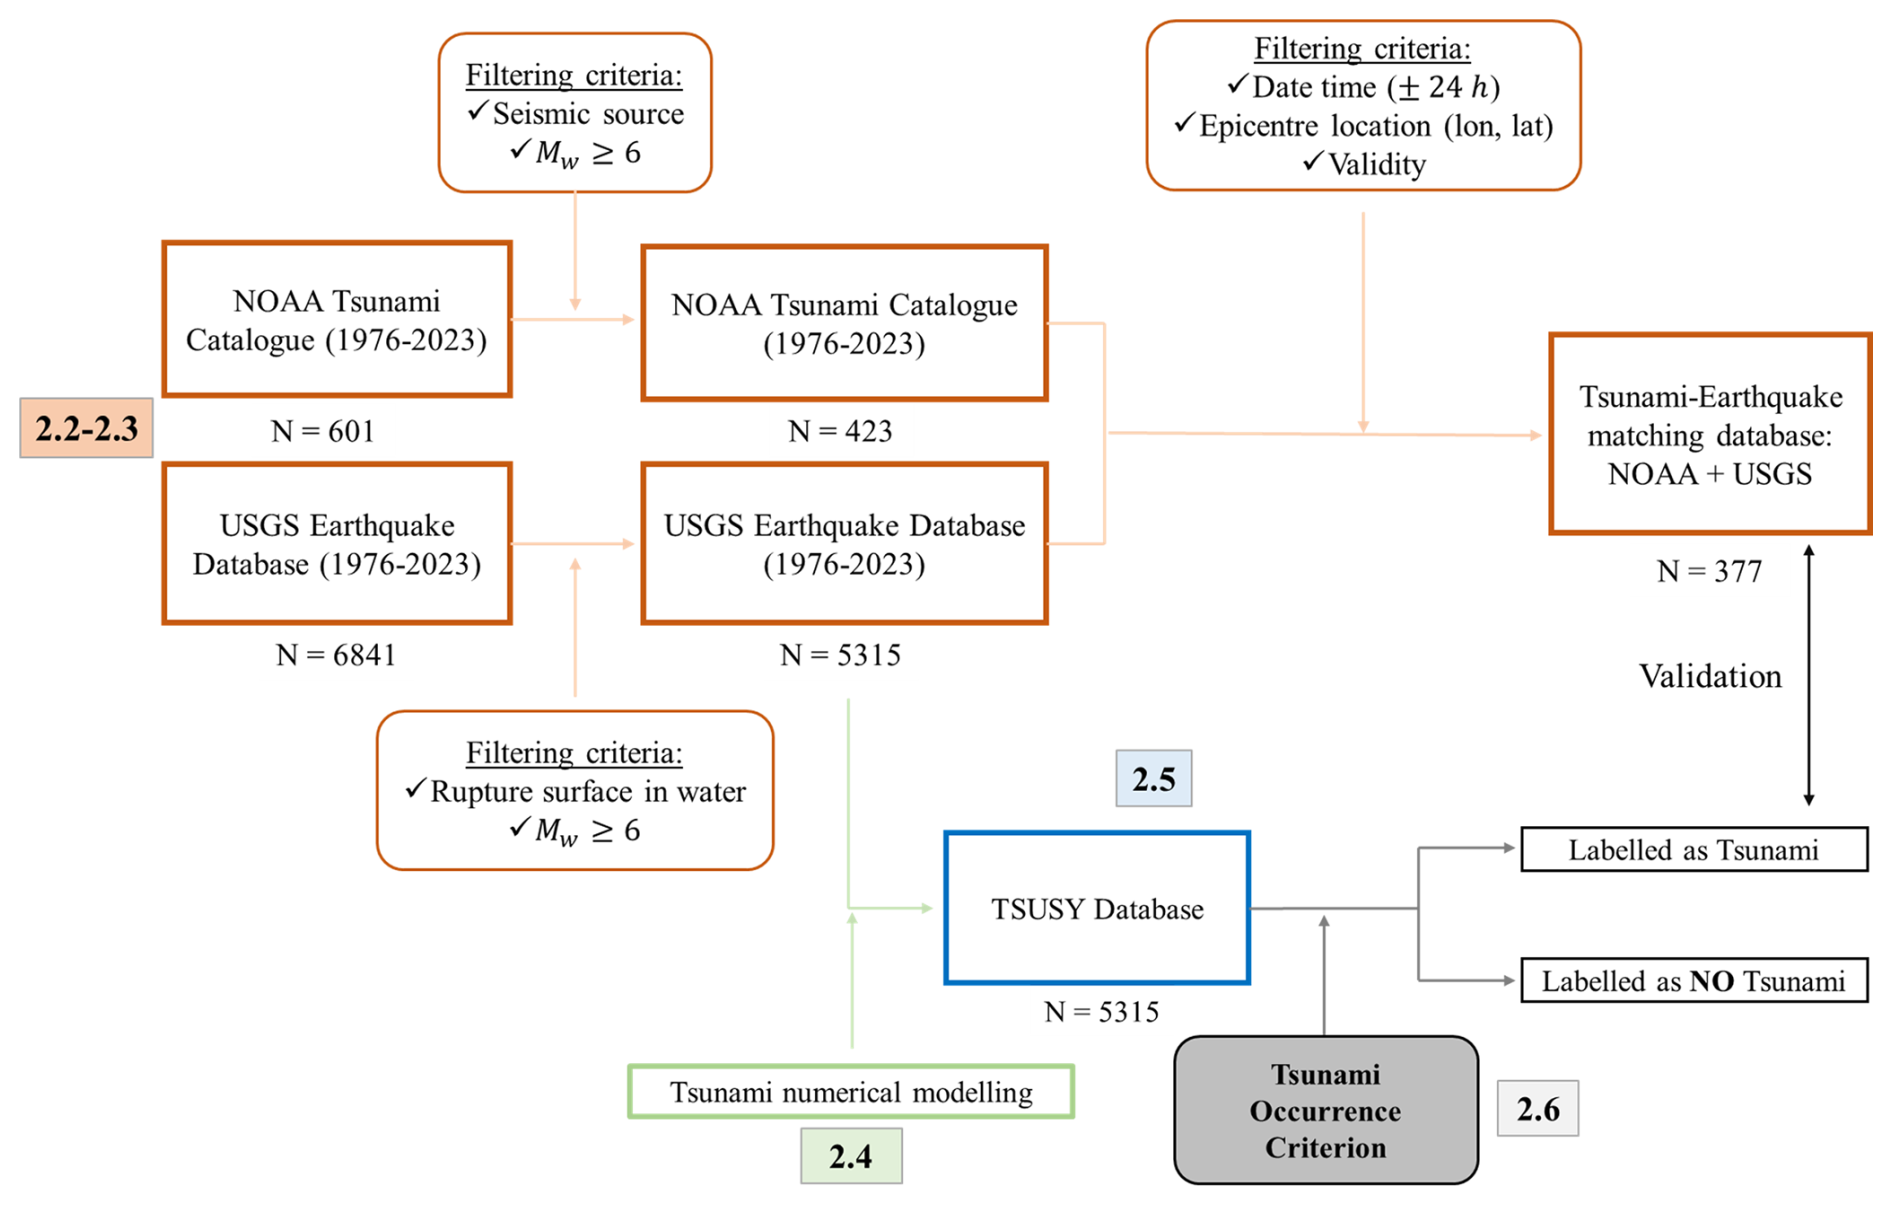
Figure 1Schematic workflow showing the filtering of historical earthquake and tsunami data (NOAA and USGS), the generation of the TSUSY Database, and the derivation of the tsunami-occurrence threshold leading to the labelling of events as tsunamis or non-tsunamis. N indicates the number of events retained at each step of the workflow. The numbering of the boxes corresponds to Sect. 2.2–2.6, where each step is described in detail.
2.2 Data sources (Seismic source and historical tsunami data)
This section provides a detailed description of the data employed in this study. First, the NOAA tsunami database, which was used for validation purposes, is presented. Second, the earthquake data obtained from the USGS are described.
2.2.1 NOAA Tsunami Catalogue
The NOAA tsunami catalogue (National Geophysical Data Center/World Data Service, 2024) provides a comprehensive listing of historical tsunami source events and wave run-ups worldwide, extending back to 2100 BC; as such, it represents the most comprehensive historical tsunami catalogue currently available in the literature. The events in the database were compiled from a variety of sources, including scientific studies, regional and global catalogues, tide gauge data, deep ocean sensor data, individual event reports, and grey literature. It provides information on variables, such as Maximum Wave Height (MWH), number of runups, tsunami magnitude, tsunami intensity (Papadopoulos and Imamura, 2001), and social impacts, including missing persons, fatalities, and economic losses.
The period considered in this study, from 1976 to 2023, includes 601 recorded tsunamis, of which 423 events of seismic origin with magnitudes ≥ 6 were selected, while events caused but landslides or volcanic activity were excluded. Tsunamis classified in the catalogue as doubtful or very doubtful were also excluded, resulting in a total of 397 events. Subsequently, NOAA events were matched with USGS earthquake data to ensure consistency in time and location when comparing both catalogues. A spatial buffer of 3° in epicentre's coordinates and a temporal buffer of ±24 h from the earthquake origin time were applied to account for potential discrepancies between datasets. After applying these filters, 377 NOAA events were retained for simulations, assuming they correspond to the same earthquakes based on the defined buffers. This catalogue provides the historical reference against which the simulation-based threshold was validated.
2.2.2 USGS data
The ANSS (Advanced National Seismic System) Comprehensive Earthquake Catalog (ComCat) includes a range of data and products, including earthquake source parameters (such as hypocentres, magnitudes, phase picks and amplitudes) and additional outputs (such as moment tensor solutions, macroseismic information, tectonic summaries and maps) generated by contributing seismic networks (U.S. Geological Survey, 2017). The catalogue encompasses the period from 1976 to 2023 (available at: https://earthquake.usgs.gov/earthquakes/search/, last access: 11 May 2026) and the data are available in various formats, including GeoJSON and QuakeML. For this study, all events within the specified time frame were selected following a thorough analysis, representing the maximum period for which seismic information can be downloaded.
-
From 1976 to 1989, events were described using focal-mechanism data in the GCMT catalogue (Global Centroid Moment Tensor) (Dziewonski et al., 1981; Ekström et al., 2012). Although the full moment tensor was available from the original source, the data incorporated in the USGS catalogue includes only the orientation of the nodal planes and rake of slip, but do not include the seismic moment (M0) directly or the tensor components. In these events the scalar moment has been computed from the magnitude using Kanamori's formula (Kanamori, 1977).
-
Between 1990 and 1997, the data included in the USGS catalogue incorporated both nodal planes and moment tensors, the latter providing M0 directly for slip calculations.
-
The final period, spanning from 1997 to 2023, encompasses the most comprehensive information available for each event, including the W-phase Moment Tensor (Mww), nodal planes (Fig. 2).
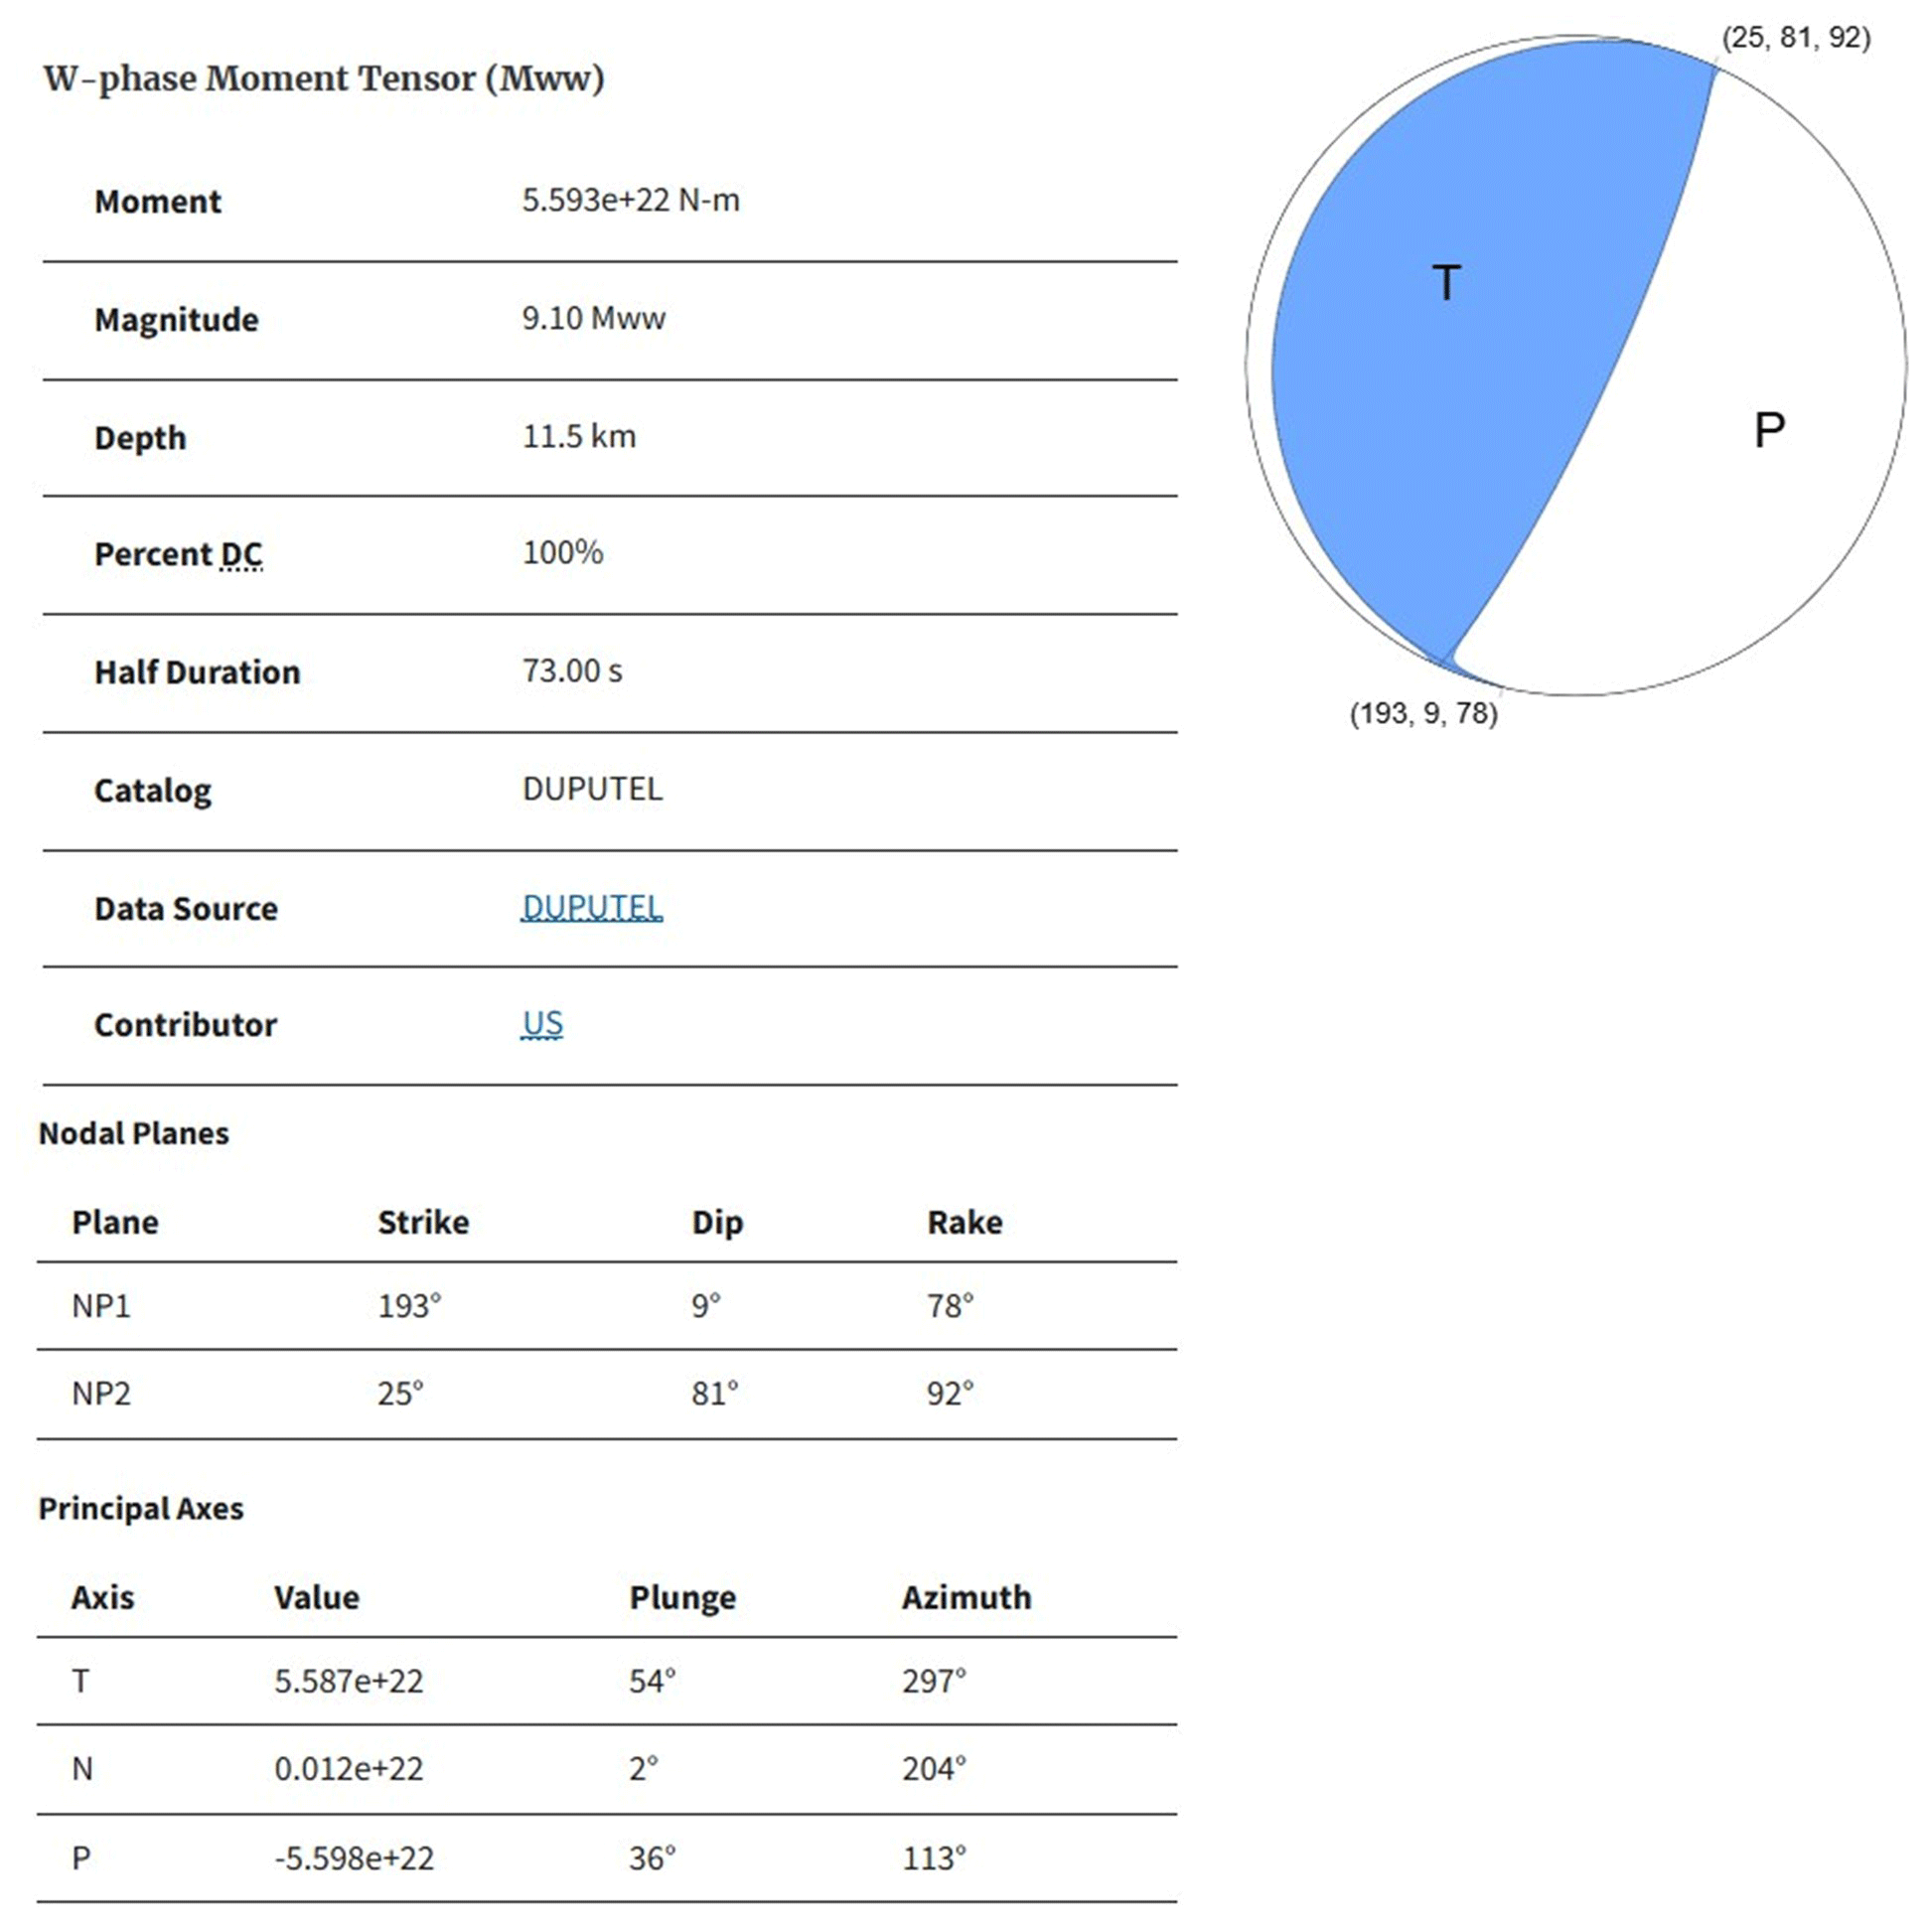
Figure 2Moment tensor products obtained from USGS catalogue (U.S. Geological Survey, 2017).
From this repository, events with magnitudes equal to or greater than 6 were selected. This threshold was chosen because it is commonly used in many DMs (Tinti et al., 2012; NOAA and NWS, 2017; IGN and Dirección General de Protección Civil y Emergencias, 2021), and represents the minimum earthquake magnitude generally considered capable of generating a tsunami. Furthermore, the USGS classifies earthquakes with a magnitude greater than 6 as significant. Based on these criteria, a total of 6,841 earthquakes with magnitudes equal to or greater than 6 were initially identified for the specified period. Although the USGS provides magnitudes in different scales (e.g. Ms, Mwc or Me), this study uses the Moment Magnitude Scale Mw.
2.3 Earthquake historical database processing
This section describes the post-processing applied to USGS data (Sect. 2.2.2) to obtain a catalogue of historical tsunamigenic earthquakes, events required for numerical modelling. The 6841 events constitute the input for this process, which involves filtering and parametrisation to prepare the simulations. As mentioned, USGS database consists of two types of data: (1) focal-mechanism data and (2) moment-tensor data each requiring a different post-processing approach.
For earthquakes with focal mechanism data, information was extracted from GeoJSON files, which provide two nodal planes, focal depth, and origin magnitude Mw.
To choose one of the two nodal planes of the focal mechanism, a mechanistic criterion was adopted: (i) The rupture type was classified following the seven categories of the FMC algorithm (Álvarez-Gómez, 2019; https://github.com/Jose-Alvarez/FMC, last access: 11 May 2026): normal, normal strike-slip, strike-slip normal, strike-slip, strike-slip reverse, reverse strike-slip, and reverse faulting. This algorithm assigned the rupture type according to the orientation of the principal axes of the seismic moment tensor (P, B, T) derived from the nodal planes. (ii) Depending on the rupture type the selection of the nodal plane as rupture plane is based on its dip. For reverse faulting the plane with lower dip is selected, while for normal faulting is the plane with higher dip. In the case of strike-slip ruptures, with near-vertical nodal planes, there is no physical criterion that can be used a priori without knowing the geology of the area where it has occurred. The algorithm chooses the nodal plane with the greatest dip, but the selected nodal plane does not necessarily correspond to the earthquake rupture plane. The vertical deformation in strike slip events tend to be located at the tips of the rupture plane; consequently, although the amount of vertical deformation is limited for this kind of ruptures, sensible differences between the tsunamis generated by both nodal planes can arise, specially, in the near field.
Table 2Blaser formulation (Blaser et al., 2010) for fault plane Length (L) and Width (W).

The dimensions of the rupture plane, length (L) and width (W), were then calculated following the formulations of Blaser et al., (2010) presented in Table 2.
The seismic moment (M0) was then calculated applying the Kanamori formula (Eq. 1) (Kanamori, 1977):
Once the M0 was obtained, the average slip on the fault was estimated as (Eq. 2):
where G is the shear modulus of the material, assumed as () for continental crust, and A is the fault area (A: Area (W×L)).
On the other hand, events with moment tensor data were processed analogously to focal mechanism events. Using principal axes, focal depth, and magnitude from the W-phase moment tensor, fault geometry and slip were computed following the same workflow. In this way, the parameters required for the Okada parametrisation (Okada, 1985) were obtained. This approach ensures the use of a consistent historical seismic database, making the data comparable across different events. For the application of this reasoning, the FMC tool was utilized (Álvarez-Gómez, 2019; https://github.com/Jose-Alvarez/FMC).
Table 3Example of Okada parameters used for the simulation: Indian Ocean earthquake 2004 (USGS id: official20041226005853450_30).

The generation of the free initial surface associated with each earthquake was calculated by using the methodology developed by Okada (1985). This model requires the following parameters: focal depth, width (W), length (L), slip, dip, strike, rake, longitude, and latitude. Table 3 presents an example of the earthquake parameters after post-processing the USGS data.
An additional criterion was applied to determine whether any part of the rupture occurs in the sea, based on the dimensions derived from the use of Blaser's empirical relationships. In this approach, the fault was represented by a simplified rectangle defined by length (L) and width (W), with the epicentre positioned at the centre. Following a conservative approach, an event was classified as a potential tsunamigenic source if any part of this rectangle intersects with the sea. In shallow events the simplified rectangular geometry obtained from the dimensions of the empirical relations may extend part of the rupture above the earth surface taking into account the original hipocentral depth. In such cases, the depth parameters were adjusted to ensure the entire source remained into the crust.
After applying these filters, the number of events decreased from 6841 to 5315. This final database constitutes a historical worldwide database of tsunamigenic earthquakes, thus fulfilling the first objective of this study. It is noteworthy that the database only includes events with magnitudes equal to or greater than 6 that meet the condition of occurring, at least partially, in water. These seismic parameters form the basis for generating the tsunami scenarios analysed in this study.
2.4 Numerical modelling
Numerical modelling for tsunamigenic seismic events typically involves three key phases: (a) selection of the seismic source, (b) preparation of bathymetric data, and (c) tsunami wave modelling. The application of these steps in the global simulations carried out in this study is explained in the following paragraphs.
Tsunami simulations were performed using the numerical model Tsunami-HySEA (Macías-Sánchez et al., 2014), which solves the 2D non-linear shallow water equations (NSWE) in a single layer formulation, with friction effects parameterized using Manning and quadratic laws. This model has been widely applied in tsunami simulations and benchmarking (Macías et al., 2017, 2020).
2.4.1 Selection of seismic sources
In the generation stage, Okada's fault deformation model (Okada, 1985) was used to produce the static displacement of the sea floor using the fault parameters as illustrated in Fig. 3. This model computes the strain produced by a rectangular fault rupture in an elastic half-space through a set of geometric and kinematic parameters. These include fault length (L), width (W), and focal depth (hf), which define the size and position of the fault plane; strike (θ), dip (δ), and rake angles λs, which describe its orientation and slip direction. In Fig. 3, H denotes the local water depth above the rupture zone.
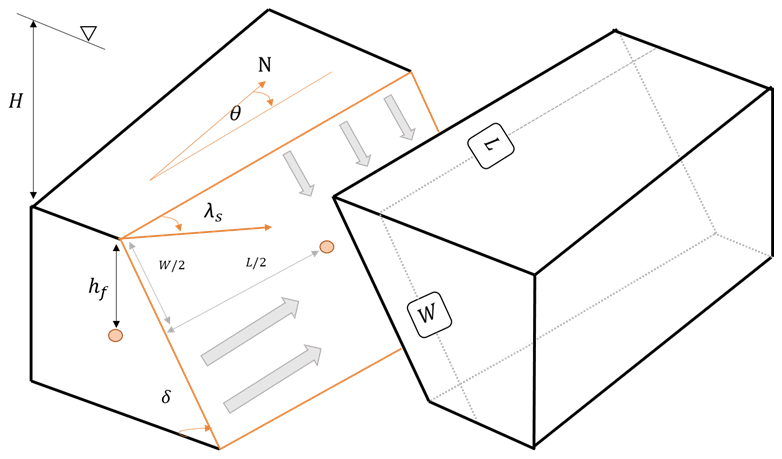
Figure 3Geometric parameters and focal mechanisms that characterize fault rupture in the Okada model: length (L), width (W), depth (D), strike, dip, rake, and slip, together with water depth (H) (adapted from Echave-Lezcano, 2016).
The process begins with the selection of seismic sources as input data, which is crucial for accurately predicting tsunami generation and propagation. The seismic events included in the dataset described in Sect. 2.3 have been used to simulate all historical tsunami events.
2.4.2 Preparation of bathymetric data
To perform the numerical simulations for the database, a standard computational domain was defined. The simulation grid has a horizontal resolution of and was built from the General Bathymetric Chart of the Oceans (GEBCO), which provides global bathymetric data at 15 arcsec spacing (GEBCO Bathymetric Compilation Group 2023, 2023). To avoid boundary artefacts in the central Pacific and to ensure ocean connectivity across the 180° meridian, the bathymetry was duplicated and stitched in the Pacific region. This extension increases the longitudinal span of the model domain from −80 to 440° (Fig. 4). This configuration enables the simulation of any global tsunami event by shifting the source location within the extended domain (e.g., events in the Indian Ocean can be represented without introducing artificial boundaries). The resulting computational grid comprises 1165 × 4127 cells.
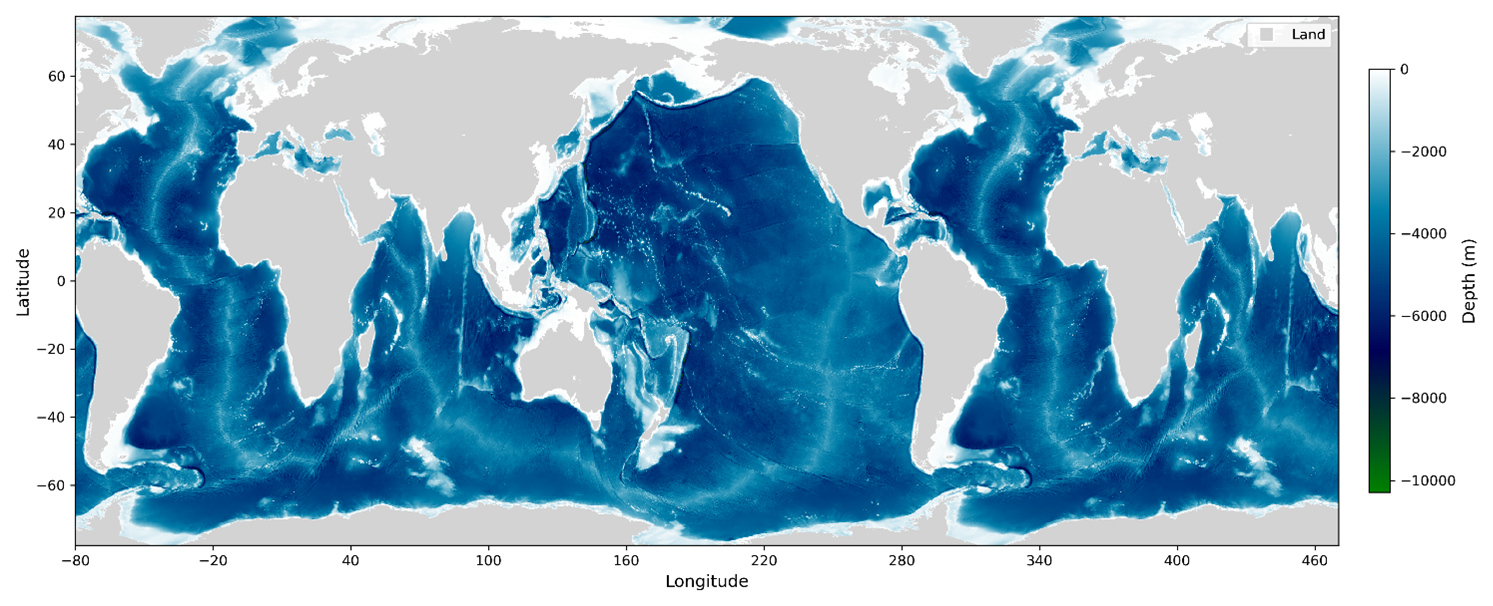
Figure 4Grid () constructed with information obtained from GEBCO Bathymetric Compilation Group 2023 (2023).
2.4.3 Tsunami wave modelling
Finally, with all the necessary data collected and integrated, the numerical model was run to simulate 5315 scenarios, as illustrated later in Sect. 3.2. As a result of the numerical simulations and post-processing of the output data, only the MWH, defined as the highest wave height in metres recorded in each simulation cell, was retained. Therefore, for each grid cell, MWH were obtained, forming the database to be used in the following statistical analysis.
After carrying out these steps, 5315 potential tsunami simulations were compiled, leading to a historical registry that includes both the seismic parameters and the simulated wave heights. This modelling framework ensures a homogeneous set of simulated scenarios from which MWH can be extracted for statistical analysis.
2.5 TSUSY Database
To define and further validate a tsunami occurrence criterion, it was first necessary to compile all earthquake simulations into a single, structured framework. This section presents the comprehensive tsunami database denominated TSUSY Database (TSUnami SYstem Database), generated by integrating all pre- and post-processed data according to the methodology described in Sect. 2.
The TSUSY Database is an open-source simulation repository which stores all seismic parameters, both pre- and post-processed, together with the corresponding tsunami simulations. In particular, it contains the MWH field for each simulated event, allowing users to examine sea surface deformations and the spatial distribution of wave amplitudes across the grid.
The TSUSY Database is designed to provide detailed and accessible information for technical staff in tsunami warning centres as its primary users – while also supporting the research community. Each simulation is stored in netCDF format, ensuring that the data are well organised and easy to manage.
By accessing this repository, users can explore both seismic and oceanographic data, including:
-
Seismic characteristics: standardized parameters of seismic events from both pre- and post-processed data.
-
MWH simulations: Detailed records of sea surface deformations per grid cell, providing a spatial representation of tsunami impacts.
For the purposes of this study, the TSUSY Database (accessible at: https://tsunami.ihcantabria.com, last access: 11 May 2026) plays a central role: it provides a homogeneous and comprehensive dataset from which statistical analyses can be performed to establish the tsunami-occurrence threshold. By compiling 5315 systematically simulated scenarios, it enables the identification of patterns across different magnitudes, depths, and fault geometries, ensuring that the threshold is based on a consistent global framework. In addition, the database allows direct validation comparing to NOAA records, linking simulated outputs with historical observations.
2.6 Tsunami-occurrence threshold determination
Although operational tsunami warning systems ultimately evaluate tsunami impact at specific coastal segments, an initial step is to determine whether the earthquake source is capable of generating a tsunami. In this study, this first-level decision is represented as a binary classification of the earthquake as tsunamigenic or non-tsunamigenic. A key methodological step is therefore the definition of a physically consistent and statistically robust event-level metric derived from the simulated MWH, which can be used to label between “potential tsunami” and “non-tsunami” cases. This section describes how this metric is constructed from the simulation results and establishes the basis for the subsequent derivation of a tsunami-occurrence threshold.
2.6.1 Percentile threshold selection
For each of the 5315 simulated events, the maximum value of the wave-height time series was extracted at every grid point of the computational domain. From this spatial distribution of maximum values, the 99.98th percentile was computed, considering only values above 0.01 m. This lower bound corresponds to the wetting threshold used in the numerical model to activate inundation; wave heights below this value do not produce flooding in the simulations and can therefore be regarded as negligible.
This filtering step removes null or quasi-null events while preserving the upper tail of the wave-height distribution. Lower percentiles tend to reflect widespread, low-amplitude oscillations that are not representative of tsunami occurrence, whereas the absolute maximum (100th percentile) may be controlled by a single grid cell affected by numerical artefacts or local bathymetric effects. The 99.98th percentile provides a compromise between these extremes: it focuses on the largest simulated wave heights while still relying on a statistically significant number of grid points, thereby reducing sensitivity to spurious outliers. This choice defined the percentile-based metric used later in the classification framework.
2.6.2 Definition of the working metric
In addition to the percentile value itself, the number of grid cells with MWH exceeding the event-specific 99.98th-percentile value as a proxy for spatial coherence was computed. This count helps distinguish events dominated by isolated numerical maxima (few exceedances) from those showing a spatially extended tsunami signal (many exceedances). A large number of exceedances indicates a spatially coherent tsunami footprint, whereas a very limited number of exceedances is more consistent with isolated extreme values that are less likely to reflect a physically meaningful tsunami field.
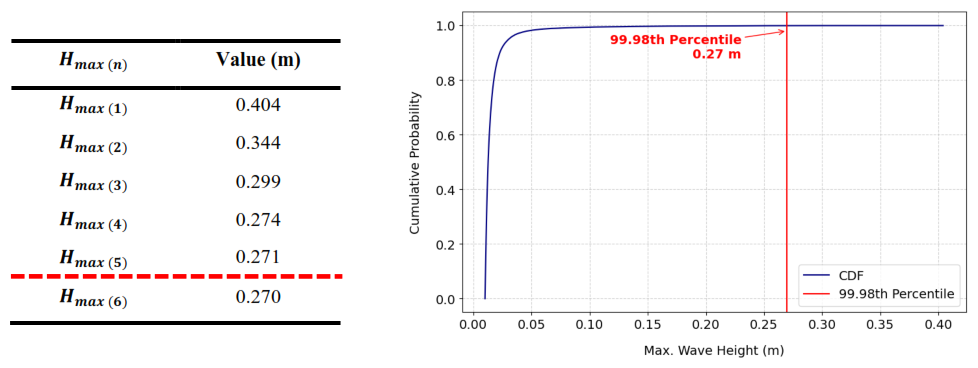
Figure 5Example of the 99.98th percentile MWH metric for a single event. Left: ordered grid-point maxima Hmax(n) (descending rank n). Right: cumulative distribution function (CDF). The red line marks the 99.98th percentile (0.27 m) used as the event-level wave height.
An illustrative example of this procedure is shown in Fig. 5. For a given event, the MWH values were extracted at all grid points and ranked in descending order, and the corresponding cumulative distribution function (CDF) was constructed. In the example shown, the 99.98th percentile corresponds to a wave height of 0.27 m, which was adopted as the representative event-level wave height for classification purposes. The working metric used in the subsequent analysis thus consists of the 99.98th percentile of the MWH field, complemented by the number of grid cells exceeding this value.
The empirical behaviour of this metric across the full dataset, and its use for defining the tsunami-occurrence threshold and labelling events, are presented and discussed in Sect. 3.3.
2.6.3 Threshold optimisation procedure
Once the tsunami indicator based on the 99.98th percentile of the MWH was defined for each simulated event, the next step was to determine the optimal threshold separating tsunami and non-tsunami cases.
To assess the performance of alternative thresholds, the simulated events were compared with the tsunami records reported in the NOAA catalogue, which was used as an observational reference dataset. For each candidate threshold applied to the 99.98th-percentile MWH, simulated events were labelled as “tsunami” when the percentile value exceeded the threshold and as “non-tsunami” otherwise.
This comparison allowed the construction of a confusion matrix describing the classification performance for each threshold, including:
-
True Positives (TP): events classified as tsunamis in both TSUSY and the NOAA catalogue.
-
True Negatives (TN): events classified as non-tsunamis in both datasets.
-
False Positives (FP): events classified as tsunamis in TSUSY but not recorded as tsunamis in NOAA.
-
False Negatives (FN): events recorded as tsunamis in NOAA but classified as non-tsunamis in TSUSY.
From these values, the standard classification metrics precision and recall were computed according to Eqs. (3) and (4):
Precision quantifies the proportion of predicted tsunami events that correspond to observed tsunamis, while recall measures the proportion of observed tsunamis that are successfully detected by the model.
To determine the optimal tsunami-occurrence threshold, the F1-score was used as a combined performance metric. This choice is motivated by the characteristics of the dataset used in this study. The number of tsunami events represents only a small fraction of the total number of simulated cases, resulting in a highly imbalanced classification problem, where non-tsunami events largely outnumber tsunami events. In such situations, commonly used metrics such as overall accuracy may provide misleading results, as a classifier could achieve high accuracy simply by predicting the majority class.
For this reason, the evaluation was based on the precision–recall framework, which is more appropriate for imbalanced datasets. The F1-score, defined as the harmonic mean of precision and recall, provides a balanced measure of classification performance by simultaneously accounting for false positives and false negatives. This makes it particularly suitable for problems where both types of classification error must be considered.
The F1-score evaluates the trade-off between precision and recall. The F1-score is defined as shown in Eq. (5):
The F1-score was computed for a range of candidate thresholds applied to the 99.98th-percentile MWH, and the threshold corresponding to the maximum F1-score was selected as the optimal tsunami-occurrence criterion.
After applying the methodology, the study produced two primary results, along with a final outcome derived from these findings. The first result is the generation of a comprehensive database of earthquakes and potential tsunami simulations for historical events. The second is the development of a tsunami-occurrence criterion, expressed as a wave-height threshold. This threshold was subsequently validated using data from the NOAA catalogue.
3.1 Global database of tsunamigenic earthquake simulations
The seismic data from the USGS enabled the creation of a database comprising 5315 potential tsunamigenic earthquakes. This database was derived in accordance with the criteria set forth in Sect. 2.2 and 2.3. As mentioned, one of the criteria was to consider exclusively earthquakes with a magnitude of 6 or higher. This decision was based on evidence showing that, out of 900 000 cases with lower magnitudes, only 24 resulted in tsunamis, representing just 0.0025 %.
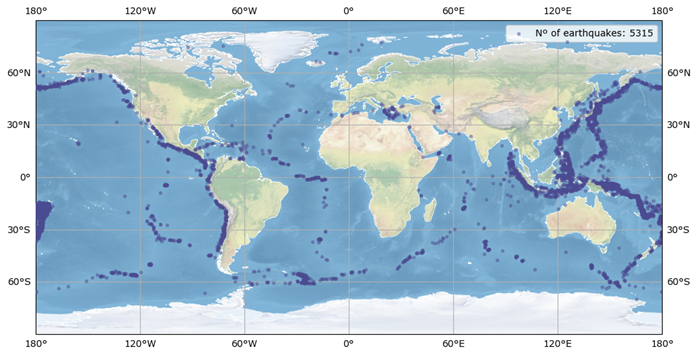
Figure 6Spatial distribution of tsunami potential earthquakes with Mw≥6 (from USGS database 1976 to 2023).
The fault parameters presented in Table 3 are stored and logged in a tsunamigenic earthquake database. These parameters have been analysed to understand the distribution of their values in the new database. Figure 6 illustrates the worldwide distribution of these earthquakes, and Fig. 7 shows histograms for twelve earthquake-related variables: longitude, latitude, focal depth, date, length (L), width (W), slip, seismic moment (M0), moment magnitude (Mw), dip, rake and strike.
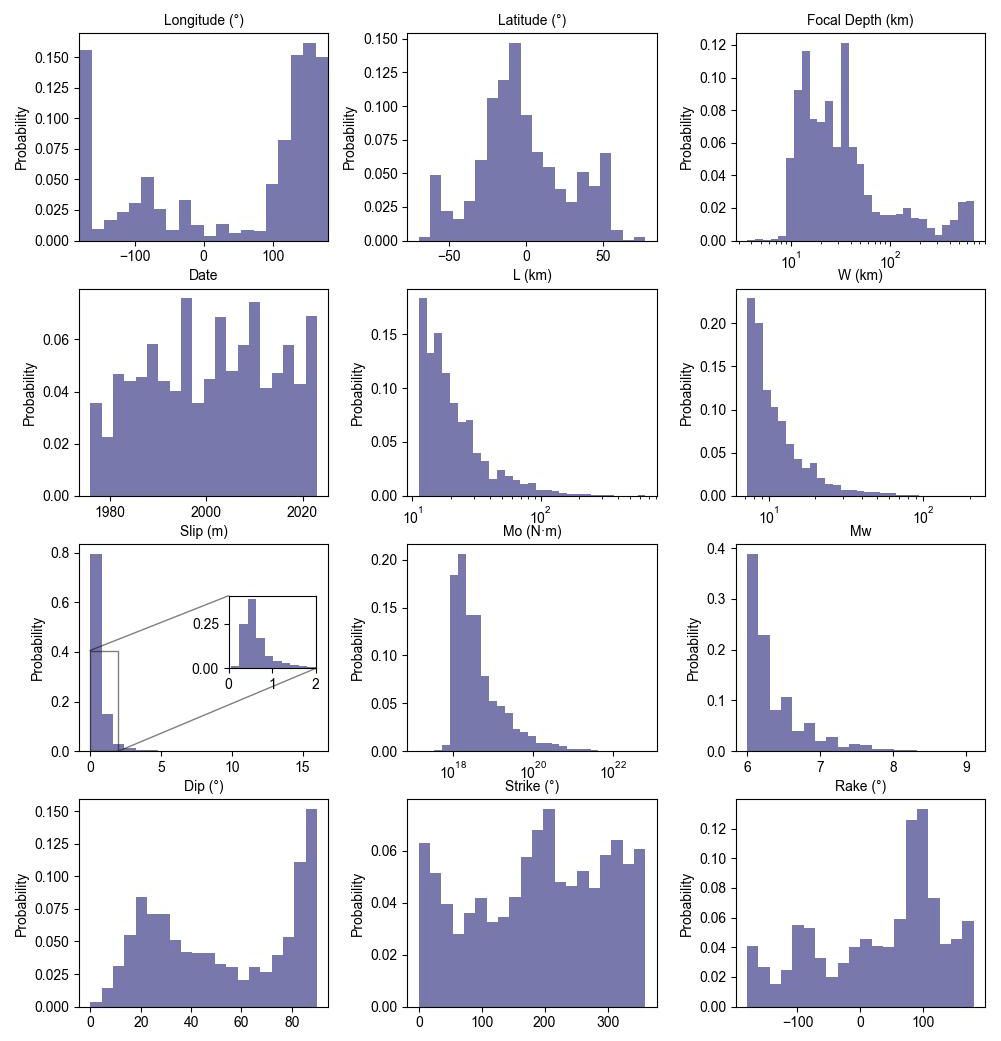
A significant variable, although not a geological term but rather a geographical one, is the set of geographic coordinates of seismic events: longitude and latitude. The histograms for these coordinates expectedly describe the concentrations of the earthquakes in the tectonically active areas.
Focal depth (km) refers here to the centroid depth of the seismic moment tensor. The analysis shows that seismic events with the potential to generate tsunamis are predominantly shallow, with a notable concentration between 10 and 60 km. This depth range represents a zone of common seismic activity, with a gradual decrease in frequency for greater depths. It is common that DMs mark the 100 km value as a limit for studying the probability of a tsunamigenic earthquake.
The temporal distribution of events shows a clear increase in the number of recorded earthquakes from the early 1990s onward. Earlier periods contain fewer events, whereas the record becomes denser in subsequent decades. This apparent increase may be influenced by changes in the way earthquake information is reported and archived in the USGS catalogue.
When examining fault dimensions, specifically width (W) and length (L), it appears that faults generally have moderate sizes. The data suggest that very large faults are less frequent, and a correlation between width and length is observed, in accordance with the scale relationship. The distribution of fault sizes appears to be right-skewed, resembling a power-law with a long tail toward larger fault sizes. This shows that moderate-sized ruptures are more common, whereas very large ruptures are relatively rare. This behaviour is consistent with what would be expected and follows the well-established scaling laws of fault population in tectonics, where larger faults occur less frequently, which is also in agreement with the Gutenberg–Richter distribution of earthquake magnitudes.
The magnitude of an earthquake is described in the catalogue by the moment magnitude (Mw), which is a measure ofthe energy released during the seismic event. The Mw, scale is based on the physical properties of the earthquake, usually derived from an analysis of different type of waveforms recorded from the shaking. The distribution is positively skewed, with a pronounced peak around 6.0–6.5 and a rapidly decreasing probability density as Mw, increases. This pattern is also intuitive, since smaller earthquakes are naturally more common, while larger magnitudes follow a logarithmic frequency–magnitude relationship (the Gutenberg–Richter law). The tail extends towards higher magnitudes with very low frequency, following a power-law relationship, indicating that high-magnitude events are rare. Unlike previous plots that used a logarithmic x-axis, this histogram shows the magnitude values on a linear scale as the value of the magnitude is a function of the logarithm of the seismic moment (M0). This representation emphasizes the concentration of values in the lower range and a sharp drop-off in probability for values above 7.0. The observed distribution follows the Gutenberg–Richter law, which describes the exponential decay in the number of earthquakes with increasing magnitude. In relation to this parameter, the M0, or scalar moment of the seismic moment tensor, represents the moment of the event in N m.
With regard to slip, which represents the average displacement along the fault plane (in metres), there is considerable variability among events. Most earthquakes exhibit relatively small slip values, typically below 1 m, while larger slip values occur progressively less frequently. As is typical for earthquake size-related parameters, the slip distribution follows a power-law behaviour, with small displacements being far more common than large ones.
The orientation of the nodal planes is described by two angles: dip (angle of the plane with the horizontal) and strike (angle of a horizontal line on the plane with the north). A third angle describes the orientation of the slip vector of the earthquake on the rupture plane, the rake. The initial description elucidates the inclination of the fault plane in relation to the horizontal, indicating that moderate dip angles, generally between 20 and 40°, predominate among the analysed events. These moderate inclinations are characteristic of reverse faults commonly found in subduction zones, which are related to bigger earthquakes and are typically more tsunamigenic. Consequently, their prevalence is consistent with the expected distribution and is reflected in the statistical analysis.
The strike refers to the orientation of the fault plane in relation to the geographic north. The distribution shows a tendency toward specific strike orientations, with common values around 150 and 250°, reflecting the underlying tectonic deformation systems where these faults are included. Finally, the rake provides insights into the type of fault movement. The dataset displays a wide range of rake values, with a notable concentration around 90°, indicating a predominance of thrust faulting mechanisms.
In conclusion, the histograms for the nine earthquake parameters illustrate trends and patterns that align with regional tectonics and anticipated fault mechanisms. The data indicate that the majority of seismic events occur at shallow focal depths with moderate fault sizes and small slips. The diversity in fault orientations and movements reflects the intricate nature of seismic processes across different regions.
3.2 Tsunami database (TSUSY Database)
The array of earthquake data presented was used to generate a database of events by numerically simulating 5315 scenarios with the Tsunami-HySEA code, covering all the selected events over the 1976–2023 period. The Maximum Wave Height of each Grid Point (MWHGP) was recorded for each event and then included in the tsunami database. Figure 8 illustrates this variable for a representative event with a magnitude of 7.6 and a focal depth of 35.5 km, whose epicentre was located near Sand Point, Alaska (54.602° N, 159.626° W) on 19 October 2020.
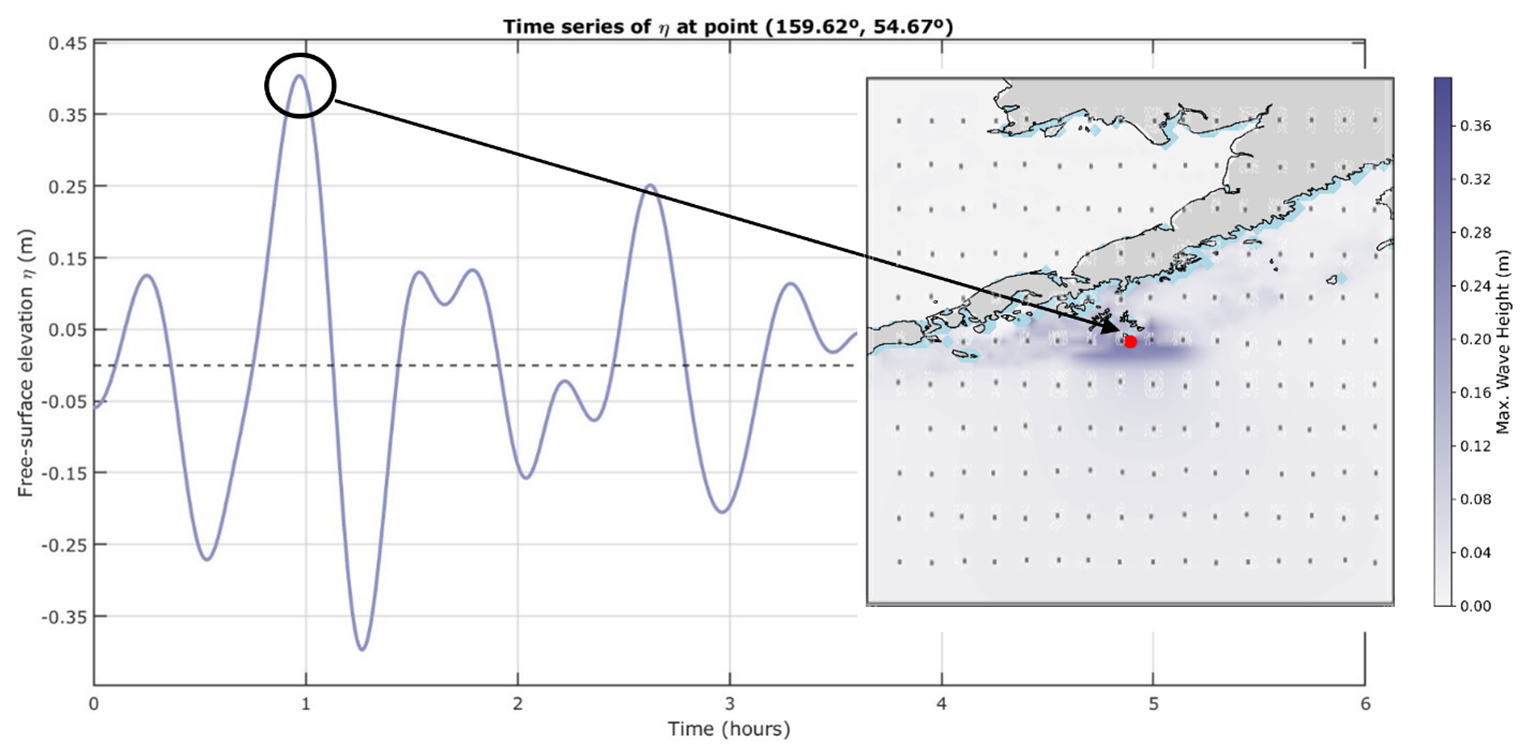
Figure 8Representation of the MWH (m) variable at each grid point (MWHGP) for the event that occurred in Alaska.
To characterise the intensity of the tsunami events, the MWH of the whole grid for each event (MWHE) was recorded, showing a range of potential sea-level variations from minimal deformation to significant changes in water level. Figure 9a presents a histogram of this MWH for each event (MWHE), which includes only events with MWH greater than 0.01 m, excluding 2173 events that fall below this threshold.
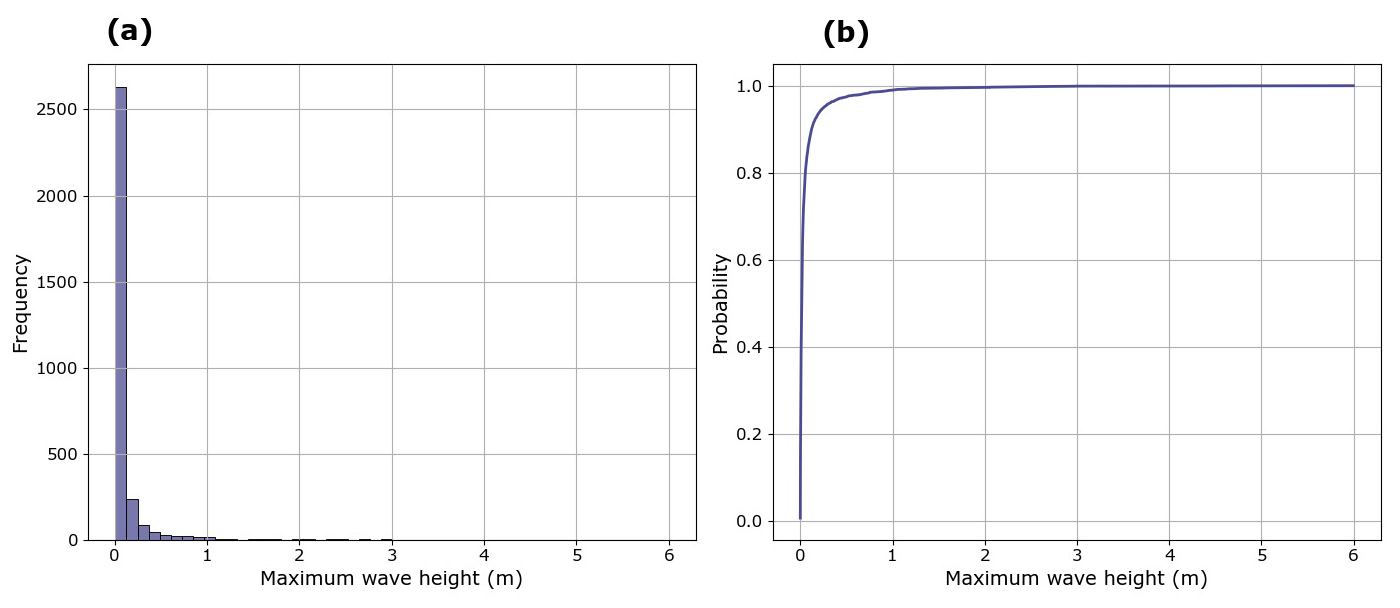
Figure 9Distribution of maximum simulated wave height for all events with MWHE > 0.01 m: (a) histogram and (b) cumulative distribution function (CDF).
It is evident that the majority of events are clustered on the left side of the chart, which reflects their low intensity. This distribution is to be expected, as the majority of earthquakes generate only minor perturbations in sea level, resulting in a high number of events with lower values. Consequently, many of these events did not cause significant changes in water level and, therefore, did not produce high wave heights.
In Fig. 9b it is possible to see the CDF that increases rapidly for low wave height values, reaching values close to 1 at approximately 1 m. This indicates that the cumulative probability of the MWH being less than or equal to this threshold is very high. Beyond this point, the curve flattens, exhibiting an almost negligible slope, suggesting that wave heights exceeding 2 m are extremely rare within the analysed dataset of simulations. This behaviour is characteristic of distributions with a strong skew towards lower values, indicating that most recorded events correspond to small wave heights, with very few occurrences of extreme heights. Such an analysis is crucial in coastal hazard assessments and tsunami modelling, as it helps estimate the probability of exceeding critical thresholds based on historical or simulated data. It is noteworthy that almost 85 % of events have MWHE below 0.1 m.
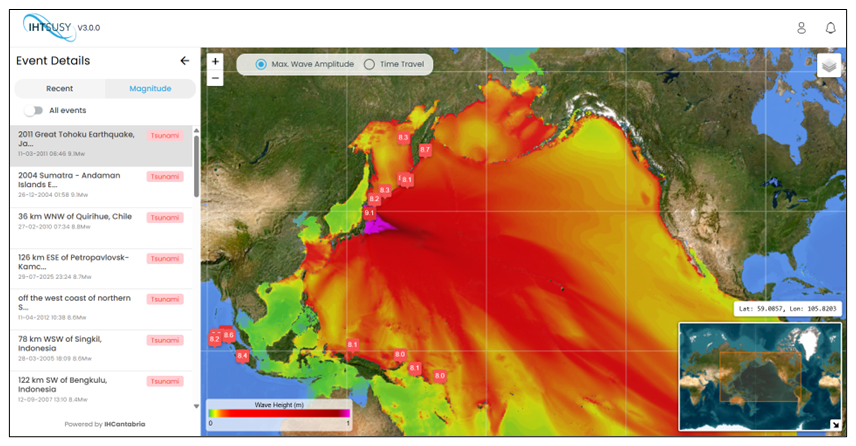
Figure 10Representation of a numerical simulation of Tohoku (Japan) 2011 in the TSUSY Database.
Since one of the objectives of this study is to collate all historical data and create a comprehensive database of potential tsunamis, the TSUSY Database contains all of this data for each one of the 5315 events. The Tohoku Tsunami (Japan) is an example of a simulated tsunami included in the TSUSY Database, as shown in Fig. 10, which illustrates a summary of the results for this event, including the name, date, coordinates and focal depth of the earthquake, as reported at the epicentre. Additionally, the upper panel depicts the MWH simulation and the propagation of tsunami waves.
3.3 Tsunami occurrence criterion
In this section, the methodology outlined in Sect. 2.6 was applied to the full TSUSY catalogue (Sect. 3.2) to derive a practical tsunami-occurrence threshold from the simulated wave-height fields. The resulting metrics were analysed to characterise their global variability and to identify a range of MWH values where the criterion is uncertain. This analysis directly addresses one of the key questions raised in the introduction: whether a tsunami has been generated following an earthquake. Although the number of grid cells exceeding the percentile is useful to assess the spatial consistency of individual simulated events and to identify isolated numerical outliers, the following analysis focuses on the percentile value itself to derive a practical tsunami-occurrence threshold.
3.3.1 Representation of event variability
Once computed for all simulations, the relationship between the event-specific 99.98th-percentile wave height and the number of grid cells exceeding this value was represented in a density heatmap (Fig. 11). Colour intensity indicates the concentration of events within each bin, providing a global overview of the distribution of simulated tsunami responses. The results reveal a broad range of behaviours, from large tsunamis with values exceeding 4.5 m to very small perturbations approaching the numerical wetting threshold. Most simulations cluster within the intermediate range, with 99.98th-percentile wave heights between 0.1 and 0.4 m, where the tsunami-occurrence classification becomes uncertain.
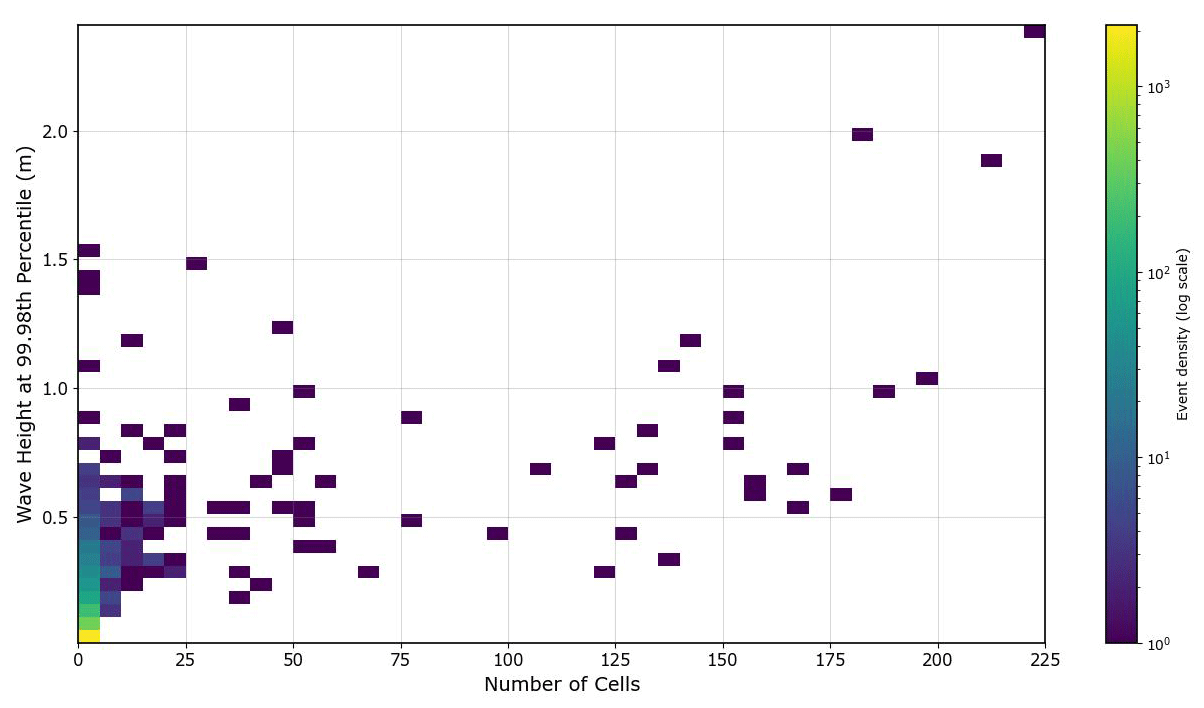
Figure 11Heatmap showing the number of grid cells exceeding the threshold (x axis) versus the 99.98th percentile wave height (y axis).
3.3.2 Selection of the tsunami-occurrence threshold
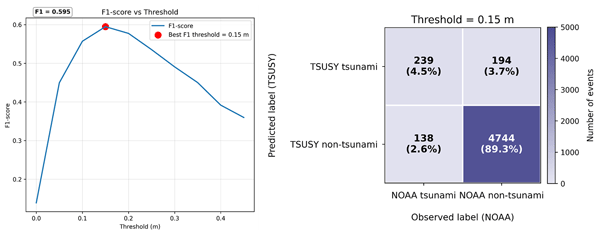
Following the methodology described in Sect. 2.6, the classification performance of different candidate thresholds was evaluated using the F1-score, which provides a balanced metric combining precision and recall for this highly imbalanced classification problem. Figure 12 shows the variation of the F1-score as a function of the candidate tsunami-occurrence threshold applied to the 99.98th-percentile MWH.
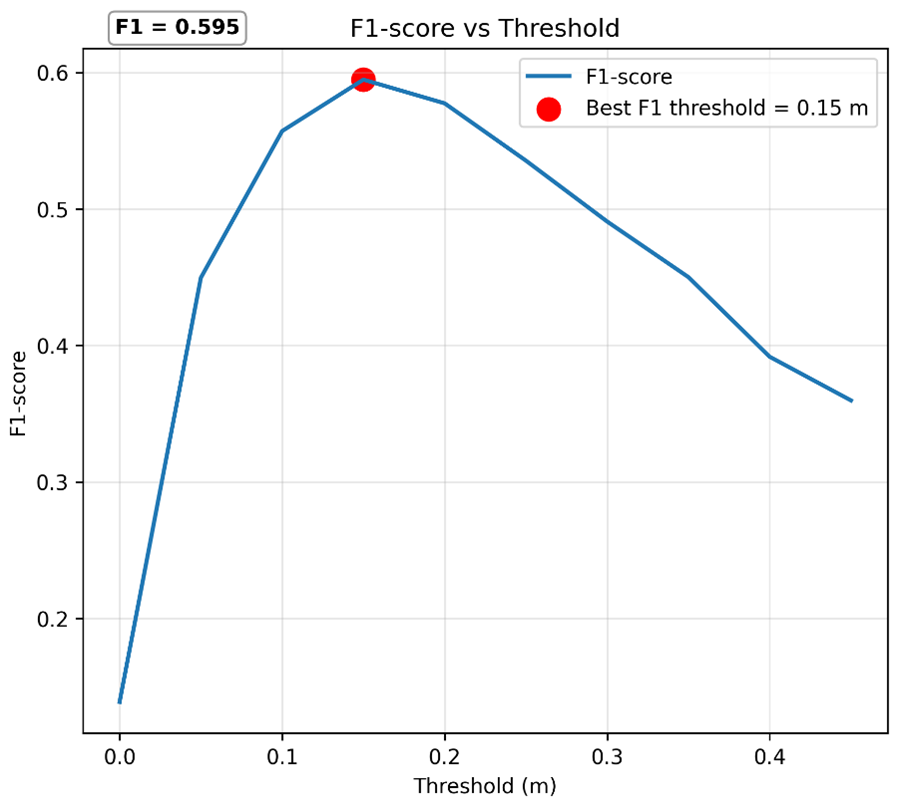
Figure 12Variation of the F1-score as a function of the candidate tsunami-occurrence threshold applied to the 99.98th-percentile MWH.
The analysis reveals a maximum around 0.15 m, indicating the threshold that provides the best balance between precision and recall when compared with the NOAA tsunami catalogue.
Based on this result, a threshold of 0.15 m was selected as the tsunami-occurrence threshold. The corresponding confusion matrix is shown in Fig. 13, illustrating the classification performance relative to the NOAA catalogue. This value therefore represents the threshold that maximizes the classification agreement between the simulated tsunami catalogue and the observational NOAA tsunami records.
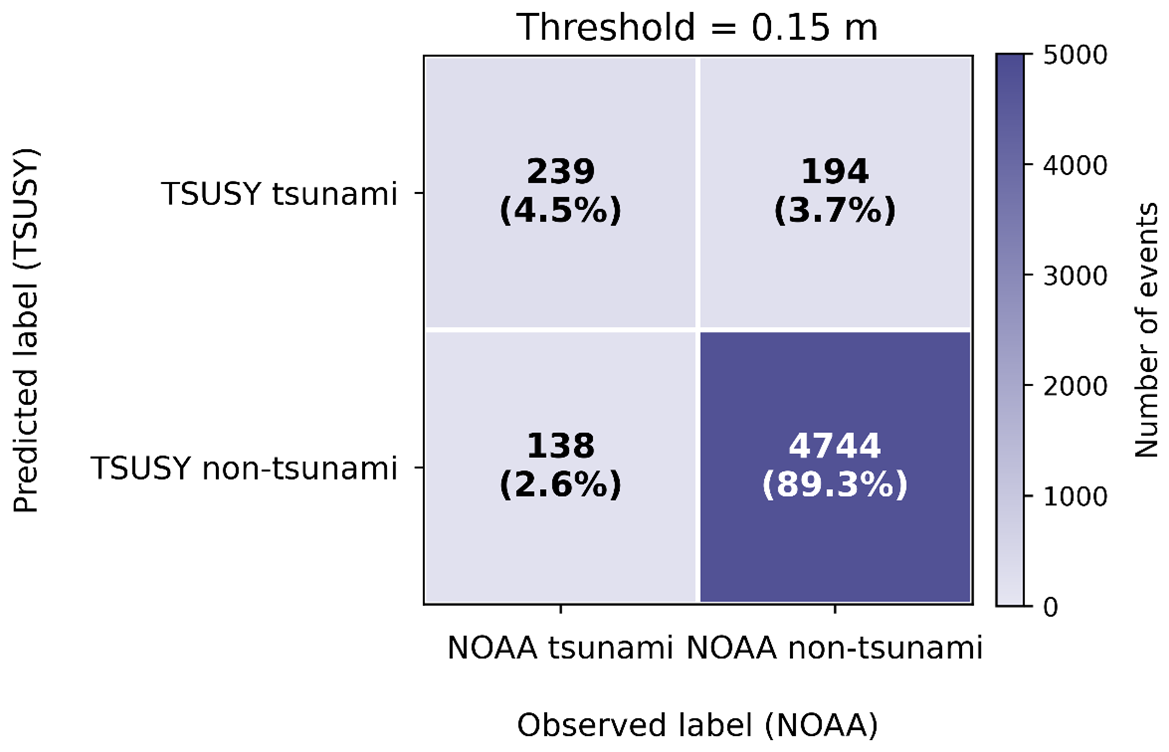
Figure 13Confusion matrix obtained using the selected tsunami-occurrence threshold of 0.15 m applied to the 99.98th-percentile MWH.
The confusion matrix corresponding to the selected threshold (Fig. 13) allows a quantitative assessment of the classification performance. Overall, a high level of agreement is observed between the simulated classification and the NOAA catalogue, with 93.8 % of events correctly classified (true positives and true negatives).
The remaining 6.3 % of cases correspond to misclassifications, including 3.7 % false positives and 2.6 % false negatives. These discrepancies are primarily associated with intermediate and borderline cases, where tsunami generation is inherently uncertain, and are further analysed in Sect. 4.
Despite these differences, the selected threshold of 0.15 m captures a large proportion of the observed tsunami events while maintaining a relatively low number of false positives, supporting its suitability as a practical tsunami-occurrence criterion.
This section evaluates the consistency of the tsunami criterion derived from the 0.15 m threshold and its correspondence with historical tsunami records. The analysis quantifies the agreement with the NOAA catalogue and examines discrepancies by magnitude range in order to assess the statistical robustness of the proposed criterion. It then focuses on the additional tsunamis identified only in the TSUSY Database, exploring why they are not listed as tsunamis in NOAA and what this implies for operational tsunami assessment.
4.1 Evaluation of results: matching with NOAA Catalogue
The comparison with NOAA indicates that the 0.15 m tsunami-occurrence criterion provides a consistent and physically based tsunami identification. Using this criterion, 433 events are labelled as tsunamis in the TSUSY Database, compared with 377 tsunami events in the filtered NOAA catalogue. Among these, 239 events are common to both catalogues, while 194 appear only in the TSUSY Database and 138 only in NOAA. The spatial distribution (Fig. 14) shows that agreement is highest along the main subduction zones, where both catalogues concentrate most tsunamis.
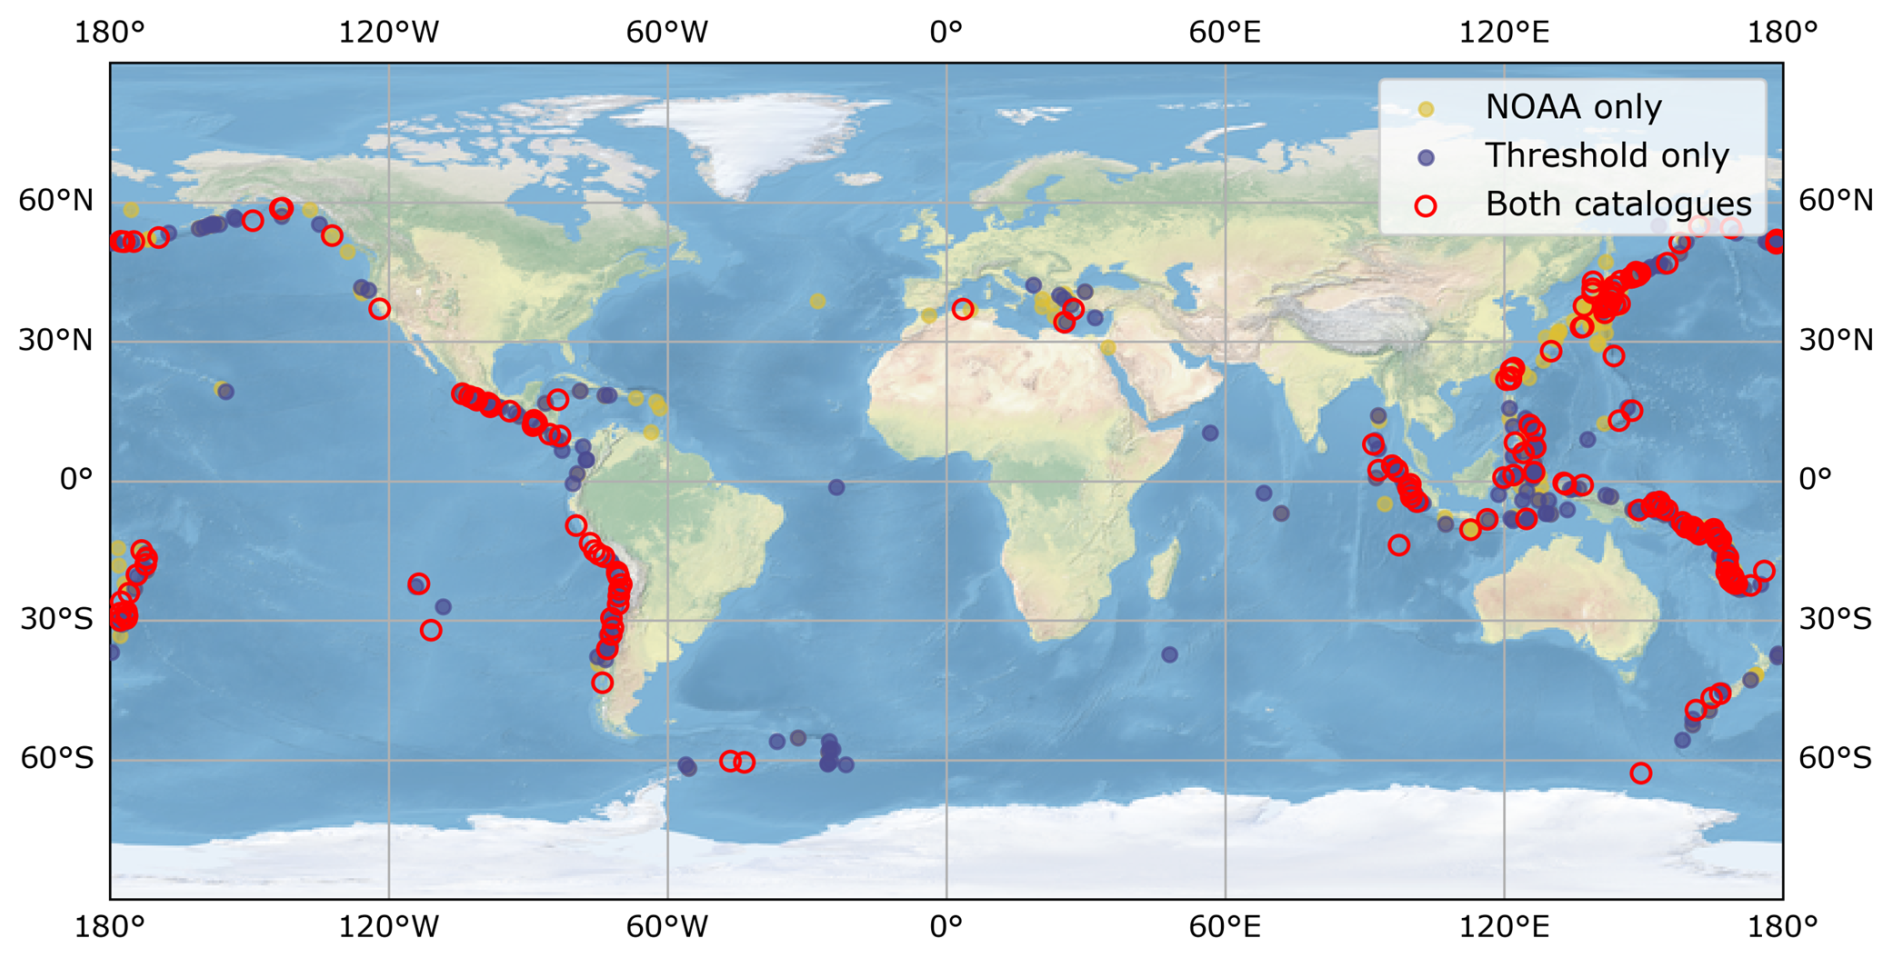
Figure 14Global distribution of tsunamis in the TSUSY Database and in the filtered NOAA catalogue. Yellow dots correspond to events present only in NOAA, blue dots to events present only in the TSUSY Database (0.15 m threshold), and red circles to events present in both catalogues.
In relative terms, about 63 % of the NOAA events are also labelled as tsunamis when applying the proposed threshold. The remaining 37 % correspond to earthquakes that NOAA reports as tsunamis but that do not exceed the 0.15 m threshold or do not meet the spatial consistency condition. This mismatch is concentrated in magnitude ranges and source configurations where the tsunami potential is intrinsically uncertain. Conversely, about 55 % of the events labelled as tsunamis in the TSUSY Database correspond to tsunamis reported in the NOAA catalogue, while the remaining 45 % are not included in the NOAA database. These cases are discussed in Sect. 4.2.
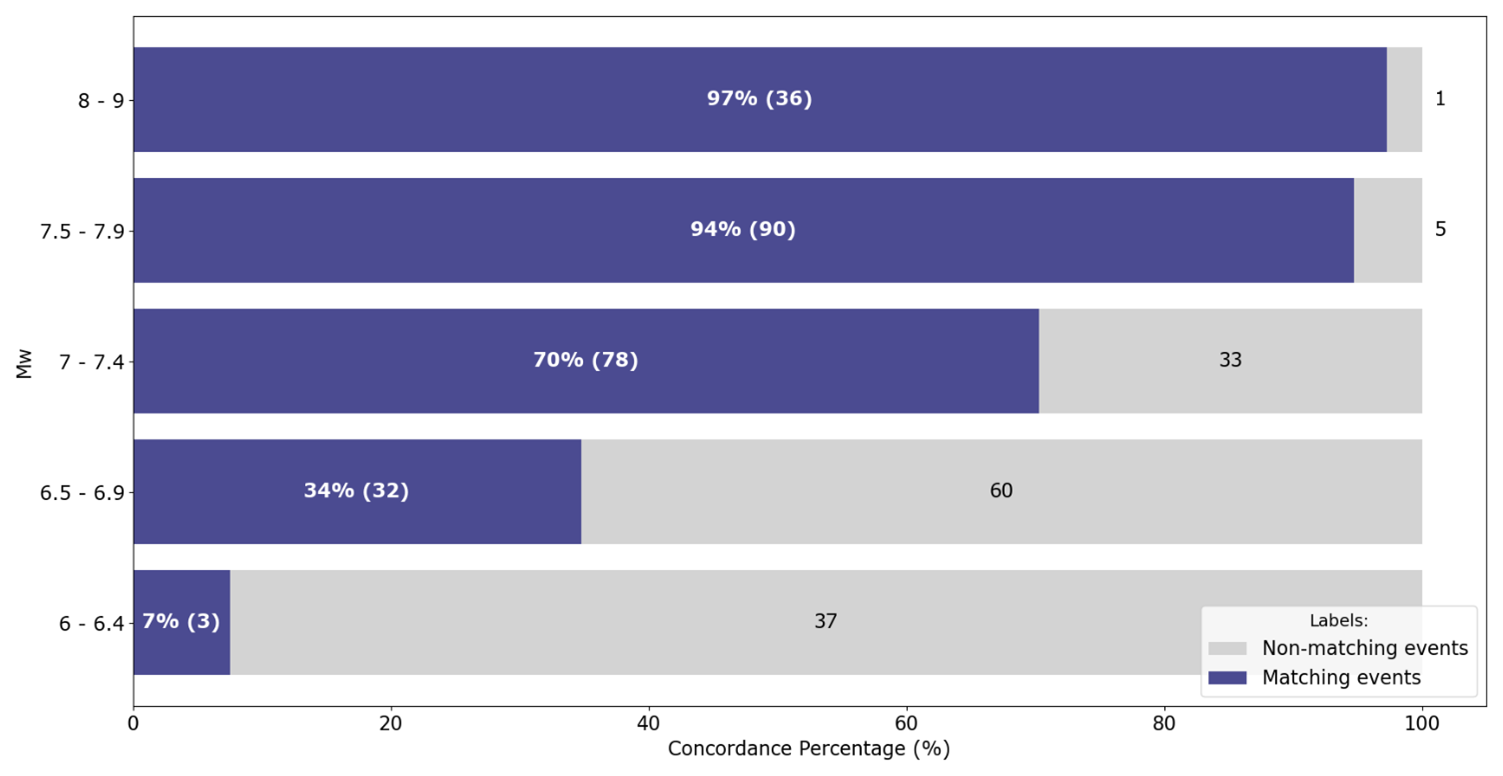
Figure 15Percentage of NOAA tsunami events that are also labelled as tsunamis in the TSUSY Database, by magnitude range. Dark bars indicate matching events and light bars indicate non-matching NOAA events; labels show the percentage and number of events in each group.
Grouping the events by magnitude clarifies this pattern (Fig. 15). For Mw ≥ 7, the agreement between NOAA and the TSUSY Database is high, whereas for Mw < 7 the percentage of matching events drops sharply. This behaviour is consistent with the intended design of the threshold to reduce false positives: it retains almost all large tsunamis and discards many small or deep events that only produce minor sea-level disturbances.
In the highest magnitude range (8–9), only one NOAA event is not reproduced as a tsunami in the simulations. This earthquake has a focal depth of 580 km and a 99.98th percentile MWH of about 0.09 m, clearly below the 0.15 m threshold. Such a deep source is inefficient at displacing the seafloor, and NOAA operational guidelines usually exclude these cases from tsunami evaluation. However, in the NOAA catalogue it is reported as a tsunami despite this focal depth. This mismatch therefore reflects a conservative choice in the TSUSY Database definition rather than an inconsistency.
In the 7.5–7.9 range, a small group of NOAA tsunamis falls just below the threshold, with 99.98th percentile MWH values between 0.10 and 0.14 m. These borderline events typically share one or more of the following characteristics: relatively deep focal depths, strike-slip mechanisms and/or very small amplitudes recorded on tide gauges and DART buoys. A reduction of the threshold by only 1 cm would be enough to label them as tsunamis, but the adopted value of 0.15 m is intentionally conservative, privileging robustness and the reduction of false positives over capturing every minor sea-level disturbance.
In the 7.0–7.4 range, 33 NOAA events are not labelled as tsunamis in the TSUSY Database. Their simulated 99.98th percentile MWH values span from a few centimetres up to 0.138 m, often below or very close to the threshold. Many of these earthquakes likely produced limited coastal impact, so their exclusion is consistent with a tsunami-occurrence criterion aimed at operational warning decisions rather than at detecting any small oscillation.
The largest discrepancy appears for magnitudes 6.5–6.9, where 64 NOAA tsunamis do not exceed the threshold in the TSUSY Database. Most of these earthquakes fail the spatial consistency condition or exhibit source characteristics close to the lower limit of what is usually considered tsunamigenic, especially when they are relatively deep or far from the seafloor. In this range, the simulations act as a physical filter that removes a large number of marginal cases.
For Mw 6.0–6.4, discrepancies remain substantial, as expected for events that are generally too small to generate damaging tsunamis. Only a few earthquakes in this bin exceed the 0.15 m criterion, combining shallow focal depths with relatively large slip and producing simulated MWH values around 0.2–0.3 m. These cases correspond to favourable source conditions (e.g. shallow depth and relatively large slip) that compensate for the lower magnitude. The remaining events yield negligible simulated wave heights and are labelled as non-tsunamis.
Taken together, these results confirm that the 0.15 m threshold is consistent with current operational practice. It reproduces nearly all large tsunamis (Mw ≥ 7) in the NOAA catalogue, while strongly reducing the number of low-magnitude or deep events labelled as tsunamis. Importantly, no high-impact tsunami events in the NOAA catalogue are classified as non-tsunami by the proposed threshold.
In the following subsection we move from the shared events to those that are labelled as tsunamis only in the TSUSY Database, examining why they are absent from the NOAA catalogue.
4.2 Tsunamis identified only in the TSUSY Database and not reported in NOAA
In contrast to Sect. 4.1, which focused on events common to both catalogues, the events labelled as tsunamis in the TSUSY Database but not listed as such in the NOAA catalogue provide additional insight into the limitations of historical records and the added value of simulation-based criterion. These events are not uniformly distributed; they fall into identifiable groups that are physically plausible and are likely to be under-reported.
A first group corresponds to foreshocks and aftershocks of major tsunamigenic earthquakes, such as the 2004 Sumatra, 2010 Chile and 2011 Japan events. While the mainshocks are recognised as tsunamis in both catalogues, some associated shocks are not listed as separate tsunamis in NOAA. The simulations show that several of these secondary events generate wave fields above the threshold and therefore qualify as tsunamigenic in the TSUSY Database. This reflects a different aggregation choice rather than a contradiction: NOAA reports a single tsunami episode, whereas the TSUSY Database treats each causative earthquake as a separate event and assigns an event-level label based on the simulated wave-height criterion.
A second group includes events that NOAA attributes primarily to landslides. In these cases, the tsunami is linked to a mass movement triggered by the earthquake. In the TSUSY Database, by contrast, is only considered the seismic source. For a number of such events, the simulations indicate that the earthquake alone can exceed the 0.15 m threshold, meaning that the seismic displacement is, by itself, tsunamigenic. This does not exclude the role of landslides; however, the simulations indicate that, for some events, the seismic displacement alone can exceed the threshold, suggesting that both mechanisms may contribute to tsunami generation.
A third group comprises events marked by NOAA as “very doubtful” or “questionable” tsunamis, which were excluded during the filtering of the catalogue. These entries highlight the uncertainty inherent in historical records based on sparse observations or anecdotal reports. When simulated, several of them generate waves above the threshold, supporting their physical plausibility even if the documentary evidence is weak. Excluding them from the direct comparison but retaining them in the TSUSY Database strikes a balance between conservatism in validation and completeness in the simulation database.
Another relevant subset consists of earthquakes occurring in remote regions, where the available observational network is very limited or absent. In such areas, the absence of records in NOAA is expected, regardless of whether a tsunami actually occurred. The TSUSY Database reveals that some of these events produce simulated wave heights above the threshold near uninhabited or poorly monitored coastlines. These tsunamis are physically plausible but are naturally absent from historical catalogues.
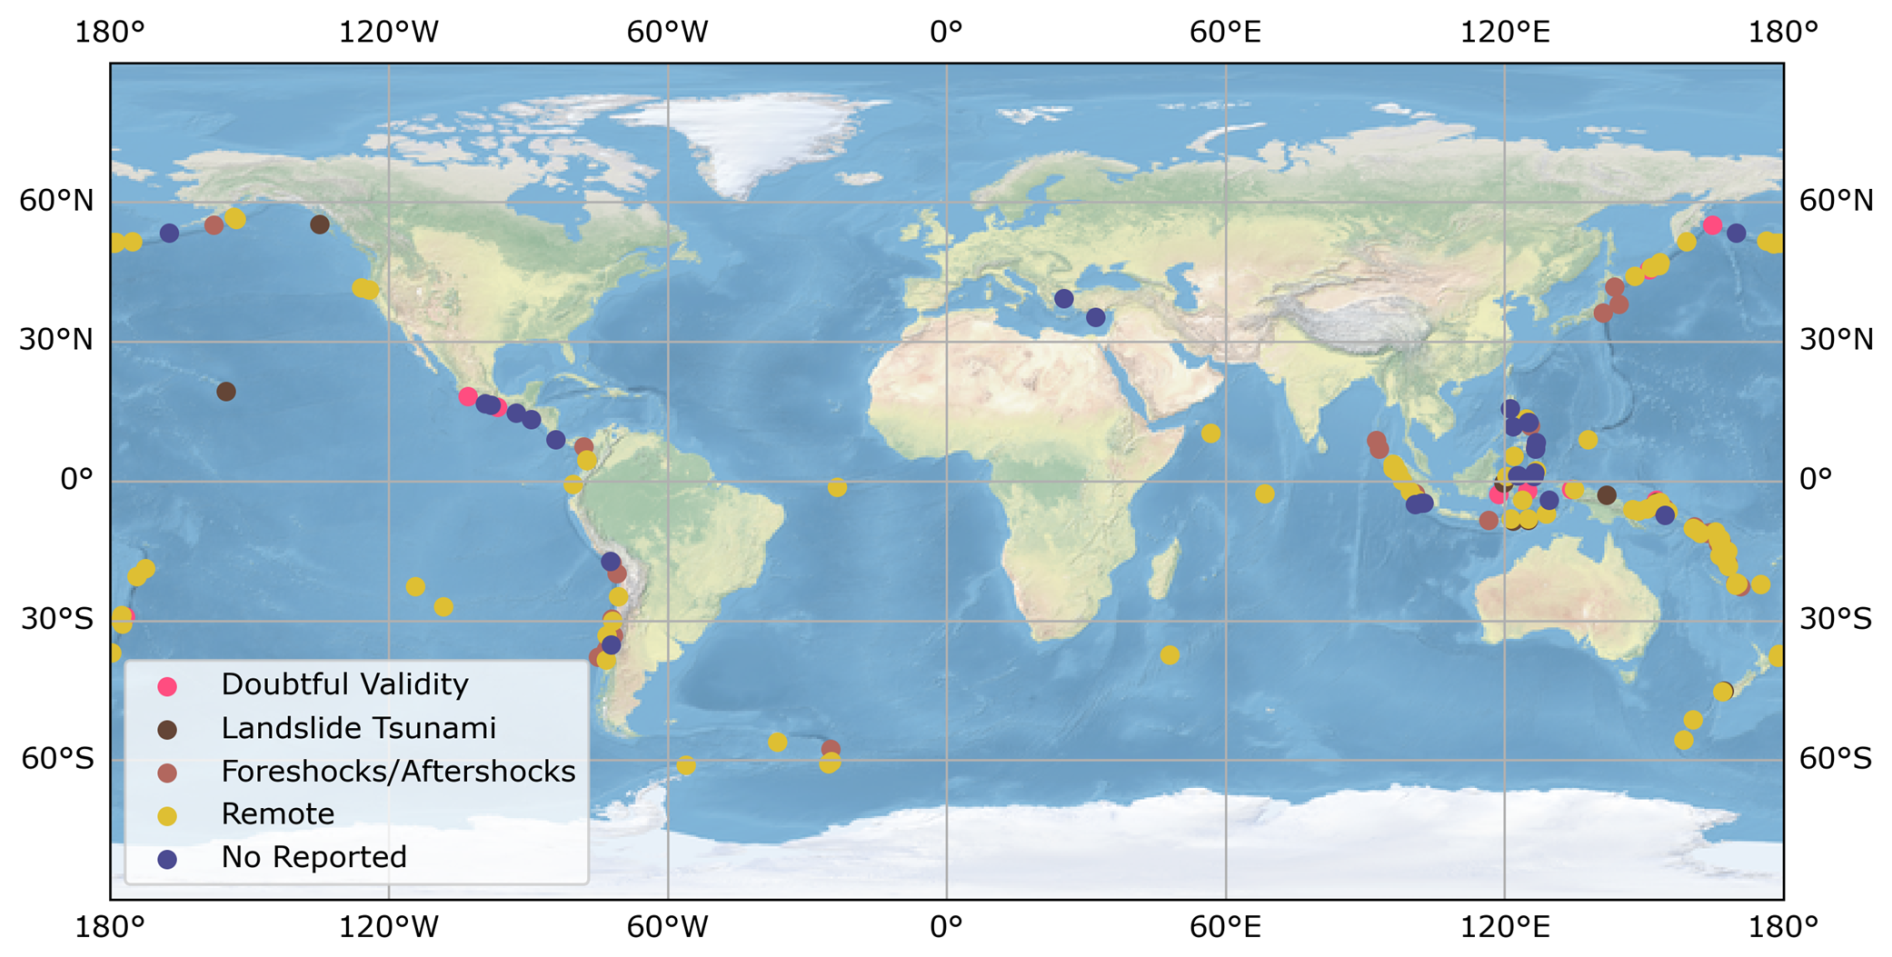
Figure 16Epicentral locations of tsunami events identified by the 0.15 m tsunami-occurrence threshold in the TSUSY Database that are not listed as tsunamis in the NOAA catalogue. Different symbols/colours indicate the event groups discussed in the text (foreshocks/aftershocks, landslide-related events, doubtful/questionable events, remote events, and “No Reported” cases).
Finally, the TSUSY Database identifies a set of “No Reported” events for which no tsunami information has been found in NOAA or other sources, yet the simulations produce wave heights above the threshold in potentially exposed coastal areas. Figure 16 summarises the spatial distribution of the different groups of events labelled as tsunamis by the TSUSY Database but not listed as tsunamis in NOAA.
The distribution of these additional tsunamis is consistent with their interpretation. Events with limited or no impact on populated areas cluster in the open ocean and around remote islands, where under-reporting is expected.
Overall, the TSUSY Database acts as a physically based complement to the NOAA catalogue. The 0.15 m threshold reproduces the bulk of NOAA tsunamis for Mw ≥ 7 and intentionally filters out many marginal cases, while the simulations identify additional tsunamis that are physically plausible and are missing or weakly documented in historical records. This combination of numerical modelling and catalogue information provides a more comprehensive and operationally useful characterisation of tsunami occurrence than either source alone.
The methodology developed in this work has been directly implemented in the IH-Tsunamis System (IH-Tsusy), an online operational platform designed to support tsunami analysis in near real time. IH-Tsusy consists of two tightly coupled components: a real-time module that evaluates the tsunamigenic potential of ongoing earthquakes and, when appropriate, launches numerical simulations of tsunami propagation; and a continuously updated global database of historical tsunami simulations.
The first core component of IH-Tsusy is the global database of historical simulations, which builds upon the TSUSY Database described in this study. It contains numerical assessments of earthquakes and associated tsunami simulations from 1976 to the present, continuously updated as new events occur. For each event, the database stores the simulated maximum wave heights and travel times, together with the seismic source parameters and corresponding maps. This archive not only provides an openly available resource for tsunami hazard studies and model validation, but also supplies the training dataset for the AI-based decision model implemented in IH-Tsusy.
Building on this database, the real-time component of IH-Tsusy automatically retrieves seismic information from the USGS after an earthquake occurs anywhere in the world. The same set of source parameters used in this study (moment magnitude, depth, fault orientation and dimensions, slip, and focal mechanism) is fed to an artificial neural-network-based model (Gallego Jiménez, 2025) specifically trained to estimate whether the event is tsunamigenic. The training of this model relies on the TSUSY Database and on the tsunami-occurrence criterion derived in this paper: each simulated event is labelled as “potential tsunami” or “non-tsunami” according to the 99.98th-percentile wave-height threshold. Thus, the model learns the relationship between earthquake source characteristics and the occurrence of a tsunami as defined by our simulation-based criterion. When the model classifies a new earthquake as potentially tsunamigenic, IH-Tsusy triggers a GPU-based Tsunami-HySEA simulation, which provides estimates of travel times and wave amplitudes, displayed through a geospatial viewer. These results are typically available within approximately 10 min after the focal mechanism is released.
In summary, IH-Tsusy illustrates a concrete operational application of the methodology presented in this paper. The tsunami-occurrence threshold and the TSUSY Database provide the foundation for both the real-time neural-network classifier and the global archive of simulations, demonstrating how a simulation-based definition of tsunami occurrence can be transferred from a research framework to an operational decision-support system.
This work presented a global, simulation-based framework for defining a tsunami-occurrence criterion, built on the combination of historical seismic catalogues, numerical modelling and statistical analysis. Starting from USGS earthquake data and tsunami records from the NOAA catalogue, the TSUSY Database was constructed: a consistent set of tsunami simulations covering the period 1976–2023, from which maximum wave heights and associated metrics were derived for more than 5300 events. This database provides a homogeneous numerical characterisation of tsunami potential at global scale for instrumentally recorded earthquakes within the considered magnitude and depth ranges.
On this basis, a tsunami-occurrence criterion was defined grounded in simulated maximum wave heights rather than in seismic parameters alone, and expressed as a tsunami-occurrence threshold at 0.15 m. For each event, the 99.98th percentile of the MWH field was computed, with a lower bound of 0.01 m corresponding to the wetting threshold in the numerical model. A range of candidate thresholds was then evaluated by comparing the simulated tsunami classifications with the tsunami records reported in the NOAA catalogue. Using a confusion-matrix framework, precision and recall were computed for each threshold and combined through the F1-score metric, which provides a balanced evaluation of classification performance in the presence of strongly imbalanced classes. The analysis revealed a maximum F1-score for a threshold close to 0.15 m, indicating the value that provides the best balance between false positives and false negatives. This threshold was therefore adopted as the tsunami-occurrence criterion used to label events in the TSUSY Database.
The performance of this threshold was evaluated by comparing the resulting tsunami criterion with the filtered NOAA tsunami catalogue. Using the 0.15 m threshold, 433 earthquakes in the TSUSY Database were labelled as tsunamigenic, compared with 377 tsunami events in NOAA; 239 of these events are common to both catalogues. Approximately 65 % of the NOAA tsunamis are reproduced as tsunamis by the threshold, with agreement highest for Mw ≥ 7 and shallow events. Discrepancies are concentrated at lower magnitudes (Mw 6.0–6.9) and in cases with unfavourable source characteristics, such as great focal depths or limited spatial extent in the simulated wave fields. This magnitude-dependent behaviour is consistent with current operational practice, in which Mw≈6.5 is often used as a lower bound for considering an event as potentially tsunamigenic, and is consistent with the interpretation of 0.15 m as a conservative, physically based tsunami-occurrence threshold.
On the other hand, the analysis of events labelled as tsunamis in the TSUSY Database but not listed as tsunamis in the NOAA catalogue illustrates the contribution of a simulation-based approach. These “TSUSY-only” tsunamis form several distinct groups: foreshocks and aftershocks of major tsunamigenic earthquakes, events associated with landslide-related tsunamis, doubtful or questionable entries in the historical catalogue, earthquakes in remote or poorly instrumented regions, and “No Reported” cases for which no tsunami information is available despite simulated exceedance of the threshold. In all these situations, the numerical simulations provide physically plausible tsunami signals that either complement or clarify the often incomplete and heterogeneous historical record, particularly in data-sparse regions.
Taken together, these results indicate that the proposed methodology achieves two complementary objectives. First, it reproduces most historically reported tsunamis for moderate-to-large earthquakes while filtering out a substantial number of small, deep or marginal events whose simulated impact is weak or highly localised. Second, it reveals additional, physically plausible tsunami signals that are absent or only vaguely documented in observational catalogues. This combined use of historical data and systematic numerical simulations therefore provides a more complete and internally consistent picture of global tsunami occurrence than either source alone.
Finally, the tsunami-occurrence threshold and the TSUSY Database have been integrated into the IH-Tsusy operational system, where they serve both as training labels for a neural-network classifier and as reference fields for an evolving global database of simulated tsunamis. In this context, the 0.15 m threshold functions as an explicit, simulation-based and physically grounded decision rule for determining whether an ongoing earthquake should be treated as tsunamigenic, illustrating a direct transfer from methodological development to operational tsunami warning practice.
| AI | Artificial Intelligence |
| ANSS | Advanced National Seismic System |
| BMS | Best-Matching Scenarios |
| CDF | Cumulative Distribution Function |
| CENALT | CENtre D'Alerte aux Tsunamis (France) |
| DM | Decision Matrix |
| ENVs | Envelopes |
| ETA | Estimated Time of Arrival |
| EWA | Estimated Wave Amplitude |
| FMC | Focal Mechanism Classification |
| GCMT | Global Centroid Moment Tensor |
| GEBCO | General Bathymetric Chart of the Oceans |
| IGN | Instituto Geográfico Nacional (Spain) |
| INCOIS | Indian National Centre for Ocean Information Services |
| INGV | Istituto Nazionale di Geofisica e Vulcanologia (Italy) |
| IRIDeS | International Research Institute of Disaster Science (Japan) |
| JMA | Japan Meteorological Agency |
| KOERI | Kandilli Observatory and Earthquake Research Institute (Turkey) |
| MWH | Maximum Wave Height |
| MWHE | Maximum Wave Height of the Event (whole grid) |
| MWHGP | Maximum Wave Height per Grid Point |
| Mw | Moment Magnitude scale |
| NOA | National Observatory of Athens (Greece) |
| NOAA | National Oceanic and Atmospheric Administration |
| NTWC | National Tsunami Warning Centre |
| PIANC | The World Association for Waterborne Transport Infrastructure |
| SHOA | Servicio Hidrográfico y Oceanográfico de la Armada (Chile) |
| SIPAT | Sistema Integrado de Pronóstico y Alerta de Tsunamis (Chile) |
| TSUSY | TSUnami SYstem Database |
| TSP | Tsunami Service Provider |
| TWS | Tsunami Warning Systems |
| USGS | United States Geological Survey |
The FMC (Focal Mechanisms Classification) model used to define the seismic rupture geometry is openly available through GitHub (https://github.com/Jose-Alvarez/FMC, Álvarez-Gómez, 2019). The tsunami numerical simulations were performed using Tsunami-HySEA. The TsunamiClassifier neural-network model developed and used within the IH-Tsusy operational system is openly available through GitHub (https://github.com/AlbertGallegoJimenez/TsunamiClassifier, Gallego Jiménez, 2025). Additional scripts and workflows developed for the construction of the TSUSY Database and the post-processing of results are available from the corresponding author upon reasonable request.
The tsunami catalogue used in this study was obtained from the NOAA Global Historical Tsunami Database provided by the National Centers for Environmental Information (https://www.ngdc.noaa.gov/hazel/view/hazards/tsunami/search, last access: 11 May 2026). Earthquake source parameters were retrieved from the United States Geological Survey (USGS) Advanced National Seismic System Comprehensive Earthquake Catalog (ComCat) (https://earthquake.usgs.gov/earthquakes/search/). Bathymetric data used for tsunami simulations were obtained from the General Bathymetric Chart of the Oceans (GEBCO) (https://doi.org/10.5285/f98b053b-0cbc-6c23-e053-6c86abc0af7b, GEBCO, 2023). The tsunami simulations generated in this study and the derived TSUSY Database, including the tsunami numerical simulations and the seismic source input data used to generate them, are currently integrated within the operational IH-Tsusy platform and are available (https://tsunami.ihcantabria.com/?_ga=2.133392654.1645853229.1772801387-174509965.1772801387#/events, last access: 11 May 2026).
David Galán Pérez: Conceptualization, Data curation, Formal analysis, Investigation, Methodology, Software, Validation, Visualization, Writing – original draft, Writing – review and editing, Supervision. Iñigo Aniel-Quiroga: Conceptualization, Supervision, Writing – review and editing. Albert Gallego: Conceptualization, Data curation, Software, Writing – review and editing. Ignacio Aguirre-Ayerbe: Conceptualization, Supervision, Writing – review and editing. Mauricio González: Conceptualization, Supervision, Writing – review and editing. Omar Quetzalcóatl: Conceptualization, Writing – review and editing. Jose A. Álvarez-Gómez: Validation, Writing – review and editing. Luis Pedraz: Software.
At least one of the (co-)authors is a member of the editorial board of Natural Hazards and Earth System Sciences. The peer-review process was guided by an independent editor, and the authors also have no other competing interests to declare.
Publisher's note: Copernicus Publications remains neutral with regard to jurisdictional claims made in the text, published maps, institutional affiliations, or any other geographical representation in this paper. The authors bear the ultimate responsibility for providing appropriate place names. Views expressed in the text are those of the authors and do not necessarily reflect the views of the publisher.
The authors acknowledge the European Plate Observing System (EPOS) Research Infrastructure for its contribution to this study. Furthermore, the authors acknowledge the Gobierno de Cantabria for the initial support of the IH-TSUSY system through the Fenix Programme.
This study forms part of the ThinkInAzul programme and was supported by Ministerio de Ciencia e Innovación with funding from European Union NextGeneration EU (PRTR-C17.I1) and by Comunidad de Cantabria, as well as by the research project PID2023-151688OA-I00 funded by MICIU/AEI/10.13039/501100011033 and by FEDER, EU. The role of ThinkInAzul programme was to cover the grant of the corresponding author, while the FEDER fundings covered the article publishing charges (APCs).
This paper was edited by Ira Didenkulova and reviewed by Juan V. Cantavella Nadal and one anonymous referee.
Aguirre-Ayerbe, I., Martínez Sánchez, J., Aniel-Quiroga, Í., González-Riancho, P., Merino, M., Al-Yahyai, S., González, M., and Medina, R.: From tsunami risk assessment to disaster risk reduction – the case of Oman, Nat. Hazards Earth Syst. Sci., 18, 2241–2260, https://doi.org/10.5194/nhess-18-2241-2018, 2018.
Allen, S. C. R. and Greenslade, D. J. M.: Model-based tsunami warnings derived from observed impacts, Nat. Hazards Earth Syst. Sci., 10, 2631–2642, https://doi.org/10.5194/nhess-10-2631-2010, 2010.
Álvarez-Gómez, J. A.: FMC – Earthquake focal mechanisms data management, cluster and classification, SoftwareX, 9, 299–307, https://doi.org/10.1016/j.softx.2019.03.008, 2019.
Blaser, L., Kruger, F., Ohrnberger, M., and Scherbaum, F.: Scaling Relations of Earthquake Source Parameter Estimates with Special Focus on Subduction Environment, B. Seismol. Soc. Am., 100, 2914–2926, https://doi.org/10.1785/0120100111, 2010.
Catalan, P. A., Gubler, A., Cañas, J., Zuñiga, C., Zelaya, C., Pizarro, L., Valdes, C., Mena, R., Toledo, E., and Cienfuegos, R.: Design and operational implementation of the integrated tsunami forecast and warning system in Chile (SIPAT), Coast. Eng. J., 62, 373–388, https://doi.org/10.1080/21664250.2020.1727402, 2020.
CIGIDEN: A seis años del 27F: destacan las lecciones aprendidas tras la tragedia, https://www.cigiden.cl/a-seis-anos-del-27-f-destacan-las-lecciones-aprendidas-tras-la-tragedia/ (last access: 11 May 2026), 2016.
Daskalaki, E., Aguirre Ayerbe, I., Baptista, M. A., Amato, A., Cambaz, M. D., Charalampakis, M., Cugliari, L., El-Gharabawy, S. M., Hamouda, A., Hebert, H., Kalligeris, N., Cantavella Nadal, J. V., Meral Özel, N., Péroche, M., and Yalciner, A. C.: Recent Developments in Tsunami Preparedness in the Northeast Atlantic and Mediterranean Region: Challenges, Strengths, and Weaknesses , EGU General Assembly 2025, Vienna, Austria, 27 April–2 May 2025, EGU25-16032, https://doi.org/10.5194/egusphere-egu25-16032, 2025.
Dziewonski, A. M., Chou, T. -A., and Woodhouse, J. H.: Determination of earthquake source parameters from waveform data for studies of global and regional seismicity, J. Geophys. Res.-Sol. Ea., 86, 2825–2852, https://doi.org/10.1029/JB086iB04p02825, 1981.
Echave-Lezcano, J.: Elaboración de la metodología y base de datos numérica de tsunamis para el Sistema de Alerta de Tsunamis español, MS thesis, Universidad de Cantabria, Spain, 2016.
Ekström, G., Nettles, M., and Dziewoński, A. M.: The global CMT project 2004–2010: Centroid-moment tensors for 13 017 earthquakes, Phys. Earth Planet. In., 200–201, 1–9, https://doi.org/10.1016/j.pepi.2012.04.002, 2012.
Gallego Jiménez, A.: TsunamiClassifier, GitHub [code], https://github.com/AlbertGallegoJimenez/TsunamiClassifier (last access: 11 May 2026), 2025.
GEBCO Bathymetric Compilation Group 2023: The GEBCO_2023 Grid – a continuous terrain model of the global oceans and land, NERC EDS British Oceanographic Data Centre NOC [data set], https://doi.org/10.5285/f98b053b-0cbc-6c23-e053-6c86abc0af7b, 2023.
Generalitat Valenciana: La Generalitat ha activat aquest matí el Pla Territorial d'Emergències de la Comunitat Valenciana per avís del Ministeri de l'Interior de risc de tsunami, https://comunica.gva.es/va/detalle?id=359855854&site=174860102 (last access: 11 May 2026), 2015.
Harig, S., Immerz, A., Weniza, Griffin, J., Weber, B., Babeyko, A., Rakowsky, N., Hartanto, D., Nurokhim, A., Handayani, T., and Weber, R.: The Tsunami Scenario Database of the Indonesia Tsunami Early Warning System (InaTEWS): Evolution of the Coverage and the Involved Modeling Approaches, Pure Appl. Geophys., 177, 1379–1401, https://doi.org/10.1007/s00024-019-02305-1, 2020.
Igarashi, Y., Ueno, T., Nakata, K., Hernandez-Grennan, V. C., Cruz-Salcedo, J. L., Narag, I. C., Bautista, B. C., and Koizumi, T.: Building a Tsunami Simulation Database for the Tsunami Warning System in the Philippines, Journal of Disaster Research, 10, 51–58, https://doi.org/10.20965/jdr.2015.p0051, 2015.
Indian National Centre for Ocean Information Services (INCOIS): Standard Operating Procedure for the Indian Tsunami Early Warning Centre (ITEWC), INCOIS, Hyderabad, India, https://incois.gov.in (last access: 11 May 2026), 2011.
Instituto Geográfico Nacional (IGN) and Dirección General de Protección Civil y Emergencias: Plan Estatal de Protección Civil ante el riesgo de maremotos. Edición comentada, Centro Nacional de Información Geográfica and Ministerio del Interior – Centro de Publicaciones, Madrid, Spain, https://doi.org/10.7419/162.02.2022, 2021.
Intergovernmental Oceanographic Commission (IOC): Tsunami Glossary, 2013, Revised Edition 2013, IOC Technical Series, 85, UNESCO, Paris (IOC/2008/TS/85rev), 2013.
Japan Meteorological Agency: Tsunami Warnings/Advisories, https://www.data.jma.go.jp/eqev/data/en/guide/tsunamiinfo.html (last access: 11 May 2026), 2025.
Kanamori, H.: The energy release in great earthquakes, J. Geophys. Res., 82, 2981–2987, https://doi.org/10.1029/JB082i020p02981, 1977.
Løvholt, F., Kaiser, G., Glimsdal, S., Scheele, L., Harbitz, C. B., and Pedersen, G.: Modeling propagation and inundation of the 11 March 2011 Tohoku tsunami, Nat. Hazards Earth Syst. Sci., 12, 1017–1028, https://doi.org/10.5194/nhess-12-1017-2012, 2012.
Macías, J., Castro, M. J., Ortega, S., Escalante, C., and González-Vida, J. M.: Performance Benchmarking of Tsunami-HySEA Model for NTHMP's Inundation Mapping Activities, Pure Appl. Geophys., 174, 3147–3183, https://doi.org/10.1007/s00024-017-1583-1, 2017.
Macías, J., Castro, M. J., Ortega, S., and González-Vida, J. M.: Performance assessment of Tsunami-HySEA model for NTHMP tsunami currents benchmarking. Field cases, Ocean Model., 152, 101645, https://doi.org/10.1016/j.ocemod.2020.101645, 2020.
Macías-Sánchez, J., Castro-Díaz, M. J., González-Vida, J. M., De la Asunción, M., and Ortega, S.: HySEA: An operational GPU-based model for Tsunami Early Warning Systems, in: Geophysical Research Abstracts, EGU General Assembly 2014, Vienna, Austria, 27 April–2 May 2014, EGU2014-14217, http://hdl.handle.net/10630/7489 (last access: 11 May 2026), 2014.
MarCom Working Group 122: Tsunami disasters in ports due to the Great East Japan Earthquake, PIANC report, Brussels, 1–138 pp., ISBN 978-2-87223-211-6, 2014.
National Geophysical Data Center/World Data Service: NCEI/WDS Global Historical Tsunami Database, NOAA National Centers for Environmental Information, https://doi.org/10.7289/V5PN93H7, 2024.
National Oceanic and Atmospheric Administration (NOAA) and National Weather Service (NWS): User's Guide for the Tsunami Warning System in the U.S. National Tsunami Warning Center Area-of-Responsibility, NOAA/NWS/NTWC, Palmer, Alaska, USA, Version 6.7, http://tsunami.gov (last access: 11 May 2026), 2017.
Necmioğlu, Ö., Turhan, F., Özer Sözdinler, C., Yılmazer, M., Güneş, Y., Cambaz, M. D., Altuncu Poyraz, S., Ergün, T., Kalafat, D., and Özener, H.: KOERI's Tsunami Warning System in the Eastern Mediterranean and Its Connected Seas: A Decade of Achievements and Challenges, Appl. Sci., 11, 11247, https://doi.org/10.3390/app112311247, 2021.
Okada, Y.: Surface deformation due to shear and tensile faults in a half-space, B. Seismol. Soc. Am., 75, 1135–1154, https://doi.org/10.1785/BSSA0750041135, 1985.
Papadopoulos, G. and Imamura, F.: A proposal for a new tsunami intensity scale. International Tsunami Symposium 2001 Proceedings, Seattle, Washington, USA, 7–10 August 2001, 569–577, 2001.
Reuters: Tribunal chileno acoge salida extrajudicial para imputados en fallida alerta de tsunami, Reuters, https://www.reuters.com/article/world/americas/tribunal-chileno-acoge-salida-extrajudicial-para-imputados-en-fallida-alerta-de-idUSKCN0X42BV/ (last access: 11 May 2026), 2016.
Röbke, B. R. and Vött, A.: The tsunami phenomenon, Prog. Oceanogr., 159, 296–322, https://doi.org/10.1016/j.pocean.2017.09.003, 2017.
Roudil, P., Schindelé, F., Bossu, R., Alabrune, N., Arnoul, P., Duperray, P., Gailler, A., Guilbert, J., Hébert, H., and Loevenbruck, A.: The French tsunami warning center for the Mediterranean and Northeast Atlantic: CENALT, Science of Tsunami Hazards, 32, 1–7, Tsunami Society International, 2013.
Satake, K.: Advances in earthquake and tsunami sciences and disaster risk reduction since the 2004 Indian ocean tsunami, Geosci. Lett., 1, 15, https://doi.org/10.1186/s40562-014-0015-7, 2014.
Selva, J., Lorito, S., Volpe, M., Romano, F., Tonini, R., Perfetti, P., Bernardi, F., Taroni, M., Scala, A., Babeyko, A., Løvholt, F., Gibbons, S. J., Macías, J., Castro, M. J., González-Vida, J. M., Sánchez-Linares, C., Bayraktar, H. B., Basili, R., Maesano, F. E., Tiberti, M. M., Mele, F., Piatanesi, A., and Amato, A.: Probabilistic tsunami forecasting for early warning, Nat. Commun., 12, 5677, https://doi.org/10.1038/s41467-021-25815-w, 2021.
Servicio Hidrográfico y Oceanográfico de la Armada de Chile (SHOA): Guía de Referencia Sistema Nacional de Alarma de Maremotos, 3rd edn., SHOA, Valparaíso, Chile, https://www.shoa.cl/ (last access: 11 May 2026), 2023 (updated 2025).
Soulé, B.: Post-crisis analysis of an ineffective tsunami alert: the 2010 earthquake in Maule, Chile, Disasters, 38, 375–397, https://doi.org/10.1111/disa.12045, 2014.
Synolakis, C. E. and Bernard, E. N.: Tsunami science before and beyond Boxing Day 2004, Philos. T. Roy. Soc. A, 364, 2231–2265, https://doi.org/10.1098/rsta.2006.1824, 2006.
Tinti, S., Graziani, L., Brizuela, B., Maramai, A., and Gallazzi, S.: Applicability of the Decision Matrix of North Eastern Atlantic, Mediterranean and connected seas Tsunami Warning System to the Italian tsunamis, Nat. Hazards Earth Syst. Sci., 12, 843–857, https://doi.org/10.5194/nhess-12-843-2012, 2012.
Tsunami Inundation Database Portal: https://www.risksciences.ucla.edu/nhr3/tsunami-portal, last access: 7 August 2024.
U.S. Geological Survey: Earthquake Hazards Program, 2017, Advanced National Seismic System (ANSS) Comprehensive Catalog of Earthquake Events and Products: Various, https://earthquake.usgs.gov/earthquakes/search/ (last access: 11 May 2026), 2017.
Wang, X. and Liu, P. L.-F.: Numerical simulations of the 2004 Indian Ocean tsunamis-coastal effects, J. Earthq. Tsunami, 1, 273–297, https://doi.org/10.1142/S179343110700016X, 2007.
- Abstract
- Introduction
- Methodology
- Results
- Discussion
- Implementation of the methodology: application of the TSUSY Database
- Conclusions
- Appendix A: Abbreviations
- Code availability
- Data availability
- Author contributions
- Competing interests
- Disclaimer
- Acknowledgements
- Financial support
- Review statement
- References
- Abstract
- Introduction
- Methodology
- Results
- Discussion
- Implementation of the methodology: application of the TSUSY Database
- Conclusions
- Appendix A: Abbreviations
- Code availability
- Data availability
- Author contributions
- Competing interests
- Disclaimer
- Acknowledgements
- Financial support
- Review statement
- References