the Creative Commons Attribution 4.0 License.
the Creative Commons Attribution 4.0 License.
 | 15 May 2026
Projections of changes in extreme storm surges for European coasts using statistical downscaling
Maialen Irazoqui Apecechea
Angélique Melet
Melisa Menendez
Hector Lobeto
Jonathan B. Valle-Rodriguez
Understanding future changes in extreme storm surges (ESSs) is critical for coastal risk assessment and adaptation. However, existing projections in Europe are often based on computationally expensive dynamical models, limiting ensemble sizes and thus confidence in projected changes. In this study, we develop a cost-effective statistical downscaling model (SDM) trained to replicate dynamically downscaled storm surges, enabling the generation of a pan-European ensemble of ESS projections based on 17 global climate models (GCMs) – substantially expanding previous efforts.
The SDM is trained on a storm surge hindcast and demonstrates stable skill across historical and future climates, broadly capturing projected changes in the 10-year return level given by dynamical simulations. Skill degrades for higher extremes and hence ensemble projections focus on the 10-year return level. Results also show overall lower skill for the eastern Mediterranean and Baltic Seas. Ensemble projections reveal robust multi-model mean changes in the 10-year return level of ESSs by 2100. Negative multi-model mean changes are identified in the Mediterranean Sea (−7 %), Moroccan Atlantic coast (−10 %), and Danish Straits (−6 %), while positive changes of around +6 % are projected for the Celtic and Irish Seas, western Denmark, and the Gulf of Finland. Despite these robust signals, inter-model spread is substantial, with likely ranges (17th–83rd percentiles) extending from −25 % to +17 % across Europe, and changes of up to ±35 % in individual models. The southern North Sea and northern Baltic Sea emerge as low-confidence regions, marked by particularly strong inter-model spread.
Our results underscore the importance of extended ensembles in projecting ESSs in Europe and demonstrate the value of cost-effective statistical models to complement dynamical downscaling in applications that demand extensive simulations, such as large-ensemble projections. They also reveal that more sophisticated, extreme-targeted statistical methods are required to project ESSs in the eastern Mediterranean and Baltic Sea, and overall for higher return periods.
- Article
(7305 KB) - Full-text XML
-
Supplement
(4101 KB) - BibTeX
- EndNote


Extreme storm surges (ESSs), driven by intense wind forcing and low atmospheric pressure during storms, are a major contributor to coastal extreme sea levels and flood risk across Europe and many other regions globally (Woodworth et al., 2019). These events are particularly pronounced in regions with shallow depths and wide continental shelves – conditions typical of much of the northern European coastline. With ongoing climate change and associated mean sea-level rise, the impacts of storm surges are expected to increase significantly. Even without changes in storm characteristics, rising mean sea levels alone are expected to dramatically increase the frequency of today's high-impact events (e.g., Fox-Kemper et al., 2021). In addition, stormy conditions over the ocean and the induced storm surge behaviour may also change under a warmer climate and may further contribute to changes in future coastal hazards, although current evidence for Europe remains inconclusive and strongly region-dependent. While Calafat et al. (2022) report trends in European storm surge extremes matching the rate of sea level rise, other studies emphasize the lack of significant future storm surge changes and dominance of internal variability over forced trends (e.g., Lang and Mikolajewicz, 2019; Sterl et al., 2009).
Despite the relevance of storm surges for European extreme sea levels, regional projections of future changes in storm surges remain limited, including for Europe. Most existing studies rely on hydrodynamic simulations to dynamically downscale climate model outputs. While physically detailed, these methods are computationally expensive, restricting ensemble sizes to a small number of global climate models (GCMs) (e.g., Chaigneau et al. 2024; Muis et al., 2020, 2022; Vousdoukas et al., 2016). As a result, inter-model uncertainty is poorly characterized, reducing the confidence in projected ESS changes, and inter-model spread across small ensembles is reported to be high, emphasizing the need for larger ensembles.
In response to these limitations, statistical downscaling has emerged as a computationally efficient alternative. These models aim to derive empirical relationships between large-scale fields (predictors) and local variables (predictands) – in our case, linking atmospheric fields to local storm surges. Several statistical methods exist with varying levels of complexity. Multiple linear regression techniques, which typically include a dimensionality reduction step of the predictors based on principal component analysis, remains widely used due to its simplicity, low computational cost, and high interpretability. Several studies have demonstrated its ability to reconstruct historical storm surges and wave conditions with skill comparable to, or exceeding, that of dynamical approaches (e.g., Cid et al., 2017; Harter et al., 2024; Tadesse et al., 2020). More complex methods based on Weather Types cluster synoptic atmospheric conditions into circulation regimes and link them probabilistically to local surge responses (Anderson et al., 2019; Costa et al., 2020; Zhong et al., 2025), offering a physically interpretable but regime-based (discrete) representation of surge–atmosphere relationships. More recently, neural network approaches are emerging as promising tools to statistically downscale marine variables. These methods can accommodate more flexible and complex predictor-predictand relationships, including non-linearities typically characterizing storm surges and their extremes. Recent studies (Bruneau et al., 2020; Tiggeloven et al., 2021) have demonstrated improved skill of neural networks to represent storm surge and their non-linearities at tide-gauges globally compared to multiple linear regression methods, with comparable performance to dynamical models, but a tendency to underpredict extremes persist. A very recent study (Hermans et al., 2025) showed that adapting the cost function to specifically target extreme events can alleviate this tendency of underprediction. While promising in terms of predictive accuracy, neural network models require extensive tuning, large training datasets, and offer limited interpretability – making their application at large scale more challenging.
A key limitation of most statistical downscaling approaches is their reliance on observed storm-surges in tide-gauge records for training, which restrict reconstructions to discrete coastal sites with sufficiently long and high-quality observations. Alternatively, the use of outputs from physically based numerical simulations (e.g., reanalysis products) as the predictand enables the training of statistical models on spatially and temporally continuous storm surge fields, effectively replicating the behaviour of dynamical models at a fraction of the computational cost. Such dynamical-statistical approaches have been successfully applied to reconstruct historical storm surge fields at regional (Tausía et al., 2023) and global scales (Cid et al., 2017).
While widely used for past storm surge reconstructions, the application of statistical downscaling to future storm surge projections remains limited. Only a few studies have explored this approach for regional projections, such as Cagigal et al. (2020) for New Zealand and Boumis et al. (2025) for Japan. In Europe, regional-scale statistical ESS projections remain scarce, having been developed only for the Baltic Sea (Dubois et al., 2025) and based on a limited set of 4 GCMs and discrete coastal locations. Furthermore, such studies have not evaluated whether the statistical relationships established under past conditions (whether from observations of reanalyses) remain valid under forcing from climate models, nor have they explicitly assessed the assumption of stationarity in the predictor–predictand relationship between past and future periods. As such, the reliability of statistically downscaled storm surge projections under climate change remains under-explored.
In this study, we address these gaps by producing the first expanded multi-model ensemble (17 models) of pan-European extreme storm surge projections using a dynamical-statistical downscaling approach. Rather than developing a new statistical approach, we adopt an existing method used for broad-scale storm-surge reconstructions – multiple linear regression –, tailor it to Europe, and assess its capability for projecting ESS changes, which has not yet been demonstrated. The adopted framework enables this evaluation by using dynamically downscaled projections as a benchmark, which is not possible for observations-based statistical downscaling. The multiple linear regression framework is chosen for its proved satisfactory performance in Europe (Tadesse et al., 2020) and its computational efficiency, which facilitates its scalability to the whole European coast. We train the model on reanalysis-forced hindcast simulations performed with a high-resolution dynamical downscaling storm surge model. The statistical model is adapted for application to global circulation models (GCMs) from the Coupled Model Intercomparison Project Phase 6(CMIP6), which present varying spatial and temporal resolution. We validate the statistical model using an ensemble of four dynamically downscaled GCMs for historical and future climates. Finally, the trained model is applied to a 17-member CMIP6 ensemble to assess projected changes in ESSs and their associated uncertainties across the European coastline.
2.1 General workflow
The general workflow of the study – including the training, validation and application of the envisioned statistical downscaling model for climate projections of future ESS changes – is presented in Fig. 1. First, a dynamical downscaling model is used to generate both the dataset of past storm-surges (a hindcast forced by the ERA5 reanalysis, Hersbach et al., 2020) to train the statistical model – also used to evaluate the skill of the statistical model to reproduce past ESSs – and the benchmark datasets for future changes in storm surge extremes (CMIP6-forced simulations for historical and future climates, 4 GCMs) to validate the statistical projections. The validation for statistical projections focusses on evaluating two aspects: whether the statistical model trained in past conditions remains valid in future climates (stationarity) and the extrapolation capability of the hindcast-trained statistical model to climate forcing (extrapolability), with a focus on reproducing projected ESS changes (our ultimate goal). To our knowledge, this constitutes the first study to explicitly assess these two aspects, addressing a key limitation in previous approaches that apply hindcast-trained models without prior validation for storm surge projections (Cagigal et al., 2020; Dubois et al., 2025). Finally, the hindcast-trained statistical model is used to produce an ensemble of projections of ESS changes based on 17 GCMs from CMIP6. The different components and steps involved in the workflow are further elaborated in the following sections.
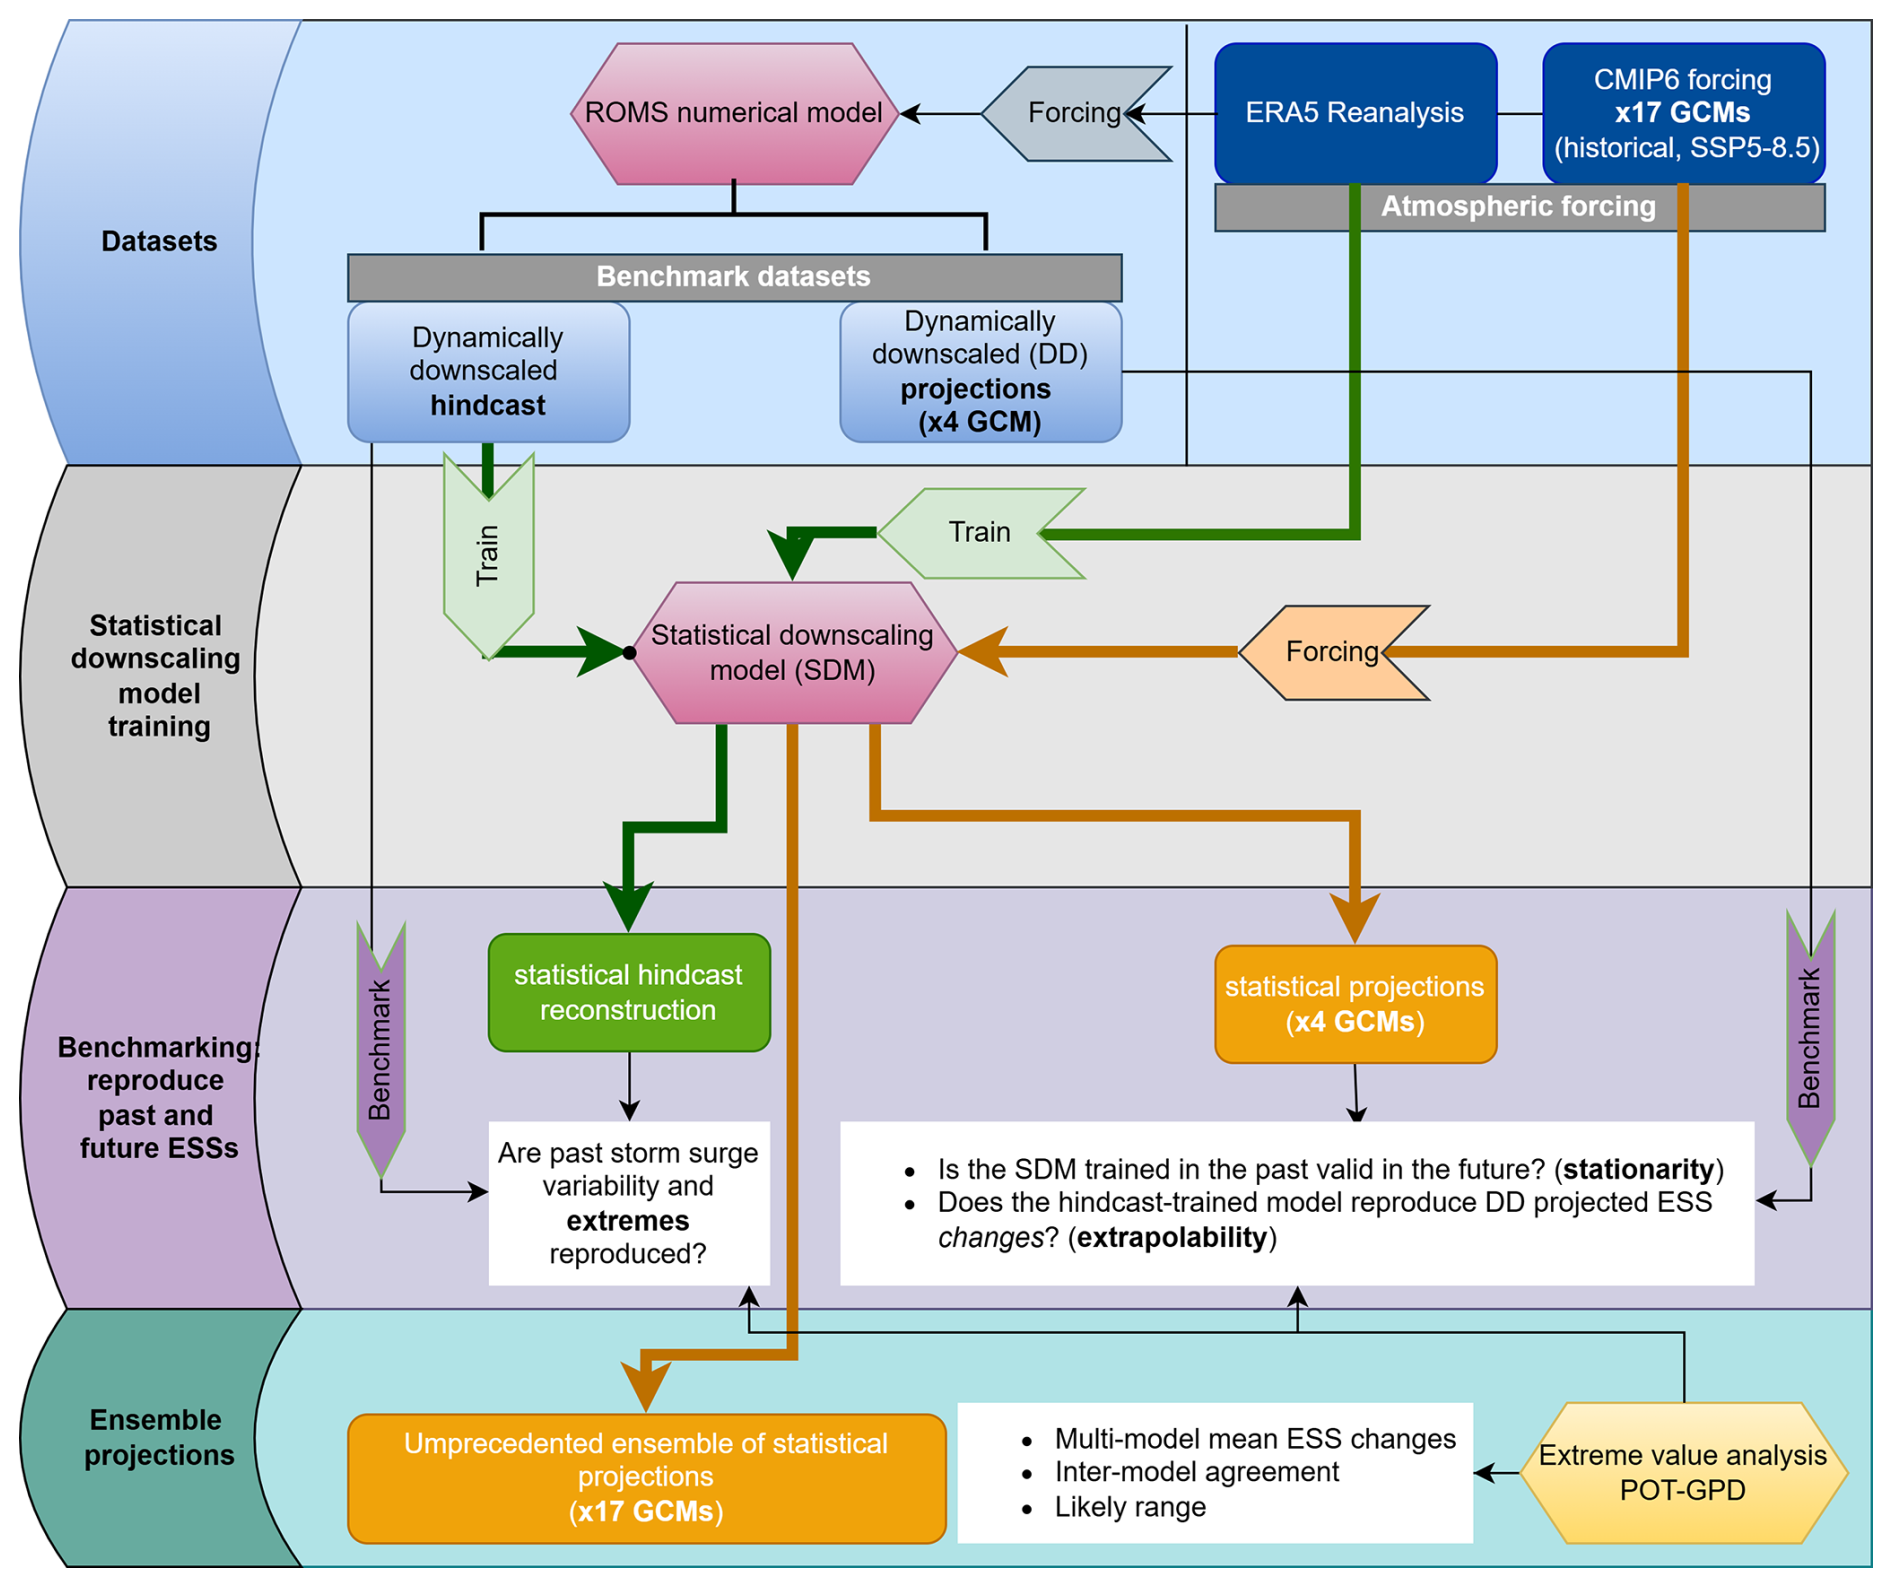
Figure 1General workflow of the study, including the atmospheric forcings and benchmark datasets, definition and training of the statistical downscaling model (SDM), benchmarking of the statistical model for projections of extreme storm surge (ESS) changes, and application of the model for ensemble ESS change projections based on 17 Global Climate Models (GCMs).
2.2 Training and benchmark datasets
In this study, the role of the dynamical downscaling model (hydrodynamic storm-surge model) is to generate the training and benchmark datasets for the statistical model. Accordingly, the hydrodynamic model description and validation are intentionally limited in scope, focusing on documenting the hydrodynamic framework and assessing its ability to provide a suitable benchmark representation of storm-surge variability and extremes, rather than at presenting or exhaustively calibrating the numerical storm-surge model. The hydrodynamic model is based on the Regional Ocean Modelling System (ROMS) (Shchepetkin and McWilliams, 2005) in barotropic mode (2D). Based on the configuration developed by Cid et al. (2014), the model was implemented over a pan-European domain using an orthogonal grid, with a horizontal resolution ranging from 5 to 11 km, comprising a total of 272 382 grid points, and with bathymetry based on the ETOPO1 1 arcmin dataset (Amante and Eakins, 2009). The model is forced by fields of meridional and zonal winds at 10 m (U10, V10) and surface atmospheric pressure (SLP), and the inverse barometer effect is included as storm-surge open boundary conditions. Astronomic tides are not included in the configuration, and hence non-linear tide-surge interactions (e.g., Jenkins et al., 2025) are not resolved. Bottom stress is given by a quadratic bottom drag coefficient of 10−4 and the horizontal viscosity is set using a lateral harmonic constant mixing coefficient of 500 m2 s−1. The wind stress is calculated following Wu (1982), an empirical formula that linearly relates the wind-stress coefficient to the wind velocity. For computational speedup, we analyze storm-surge outputs at one in every 10 coastal points (every 50–100 km, ∼600 coastal points in total).
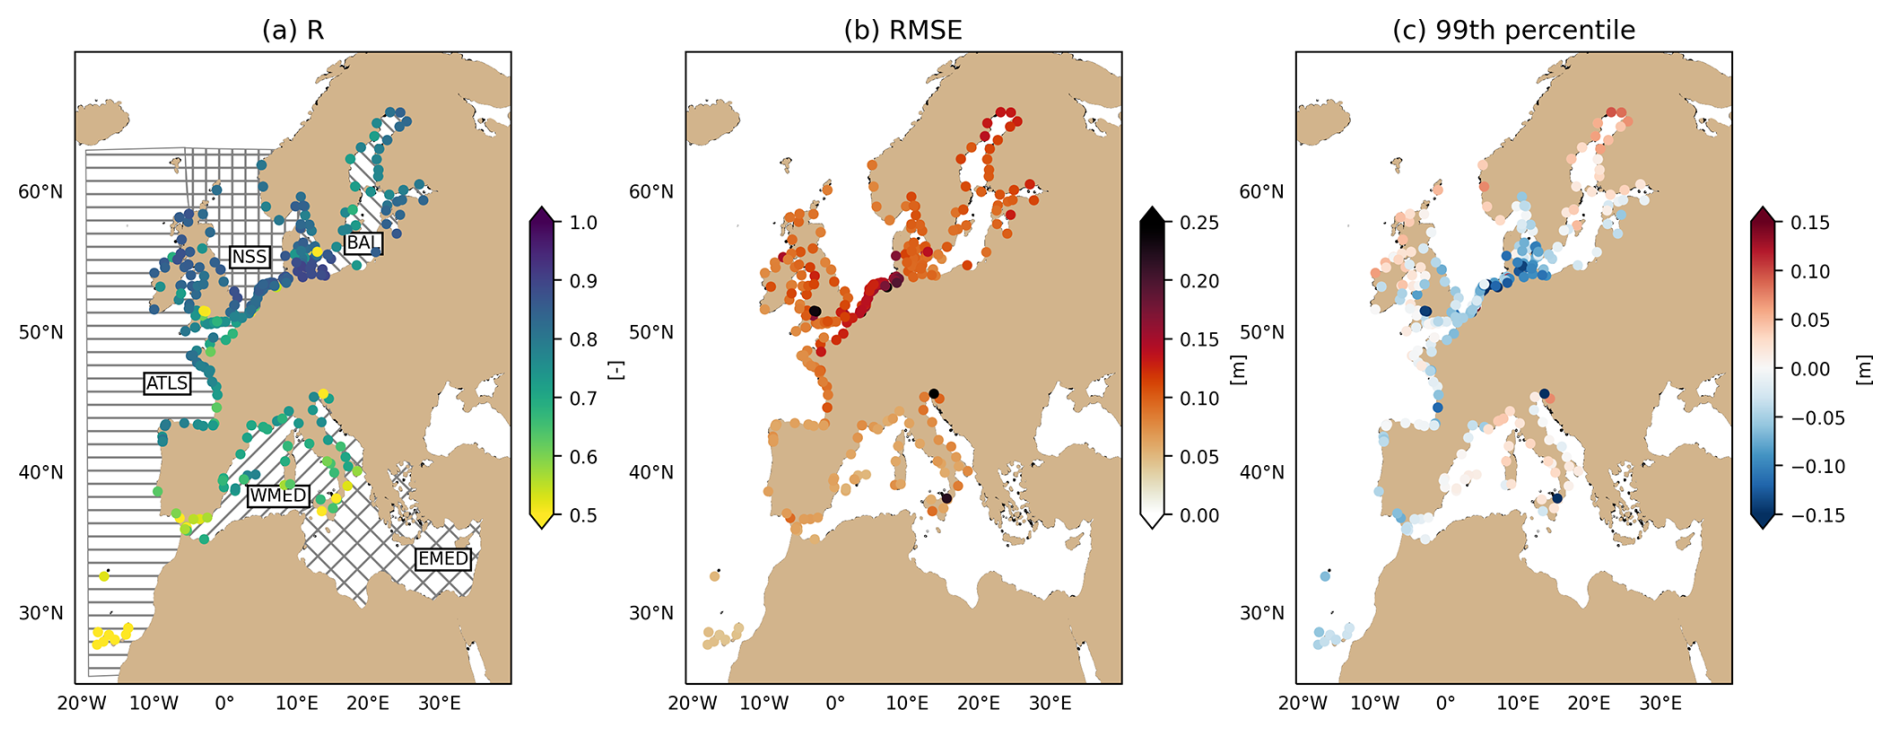
Figure 2Performance of the dynamically downscaled storm-surge hindcast against non-tidal residuals from GESLA3 tide-gauge observations (Haigh et al., 2023) for 1997–2015. (a) Pearson correlation coefficient (R). (b) Root mean square error (RMSE). (c) 99th percentile error. GESLA3 storm surge has been extracted after yearly tidal analysis (considering a minimum of 80 % coverage for each year) and is computed relative to the annual mean sea level (detrended). Stations with at least 4 years at the assessed period are retained, and statistics are evaluated only at valid observation timestamps. EMED: Eastern Mediterranean Sea; WMED: Western Mediterranean Sea; BAL: Baltic Sea; NSS: North Sea; ATLS: Atlantic Shelf.
For the hindcast simulation used to train the statistical model, we force the hydrodynamic model with ERA5 instantaneous hourly wind and atmospheric fields for the period 1997–2021. The dynamically downscaled hindcast demonstrates satisfactory agreement with the storm surges observed in the GESLA3 tide-gauges (Fig. 2; see caption for processing details), yielding mean correlation (Fig. 2a). and RMSE (Fig. 2b) values of 0.76 and 10 cm, respectively. Correlations are lower than average for the southern part of the domain, which probably reflects the contribution of baroclinic processes to the non-tidal residual in tide-gauges (García et al., 2006; Mohamed and Skliris, 2022), which is not captured in the 2D barotropic model. RMSEs are higher than average in the North Sea (15 cm), which is expected given the larger storm surge amplitudes in the region (Calafat and Marcos, 2020; Pineau-Guillou et al., 2023). The correlation and RMSE spatial patterns and values reported for the dynamical model are comparable to those reported for other European barotropic hydrodynamic models (Agulles et al., 2024; Cheynel et al., 2025a; Fernández-Montblanc et al., 2020). The hindcast simulation shows a general tendency for underpredicting high storm surges (mean −3 cm), again most pronounced around the North Sea (−10 cm, Fig. 2c). The reported underestimation of high storm surges is also a well-documented limitation in similar hydrodynamic model simulations (Chaigneau et al., 2024; Cheynel et al., 2025a; Fernández-Montblanc et al., 2020), which is likely attributable to inaccuracies in the representation of storm events in the atmospheric forcing data (Irazoqui et al., 2023). Based on these findings, we conclude that the simulated hindcast shows a sufficiently high skill in reproducing storm-surge variability and extremes to serve as training for the statistical downscaling model, though the systematic underprediction relative to observations should be considered when interpreting projections of both dynamical and statistical models.
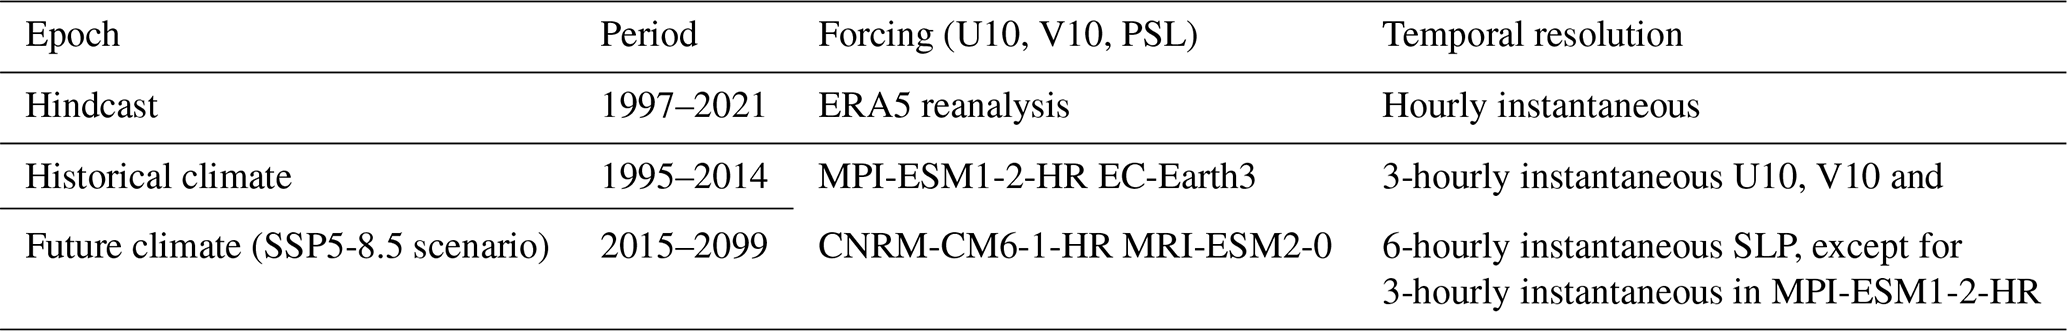
In addition to the storm surge hindcast – which reproduces past storm surge conditions around European coastlines – we produce an ensemble of historical and future storm surge conditions by forcing the dynamical downscaling model with 4 CMIP6 models (Table 1), used as benchmark for the statistical downscaling model under climate forcing.. Future projections are based on an intensive fossil fueled socio-economic development with high future emissions (SSP5-8.5, Shared Socioeconomic Pathway 5, radiative forcing of 8.5 W m2 by 2100, Meinshausen et al., 2020). It is noteworthy that the temporal resolution of the climate forcing (3–6 hourly) is coarser than that used for the hindcast, which may affect the representation of extremes in the projections.
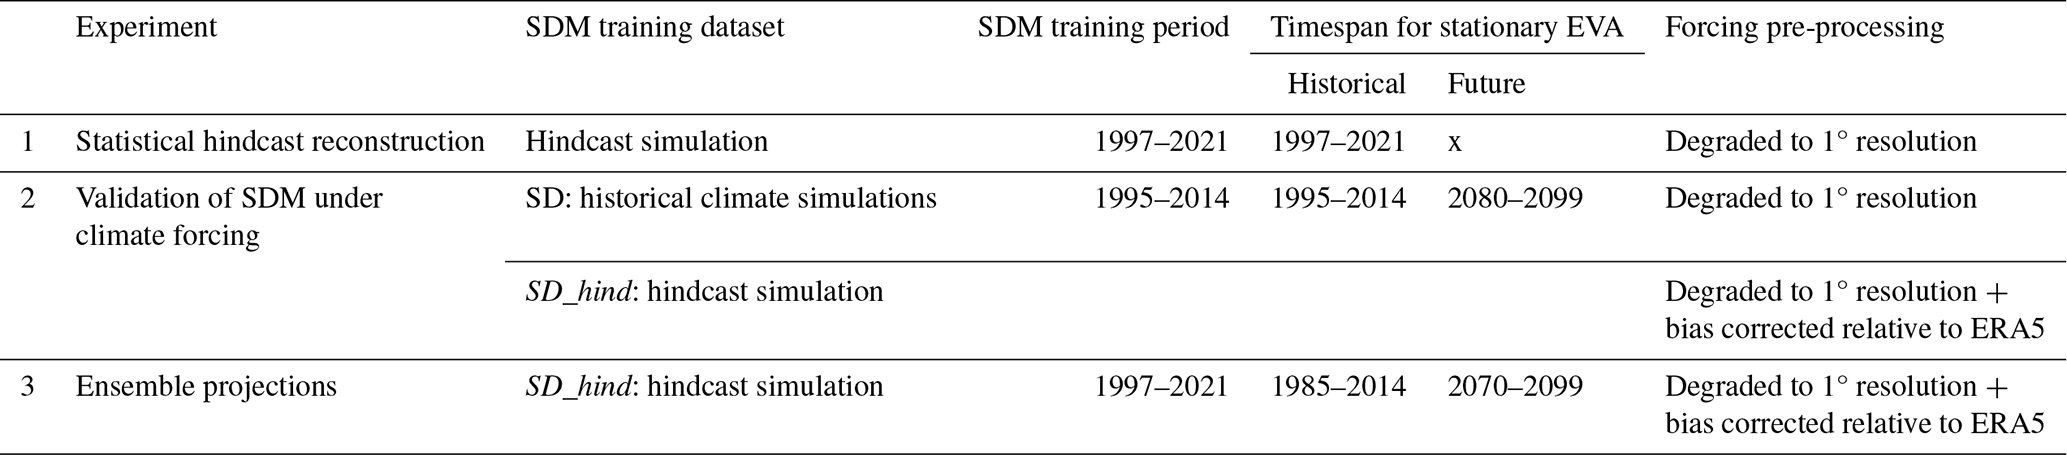
Table 1Simulations performed with the dynamical downscaling model and corresponding time coverage and forcing models. The global circulation models (GCMs) are part of CMIP6. Model horizontal resolutions for the CMIP6 GCMs are presented in Table S1 in the Supplement. No specific preprocessing is performed for the forcing of the dynamical simulations.
2.3 Statistical downscaling model
Following our goal to study storm-surge extremes, we build a statistical downscaling model based on multiple linear regression to establish a relationship between the dynamically downscaled daily maxima storm-surge at each target coastal location (predictand) and daily aggregated forcing atmospheric fields (SLP, U10, V10) in a region of influence around each coastal point (predictors). We target daily maxima to represent event-scale storm-surge extremes, retaining synoptic variability while reducing temporal dimensionality, as commonly done in previous statistical storm-surge downscaling studies employing multiple linear regression (e.g., Cid et al., 2017; Tadesse et al., 2020; Tausía et al., 2023). We consider a temporal lag of up to two days between predictors and predictand, given the beneficial impact shown by Tadesse et al. (2020) in the European region. Principal component analysis (targeting a 99 % of explained variance) is employed to reduce the high dimensionality of the predictors to lighten and stabilize the subsequent regression, as orthogonal principal components inherently minimize multicollinearity. The procedure is applied once to a single matrix in which all predictors are concatenated, including all variables, spatial locations, and time lags. To avoid dominance by variables with larger variance, predictors are standardized prior to principal component analysis by removing their mean and scaling them by the temporal standard deviation, with no additional weighting. We henceforth refer to such a statistical model as SDM.
To enable the application of our SDM across CMIP6 forcings with varying spatial resolutions, all atmospheric input fields – including ERA5 reanalysis – are remapped to a uniform spatial resolution of 1°. This preprocessing step ensures consistency in spatial resolution across training and application datasets. Notably, when trained on the hindcast simulation, the SDM learns to relate coarsened atmospheric predictors to storm surges generated using high-resolution ERA5 forcing (0.25°). Consequently, when applied to 1° CMIP6 predictors, the SDM may partly reflect differences between storm-surge responses linked to coarse and higher-resolution atmospheric forcing through the learned regression relationships.
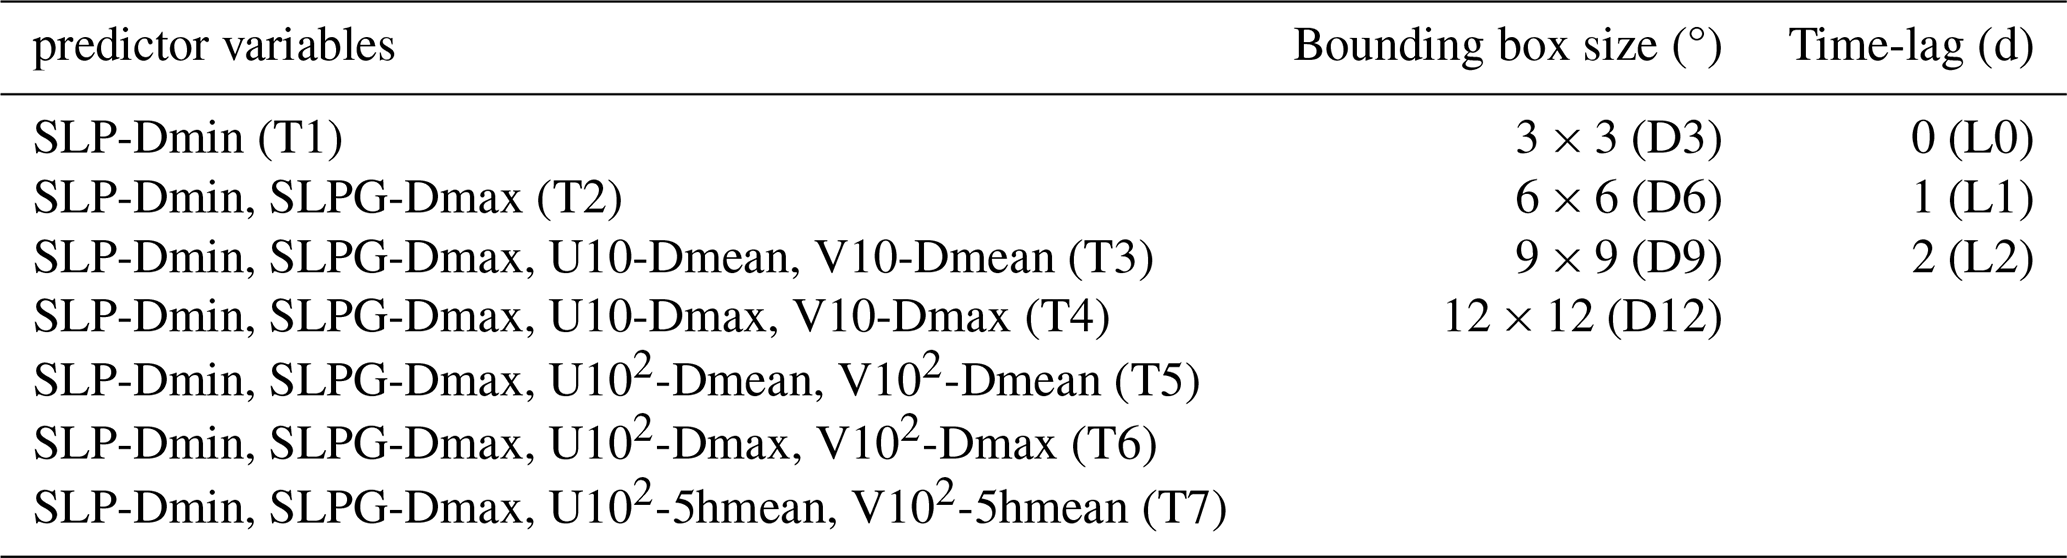
First, an SDM selection phase is conducted to identify the optimal SDM configuration for the representation of daily maxima storm-surge along the European coastline, based on the SDM skill to reconstruct the hindcast simulation under ERA5 forcing degraded to 1°. The objective is to select a single configuration that delivers optimal performance at the European scale and can subsequently be used for European-scale ESS projections. Different configuration choices and predictor variables (Table 2) are tested. We aim for best overall performance at the least possible complexity (and computational cost), indicated by the resulting number of principal components. In terms of predictors, we consider sets of increasing complexity: we start from daily minima atmospheric pressure – SLP – representing the inverse barometer effect (T1); we then add the daily maximum squared atmospheric pressure gradient – SLPG – as a proxy for geostrophic winds (Rueda et al., 2016) (T2); finally, as surface winds may substantially deviate from geostrophic balance even at 1° resolutions (Pyykkö and Svensson, 2023), we also account for the influence of zonal and meridional near-surface winds (U10, V10), considering both daily mean and daily maximum values (T3 and T4, respectively), as well as their squared counterparts (U102, V102), represented by T5 (daily mean) and T6 (daily maxima). Squared wind components capture the nonlinear effects associated with wind stress, which was shown to reduce biases on the statistical estimation of ESSs compared to linear winds in Europe (Harter et al. 2024). We explore both daily maximum and mean wind speeds to reflect different physical contributions to storm surge development – instantaneous wind stress for peak-driven surges, and integrated wind forcing for more gradual surge buildup. As a last experiment, we explore an intermediate option between daily mean and maxima squared winds, where the mean over the 5 h centered at the time of maximum winds is considered (T7). In terms of configuration choices, we test predictor fields in boxes of 3, 6, 9 and 12° (D) centered at each coastal point, and for 0,1 and 2 d of lag (L) in the predictors. Lagged predictors allow the model to recognize multi-day storm dynamics, including slow-moving or pre-conditioning events that influence surge magnitude.
Table 2Options for the SDM configuration tested. Predictors include: sea-level pressure – SLP, sea level pressure gradient squared -SLPG, zonal and meridional winds at 10 m-U10, V10 – and corresponding squared values (U102,V102). Time aggregations: daily minima (Dmin), daily maxima (Dmax), daily mean (Dmean) and 5 h mean around the time of maximum daily wind (5hmean).
We evaluate the SDM for the configurations summarized in Table 2, Table 2 using ERA5 forcings and the hindcast data (1997–2021, 25 years). We evaluate performance through a k-fold cross validation, using 5 folds or splits (5 years), whereby the model is trained for k−1 folds at a time and tested on the remaining fold. The test folds, representative of the SDM performance for independent data, are finally combined into a complete time-series for 1997–2021. We evaluate standard metrics over the whole time-series (root mean squared error -RMSE, Pearson correlation coefficient – R) as well as the mean bias (MB) for the tail of the distribution (>99th percentile) to quantify performance for high storm surges. Coefficient-level significance filtering is not applied; robustness is instead sought through the assessment of a large set of configurations, acknowledging that some residual unnecessary complexity may remain.
Average performance metrics across all coastal points (Fig. 3a–c) indicate a general improvement in the SDM skill with increasing domain size (D), inclusion of temporal lags (L), and predictor complexity (T). Overall, the SDM achieves high correlations (>0.74) and low RMSE values (<0.08 m) across all configurations. However, for high storm surge values (Fig. 3c), a systematic underprediction bias is observed.
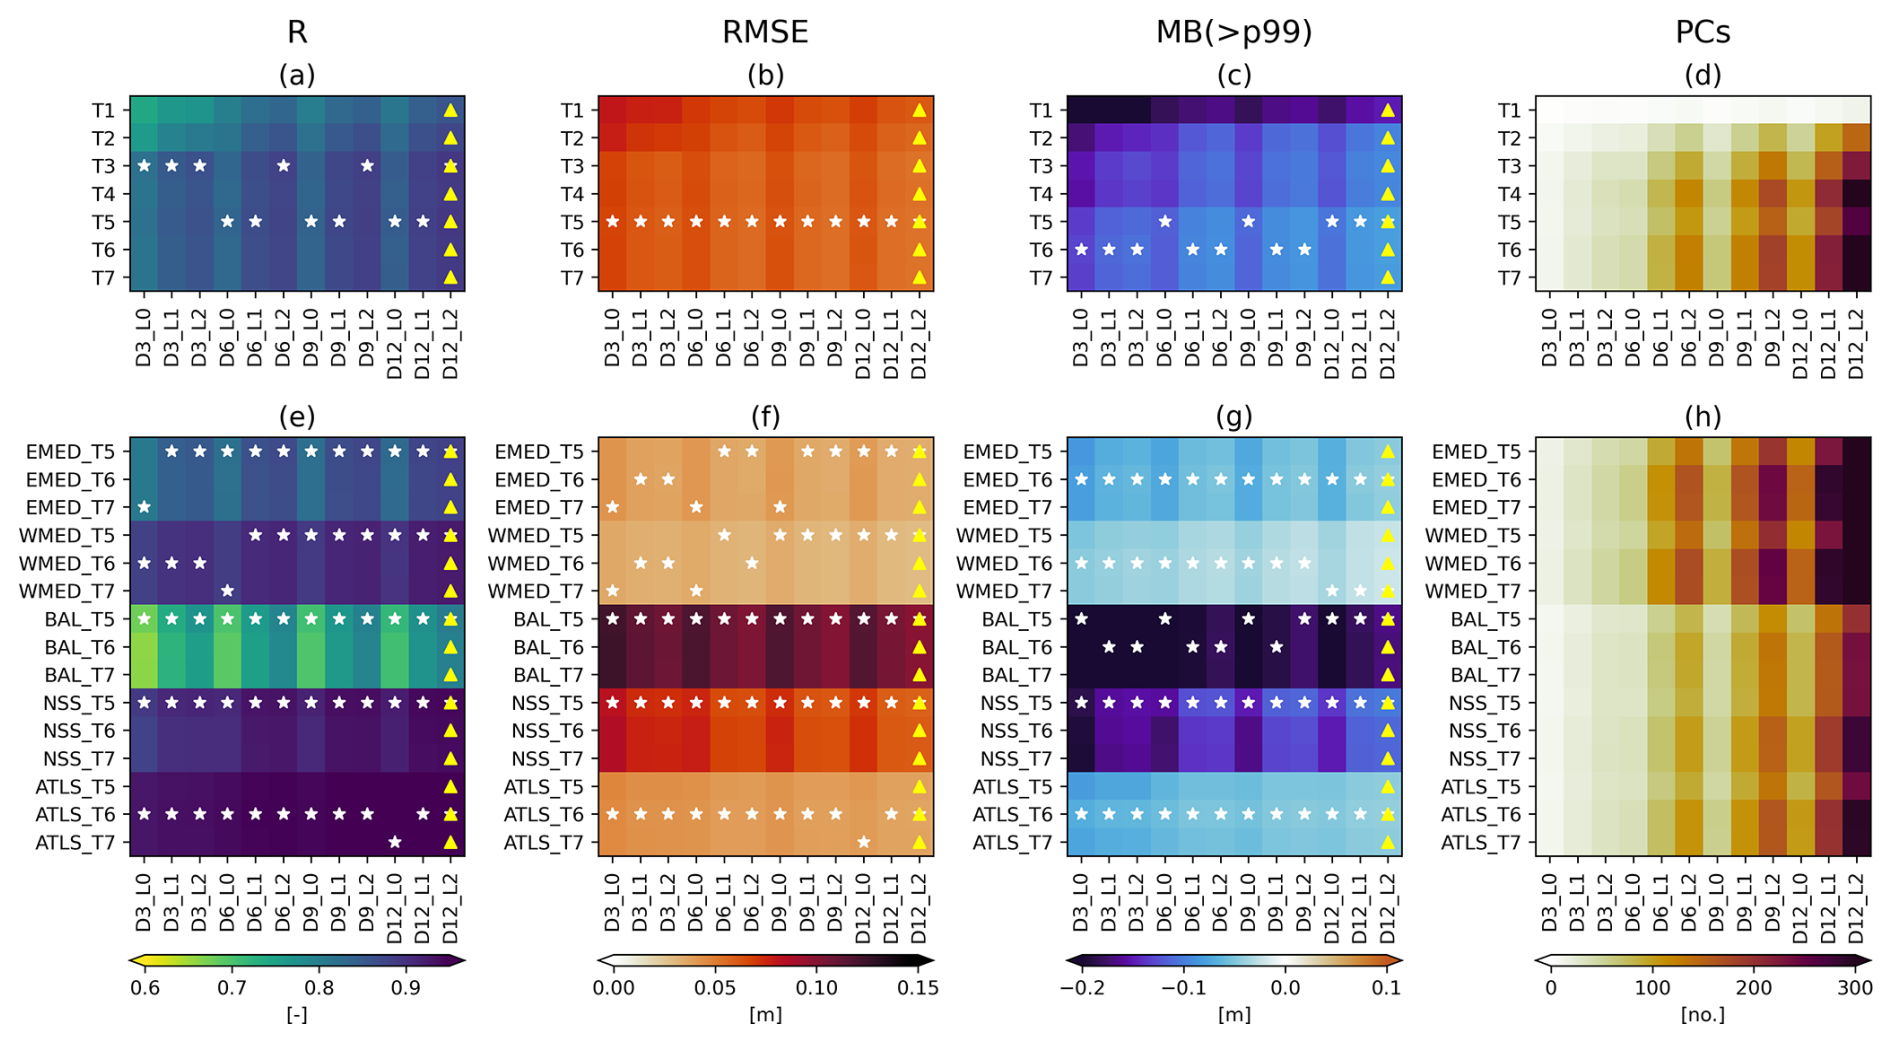
Figure 3Performance of the statistical downscaling model (SDM) for the reconstruction of storm-surges from the hindcast simulation for the different configuration choices in Table 2. (a–d) Metrics averaged over Europe; (e–h) Metrics averaged over the following sub-regions: EMED – Eastern Mediterranean Sea; WMED – Western Mediterranean Sea; BAL – Baltic Sea; NSS – North Sea; ATLS – Atlantic Shelf. See Fig. 2 for the definition of the geographical coverage of each region. Metrics are derived over the 1997–2021 statistically downscaled daily maxima storm surge, reconstructed piece-wise for data independent from training following a k-fold approach. R – Pearson correlation coefficient, RMSE-root mean square error, MB (>p99) – mean bias for the series above the 99th percentile. PCs – number of resulting principal components. For each performance metric, white starts indicate best set of predictors (T) for each configuration (domain size – D, time lag – L, horizontal axis), and yellow triangles best configuration for each set of predictors per domain (vertical axis).
Performance gains associated with larger D, longer L, and more complex T are attributed to both more informative predictors and a greater number of principal components (PCs) retained in the model (Fig. 3d), which increase the degrees of freedom available for regression. This improved flexibility, however, comes at the cost of added computational complexity and a heightened risk of overfitting.
Certain configurations emerge as particularly beneficial. A domain size of at least 6° (D2) and the inclusion of a minimum 1 d lag (L1) significantly enhance performance across predictor sets and evaluation metrics. Predictor-wise, the addition of wind variables (T>2) markedly improves correlation and RMSE, demonstrating their added value relative to the purely geostrophic information contained in SLP gradients. While performance under normal conditions appears insensitive to further predictor complexity, high surge events show notable bias reductions when squared wind terms (T>4) are included – consistent with findings by Harter et al. (2024). However, for T>4, no single predictor set emerges as the best-performing option for Europe as a whole and across configurations and metrics.
A regional decomposition of model skill using T>4 (Fig. 3e–g, see Fig. 2 for geographic regions) reveals strong spatial variability. Considering characteristic regional storm-surge variance (i.e., normalizing RMSE and MB, not shown), the SDM performs best along the Atlantic façade (ATLS), North Sea (NNS), and western Mediterranean (WMED), while performance is weaker in the eastern Mediterranean (EMED) and especially in the Baltic Sea (BAL). In these lower-performing regions, temporal lag proves critical; performance improves substantially with lags up to two days. Although increasing the domain beyond 9° yields minimal benefit, it significantly increases computational cost. Performance differences between T5, T6 and T7 are negligible; T5 is therefore favoured due to its lower complexity, which allows comparable skill to be achieved with fewer retained principal components, suggesting a more stable and less noise-dominated representation of variability.
Based on these findings, the configuration T5–D9–L2 is selected as the optimal model at European scale, balancing accuracy, complexity, and computational efficiency. This configuration yields average correlation, RMSE, and MB values of 0.89, 5.5, and 8.6 cm, respectively, which is comparable to other state-of-the-art data-driven reconstructions in Europe (e.g., Tadesse et al., 2020). A more detail evaluation of the capability of the SDM to reconstruct past storm surges, and particularly their extremes – which informs on the confidence for projections – is provided in the Results Sect. 3.1.
2.4 Extreme Value Analysis
ESSs in past and future climates are analyzed through stationary-on-slice extreme value analysis (EVA). We fit a Generalized Pareto Distribution (GPD) on the daily-maxima storm-surges that exceed a threshold (known as the Peak Over Threshold method, POT). The selected threshold was based on an average rate of 5 extreme events per year in the considered time-slice, which corresponds to the 99.14th percentile in average across Europe for the hindcast simulation (1997–2021). Events are considered independent when separated by at least 3 d, considered the approximate time most storm events influence water levels at the coast (Wahl et al., 2017) and typically employed in extreme value analysis in Europe (Chaigneau et al., 2024; Haigh et al., 2016; Vousdoukas et al., 2016). GPD parameters are estimated using maximum likelihood estimation. Confidence intervals are derived using a mean-adjusted bootstrap (Efron and Tibshirani, 1994), based on 600 resamples, and reported at the 5–95th percentile levels.
The periods used for the stationary-on-slice EVA range from 20 to 30 years, depending on the experiments at hand (e.g. validation against dynamical projections, ensemble projections), which are further elaborated on the following Sect. 2.5 (Table 3). Across all experiments, the suitability of the extreme-value model is assessed using the Anderson–Darling test at the 0.05 significance level. Both GPD and exponential distributions were evaluated. Results (not shown) indicate that the GPD provides a more robust fit across European coastlines, whereas the exponential distribution is frequently rejected over large coastal stretches for multiple climate models, in both historical and future periods, and for both dynamically and statistically downscaled datasets.
Accordingly, the GPD is adopted consistently across datasets and climates, with the shape parameter allowed to vary between periods. Sensitivity tests in which the future-period GPD shape parameter was fixed to its historical value resulted in widespread rejection by the Anderson–Darling test and were therefore not retained. While allowing the shape parameter to vary increases uncertainty in high return-level estimates compared to an exponential fit – potentially reducing the detectability of future changes – our tests indicate that this flexibility is required for an adequate representation of extremes. Under the retained distribution (GPD with freely varying shape), shape parameter estimates have been inspected and show to be stable across experiments, GCMs, and epochs, with predominantly negative values (except in the Canary Islands) and absolute magnitudes below 0.5.
2.5 Experimental design
The general workflow for the training and application of the selected SDM (Sect. 2.3) for ESS climate projections is outlined in Fig. 4, and the different experiments performed following this workflow are elaborated in Table 3.
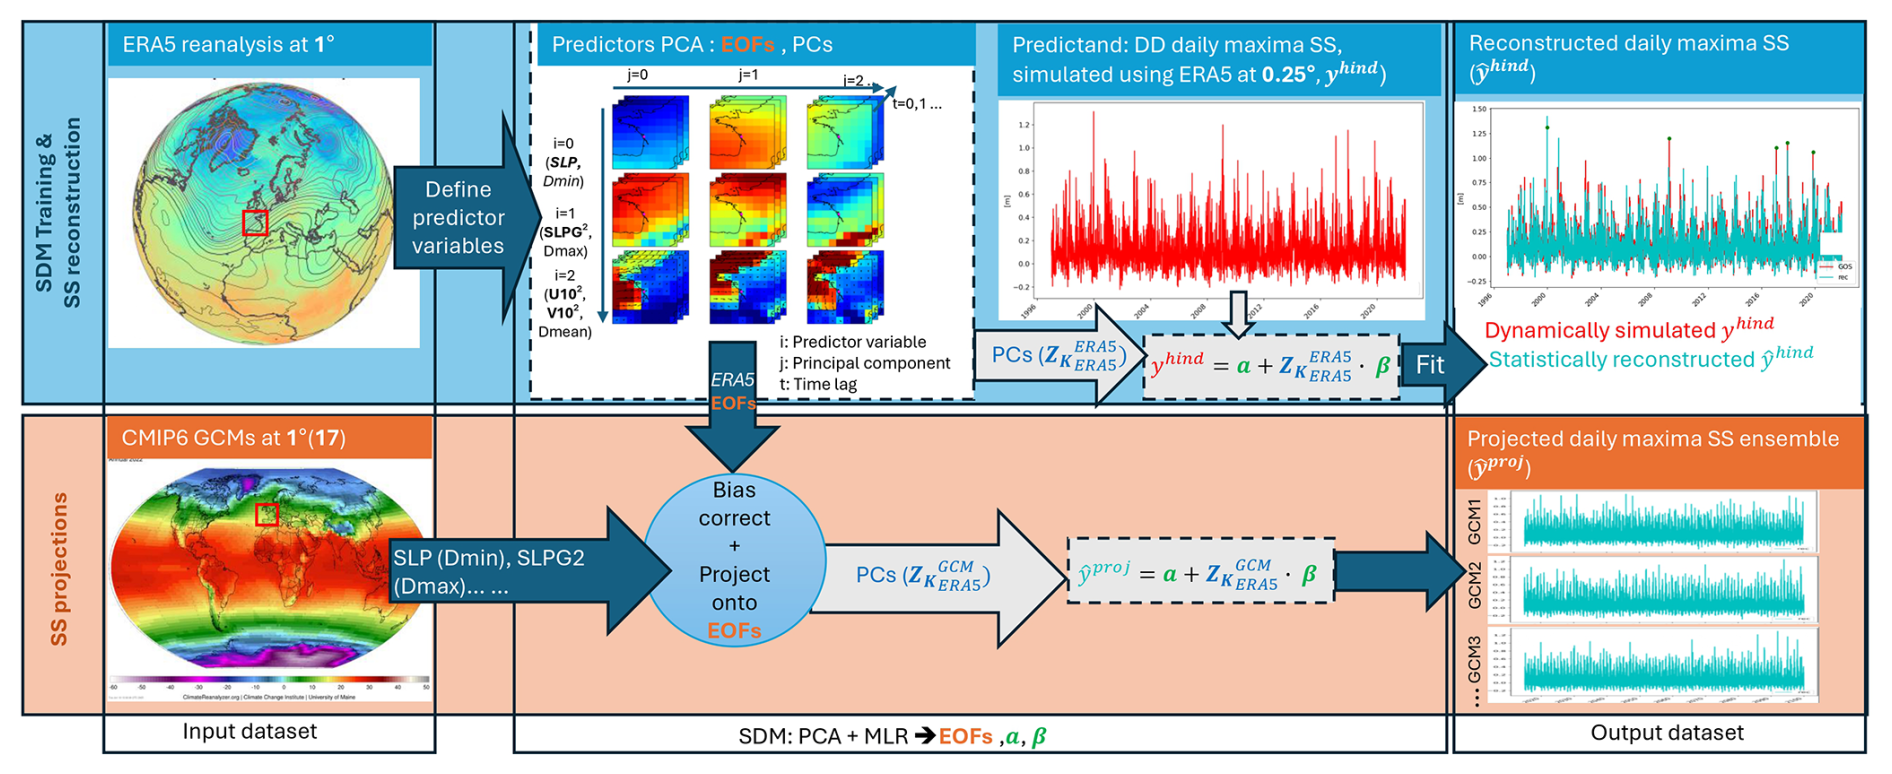
Figure 4Workflow followed for the training and application of the statistical downscaling model (SDM) projections of daily maxima storm surges (SS, represented by y), illustrated for La Rochelle, France. Predictor atmospheric variables are those corresponding to the chosen configuration T5 defined in Table 2. The SDM is trained on the dynamical downscaling model hindcast simulation outputs (yhind), forced by the ERA5 reanalysis. The SDM is defined by the empirical orthogonal functions (EOF) – extracted through principal component analysis (PCA) and representing the dominant modes of variability in the atmospheric fields around the target coastal point – and the linear regression coefficients (a, β) derived from multiple linear regression (MLR) between the principal component series () and yhind. SDM based reconstructions () successfully reproduce the hindcast outputs (yhind). Once these SDM elements are defined, global climate model (GCM) atmospheric fields from CMIP6 interpolated at 1° are projected onto the EOFs () and combined through the regression coefficients to produce storm-surge projections ().
The statistical hindcast reconstruction (experiment 1) is produced by training the SDM over the whole available period (1997–2021). It is used to evaluate the capability of the model to represent ESSs, which was not explicitly evaluated during the SDM model selection. Such an analysis will inform on the confidence associated with the statistical projections in relation to the underlying statistical model, aside from stationarity and extrapolability aspects.
For statistical projections for validation of the hindcast-trained SDM (SD_hind in Table 3) under climate forcing (experiment 2) and subsequent ensemble projections (experiment 3), CMIP6 forcings are bias-corrected relative to the ERA5 reanalysis (both previously remapped to 1° resolutions, see Sect. 2.3) before applied to the SDM by adjusting their mean and standard deviation at each grid cell over the reference period 1995–2014. This step crucially ensures compatibility in magnitude and variance between CMIP6 and ERA5 predictors, and hence a consistent projection of CMIP6 predictors onto the ERA5-based principal components. While the SDM is trained on daily-aggregated data at original 1-hourly resolution (hindcast), the comparison between dynamical and statistically downscaled projections remains internally consistent under the coarser 3-hourly climate forcing, as the statistical model is trained and applied using predictor–predictand datasets at the same temporal resolution, and the impact on the EOFs is expected to be negligible.
As highlighted in Table 3, slightly different protocols are applied for experiments 2 and 3. Particularly for experiment 2, an additional statistical estimate trained on historical simulations (SD in Table 3) is evaluated. The rationale behind each of the experiments, as well as the target diagnostics, are detailed in the following.
Table 3Experiments involved in the validation of the statistical model (SDM) for past and future extreme storm surges (ESSs), and SDM application for ensemble projections of ESS changes. SD and SD_hind refer to statistical projections using an SDM trained in each GCMs historical simulation and the hindcast simulation, respectively. See Sect. 2.5.1 for further details.
2.5.1 Validation under climate forcing
The purpose of these experiments is to evaluate the stationarity of predictor-predictand relationships between periods and the extrapolability of the hindcast-based statistical relationships to climate models, ultimately validating the use of the hindcast-trained SDM for ESS projections. These crucial aspects are evaluated at the level of the storm surge outputs rather than through separate analyses of individual SDM components such as the EOFs or the regression coefficients. This integrated approach allows to propagate stationarity and extrapolability issues across the different parts that compose the SDM (bias correction, EOFs, regression coefficients) and assess their combined effect on the target storm-surges.
To validate the SDM for climate projections, we inter-compare three storm-surge estimates: the dynamically downscaled estimates (DD), the storm surge estimates produced using the SDM trained on the historical dynamical simulation outputs for each GCM (SD), and the storm surge estimates using the SDM trained solely on the hindcast simulation outputs (SD_hind), which include the bias corrections on GCM forcings required for consistent projection of GCM fields onto ERA5-based principal components. The SD estimates will inform on the differences in storm-surge projections incurred by the SDM model alone (and stationarity assumption when evaluated for the future), while the SD_hind estimates will also incorporate differences stemming from the extrapolability assumption. Notably, SD_hind allows to rely on a single dynamically downscaling simulation – the hindcast – as opposed to dynamical downscaling historical simulations for each GCM, as required for SD, which would result costly for large ensembles. We emphasize that the bias correction needed for SD_hind estimates but absent in the other sets (DD, SD) does not impact the validation of the SDM for climate projections, as it has no impact on the two target validation tests (stationarity and reproduction of projected changes).
Since dynamical simulations are available for a limited 20-year period for historical climates, and hence for a fair comparison between SD and SD_hind, we limit the SDM training to 20 years in all experiments exclusively for the validation for historical and future climates: 1997–2016 when trained on the hindcast (SD_hind) and 1995–2014 when trained on the historical simulations (SD). Projections span the period 1995–2099. For validation of projected ESS changes, the periods 1995–2014 and 2080–2099 are analyzed for past (hindcast, historical) and future epochs respectively. As all downscaled estimates (DD/SD/SD_hind) represent the same storm surges under identical forcing and periods, sampling uncertainty is expected to be largely shared across estimates, and model evaluation focuses on point estimates.
Based on these experiments, stationarity and extrapolability are evaluated as follows:
-
Stationarity assumption: We compare the skill of the SDM to reproduce storm surge climates in both historical and future periods when the model is trained exclusively on historical outputs of the dynamical model, either from the hindcast (SD_hind) or from each GCM-specific historical climate simulations (SD). When the skill (Pearson correlation coefficient, RMSE, MB above the 99th percentile) is stable between future and historical periods, the stationarity assumption is validated. We highlight that although the EOFs and regression coefficients are assumed stationary, SDM-based storm-surge estimates can reflect temporal changes in variability and trends through changes in the atmospheric predictors associated with the identified modes of variability.
-
Extrapolability to climate forcing: The combined effect of stationarity and extrapolability are finally assessed through evaluating the ability of the hindcast-trained SDM to capture projected changes in ESSs given by dynamical simulations. Projecting changes in ESSs constitutes the ultimate objective of our study. Projecting relative changes between historical and future periods and then adjusting observational or reanalysis baselines accordingly – called the delta method – is commonly done in climate science to minimize the influence of biases in the GCMs in future projections. As previously highlighted, biases have been corrected for SD_hind (through simple mean bias and variance corrections, for safe projection onto ERA5-based EOFs), but they haven't been corrected for SD and DD estimates. Additionally, even when corrected, biases in extremes have not been explicitly addressed, which may differ from those related to mean conditions. Together, these factors justify our focus on evaluating projected changes of ESSs (future vs. past) instead of directly assessing their future projections in the DD/SD/SD_hind intercomparison.
2.5.2 Multi-model ensemble projections
Finally, the validated SDM is trained on the full available hindcast (1997–2021) and is applied to 17 CMIP6 models following the workflow in to generate an unprecedented ensemble of storm surge projections spanning the 21st century (1970–2099). The CMIP6 models (Table S1) span resolutions between 0.5 and 1.875° and are selected based on the availability of high-frequency atmospheric forcing – 3-hourly instantaneous wind fields and 6-hourly instantaneous mean sea-level pressure – for both the historical period and the target SSP5-8.5 scenario. Besides more comprehensive multi-model means, the expanded ensemble size enables a quantitative assessment of the robustness of projected changes in ESSs, measured in this study by the fraction of models that agree on the sign of change. We define robust changes when models agree in sign (closest estimate to the 80 % ratio used in IPCC AR6). Additionally, our ensemble allows, for the first time, the estimation of a likely range of ESS changes (represented by the 17th and 83rd percentiles) in line with IPCC uncertainty language.
3.1 Statistical hindcast reconstruction
Time series and quantile-quantile plots for the statistical hindcast reconstruction in selected example locations across different European seas (Fig. 5) illustrate the skill of the SDM to accurately reproduce the storm surge signal relative to dynamical simulations. Poorer performance in the representation of general storm surge variability is observed in Antalya and Helsinki (correlations of 0.87 and 0.82 vs. >0.93 in the others), in line with the cross-validation analysis which showed poorer performance in the eastern Mediterranean and the Baltic Sea, respectively (Sect. 2.3). The overall good agreement between statistical and dynamical estimates extends into the extreme tail – represented by the 99–100th percentiles at 0.1-percentile resolution. The Baltic station is the main exception, reflecting a lower SDM skill for extreme conditions in this region. For the largest 5 events in the series (green circles), performance strongly depends on the specific extreme event at hand and is largest for Texel (mean error of −30 cm) and Helsinki (−33 cm). For a thorough evaluation of extreme events across Europe, a dedicated evaluation is carried out next using extreme-value theory.
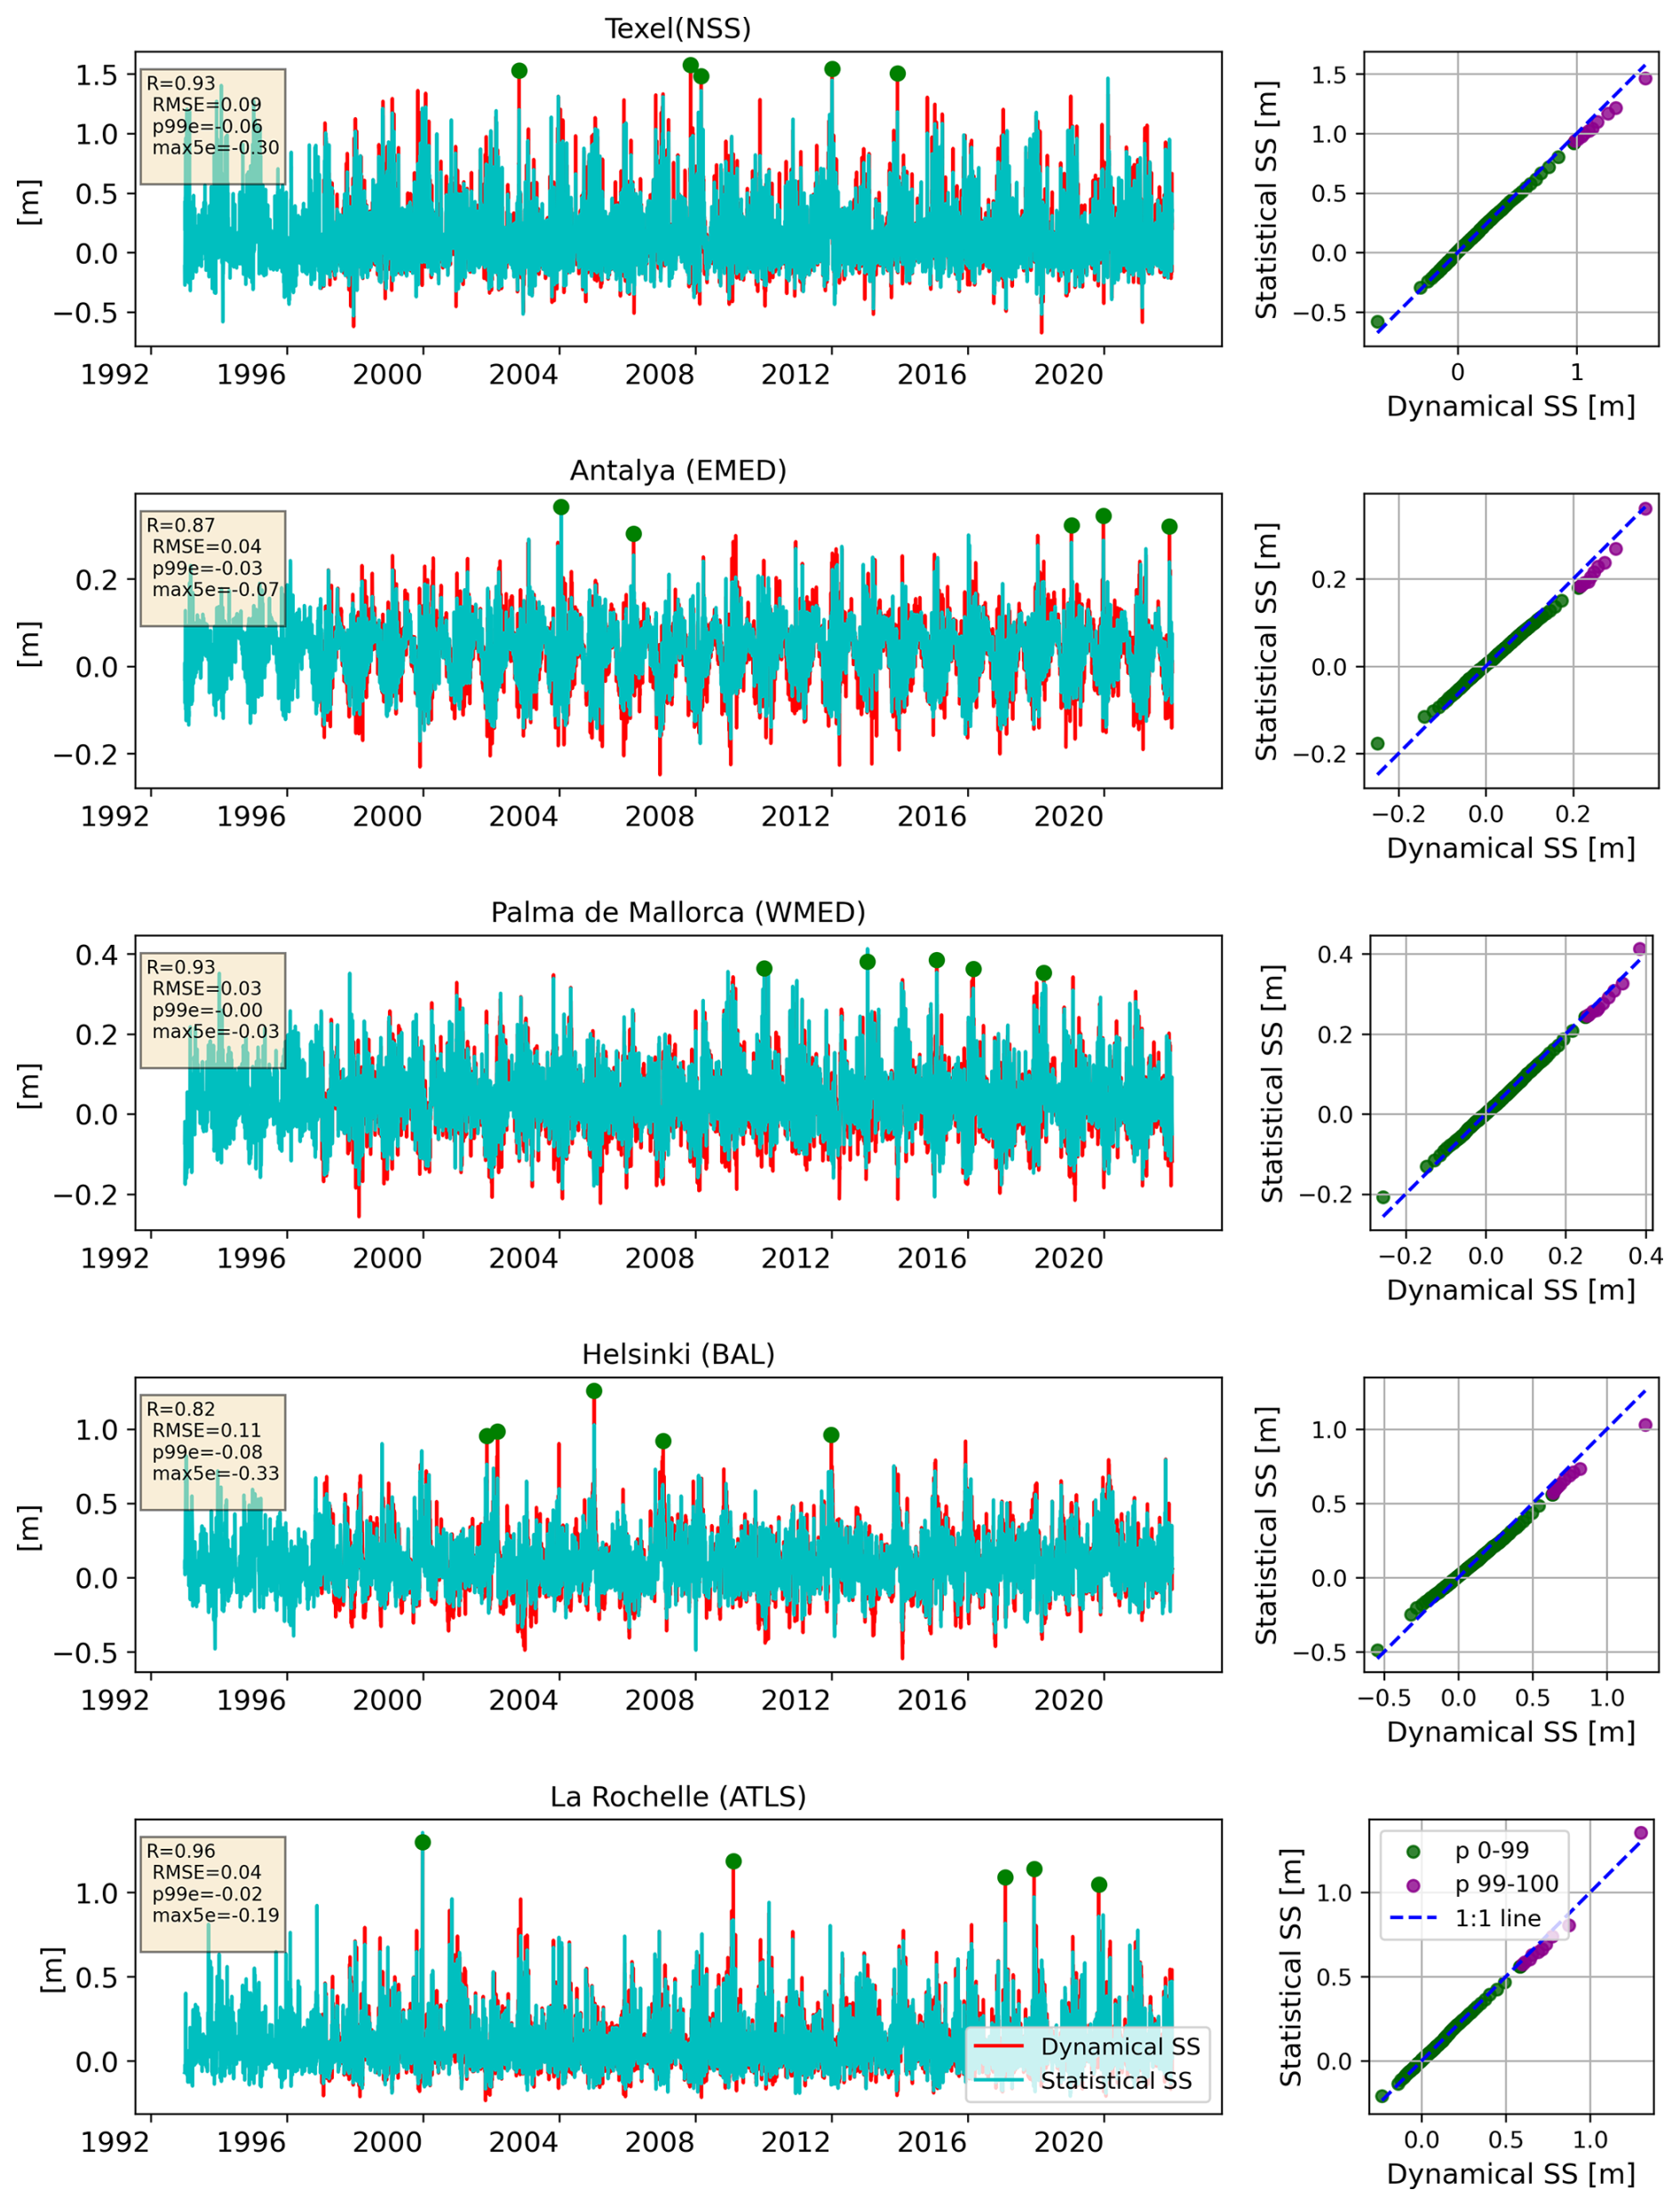
Figure 5Left: Comparison between daily-maxima coastal storm-surge (meters) from dynamical simulations (red, predictand) and the reconstruction using statistical downscaling (blue). The largest 5 events in the predictand are marked with a circle. Right: Quantile-quantile comparison, with percentiles (p) between 0–99 shown in green (1 percentile spacing) and between 99–100 in magenta (0.1 percentile spacing), the latter representing the extremes in the time series. Performance metrics added in boxes on time series plots: R – Pearson correlation coefficient; RMSE – root mean square error; p99e – error in the 99th percentile; max5e – mean error across the 5 largest events (green dots). EMED: Eastern Mediterranean Sea; WMED: Western Mediterranean Sea; BAL: Baltic Sea; NSS: North Sea; ATLS: Atlantic Shelf. See Fig. 2 for the definition of the geographical coverage of each region.
Extremes are evaluated focusing on the SDM skill for the 10-year (RL10) and 100-year (RL100) return levels relative to the dynamical hindcast (Fig. 6) using the chosen EVA method (Sect. 2.4). As suggested by previous results, the SDM systematically underpredicts extremes, except around the Canary Islands and Moroccan Atlantic coast. For the 10-year return level, relative errors average −9 % across Europe, with reduced skill in the Baltic (−13 %; down to −18 % in the southern Gulf of Bothnia), the Adriatic and Aegean Seas (−14 %), and locally along southeastern UK (−20 %). Errors for the 100-year return level show a similar pattern, with a moderate amplification overall (average absolute error change of +2 %) but more pronounced (+7 %–10 %) in the Gulf of Finland, the southern Adriatic sea, the Aegean sea, and around the Canary Islands. As a result, regional boxplots (Fig. 6c) highlight the Baltic and eastern Mediterranean as regions where negative biases reach markedly higher values ( %) for the 100 vs. 10-year return level, reflecting extensive coastal areas with amplified errors for more extreme events. Although errors in statistical estimates of ESSs across Europe remain overall modest (with 90 % of all coastal points exhibiting errors with absolute values smaller than 16 % and 21 % for the 10- and 100-year return levels, respectively), they indicate lower confidence in SDM-based estimates of ESSs for regions such as the Baltic and eastern Mediterranean, and extending to the North Sea for high return periods, which should be considered when interpreting corresponding statistical climate projections. The increase of error for increasing storm surge magnitudes suggests that the storm-surge–predictor relationship departs from linearity between average and extreme conditions. This reflects the ordinary least squares formulation, which optimizes the mean response and leads to heteroscedastic errors for rare extremes; this behaviour is inherent to the methodology and is not expected to change qualitatively when the model is driven by bias-adjusted CMIP6 predictors.
Based on these results, we decide to focus statistical projections in the following to the 10-year storm-surge event to limit the impact of the decreasing SDM performance for high return periods on the confidence of the target statistical ensemble projections.
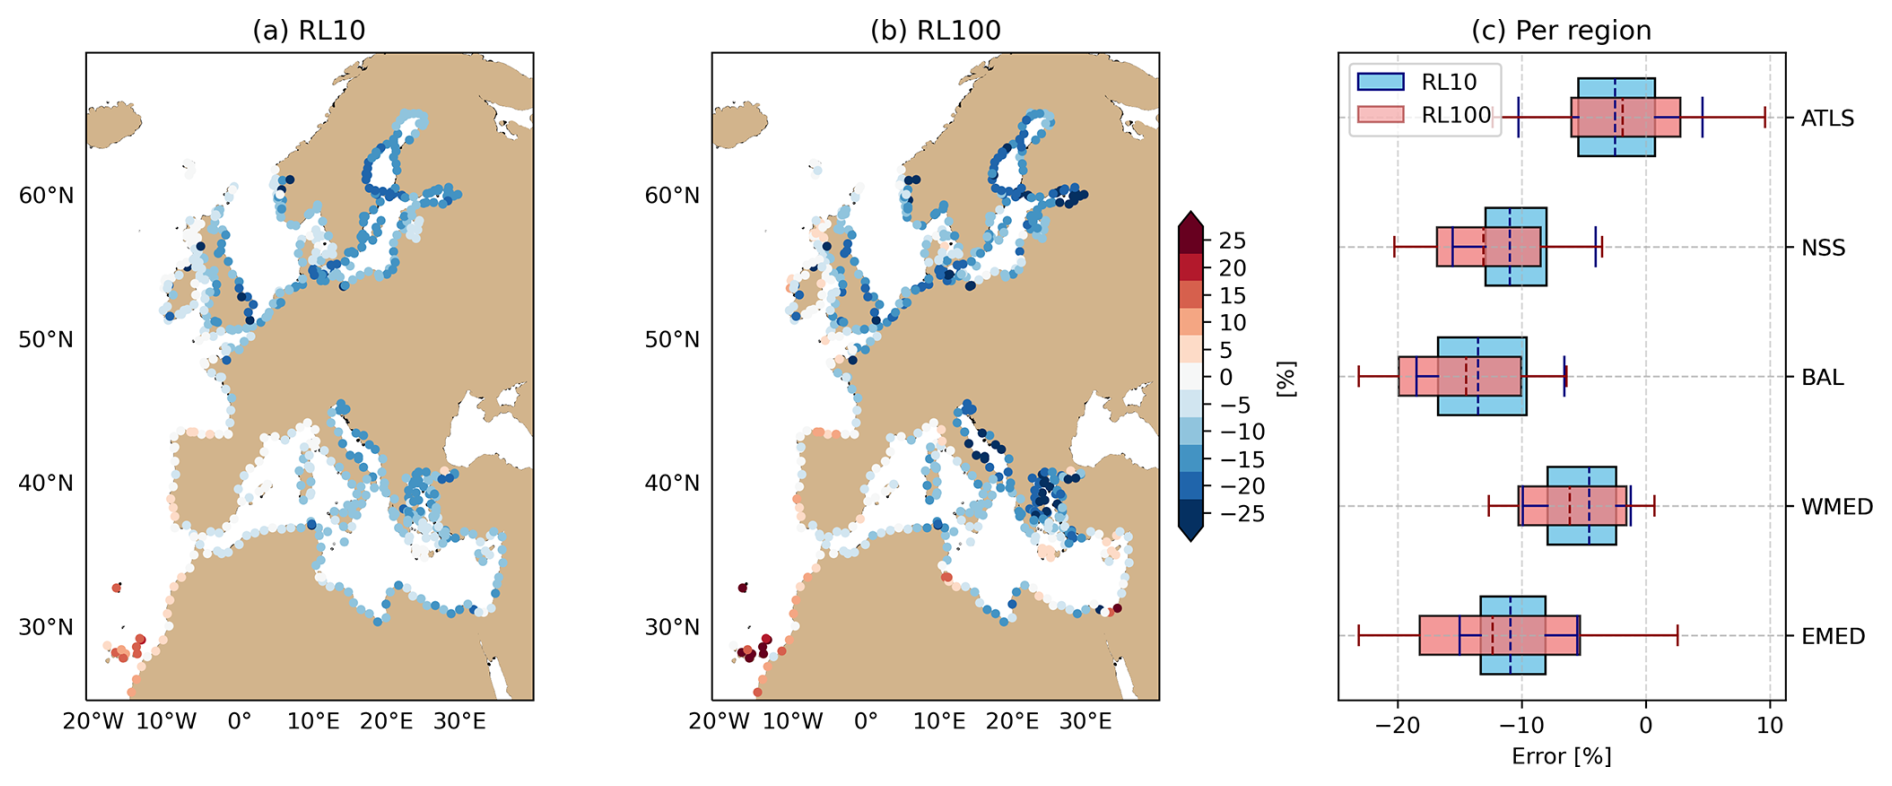
Figure 6Spatial plots of the relative error (%) in the 10-year (RL10, a) and 100-year (RL100, b) return levels between the statistical and the dynamical models, calculated using stationary extreme value analysis over 1997–2021. (c) Corresponding regional box plots, with boxes covering the interquartile range (25–75th percentiles), whiskers extending between the 10–90th percentiles, and dashed lines indicating the median in each region. EMED: Eastern Mediterranean Sea; WMED: Western Mediterranean Sea; BAL: Baltic Sea; NSS: North Sea; ATLS: Atlantic Shelf. See Fig. 2 for the geographical coverage of each region.
3.2 Validation of statistical projections
3.2.1 Stationarity assumption
Following the procedure described in Sect. 2.5.1, stationarity in the predictor–predictand relationship is assessed based on the stability of the SDM skill between historical and future climates.
Regionally aggregated skill metrics (Fig. 7) illustrate that performance metrics for SDM trained on each GCM-specific historical simulations (SD) are very comparable to those seen for the hindcast during SDM selection (Fig. 3). SD_hind performs generally similar to SD, although it exhibits marginally reduced performance in reproducing the dynamically downscaled storm surges for climate simulations, which is consistent with the fact that GCM-specific information was not included in the SD_hind training process. Particularly, the underprediction of high storm surges (>99th percentile, Fig. 7i–l) is systematically more pronounced for SD_hind. This could be the result of the bias correction if predictors in GCMs were systematically biased relative to ERA5 – for instance due to overestimated average wind speeds – producing larger storm surges for GCMs. This is suggested by results in Fig. S1, which show systematically overpredicted ESSs in historical dynamical simulations across GCMs relative to the hindcast simulation, while hindcast-trained SDM estimates show much reduced errors. Nevertheless, when comparing performance metrics between historical and future periods, a remarkably strong stationarity is found for both SD and SD_hind and across performance metrics, with maximum regional absolute differences between periods of 0.02, 0.01 and 0.06 m for correlation, RMSE and MB above the 99th percentile, respectively, across SD and SD_hind estimates. These results support the validity of applying SDMs trained on past conditions to project future climates.
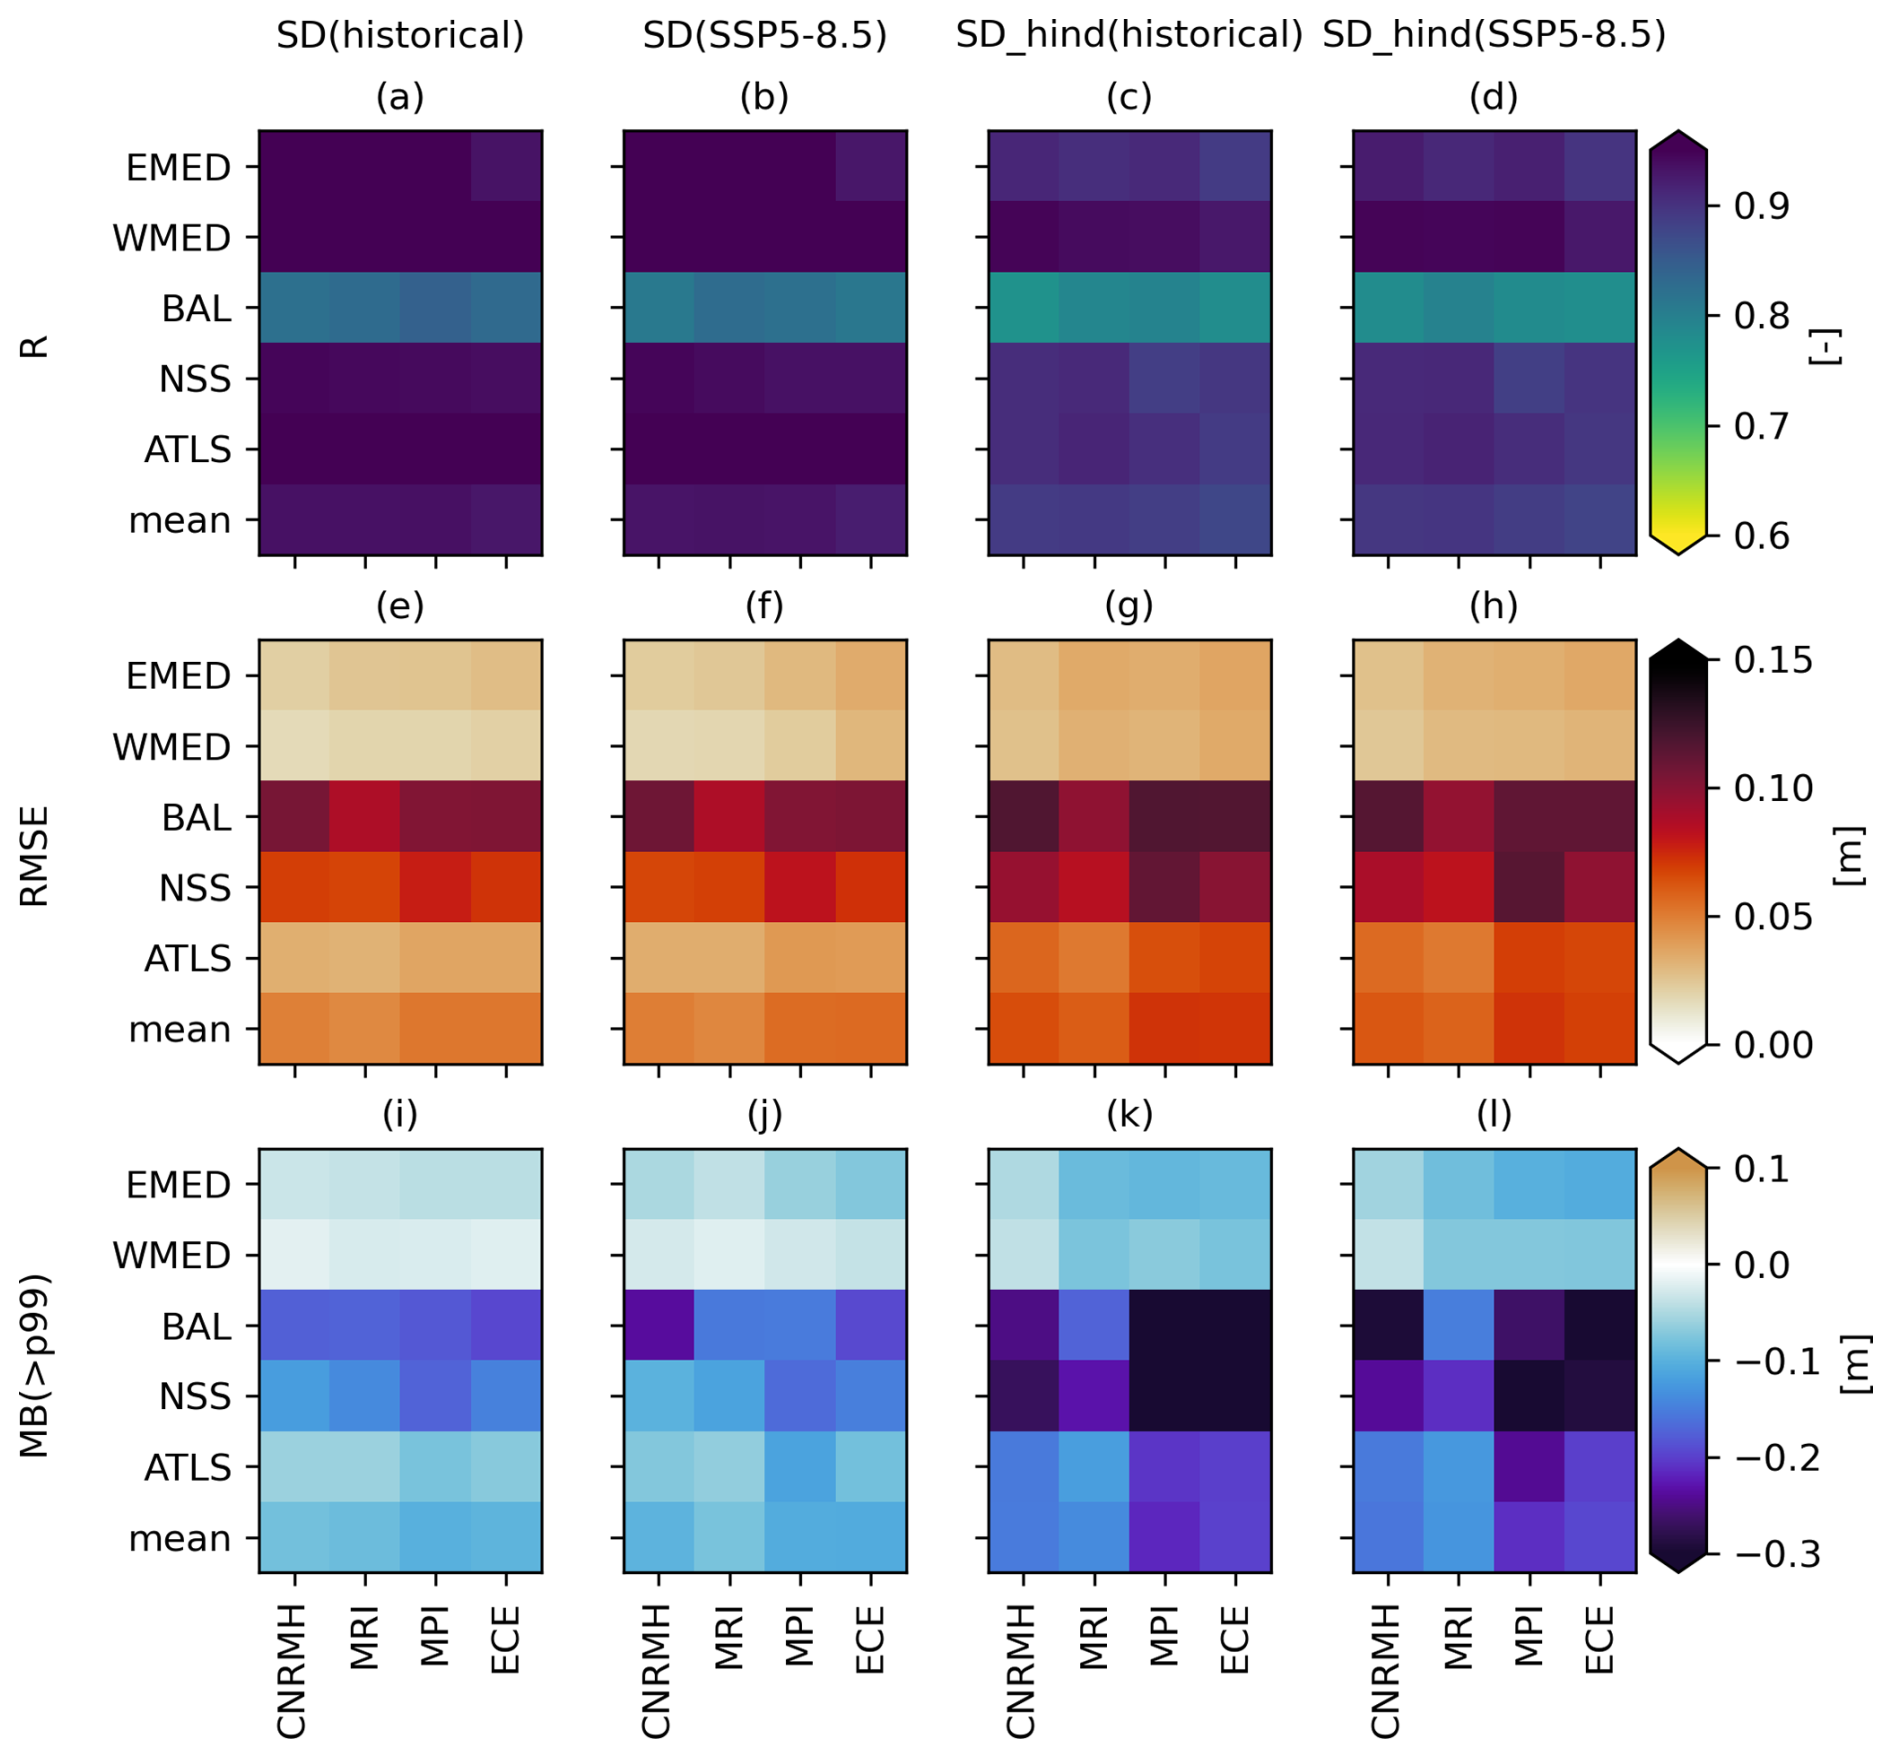
Figure 7SDM skill in the reproduction of storm surges for historical (1995–2014) and future (2080–2099, SSP5-8.5) climates for each GCM when trained on the historical dynamical simulations with each GCM (SD) and when trained on the hindcast simulation (SD_hind). The 4 GCMs are CNRM-CM6-1-HR (CNRMH), MRI-ESM2-0(MRI), MPI-ESM1-2-HR(MPI) and EC-Earth3 (ECE). EMED: Eastern Mediterranean Sea; WMED: Western Mediterranean Sea; BAL: Baltic Sea; NSS: North Sea; ATLS: Atlantic Shelf. See Fig. 2 for the definition of the geographical coverage of each region.
3.2.2 Extrapolation to climate forcing
Once the stationarity assumption validated, we next evaluate the extrapolation capability of the hindcast-trained SDM to climate forcing by assessing its skill to reproduce dynamically downscaled changes in ESSs (Sect. 2.5.1), and which hence constitutes the ultimate test to justify its application for multi-model ensemble projections of changes in ESS (Sect. 2.5.2), focusing on the 10-year storm surge level.
Dynamical projections reveal considerable inter-model spread, with regional changes typically reaching ±20 % (Fig. 8a, e, i, m, 5–95th percentiles of results pooled across GCMs), exceptionally higher (−25 % 32 %, 1st 99th percentiles respectively). Statistical projections trained independently on each GCM (SD, Fig. 8b, f, j, n) replicate the main European-scale spatial features of the dynamically downscaled projections, demonstrating the SDM's skill to replicate GCM-specific climate responses:mean absolute biases (MAB) remain modest (5 %–7.5 %) and pattern correlation coefficients (PCC) for three of the four GCMs are >=0.7 (CNRM-CM6-1-HR being the exception with PCC = 0.52), which is often deemed satisfactory in climate model performance evaluations (Back et al., 2024; Berhanu et al., 2025; Zebaze et al., 2025). Additionally, the sign of the projected change (sign agreement, SA) is correctly reproduced at ≥70 % of grid points (67 % for CNRM-CM6-1-HR). These indicators show that, despite some amplitude biases, the spatial imprint of the projected changes in the 10-year return level based on dynamical simulations is reasonably well reproduced by the SDM.
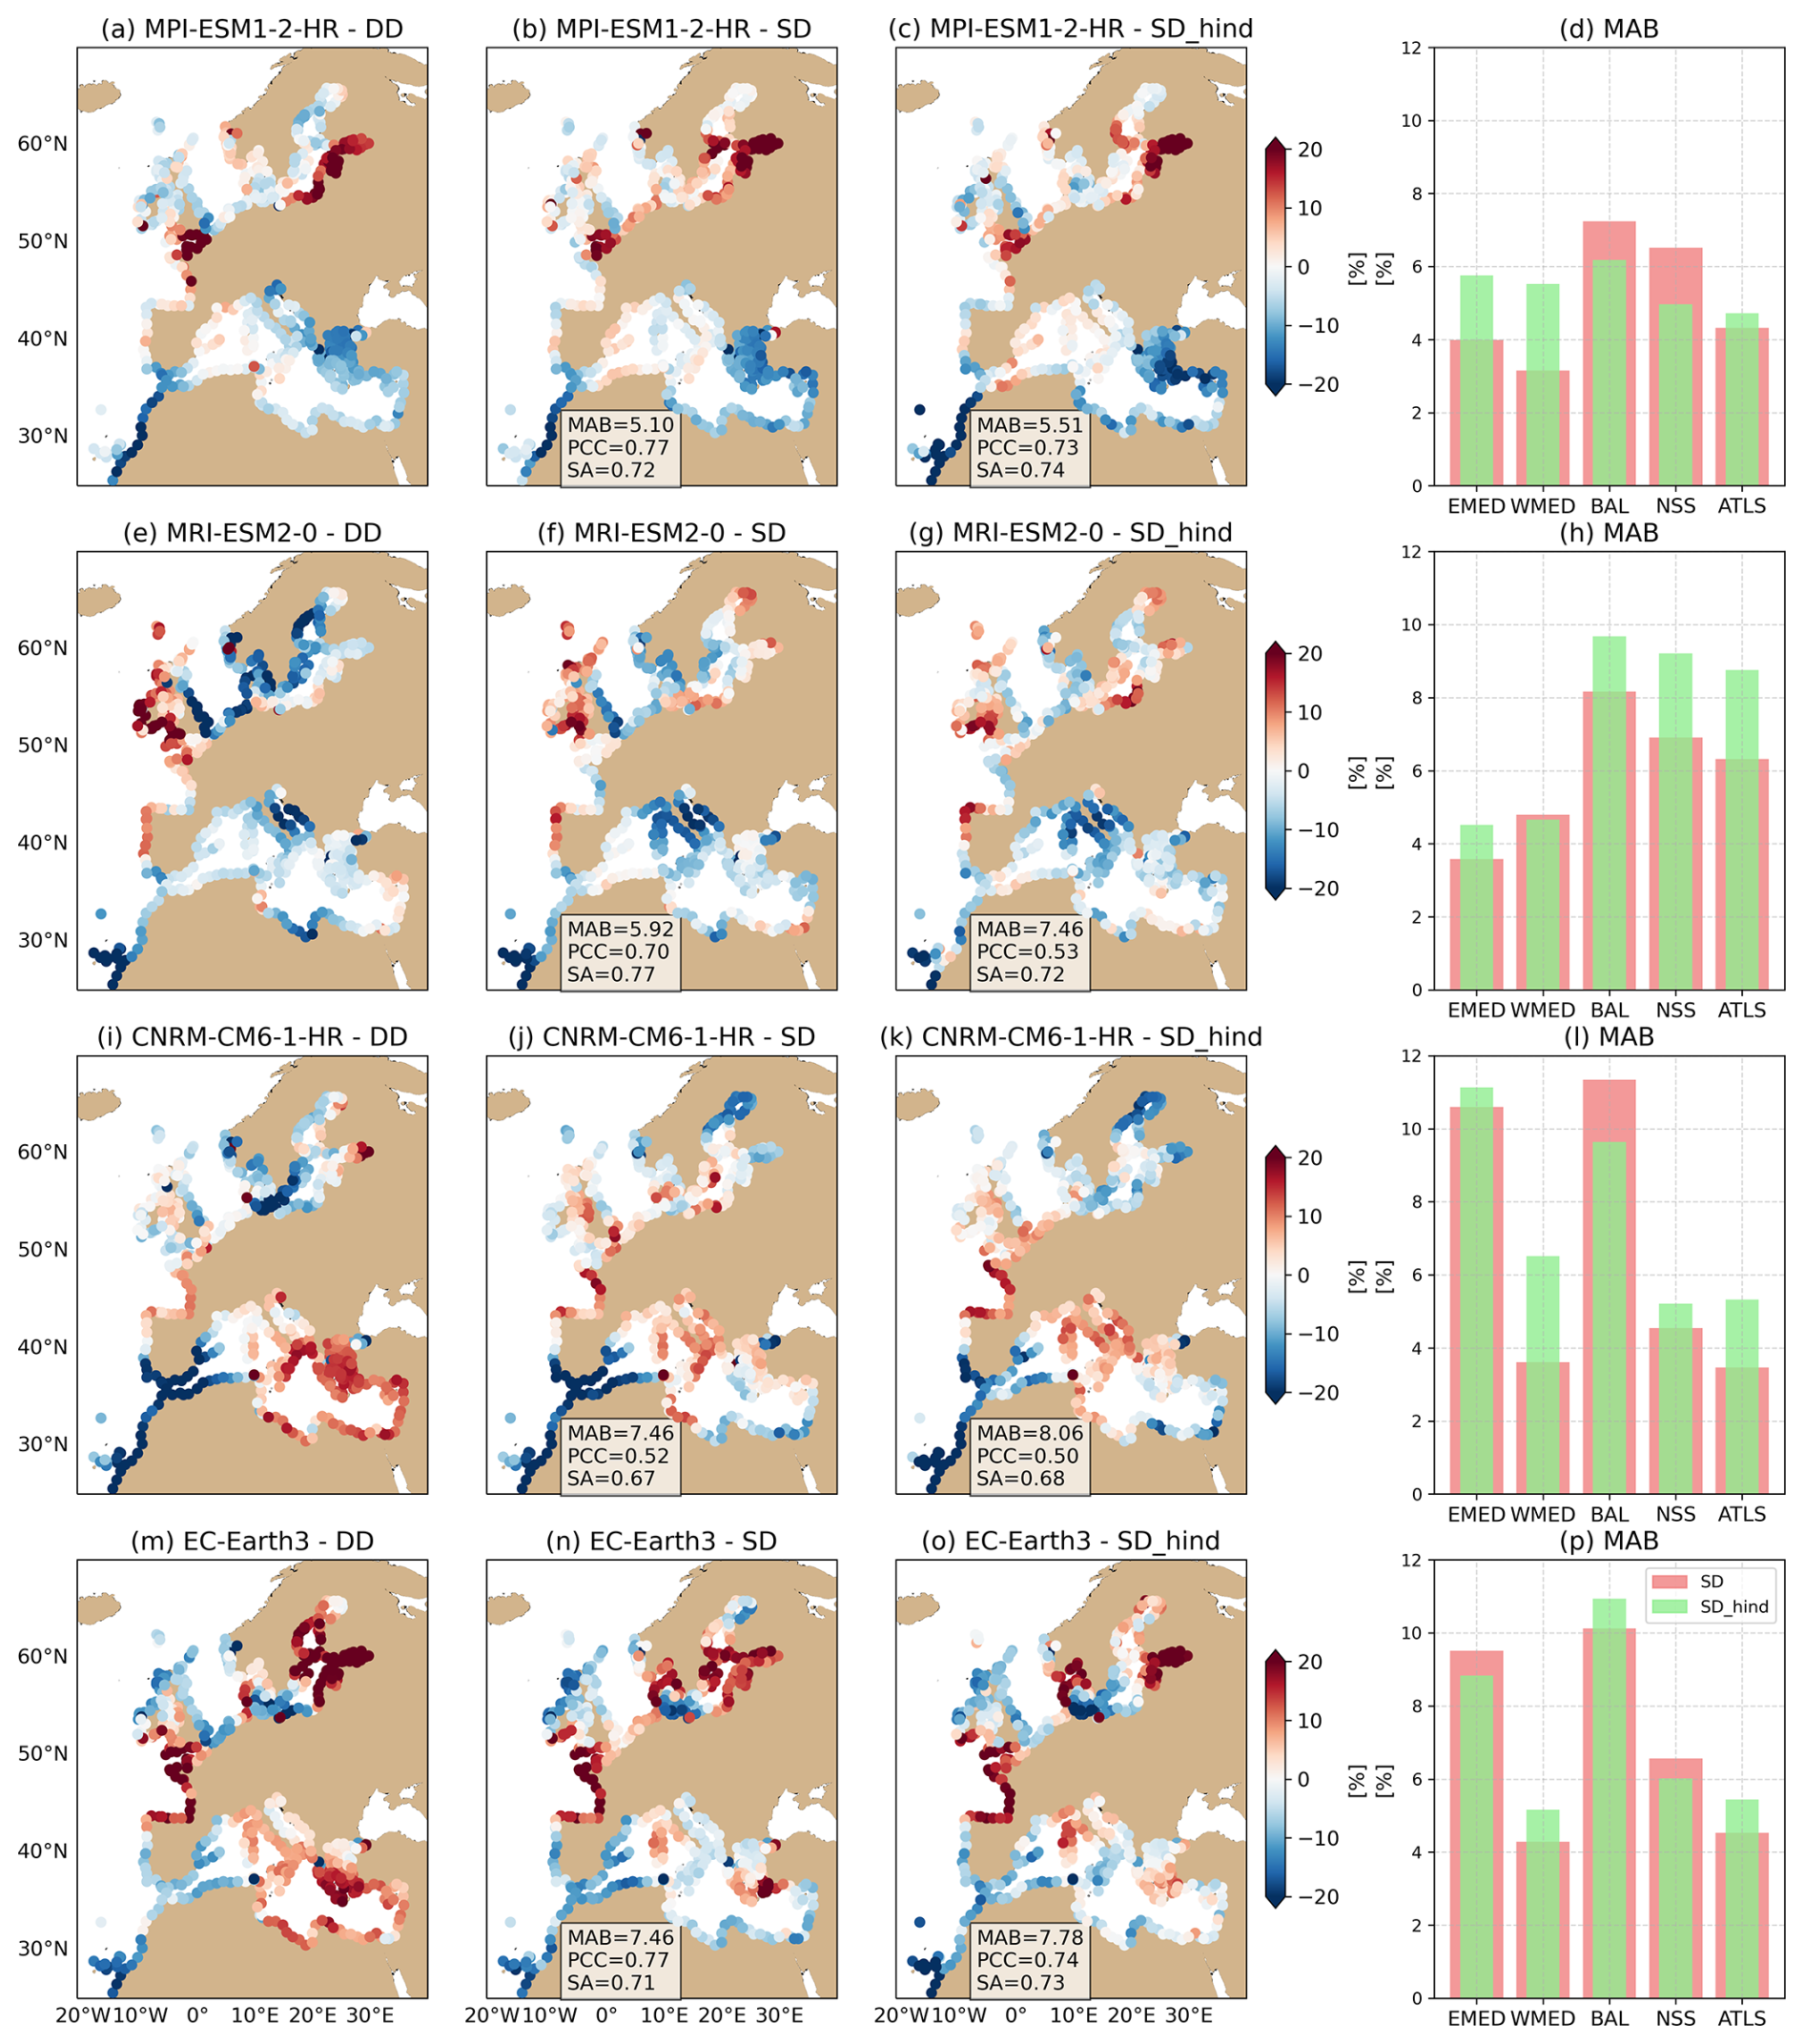
Figure 8Projected changes (%, extreme value analysis on [2080–2099] vs. [1995–2014]) in the 1 in 10 year storm surge event (RL10) for dynamical climate simulations (DD, a, e, i, m), statistical estimates trained on each historical climate simulation (SD, b, f, j, n) and statistical estimates trained on the hindcast forced by ERA5 (SD_hind, c, g, k, o) for the 4 GCMs downscaled. For each GCM (each row), the regionally averaged mean absolute bias (MAB) of SD and SD_hind estimates relative to DD estimates are given on the right-most column (d, h, l, p). EMED: Eastern Mediterranean Sea; WMED: Western Mediterranean Sea; BAL: Baltic Sea; NSS: North Sea; ATLS: Atlantic Shelf. See Fig. 2 for the definition of the geographical coverage of each region. For a fair comparison between SD and SD_hind, both are trained on 20-yr periods (1995–2014 and 1997–2016 respectively).
Performance, however, varies considerably across regions (Fig. 8d, h, l, q). The Baltic Sea exhibits the largest amplitude errors for most GCMs, and both the Baltic and eastern Mediterranean perform notably worse for CNRM-CM6-1-HR and EC-Earth. While this could be attributed to the lower hindcast skill identified in these regions (Figs. 3, 6), performance in reproducing projected changes is not systematically lower for these regions across GCMs. In the eastern Mediterranean, poor SDM performance appears only for the two models projecting positive ESS changes (CNRM-CM6-1-HR and EC-Earth3), while for the other two GCMs (MPI-ESM1-2-HR and MRI-ESM2-0), the projected negative ESS changes with differing spatial patterns are well reproduced by the statistical model. In the Baltic Sea, dynamical ESS changes for MRI-ESM2-0 and CNRM-CM6-1-HR – which are broadly negative – are very poorly reproduced by the statistical model, whereas for MPI-ESM1-2-HR and EC-Earth3 the positive signal seen in the dynamical simulations is broadly retained in the statistical projections, albeit with reduced amplitude.
These results indicate that a limited hindcast skill of the statistical model does not necessarily imply a corresponding poor performance in projecting ESS changes. This likely depends on how well the SDM captures the effect of the dominant atmospheric predictors and associated variability modes driving future ESS changes: if these are well represented, the main climate-change signal can still be recovered even when other predictors or specific modes are less accurately represented. While out of scope for the current study, a more detailed analysis of the predictors and variability modes dominating projected ESS changes across GCMs should be pursued in future works to help clarify and better interpret the SDM's skill for climate projections, particularly in challenging regions such as the Baltic Sea and the eastern Mediterranean Sea.
When using the SDM trained solely on the hindcast (SD_hind, Fig. 8c, g, k, o), spatial patterns and relative amplitudes of changes in the 10-year return level are generally well preserved across GCMs, as reflected by the performance metrics (MAB, PCC and SA) which remain broadly comparable to those for GCM-specific statistical projections (SD). The exception is MRI-ESM2-0, for which performance decays substantially between SD and SD_hind in both the spatial pattern (PCC) and the amplitude (MAB) of the signal. This decay is largely owed to a pronounced reduction of the ESS change signal across the northwest Shelf (UK coasts, North Sea) (see regional metrics in Fig. 8h). Across GCMs, the transition to a hindcast-trained SDM tends to only moderately amplify regional amplitude biases (Fig. 8d, h, l, q). Overall, these results support the applicability of the SD_hind setup for climate projections, with the added advantage of requiring a single simulation for training (the hindcast). However, differences with GCM-specific statistical projections (SD) can be notable for some coastal sections, which might be explained by the fact that ERA5-based EOFs do not always fully explain GCM predictor variability for specific models and regions. As such, SD_hind estimates can only account for future storm surge changes linked to the identified ERA5 principal components, and not to novel atmospheric conditions or different modes of variability/covariance structures that may be present in GCMs. An analysis of the retained explained variance after projecting GCM fields onto hindcast-based principal components for the target 17-GCM ensemble (Fig. S3, historical climate) reveals generally strong representativity across Europe, though with notable reductions for certain models and regions (e.g. the Mediterranean Sea for HadGEM3-GC31-MM). The retained variance also reveals stable between historical and end-of-century climates (not shown), supporting the stationarity of the predictands. Further analyses are needed to understand the observed differences between ERA5 and GCM variability and their impact on ESS change projections.
We finally compute performance metrics by pooling projections across GCMs for each region (Fig. 9). Results confirm the eastern Mediterranean and the Baltic to be the worst performing regions, and notably so for the Baltic, with highest MAB (9.2 %) and lowest PCC and SA (0.59 and 0.72, respectively, for SD). Given that dynamical simulations highlight these regions to display relatively strong future ESS changes (Fig. 9a), these results highlight the need to improve statistical projections in these regions for reliable future storm surge hazard assessments. The ensemble statistical projections presented hereafter should therefore be interpreted with caution in the Baltic and eastern Mediterranean regions. The best performing regions are the Atlantic façade and the western Mediterranean with lowest MAB (<5 % for SD) and highest. PCC and SA (>0.8 and >0.85, respectively, for SD). For the North Sea, results are somewhat mixed, as amplitude errors are moderate, the sign of ESS changes is well captured but the spatial pattern is less well resolved. The switch to a hindcast-trained SDM incurs a general but moderate decay in the SDM performance across regions, through with a notably larger impact on the western Mediterranean Sea.
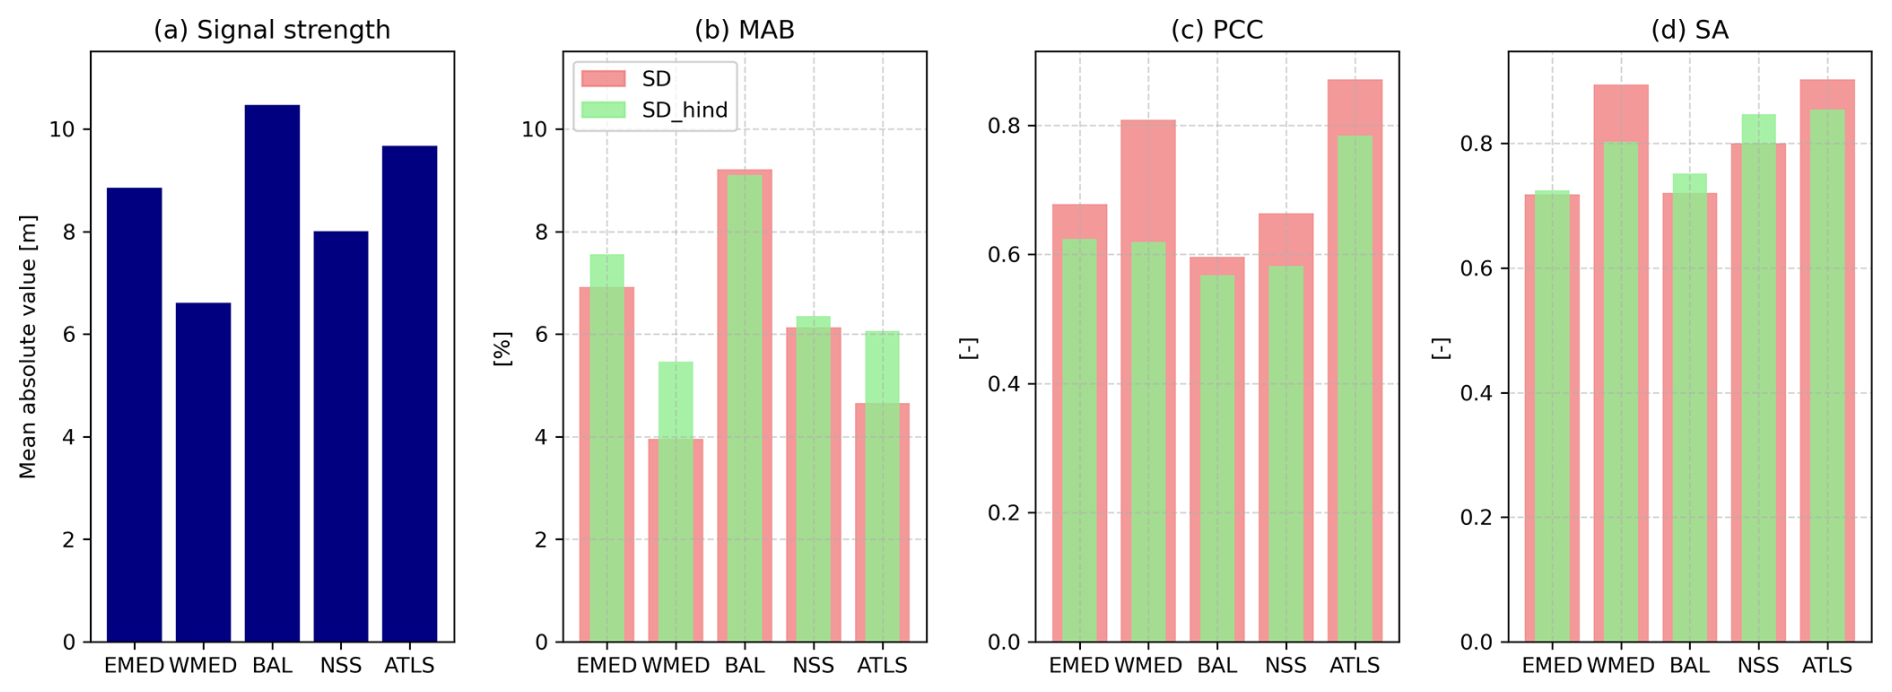
Figure 9Regional performance metrics of statistically downscaled projections relative to dynamically downscaled projections computed by pooling projections across the 4 GCMs for each region. (a) Strength of the signal of projected changes in the 10-year storm surge return level (RL10) from dynamical simulations (regional mean of absolute projected changes). (b) Mean absolute bias (%). (c) Pattern correlation coefficient (PCC). (d) Fraction of coastal points per region for which the sign of the RL10 change is reproduced (–), considering coastal points where the absolute amplitude is >=5 %.
Overall, the hindcast-trained SDM shows a sufficiently satisfactory skill in reproducing GCM-specific responses of European-scale ESSs simulated by dynamical simulations. While several limitations apply which should be considered when interpreting associated projections – including notably reduced skill in some regions (e.g., the Baltic Sea and eastern Mediterranean Sea), potential inconsistencies where GCM atmospheric variability departs from ERA5, and a systematic underestimation of ESS change magnitudes – our results support the broader use of the hindcast-trained SDM for cost-efficient multi-model projections of European-scale ESS changes. The SDM enables projections for a substantially larger ensemble of GCMs than previously reported, hence allowing a more rigorous identification of main regional trends, and importantly, a more comprehensive evaluation of inter-model variability in ESS projections, which has been poorly constrained in studies to date.
3.3 Statistical ensemble projections
Ensemble statistics (Sect. 2.5.2) for the statistical projections of changes in the 10-year storm surge level using 17 CMIP6 GCMs are provided in Fig. 10 for the middle and end of the century under SSP5-8.5. We highlight that based on the validation results, statistical ensemble projections in the Baltic and eastern Mediterranean seas are subject to lower confidence given limited skill of the statistical model, illustrated in Fig. 10 through hatching in these regions. For reference, 10-year event ESS changes for individual GCMs are provided in Figs. S4, S5, and corresponding confidence interval (given by the 5th and 95th percentile levels) are provided in Figs. S6–S8 for each of the epochs assessed.
For the 2050 time horizon (Fig. 10a), the ensemble ESS projections show minor absolute multi-model mean changes in the 10-year return level across most European coastlines (<5 %), except for sections of the Alboran sea and the Atlantic Moroccan coast (changes down to −11 %). However, the likely range spans [−19, 11] % across Europe, with upper estimates (83rd percentile) reaching >10 % in the Celtic Sea, Gulf of Finland and western Danish coast, and lower estimates (17th percentile) showing widespread negative changes in the 10-year return level in both northern (−6 % average) and southern Europe (−10 % average) (Fig. 10c, d, see also Fig. S4 for individual ensemble members). The Mediterranean Sea is the only region where a consistent signal emerges, with a substantial fraction of models projecting a decrease in future 10-year return levels (Fig. 10b).
By the end of the century (Fig. 10e), more pronounced multi-model mean changes of the 10-year return level are projected, with a spatial pattern that appears to scale with the mid-century changes, and widespread regions of substantial inter-model agreement emerge (Fig. 10f). These two features suggest that future changes in the 10-year return level are likely (and at least partly) driven by a forced response to anthropogenic climate change. A robust ( models) reduction in the 10-year return level is projected along the Mediterranean coasts (means across western and easter sections of −8 % and −6 %, respectively), the Atlantic façade of the domain south of 45° N (mean −10 %), and around the Danish Straits (mean −6 %). In contrast, a robust increase is projected for the coasts around the Celtic and Irish seas, western Denmark and the Gulf of Finland, with average changes in those regions of around +6 %. However, the inter-model spread proves large across Europe, with upper range estimates (83rd percentile) reaching >10 % in most of northern Europe and lower range estimates (17th percentile) yielding values % across southern Europe, reaching −25 % around the Moroccan and Canarian Atlantic coasts. Notably, individual models may project changes of up to ±35 % (Fig. S5). While small multi-model mean changes are projected for the Bay of Biscay, eastern UK, southern North Sea and northern Baltic Sea, the latter two regions display the widest likely ranges in Europe together with low inter-model agreement, reflecting very low confidence in projected regional changes of the 10-year return level. In the North Sea, the large inter-model spread in ESS changes is in line with studies reporting similar findings for CMIP6-based wind projections (Hahmann et al., 2022).
The regions where robust changes have been identified broadly agree in sign with previous literature on dynamically downscaled projections of changes in the 10-year storm surge return level, despite the different GCMs being employed (Makris et al., 2023; Muis et al., 2022; Vousdoukas et al., 2016). Across studies, positive and negative ESS changes are concentrated in northern and southern Europe, respectively. However, the exact extents and magnitudes may differ substantially. For example, Muis et al. (2022) and Vousdoukas et al. (2016) identify positive future ESS changes across the Baltic Sea, while in our results substantial positive changes are limited to the eastern Baltic Sea (nothing that, in our case, the SDM is subject to lower confidence here). These studies also identify regions with substantial signals which are not emerging in our ensemble (e.g. the south-eastern North Sea in Vousdoukas et al., 2016), which may result from the use of smaller ensembles which underrepresent inter-model variance in storm-surge projections. In the North Sea, mismatches may be influenced by moderate skill of the SDM for future ESS changes (Sect. 3.2.2). In contrast, the widespread reduction in future ESSs throughout the Mediterranean Sea identified in our ensemble is consistent across studies, even considering the lower confidence of our SDM in the eastern Mediterranean Sea. The latitudinal dipole in projected ESS changes in Europe may reflect a poleward shift of the mid-latitude jet stream and corresponding northward displacement of storm tracks (Köhler et al., 2025; Yu et al., 2023, 2024), though further analyses would be needed to attribute ESS changes to this phenomenon.
Projections of the 100-year return level (Fig. S9), which are subject to overall lower confidence due to reduced SDM skill, show generally amplified multi-model mean changes but substantially reduced inter-model agreement and larger spread than for the 10-year return level. This results in very wide likely ranges across Europe (see Figs. S10 and S11 for individual ensemble members), supporting the conclusion that the SDM should be used with caution for high return periods. In addition to degraded SDM performance, the reduced inter-model agreement likely reflects limitations in GCMs' ability to resolve the most severe extratropical storms (Priestley et al., 2020) and uncertainties in estimating the GPD shape parameter, which controls tail behaviour but is poorly constrained over 30-year periods. For this reason, several studies assume a time-invariant shape parameter when analysing changes in extremes (Cheynel et al., 2025a, b; Lobeto and Menendez, 2024; Marcos and Woodworth, 2017; Roustan et al., 2022). Further research is needed to assess how these different aspects affect the robustness of projections of ESSs at high return periods.
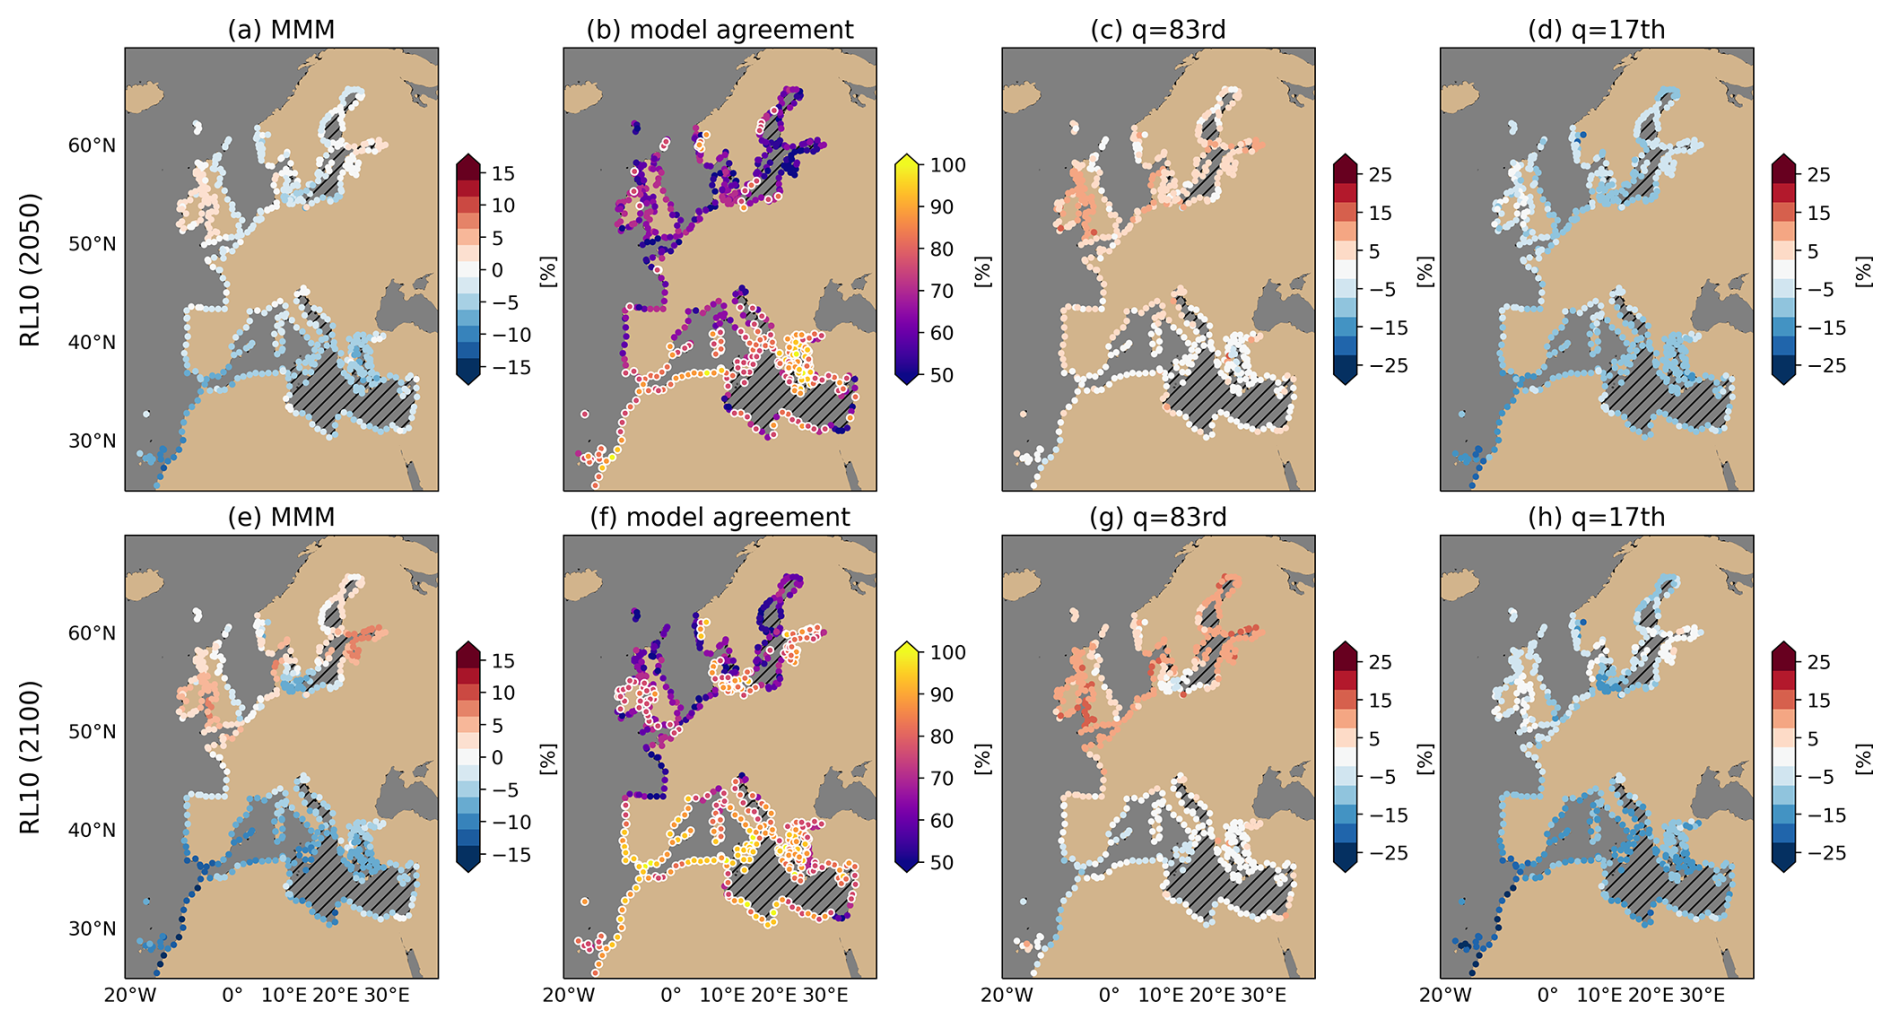
Figure 10Muti-model mean (MMM) projected changes [%] in the 1 in 10 storm surge return level by middle (a) and end (e) – of the 21st century generated by the hindcast-trained statistical downscaling model (SDM, training period 1997–2021). Corresponding ratio of models agreeing in the sign of projected changes (b, f), 83rd (c, g) and 17th (d, h) percentiles, indicating the likely range as per IPCC definitions. Hatching over the eastern Mediterranean Sea and the Baltic Sea indicate lower confidence in statistical projections in these regions given limited skill of the SDM for both past and future extreme storm surges (Sect. 3.1, 3.2). Extreme value analysis is computed for 30-year periods: baseline [1985–2014], middle of the century [2035–2064], and end of the century [2070–2099]. For reference, in a 17-model ensemble, the 17th and 83rd quantiles correspond to the lower/higher ∼3 models. The % model agreement represents confidence in the sign of projected changes. Those with ratio >80 % (here, models) are marked with white circle edges in panels (b, f).
The SDM developed in this study has shown satisfactory skill to reproduce ESS changes projected by dynamical downscaling models at the European scale, demonstrating the potential of the current dynamical-statistical approach to perform storm surge projections that would otherwise be very computationally demanding. However, several limitations and assumptions apply to our approach.
Regarding the statistical downscaling approach chosen, we have shown that multiple linear regression leads to a systematic underprediction of the target (predictand) extremes, despite achieving very satisfactory performance for normal conditions. Our results have shown that this negative bias has a limited impact on reproducing regional-scale projections of 10-year storm surge level changes for most of Europe, but for specific regions such as the Baltic Sea and the eastern Mediterranean Sea, the statistical model shows substantially lower skill, and hence our statistical projections are subject to lower confidence in these regions. Future works should explore ways of improving the SDM skill in these regions. Spectral analyses (not shown) indicate that the SDM still struggles to capture lower-frequency (> monthly) Baltic Sea variability, likely because much of it is driven by non-local processes (Weisse et al., 2021). Key remote influences include Baltic Sea volume changes driven by barotropic exchanges with the North Sea and low-pass-filtered storm surges entering through the Danish Straits (Andrée et al., 2023; Hieronymus et al., 2017). These could be better represented, respectively, by adding to the predictor set pressure-gradient indices spanning the North Sea–Baltic region (Karabil et al., 2018) or by including as regressor a low-pass-filtered surge proxy on the North Sea side. Beyond these regional challenges, and despite broadly agreeing regional patterns of changes in the 1 in 10 year storm surge level, differences between statistical and dynamical ESS changes can be substantial locally, and are expected to amplify for higher return periods given the associated decreasing capability of the presented statistical model.
Regarding possible improvements in the statistical method underlying our SDM, filtering principal components based on the statistical significance of their regression coefficients could reduce noise and improve generalization of the SDM (Tadesse et al., 2020). Future works could also explore distance-weighted principal component analysis (Baldwin et al., 2009), which emphasizes atmospheric variability near the site of interest, potentially yielding principal components more representative of local storm surge drivers. When targeting extreme events, the multiple linear regression can be modified to optimize for extremes, for example through generalized linear models or weighted regression approaches. Other more complex data-driven approaches than multiple linear regression , such as weather types (Costa et al., 2020) and neural networks targeted to extremes (Hermans et al., 2025) have demonstrated potential for an improved representation of ESSs, but their use at regional to continental scale has not been proven to date. The vast majority of studies employing data-driven approaches for storm surges have either not assessed extreme events or have declared a tendency to underpredict them (Bruneau et al., 2020; Tiggeloven et al., 2021). In this regard, a key shortcoming of employing a dynamical-statistical downscaling approach (as opposed to targeting observed storm surges) is that the skill of the SDM will be strongly conditioned by the skill of the dynamical model. In this study, as well as in several previous ones, a tendency of the storm surge hindcast to underpredict ESSs has been identified (Fernández-Montblanc et al., 2020; Irazoqui Apecechea et al., 2023). In fact, this underprediction tendency may partly explain the improved skill of the presented SDM in reproducing extremes in the dynamical model compared to previous studies benchmarking against observations, and may imply lower skill when targeting observed extremes. For future projections, the reliability of storm surge estimates – whether derived from dynamical downscaling or statistical downscaling – ultimately depends on the skill of the forcing GCM. Our results indicate that GCM-driven biases in ESSs persist, even after the bias correction applied in the forcings for the SDM projections. Beyond advanced bias correction methods, alternative approaches to account for GCM fidelity include weighting the multi-model mean based on each GCM's ability to reproduce relevant European atmospheric patterns (e.g., via weather types, Borato et al., 2024; Cagigal et al., 2020) or on a site-specific basis, using each GCM's historical skill in reproducing ESSs at coastal locations (e.g., Fig. S2).
While the main patterns of projected ESS changes were well captured by the SDM compared to dynamical downscaling in large parts of Europe (Fig. 8), differences can be substantial locally. The reduced explained variance under GCM forcing highlights inherent limitations in the extrapolation capability of the SDM to climate forcing. Future work should focus on characterizing this aspect better, looking at differences in covariance structure between ERA5 and GCM fields, including potential multicollinearity after projection onto ERA5-derived EOFs, to better understand impact on hindcast-trained ESS projections. Finally, an additional contributor to hindcast-trained statistical projection errors may be the mismatches between the ERA5 and GCM land-sea masks. This mismatch may affect the weighting assigned to winds in grid cells adjacent to the coastal target locations during projection onto the ERA5 principal components.
The use of 1° resolution atmospheric predictors might further impact the skill of the SDM in reproducing dynamical simulations that are forced by the reanalysis and GCMs at their original, often higher than 1° resolution. While this step was needed to render a SDM compatible across forcings, studies suggest this resolution remains adequate: Agulles et al. (2024) found storm surges and extremes are well represented at 1° atmospheric forcings over Europe, and Costa et al. (2020) showed that such degraded predictors best preserved variability during dimensionality reduction for La Rochelle. Indeed, negligible impacts on the SDM skill were found when using the original, high-resolution (0.25°) ERA5 predictors across Europe, except for occasional extreme events in selected locations (not shown). As downscaled CMIP6 datasets for Europe (e.g., Euro-CORDEX, Katragkou et al., 2024) become increasingly available, the potential added value of higher-resolution atmospheric forcing – more closely aligned with ERA5's native resolution – for statistical storm surge projections warrants further investigation. Alternatively, storm surge simulations could be dynamically downscaled for a limited (e.g. 25 year) historical slice from each GCMs. These would serve to train GCM-specific SDMs at native resolution, which could then be applied to future projections. This approach offers a middle ground in computational cost between the current method and full dynamical downscaling of the ensemble, while avoiding the potential limitations of extrapolating ERA5 predictor modes to GCMs.
Despite the expanded ensemble size employed in this study, projections of future changes in ESSs still exhibit substantial spread, highlighting the risk for substantially biased estimates (in magnitude and sign) when relying on small ensembles – an approach commonly adopted in the literature using hydrodynamic models. While part of this spread may stem from differing forced responses across GCMs, internal variability in storm surge extremes may play an important role. Recent studies have highlighted the presence of multi-decadal variability in observed extremes (Cheynel et al., 2025b), with strong links to large-scale climate modes such as the Arctic Oscillation (Lobeto and Menendez, 2024). Consequently, not only may internal climate variability contribute to future ESS changes, but differing phasing of this variability across GCMs may further amplify inter-model spread. This internal variability presents a major challenge for the detection and attribution of changes in extreme storm surges. Non-stationary extreme value analysis (e.g. Lobeto and Menendez, 2024; Mentaschi et al., 2016) offers a potential pathway to disentangle internal variability from externally forced trends by incorporating covariates – such as dominant climate modes – into the distribution parameters. Analyzing the residual trends in the extreme value distribution after accounting for these modes could improve the robustness of projected ESS changes. In this context, cost-effective statistical downscaling models like the one developed in this study offer significant value for detection and attribution efforts. They enable the generation and analysis of long storm surge time series under fixed pre-industrial radiative forcing (i.e. using hundreds of years of piControl GCM forcings, upon availability of predictors at high temporal resolutions), which are essential for characterizing the influence of internal variability but are highly costly to produce with classic dynamical downscaling. Expanding our projections to additional SSP scenarios could also help in the interpretation of the projected changes.
In this study, we have developed and applied a cost-effective statistical downscaling model (SDM) to generate the first expanded, pan-European ensemble of extreme storm surge projections based on 17 CMIP6 models. This significantly extends the ensemble size compared to previous regional assessments, which have typically relied on computationally expensive dynamical downscaling approaches that limit the feasible number of models.
Our SDM is trained to replicate dynamically downscaled storm surge outputs, enabling the generation of spatially and temporally seamless surge estimates across the European coastline. We evaluated the performance of the SDM, which was trained on ERA5 reanalysis and historical storm surge estimates, in replicating past and future extreme storm surges derived from dynamically downscaled simulations. For past conditions, the SDM showed a general tendency to underpredict extreme storm surges, with growing biases for higher return periods (100-year), and hence subsequent projections were limited to more moderate extremes (10-year event). The model demonstrated stable skill across both historical and future climates, and showed overall satisfactory skill in reproducing the European-scale patterns of future changes in the 10-year return level given by dynamical simulations, although with a tendency for reduced amplitudes, and a notably lower skill in the Baltic Sea and the eastern Mediterranean regions. In these regions, statistical projections are therefore subject to lower confidence, highlighting the need to improve the statistical method for accurate assessments. In contrast, the model showed excellent performance along the European Atlantic façade and the western Mediterranean Sea, and moderate skill in the North Sea.
The resulting ensemble projections reveal negligible changes in 10-year return level of storm surges by mid-century (2050), but robust changes (defined as agreement in sign across ≥13 of 17 models) emerge by the end of the century in several regions. Robust negative changes are projected for the Mediterranean Sea (−7 %), Moroccan Atlantic coast (−10 %), and Danish Straits (−6 %), while positive changes of around +6 % are projected for the Celtic and Irish Seas, western Denmark, and the Gulf of Finland. Despite these identified regions of robust changes, multi-model mean changes are generally modest ([−15,8] % across Europe) but the likely ranges – defined by the 17th and 83rd percentiles – are wide, reflecting substantial inter-model spread in projected changes of 10-year return levels. In some regions, individual models project changes as large as ±35 %. For the southern North Sea and northern Baltic Sea, our results reveal low confidence in projections of extreme storm surge changes, given by the combination of pronounced inter-model spread and low inter-model agreement on the sign of projected changes.
Our findings underscore the value of statistical methods to better characterize inter-model uncertainty in projections of extreme storm surges. They also highlight the importance of using large ensembles when assessing future changes in extreme storm surges, as small ensemble sizes can lead to low confidence estimates. Future research should aim to identify and quantify the sources of spread in ESS projections, particularly the role of internal variability in extremes. In this regard, cost-effective statistical models such as the one developed here provide a powerful tool for advancing detection and attribution studies, by enabling efficient production of long-term storm surge estimates across multiple GCMs, scenarios, and regions.
The Regional Ocean Modelling System (ROMS) code used for the dynamical dowsncaling of storm surge is freely accesible through the ROMS website (https://www.myroms.org/index.php, last access: 15 July 2025).
Data on projected changes on extreme storm surge extremes using statistical downscaling are available on request. The tide gauge data used for validation are available on the GESLA website (at http://www.gesla.org, last access: 20 July 2025, Haigh et al., 2023). The atmospheric fields from the 17 CMIP6 GCMs used to force the dynamical and statistical downscaling models are freely accessible via the different nodes attached to the ESGF server, such as https://esgf-node.ipsl.upmc.fr/ (last access: 20 July 2025) (ScenarioMIP dataset, historical and ssp585 experiments).
The supplement related to this article is available online at https://doi.org/10.5194/nhess-26-2269-2026-supplement.
MIA, AM and MM designed the scope of the study and experiments. JBV performed the dynamical downscaling simulations. MIA, MM and HL designed the statistical downscaling model and SDM selection process. MIA carried out all statistical downscaling experiments and analyses in the manuscript and prepared the manuscript with contributions from all co-authors.
The contact author has declared that none of the authors has any competing interests.
Publisher's note: Copernicus Publications remains neutral with regard to jurisdictional claims made in the text, published maps, institutional affiliations, or any other geographical representation in this paper. The authors bear the ultimate responsibility for providing appropriate place names. Views expressed in the text are those of the authors and do not necessarily reflect the views of the publisher.
The authors are grateful to Lorenzo Mentaschi for providing the code used to perform the extreme value analyses, and to Alisee Chaigneau for her guidance on using the package. We also thank Adrian Acevedo Garcia for organising the transfer of the dynamical simulation outputs. Some parts of this manuscript have been rephrased using AI tools (e.g., ChatGPT), based solely on content originally written by the authors.
This research has been supported by the EU Horizon 2020 Framework Programme, H2020 Societal Challenges (grant agreement no. 101003598).
This paper was edited by Philip Ward and reviewed by Marta Marcos and José A. A. Antolínez.
Agulles, M., Marcos, M., Amores, A., and Toomey, T.: Storm surge modelling along European coastlines: The effect of the spatio-temporal resolution of the atmospheric forcing, Ocean Model., 192, 102432, https://doi.org/10.1016/j.ocemod.2024.102432, 2024.
Amante, C. and Eakins, B. W.: ETOPO1 Global Relief Model converted to PanMap layer format (p. 1 MBytes) [Application/zip], PANGAEA, https://doi.org/10.1594/PANGAEA.769615, 2009.
Anderson, D., Rueda, A., Cagigal, L., Antolinez, J. A. A., Mendez, F. J., and Ruggiero, P.: Time-Varying Emulator for Short and Long-Term Analysis of Coastal Flood Hazard Potential, J. Geophys. Res.-Oceans, 124, 9209–9234, https://doi.org/10.1029/2019jc015312, 2019.
Andrée, E., Su, J., Dahl Larsen, M. A., Drews, M., Stendel, M., and Skovgaard Madsen, K.: The role of preconditioning for extreme storm surges in the western Baltic Sea, Nat. Hazards Earth Syst. Sci., 23, 1817–1834, https://doi.org/10.5194/nhess-23-1817-2023, 2023.
Back, S.-Y., Kim, D., and Son, S.-W.: MJO Diversity in CMIP6 Models, J. Climate, 37, 4835–4850, https://doi.org/10.1175/JCLI-D-23-0656.1, 2024.
Baldwin, M. P., Stephenson, D. B., and Jolliffe, I. T.: Spatial Weighting and Iterative Projection Methods for EOFs, J. Climate, 22, 234–243, https://doi.org/10.1175/2008jcli2147.1, 2009.
Berhanu, D., Alamirew, T., Bewket, W., Tarkegn, T. G., Zeleke, G., Haileslassie, A., O'Donnell, G., Walsh, C. L., and Gebrehiwot, S.: Evaluation of CMIP6 models in simulating seasonal extreme precipitation over Ethiopia, Weather Climate Extrem., 47, 100752, https://doi.org/10.1016/j.wace.2025.100752, 2025.
Borato, L., Härter Fetter Filho, A. F., Gomes Da Silva, P., Mendez, F. J., and Da Fontoura Klein, A. H.: Evaluation of CMIP5 and CMIP6 Models Based on Weather Types Applied to the South Atlantic Ocean, Int. J. Climatol., 44, 5580–5595, https://doi.org/10.1002/joc.8653, 2024.
Boumis, G., Moftakhari, H., and Moradkhani, H.: 21-st century probabilistic daily storm surge projections for Japan's coasts, Harvard Dataverse, https://doi.org/10.7910/DVN/RQIBTA, 2025.
Bruneau, N., Polton, J., Williams, J., and Holt, J.: Estimation of global coastal sea level extremes using neural networks, Environ. Res. Lett., 15, 074030, https://doi.org/10.1088/1748-9326/ab89d6, 2020.
Cagigal, L., Rueda, A., Castanedo, S., Cid, A., Perez, J., Stephens, S. A., Coco, G., and Méndez, F. J.: Historical and future storm surge around New Zealand: From the 19th century to the end of the 21st century, Int. J. Climatol., 40, 1512–1525, https://doi.org/10.1002/joc.6283, 2020.
Calafat, F. M. and Marcos, M.: Probabilistic reanalysis of storm surge extremes in Europe, P. Natl. Acad. Sci. USA, 117, 1877–1883, https://doi.org/10.1073/pnas.1913049117, 2020.
Calafat, F. M., Wahl, T., Tadesse, M. G., and Sparrow, S. N.: Trends in Europe storm surge extremes match the rate of sea-level rise, Nature, 603, 841–845, https://doi.org/10.1038/s41586-022-04426-5, 2022.
Chaigneau, A. A., Melet, A., Voldoire, A., Irazoqui Apecechea, M., Reffray, G., Law-Chune, S., and Aouf, L.: Dynamic projections of extreme sea levels for western Europe based on ocean and wind-wave modelling, Nat. Hazards Earth Syst. Sci., 24, 4031–4048, https://doi.org/10.5194/nhess-24-4031-2024, 2024.
Cheynel, J., Pineau-Guillou, L., Lazure, P., Marcos, M., Lyard, F., and Raillard, N.: A secular sea level hindcast (1900–2015) to investigate extreme surges variability and trends in the North Atlantic, Ocean Model., 199, 102636, https://doi.org/10.1016/j.ocemod.2025.102636, 2025a.
Cheynel, J., Pineau-Guillou, L., Lazure, P., Marcos, M., and Raillard, N.: Regional changes in extreme storm surges revealed by tide gauge analysis, Ocean Dynam., 75, 29, https://doi.org/10.1007/s10236-025-01675-6, 2025b.
Cid, A., Castanedo, S., Abascal, A. J., Menéndez, M., and Medina, R.: A high resolution hindcast of the meteorological sea level component for Southern Europe: The GOS dataset, Clim. Dynam., 43, 2167–2184, https://doi.org/10.1007/s00382-013-2041-0, 2014.
Cid, A., Camus, P., Castanedo, S., Méndez, F. J., and Medina, R.: Global reconstructed daily surge levels from the 20th Century Reanalysis (1871–2010), Global Planet. Change, 148, 9–21, https://doi.org/10.1016/j.gloplacha.2016.11.006, 2017.
Costa, W., Idier, D., Rohmer, J., Menendez, M., and Camus, P.: Statistical Prediction of Extreme Storm Surges Based on a Fully Supervised Weather-Type Downscaling Model, J. Mar. Sci. Eng., 8, 1028, https://doi.org/10.3390/jmse8121028, 2020.
Dubois, K., Nilsson, E., Larsen, M. A. D., Drews, M., Hieronymus, M., Karami, M. P., and Rutgersson, A.: Exploring Storm Tides Projections and Their Return Levels Around the Baltic Sea Using a Machine Learning Approach, Tellus A, 77, https://doi.org/10.16993/tellusa.4101, 2025.
Efron, B. and Tibshirani, R. J.: An Introduction to the Bootstrap (0 ed.), Chapman and Hall/CRC, https://doi.org/10.1201/9780429246593, 1994.
Fernández-Montblanc, T., Vousdoukas, M. I., Mentaschi, L., and Ciavola, P.: A Pan-European high resolution storm surge hindcast, Environ. Int., 135, 105367, https://doi.org/10.1016/j.envint.2019.105367, 2020.
Fox-Kemper, B., Hewitt, H. T., Xiao, C., Aðalgeirsdóttir, G., Drijfhout, S. S., Edwards, T. L., Golledge, N. R., Hemer, M. A., Kopp, R. E., Krinner, G., Mix, A., Notz, D., Nowicki, S., Nurhati, I. S., Ruiz, L., Sallee, J.-B., Slangen, A. B. A., and Yu, Y.: Ocean, Cryosphere and Sea Level Change, in: Climate Change 2021: The Physical Science Basis, Contribution of Working Group I to the Sixth Assessment Report of the Intergovernmental Panel on Climate Change (pp, 1211–1362), edited by: Masson-Delmotte, V., Zhai, P., Pirani, A., Connors, S. L., Pean, C., Berger, N., Caud, N., Chen, Y., Goldfarb, L., Gomis, M. I., Huang, M., Leitzell, K., Lonnoy, E., Matthews, J. B. R., Maycock, T., Waterfield, T., Yelekci, O., Yu, R., and Zhou, B., Cambridge University Press, https://doi.org/10.1017/9781009157896.011, 2021.
García, D., Chao, B. F., Del Río, J., Vigo, I., and García-Lafuente, J.: On the steric and mass-induced contributions to the annual sea level variations in the Mediterranean Sea, J. Geophys. Res.-Oceans, 111, 2005JC002956, https://doi.org/10.1029/2005JC002956, 2006.
Hahmann, A. N., García-Santiago, O., and Peña, A.: Current and future wind energy resources in the North Sea according to CMIP6, Wind Energ. Sci., 7, 2373–2391, https://doi.org/10.5194/wes-7-2373-2022, 2022.
Haigh, I. D., Wadey, M. P., Wahl, T., Ozsoy, O., Nicholls, R. J., Brown, J. M., Horsburgh, K., and Gouldby, B.: Spatial and temporal analysis of extreme sea level and storm surge events around the coastline of the UK, Sci. Data, 3, https://doi.org/10.1038/sdata.2016.107, 2016.
Haigh, I. D., Marcos, M., Talke, S. A., Woodworth, P. L., Hunter, J. R., Hague, B. S., Arns, A., Bradshaw, E., and Thompson, P.: GESLA Version 3: A major update to the global higher-frequency sea-level dataset, Geosci. Data J., 10, 293–314, https://doi.org/10.1002/gdj3.174, 2023.
Harter, L., Pineau-Guillou, L., and Chapron, B.: Underestimation of extremes in sea level surge reconstruction, Sci. Rep., 14, 14875, https://doi.org/10.1038/s41598-024-65718-6, 2024.
Hermans, T. H. J., Ben Hammouda, C., Treu, S., Tiggeloven, T., Couasnon, A., Busecke, J. J. M., and van de Wal, R. S. W.: Computing extreme storm surges in Europe using neural networks, Nat. Hazards Earth Syst. Sci., 25, 4593–4612, https://doi.org/10.5194/nhess-25-4593-2025, 2025.
Hersbach, H., Bell, B., Berrisford, P., Hirahara, S., Horányi, A., Muñoz-Sabater, J., Nicolas, J., Peubey, C., Radu, R., Schepers, D., Simmons, A., Soci, C., Abdalla, S., Abellan, X., Balsamo, G., Bechtold, P., Biavati, G., Bidlot, J., Bonavita, M., and Thépaut, J.: The ERA5 global reanalysis, Q. J. Roy. Meteorol. Soc., 146, 1999–2049, https://doi.org/10.1002/qj.3803, 2020.
Hieronymus, M., Hieronymus, J., and Arneborg, L.: Sea level modelling in the Baltic and the North Sea: The respective role of different parts of the forcing, Ocean Model., 118, 59–72, https://doi.org/10.1016/j.ocemod.2017.08.007, 2017
Irazoqui Apecechea, M., Melet, A., and Armaroli, C.: Towards a pan-European coastal flood awareness system: Skill of extreme sea-level forecasts from the Copernicus Marine Service, Front. Mar. Sci., 9, 1091844, https://doi.org/10.3389/fmars.2022.1091844, 2023.
Jenkins, L. J., Haigh, I. D., Sifnioti, D. E., Pinto Rascon, J. A., Inayatillah, A., and Kassem, H.: Non-linear tide-surge interactions around the coast of the UK through the lens of tidal level, phase, and skew surge, Estuar. Coast. Shelf S., 321, 109323, https://doi.org/10.1016/j.ecss.2025.109323, 2025.
Karabil, S., Zorita, E., and Hünicke, B.: Contribution of atmospheric circulation to recent off-shore sea-level variations in the Baltic Sea and the North Sea, Earth Syst. Dynam., 9, 69–90, https://doi.org/10.5194/esd-9-69-2018, 2018.
Katragkou, E., Sobolowski, S. P., Teichmann, C., Solmon, F., Pavlidis, V., Rechid, D., Hoffmann, P., Fernandez, J., Nikulin, G., and Jacob, D.: Delivering an Improved Framework for the New Generation of CMIP6-Driven EURO-CORDEX Regional Climate Simulations, Am. Meteorol. Soc., E962–E974, https://doi.org/10.1175/BAMS-D-23-0131.1, 2024.
Köhler, D., Räisänen, P., Naakka, T., Nordling, K., and Sinclair, V. A.: The future North Atlantic jet stream and storm track: relative contributions from sea ice and sea surface temperature changes, Weather Clim. Dynam., 6, 669–694, https://doi.org/10.5194/wcd-6-669-2025, 2025.
Lang, A. and Mikolajewicz, U.: The long-term variability of extreme sea levels in the German Bight, Ocean Sci., 15, 651–668, https://doi.org/10.5194/os-15-651-2019, 2019.
Lobeto, H. and Menendez, M.: Variability Assessment of Global Extreme Coastal Sea Levels Using Altimetry Data, Remote Sens., 16, 1355, https://doi.org/10.3390/rs16081355, 2024.
Makris, C. V., Tolika, K., Baltikas, V. N., Velikou, K., and Krestenitis, Y. N.: The impact of climate change on the storm surges of the Mediterranean Sea: Coastal sea level responses to deep depression atmospheric systems, Ocean Model., 181, 102149, https://doi.org/10.1016/j.ocemod.2022.102149, 2023.
Marcos, M. and Woodworth, P. L.: Spatiotemporal changes in extreme sea levels along the coasts of the North Atlantic and the Gulf of Mexico, J. Geophys. Res.-Oceans, 122, 7031–7048, https://doi.org/10.1002/2017JC013065, 2017.
Meinshausen, M., Nicholls, Z. R. J., Lewis, J., Gidden, M. J., Vogel, E., Freund, M., Beyerle, U., Gessner, C., Nauels, A., Bauer, N., Canadell, J. G., Daniel, J. S., John, A., Krummel, P. B., Luderer, G., Meinshausen, N., Montzka, S. A., Rayner, P. J., Reimann, S., Smith, S. J., van den Berg, M., Velders, G. J. M., Vollmer, M. K., and Wang, R. H. J.: The shared socio-economic pathway (SSP) greenhouse gas concentrations and their extensions to 2500, Geosci. Model Dev., 13, 3571–3605, https://doi.org/10.5194/gmd-13-3571-2020, 2020.
Mentaschi, L., Vousdoukas, M., Voukouvalas, E., Sartini, L., Feyen, L., Besio, G., and Alfieri, L.: The transformed-stationary approach: a generic and simplified methodology for non-stationary extreme value analysis, Hydrol. Earth Syst. Sci., 20, 3527–3547, https://doi.org/10.5194/hess-20-3527-2016, 2016.
Mohamed, B. and Skliris, N.: Steric and atmospheric contributions to interannual sea level variability in the eastern mediterranean sea over 1993–2019, Oceanologia, 64, 50–62, https://doi.org/10.1016/j.oceano.2021.09.001, 2022.
Muis, S., Apecechea, M. I., Dullaart, J., de Lima Rego, J., Madsen, K. S., Su, J., Yan, K., and Verlaan, M.: A High-Resolution Global Dataset of Extreme Sea Levels, Tides, and Storm Surges, Including Future Projections, Front. Mar. Sci., 7, 263, https://doi.org/10.3389/fmars.2020.00263, 2020.
Muis, S., Aerts, J., Álvarez Antolínez, J. A., Dullaart, J., Duong, T. M., Erikson, L., Haarmsa, R., Irazoqui Apecechea, M., Mengel, M., Le Bars, D., O'Neill, A., Ranasinghe, R., Roberts, M., Verlaan, M., Ward, P. J., and Yan, K.: Global projections of storm surges using high-resolution CMIP6 climate models: Validation, projected changes, and methodological challenges [Preprint], Climatology (Global Change), https://doi.org/10.1002/essoar.10511919.1, 2022.
Pineau-Guillou, L., Delouis, J., and Chapron, B.: Characteristics of Storm Surge Events Along the North-East Atlantic Coasts, J. Geophys. Res.-Oceans, 128, e2022JC019493, https://doi.org/10.1029/2022JC019493, 2023
Priestley, M. D. K., Ackerley, D., Catto, J. L., Hodges, K. I., McDonald, R. E., and Lee, R. W.: An Overview of the Extratropical Storm Tracks in CMIP6 Historical Simulations, J. Climate, 33, 6315–6343, https://doi.org/10.1175/JCLI-D-19-0928.1, 2020.
Pyykkö, J. and Svensson, G.: Wind Turning in the Planetary Boundary Layer in CMIP6 Models, J. Climate, 36, 5729–5742, https://doi.org/10.1175/JCLI-D-22-0705.1, 2023.
Roustan, J.-B., Pineau-Guillou, L., Chapron, B., Raillard, N., and Reinert, M.: Shift of the storm surge season in Europe due to climate variability, Sci. Rep., 12, 8210, https://doi.org/10.1038/s41598-022-12356-5, 2022
Rueda, A., Camus, P., Tomás, A., Vitousek, S., and Méndez, F. J.: A multivariate extreme wave and storm surge climate emulator based on weather patterns, Ocean Model., 104, 242–251, https://doi.org/10.1016/j.ocemod.2016.06.008, 2016.
Shchepetkin, A. F. and McWilliams, J. C.: The regional oceanic modeling system (ROMS): A split-explicit, free-surface, topography-following-coordinate oceanic model, Ocean Model., 9, 347–404, https://doi.org/10.1016/j.ocemod.2004.08.002, 2005.
Sterl, A., van den Brink, H., de Vries, H., Haarsma, R., and van Meijgaard, E.: An ensemble study of extreme storm surge related water levels in the North Sea in a changing climate, Ocean Sci., 5, 369–378, https://doi.org/10.5194/os-5-369-2009, 2009.
Tadesse, M., Wahl, T., and Cid, A.: Data-Driven Modeling of Global Storm Surges, Front. Mar. Sci., 7, 260, https://doi.org/10.3389/fmars.2020.00260, 2020.
Tausía, J., Delaux, S., Camus, P., Rueda, A., Méndez, F., Bryan, K. R., Pérez, J., Costa, C. G. R., Zyngfogel, R., and Cofiño, A.: Rapid response data-driven reconstructions for storm surge around New Zealand, Appl. Ocean Res., 133, 103496, https://doi.org/10.1016/j.apor.2023.103496, 2023.
Tiggeloven, T., Couasnon, A., Van Straaten, C., Muis, S., and Ward, P. J.: Exploring deep learning capabilities for surge predictions in coastal areas, Sci. Rep., 11, 17224, https://doi.org/10.1038/s41598-021-96674-0, 2021.
Vousdoukas, M. I., Voukouvalas, E., Annunziato, A., Giardino, A., and Feyen, L.: Projections of extreme storm surge levels along Europe, Clim. Dynam., 47, 3171–3190, https://doi.org/10.1007/s00382-016-3019-5, 2016.
Wahl, T., Haigh, I. D., Nicholls, R. J., Arns, A., Dangendorf, S., Hinkel, J., and Slangen, A. B. A.: Understanding extreme sea levels for broad-scale coastal impact and adaptation analysis, Nat. Commun., 8, 16075, https://doi.org/10.1038/ncomms16075, 2017.
Weisse, R., Dailidienė, I., Hünicke, B., Kahma, K., Madsen, K., Omstedt, A., Parnell, K., Schöne, T., Soomere, T., Zhang, W., and Zorita, E.: Sea level dynamics and coastal erosion in the Baltic Sea region, Earth Syst. Dynam., 12, 871–898, https://doi.org/10.5194/esd-12-871-2021, 2021.
Woodworth, P. L., Melet, A., Marcos, M., Ray, R. D., Wöppelmann, G., Sasaki, Y. N., Cirano, M., Hibbert, A., Huthnance, J. M., Monserrat, S., and Merrifield, M. A.: Forcing Factors Affecting Sea Level Changes at the Coast, Surv. Geophys., 40, 1351–1397, https://doi.org/10.1007/s10712-019-09531-1, 2019.
Wu, J.: Wind-stress coefficients over sea surface from breeze to hurricane, J. Geophys. Res.-Oceans, 87, 9704–9706, https://doi.org/10.1029/JC087iC12p09704, 1982.
Yu, H., Screen, J. A., Hay, S., Catto, J. L., and Xu, M.: Winter Precipitation Responses to Projected Arctic Sea Ice Loss and Global Ocean Warming and Their Opposing Influences over the Northeast Atlantic Region, J. Climate, 36, 4951–4966, https://doi.org/10.1175/JCLI-D-22-0774.1, 2023.
Yu, H., Screen, J. A., Xu, M., Hay, S., and Catto, J. L.: Comparing the Atmospheric Responses to Reduced Arctic Sea Ice, a Warmer Ocean, and Increased CO2 and Their Contributions to Projected Change at 2 °C Global Warming, J. Climate, 37, 6367–6380, https://doi.org/10.1175/JCLI-D-24-0104.1, 2024.
Zebaze, S., Anand, A., Fotso-Nguemo, T. C., Taguela, T. N., Ngavom, Z., Komkoua Mbienda, A. J., Fotso-Kamga, G., Choumbou, P. C., and Vondou, D. A.: Assessing the performance of the CMIP6 multi model mean in simulating precipitation and temperature across Africa, Model. Earth Syst. Environ., 11, 374, https://doi.org/10.1007/s40808-025-02560-3, 2025.
Zhong, Z., Kassem, H., Haigh, I. D., Sifnioti, D. E., Gouldby, B., Liu, Y., and Camus, P.: Advanced weather typing for downscaling of wave climate and storm surge at a UK nuclear power station, Ocean Dynam., 75, https://doi.org/10.1007/s10236-025-01682-7, 2025.