the Creative Commons Attribution 4.0 License.
the Creative Commons Attribution 4.0 License.
 | 13 May 2026
Seismo-acoustic and GNSS observations of a record-breaking Black Sea storm: repurposing geophysical sensors for environmental monitoring
Laura Petrescu
Bogdan Antonescu
Sorin Nistor
Iustin Floroiu
Dragoş Ene
Daniela Ghica
Constantin Ionescu
Andrei Anghel
Mihai Datcu
In August 2024, a devastating storm struck Romania's Black Sea coast, setting new precipitation records and marking an unusual change relative to historical climate observations. To investigate this extraordinary event, we integrated non-conventional sensors (seismic, GNSS, infrasound, and satellite data) with ERA5 meteorological reanalysis to monitor storm dynamics. High-frequency (>30 Hz) seismic signals captured precipitation, while microseismic bands (0.1–1 Hz) reflected wave-induced ground motion. Analysis of infrasound data via unsupervised learning delineated periods of acoustic quiescence from storm-related activity. The temporal evolution of these infrasound states coincided with distinct patterns in seismic ground motion, suggesting a shared origin in the storm's atmospheric dynamics. The infrasound array also detected over 1100 signals in the 0.6–7 Hz band, matching lightning discharges observed by geostationary satellites. GNSS data recorded a buildup of precipitable water vapor that peaked concurrently with intense rainfall, following a multi-day increase that preceded the main storm phase. This study highlights the value of integrating diverse, non-traditional datasets to enhance the resolution and depth of storm analysis. Their combined use offers a more holistic understanding of storm evolution and supports future research on the potential role of multi-sensor observations in improving early-warning systems in vulnerable coastal regions.
- Article
(12686 KB) - Full-text XML
-
Supplement
(851 KB) - BibTeX
- EndNote


Climate change has become a critical global issue, with far-reaching effects on weather patterns and the frequency and intensity of extreme events (Stott, 2016). These changes are not only contributing to more severe weather events but also altering the timing, location, and duration of storms, making them harder to predict and manage (Bengtsson et al., 2006). Understanding how to effectively monitor and predict the behavior of storms, particularly extreme ones, is crucial for improving forecasting models, enhancing early warning systems, and mitigating their impacts on both natural and human systems.
Traditional meteorological monitoring relies heavily on ground-based stations, weather radars, and satellite observations to track and predict storm behavior (Kober and Tafferner, 2009). These systems have been the backbone of weather forecasting for decades, providing valuable data on temperature, pressure, wind speed, and precipitation. However, while these methods are effective, they often have limitations in terms of spatial coverage (e.g. Sokol et al., 2021), particularly in remote or hard-to-reach areas. Additionally, they may struggle to capture certain atmospheric phenomena in real-time. As a result, non-conventional monitoring methods are increasingly being integrated into storm tracking efforts to complement existing meteorological approaches (e.g. Bosy et al., 2012; Burtin et al., 2016; Diaz et al., 2023; Coviello et al., 2024).
In this context, our study focuses on the integration of alternative environmental datasets, including GNSS stations, infrasound sensors, and seismic data, to track the dynamics of an extreme storm event, as part of a national climate change resilience strategy, implemented through the DTE Climate project (https://dteclimate.upb.ro/, last access: 9 April 2026). GNSS data provide valuable information on atmospheric water vapor, helping to track moisture changes that influence storm formation and intensity (Bosy et al., 2012; Marut et al., 2022). Infrasound sensors detect low-frequency acoustic waves generated by storm activity, such as lightning or large-scale weather system movements like microbaroms (e.g. Landès et al., 2012). Seismic data, though traditionally used for earthquake monitoring, can also record vibrations caused by storm-induced pressure changes, making it useful for detecting rainstorms, floods, or tropical cyclones (e.g. Retailleau and Gualtieri, 2021). Through the integration of these diverse sensor networks, our work highlights their synergy in improving storm detection, monitoring capabilities, and, potentially, early warning systems, contributing to more robust climate resilience strategies.
The Black Sea region (Fig. 1) is characterized by a unique combination of geographic and meteorological features that significantly influence its climate and weather patterns. Nestled between Europe and Asia, the Black Sea is bordered by six countries with diverse landscapes, from mountainous areas to flat plains. This geography, combined with the Black Sea's relatively shallow waters compared to oceanic environments and its connection to the Mediterranean through the Bosphorus Strait, creates an environment where rapid changes in weather are common. Understanding the dynamics of these extreme weather events is crucial, as they can have a profound impact on the environment, economy, and daily life in the region. Monitoring such events is key to improving our ability to predict their occurrence and intensity. By studying the complex atmospheric processes that govern these storms, we can enhance predictive models and refine early warning systems, ultimately helping to mitigate the risks and protect the communities and ecosystems most vulnerable to these extreme weather phenomena.
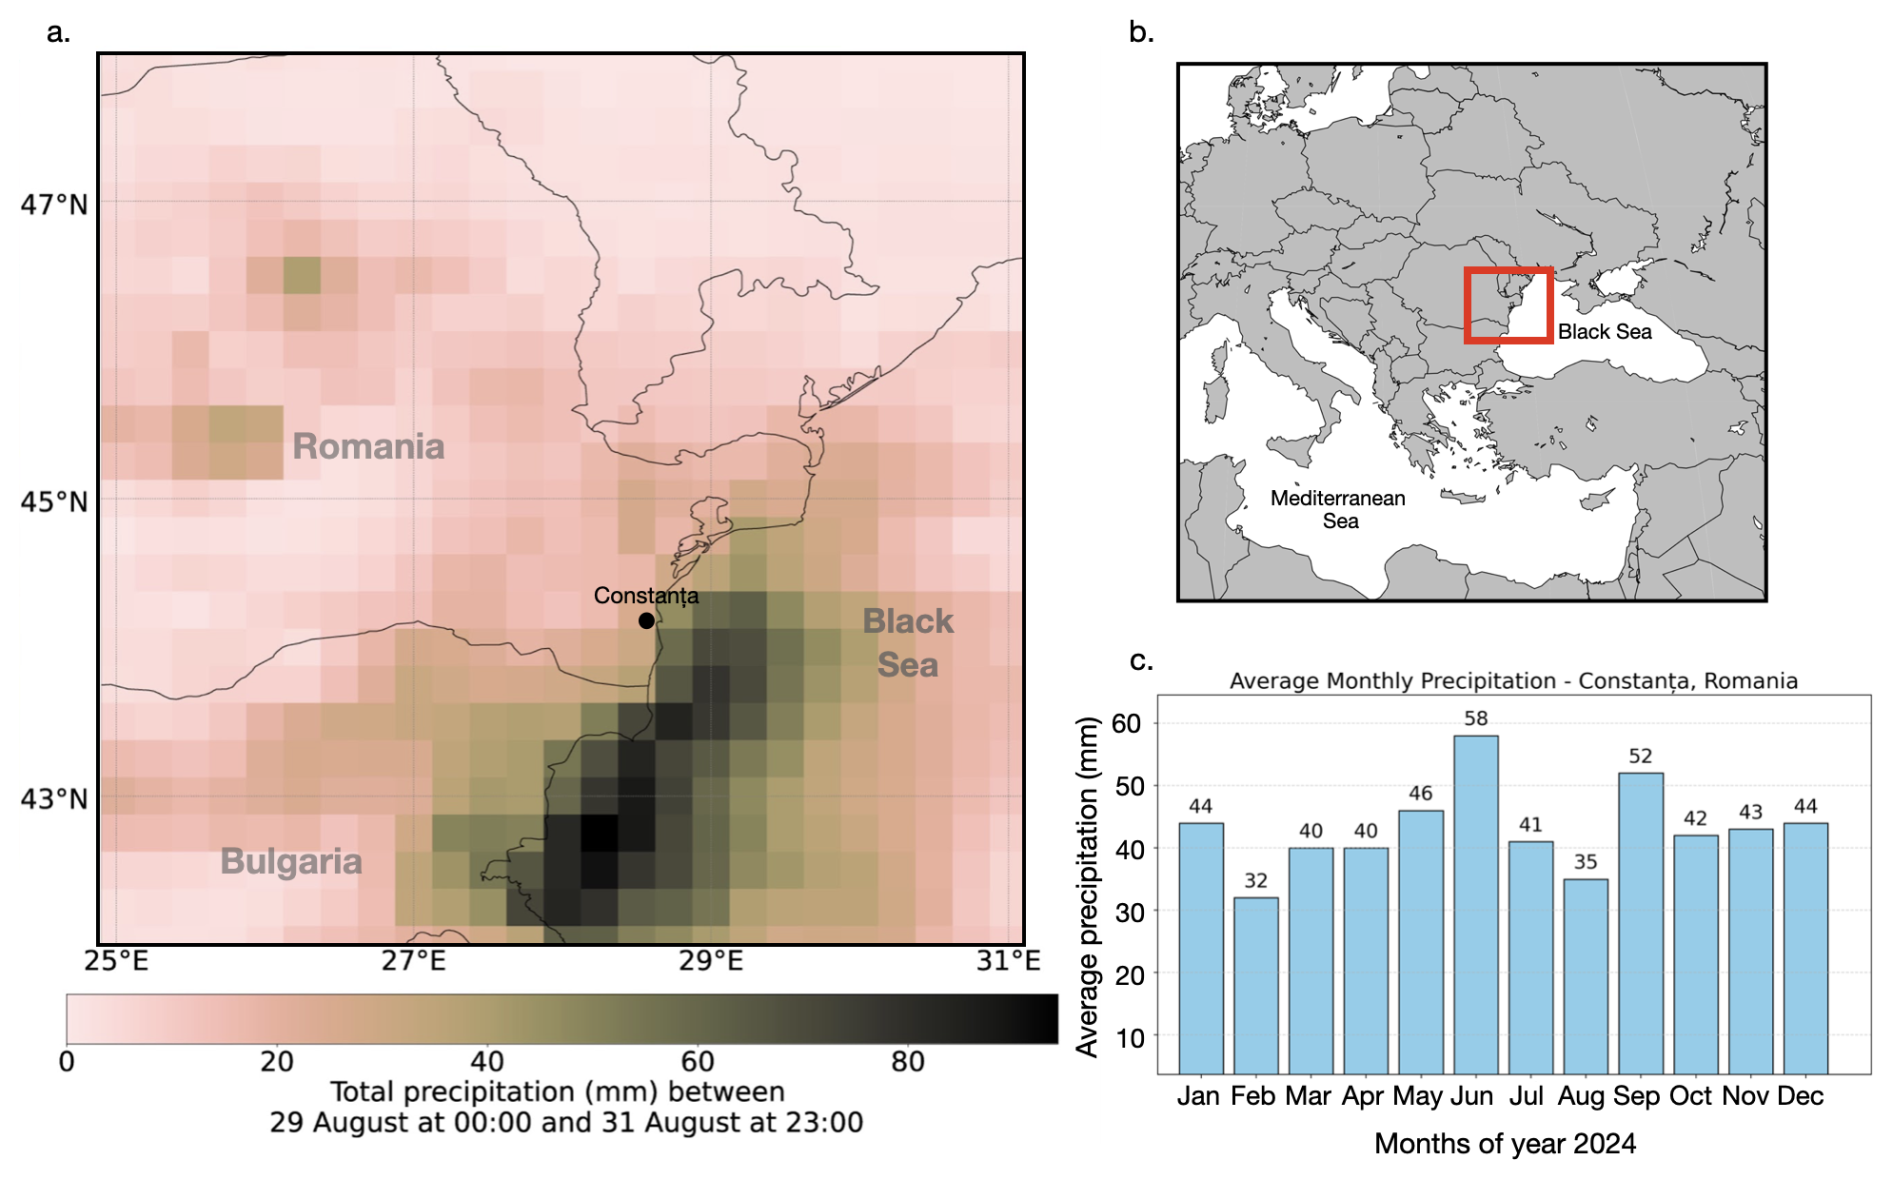
Figure 1(a) Total precipitation accumulated (in mm, shaded according to the scale) between 29 August 00:00 UTC and 31 August 23:00 UTC extracted from ERA5 data. (b) Map of Europe with red square marking the study region; (c) Average monthly precipitation rates in Constanţa, Romania.
In August 2024, Romania experienced severe flooding, largely driven by a storm that brought unusual precipitation patterns to the Black Sea coastal region. Exceptional precipitation totals were recorded over south-eastern Romania in particular in Mangalia (234.7 mm), Agigea (145 mm), and Tuzla (118 mm), leading to significant flooding in coastal towns (Fig. 1). Over 800 emergency calls prompted large-scale intervention by ISU Dobrogea, focusing on evacuations, debris clearance, and infrastructure restoration (Antonescu et al., 2024). According to the National Meteorological Agency official records (https://www.meteoromania.ro/clim/caracterizare-lunara/cc_2024_08.html, last access: 9 April 2026), one of the coastal stations at Mangalia, recorded a total of 343.6 mm of precipitation in August 2024, breaking the previous record of 159.1 mm from 1947, and significantly surpassing the average monthly precipitation values for this area (Fig. 1c). A remarkable 234.7 mm of this total fell in a single day on 31 August 2024, highlighting the event's exceptional intensity.
An analysis by ClimaMeter (https://www.climameter.org/, last access: 9 April 2026, Faranda et al., 2024; Antonescu et al., 2024) immediately after the storm, showed that low pressure systems similar to the one that caused the floods typically produce 15 % less rainfall in eastern Romania compared to historical trends. However, this particular storm led to a significant local increase in precipitation, particularly in Constanţa, where daily rainfall reached up to 5 mm d−1, or up to 10 % more than usual. ClimaMeter's analysis compares events of this type to historical analogues over the past several decades, providing context for how unusual this storm was. According to Antonescu et al. (2024), the local precipitation anomaly in this event is mostly linked to human-induced climate change, with natural climate variability playing a modest role. Studying this unusual storm and its atmospheric characteristics demonstrates the value of using all available observational infrastructure, including geophysical sensors, to monitor extreme precipitation events, gain insights into atmospheric processes, and support preparedness and resilience in the context of ongoing climate variability.
The analysis of the storm event integrates a variety of data sources and methodologies to provide a comprehensive understanding of its dynamics. Seismic data, infrasound measurements, GNSS water vapor data, and ERA5 reanalysis data are all utilized to capture different aspects of the storm's behavior (Fig. 2). Seismic data offers insights into ground vibrations and atmospheric disturbances, while infrasound monitoring detects low-frequency acoustic signals generated by lightning and other meteorological phenomena. GNSS water vapor data provides valuable information on atmospheric moisture. Additionally, ERA5 reanalysis data (Hersbach et al., 2020), which provides detailed atmospheric and wave dynamics data, helps contextualize the storm's impact within broader weather patterns. Together, these diverse data sources enable a multifaceted approach to studying the storm and its effects.
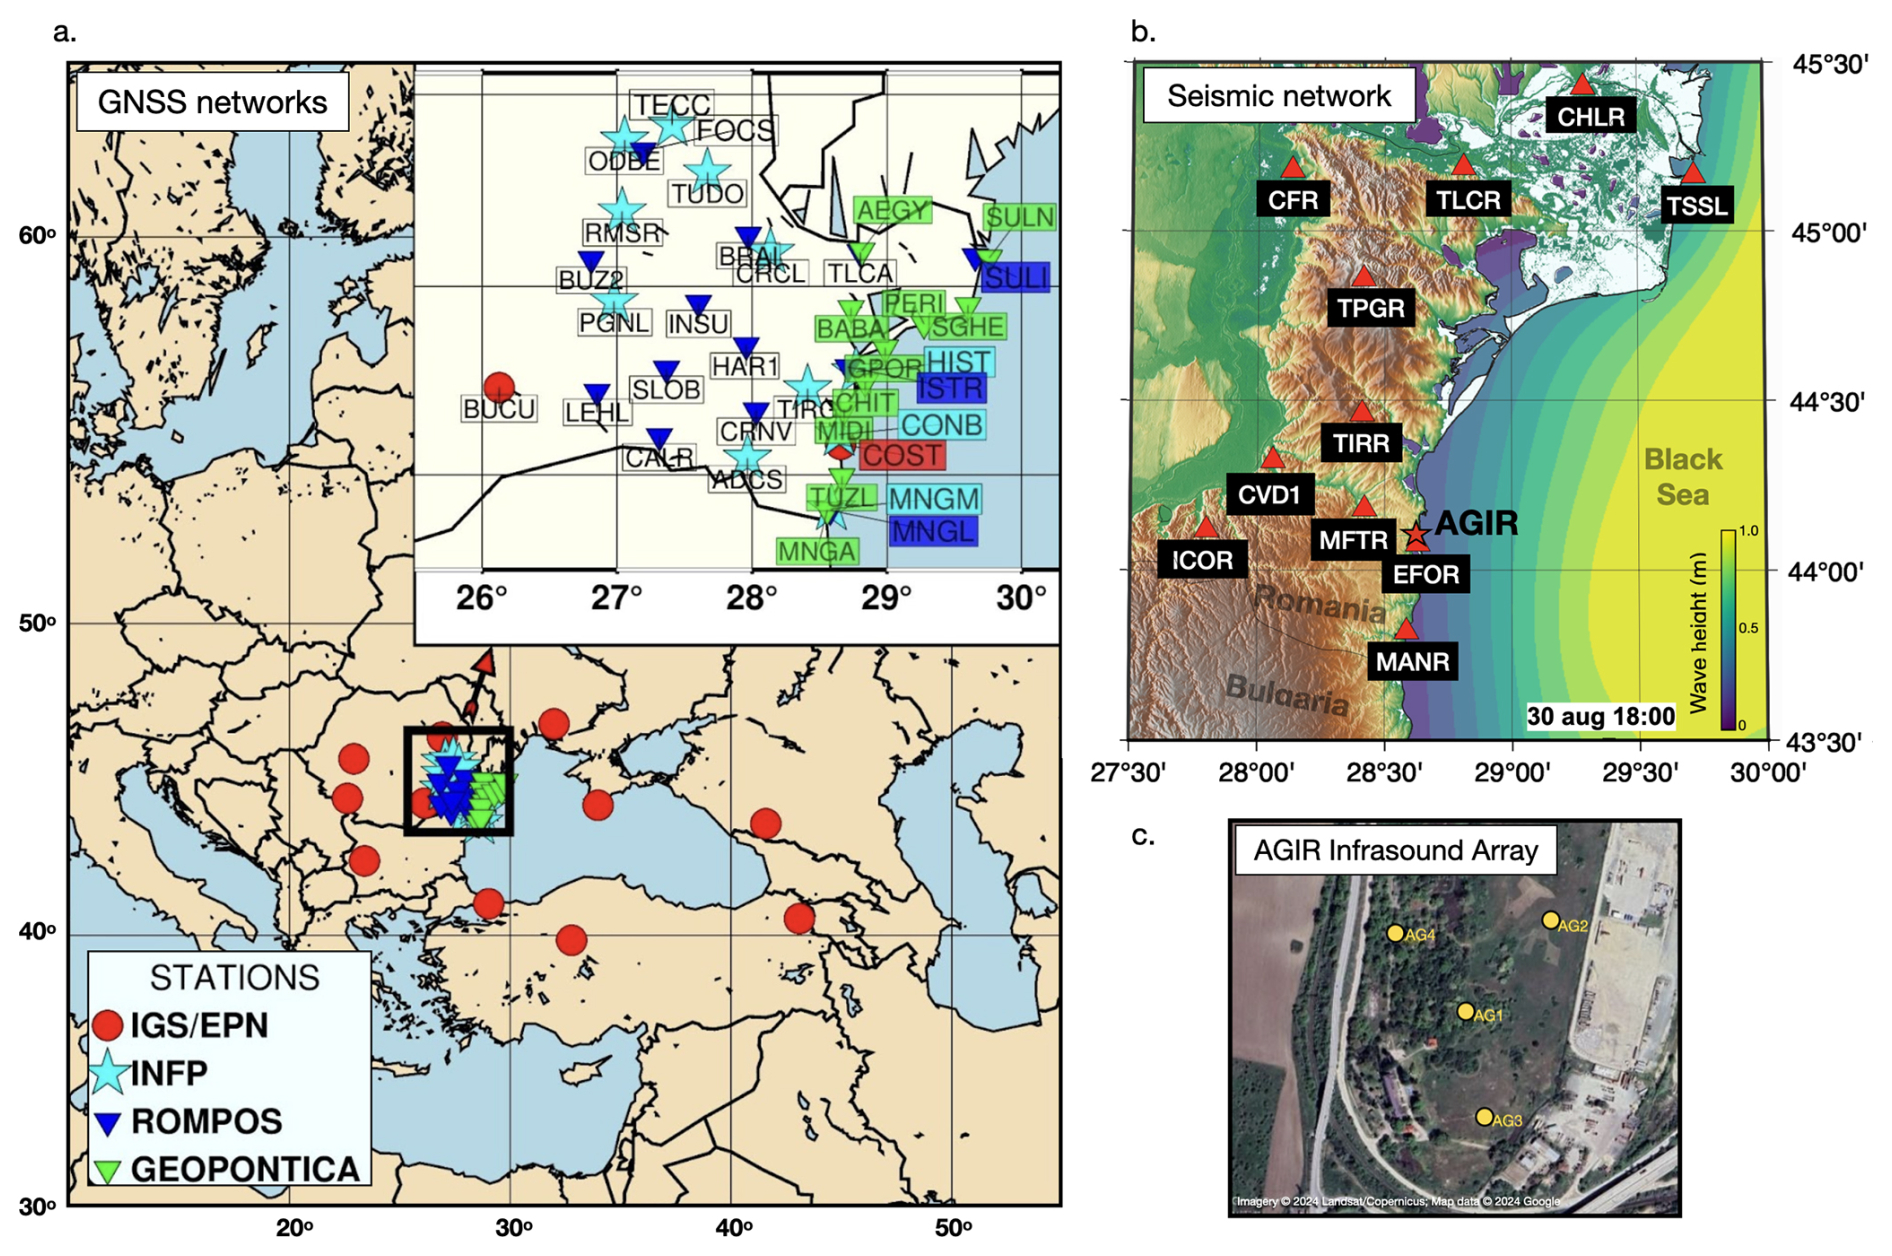
Figure 2(a) Map of Europe and the Black Sea coast showing GNSS stations and their belonging networks used for analysis in this study. (b) Map of the Romanian sea coast showing seismic stations (red triangles) and the location of the AGIR infrasound array (star). Imagery © 2024 Landsat/Copernicus, Map data ©2024 Google. Coloured contours represent total wave height at 18:00 UTC on the 30 August 2024 from ERA5 reanalysis data. (c) The layout of the AGIR infrasound array.
3.1 Seismic Data
Seismic data represents vibrations of the Earth's surface, commonly referred to as seismic noise. These low-amplitude movements are recorded across the Earth's surface and are traditionally used to study the Earth's internal structure and detect earthquakes. Recently, it has increasingly found applications in meteorology and hydrology, particularly for monitoring weather events (e.g. Diaz et al., 2023; Hua et al., 2023), destructive flood episodes (Burtin et al., 2016), ocean storms, and tropical cyclones (Gualtieri et al., 2018). Seismic noise can reveal the impact of atmospheric and oceanic conditions, providing valuable insights into weather events and climate changes (e.g. Bromirski and Duennebier, 2002; Aster et al., 2008, 2023). In particular, seismic data helps track variations in the Earth's surface caused by factors such as ocean waves, wind, and precipitation, offering a unique perspective on these phenomena (e.g. Grevemeyer et al., 2000; Borzì et al., 2022).
When the seismic noise is analyzed in the frequency domain, two clear peaks emerge in the spectrum (Fig. 3), reflecting distinct types of ocean wave interactions (Koper and Burlacu, 2015; Ardhuin et al., 2019; Tanimoto and Anderson, 2023). The primary peak, observed in the range of 10–20 s (0.05–1 Hz), is generated by the impact of “swell” waves traveling in the same direction, inducing pressure variations in the Earth's crust that match the period of the waves. The secondary peak, in the range of 5–10 s (0.1–0.5 Hz), is produced by wind-driven waves, which propagate in different directions and generate pressure oscillations on the ocean floor (Ebeling, 2012). These seismic signals directly link ocean conditions with seismic activity (Li et al., 2020), providing insights into large-scale weather phenomena like ocean storms.
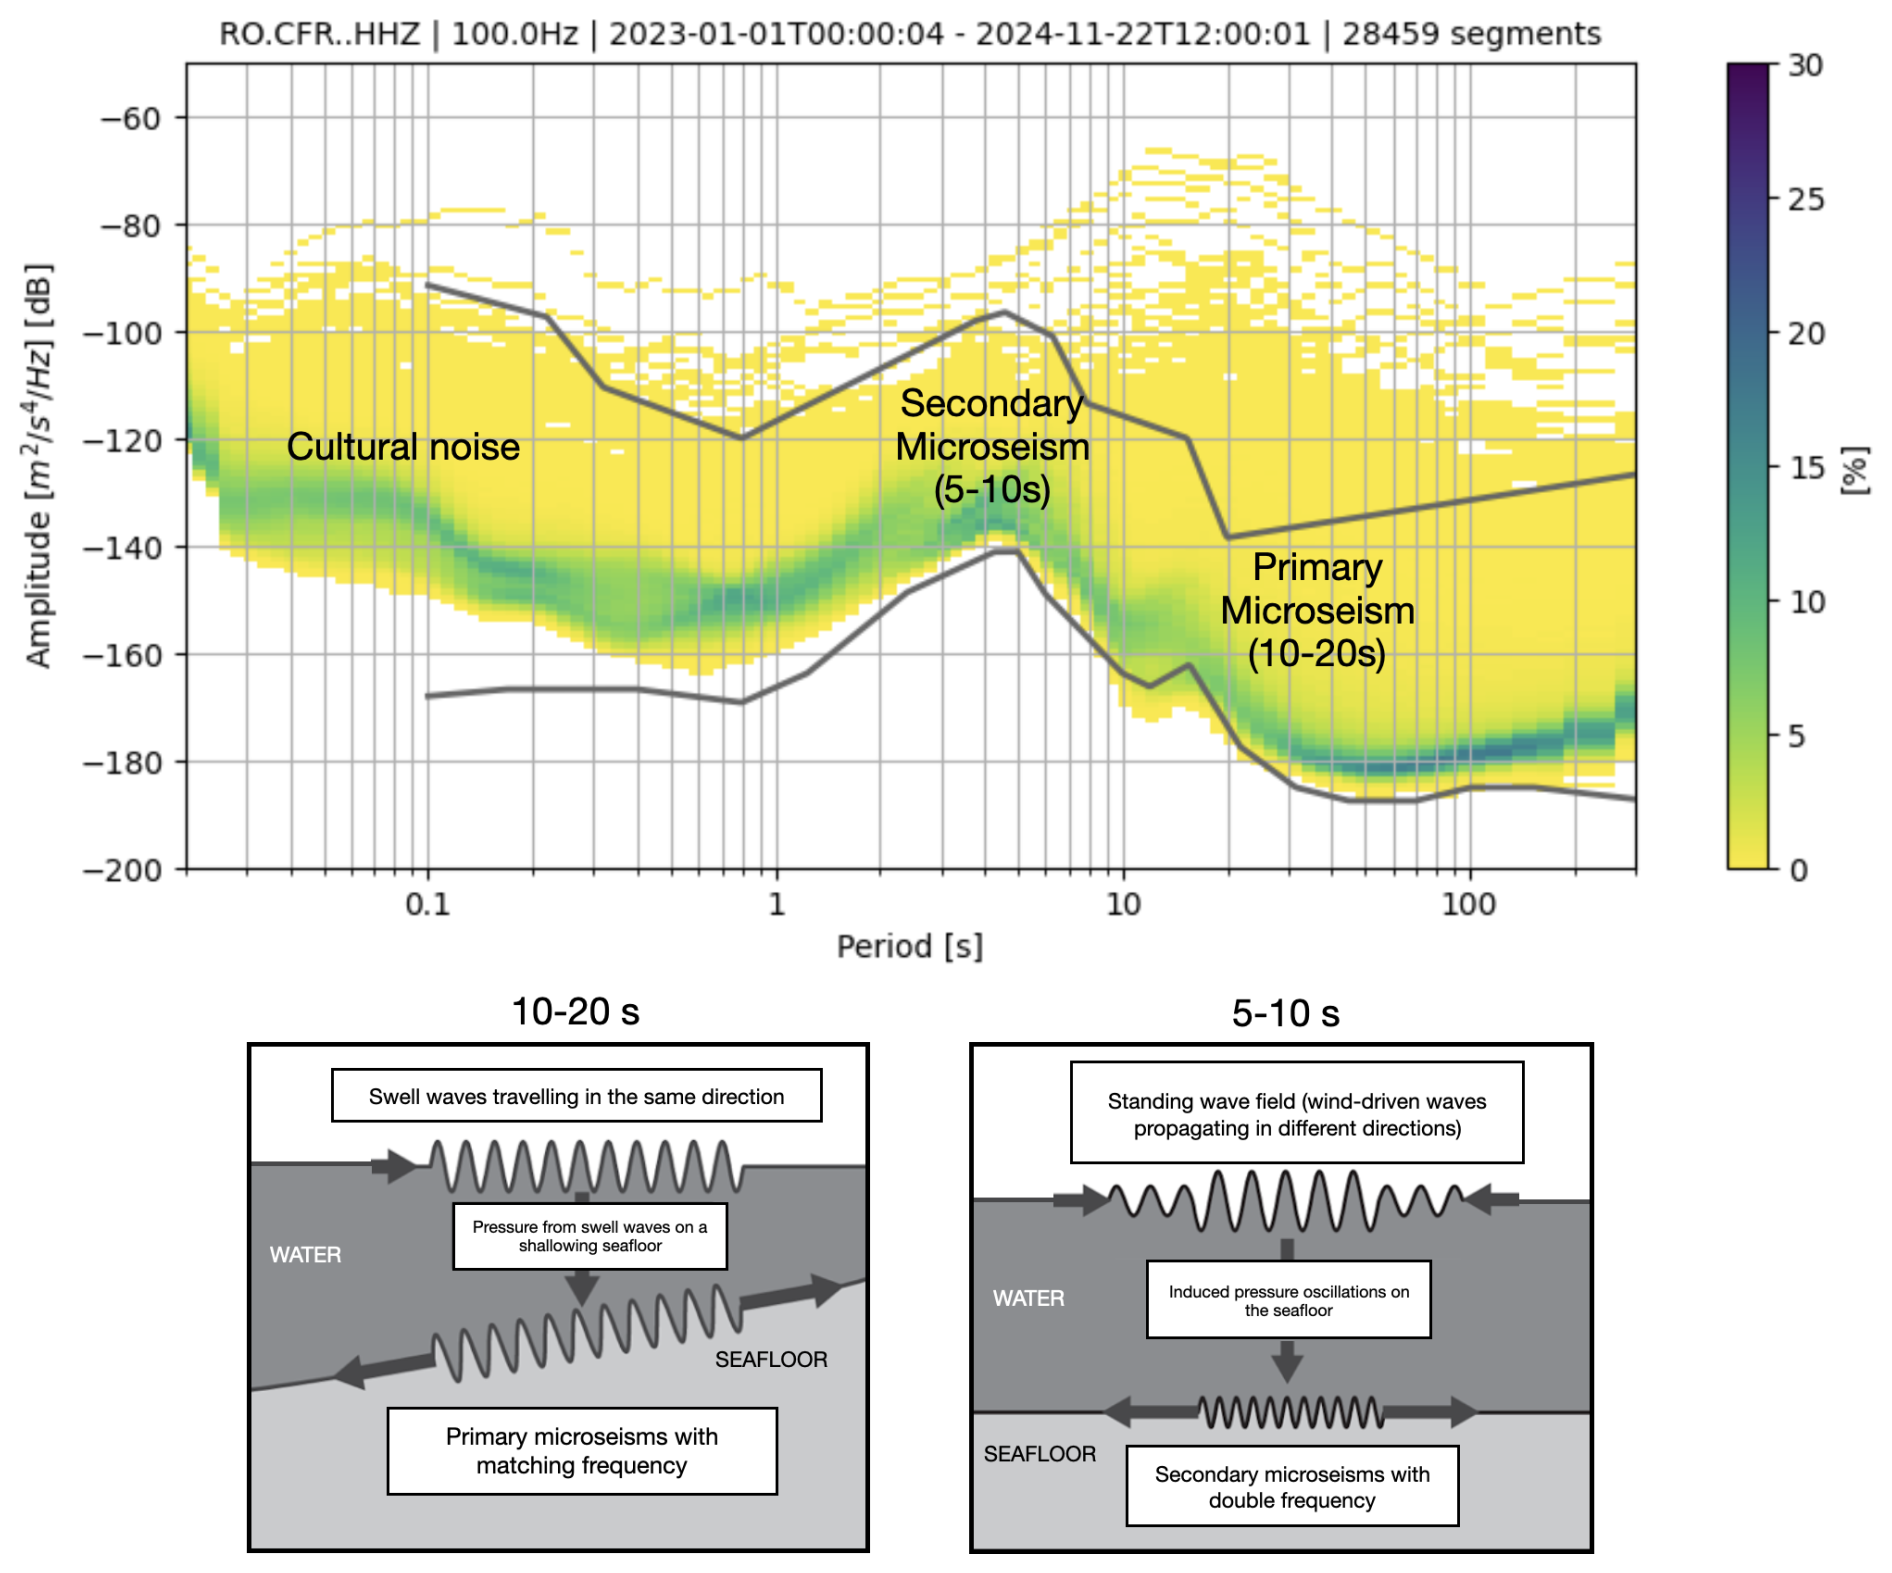
Figure 3Probabilistic Power Spectral Density (PPSD) of seismic noise for station CFR, over two years, showing key sources of primary and secondary microseisms. Below, sketches illustrate the generation mechanisms: primary microseisms are caused by unidirectional swell waves inducing pressure fluctuations on a shoaling seafloor, while secondary microseisms result from nonlinear interactions of wind-driven waves over deeper water (modified after Ebeling, 2012).
Higher frequencies above 30 Hz are associated with the effects of precipitation and wind, as seen in studies like Rindraharisaona et al. (2022) or Diaz et al. (2023). These higher-frequency seismic signals help track more localized weather events, such as storms and heavy rainfall. Seismic data, when integrated with other meteorological tools, enhances the ability to monitor and predict weather events.
To analyse seismic data, the raw traces are first corrected for instrument response and converted to units of velocity. These are then filtered with bandpass butterworth filters adapted to capture the target signal: low pass filtering (<1 Hz) for wave-seafloor coupled interactions and high pass filtering (>30 Hz) to identify possible signatures of precipitation, essentially induced pressure fluctuations in the ground converted to weak seismic vibrations due to rain drops. Spectrograms of these filtered seismic traces were computed using short-time Fourier transforms implemented in the scipy.signal package, with the default 256-sample window length used for each segment, to visualise signatures of the hydro-meteorological phenomena in the frequency content of ground vibrations.
Potential environmental signals in the seismic data were also investigated using power spectral density (PSD) analysis. To account for variations over time, a Probabilistic Power Spectral Density (PPSD) method was applied. The continuous waveform was divided into 1 h time windows with 50 % overlap, and a PSD was computed for each window after instrument-response correction and basic preprocessing. These estimates were combined into a probability distribution, providing a statistical overview of typical and transient noise levels across frequencies. The PPSD was produced using ObsPy (Beyreuther et al., 2010), which handles data gaps and ensures reliable normalization.
Temporal variations in PSD amplitudes are also analyzed to track changes in seismic noise at specific frequencies. By extracting PSD values at selected frequencies that are expected to capture primary and secondary microseisms, time series of noise levels are generated. These temporal PSDs allow for the identification of trends and correlations with environmental factors, such as ocean wave activity or weather conditions.
3.2 Acoustic Data
Infrasound waves are low-frequency acoustic waves that are inaudible to the human ear, typically below 20 Hz. These waves are generated by a variety of natural and anthropogenic sources, including meteorological events, volcanic eruptions, earthquakes, and human activities such as explosions and industrial processes (Campus and Christie, 2009; Bondár et al., 2022). In particular, infrasound is often associated with phenomena like thunderstorms, ocean waves, and large-scale atmospheric events, which generate pressure fluctuations that propagate through the atmosphere (e.g. Stopa et al., 2012; Landès et al., 2012; Listowski et al., 2022). These waves provide valuable information about the dynamics of weather systems (e.g. Hupe et al., 2019), making them an essential tool for monitoring and understanding environmental processes (e.g. Brachet et al., 2009; Hupe et al., 2022). Infrasound associated with thunderstorms, primarily generated by acoustic waves from thunder, has been studied previously and shown to be detectable at distances ranging from tens to hundreds of kilometers (e.g., Assink et al., 2008; Šindelářová et al., 2015, 2021). Nevertheless, infrasound arrays detect signals from multiple storm-related sources, not just thunder (e.g., Waxler et al., 2024). In the present study, we build on this understanding by integrating these signals with seismic, satellite, meteorological, and water vapor observations to investigate what these complementary datasets reveal about storm evolution in a coastal environment.
For the monitoring of infrasound signals, we use data from an infrasound array system located at Eforie Nord-Agigea, Romania (AGIR, Fig. 2). This array consists of multiple sensors, including SIS-1 infrasonic sensors (Seismowave), equipped with global positioning systems (GPS) and noise reduction technology.
To analyze the seismo-acoustic characteristics of the 30–31 August Black Sea storm, we used a two-pronged approach: (1) single sensor signal analysis based on feature extraction and unsupervised machine learning, and (2) array-based analysis using all the sensors of AGIR and classic multi-channel correlation algorithms. Together, these methods provide complementary insights into the acoustic behavior of the storm, capturing both local signal characteristics and spatial coherence across sensors.
For the single-station analysis, infrasound data recorded at the AGIR sensor (Fig. 2) was segmented into 30 min windows, and a set of time-frequency features was extracted to characterize the signal dynamics (Supplement). These features describe how energy and frequency content evolve over time, providing insights into the structure of the infrasound signal. Parameters such as spectral centroid and spectral rolloff are standard descriptors in acoustic signal analysis and are suitable here because they effectively capture shifts in dominant frequency produced by lightning-generated acoustic waves or the passage of pressure disturbances, while spectral flux highlights changes in broadband acoustic energy (Pásztor et al., 2023). Spectral entropy reflects the complexity of the frequency distribution, which increases during turbulent atmospheric conditions, and the zero-crossing rate, mean, and variance of the power spectrum summarize overall activity and variability. This feature set provides a compact representation of the signal suitable for unsupervised machine-learning approaches such as clustering, techniques widely used in data mining to identify patterns in multidimensional time-frequency data (e.g., Coates and Ng, 2012), and allows us to distinguish physically interpretable stages of storm-induced changes in the infrasound wavefield.
The extracted features were used as input for K-Means clustering (MacQueen, 1967), an unsupervised machine learning algorithm that partitions data into a predefined number of groups. K-Means minimizes within-cluster variance by iteratively assigning feature vectors to the nearest cluster centroid and updating the centroids based on the grouped data. This clustering method enables the identification of distinct acoustic patterns in the signal (e.g. Pásztor et al., 2023), offering a data-driven way to segment the storm's infrasound profile without requiring prior labels or assumptions. Prior to clustering, the features were standardized using z-score normalization, to ensure comparable scaling across variables. The optimal number of clusters was determined using the elbow method, which evaluates within-cluster variance as a function of cluster number (Supplement). To select the most informative features, we applied covariance pruning, and the temporal evolution of the features was visualized to ensure meaningful representation. This procedure resulted in six clusters, providing a balanced representation of the infrasound dynamics while avoiding over-segmentation or overfitting. By combining multiple features in the clustering, this method captures the evolving acoustic states of the storm in a compact, interpretable form.
In parallel with the single-station analysis, we also applied the Progressive Multi-Channel Correlation (PMCC) method, as implemented in the DTK-PMCC software (Cansi and Le Pichon, 2008; Le Pichon et al., 2010) to detect and analyze coherent acoustic signals across an infrasound array. The PMCC method targets signals generated by atmospheric sources such as lightning (i.e., associated thunders) or other pressure disturbances, operating in the low-frequency range of 0.7 to 7 Hz. It is specifically suited for mini-array configurations, where signal coherence between closely spaced sensors can be exploited for precise signal detection and characterization.
The PMCC algorithm was implemented using a multi-resolution configuration following the standardization proposed by Garcés (2013), with window lengths and frequency bands arranged in third-octave bands. A total of 19 frequency bands were used, covering 0.1–7 Hz. Window lengths decrease logarithmically with frequency, ranging from 258 s in the lowest band to 4 s in the highest band. A 10 % time step was applied (corresponding to 90 % overlap between consecutive windows), and this scheme repeats every decade. Within each time-frequency segment, cross-correlations are computed between all sensor pairs to identify coherent wavefronts, signals that exhibit consistent arrival times across the array. From these detections, PMCC estimates several key propagation parameters, including backazimuth (the direction of arrival), horizontal trace velocity, amplitude, duration, and dominant frequency. This approach is particularly effective in noisy environments and enables the discrimination of storm-generated infrasound from background signals or unrelated acoustic sources. The algorithm's output consists of a time-frequency map of signal detections enriched with physical metadata, allowing for detailed interpretation of the storm's acoustic footprint and its temporal evolution.
3.3 Satellite Observations
We also incorporated data from the Meteosat Third Generation (MTG) satellite system (Holmlund et al., 2021), specifically from its Lightning Imager (LI) sensor (Viticchie et al., 2020). The MTG satellites operate in geostationary orbit at approximately 36 000 km altitude, providing continuous observations over Europe, Africa, and surrounding waters. The Lightning Imager detects cloud-to-cloud, cloud-to-ground, and intra-cloud lightning flashes using four cameras that collectively cover 86 % of the Earth's visible disc from the satellite's perspective.
For this study, we used Level 2 group data, which includes the geographical coordinates and timing of each detected flash. The MTG Lightning Imager detects total lightning (cloud-to-cloud and cloud-to-ground) optically at 777 nm, with 4.5 km pixel resolution at the sub-satellite point and 1 ms frame interval (Holmlund et al., 2021; Kokou, 2023). Level-2 achieves detection efficiencies of ∼80 %–90 %, capturing even weak flashes reliably, with false alarm rates <0.3 (Enno et al., 2025). Flash geolocation uncertainty reaches 5–10 km near the edge of the instrument's field of view, where off-nadir viewing geometry amplifies parallax effects (Bližňák and Sokol, 2026). By mapping these detections, we were able to analyze the spatial distribution and temporal evolution of the storm's lightning activity. The dataset also offered insights into the storm's intensity and structure, complementing other meteorological observations.
Associations between infrasound detections and lightning flashes detected by MTG within 50 km of the AGIR infrasound station were investigated by assuming direct-path acoustic propagation and a correspondence between infrasound time-of-arrival and the MTG lightning discharge time (after Assink et al., 2008):
where d is the distance between the lightning discharge and the infrasound station, c=340 m s−1, and s accounts for timing uncertainty associated with the simplified propagation assumption. In particular, infrasound travel time from thunder sources can vary due to atmospheric temperature and wind variations along the propagation path, which affect the effective sound speed and may introduce deviations from the assumed constant-velocity, straight-path propagation. Additionally, a maximum angular deviation of 10° between the observed infrasound backazimuth and the MTG-derived backazimuth is permitted for an association to be accepted.
3.4 GNSS Data
The use of GNSS technology for atmospheric monitoring provides a powerful tool for analyzing extreme weather events. Beyond its well-known applications in navigation, timing, positioning and crustal dynamics (Nistor et al., 2021a, b), GNSS has become a reliable method for sensing tropospheric water vapour, an essential driver of weather systems and a key variable in forecasting models (Guerova et al., 2016; Vaquero-Martínez and Antón, 2021). Over the past two decades, ground-based GNSS networks in Europe have contributed significantly to operational meteorology by providing near real-time estimates of atmospheric water vapour, aiding in the detection and tracking of severe weather, including heavy rainfall and storms (Karabatić et al., 2011; Priego et al., 2017; Jones et al., 2020). These high-resolution observations have proven valuable for both nowcasting and validating numerical weather prediction models (Wilgan et al., 2015; Bosy et al., 2012; Awange, 2012).
In this study, GNSS data were collected from several networks (Fig. 2), including the International GNSS Service (IGS, Johnston et al., 2017), the EUREF Permanent Network (EPN, Bruyninx et al., 2012), the Romanian Position Determination System (ROMPOS, Iliescu et al., 2019), and GEOPONTICA (Dimitriu et al., 2017). A total of 37 permanent GNSS stations were analyzed over a 30 d period, with the rainiest interval selected at the midpoint of the study period. These stations provide high-quality, continuous observations critical for atmospheric monitoring.
The data were processed using a double-differenced, ionosphere-free combination of L1 and L2 carrier phases. This approach helps minimize errors such as ionospheric delays, satellite clock biases, and other common atmospheric effects. The resulting Zenith Tropospheric Delay (ZTD) values were then corrected using the Vienna Mapping Functions 3 (VMF3, Landskron and Böhm, 2018), which improves the accuracy of ZTD by accounting for variations in the troposphere's atmospheric conditions. Once the ZTD was refined, it was converted into integrated precipitable water vapor (PWV) using surface meteorological data (temperature and pressure) from co-located weather stations, following the method outlined by Bosy et al. (2012). This process allowed for the derivation of high-resolution atmospheric water vapor content, critical for analyzing the dynamics of the extreme storm event over the Black Sea. By combining GNSS-derived PWV with data from other observational sources, the study captured the temporal and spatial variations in atmospheric moisture, offering valuable insights into the storm's development and intensity.
3.5 Meteorological Data
To compare the infrasound signals captured during the Black Sea extreme storm event, we extracted meteorological data from the open-access ERA5 reanalysis dataset, produced by the European Centre for Medium-Range Weather Forecasts (ECMWF). This dataset provides a comprehensive record of global weather conditions from 1950 to the present (Hersbach et al., 2023). ERA5 combines observational data and advanced numerical models to generate relatively high-resolution atmospheric parameters compared with earlier global reanalyses, including precipitation (Fig. 1), wind speed, and wave height. ERA5 has been extensively validated (Jiao et al., 2021; Wu et al., 2022; Soci et al., 2024) and is widely used in studies of storm evolution and precipitation dynamics (e.g. Dullaart et al., 2020; Tiberia et al., 2021; Price et al., 2025), making it a suitable choice for the mesoscale processes examined here.
For our study, the ERA5 data was used to track the meteorological context of the storm, offering insights into the intensity of precipitation, the evolution of wind patterns, and the development of oceanic wave heights. With a temporal resolution of 1 h and spatial resolution of 0.25° × 0.25°, ERA5 allows for a mesoscale comparison of the storm's meteorological characteristics over time. While its spatial averaging cannot resolve localized convective-scale precipitation, it provides a vital benchmark for qualitative comparisons and for testing multi-sensor monitoring potential. These comparisons help us understand the storm's dynamics and assess its impact, further enhancing the interpretation of infrasound signals and aiding in future storm prediction and monitoring efforts. The open-access nature of ERA5 ensures broad accessibility, contributing to the transparency and reproducibility of our storm analysis (Copernicus Climate Change Service, Climate Data Store, 2023).
4.1 Seismic signatures of storm evolution
High frequency (>30 Hz) analysis of seismic noise reveals strong signals during periods of intense rainfall (Fig. 4). Specifically, the displacement envelope at station MANR and its spectrogram for 30 August, 12:00 UTC to 31 August, 06:00 UTC (Fig. 4b, c) reveal strong signal around midnight, when recorded precipitation exceeded 20 mm per 10 min. Similar temporal patterns in the seismic spectrogram were also visible when compared with hourly precipitation levels from ERA5, indicating that the high amplitude of energy observed above 30 Hz is most plausibly generated by raindrop impacts.
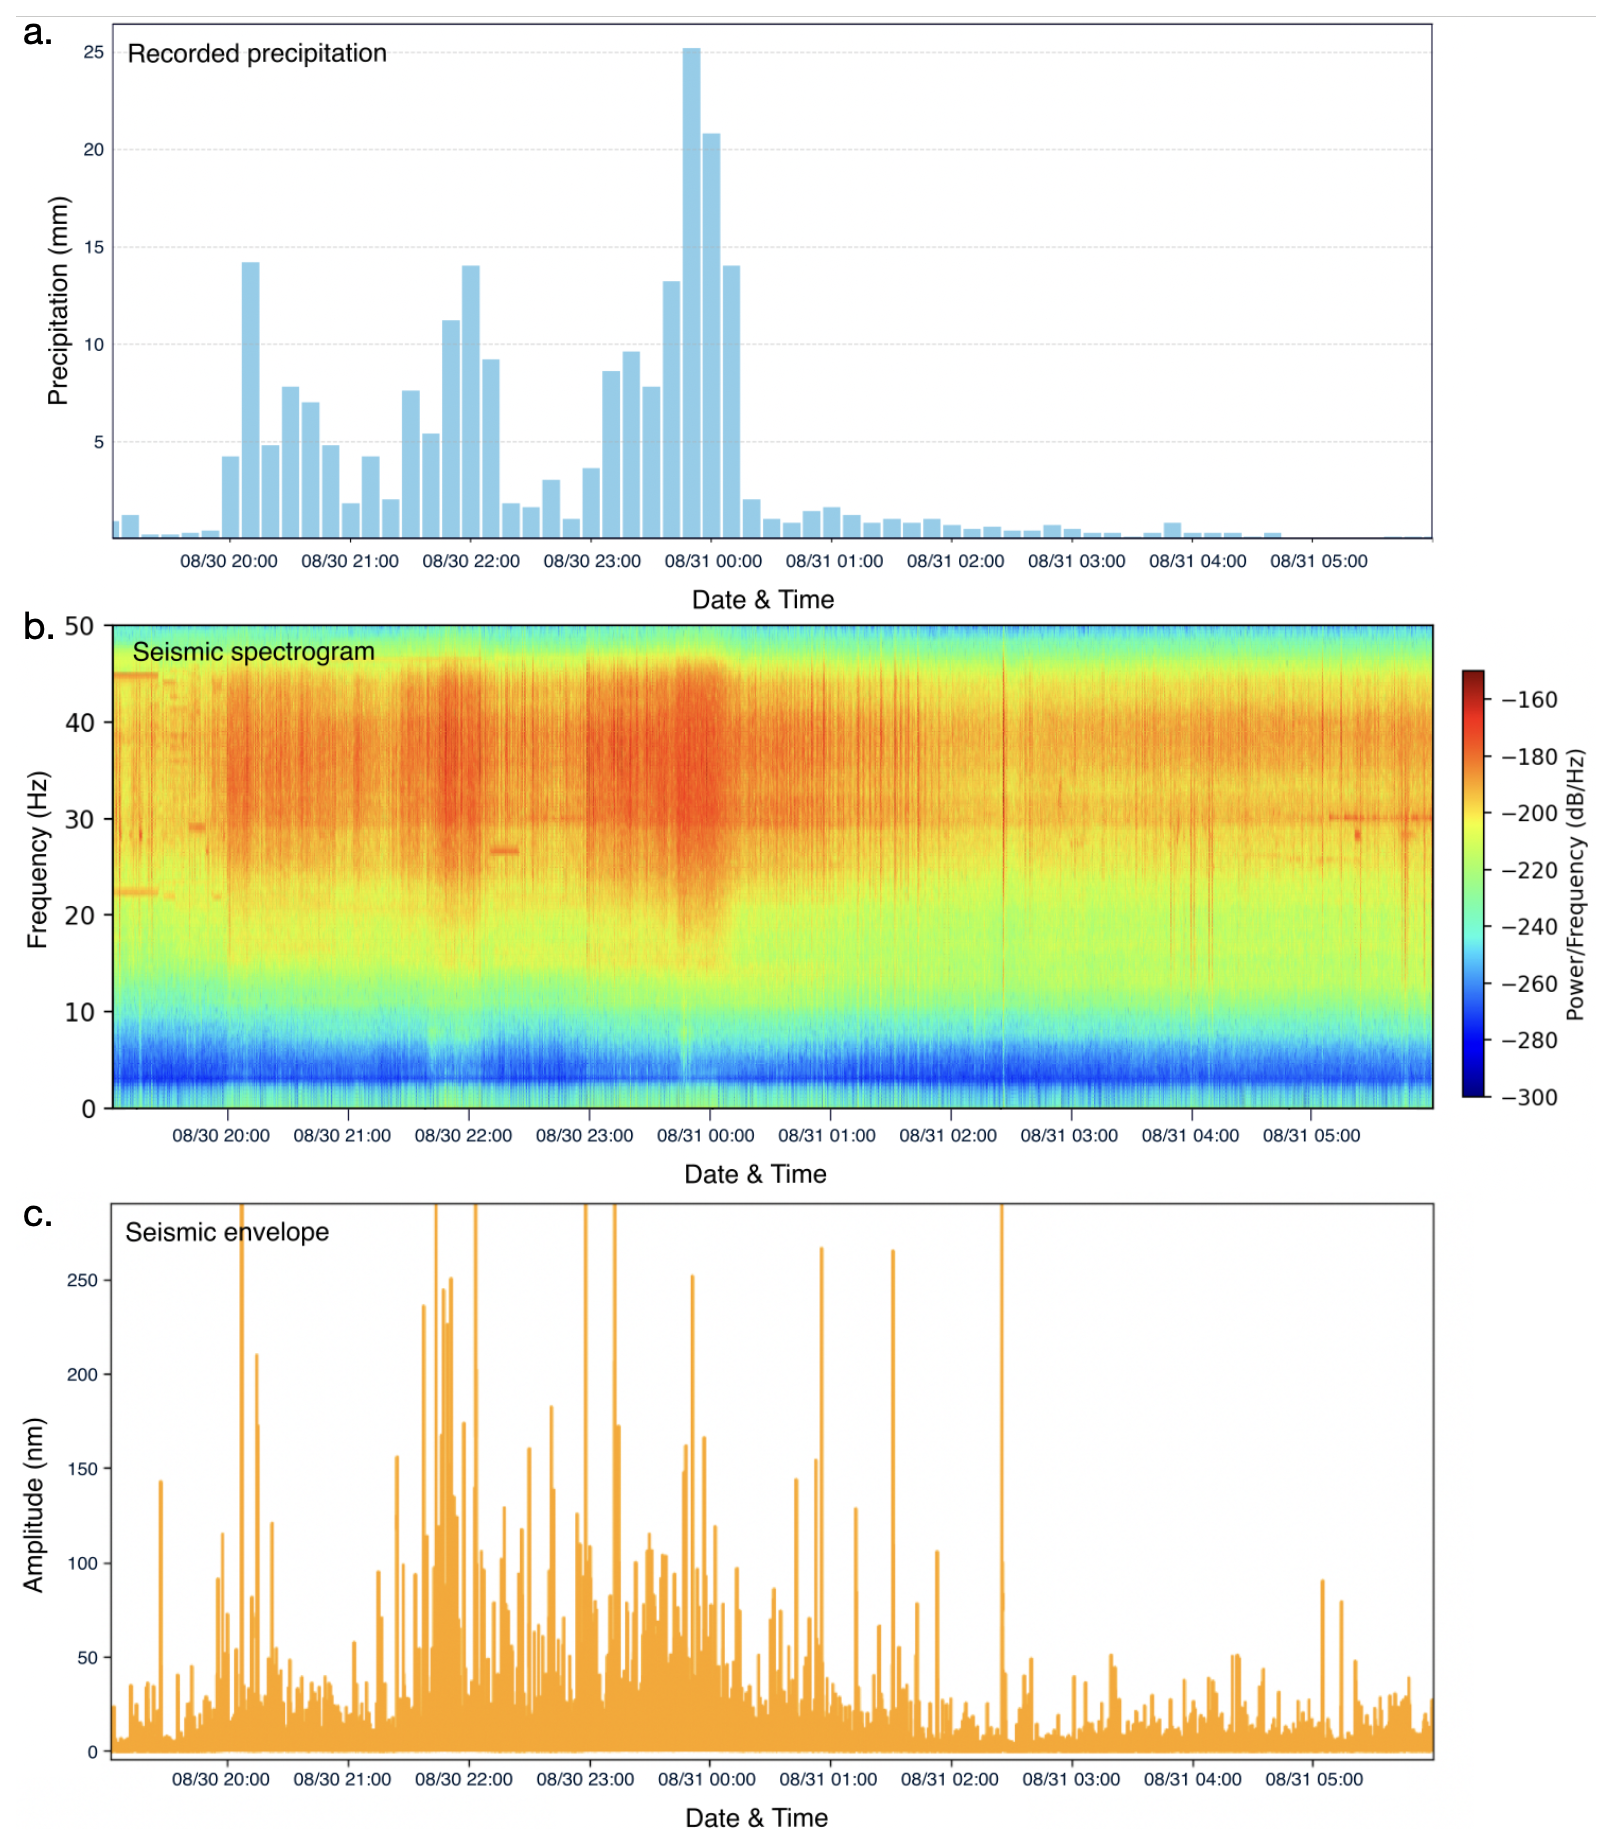
Figure 4High frequency (30–50 Hz) observations of the storm at station MANR. (a) Time series of total precipitation every 10 min from the ANM station at Mangalia. (b) Spectrogram of the seismic time series for station MANR. (c) Envelope of the displacement seismogram at station MANR.
However, this correspondence is not uniform across all rainfall episodes. While the main precipitation maximum on 30–31 August produces a clear and sustained seismic response, several lower-intensity precipitation pulses show a much weaker or no recognizable signature in either the seismic envelope or spectrogram. This behaviour is consistent with previous work (e.g., Rindraharisaona et al., 2022), which demonstrates that only rainfall above a certain intensity, or involving sufficiently large drops, generates impact forces strong enough to be detected by broadband seismometers. Our observations therefore reflect both strong positive correlations during intense rainfall and the lack of seismic expression for weaker precipitation. This selective sensitivity supports the interpretation that high-frequency seismic noise can reflect strong rainfall peaks but is less responsive to light or moderate precipitation, an important nuance when interpreting multi-sensor relationships in this study.
Anthropogenic seismic noise is typically strongest at low to mid frequencies (<25 Hz), where day-night variations reflect traffic, human activity, and transient signals from machinery, while higher-frequency bands (25–45 Hz) may include periodic contributions from rotating equipment (e.g., Groos and Ritter, 2009; Díaz et al., 2017). The bandwidth targeting rainfall in this case is between 30–50 Hz, which is above the dominant frequency content of most anthropogenic sources and overlaps with raindrop-impact energy documented in recent rainfall-seismic studies.
To visualise the signature of the storm passing over the network of broadband seismic stations in the coastal area, we also plotted the hourly precipitation values with the hourly root-mean-square amplitudes of the high-frequency (>30 Hz) seismic velocity envelopes recorded at seismic stations. Figure 5 shows four snapshots of hourly plots of gridded precipitation data from ERA5, which have a lower amplitude than point measurements at the Mangalia station, due to the averaging over the grid block. This figure presents a temporal coincidence between changing precipitation patterns from ERA5 data and the amplitudes of high-frequency seismic noise. This observation further supports the likelihood of a causal relationship. These high-frequency seismic signals could potentially be explored as a near real time indicator of intense rainfall events, providing a conceptual basis for a simple streaming detection approach.
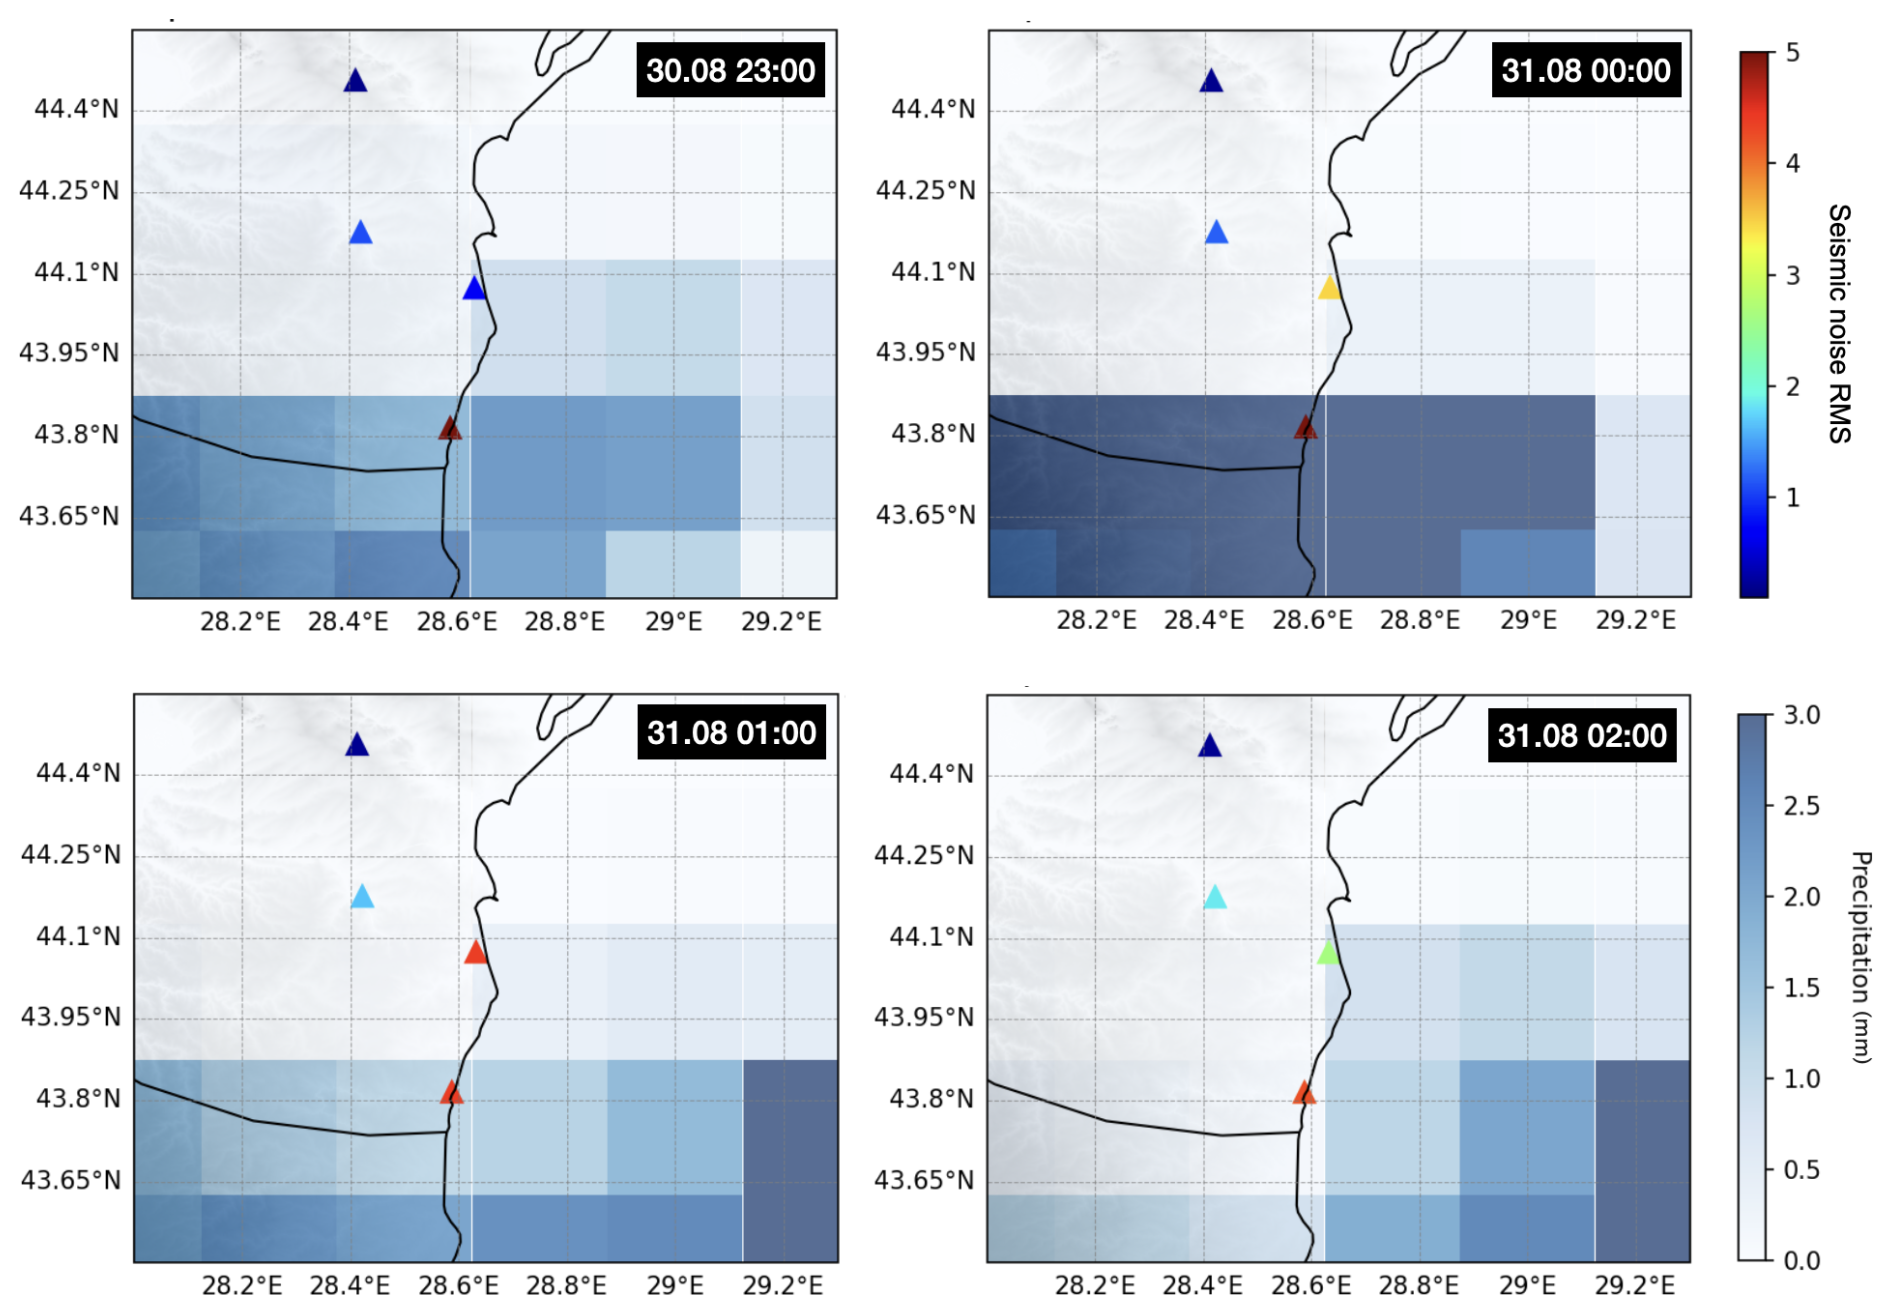
Figure 5Distribution of hourly RMS of high pass filtered (>30 Hz) seismograms and precipitation data. Colours indicate hourly RMS amplitude of velocity envelopes filtered 30–50 Hz. Background coloured grid indicates the total precipitation (mm) from ERA5 data.
The analysis of the microseismic noise frequency band is closely linked to the interaction between ocean waves and the seafloor, which is influenced by storm conditions. To assess the storm's impact, we analyze the PPSD (Probabilistic Power Spectral Density) of noise recorded at several stations during both storm and quiet days, using the latter as a baseline. Figure 6 shows examples of PPSD at stations MANR and MFTR (Fig. 2), revealing differences in PSD amplitudes across the primary and secondary microseismic bands. These differences indicate the presence of high-intensity wind-driven waves and swell energy in the sea.
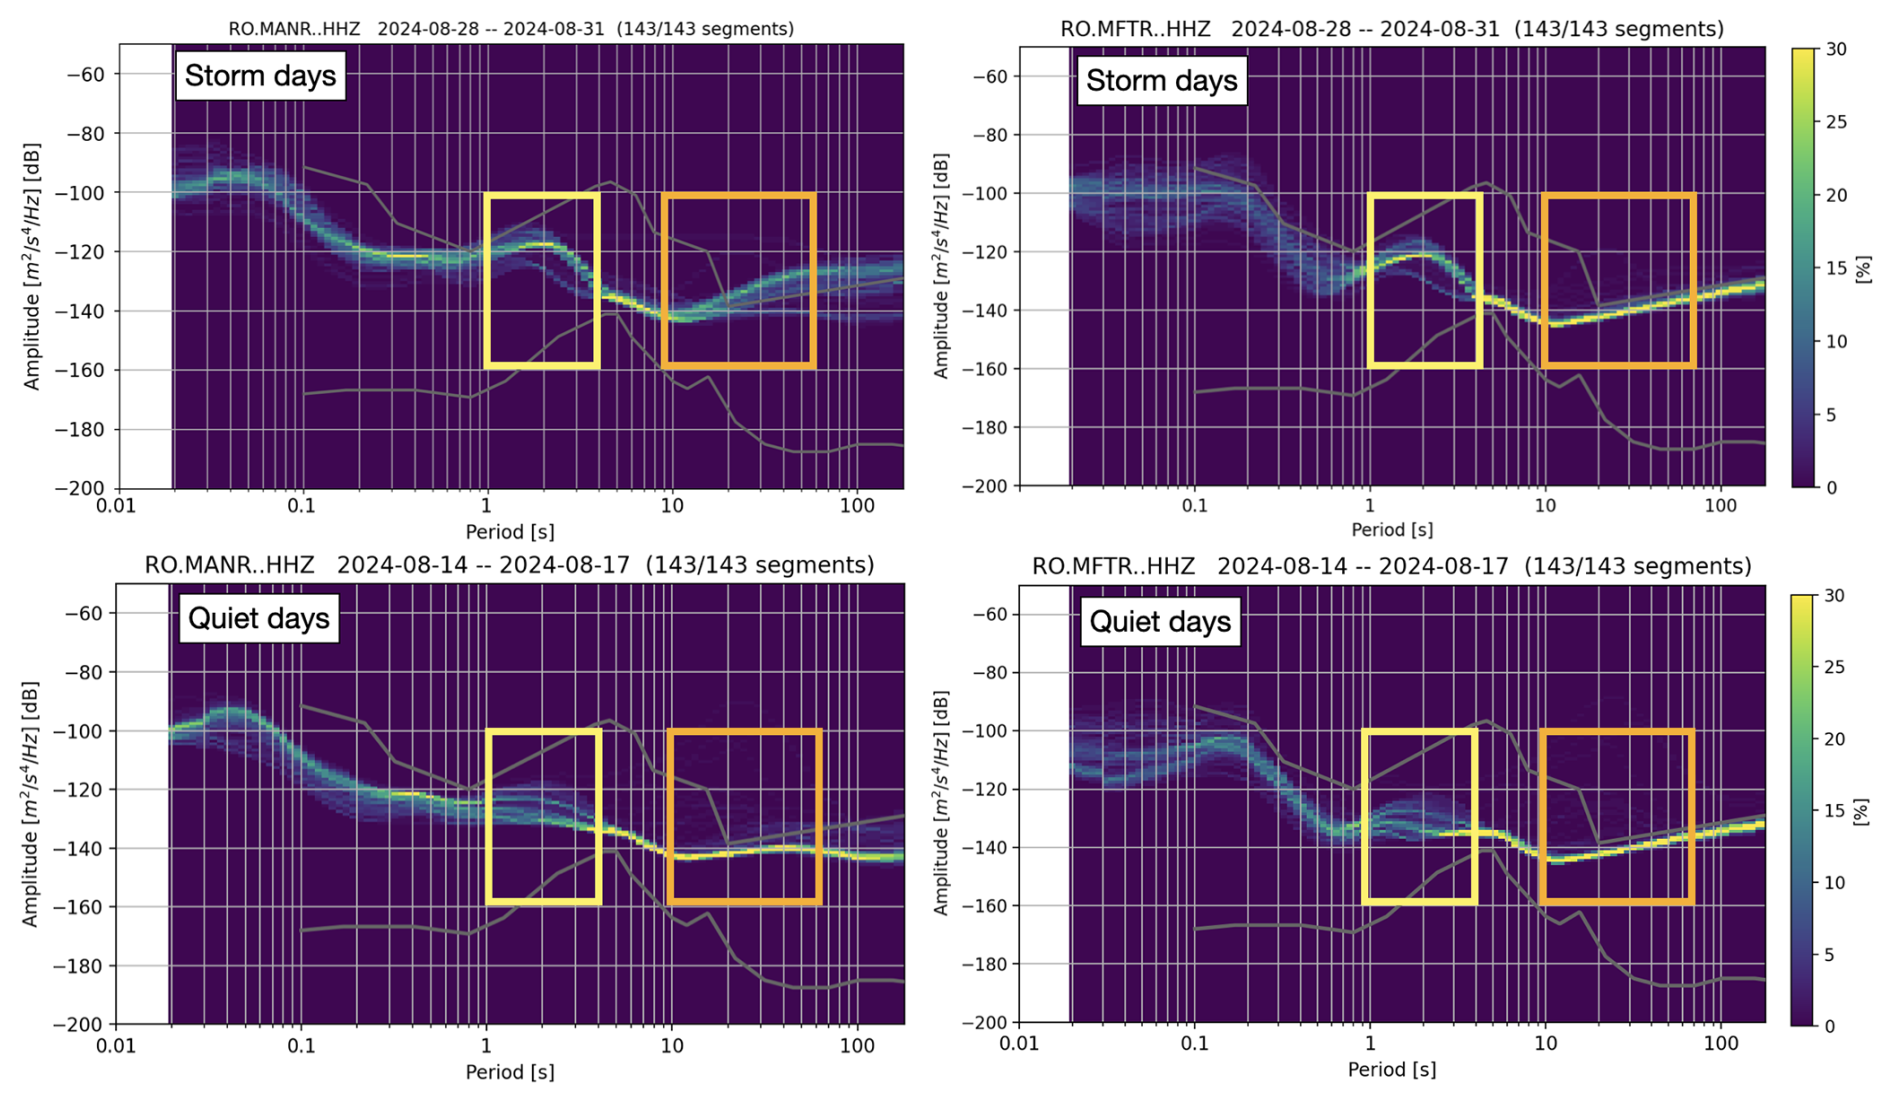
Figure 6Probabilistic Power Spectral Density (PPSD) plots for two seismic stations near the Black Sea coast capturing the target storm signal in the microseismic bandwidths (marked with rectangles). The top panels show the PPSD distributions across frequencies, indicating the probability of power spectral density values in percentage for days including the Black Sea storm. The bottom panels show PPSD for days with no recorded events.
The secondary microseismic band, in particular, shows a significant rise in amplitude during storms, consistent with established mechanisms linking storm-driven wave activity and seafloor pressure fluctuations (Fig. 3) to enhanced secondary microseism generation, while local factors such as bathymetry or wave direction may modulate the response (Bromirski and Duennebier, 2002; Ebeling, 2012; Ardhuin et al., 2019). On quiet days, the PSD remains consistently lower, typically staying below the −120 dB threshold. This stark contrast emphasizes the role of atmospheric conditions in modulating seismic noise, with storms causing a notable increase in energy across both frequency bands. The temporal evolution of the PSD values (Fig. 7) further highlights the storm's impact, with fluctuations corresponding to changes in environmental factors, reinforcing the connection between storm activity and the observed seismic signals.
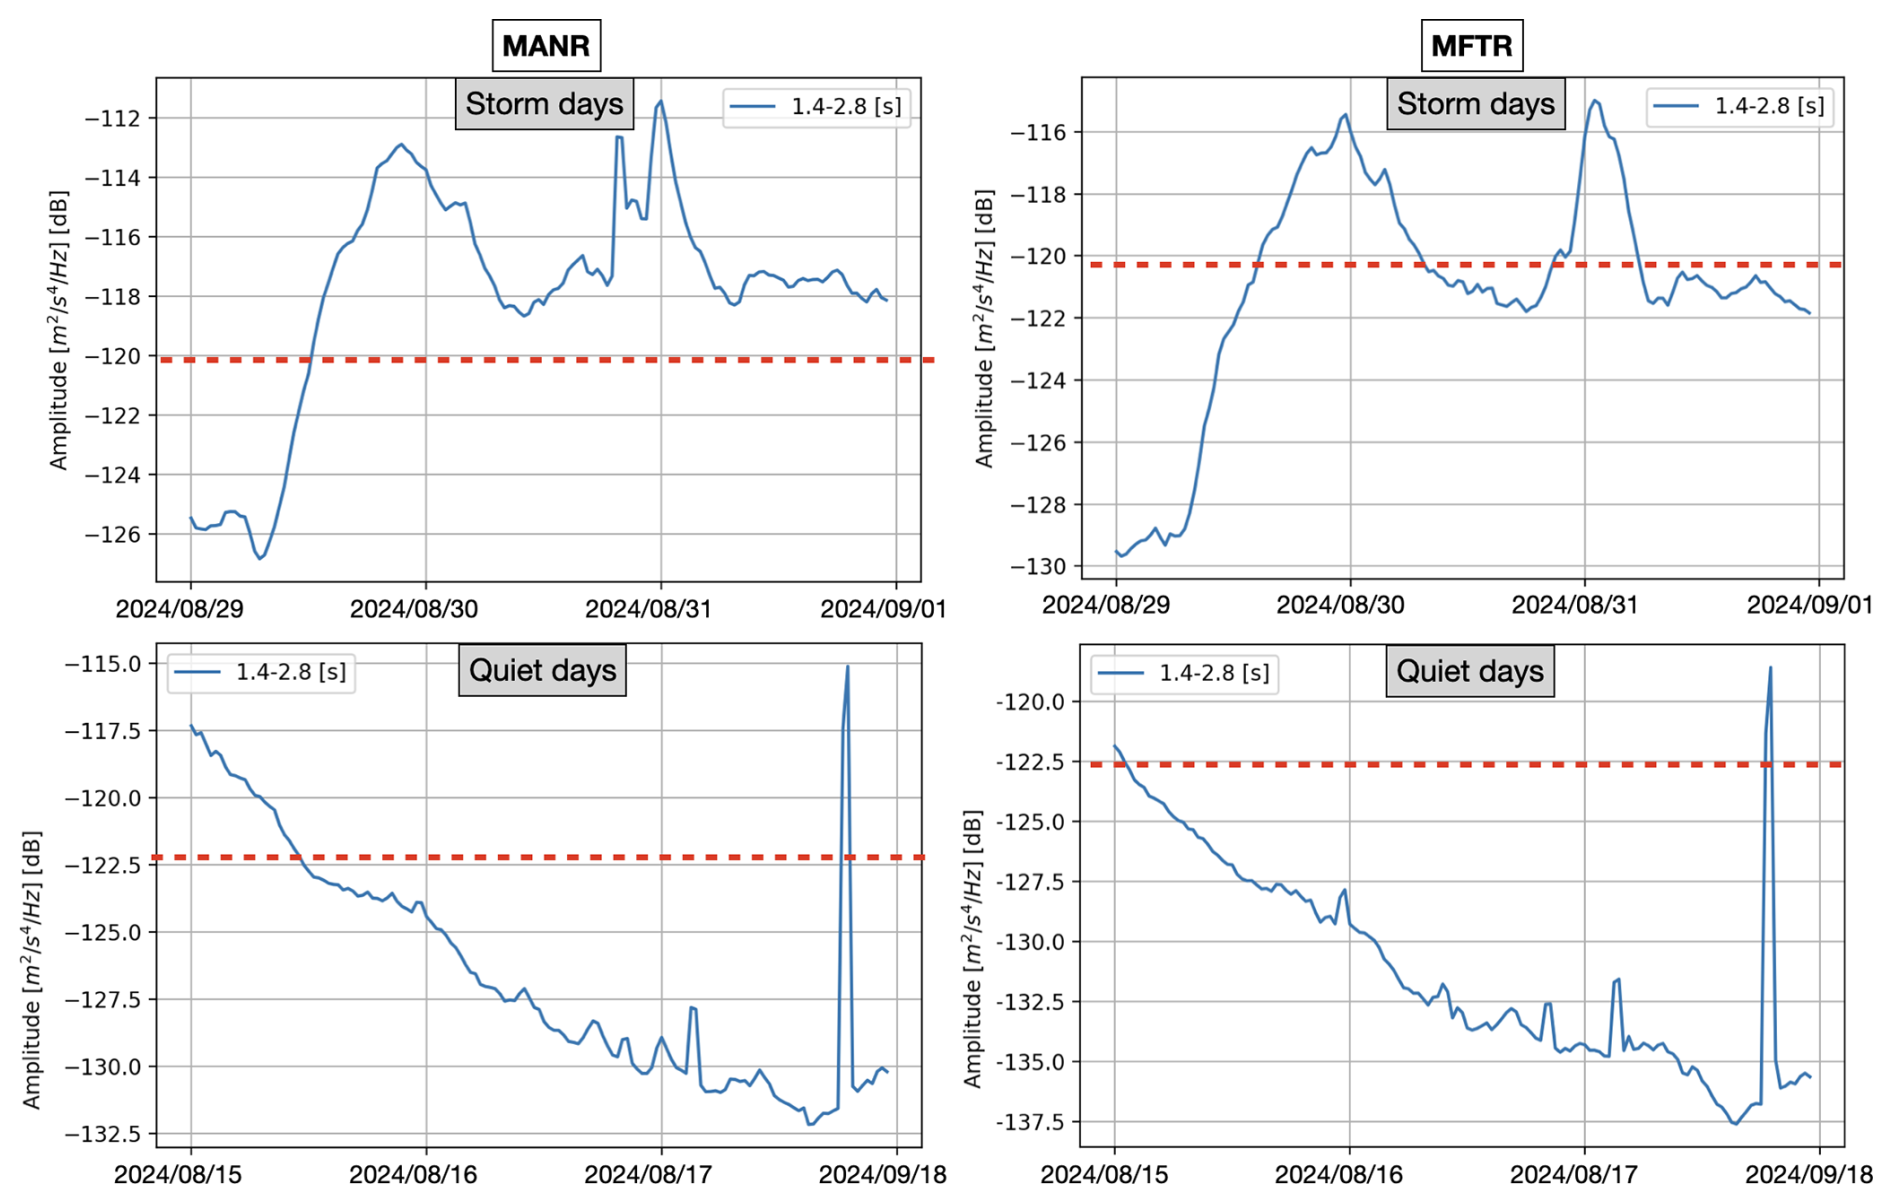
Figure 7Temporal PSDs for two seismic stations near the Black Sea Coast in the secondary microseismic band showing significantly higher values ( dB) during stormy days compared to days without recorded precipitation.
Anthropogenic seismic noise does not significantly affect the microseismic band (0.1–1 Hz). Human-generated vibrations predominantly occupy frequencies above 1 Hz, while long-period microseisms are produced by ocean wave interactions and are coherent over large distances. The temporal evolution of the microseismic energy observed in this study matches changes in wave state associated with the storm rather than any local activity. Similar to the findings of Groos and Ritter (2009), the sub-Hz frequency range is dominated by natural sources, with anthropogenic contributions being negligible.
4.2 Infrasound and satellite lightning observations
4.2.1 Single-station feature extraction
The evolution of time-frequency features over the duration of the Black Sea storm revealed distinct patterns in the infrasound signal (Figs. 8 and 9). Centroid and rolloff show parallel behavior because they are both frequency-domain descriptors tied to the distribution of spectral energy, and so both respond strongly to the same uplift in energy during the storm's peak. Spectral flux, by contrast, quantifies inter-frame spectral change, so its peak occurs where the spectrum transitions most rapidly, even when that does not coincide with the maximum absolute energy (e.g. Pásztor et al., 2023). Finally, the zero-crossing rate reflects time-domain volatility, not spectral shape, which explains its distinct pattern, such as the storm's later stages may introduce broadband turbulence or noise components that boost zero crossings independently of the spectral shifts visible in the first two panels. While the individual features varied over time, it is the combination of these features through K-means clustering that effectively identifies the time frame corresponding to the main precipitation episode. Zero-crossings exhibited more variable patterns, reflecting high-frequency fluctuations, but the joint clustering of all features robustly captures the timing of the storm's most intense phases.
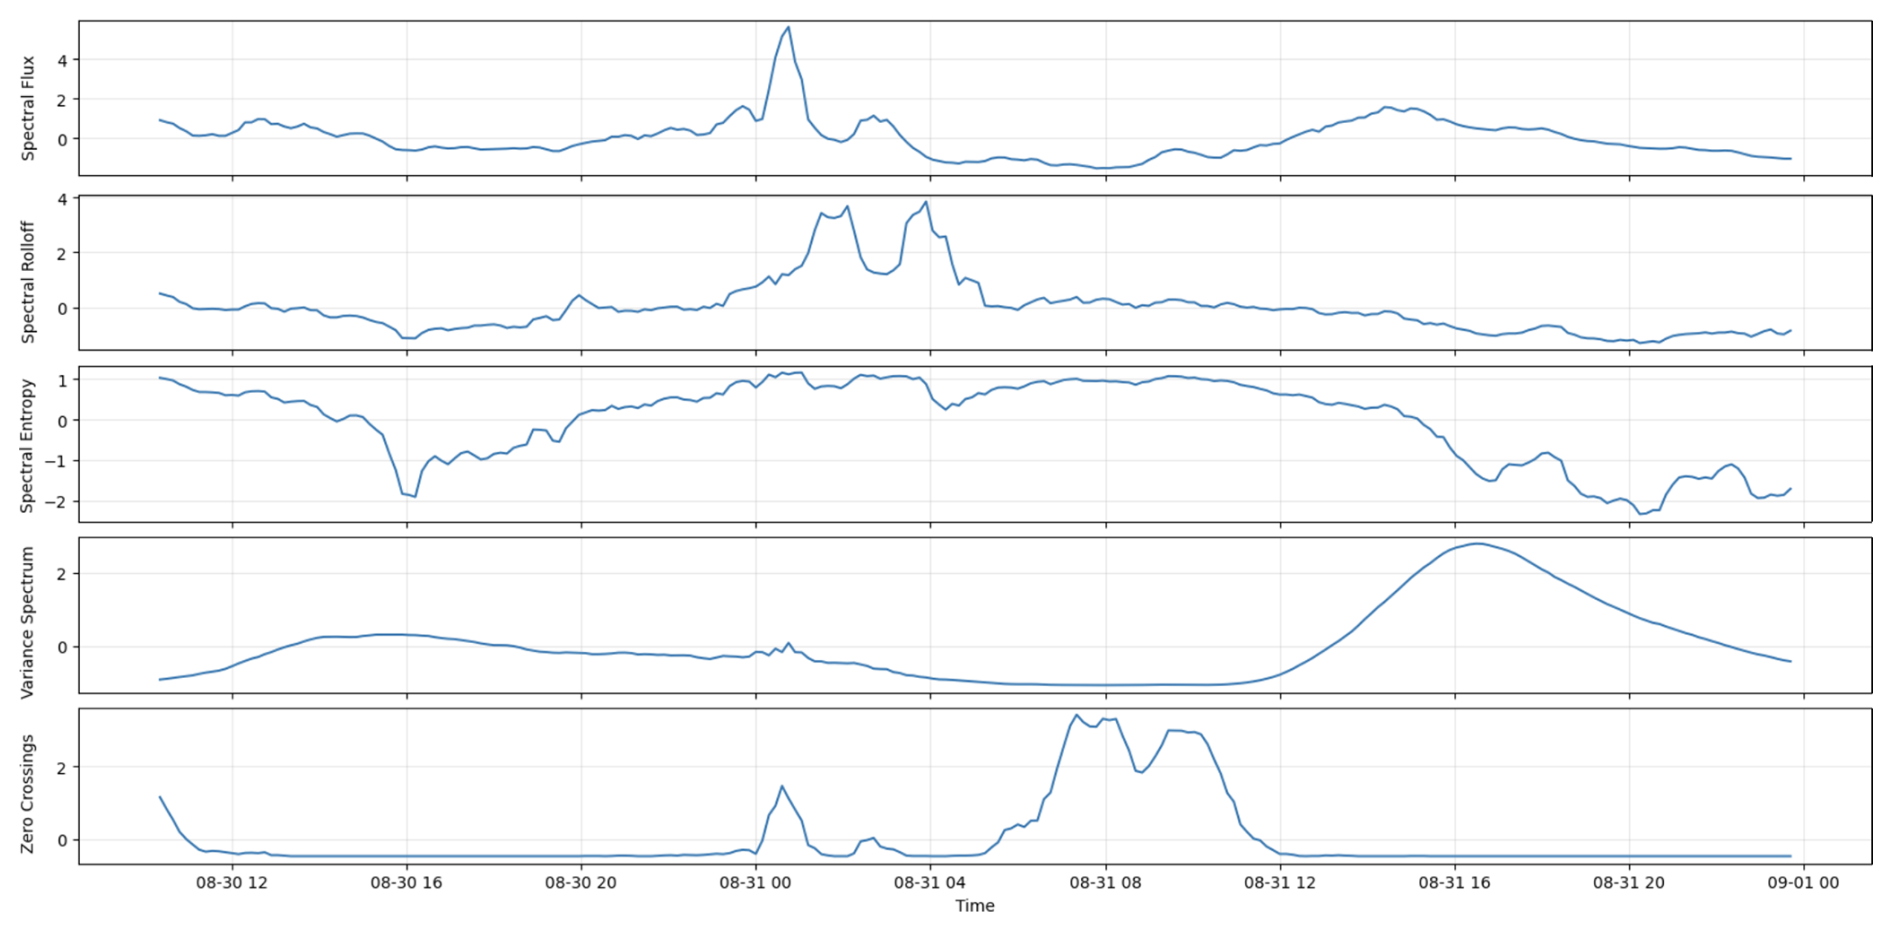
Figure 8Time-frequency feature analysis for the single-station infrasound signal recorded at AGIR during the Black Sea Storm.
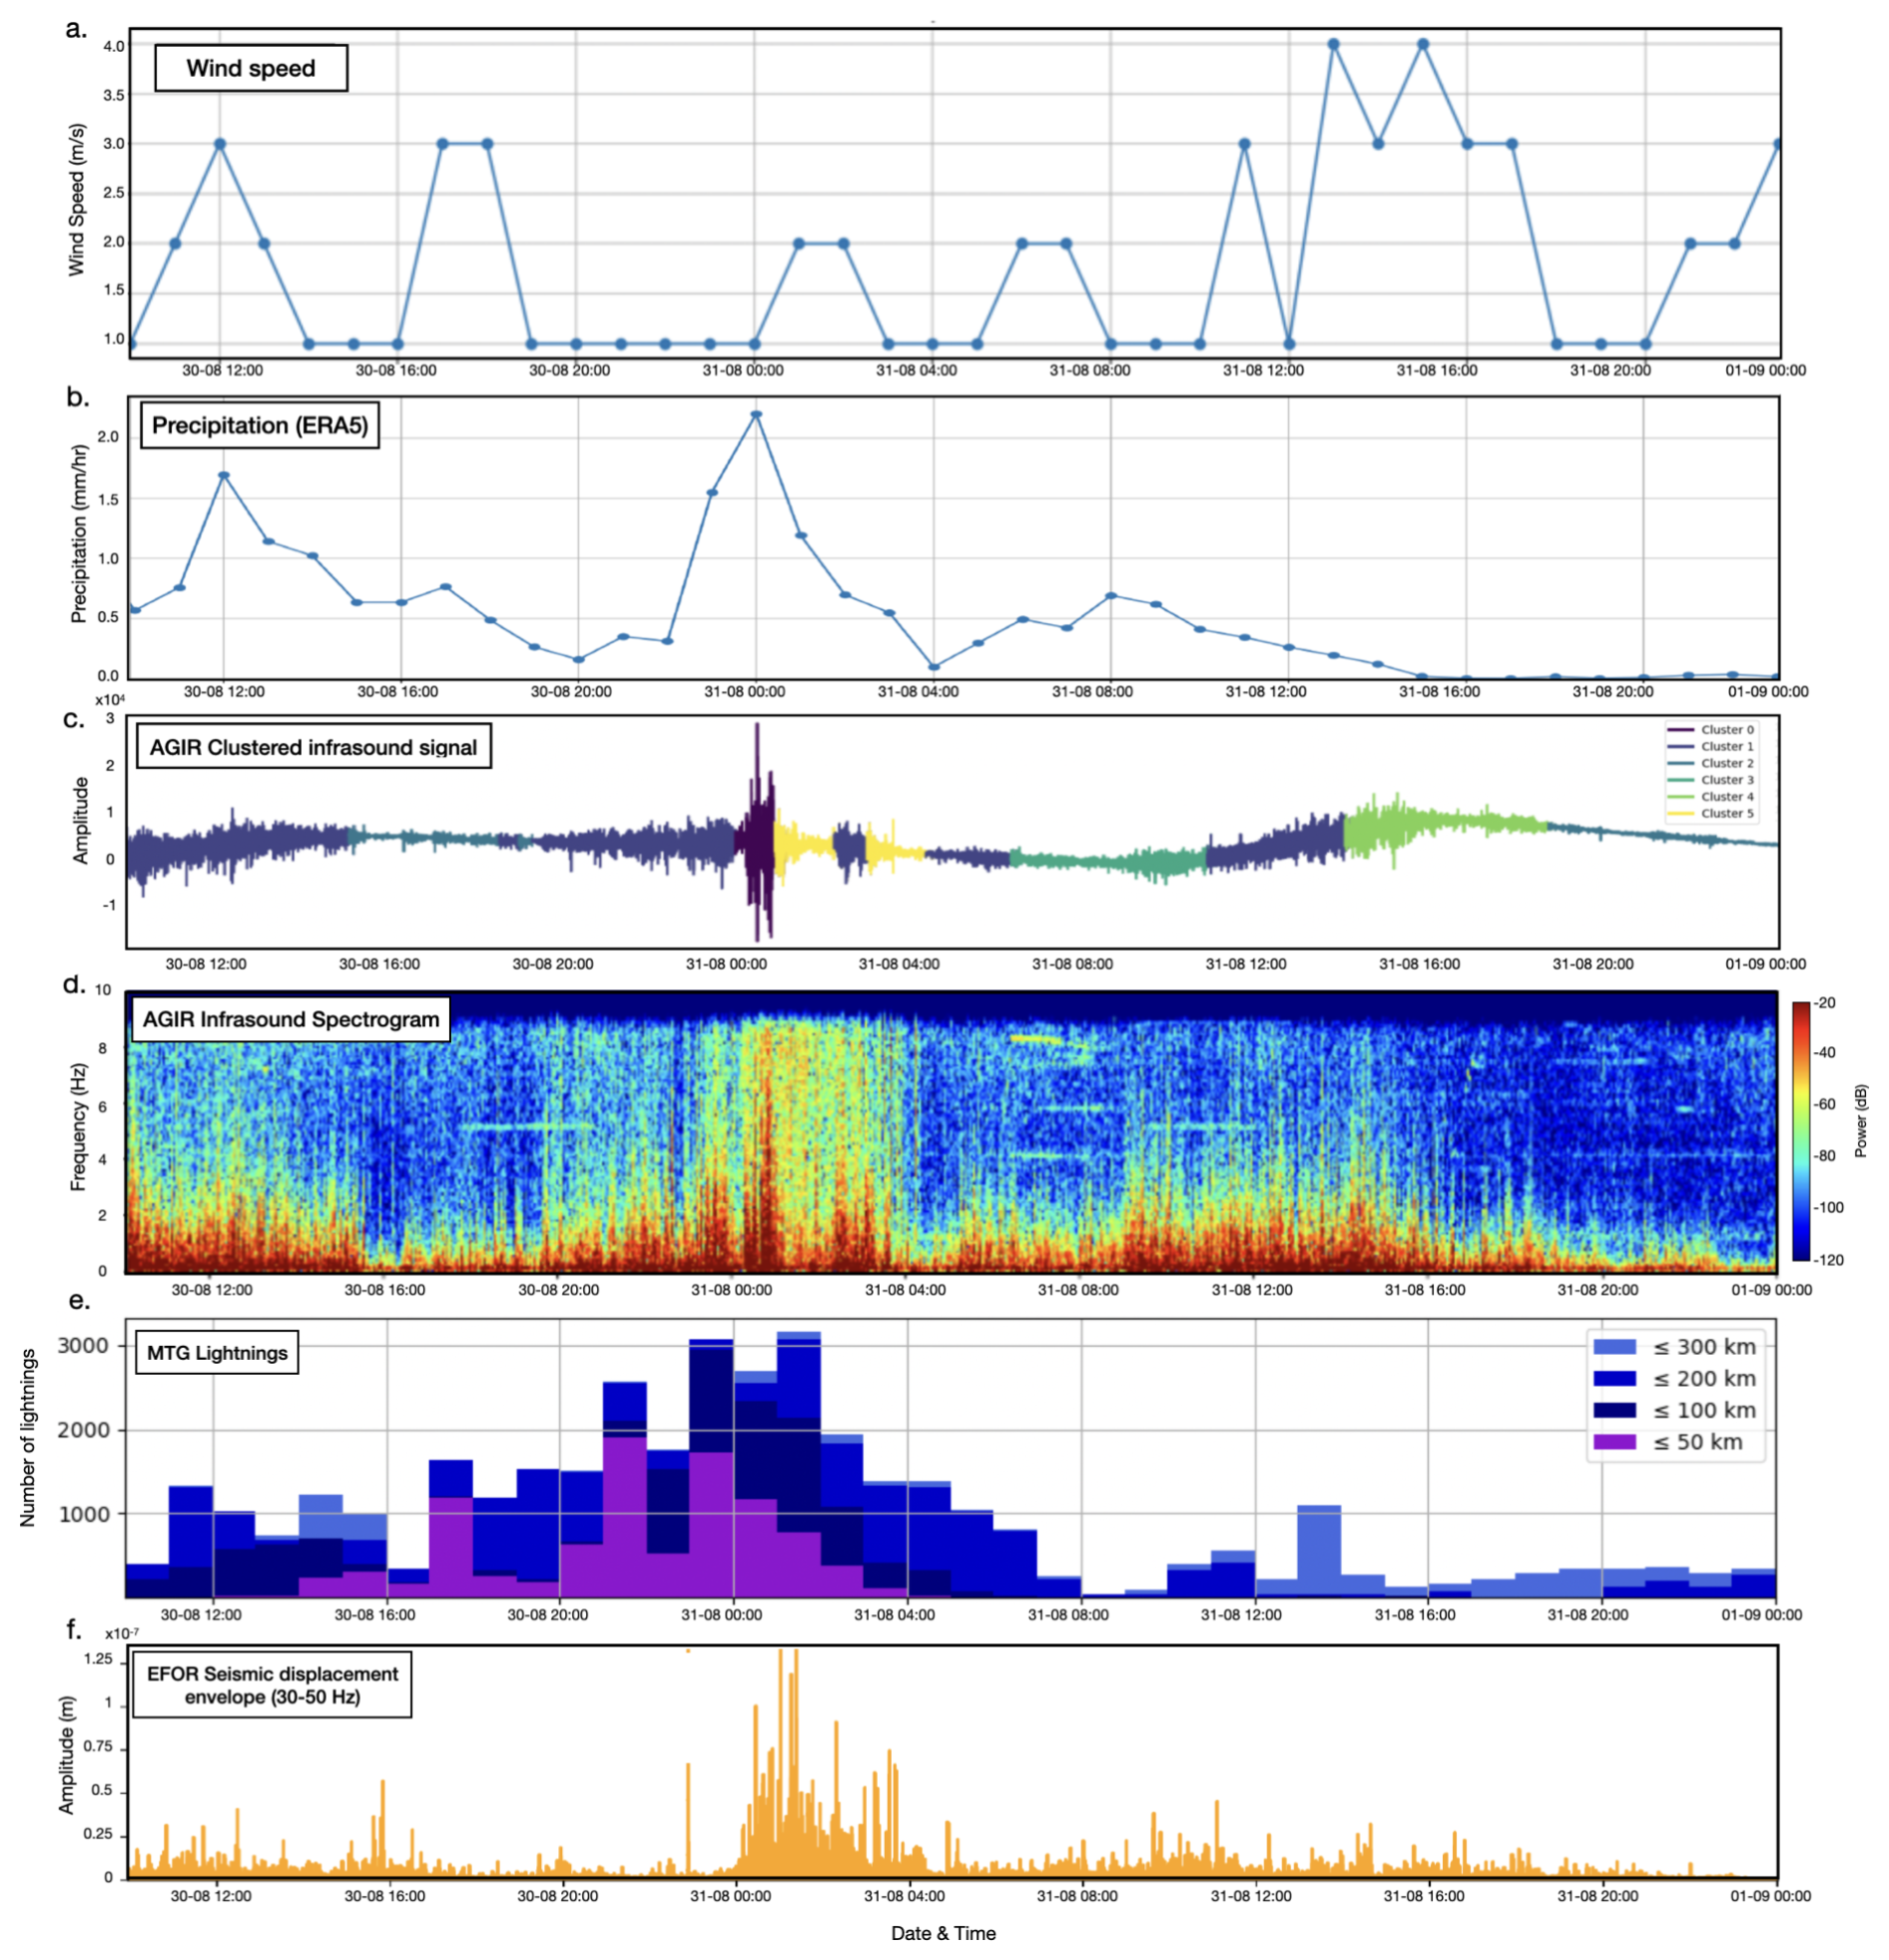
Figure 9Clustering results of infrasound signals recorded at AGIR from the August Black Sea storm event compared with precipitation data and seismic signal from EFOR station. (a) Wind speed per hour measured at ANM meteorological station Constanţa; (b) Average precipitation data from 1° × 1° around AGIR. (c) Raw infrasound signal recorded at the AGIR sensor during the period of 30–31 August 2024, with different segments color-coded according to the cluster they belong to, based on K-means clustering of 30 min time-frequency feature windows. (d) The corresponding spectrogram generated using Blackman windowing with 128 samples and 70 % overlap; (e) Number of lightnings detected by the MTG satellite. (f) Seismic displacement envelope at station EFOR, filtered between 30–50 Hz.
K-means clustering separated the acoustic data into six groups with distinct spectral and amplitude characteristics (Fig. 9). These clusters highlight acoustic states that may relate to different environmental conditions during the monitoring period. For example, Cluster 0 coincides with periods of intense precipitation and stronger winds, and also aligns with enhanced lightning activity, suggesting a link with the most energetic phases of the convective system. Cluster 1 captures intervals with moderate amplitudes but persistently elevated background acoustic levels, without corresponding rainfall or wind peaks, and with comparatively reduced lightning occurrence. Cluster 2 reflects calmer conditions with low amplitudes and little or no precipitation and minimal lightning activity. Transitional patterns also arise, such as Cluster 3, which appear before intervals grouped in Cluster 1 and mark intermediate acoustic activity. Overall, the clustering approach demonstrates that combining multiple features reveals consistent acoustic regimes and can help differentiate environmental conditions, without relying on any single parameter.
Interestingly, the spectral content of the infrasound signal showed similarities to seismic signal envelopes, particularly in the high frequency ranges (Fig. 9), which may suggest a connection between the atmospheric pressure waves detected by infrasound and the ground vibrations captured by seismic instruments. When considered alongside the temporal evolution of lightning activity, this overlap implies that both seismic and infrasound signals could be complementary in capturing different aspects of storm dynamics, with seismic signals reflecting ground vibrations and infrasound capturing the atmospheric processes, and lightning indicating convective intensity.
4.2.2 Array analysis and lightning detection
Using multiple sensors from the AGIR infrasound array with the PMCC algorithm allowed us to isolate coherent infrasound signals and estimate their propagation parameters, such as backazimuth and arrival times, across the sensor network. Nearly 11 000 lightning flashes were detected by the MTG Lightning Imager within 50 km of the AGIR station during the Black Sea storm (Fig. 10a), providing a dense reference set for comparison. Within the relevant 0.6–7 Hz frequency band, approximately 1100 infrasound detections were identified. These signals primarily consisted of long-duration wave trains with frequent amplitude peaks and short-lived disturbances characteristic of lightning-generated infrasound. Their dominant frequency was around 3 Hz, and amplitudes ranged from 0.01 to 3.4 Pa (Fig. 10b).
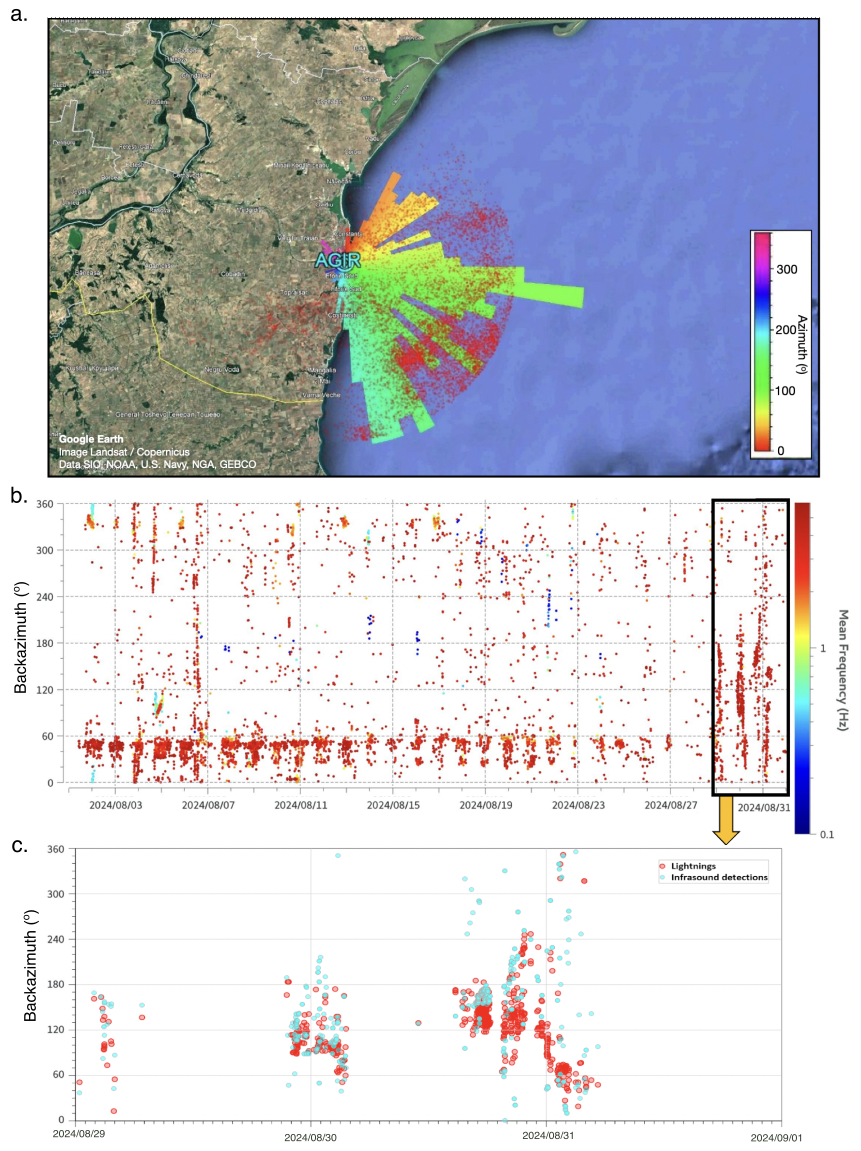
Figure 10(a) Map of the coastal study area with an overlaid polar histogram of infrasound detections from the AGIR station. The figure includes lightning strike locations detected by the MTG Lightning Imager system for 29–31 August 2024. Base map credits: Imagery ©2024 Landsat/Copernicus; Data SIO, NOAA, U.S. Navy, NGA, GEBCO; Map data © 2024 Google. (b) diagram of high-frequency detections from the AGIR infrasound station between 1–31 August 2024. (c) Associations between events detected by the AGIR infrasound array and the MTG satellite database for 29–31 August 2024.
A subset of the infrasound detections could be confidently associated with individual lightning discharges based on temporal alignment and backazimuth consistency. Overall, we were able to associate 6.4 % of lightning flashes with infrasound detections at AGIR (Fig. 10c). This level of correspondence is reasonable given that only a subset of lightning discharges radiate infrasound efficiently and that propagation strongly depends on altitude, source geometry, and atmospheric conditions. Nevertheless, these coincident detections demonstrate that lightning-generated infrasound was clearly recorded during the storm and that the PMCC-derived acoustic signatures provide valuable insight into the evolution of electrical activity and storm dynamics.
Anthropogenic noise sources, such as wind turbines (e.g., Jakobsen, 2005), industrial machinery (Gastmeier and Howe, 2008), and road traffic (Grafkina et al., 2019), are well-documented challenges for infrasound studies because they often generate persistent, periodic, or tonal signals that can mask natural atmospheric phenomena. The AGIR infrasound array used here is located in a semi-rural setting, distant from major roads and industrial facilities, which reduces the likelihood of local anthropogenic contamination. Several independent lines of evidence indicate that such contamination is negligible in this case study. First, the strongest infrasound signatures occurred during night-time hours, when human activity is minimal. Second, both the clustering and PMCC analyses identify transient signals with energy peaking around ∼3 Hz, which contrasts sharply with the more continuous or harmonic spectral patterns typically produced by anthropogenic sources. Third, the temporal alignment of these acoustic signatures with independent observations of lightning and precipitation provides confirmation that the detected infrasound variability is storm-related rather than anthropogenic in origin.
4.3 GNSS-derived precipitable water vapor trends
The analysis of daily GNSS-derived precipitable water vapor (Fig. 11) reveals clear temporal variations, with the highest PWV values consistently recorded on stormy days (>40 mm on DOY 240–243, i.e. 27–30 August). Notably, the peak values occurred between DOY 241 and DOY 243 (Fig. 11b), when the heaviest rainfall was observed (Fig. 1). Coastal stations showed extremely high PWV values (>40 mm) compared to inland stations (<30 mm), with a slight decrease in PWV away from the coast (Fig. 11a). This spatial distribution highlights the geographical gradient of atmospheric moisture, with the highest PWV concentrations near coastal areas, also decreasing gradually toward the north away from the storm peak. Interestingly, some inland stations (BUCU, PGNL, RMSR) recorded their peak PWV on DOY 255, corresponding to the onset of the Boris storm, another significant extreme rainfall event that swept through Central and Eastern Europe (Athanase et al., 2024).
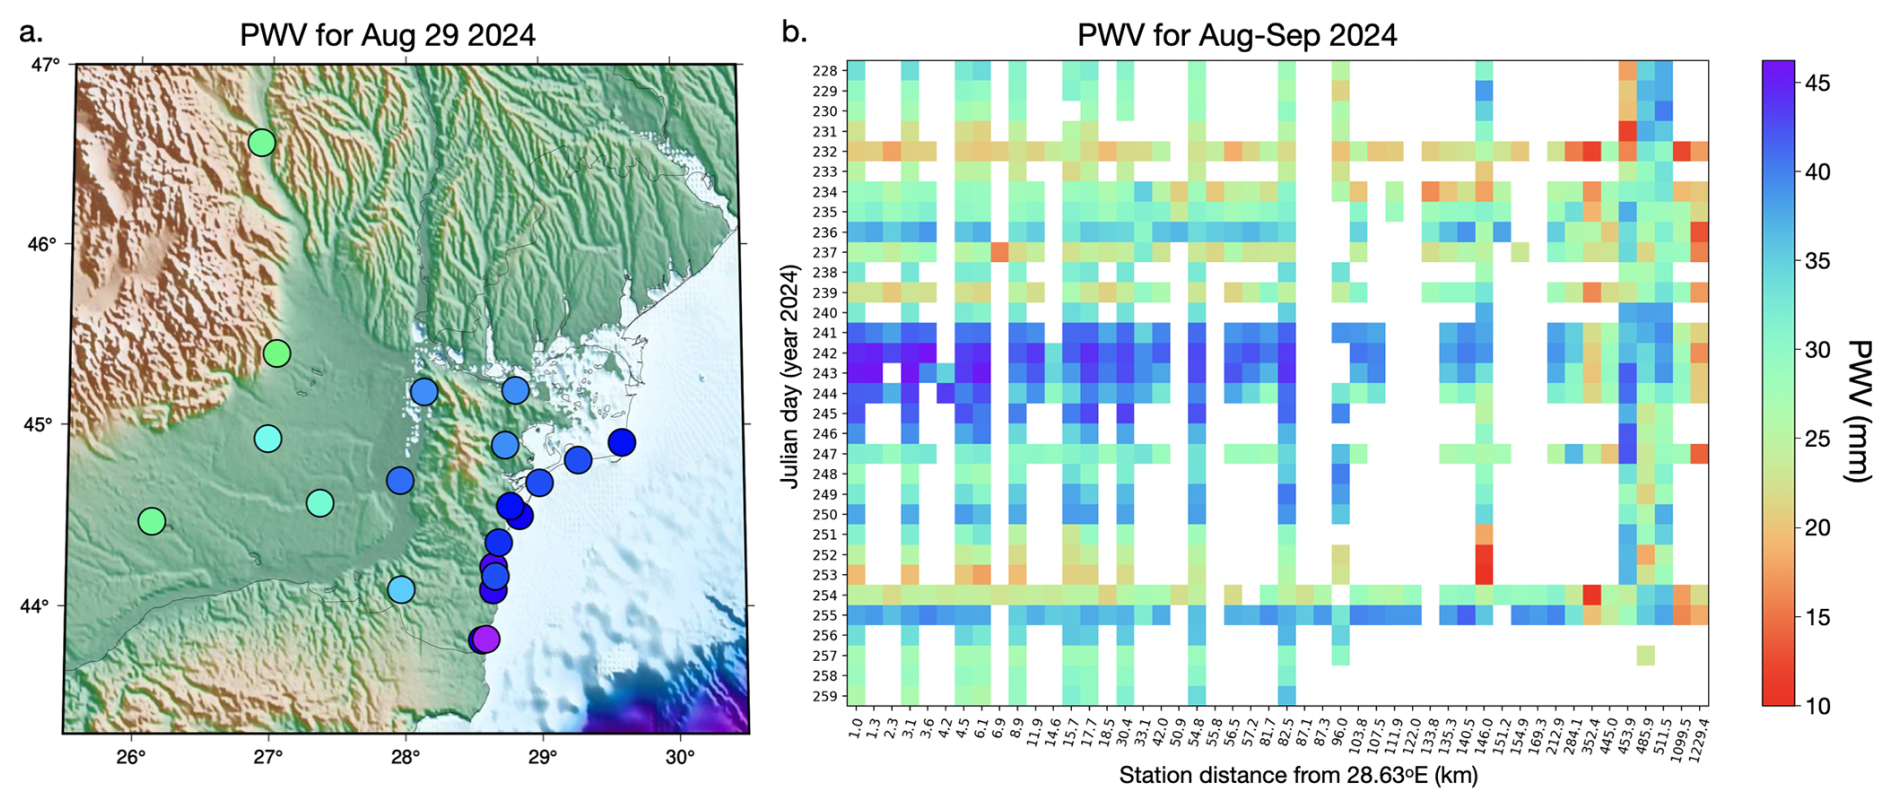
Figure 11(a) Map of GNSS stations coloured as a function of PWV estimated for the 29 August. (b) Daily PWV values for each station, plotted as a function of their longitudinal distance relative to 28.63° E.
Elevated PWV was observed as early as 27 August (Fig. 12a), suggesting that the tropospheric moisture loading began to increase several days before the onset of the rainfall. This increase in PWV may act as an indicator of a developing weather system. Remarkably, although HAR1, located inland, did not directly experience the extreme rainfall, it exhibited similar PWV behavior to coastal stations, suggesting that GNSS stations, even outside the immediate storm zones, can capture atmospheric signals indicative of intense precipitation. This finding offers a valuable precedent, showing that PWV measurements at GNSS stations not directly in the storm path can still provide critical insights into moisture dynamics at the tropospheric level. The comparison with ERA5's total-column water vapour further supports this interpretation, as the broad temporal evolution of ERA5 humidity mirrors the GNSS-derived daily PWV patterns, despite the inherently coarser resolution of the reanalysis data.
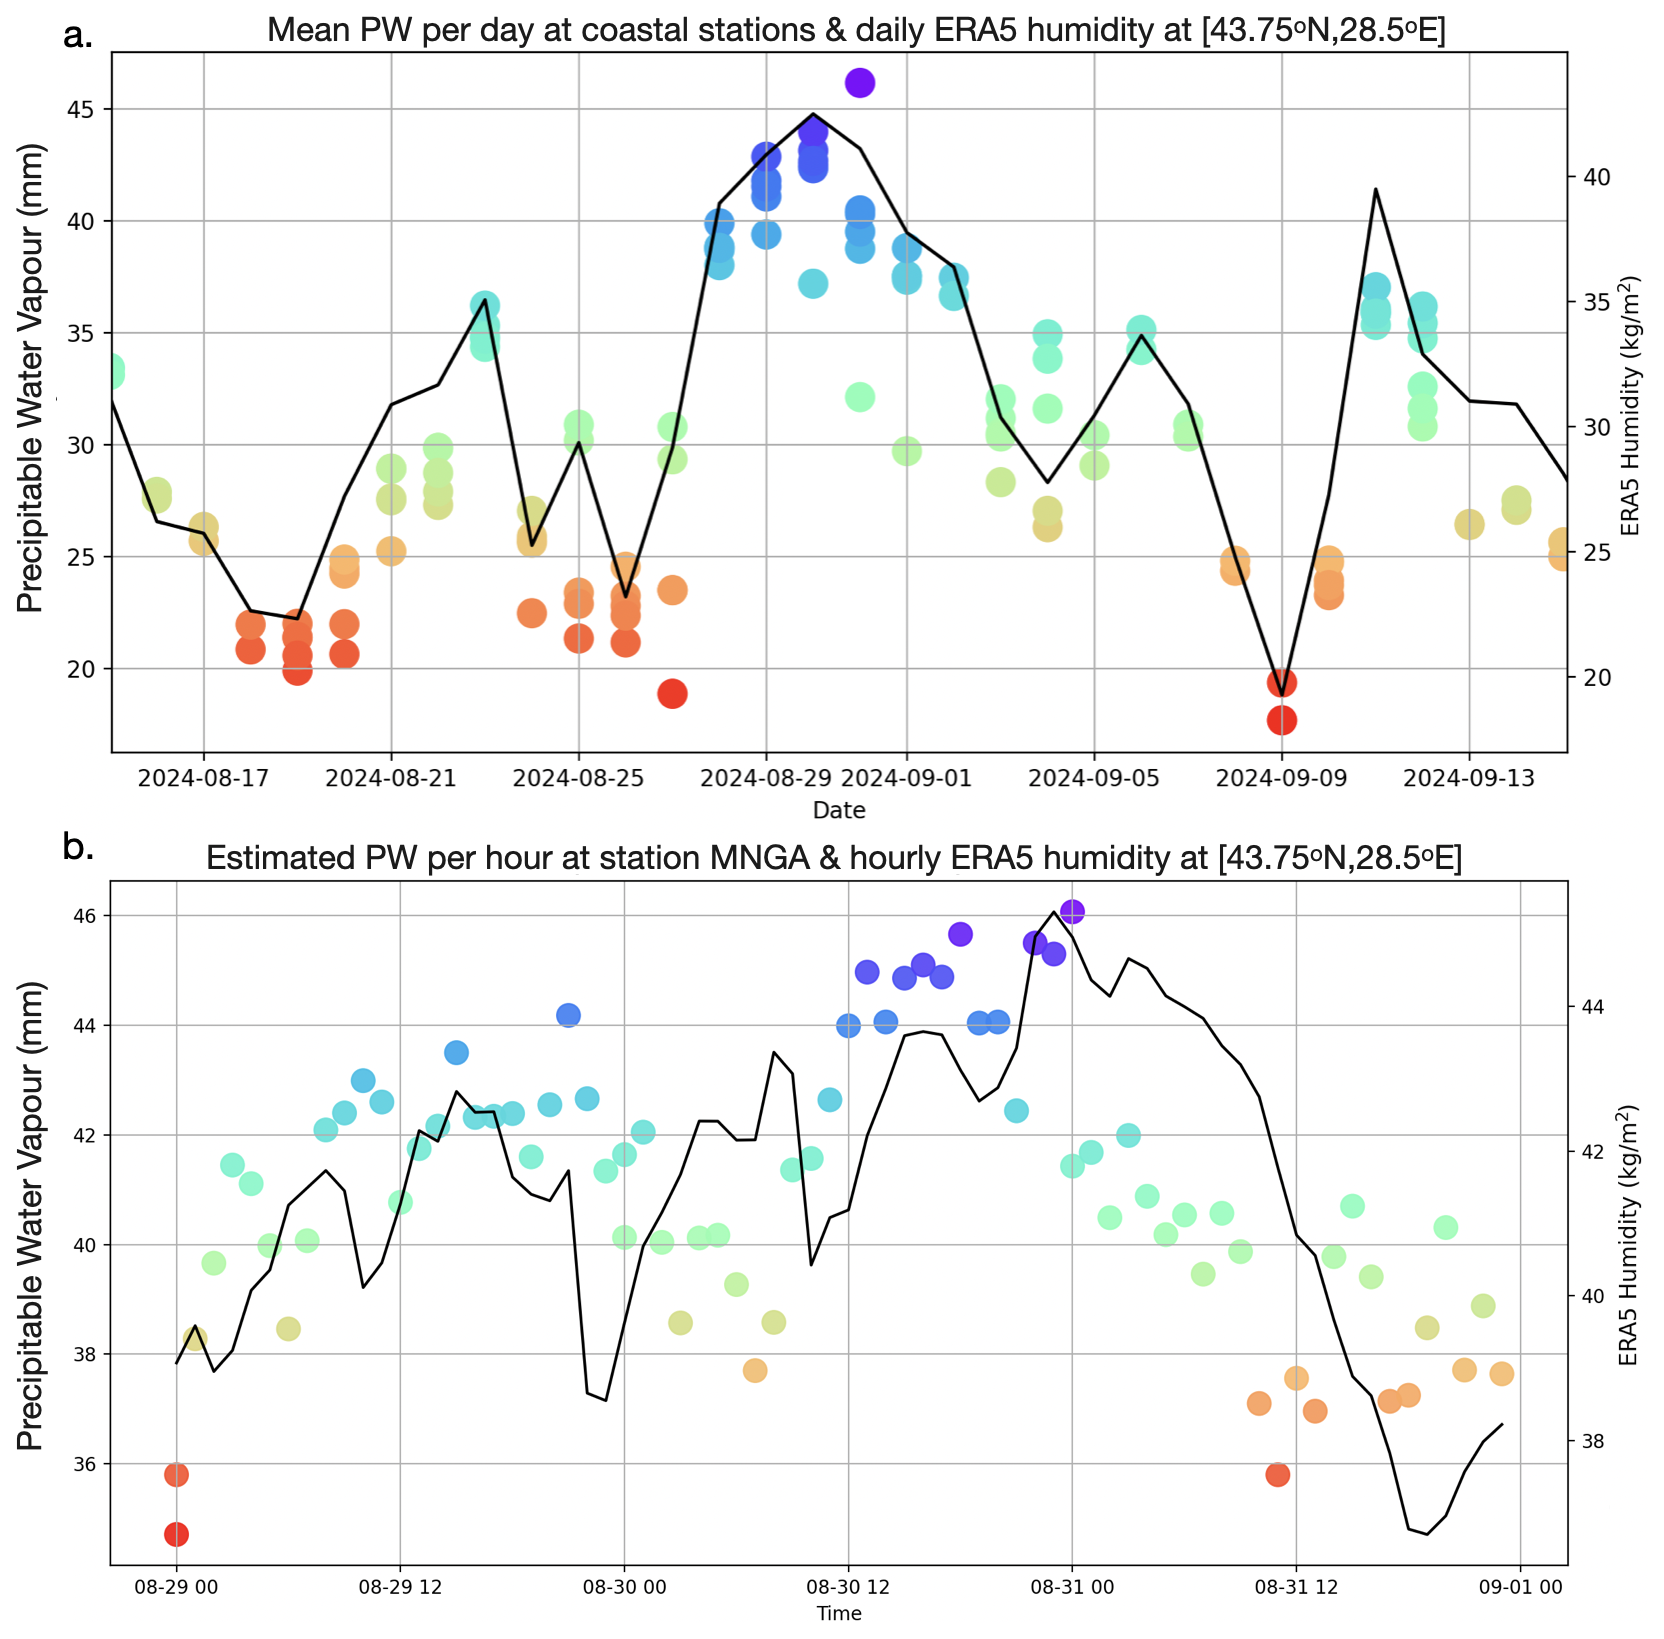
Figure 12Comparison of GNSS-derived precipitable water vapor (coloured circles) with independent humidity data (black line) from ERA5's total column vertically integrated water vapor parameter. (a) Mean PWV values per day at selected GNSS stations (CONB, HAR1, MNGA, MNGL, MNGM, TUZL) alongside daily averaged ERA5 humidity. (b) Estimated PWV values per hour at the MNGA GNSS station compared with hourly ERA5 humidity at the 43.75° N, 28.5° E grid point. In both panels, GNSS data points are represented by colored circles where the color scale corresponds to the PWV magnitude, consistent with the vertical axis.
Using the hourly PWV data, Fig. 12b illustrates the evolution of water vapour at the MNGA station, which recorded the heaviest rainfall in the study area. Notably, MNGA also showed a rapid buildup of PWV, reaching values greater than 44 mm just a few hours before the storm event. This rapid increase in PWV suggests that the accumulation of atmospheric moisture may precede extreme weather events, such as intense rainfall and storms. This observation aligns with known atmospheric dynamics, where a significant increase in water vapor content precedes heavy precipitation, highlighting the potential usefulness of GNSS-based PWV monitoring for studying pre-storm atmospheric moisture variability. The general rising trend toward the event is present in both GNSS-based and ERA5 reanalysis datasets, although some minor fluctuations are not matched. After the storm, the GNSS PWV drops sharply while ERA5 maintains elevated values for several hours. These differences show that GNSS can resolve rapid, real-time atmospheric changes that may be blurred in large-scale weather model products.
Storm evolution, in the meteorological sense, describes the sequence of processes from pre-storm atmospheric moisture accumulation to convective initiation, peak rainfall, electrical activity, and the associated marine response along coastal areas. The multi-sensor dataset used here captures these different stages: GNSS-PWV documents the build-up of column water vapor before convective onset, infrasound detects lightning-generated acoustic waves and pressure disturbances during the mature convective phase, high-frequency seismic noise reflects the timing and spatial progression of intense rainfall at the surface, microseisms respond to storm-driven changes in sea state, and ERA5/MTG provide the mesoscale structure that ties these geophysical signals together. By observing the same storm through these complementary physical pathways, we can outline a more detailed picture of how the storm developed, intensified, and decayed than is possible from individual datasets.
The integration of infrasound, seismic, and GNSS data in monitoring the extreme storm event over the Black Sea provides valuable insights into the dynamics of storm behavior and illustrates the potential of repurposing non-conventional sensors for meteorological analysis. Infrasound data, for instance, revealed a clear acoustic signature of lightning activity, with signals detected in the range of 0.6 to 7 Hz corresponding to electrical discharges. The high frequency of infrasound detections (around 1100) suggests that it may provide useful information for tracking storm-related phenomena, particularly lightning, which is difficult to capture with traditional methods. However, the signals did not always perfectly align with lightning strikes, indicating that other factors, such as the movement of storm systems or variations in atmospheric conditions, may influence infrasound signatures. This suggests that refining the correlation between infrasound signals and lightning activity could be an avenue for future research, particularly in cases of sparse lightning or in remote regions.
Seismic data alone also showed a strong connection between high-frequency seismic noise and heavy rainfall, supporting previous studies that linked seismic signals to rainfall intensity. The distinction between high-frequency and low-frequency seismic noise is particularly noteworthy. Increases in high-frequency seismic noise occurred during intense precipitation, while low-frequency signals were associated with wave height and storm-driven winds. This suggests that different seismic frequencies capture distinct storm dynamics, with high-frequency signals reflecting localized rainfall impacts and low-frequency signals tied to broader atmospheric and oceanic interactions. This dual-frequency approach provides a more nuanced interpretation of seismic data in storm monitoring, highlighting its complexity.
A key finding of this study is that K-means clustering of multiple acoustic features, including spectral centroids, roll-off, flux, and zero-crossing rate, effectively segmented the infrasound record into distinct storm phases. This approach proved more robust than relying on any single feature, as the combination captured the complex, evolving nature of the storm's acoustic signature. For instance, the identified clusters delineated periods of intense precipitation, elevated background acoustic levels, and calm intervals, providing a data-driven overview of the storm's progression. The fact that these acoustically defined phases align with independent meteorological observations, such as rainfall peaks, confirms that the infrasound signal variability is a direct response to the storm's atmospheric dynamics.
Furthermore, the observed spectral similarity between the infrasound signals and high-frequency seismic envelopes suggests a coupled seismo-acoustic response to the storm. This implies that the same atmospheric forcing, such as pressure fluctuations from rainfall and wind, generates complementary signals in the atmosphere (infrasound) and the ground (seismic waves). Our findings are consistent with other studies of intense weather systems, where coupled microbarom-microseism signals have been shown to track storm structure and evolution (e.g., Butler and Aucan, 2018; Smirnov et al., 2021). The coherent acoustic and seismic responses to atmospheric-oceanic pressures, as also documented in Distributed Acoustic Sensing studies (Taweesintananon et al., 2023) and surf studies (Francoeur et al., 2025), reinforce the interpretation of a shared source mechanism. Therefore, a major and logical next step is to move beyond analyzing these datasets in parallel and to perform joint clustering of seismo-acoustic data (e.g. Floroiu et al., 2025). Such an integrated approach could unlock a more comprehensive, multi-physics understanding of storm dynamics by simultaneously characterizing the coupled atmospheric and ground-borne wavefields.
The temporal variations observed in GNSS-derived integrated precipitable water vapor provide valuable insights into atmospheric moisture dynamics before extreme weather events. The pronounced increase in PWV, particularly in the days leading up to and during the storm, supports the link between elevated atmospheric water vapor and precipitation. Notably, the PWV buildup starting roughly three days before the extreme rainfall suggests that rising moisture levels in the troposphere were observed prior to the intense precipitation in this event. Even stations located up to 130 km inland, such as HAR1, recorded similar PWV trends, indicating that GNSS stations outside direct storm zones can still provide crucial atmospheric data. Hourly PWV trends further revealed a rapid increase several hours before precipitation, with values exceeding 44 mm h−1, highlighting the accumulation of moisture just before heavy rainfall. These findings align with the notion that increasing atmospheric moisture acts as a precursor to intense precipitation, highlighting the potential of GNSS-based PWV monitoring for tracking moisture and understanding short-term atmospheric fluctuations.
The integration of GNSS, infrasound, and seismic data provides a more comprehensive understanding of storm dynamics than any single data source alone. The synergy between these diverse sensor types allows for the detection of atmospheric moisture, lightning activity, rainfall-induced seismic signals, and storm-driven oceanic interactions. Future research should focus on refining unsupervised learning algorithms for infrasound and seismic signal classification, optimizing joint clustering techniques, and improving the integration of these data sources to enhance storm forecasting and early-warning systems. This case study highlights the potential of multi-sensor observations to enhance our understanding of extreme storm behavior and support the development of future early-warning strategies.
This study presents a comprehensive analysis of a record-breaking storm over the Black Sea, using a combination of GNSS, infrasound, and seismic data to capture the dynamics of extreme weather events. Our findings underscore the power of multi-sensor networks in enhancing the understanding of storm behavior, particularly in the context of atmospheric moisture, lightning activity, and storm-induced seismic signals. GNSS-derived integrated precipitable water vapor indicates a clear buildup of atmospheric moisture hours before the onset of heavy rainfall, providing valuable insights into the lead-up to extreme precipitation events. Infrasound and seismic data further complemented this analysis, with infrasound providing useful observations of lightning activity and seismic data revealing the link between rainfall intensity and high-frequency seismic noise.
The storm analysed here represents an exceptional meteorological event and one of the most intense storms recorded in the region in recent years. According to the ClimaMeter analysis of Antonescu et al. (2024), the characteristics of this storm place it within the broader context of extreme events under changing climate conditions. The integration of GNSS, infrasound, and seismic data provides a more nuanced and holistic view of storm dynamics, highlighting the need for advanced monitoring systems to predict and respond to such extreme events. Looking forward, such multi-sensor approaches may support future developments in integrated environmental monitoring and research into early-warning capabilities, ultimately contributing to improved understanding and characterization of high-impact atmospheric events.
Seismic data were processed with the open-source python framework for seismology Obspy (Beyreuther et al., 2010). Infrasound data was processed with the WinPMCC software (Le Pichon et al., 2010) developed by CEA/DASE (French Atomic Energy Commission, Environmental Assessment and Monitoring Department) and open-source Python libraries for signal processing. Some of the figures were made with GMT (Generic Mapping Tools, Wessel et al., 2019). The GNSS data was processed using Gamit/Globk (Herring et al., 2020) developed by Massachusetts Institute of Technology (http://www-gpsg.mit.edu/gg/, last access: 10 March 2026).
Processed infrasound, seismic, and GNSS-derived integrated water vapour data can be visualized and accessed via the INFP monitoring platforms: https://infp.ro/dashboard-reactive.php (last access: 9 April 2026) and https://reactive.infp.ro/events/ (last access: 9 April 2026). Seismic data are part of the Romanian National Seismic Network maintained by the National institute for Earth Physics (NIEP, https://www.infp.ro/, last access: 9 April 2026) and are freely available in the miniseed format via EIDA (European Integrated Data Archive, https://www.orfeus-eu.org/data/eida/, last access: 9 April 2026). GNSS data are available for download from NIEP (http://gps.infp.ro/#/download, last access: 9 April 2026) and are provided in the standardized RINEX v2 format, with 24 h files sampled at 30 s intervals. Infrasound data at AGIR are available to download from NIEP via FDSN dataselect web service. Hourly hydro-meteorological data were obtained from the Copernicus Climate Change Service, Climate Data Store (https://doi.org/10.24381/cds.bd0915c6), ERA5 dataset (Hersbach et al., 2023). Limited wind and precipitation data were downloaded from the National Meteorological Agency from https://www.meteoromania.ro/grafice/ (last access: 13 September 2024) and from https://www.meteoromania.ro/clim/caracterizare-lunara/cc_2024_08.html (last access: 10 November 2025), respectively. Lightning data came from Meteosat Third Generation Lightning Imager operated by EUMETSAT (The European Organisation for the Exploitation of Meteorological Satellites, https://www.eumetsat.int/, last access: 15 April 2025).
The supplement related to this article is available online at https://doi.org/10.5194/nhess-26-2227-2026-supplement.
LP: Conceptualization, Methodology, Software, Formal analysis, Data Curation, Writing-Original Draft, Visualization; BA: Conceptualization, Writing-Review & Editing, Visualization; SN: Software, Formal Analysis, Data curation, Visualisation, Writing-Review & Editing; IF: Methodology, Software, Formal analysis, Data Curation, Writing-Original Draft, Visualization; DE Software, Formal analysis, Data Curation, Writing-Review & Editing; DG: Software, Formal analysis, Data Curation; CI: Funding Acquisition, Resources, Project administration; AA: Methodology, Supervision; MD: Methodology, Supervision, Funding Acquisition, Resources, Project administration.
The contact author has declared that none of the authors has any competing interests.
Publisher's note: Copernicus Publications remains neutral with regard to jurisdictional claims made in the text, published maps, institutional affiliations, or any other geographical representation in this paper. The authors bear the ultimate responsibility for providing appropriate place names. Views expressed in the text are those of the authors and do not necessarily reflect the views of the publisher.
We would like to thank the technicians and staff at NIEP for their support in installing, maintaining, and ensuring the proper functioning of the equipment used in this study. Additionally, we appreciate the efforts of those involved in data formatting and preparation (Cristian Neagoe, Eduard Nastase, Victorin Toader) which were essential for this work. We also thank the two anonymous reviewers for their valuable feedback, which helped improve the manuscript.
This work was supported by the European Union - NextGenerationEU and the Romanian Ministry of Education and Research, within the framework of the “Competence Center for Climate Change Digital Twin for Earth forecasts and societal redressment” Project PNRR- DTEClimate nr. 760008/31.12.2023, subproject Reactive “The Research center for climate change due to natural disasters and extreme weather events”. LP was supported by the NUCLEU project (SOL4RISC Program, project nr. PN23360201) under the Ministry of Education and Research.
This paper was edited by Philip Ward and reviewed by three anonymous referees.
Antonescu, B., Dafis, S., and Faranda, D.: Changes in precipitation patterns driving August 2024 Romania floods mostly driven by human-driven climate change, ClimaMeter, Institut Pierre Simon Laplace, CNRS, https://doi.org/10.5281/zenodo.14056214, 2024.
Ardhuin, F., Gualtieri, L., Stutzmann, E., Nakata, N., and Fichtner, A.: Physics of ambient noise generation by ocean waves, in: Seismic ambient noise, edited by: Nakata, N., Gualtieri, L., and Fichtner, A., Cambridge University Press, 69–108, https://doi.org/10.1017/9781108264808.005, 2019.
Assink, J. D., Evers, L. G., Holleman, I., and Paulssen, H.: Characterization of infrasound from lightning, Geophys. Res. Lett., 35, L15802, https://doi.org/10.1029/2008GL034193, 2008.
Aster, R. C., McNamara, D. E., and Bromirski, P. D.: Multidecadal climate-induced variability in microseisms, Seismol. Res. Lett., 79, 194–202, https://doi.org/10.1785/gssrl.79.2.194, 2008.
Aster, R. C., Ringler, A. T., Anthony, R. E., and Lee, T. A.: Increasing ocean wave energy observed in Earth's seismic wavefield since the late 20th century, Nat. Commun., 14, 6984, https://doi.org/10.1038/s41467-023-42673-w, 2023.
Athanase, M., Sánchez-Benítez, A., Monfort, E., Jung, T., and Goessling, H. F.: How climate change intensified storm Boris' extreme rainfall, revealed by near-real-time storylines, Commun. Earth Environ., 5, 676, https://doi.org/10.1038/s43247-024-01847-0, 2024.
Awange, J. L.: Environmental monitoring using GNSS: Global navigation satellite systems, Springer, Heidelberg, https://doi.org/10.1007/978-3-540-88256-5, 2012.
Bengtsson, L., Hodges, K. I., and Roeckner, E.: Storm tracks and climate change, J. Climate, 19, 3518–3543, https://doi.org/10.1175/JCLI3815.1, 2006.
Beyreuther, M., Barsch, R., Krischer, L., Megies, T., Behr, Y., and Wassermann, J.: ObsPy: A Python toolbox for seismology, Seismol. Res. Lett., 81, 530–533, https://doi.org/10.1785/gssrl.81.3.530, 2010.
Bližňák, V. and Sokol, Z.: First validation of the Lightning Imager aboard Meteosat Third Generation satellite with Earth Networks Total Lightning Network, Int. J. Appl. Earth Obs., 147, 105205, https://doi.org/10.1016/j.jag.2026.105205, 2026.
Bondár, I., Šindelářová, T., Ghica, D., Mitterbauer, U., Liashchuk, A., Baše, J., Chum, J., Czanik, C., Ionescu, C., Neagoe, C., and Pásztor, M.: Central and Eastern European Infrasound Network: contribution to infrasound monitoring, Geophys. J. Int., 230, 565–579, https://doi.org/10.1093/gji/ggac066, 2022.
Borzì, A. M., Minio, V., Cannavò, F., Cavallaro, A., D'Amico, S., Gauci, A., De Plaen, R., Lecocq, T., Nardone, G., Orasi, A., Picone, M., and Cannata, A.: Monitoring extreme meteo-marine events in the Mediterranean area using the microseism (Medicane Apollo case study), Sci. Rep.-UK, 12, https://doi.org/10.1038/s41598-022-25395-9, 2022.
Bosy, J., Kaplon, J., Rohm, W., Sierny, J., and Hadas, T.: Near real-time estimation of water vapour in the troposphere using ground GNSS and the meteorological data, Ann. Geophys., 30, 1379–1391, https://doi.org/10.5194/angeo-30-1379-2012, 2012.
Brachet, N., Brown, D., Le Bras, R., Cansi, Y., Mialle, P., and Coyne, J.: Monitoring the Earth's Atmosphere with the Global IMS Infrasound Network, in: Infrasound Monitoring for Atmospheric Studies, edited by: Le Pichon, A., Blanc, E., and Hauchecorne, A., Springer, Dordrecht, https://doi.org/10.1007/978-1-4020-9508-5_3, 2009.
Bromirski, P. D. and Duennebier, F. K.: The near-coastal microseism spectrum: Spatial and temporal wave climate relationships, J. Geophys. Res.-Sol. Ea., 107, ESE 5-1-ESE 5–20, https://doi.org/10.1029/2001JB000265, 2002.
Bruyninx, C., Habrich, H., Söhne, W., Kenyeres, A., Stangl, G., and Völksen, C.: Enhancement of the EUREF Permanent Network Services and Products, in: Geodesy for Planet Earth. International Association of Geodesy Symposia, edited by: Kenyon, S., Pacino, M., and Marti, U., 136, Springer, Berlin, Heidelberg, https://doi.org/10.1007/978-3-642-20338-1_4, 2012.
Burtin, A., Hovius, N., and Turowski, J. M.: Seismic monitoring of torrential and fluvial processes, Earth Surf. Dynam., 4, 285–307, https://doi.org/10.5194/esurf-4-285-2016, 2016.
Butler, R. and Aucan, J.: Multisensor, microseismic observations of a hurricane transit near the ALOHA cabled observatory, J. Geophys. Res.-Sol. Ea., 123, 3027–3046, https://doi.org/10.1002/2017JB014885, 2018.
Campus, P. and Christie, D. R.: Worldwide observations of infrasonic waves, in: Infrasound monitoring for atmospheric studies, edited by: Le Pichon, A., Blanc, E., and Hauchecorne, A., Springer, Dordrecht, Netherlands, 185–234, https://doi.org/10.1007/978-1-4020-9508-5_6, 2009.
Cansi, Y. and Le Pichon, A. L.: Infrasound event detection using the progressive multi-channel correlation algorithm, in: Handbook of signal processing in acoustics, edited by: Havelock, D., Kuwano, S., and Vorländer, M., Springer, New York, 1425–1435, https://doi.org/10.1007/978-0-387-30441-0_77, 2008.
Coates, A. and Ng, A. Y.: Learning feature representations with k-means, in: Neural Networks: Tricks of the Trade: Second Edition, Berlin, Heidelberg, Springer Berlin Heidelberg, edited by: Montavon, G., Orr, G. B., and Muller, K. R., 561–580, https://doi.org/10.1007/978-3-642-35289-8_30, 2012.
Copernicus Climate Change Service: Complete ERA5 global atmospheric reanalysis, Copernicus Climate Change Service (C3S) Climate Data Store (CDS), https://doi.org/10.24381/cds.143582cf, 2023.
Coviello, V., Palo, M., Adirosi, E., and Picozzi, M.: Seismic signature of an extreme hydro-meteorological event in Italy, Nat. Hazards, 1, 17, https://doi.org/10.1038/s44304-024-00018-7, 2024.
Díaz, J., Ruiz, M., Sánchez-Pastor, P. S., and Romero, P.: Urban seismology: On the origin of earth vibrations within a city, Sci. Rep.-UK, 7, 15296, https://doi.org/10.1038/s41598-017-15499-y, 2017.
Diaz, J., Ruiz, M., Udina, M., Polls, F., Martí, D., and Bech, J.: Monitoring storm evolution using a high-density seismic network, Sci. Rep.-UK, 13, https://doi.org/10.1038/s41598-023-28902-8, 2023.
Dimitriu, R. G., Stanciu, I. M., Barbu M.-B., Dobrev, N., and Dumitru, P.: First results on the western Black Sea coast geodynamics resulted from GeoPontica permanent GNSS stations network data processing, in: Proceedings of the 17th International Multidisciplinary Scientific GeoConference SGEM, Albena, Bulgaria August 2017, 17, 149–157, https://doi.org/10.5593/sgem2017/11/S01.019, 2017.
Dullaart, J. C., Muis, S., Bloemendaal, N., and Aerts, J. C.: Advancing global storm surge modelling using the new ERA5 climate reanalysis, Clim. Dynam., 54, 1007–1021, https://doi.org/10.1007/s00382-019-05044-0, 2020.
Ebeling, C. W.: Inferring Ocean Storm Characteristics from Ambient Seismic Noise. A Historical Perspective, Adv. Geophys., 53, 1–33, https://doi.org/10.1016/B978-0-12-380938-4.00001-X, 2012.
Enno, S.-E., Viticchie, B., Navia, D., and Grandell, J.: Meteosat-12 Lightning Imager: first year of observations and the main performance characteristics, 12th European Conference on Severe Storms, Utrecht, The Netherlands, 17–21 November 2025, ECSS2025-152, https://doi.org/10.5194/ecss2025-152, 2025.
Faranda, D., Messori, G., Coppola, E., Alberti, T., Vrac, M., Pons, F., Yiou, P., Saint Lu, M., Hisi, A. N. S., Brockmann, P., Dafis, S., Mengaldo, G., and Vautard, R.: ClimaMeter: contextualizing extreme weather in a changing climate, Weather Clim. Dynam., 5, 959–983, https://doi.org/10.5194/wcd-5-959-2024, 2024.
Floroiu, I., Anghel, A., Petrescu, L., and Datcu, M.: Clustering and Feature-Based Similarity Retrieval of Infrasound Events during Two Storms in Constanţa, Romania, International Conference on Machine Intelligence for GeoAnalytics and Remote Sensing (MIGARS), Bucharest, Romania, 1–4, https://doi.org/10.1109/MIGARS67156.2025.11231952, 2025.
Francoeur, J. W., Matoza, R. S., Ortiz, H. D., and De Negri, R.: Identification of transient seismo-acoustic signals from crashing ocean waves: template matching and location of discrete surf events, Geophys. J. Int., 243, ggaf317, https://doi.org/10.1093/gji/ggaf317, 2025.
Garcés, M. A.: On infrasound standards, part 1 time, frequency, and energy scaling, InfraMatics, 2, 13–35, https://doi.org/10.4236/inframatics.2013.22002, 2013.
Gastmeier, W. J. and Howe, B.: Recent studies of infrasound from industrial sources, Canadian Acoustics, 36, 58–59, https://jcaa.caa-aca.ca/index.php/jcaa/article/view/2036 (last access: 7 May 2026), 2008.
Grafkina, M. V., Nyunin, B. N., and Sviridova, E. Y: Environmental monitoring and simulation of infrasound generating mechanism of traffic flow, J. Ecol. Eng., 20, https://doi.org/10.12911/22998993/109877, 2019.
Grevemeyer, I., Herber, R., and Essen, H. H.: Microseismological evidence for a changing wave climate in the northeast Atlantic Ocean, Nature, 408, 349–352, https://doi.org/10.1038/35042558, 2000.
Groos, J. C. and Ritter, J. R. R.: Time domain classification and quantification of seismic noise in an urban environment, Geophys. J. Int., 179, 1213–1231, https://doi.org/10.1111/j.1365-246X.2009.04343.x, 2009.
Gualtieri, L., Camargo, S. J., Pascale, S., Pons, F. M. E., and Ekström, G.: The persistent signature of tropical cyclones in ambient seismic noise, Earth Planet. Sc. Lett., 484, 287–294, https://doi.org/10.1016/j.epsl.2017.12.026, 2018.
Guerova, G., Jones, J., Douša, J., Dick, G., de Haan, S., Pottiaux, E., Bock, O., Pacione, R., Elgered, G., Vedel, H., and Bender, M.: Review of the state of the art and future prospects of the ground-based GNSS meteorology in Europe, Atmos. Meas. Tech., 9, 5385–5406, https://doi.org/10.5194/amt-9-5385-2016, 2016.
Herring, T., King, R., Floyd, M., and McClusky, S.: GAMIT Reference Manual GPS Analysis at MIT Release 10.7. GAMIT/GLOBK, http://www-gpsg.mit.edu/gg/ (last access: 10 March 2026), 2020.
Hersbach, H., Bell, B., Berrisford, P., Hirahara, S., Horányi, A., Muñoz-Sabater, J., Nicolas, J., Peubey, C., Radu, R., Schepers, D., and Simmons, A.: The ERA5 global reanalysis, Q. J. Roy. Meteor. Soc., 146, 1999–2049, https://doi.org/10.1002/qj.3803, 2020.
Hersbach, H., Bell, B., Berrisford, P., Biavati, G., Horányi, A., Muñoz Sabater, J., Nicolas, J., Peubey, C., Radu, R., Rozum, I., Schepers, D., Simmons, A., Soci, C., Dee, D., and Thépaut, J.-N.: ERA5 hourly data on single levels from 1940 to present, Copernicus Climate Change Service (C3S) Climate Data Store (CDS) [data set], https://doi.org/10.24381/cds.bd0915c6, 2023.
Holmlund, K., Grandell, J., Schmetz, J., Stuhlmann, R., Bojkov, B., Munro, R., Lekouara, M., Coppens, D., Viticchie, B., August, T., and Theodore, B.: Meteosat Third Generation (MTG): Continuation and innovation of observations from geostationary orbit, B. Am. Meteorol. Soc., 102, E990–E1015, https://doi.org/10.1175/BAMS-D-19-0304.1, 2021.
Hua, J., Wu, M., Mulholland, J. P., Neelin, J. D., Tsai, V. C., and Trugman, D. T.: High-resolution precipitation monitoring with a dense seismic nodal array, Sci. Rep.-UK, 13, 11450, https://doi.org/10.1038/s41598-023-38008-w, 2023.
Hupe, P., Ceranna, L., Pilger, C., de Carlo, M., Le Pichon, A., Kaifler, B., and Rapp, M.: Assessing middle atmosphere weather models using infrasound detections from microbaroms, Geophys. J. Int., 216, 1761–1767, https://doi.org/10.1093/gji/ggy520, 2019.
Hupe, P., Ceranna, L., Le Pichon, A., Matoza, R. S., and Mialle, P.: International Monitoring System infrasound data products for atmospheric studies and civilian applications, Earth Syst. Sci. Data, 14, 4201–4230, https://doi.org/10.5194/essd-14-4201-2022, 2022.
Iliescu, A. I., Rus, T., Danciu, V., Moldoveanu, C., and Ilie, A.: Current situation of GNSS networks in Romania, Bulletin of University of Agricultural Sciences and Veterinary Medicine Cluj-Napoca, Horticulture, 76, https://doi.org/10.15835/buasvmcn-hort:2019.0040, 2019.
Jakobsen, J.: Infrasound emission from wind turbines, J. Low. Freq. Noise V. A., 24, 145–155, https://doi.org/10.1260/0263092057753744, 2005.
Jiao, D., Xu, N., Yang, F., and Xu, K.: Evaluation of spatial-temporal variation performance of ERA5 precipitation data in China, Sci. Rep.-UK, 11, 17956, https://doi.org/10.1038/s41598-021-97432-y, 2021.
Johnston, G., Riddell, A., and Hausler, G.: The international GNSS service, in: Springer handbook of global navigation satellite systems, edited by: Teunissen, P. J. and Montenbruck, O., Springer, Cham, Switzerland, 967–982, https://doi.org/10.1007/978-3-319-42928-1_33, 2017.
Jones, J., Guerova, G., Douša, J., Dick, G., de Haan, S., Pottiaux, E., Bock, O., Pacione, R., and Van Malderen, R.: Advanced GNSS tropospheric products for monitoring severe weather events and climate, COST Action ES1206 Final Action Dissemination Report, 563, https://doi.org/10.1007/978-3-030-13901-8, 2020.
Karabatić, A., Weber, R., and Haiden, T.: Near real-time estimation of tropospheric water vapour content from ground based GNSS data and its potential contribution to weather now-casting in Austria, Adv. Space Res., 47, 1691–1703, https://doi.org/10.1016/j.asr.2010.10.028, 2011.
Kober, K. and Tafferner, A.: Tracking and nowcasting of convective cells using remote sensing data from radar and satellite, Meteorol. Z., 1, 75–84, https://doi.org/10.1127/0941-2948/2009/359, 2009.
Kokou, P.: Status of the MTG-I1 Lightning Imager commissioning activities, in: EUMETSAT Conference 2023, 1-C GEO – MTG, Malmö, Sweden, 12 September 2023, https://www-cdn.eumetsat.int/files/2023-10/3. Pierre Kokou 11.15.pdf (last access: 9 April 2026), 2023.
Koper, K. D. and Burlacu, R.: The fine structure of double-frequency microseisms recorded by seismometers in North America, J. Geophys. Res.-Sol. Ea., 120, 1677–1691, https://doi.org/10.1002/2014JB011820, 2015.
Landès, M., Ceranna, L., Le Pichon, A., and Matoza, R. S.: Localization of microbarom sources using the IMS infrasound network, J. Geophys. Res.-Atmos., 117, https://doi.org/10.1029/2011JD016684, 2012.
Landskron, D. and Böhm, J.: VMF3/GPT3: refined discrete and empirical troposphere mapping functions, J. Geodesy., 92, 349–360, https://doi.org/10.1007/s00190-017-1066-2, 2018.
Le Pichon, A., Matoza, R., Brachet, N., and Cansi, Y.: Recent enhancements of the PMCC infrasound signal detector, Inframatics, 26, 5–8, https://matoza.faculty.geol.ucsb.edu/files/lepichon_2010.pdf (last access: 9 April 2026), 2010.
Li, L., Boué, P., Retailleau, L., and Campillo, M.: Spatiotemporal Correlation Analysis of Noise-Derived Seismic Body Waves With Ocean Wave Climate and Microseism Sources, Geochem. Geophy. Geosy., 21, https://doi.org/10.1029/2020GC009112, 2020.
Listowski, C., Forestier, E., Dafis, S., Farges, T., De Carlo, M., Grimaldi, F., Le Pichon, A., Vergoz, J., Heinrich, P., and Claud, C.: Remote monitoring of Mediterranean hurricanes using infrasound, Remote Sens.-Basel, 14, 6162, https://doi.org/10.3390/rs14236162, 2022.
MacQueen, J.: Some methods for classification and analysis of multivariate observations, in: Proceedings of the Fifth Berkeley Symposium on Mathematical Statistics and Probability, Berkeley, California, January 1967, 5, 281–298, https://digicoll.lib.berkeley.edu/record/113015/files/math_s5_v1_article-17.pdf (last access: 9 April 2026), 1967.
Marut, G., Hadas, T., Kaplon, J., Trzcina, E., and Rohm, W.: Monitoring the water vapor content at high spatio-temporal resolution using a network of low-cost multi-GNSS receivers, IEEE T. Geosci. Remote, 60, 1–14, https://doi.org/10.1109/TGRS.2022.3226631, 2022.
Nistor, S., Suba, N. S., Maciuk, K., Kudrys, J., Nastase, E. I., and Muntean, A.: Analysis of noise and velocity in GNSS EPN-repro 2 time series, Remote Sens.-Basel, 13, 2783, https://doi.org/10.3390/rs13142783, 2021a.
Nistor, S., Suba, N. S., El-Mowafy, A., Apollo, M., Malkin, Z., Nastase, E. I., Kudrys, J., and Maciuk, K.: Implication between geophysical events and the variation of seasonal signal determined in GNSS position time series, Remote Sens.-Basel, 13, 3478, https://doi.org/10.3390/rs13173478, 2021b.
Pásztor, M., Czanik, C., and Bondár, I.: A single array approach for infrasound signal discrimination from quarry blasts via machine learning, Remote Sens.-Basel, 15, 1657, https://doi.org/10.3390/rs15061657, 2023.
Price, I., Sanchez-Gonzalez, A., Alet, F., Andersson, T. R., El-Kadi, A., Masters, D., Ewalds, T., Stott, J., Mohamed, S., Battaglia, P., and Lam, R.: Probabilistic weather forecasting with machine learning, Nature, 637, 84–90, https://doi.org/10.1038/s41586-024-08252-9, 2025.
Priego, E., Jones, J., Porres, M. J., and Seco, A.: Monitoring water vapour with GNSS during a heavy rainfall event in the Spanish Mediterranean area, Geomat. Nat. Haz. Risk, 8, 282–294, https://doi.org/10.1080/19475705.2016.1201150, 2017.
Retailleau, L. and Gualtieri, L.: Multi-phase seismic source imprint of tropical cyclones, Nat. Commun., 12, https://doi.org/10.1038/s41467-021-22231-y, 2021.
Rindraharisaona, E. J., Réchou, A., Fontaine, F. R., Barruol, G., Stamenoff, P., Boudevillain, B., Rigaud-Louise, F., and Delcher, E.: Seismic signature of rain and wind inferred from seismic data, Earth Space Sci., 9, p.e2022EA002328, https://doi.org/10.1029/2022EA002328, 2022.
Šindelářová, J., Chum, J., Skripnikova, K., and Base, J.: Atmospheric infrasound observed during intense convective storms on 9–10 July 2011, J. Atmos. Sol.-Terr. Phy., 122, 66–74, https://doi.org/10.1016/j.jastp.2014.10.014, 2015.
Šindelářová, T., De Carlo, M., Czanik, C., Ghica, D., Kozubek, M., Podolská, K., Baše, J., Chum, J., and Mitterbauer, U.: Infrasound signature of the post-tropical storm Ophelia at the Central and Eastern European Infrasound Network, J. Atmos. Sol.-Terr. Phy., 217, 105603, https://doi.org/10.1016/j.jastp.2021.105603, 2021.
Smirnov, A., De Carlo, M., Le Pichon, A., Shapiro, N. M., and Kulichkov, S.: Characterizing the oceanic ambient noise as recorded by the dense seismo-acoustic Kazakh network, Solid Earth, 12, 503–520, https://doi.org/10.5194/se-12-503-2021, 2021.
Soci, C., Hersbach, H., Simmons, A., Poli, P., Bell, B., Berrisford, P., Horányi, A., Muñoz-Sabater, J., Nicolas, J., Radu, R., and Schepers: The ERA5 global reanalysis from 1940 to 2022, Q. J. Roy. Meteor. Soc., 150, 4014–4048, https://doi.org/10.1002/qj.4803, 2024.
Sokol, Z., Szturc, J., Orellana-Alvear, J., Popova, J., Jurczyk, A., and Célleri, R.: The role of weather radar in rainfall estimation and its application in meteorological and hydrological modelling – A review, Remote Sens.-Basel, 13, 351, https://doi.org/10.3390/rs13030351, 2021.
Stopa, J. E., Cheung, K. F., Garcés, M. A., and Badger, N.: Atmospheric infrasound from nonlinear wave interactions during Hurricanes Felicia and Neki of 2009, J. Geophys. Res.-Oceans, 117, https://doi.org/10.1029/2012JC008257, 2012
Stott, P.: How climate change affects extreme weather events, Science, 352, 1517–1518, https://doi.org/10.1126/science.aaf7271, 2016.
Tanimoto, T. and Anderson, A.: Seismic noise between 0.003 Hz and 1.0 Hz and its classification, Prog. Earth Planet. Sci., 10, https://doi.org/10.1186/s40645-023-00587-7, 2023.
Taweesintananon, K., Landrø, M., Potter, J. R., Johansen, S. E., Rørstadbotnen, R. A., Bouffaut, L., Kriesell, H. J., Brenne, J. K., Haukanes, A., Schjelderup, O., and Storvik, F.: Distributed acoustic sensing of ocean-bottom seismo-acoustics and distant storms: A case study from Svalbard, Norway, Geophysics, 88, B135–B150, https://doi.org/10.1190/geo2022-0435.1, 2023.
Tiberia, A., Mascitelli, A., D'adderio, L. P., Federico, S., Marisaldi, M., Porcù, F., Realini, E., Gatti, A., Ursi, A., Fuschino, F., and Tavani, M.: Time evolution of storms producing terrestrial gamma-ray flashes using ERA5 reanalysis data, GPS, lightning and geostationary satellite observations, Remote Sens.-Basel, 13, 784, https://doi.org/10.3390/rs13040784, 2021.
Vaquero-Martínez, J. and Antón, M.: Review on the role of GNSS meteorology in monitoring water vapor for atmospheric physics, Remote Sens.-Basel, 13, 2287, https://doi.org/10.3390/rs13122287, 2021.
Viticchie, B., Lekouara, M., Hungershöfer, K., Joro, S., Grandell, J., Maufrais, A., Marquez, M. J., and Munro, R.: Algorithm Theoretical Basis Document (ATBD) for L2 processing of the MTG Lightning Imager data, Rapp. Tech. EUMESTAT [data set], 6, https://user.eumetsat.int/s3/eup-strapi-media/Algorithm_Theoretical_Basis_Document_ATBD_for_L2_processing_of_the_MTG_Lightning_Imager_data_9e724c567a.pdf (last access: 9 April 2026), 2020.
Waxler, R., Frazier, W. G., Talmadge, C. L., Liang, B., Hetzer, C., Buchanan, H., and Audette, W. E.: Analysis of infrasound array data from tornadic storms in the southeastern United States, J. Acoust. Soc. Am., 156, 1903–1919, https://doi.org/10.1121/10.0028815, 2024.
Wessel, P., Luis, J. F., Uieda, L. A., Scharroo, R., Wobbe, F., Smith, W. H., and Tian, D.: The generic mapping tools version 6, Geochem. Geophy. Geosy., 20, 5556–5564, https://doi.org/10.1029/2019GC008515, 2019.
Wilgan, K., Rohm, W., and Bosy, J.: Multi-observation meteorological and GNSS data comparison with numerical weather prediction model, Atmos. Res., 156, 29–42, https://doi.org/10.1016/j.atmosres.2014.12.011, 2015.
Wu, G., Qin, S., Mao, Y., Ma, Z., and Shi, C.: Validation of precipitation events in ERA5 to gauge observations during warm seasons over eastern China, J. Hydrometeorol., 23, 807–822, https://doi.org/10.1175/JHM-D-21-0195.1, 2022.