the Creative Commons Attribution 4.0 License.
the Creative Commons Attribution 4.0 License.
 | 08 May 2026
Combining hazard, exposure and vulnerability data to predict historical United States hurricane losses
Alexander F. Vessey
Alexander J. Baker
Vernie Marcellin-Honore
James Michelin
Hurricanes are among the most destructive natural hazards globally. The widely used Saffir–Simpson scale is an effective public-communication tool, but it is based on a single hazard quantity (wind speed) and has low skill in representing historical economic losses. Accurate risk assessment requires hazard, exposure, and vulnerability information. We present a statistical model to predict losses from North Atlantic hurricanes making landfall in the United States using optimally weighted, normalised-rank quantities describing hazard, exposure, and vulnerability. The model significantly outperforms single-parameter predictions, including landfall wind-speed maxima and central-pressure minima. Root-mean-square error between observed losses and losses predicted from landfall wind speed alone is USD 35.6 billion, which our model reduces to USD 7.0 billion. To improve the characterisation of risk, we introduce a loss-based “Hurricane Predictive Loss Scale” to more directly link hurricane characteristics and landfall to financial impacts. These results demonstrate that integrating exposure and vulnerability data with hazard observations yields skilful estimates of historical hurricane losses, and our approach may help assess how loss from a forecast landfall may rank among historical events. This work is applicable to other cyclone-prone regions and highlights the critical need for open-source exposure and vulnerability data to advance climate risk understanding.
-
Please read the editorial note first before accessing the article.
-
Article
(4587 KB)
-
Supplement
(2544 KB)
-
Please read the editorial note first before accessing the article.
- Article
(4587 KB) - Full-text XML
-
Supplement
(2544 KB) - BibTeX
- EndNote


Intense tropical cyclones are the most impactful meteorological hazard worldwide (Aon, 2025; World Meteorological Organization, 2021). Between 1980 and 2024, global economic losses due to tropical cyclone landfalls totals USD 2.9 trillion (National Oceanographic and Atmospheric Administration, 2024), through extreme wind, storm surge and rainfall. Generally, extreme wind induces building damage (Ibrahim et al., 2024) and storm surge and intense rainfall cause fatalities (Rappaport, 2014). Improving our understanding of hurricane risk is essential to mitigating impacts through long-term policies, such as strengthened building codes, and short-term preparedness measures, such as early-warning systems.
Skilful hurricane damage assessments are challenging and uncertain, as the impacted area may be large and building damage highly site-specific. Nonetheless, damage assessment reports over the last century agree that the most financially impactful U.S. hurricanes include the Great Miami Hurricane (1926), Katrina (2005), and Harvey (2017) (Delforge et al., 2025; Grinsted et al., 2019; Muller et al., 2025; National Centers for Environmental Information, 2025; Weinkle et al., 2018). Hurricane-related economic losses have increased over time (Grinsted et al., 2019; Klotzbach et al., 2022b), which will likely continue with increasing development in exposed regions in the U.S. (Iglesias et al., 2021). These trends highlight the urgency of understanding impacts and losses to enhance disaster preparedness and support mitigation. However, uncertainties in studies of high-impact landfalling events are high compared with basin-wide metrics of cyclone activity (Emanuel, 2011). Additionally, significant uncertainty remains over how hurricane-related impacts will evolve in a warming climate (Knutson et al., 2020; Meiler et al., 2025), including U.S. landfalls (Jewson, 2023), so understanding the key factors responsible for, and which therefore help predict, losses regionally is critical.
Recent work has demonstrated skilful multi-year predictions of North Atlantic hurricane activity and U.S. hurricane damage, but individual high-damage events, particularly those occurring during periods of generally low activity, are not well predicted (Lockwood et al., 2023). Each hurricane-related loss is the result of a unique combination of meteorological and socioeconomic factors, and quantifying hurricane risk requires an understanding of hazard, exposure and vulnerability (Ward et al., 2020). Hazard quantities describe a hurricane's physical characteristics, including intensity, duration, size, and associated perils such as storm surge and rainfall-induced flooding. Exposure variables capture the location and value of affected assets, including residential, commercial, and industrial buildings within the storm's footprint. Vulnerability metrics reflect assets' susceptibility to damage, influenced by construction materials, design and age. To account for these factors, open-source catastrophe models, such as CLIMADA (Aznar-Siguan and Bresch, 2019), HAZUS (Federal Emergency Management Agency, 2024a) and OASIS LMF (Oasis Loss Modelling Framework, 2025), simulate a hurricane's track and estimate damage based on exposure and vulnerability at the landfall location. However, case-study evidence suggests such models significantly underestimate historical loss estimates for hurricanes (König, 2017) and other storm types, such as European windstorms (Welker et al., 2021). For hurricanes, this lack of skill may be due to the representation of hazard footprints (e.g., wind, precipitation and storm surge), resulting from the insufficient resolution of forecast model data or reliance on a parametric wind field (e.g., Holland et al., 2010). More complex, proprietary catastrophe models are typically used by (re-)insurers.
North Atlantic hurricanes are categorised using the Saffir–Simpson Hurricane Wind Scale, which indicates damage potential based on 1 min near-surface wind speed (Kelman, 2013). This scale is a key tool for public communication of hurricane risk (Cass et al., 2023). However, as it is based on a single hazard quantity, it does not predict damage sufficiently skilfully (Bloemendaal et al., 2021). At landfall, central sea-level pressure minima are more strongly correlated with normalised historical hurricane damage than wind-speed maxima (Klotzbach et al., 2020, 2022a), likely due to central pressure being physically related to both hurricane maximum wind speed and size (Chavas et al., 2025). There have been recent calls to modify the Saffir–Simpson scale (Wehner and Kossin, 2024) and develop multi-hazard and multidisciplinary (i.e., including exposure and vulnerability) equivalents (Tripathy et al., 2024) to help understand hurricane impacts and how risk may evolve in a warming climate (Camelo and Mayo, 2021; Gori et al., 2025; Ward et al., 2020).
To develop a hurricane classification more closely aligned with observed damage, Bloemendaal et al. (2021) devised a `Tropical Cyclone Severity Scale', which categorises hurricanes by incorporating wind speed, storm surge and accumulated rainfall. Hurricanes ranked by this scale corresponded better with historical losses compared with the Saffir–Simpson scale, but several events were still mis-represented and assigned a low category despite causing significant damage. For example, Hurricane Sandy (2012) resulted in an estimated USD 70 billion in normalised economic losses, but its classification was only changed from category 1 in the Saffir–Simpson scale to category 2 in the “Tropical Cyclone Severity Scale” (Bloemendaal et al., 2021). Other studies have attempted to develop skilful multidisciplinary scales (i.e., not only hazard information). Pilkington and Mahmoud (2016) used an artificial neural network model to forecast the economic impact from hurricanes using hazard and exposure data, including landfall location, population affected, wind speed, central pressure, precipitation and storm surge. Baldwin et al. (2023) showed the importance of differences in vulnerability between conurbations and rural areas for accurately modelling hurricane risk across the Philippines, stressing the importance of including a vulnerability layer to link a given wind speed to a percentage of exposed assets destroyed. These studies highlight the importance of accounting for multiple risk factors.
Focussing on historical U.S. landfalling hurricanes, this study examines numerous hurricane hazard, exposure and vulnerability quantities to determine whether the inclusion of socioeconomic data into a statistical loss-prediction model improves our ability to predict losses. Additionally, we developed a novel, loss-based hurricane classification scheme, which, if applied prior to forecast landfall, may communicate potential losses more accurately than Saffir–Simpson, thereby providing a usable preparedness tool for governments, disaster management agencies, and the financial sector. Here, “usable” means skilfully communicating where the expected loss would rank in the context of historical events and revising this estimation as hurricane forecasts evolve (i.e., with shorter lead times). This information could support effective preparedness by response agencies and adequate capital mobilisation by financial institutions and stakeholders. We address the following research questions:
-
Which single hazard, exposure and vulnerability variable(s) exhibit the highest correlation(s) to historical U.S. hurricane losses?
-
How skilful is a combination of hazard, exposure and vulnerability data in predicting historical U.S. losses compared with hazard-only predictions?
-
How skilfully does a loss-based hurricane classification scale represent historical U.S. losses?
This paper is structured as follows: datasets and methods are described in Sect. 2, results presented in Sects. 3–5, with a novel loss-based hurricane scale evaluated in Sect. 6, and discussion and conclusions presented in Sect. 7.
2.1 Data
In this section, we describe the datasets used to provide loss, hazard, exposure and vulnerability information for historical hurricanes affecting the U.S. Figure 1 provides a summary of these datasets and the temporal coverage spanned by each.
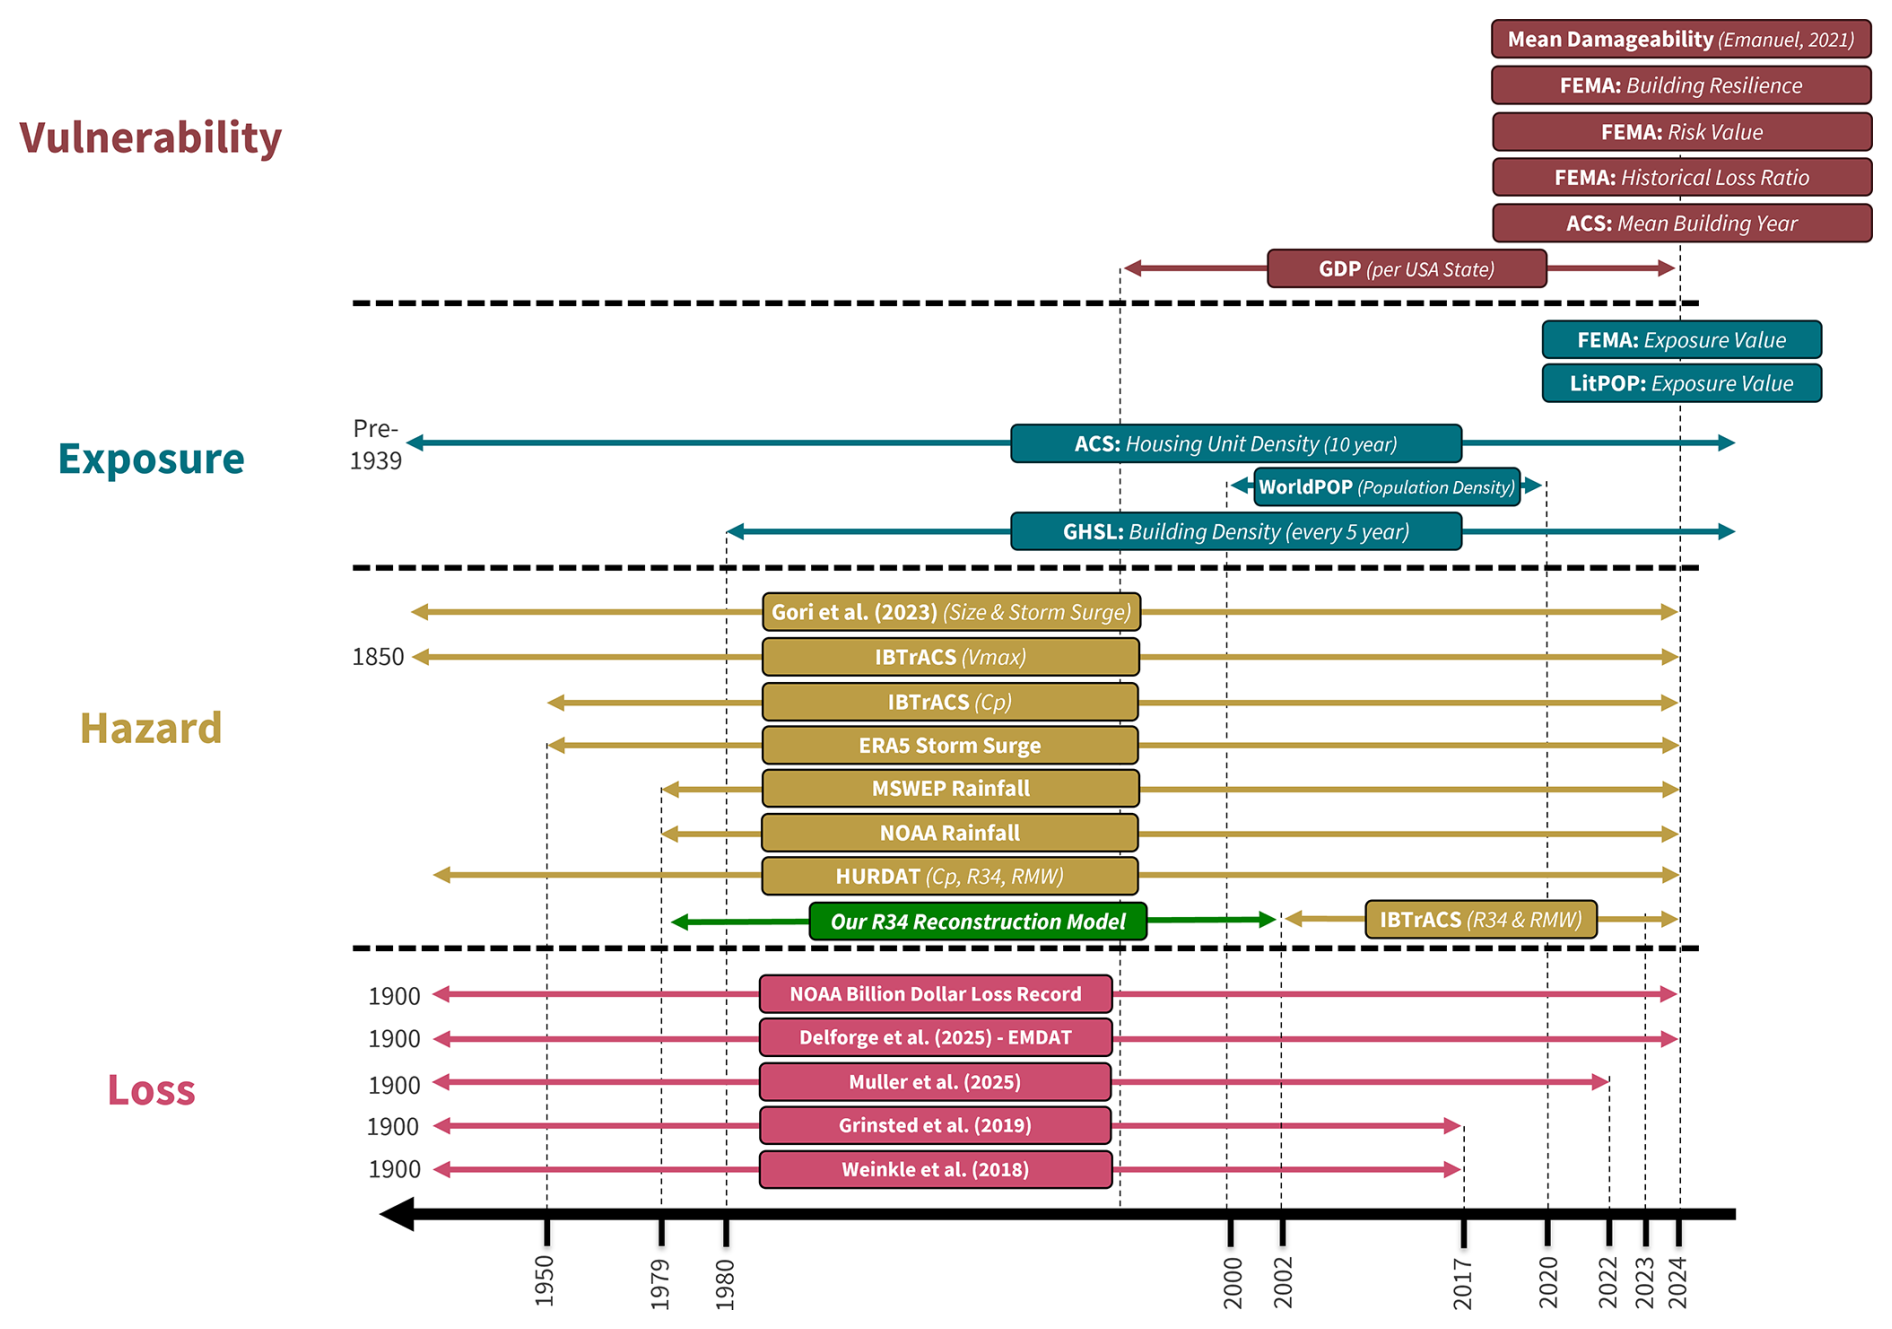
Figure 1Schematic overview of datasets used in this study. Hazard, exposure and vulnerability predictors were combined, with loss estimates being the predictand. Time-invariant exposure and vulnerability datasets are shown with no arrows. Note that the x-axis timeline is not linear. Table S1 in the Supplement provides additional information and references for these datasets.
2.1.1 Normalised historical hurricane losses
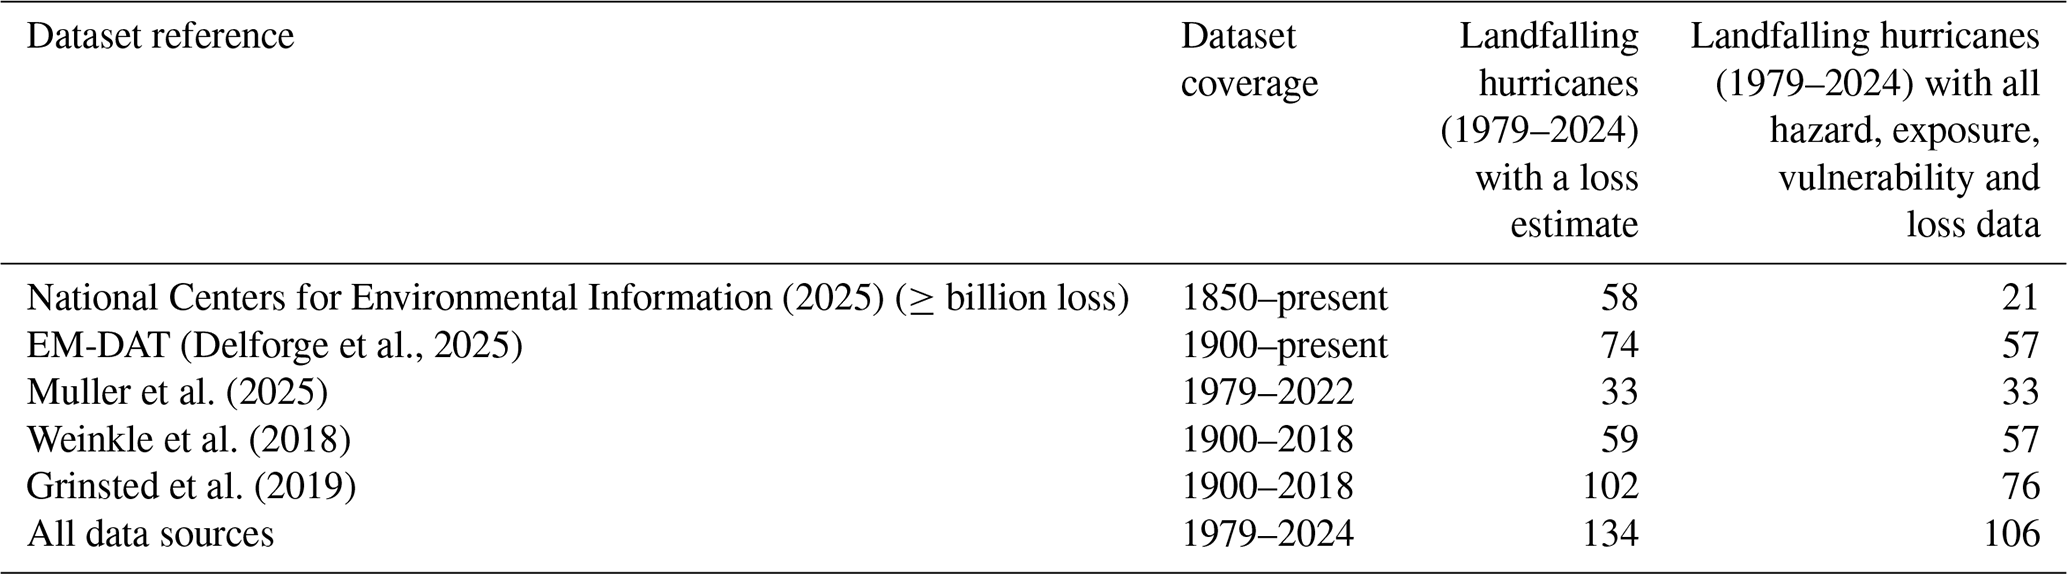
Various sources of historical hurricane loss information exist, but no consensus reference dataset. We collated the following published sources: Grinsted et al. (2019), Muller et al. (2025), National Centers for Environmental Information (2025), Weinkle et al. (2018), and the Emergency Events Database (EM-DAT; Delforge et al., 2025). These datasets differ in temporal coverage, reporting methodology, treatment of damage components, and inclusion of historical hurricane events (Fig. 1; Table 1). To maximise sample size, we combined these datasets and, for events with multiple loss estimates, these were averaged to avoid treating any dataset preferentially and help capture uncertainty. For hurricanes which made multiple landfalls, losses were averaged from the two sources – Grinsted et al. (2019) and Muller et al. (2025) – that provide per-landfall losses. Collating data in this way yielded 134 loss estimates for landfalling (including multiple landfalls) hurricanes for the period 1979–2024, of which all variables are available for 106 events (Table 1).
Table 1Summary of hurricane loss datasets, the number of U.S. hurricane landfalls (including multiple landfalls) during 1979–2024 for which a loss estimate is available, and the subset of these landfalls for which all predictors (hazard, exposure and vulnerability) are available.
Economic loss estimates must be calibrated to present-day levels of damage, including adjustment factors to account for temporal changes in inflation, wealth and building density (Weinkle et al., 2018). Typically, normalisation is based on country-level adjustments and assumes building density may be represented by residential housing changes. Regional variations in these factors, temporal changes in building vulnerability or commercial building density, and the impacts of climate change may not be accounted for (Muller et al., 2025). Each dataset we used (Table 1) provides un-normalised and normalised hurricane loss estimates. However, uncertainty arises due to the differing normalisation methodologies and reference years between datasets. To ensure consistency, we used un-normalised data and applied a unified normalisation approach, based on Weinkle et al. (2018) and Muller et al. (2025), where loss estimates were adjusted using country-level inflation and real-wealth-per-housing-unit factors (both as of 2024), and a county-level housing unit density factor (Eq. 1).
where L is loss per hurricane (and year), y, I is inflation, W is real national wealth per housing unit, and Hn is housing unit density. I was determined using the annual implicit price deflator for gross domestic product (GDP) for the period 1979–2024 (U.S. Bureau of Economic Analysis, 2023). Hn density was determined within R34 using U.S. housing unit data (U.S. Census Bureau, 2024). W was quantified using an estimate of current-cost net stock of fixed assets and consumer durable goods (U.S. Bureau of Economic Analysis, 2025).
2.1.2 Hazards
Hurricane track location, intensity and size information was obtained from the International Best Track Archive for Climate Stewardship (IBTrACS) v04r01 (Gahtan et al., 2024), provided by the National Hurricane Center. For each historical hurricane, we obtained 1 min sustained maximum wind speed, vmax, minimum central sea-level pressure, cp, translation speed, radius of maximum wind (from the storm centre), RMW, and the outermost radii of 34, 50 and 64 kn wind speeds (from the storm centre), respectively, R34, R50 and R64. Each quantity was determined at the timestep before the storm centre crosses over land, so atmospheric fields are minimally impacted by land–surface interactions. However, IBTrACS data are incomplete (i.e., not all hazard variables are available at every timestep for every hurricane). Therefore, we supplemented IBTrACS with data from NOAA's HURDAT2 reanalysis (Landsea and Franklin, 2013) – specifically, the “U.S. Hurricane Impacts/Landfalls” table of landfall information collected by NOAA reconnaissance aircraft (Hurricane Research Division, 2025) and from Gori et al. (2023). Where data are missing in IBTrACS, HURDAT2 data were substituted, if available. Where data are available in IBTrACS and HURDAT2 at a given timestep, HURDAT2 data were prioritised.
Storm surge and rainfall cause damage through coastal and inland flooding. In this study, historical hurricane storm tide (maximum storm surge and tidal height) data were taken from the storm surge residual product (Copernicus Climate Change Service, 2022), derived using the Global Tide and Surge Model version 3.0 (Kernkamp et al., 2011; Wang et al., 2021) forced by European Centre for Medium-Range Weather Forecasts' fifth-generation reanalysis (ERA5; Hersbach et al., 2020). This provides hourly reconstructed historical storm tide height from 1950–present. Storm tide residual is calculated as the difference between the total water level and simulated storm-tide elevation, including the influence of storm surge and tide. Storm tide may be larger in the hours before or after a hurricane makes landfall, depending on antecedent tidal height. To account for this, we defined the maximum storm tide residual as the maximum along the U.S. coastline within a 1000 km radius of the hurricane's central coordinate and 24 h before and after a hurricane makes landfall. An example maximum storm tide residual for Hurricane Katrina (2005) is shown in Fig. S1 in the Supplement.
Historical hurricane-related rainfall footprints were derived from the Multi-Source Weighted-Ensemble Precipitation (MSWEP) dataset (Beck et al., 2019), which assimilates gauge observations and satellite data to reconstruct 3-hourly rainfall 1979–present. For each hurricane, we determined total accumulated rainfall, maximum 3-hourly rain rate, and maximum total rain accumulation per grid-point along the track, each within a 500 km radius of the hurricane centre (location taken from IBTrACS) at each timestep. An example rainfall accumulation footprint for Hurricane Katrina is shown in Fig. S2. This chosen radius is based on previous research (e.g., Stansfield and Reed, 2023), although a fixed radius may lead to some overestimation of cyclone-related precipitation (Stansfield et al., 2020). To complement MSWEP, the maximum rainfall accumulation along each hurricane track was collated from National Oceanographic and Atmospheric Administration (2025), providing single maximum rainfall accumulation values, although not allowing differentiation between multiple landfalls with this dataset.
This study considers only landfalling hurricanes, excluding bypassing hurricanes. It is difficult to obtain a comparable measure of hurricane intensity for a bypassing event because its intensity, measured close to the system centre, is over ocean and may therefore be relatively high compared with a directly landfalling event. It is necessary to avoid introducing such an artifact into our statistical model.
2.1.3 Exposure
We took county-level building value information across the U.S. from the National Risk Index (Federal Emergency Management Agency, 2024b), derived from Hazus 6.1 (Federal Emergency Management Agency, 2024a), providing 2022-relative valuations per county based on the 2020 U.S. Census. Building values are time-invariant. Near present-day (2019) building value was quantified using the LitPOP dataset (Eberenz et al., 2020), providing global aggregated building value estimates at a 1 km spatial resolution. Building value estimates vary between the two datasets; hence, we used two building value datasets.
We also used decadal, county-level housing unit density data (U.S. Census Bureau, 2024), available 1950–present, as well as semi-decadal building density estimates from the Global Human Settlement Layer (GHSL), providing built-up surface area data derived from Sentinel-2 composite and Landsat satellite imagery from 1975–present at 1 km spatial resolution (Pesaresi and Politis, 2023). Annual gridded population density data between 2000 and 2020 at 1 km spatial resolution were obtained from WorldPop (2018). For hurricane landfalls outside the temporal coverage of GHSL and WorldPop, we used data for the closest available year. Therefore, a limitation to highlight is that we overestimate population density for pre-2000 events.
2.1.4 Vulnerability
Structural vulnerability – the susceptibility of buildings to damage – is influenced by building age, often used as a proxy for building condition and resilience, and related to changes in building codes (regulated construction standards that include a minimal resistance to extreme weather). We used county-level average building age data (U.S. Census Bureau, 2024) and a county-level indicator of building resistance to extreme weather (Federal Emergency Management Agency, 2025). We also used county-level Hurricane Risk Score and Hurricane Historical Loss Ratio data from Federal Emergency Management Agency (2024b) and Zuzak et al. (2021). Hurricane Risk Score is defined as the average social vulnerability (i.e., extent to which specific social groups are disproportionately susceptible to hurricane impacts) and community resilience (i.e., capacity to prepare for, withstand, and recover from hurricane hazards), and is given as a percentage. Hurricane Historical Loss Ratio is defined as the percentage of a location's exposed value damaged by past hurricanes. We quantified the mean Hurricane Risk Score and Hurricane Historical Loss Ratio across all counties within several hurricane radii (R34, R50 and R64 – see Sect. 2.2). GDP data for each affected U.S. state per year, indicating a state's resilience resources, for the period 1998–2024 (U.S. Bureau of Economic Analysis, 2025) were used, and 1998 GDP values were applied to pre-1998 events.
Hurricane wind vulnerability may also be expressed as a logistic–cubic wind–damage function, relating wind speed to the fractional value of assets lost. This study uses a simple quantification of this (Eqs. 2 and 3), which was deduced by Emanuel (2011).
where f is the fraction of the property value lost and vn is defined as:
where v is maximum wind speed, and vthresh and vhalf are the thresholds at which no asset damage and half asset damage occur, respectively. Building characteristics (e.g., construction type and age) influence vulnerability curves, and Vickery et al. (2006) and Federal Emergency Management Agency (2024a) suggest vhalf values in the range 120–160 kn. In this study, damage estimates were computed for historical hurricanes using this single vulnerability function for all buildings, with vthresh = 40 kn and vhalf = 140 kn. However, weaker systems may be damaging, such as tropical depression Allison (2001), modelling suggests vhalf may be as low as ∼ 50 kn (Federal Emergency Management Agency, 2024a). Multiple vulnerability functions for different building types cannot be applied due to incomplete localised building characteristic data. Instead, asset damage potential was applied to 1-dimensional LitPOP exposure and GHSL building density data within each hurricane footprint to estimate the exposure value and number of buildings damaged. At each timestep, vmax was used with Eqs. (2) and (3) (Emanuel, 2011) and the extracted exposure and building density, allowing vmax to vary with time.
2.2 Methods
2.2.1 Statistical estimation of hurricane size
Hurricane size (i.e., R34, R50 and R64) data are only available in IBTrACS from 2002 onwards. This is a significant constraint for studies of impact, as size information is needed to determine the region impacted by an event – i.e., its footprint. The exposure and vulnerability impact footprints derived in this study require hurricane size estimates. To estimate size prior to 2002 and extend the sample of landfalling hurricanes for this study, we developed a skilful random-forest statistical model to estimate R34, R50 and R64 for each hurricane and at each timestep, based on vmax, RMW, cp and latitude (Fig. 2), with RMW found to be the most influential predictor. When R34 estimates from this model are compared with R34 observations from 2002 onwards, a Spearman's correlation coefficient, ρ, of 0.85 and a mean absolute error (MAE) of 24.5 nm were found (Fig. 2). This evaluation used a leave-one-out approach (i.e., the prediction model was trained on all observations except one, and skill evaluated on the left-out observation) across 3984 timesteps (for which R34, vmax, RMW, cp and latitude within IBTrACS are not missing). There is a slight underestimation of R34 at lower values and slight overestimation at higher values, but the model overall performs well. This statistical modelling is a skilful supplement to missing IBTrACS data (Figs. 2 and S3) and allows storm size estimation back to 1979, which more than doubles our historical hurricane event sample size. Prediction models were also developed to estimate R50 and R64 for historical storms, where observations are available, with evaluation shown in Fig. S3.
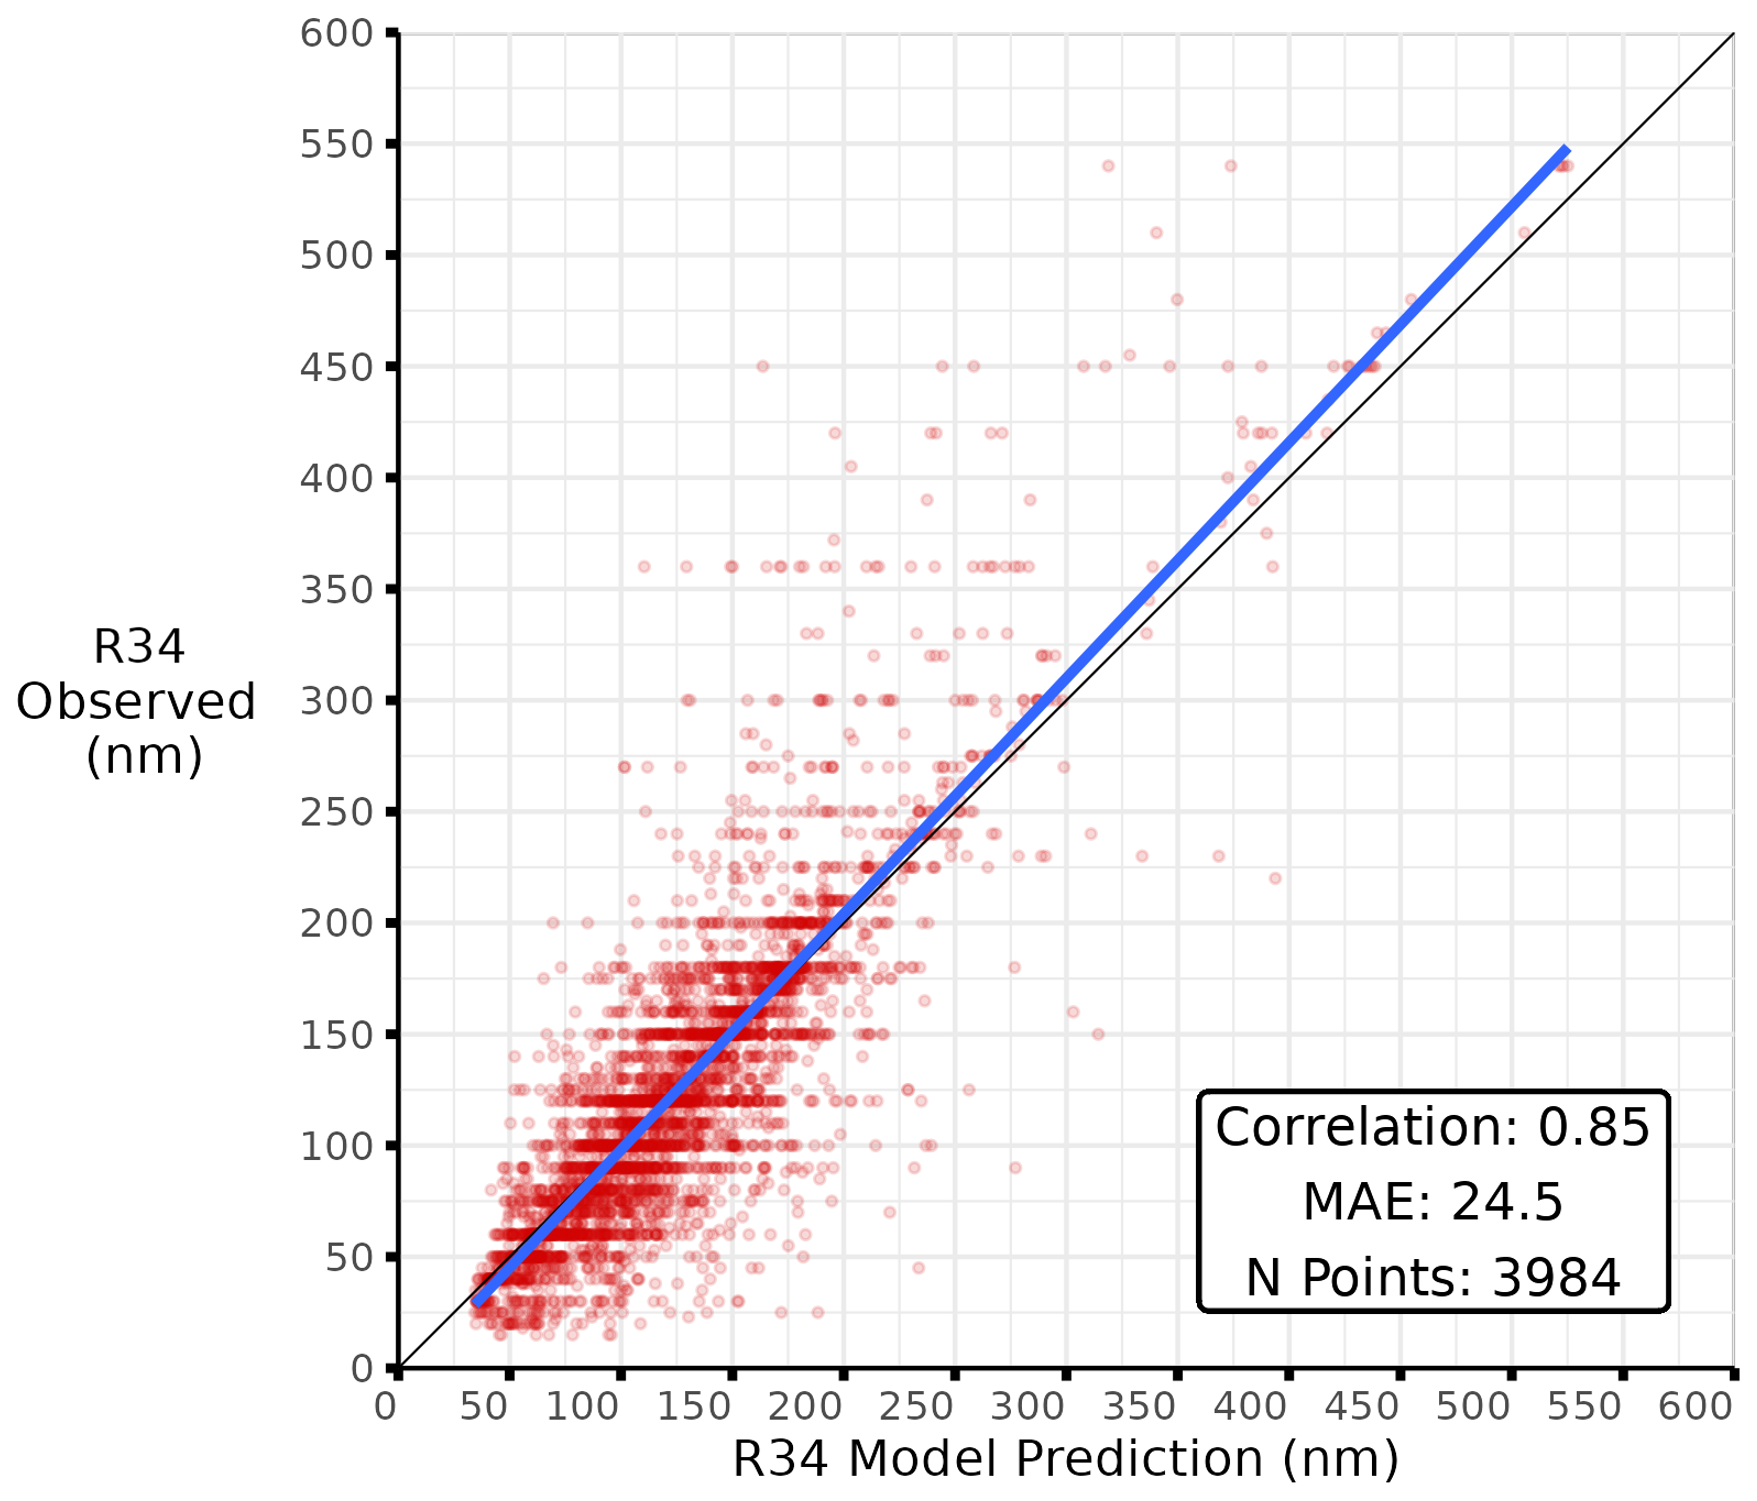
Figure 2Comparison of estimated and observed hurricane R34 (unit is nautical miles, nm) for the period 2002–2023. Our random-forest statistical model uses hurricane vmax, RMW, cp and latitude as R34 predictors.
From 1979 to 2002, however, there are instances where RMW data are missing from IBTrACS (vmax, RMW, cp and latitude are less often missing). So, for these timesteps, we either substituted the missing RMW value from the corresponding value from HURDAT2 or obtained the RMW value from reconstructions of Gori et al. (2023). Reconstructed RMW from Gori et al. (2023) is based on the hurricane wind model of Chavas et al. (2025) and ERA5 data. Of all 3-hourly timesteps where a hurricane is over land between 1979 and 2002 (approximately 10 000 timesteps), approximately 25 % timesteps have a missing RMW estimate from each of these three datasets. In these instances, we replaced the missing value with the RMW from the previous timestep. Although this introduces uncertainty, R34, R50 and R64 estimates from the random-forest model using RMW estimates from previous timesteps are also a function of cp, vmax and latitude, quantities that are much less frequently missing in IBTrACS, and these constrain our R34 statistical model even when using substituted RMW values.
2.2.2 Extracting hurricane-centred exposure and vulnerability footprints
For each hurricane, exposure and vulnerability data were extracted within the R34, R50 and R64 radii at each timestep, and accumulated to create two impact footprints: (i) along the full hurricane track where vmax > 34 kn (Fig. 3) and (ii) from the immediate landfall location (i.e., up to 12 h after landfall). Hurricanes weaken over land, so obtaining two impact footprints captures the immediate landfall, where intensity influences impacts most strongly, and the full hurricane track.
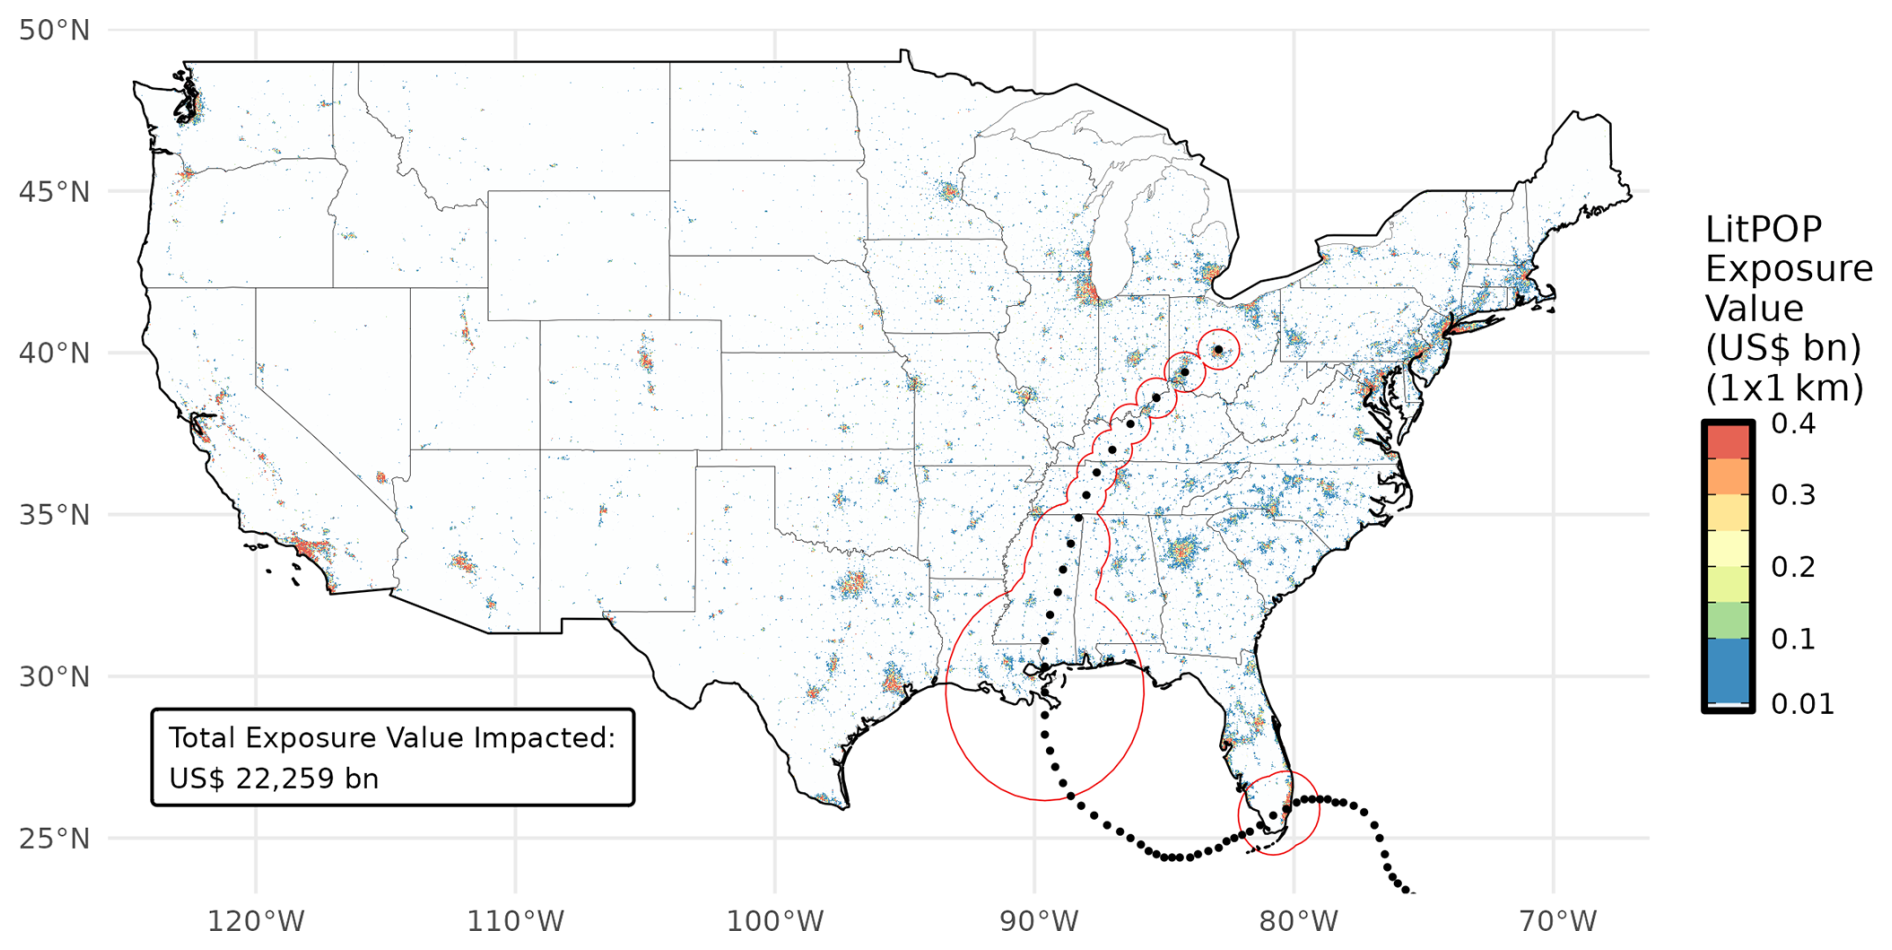
Figure 3Example LitPOP exposure value impact footprint of Hurricane Katrina (2005). Hurricane locations from IBTrACS every three hours are shown as black dots, with the R34 radius around the hurricane centre indicated by the red lines. Harvey made landfall in southern Florida, traversed the Gulf of Mexico, and made a second landfall in Louisiana.
2.2.3 Predictive statistical approaches
We assessed the skill of three independent statistical approaches to predict hurricane loss, each based on the same set of inputs. These are: (i) a weighted combined-rank framework, (ii) a linear-regression framework, and (iii) a random-forest decision-tree framework. Our target predictand is average loss per hurricane, derived from multiple datasets (see Sect. 2.1.1). Overall, 106 hurricanes, for which all risk variables could be quantified (Table 1), were used to train our predictive model. To evaluate the skill of the linear regression and random-forest predictive models, leave-one-out cross-validation was used, where each input case was treated once as the test case and the model trained on the remaining cases. The leave-one-out approach is better suited to evaluating the skill of single predictions than, for example, k-fold cross-validation, where input data are split into training subsets. For the weighted combined-rank framework, which determines the combined loss rank from various hazard, exposure and vulnerability ranks, such validation is inappropriate, as the combined-rank approach does not require training data. Instead, optimal combinations of weights between −10 and 10 were determined for each combination of input variables, to minimise a cost function, which in this case was the model root-mean-square error (RMSE) between predicted and observed hurricane loss rank.
Two approaches were considered for representing input variables: raw values and ranked values. As input variables span disparate ranges (e.g., cp spans 900–1000 hPa; LitPOP exposure spans USD 10 million to 1 trillion), raw values were normalised to the same scale as ranked values 1–n (i.e., 1–106). In this normalisation, each variable was linearly rescaled to assign the maximum value a score of 1 and minimum a score of 106, with intermediate values mapped proportionally between these bounds. Linear and normalised input predictor ranks were derived, with rank 1 corresponding to the costliest event and rank 106 to the least costly. To predict each hurricane's loss, the equivalent predicted loss rank and observed loss rank were identified, with the loss from that observed hurricane being attributed to that predicted loss rank.
We quantified model performance with the Spearman correlation coefficient, ρ, testing the ordering of prediction according to correlation between ranked values (i.e., whether one event is more damaging than another), Pearson correlation coefficients, r, testing non-ranked correlation, and RMSE. Spearman's ρ and RMSE were used as ρ is a good indicator of the capability of accurately predicting loss rank, but not suitable for identifying cases where large differences occur in the loss prediction of a single hurricane.
Hurricane-related losses across the U.S. have generally increased over time and exhibit large interannual variability (Fig. 4). The most destructive year for losses was 2005, with USD 153 billion in un-normalised (and approximately USD 350 billion in normalised) loss. The most damaging event was Hurricane Katrina (Fig. 5), although uncertainty is evident across available loss datasets (Table 1). If Katrina occurred today, loss may be in the range of USD 190–290 billion (Fig. 5). Katrina, however, is one of numerous high-impact hurricanes whose vmax-based Saffir–Simpson category at landfall is at odds with the magnitude of associated loss (Bloemendaal et al., 2021). Katrina was a category-3 landfall, despite causing unprecedented, record-breaking damage (Fig. 5). Other cases whose damage is mismatched with their Saffir–Simpson category include category-1 Hurricane Sandy (2012) and category-2 Hurricane Ike (2008), which each caused substantial losses (Fig. 5). Additionally, Hurricane Harvey (2017) was a category-4 landfall and the second-most damaging hurricane, but its loss is uncertain, with estimates between USD 90–190 billion. The historical record reveals the limitation of an event's Saffir–Simpson category in conveying its loss.
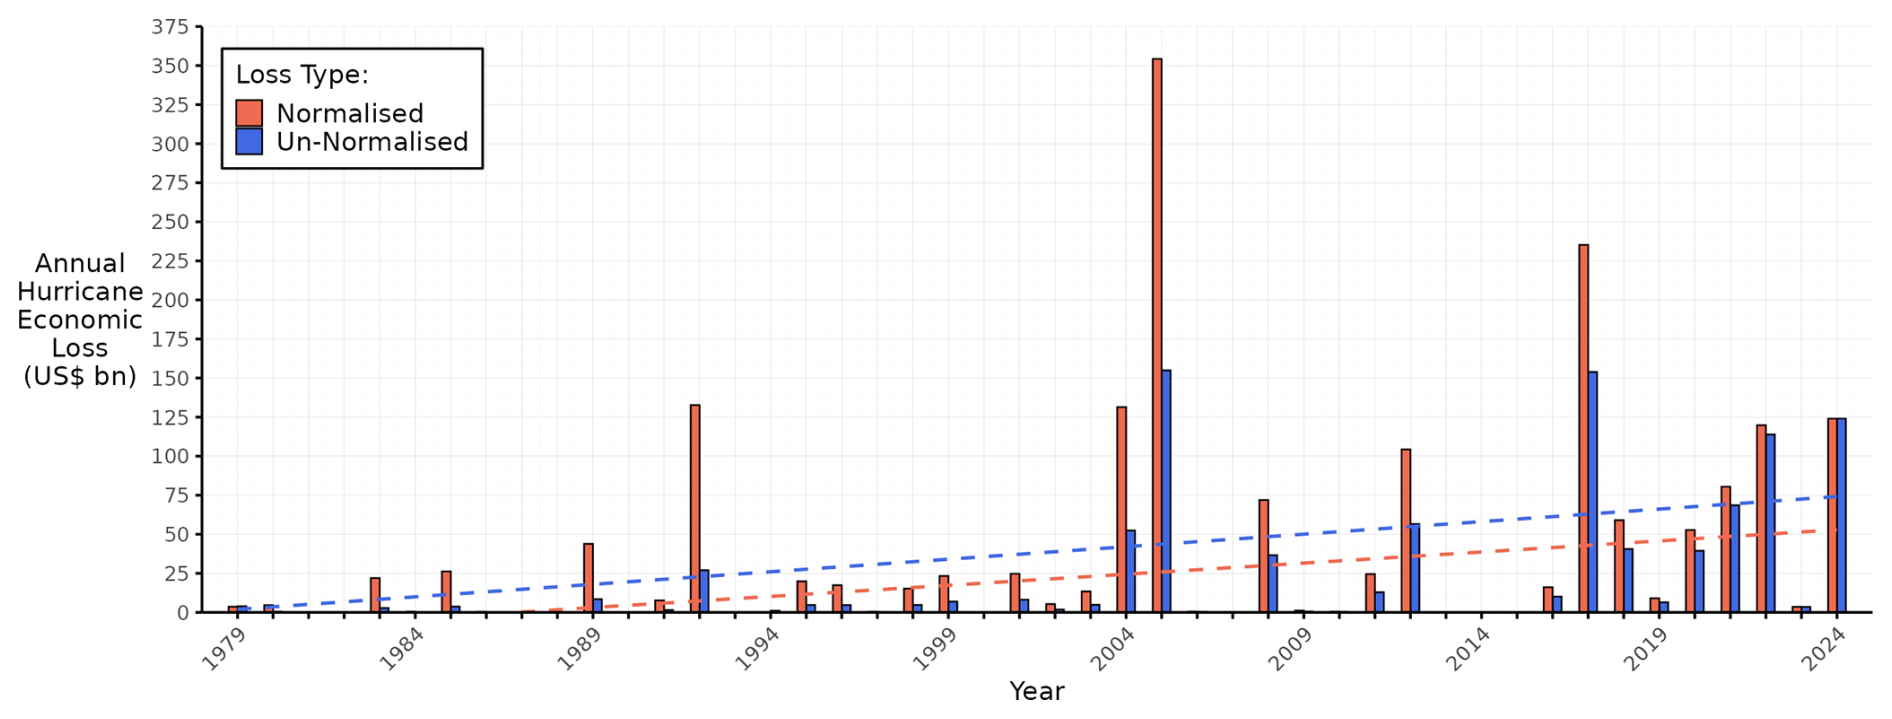
Figure 4Average historical U.S. hurricane-related losses, (red) normalised to 2024 and (blue) un-normalised by inflation, wealth and housing unit density (blue). Dashed lines indicate upward linear trends.
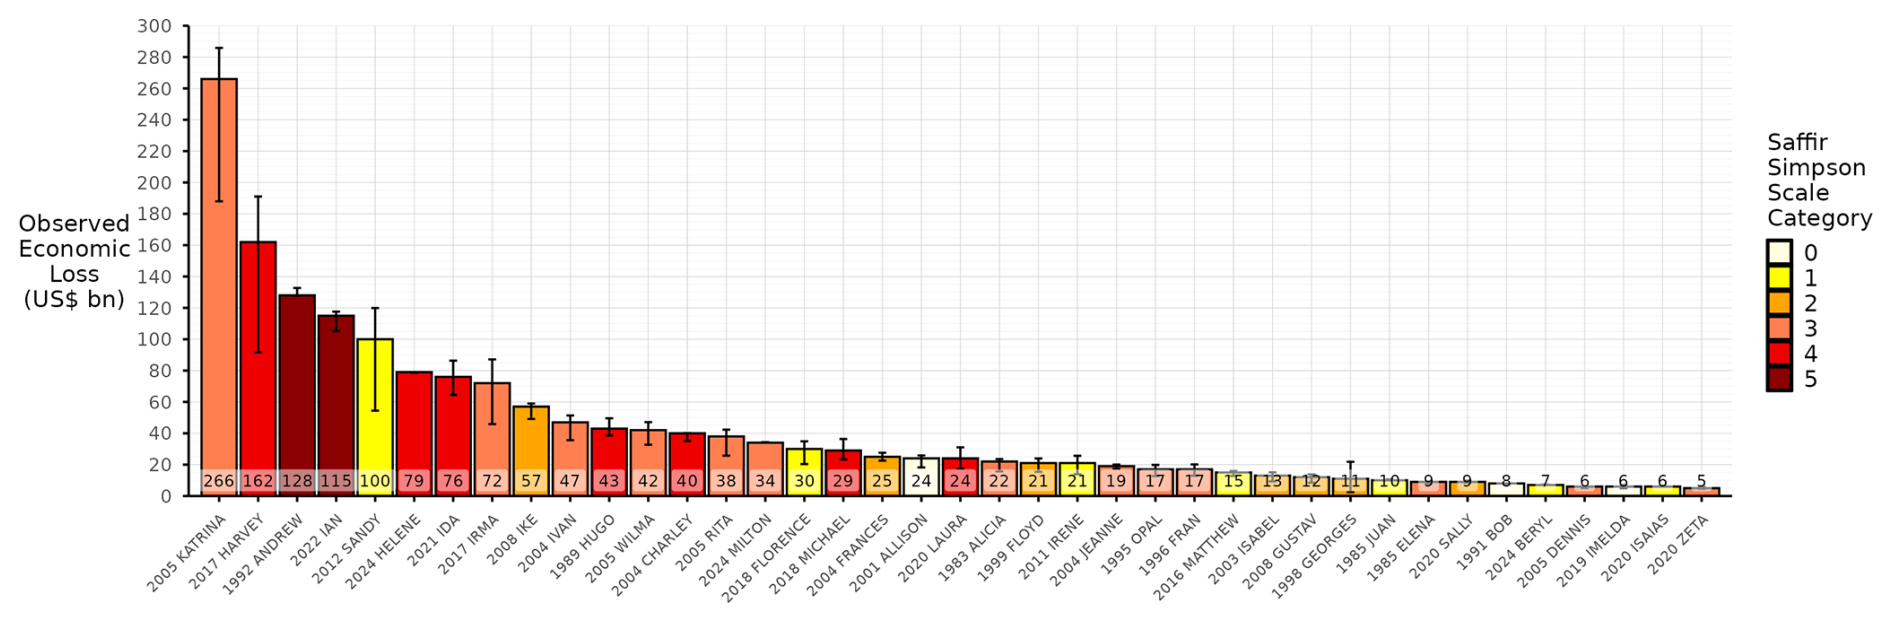
Figure 5Average loss per hurricane, normalised to 2024, for loss events exceeding USD 5 billion. Error bars indicate the range in loss estimates across datasets (Fig. 1 and Table 1) and colour indicates landfall Saffir–Simpson category.
Although loss generally increases with the Saffir–Simpson landfall category and therefore wind speed (Fig. 5), the Saffir–Simpson scale has limited skill in predicting loss (Fig. 6a), with a correlation of ρ = 0.53 across 106 events (RMSE = USD 17.1 billion when using Saffir–Simpson category to predict loss rank and associated loss using a linear model). Using vmax to predict normalised hurricane loss yields a correlation of ρ = 0.52 (RMSE = USD 17.6 billion), which is slightly lower (Fig. 6b) and consistent with Klotzbach et al. (2020). Notably, landfall vmax is significantly less skilful at predicting loss for more extreme storms, with generally higher error at more extreme vmax values (Fig. 6b), which is particularly problematic as an inaccurate forecast for these more intense storms would produce larger errors in loss. The relationship between vmax and loss is potentially nonlinear but spread, and therefore error, in loss generally increases with vmax. Performing a rank correlation between observed loss and loss predicted from vmax reveals significant spread (and heteroscedasticity) across the observed range (Fig. 7a), and this is found for all events as well as those where loss exceeds USD 1 billion (Fig. S4).
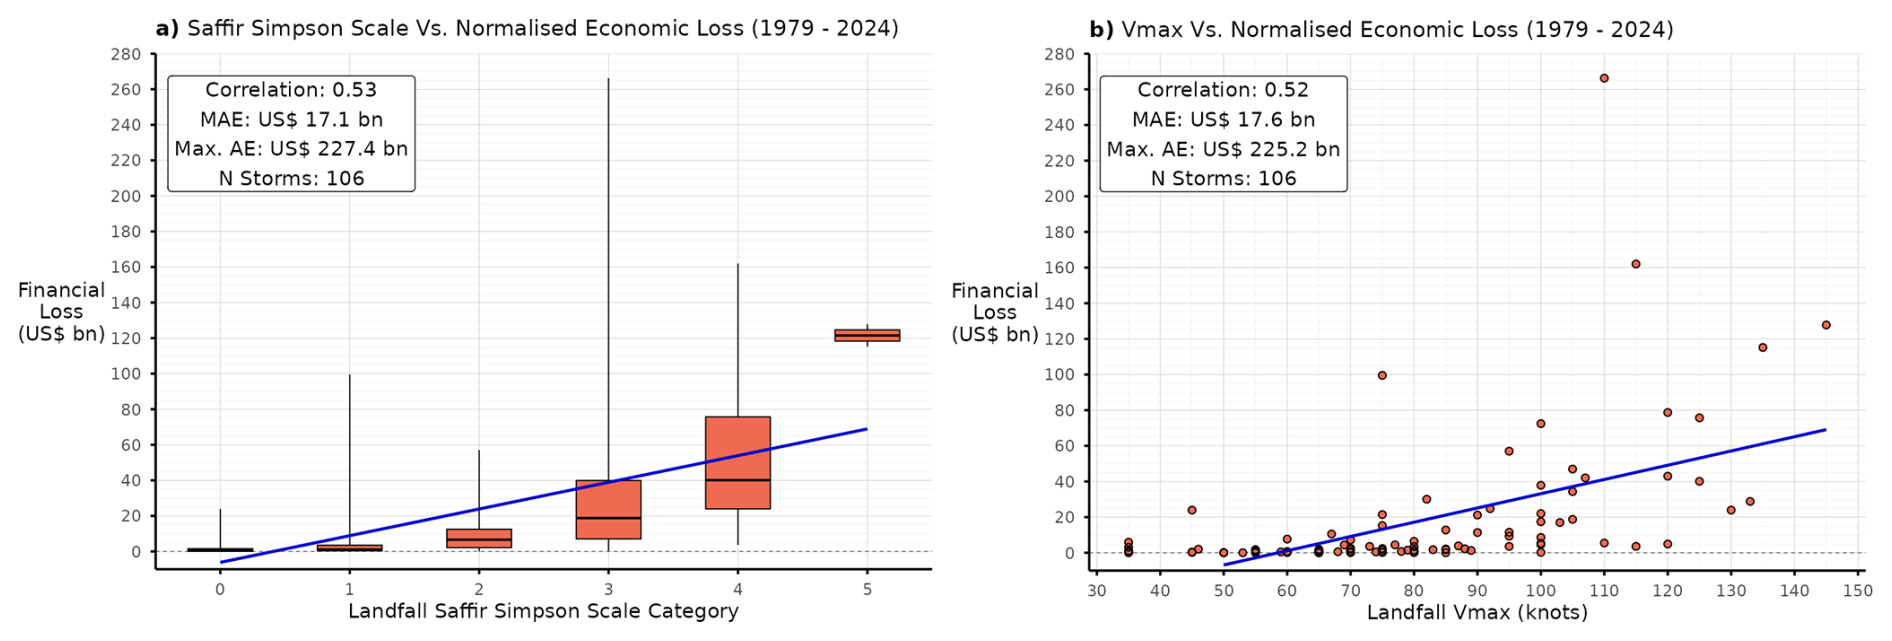
Figure 6Average economic hurricane financial loss (normalised to 2024) versus (a) Saffir–Simpson category and (b) landfall vmax of U.S. landfalls over the period 1979–2023. Blue lines indicate linear fits and an indication of goodness of fit is given in each legend: mean absolute error (MAE), absolute error (AE), and sample size, N.
We next analysed linear correlations between single predictors and historical hurricane loss over the period 1979–2024, using both raw (Fig. 7a) and rank (Fig. 7b) values. This analysis demonstrates that high prediction skill may be obtained across numerous hazard, exposure and vulnerability hurricane quantities, with landfall cp rank yielding the highest correlation (r = −0.78), followed by GHSL building density damage percentage (r = 0.77) and LitPOP exposure value damage percentage (r = 0.74) (Fig. 7a). Overall, using the value rank per storm yields higher correlations than using raw values (Fig. 7c), particularly for exposure predictors, because using ranks normalises to a linear scale, suggesting that landfall attribute ranks may provide more skilful loss predictions. This complements the analysis of Klotzbach et al. (2022b), who showed that landfall cp better correlates with loss rank than vmax or accumulated cyclone energy. Here, we further show that landfall cp outperforms other hazard variables and that landfall exposure and vulnerability variables yield higher correlations with loss rank than landfall vmax.
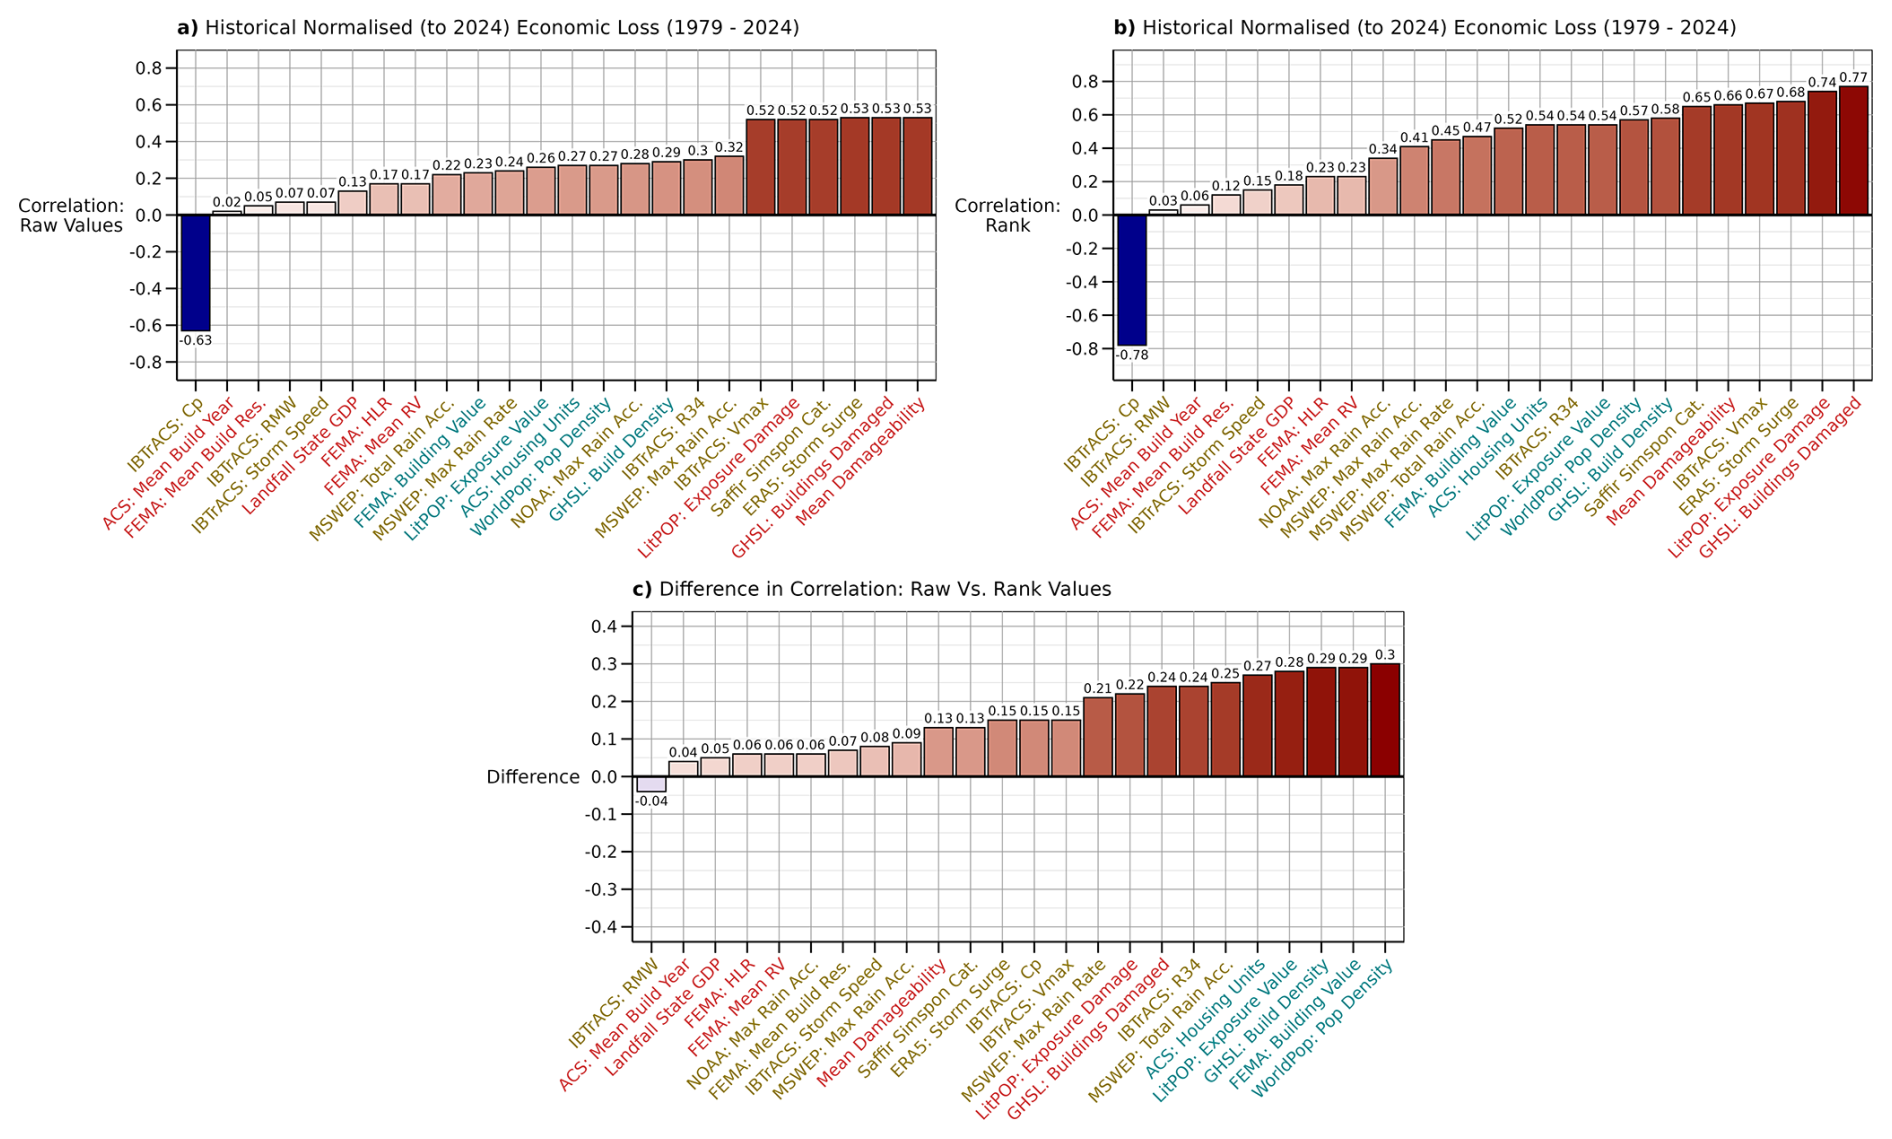
Figure 7Pearson's correlation coefficients between historical hurricane landfall predictors, quantified at landfall and within 12 h of landfall, and averaged loss for the period 1979–2024. Shown are (a) raw values versus loss, (b) predictor rank values versus loss, and (c) the coefficient difference between using raw versus ranked values (i.e., ranked minus raw correlations). Note that the x axes differ between the panels due to correlation ordering. Colours indicate whether the variable is a hazard (yellow), exposure (blue) or vulnerability (red) variable (refer to Fig. 1). Note that cp is inversely related to hurricane intensity and therefore negatively correlated with damage.
In this study, several hazard variables at landfall (vmax, cp, storm tide, R34, translation speed, and RMW) remain unchanged, but variables quantified within a hurricane footprint depend on chosen hurricane size metric (i.e., R34, R50 or R64), and those quantified along-track depend on timeframe (i.e., full track or 12 h post landfall). For landfall variables with significant correlations to loss (i.e., ≥ 0.3), a 12 h post-landfall track yields similar (or somewhat higher) correlation compared with using the full track where winds exceed 34 kn (Fig. S5a). This indicates that including the full track, where winds weaken over land, reduces correlation. (Studies of inland impacts using full-track analysis may need to cope with lower skill than landfall-focussed studies.) A notable exception is the percentage of damaged GHSL building density, which has a strong correlation using the full track (ρ = 0.78 using R34 and ρ = 0.79 using R50). Correlations are generally higher when considering normalised rather than un-normalised loss (Fig. S5b). Additionally, rank correlations are similar when using R34 and R50 to define impact radius, but correlations using R64 are lower (Fig. S5c). R64 is typically less than 100 nm, which may be too small to capture hurricane impacts, especially for lower-resolution data (e.g., county-level housing unit data).
Using landfall vmax rank to predict storm loss, by assigning the loss from the equivalent loss rank, yields ρ = 0.54 and RMSE = USD 35.6 billion (Fig. 8), so vmax has limited skill predicting historical loss. Hurricanes Katrina (2005) and Harvey (2017), which were category-3 and category-4 landfalls, respectively (Fig. 4), are among the most underestimated losses despite being the two most damaging events since 1979 (Fig. 9a). Furthermore, using vmax alone leads to loss predictions exceeding USD 30 billion for several less-damaging (≤ USD 10 billion) events (Fig. 9a), including Michael (2018), Laura (2020), Dennis (2005), Andrew (1992; second landfall) and Idalia (2023). Our analysis (Fig. 7) and recent work (Klotzbach et al., 2020, 2022a) show landfall cp to be the most skilful single hazard predictor for historical loss, and using landfall cp rank to predict loss rank improves this correlation (ρ = 0.78 and RMSE = USD 26.4 billion) (Fig. 8). However, several events, across a range of observed losses, remain poorly predicted: Andrew (1992), Michael (2018), Rita (2005), Hugo (1989), Dennis (2005), Allen (1980) and Idalia (2023) are all overestimated (Fig. 9b). This greater predictive skill of cp over vmax is likely due to the physical pressure–wind balance intrinsic to hurricanes (Chavas et al., 2017), but intensity metrics alone cannot accurately model loss.
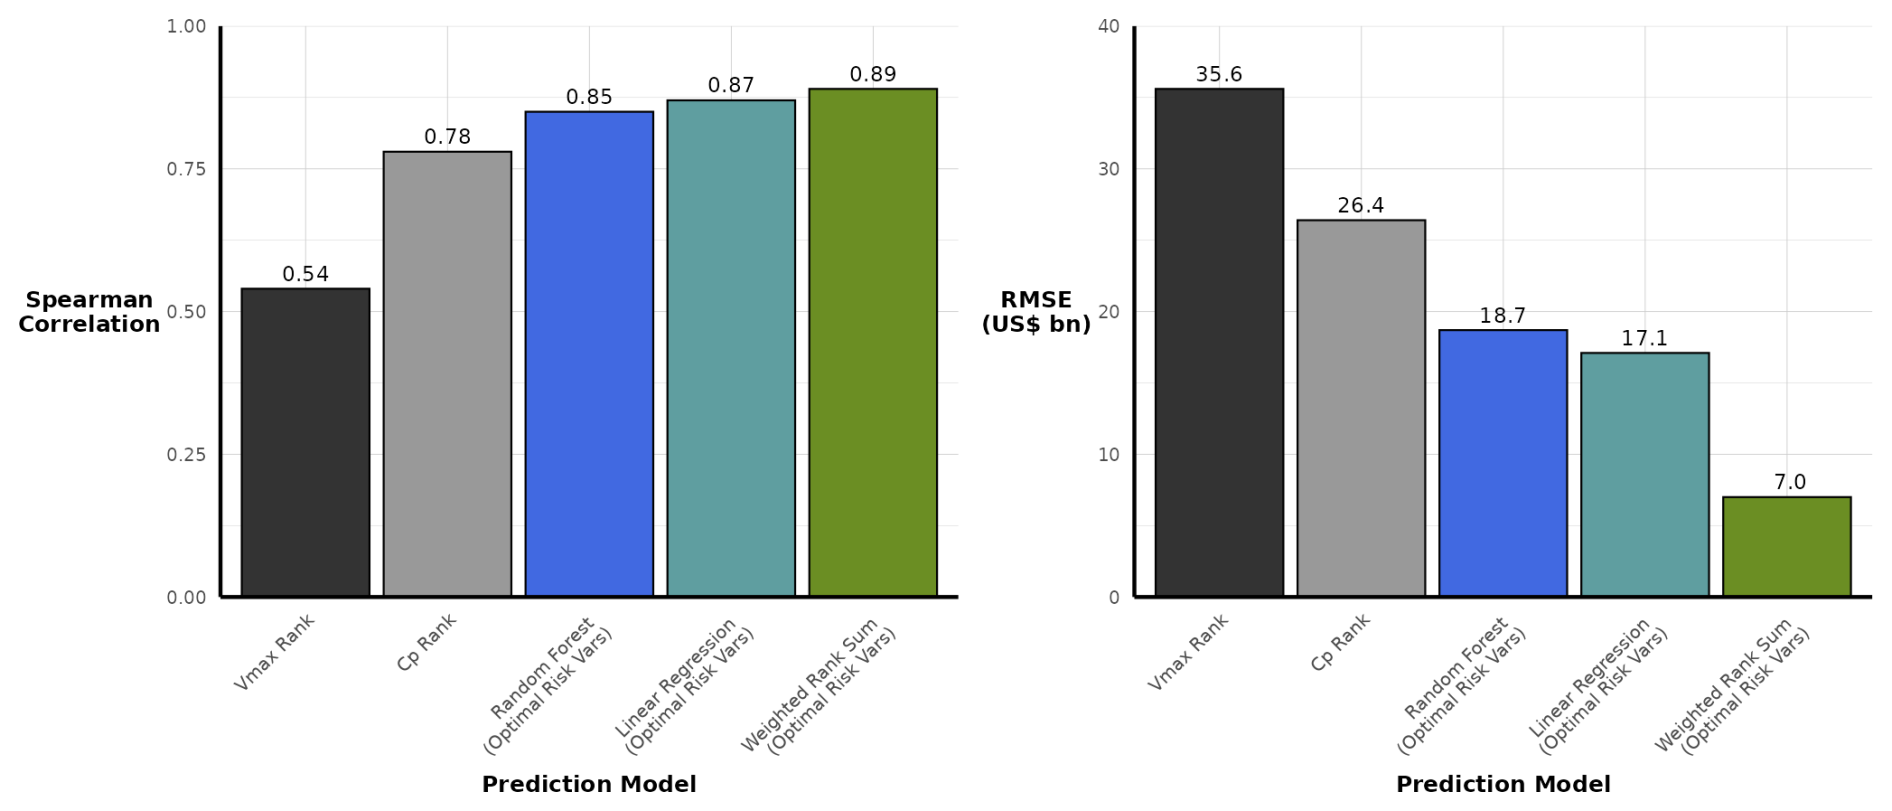
Figure 8The (a) Spearman's correlation coefficient, ρ, and (b) root mean squared error (RMSE) of each tested historical hurricane loss-prediction model.
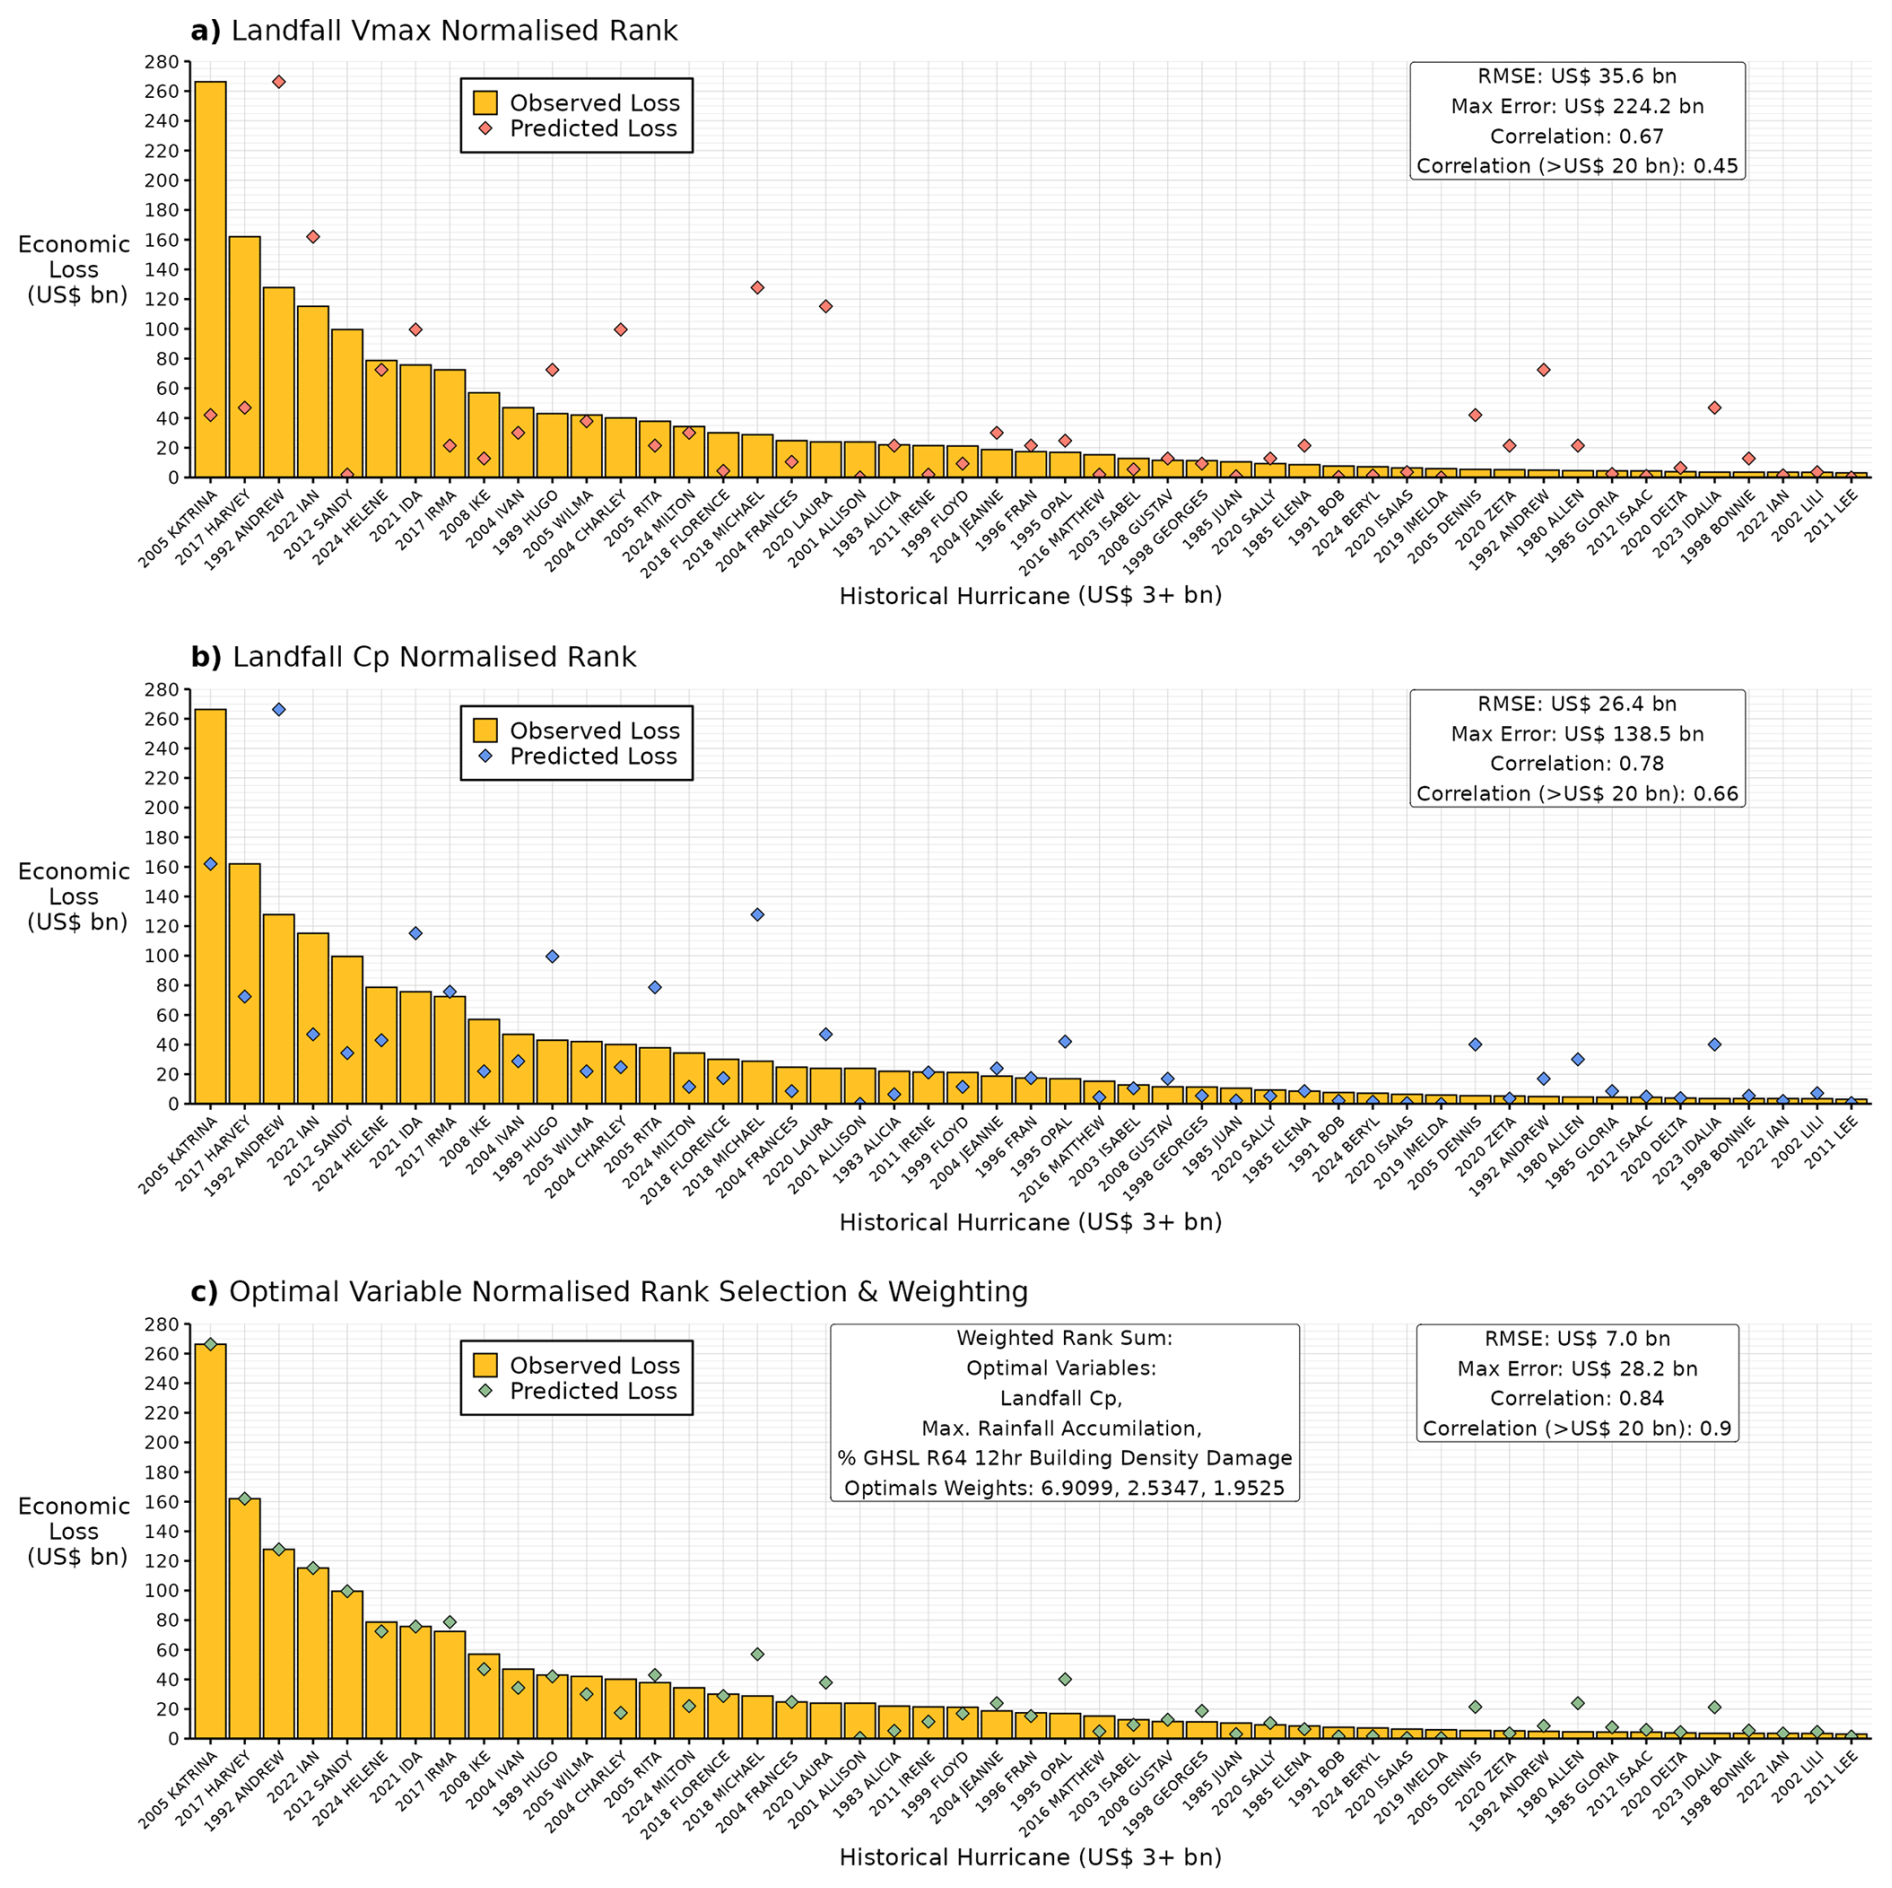
Figure 9Comparisons of landfall predictor rank with loss rank to predict past hurricane loss given past loss observations, using (a) landfall vmax rank, (b) landfall cp rank, and (c) optimally selected and weighted (refer to Fig. 7) hazard, exposure and vulnerability linear rank variables at landfall. Yellow bars indicate observed historical hurricane loss, and the coloured diamonds indicate predicted historical hurricane loss. Note that the optimal risk predictors and their optimal weights are given in panel (c).
We now combine landfall hazard, exposure and vulnerability quantities to derive more skilful models to predict historical hurricane loss, using three statistical approaches: multiple linear repression, random-forest, and weighted combined rank (Fig. 8). Using a random-forest model based on the optimal combination of hazard, exposure and vulnerability predictors is significantly skilful (ρ = 0.85; RMSE = USD 18.7 billion), with a slight improvement obtained from using a linear-regression model (ρ = 0.87: RMSE = USD 17.1 billion) (Fig. 8). Further skill is obtained when using a weighted combined-sum approach (ρ = 0.89; RMSE = USD 7.0 billion), representing a large decrease in RMSE when compared to using cp and vmax (Fig. 8). Overall, effectively combining hazard, exposure and vulnerability predictors is found to significantly reduce RMSE by 67 % compared with using landfall vmax rank alone, and by 55 % when using landfall cp rank alone (Fig. 8).
This optimal model uses the combined normalised ranks of landfall cp, maximum rainfall accumulation, and the percentage of total GHSL building density loss within R64 of the hurricane centre and within 12 h of landfall (Figs. 8; 9c). This model includes two hazard quantities representing hurricane wind and inland flooding intensity (cp and rainfall), with hurricane radius implicitly included in the percentage of total GHSL building density damage (with storms with larger R64 having higher impacted building density values). This also includes exposure values of impacted building density and applies a vulnerability function, by determining the percentage of damaged buildings proportional to vmax (at each timestep). The inclusion of building density within R64 indicates some prediction skill from capturing the inner region of a hurricane, where wind-induced damage to buildings may be highest, but only in combination with other factors. Overall, this model demonstrates the extent to which loss prediction skill can be improved when accounting for hazard, exposure and vulnerability.
Across our sample of 106 historical hurricanes, this prediction model has the lowest RMSE (USD 7.0 billion) when hazard, exposure and vulnerability predictors are ranked and summed, while also applying optimal weights (Fig. 8c). Moreover, for highly damaging historical hurricanes (≥ USD 20 billion), ρ = 0.9, which is significantly higher than using only landfall vmax (ρ = 0.45) or cp (ρ = 0.66) (Fig. 9). Our optimal model results in the five most-damaging hurricanes (Katrina, Harvey, Andrew, Ian, and Sandy) being ordered according to observed losses and thus well captured, and higher-loss events (≥ USD 20–80 billion) overall are skilfully predicted. However, some discrepancies remain. The largest errors include hurricanes Michael (2018), Opal (1995) and Allen (1980), all of which have a high landfall cp rank (i.e., high intensity) but relatively low loss. Overall, this model is markedly more skilful than using intensity metrics (landfall vmax and cp) to predict historical losses (Figs. 8 and 9).
The Saffir–Simpson scale is an effective communication tool and a key component of early-warning dissemination (Camelo and Mayo, 2021; Oliver-Smith, 2020; Wehner and Kossin, 2024), but, being based on vmax alone, does not correspond adequately with historical loss ranking (Figs. 4, 5). Based on our analyses, we devised a loss-based hurricane categorisation, termed the “Hurricane Predictive Loss Scale” (HPLS). We intend this scale to complement the Saffir–Simpson scale, as well as published work (Bloemendaal et al., 2021; Pilkington and Mahmoud, 2016), and be a classification scheme that may be used by stakeholders, particularly (re-)insurance, to predict loss.
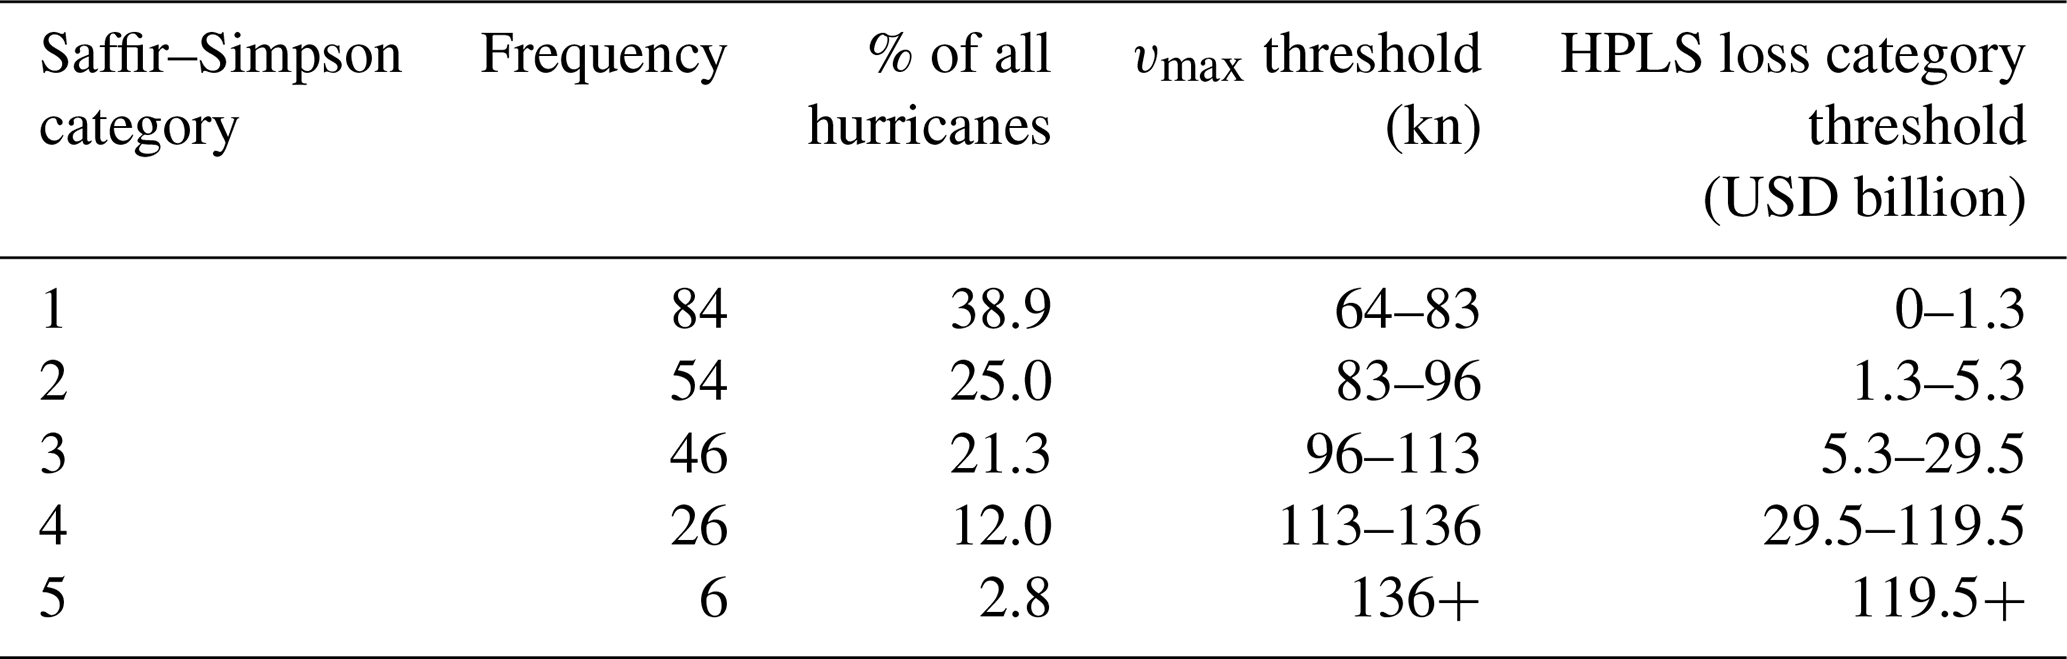
Since 1900, 39 % of landfalling hurricanes have been category 1, with 12 % and 3 % being category 4 and 5, respectively (Table S2). We applied the observed relative proportions in each Saffir–Simpson category to averaged historical loss data since 1979 (Table 1) to derive historical loss categories (Table 2) for the HPLS. As examples, a hurricane with loss less than USD 1.3 billion is a “loss category 1” event and an event causing loss greater than USD 119.5 billion is a “loss category 5” event.
Table 2Percentage of landfalling historical storms within each Saffir–Simpson category since 1900 (Hurricane Research Division, 2025). Loss category thresholds used to define the proposed HPLS.
Using our skilful hurricane loss-prediction model, we determined the HPLS loss category derived from the predicted losses for each historical hurricane (Figs. 9c and 10). The ranks of the most damaging hurricanes (Katrina, Harvey, and Andrew) are correctly predicted as being “loss category 5”, and the next most damaging storms (Ian to Wilma) are “loss category 4” events, with losses between USD 115–42 billion (Fig. 10). Hurricane Sandy (2012), which is under-categorised by the Saffir–Simpson scale (category 1) and the “Tropical Cyclone Severity Scale” (Bloemendaal et al., 2021) (category 2), is a “loss category 4” event in our scheme. Combining hazard, exposure and vulnerability quantities and loss-based categorisation is more skilful for many cases than is possible based only on hazard information.
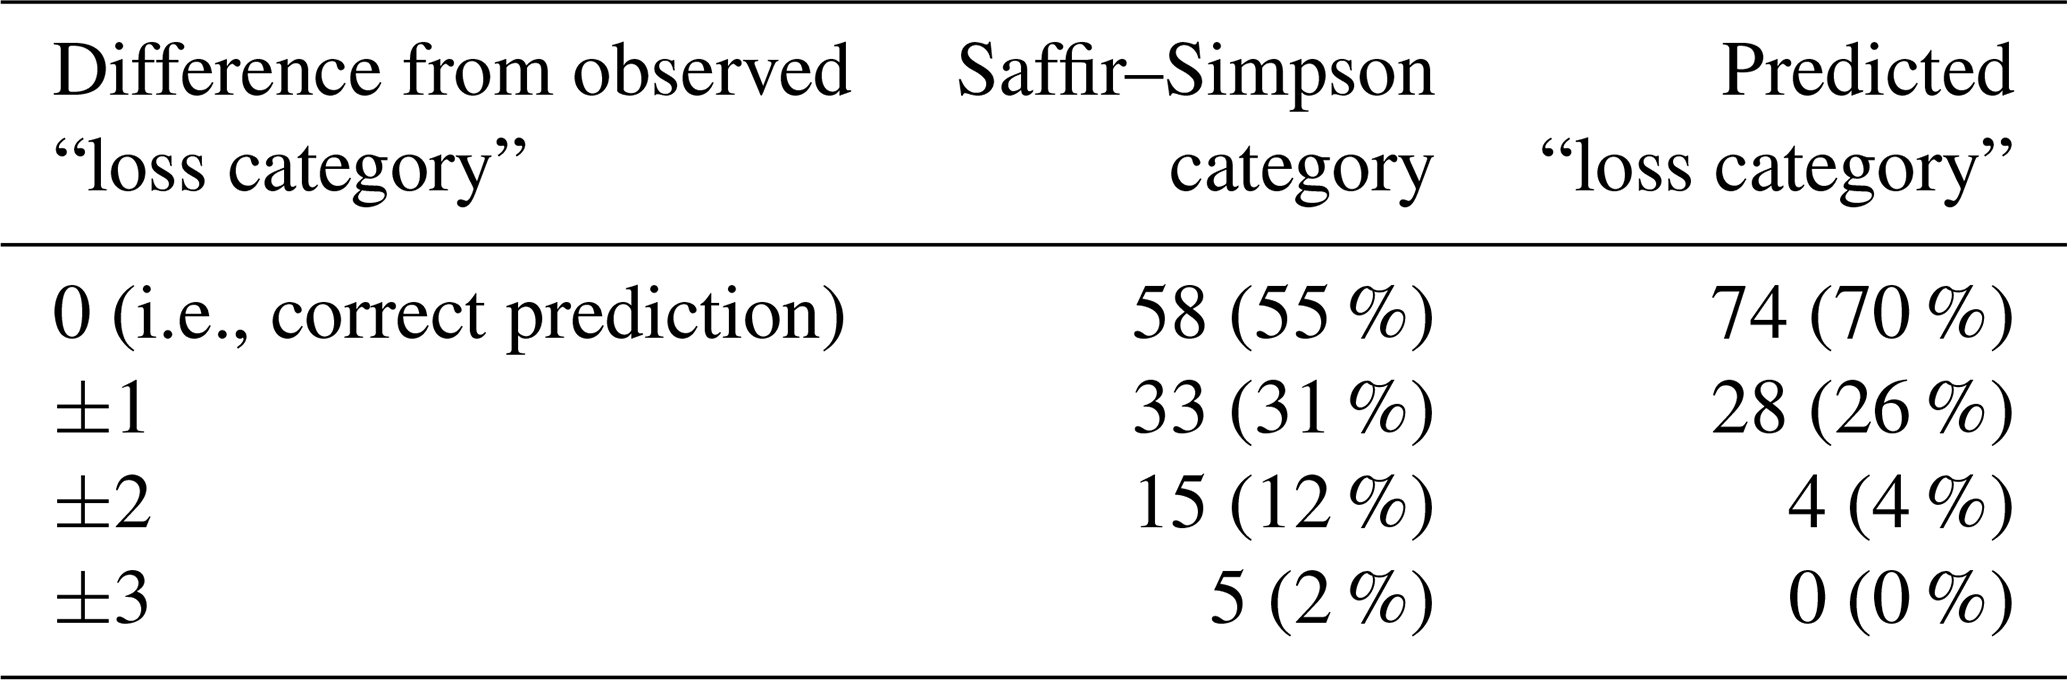
The most damaging hurricane that is misrepresented by the HPLS scheme is Hurricane Charley (2004), whose observed loss (USD 40.1 billion) is underpredicted by our model (Fig. 10). Charley should be “loss category 4” (Fig. 4 and Table 2), but its predicted loss (∼ USD 20 billion) falls in “loss category 3”. Additionally, tropical storm Allison (2001) is assigned to “loss category 1”, which stands out as a poor model prediction (Fig. 10). Overall, we found 74 events (70 %) are correctly classified by the HPLS (Table 3). However, 28 events (26 %) are misrepresented by ±1 “loss category” and 4 (4 %) are misrepresented by ±2 “loss categories” (Table 3). By comparison, Saffir–Simpson categories represent just over half (55 %) of events correctly, and 31 %, 12 % and 2 % are misrepresented by ±1, ±2 and ±3 “loss categories”, respectively (Table 3).
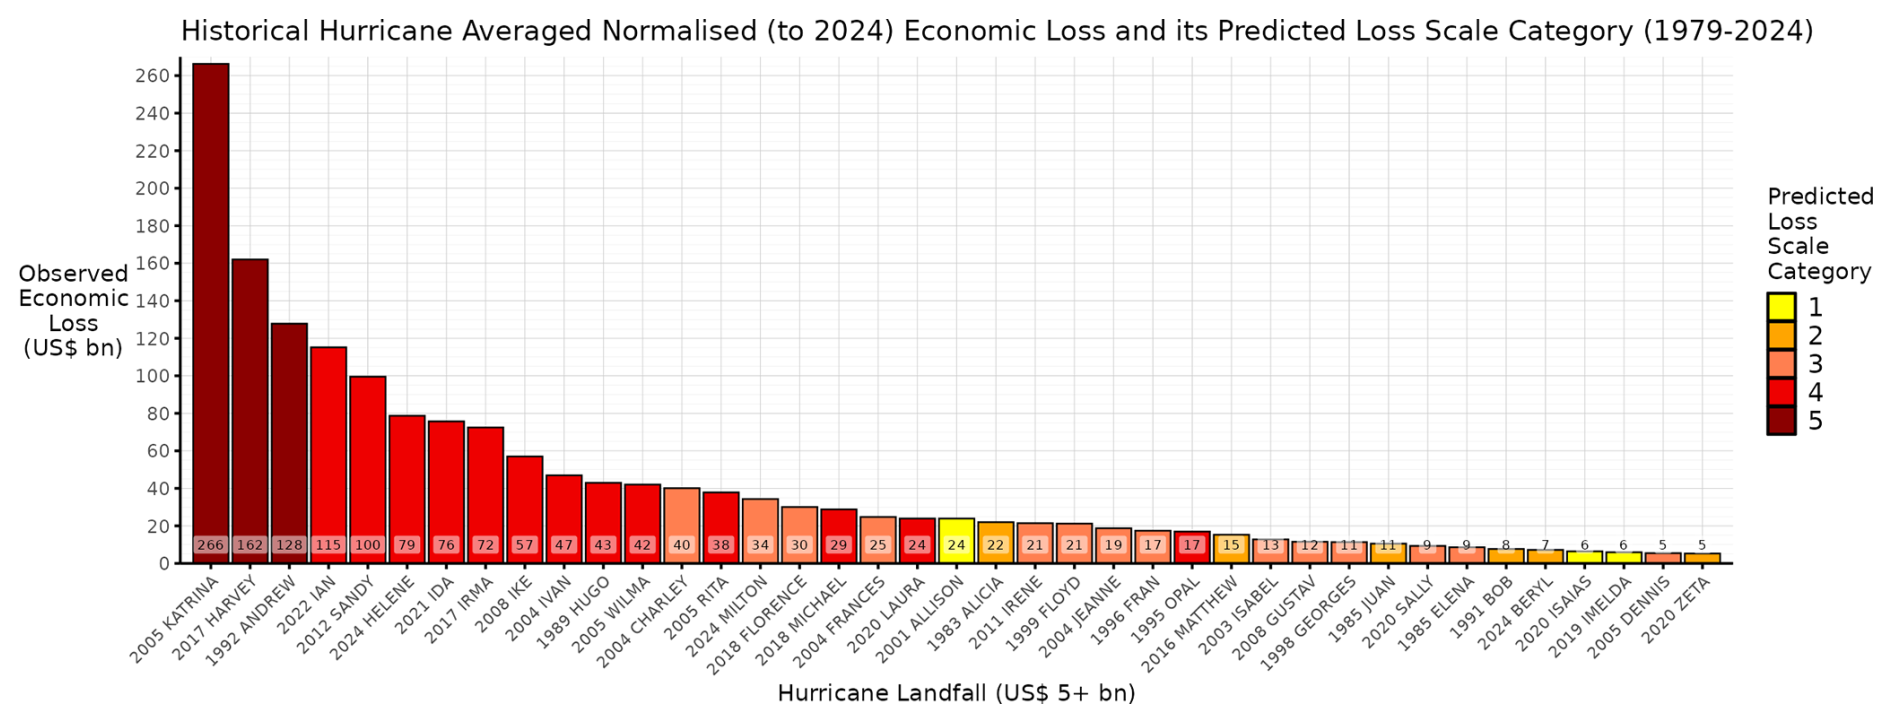
Figure 10Predicted “loss category” of each historical landfalling hurricane, using the optimal prediction model (Fig. 9c) and the HPLS (Table 2).
Table 3Quantified differences between Saffir–Simpson category or predicted “loss category” using our model (Fig. 9c) and the observed “loss category” from the HPLS (i.e., derived from observed loss).
This study explored statistical relationships between historical U.S. hurricane-related losses and quantities describing hazard, exposure and vulnerability, and makes two contributions. First, we determined whether the inclusion of socioeconomic information into a predictive model for loss from U.S. landfalls yields significant additional skill compared with using only hazard information. For historical hurricanes, we derived storm-centred hazard, exposure and vulnerability quantities, and limited our analysis to cases for which observed loss estimates are available and hurricane radius is either observed or could be skilfully estimated statistically from other observed size information. Second, we devised a loss-based hurricane classification scheme to allow rapid, skilful assessment of the loss potential of forecast events, which is intended for use by stakeholders in hurricane risk, including governmental agencies and the (re-)insurance sector, and complements existing classification schemes.
7.1 Key results and limitations
7.1.1 Integrated hazard, exposure, and vulnerability data predict historical hurricane losses more skilfully than hazard data alone
Although historical losses generally increase with landfall wind speed (and Saffir–Simpson category), hazard information alone has insufficient skill in predicting historical losses, with a large RMSE across all events, a finding which substantiates previous research (Klotzbach et al., 2020, 2022a). We find various hurricane-centred hazard, exposure and vulnerability quantities correlate significantly with losses (i.e., r > 0.5), but using a weighted-rank-sum approach to optimally combine these predictors yields markedly more skilful loss predictions (ρ = 0.89 for all storms). This high correlation between loss observations and predictions, with a significantly reduced RMSE of USD 7.0 billion, improves the predicted loss rank of the most impactful historical cases. This optimal prediction model was derived by determining the weighted sum of normalised ranks of landfall cp, maximum rainfall accumulation, and the percentage of total GHSL building density damage within R64 and within 12 h of landfall. This model includes two hazard attributes representing hurricane intensity (cp and rainfall), building density impacted, and applies a vulnerability function (percentage of building damage proportional to vmax). For this model, important limitations are related to the observational uncertainties within the input predictor data, as well as in the target variable. There is significant variance among loss estimates for historical events. Additional uncertainty stems from the lack of complete cyclone size information prior to 2002, which is not completely mitigated by our statistical estimation approach and could impact skill for pre-2002 landfalls. A key data gap is the availability of vulnerability information and its temporal granularity. Lastly, historical loss uncertainty necessitated consideration of multiple datasets and averaging losses where required.
Studies based on physical climate model outputs provide evidence of significant interannual to decadal variability in damage (Lavender et al., 2022) and substantial inter-model uncertainty (Meiler et al., 2023). Projected increases in vulnerable assets, assuming no adaptation, may worsen damage to a greater extent than physical hazard changes (Gettelman et al., 2018). Regional vulnerability, particularly building characteristics, is important, and regional factors are accounted for in high-resolution catastrophe models (e.g., Eberenz et al., 2021) and synthetic tropical cyclone models (e.g., Meiler et al., 2022), although results exhibit sensitivity to model setup (Meiler et al., 2025). Open-source catastrophe models may underestimate historical losses (König, 2017; Welker et al., 2021), so a comprehensive intercomparison of such models across historical hurricanes is warranted. While our statistical model may not predict hurricane losses events outside our sample (i.e., loss significantly exceeding that of Hurricane Katrina), it ranks losses in historical context and complements other catastrophe modelling approaches.
7.1.2 A loss-based hurricane scale effectively communicates economic impacts
We devised a “Hurricane Predictive Loss Scale” in which hurricanes are assigned a “loss category”. This characterises hurricanes according to economic losses, complementing the Saffir–Simpson scale and prior work (Bloemendaal et al., 2021; Pilkington and Mahmoud, 2016). Our model-predicted “loss categories” matched observed categories (determined from loss data) in 70 % of cases, comparing favourably with the Saffir–Simpson scale. An illustrative example is Hurricane Sandy (2012), a lower-intensity, larger-size storm that is assigned “loss category 4”, a more appropriate characterisation of the actual loss. The HPLS offers a simple method to embed information about potential losses for forecast landfalls to support decision-making. In (re-)insurance, pooling risk across a diversified portfolio reduces capital costs and increases loss predictability (Ciullo et al., 2023). For hurricanes, however, recent basin-wide (Klotzbach et al., 2022b) and near-coast (Qi et al., 2025; Wang and Toumi, 2021; Zhong et al., 2026) trends in hazards will increasingly challenge risk stakeholders. We therefore anticipate that our scheme will be a useful risk-management tool.
7.2 Outlook
Our study highlights clear data needs. First, vulnerability data of higher spatial and temporal granularity are needed. Using open-source datasets here necessitated a combination of time-varying and time-invariant predictors, which is an area for improvement. The development of such datasets using emerging technologies offers potential – for example, combining machine learning and satellite imagery to describe building attributes and structural vulnerability, and their changes, with higher fidelity. Vulnerability may be economic or social and characterised by economic or demographic data, respectively (Wilson et al., 2022). Second, there is a need for hurricane size information for historical events. This key physical quantity directly determines impacted areas (Wang and Toumi, 2016), and future work to develop reconstructions of wind radii (e.g., Xu et al., 2024) would be considerably beneficial. It is somewhat unclear how climate change may impact the horizontal structure of a hurricane's wind field. Expansion rates increase with sea-surface warming (Wang et al., 2025), supported by observed size trends (Balaguru et al., 2026). Climate models, however, do not project changes outer size over this century (Schenkel et al., 2023), although studies of high-resolution climate models, which adequately capture intensification and horizontal structure (Baker et al., 2024), are needed to help substantiate such projections and evaluate their risk implications.
There is potential to refine our approach for application to a variety of sectors and stakeholders (Beven et al., 2018). We developed a loss-based classification, but different schemes could be developed for specific sectors. For example, governments, disaster-relief organisations and public-health services may employ classification based on expected fatalities, requiring an understanding of human factors, such as risk perception (Wong-Parodi and Garfin, 2022) and the ability of communities to respond to warnings (Black et al., 2013). Predictions of human impacts could be made following our statistical framework, given adequate historical mortality-burden data for model training. Additionally, our methodology may be applied to other cyclone-prone regions, where necessary data are available. Finally, our predictive model may help quantify risk changes in a warming climate by its application to simulated future cyclones, which may be more intense and induce heavier precipitation (Knutson et al., 2020), to quantify how losses may respond to hazard changes and the expected losses due to unprecedented landfalls in regions of significant exposure or vulnerability.
IBTrACS data are available from ncei.noaa.gov/products/international-best-track-archive. All other datasets are available from the cited sources. Data analysis and visualisation code is available at https://doi.org/10.5281/zenodo.20050811 (Baker, 2026).
The supplement related to this article is available online at https://doi.org/10.5194/nhess-26-2133-2026-supplement.
AFV and AJB conceived the study. AFV performed data analysis and figure preparation, with contributions from AJB, VMH and JM. AFV and AJB wrote the manuscript. All authors interpreted results and approved the final draft.
The contact author has declared that none of the authors has any competing interests.
Publisher's note: Copernicus Publications remains neutral with regard to jurisdictional claims made in the text, published maps, institutional affiliations, or any other geographical representation in this paper. The authors bear the ultimate responsibility for providing appropriate place names. Views expressed in the text are those of the authors and do not necessarily reflect the views of the publisher.
AJB is supported by the National Centre for Atmospheric Science and by the nextGEMS (European Union Horizon2020 grant agreement 101003470) and Huracán (NERC–NSF grant agreement NE/W009587/1) projects. Data analysis in this study was facilitated by JASMIN (https://www.jasmin.ac.uk/, last access: 18 May 2025), which is operated by the Science and Technology Facilities Council on behalf of the Natural Environment Research Council.
This paper was edited by Gregor C. Leckebusch and reviewed by David N. Bresch and two anonymous referees.
Aon: 2025 Climate and Catastrophe Insight, https://www.aon.com/en/insights/reports/climate-and-catastrophe-report (last access: 18 May 2025), 2025.
Aznar-Siguan, G. and Bresch, D. N.: CLIMADA v1: a global weather and climate risk assessment platform, Geosci. Model Dev., 12, 3085–3097, https://doi.org/10.5194/gmd-12-3085-2019, 2019.
Baker, A. J.: ncas-metoffice-hrcm/hurricane_loss, Zenodo [code], https://doi.org/10.5281/zenodo.20050811, 2026.
Baker, A. J., Vannière, B., and Vidale, P. L.: On the Realism of Tropical Cyclone Intensification in Global Storm-Resolving Climate Models, Geophys. Res. Lett., 51, e2024GL109841, https://doi.org/10.1029/2024GL109841, 2024.
Balaguru, K., Chang, C.-C., Leung, L. R., Ullrich, P. A., Han, Y., Rice, J. R., Hagos, S., Chavas, D., Taraphdar, S., Harrop, B., Sun, N., and Judi, D. R.: Recent Tropical Cyclone Outer Size Increases in the Western North Atlantic, Earth's Future, 14, e2025EF007162, https://doi.org/10.1029/2025EF007162, 2026.
Baldwin, J. W., Lee, C.-Y., Walsh, B. J., Camargo, S. J., and Sobel, A. H.: Vulnerability in a Tropical Cyclone Risk Model: Philippines Case Study, Weather Clim. Soc., 15, 503–523, https://doi.org/10.1175/WCAS-D-22-0049.1, 2023.
Beck, H. E., Wood, E. F., Pan, M., Fisher, C. K., Miralles, D. G., van Dijk, A. I. J. M., McVicar, T. R., and Adler, R. F.: MSWEP V2 Global 3-Hourly 0.1° Precipitation: Methodology and Quantitative Assessment, B. Am. Meteorol. Soc., 100, 473–500, https://doi.org/10.1175/BAMS-D-17-0138.1, 2019.
Beven, K. J., Almeida, S., Aspinall, W. P., Bates, P. D., Blazkova, S., Borgomeo, E., Freer, J., Goda, K., Hall, J. W., Phillips, J. C., Simpson, M., Smith, P. J., Stephenson, D. B., Wagener, T., Watson, M., and Wilkins, K. L.: Epistemic uncertainties and natural hazard risk assessment – Part 1: A review of different natural hazard areas, Nat. Hazards Earth Syst. Sci., 18, 2741–2768, https://doi.org/10.5194/nhess-18-2741-2018, 2018.
Black, R., Arnell, N. W., Adger, W. N., Thomas, D., and Geddes, A.: Migration, immobility and displacement outcomes following extreme events, Environ. Sci. Policy, 27, S32–S43, https://doi.org/10.1016/j.envsci.2012.09.001, 2013.
Bloemendaal, N., de Moel, H., Mol, J. M., Bosma, P. R. M., Polen, A. N., and Collins, J. M.: Adequately reflecting the severity of tropical cyclones using the new Tropical Cyclone Severity Scale, Environ. Res. Lett., 16, 014048, https://doi.org/10.1088/1748-9326/abd131, 2021.
Camelo, J. and Mayo, T.: The lasting impacts of the Saffir-Simpson Hurricane Wind Scale on storm surge risk communication: The need for multidisciplinary research in addressing a multidisciplinary challenge, Weather and Climate Extremes, 33, 100335, https://doi.org/10.1016/j.wace.2021.100335, 2021.
Cass, E., Shao, W., Hao, F., Moradkhani, H., and Yeates, E.: Identifying trends in interpretation and responses to hurricane and climate change communication tools, Int. J. Disast. Risk Re., 93, 103752, https://doi.org/10.1016/j.ijdrr.2023.103752, 2023.
Chavas, D. R., Knaff, J. A., and Klotzbach, P.: A Simple Model for Predicting Tropical Cyclone Minimum Central Pressure from Intensity and Size, Weather Forecast., 40, 333–346, https://doi.org/10.1175/WAF-D-24-0031.1, 2025.
Chavas, D. R., Reed, K. A., and Knaff, J. A.: Physical understanding of the tropical cyclone wind-pressure relationship, Nat. Commun., 8, 1360, https://doi.org/10.1038/s41467-017-01546-9, 2017.
Ciullo, A., Strobl, E., Meiler, S., Martius, O., and Bresch, D. N.: Increasing countries' financial resilience through global catastrophe risk pooling, Nat. Commun., 14, 922, https://doi.org/10.1038/s41467-023-36539-4, 2023.
Copernicus Climate Change Service: Global sea level change time series from 1950 to 2050 derived from reanalysis and high resolution CMIP6 climate projections, Copernicus Climate Change Service (C3S) Climate Data Store (CDS) [data set], https://doi.org/10.24381/cds.a6d42d60, 2022.
Delforge, D., Wathelet, V., Below, R., Sofia, C. L., Tonnelier, M., van Loenhout, J. A. F., and Speybroeck, N.: EM-DAT: the Emergency Events Database, Int. J. Disast. Risk Re., 124, 105509, https://doi.org/10.1016/j.ijdrr.2025.105509, 2025.
Eberenz, S., Lüthi, S., and Bresch, D. N.: Regional tropical cyclone impact functions for globally consistent risk assessments, Nat. Hazards Earth Syst. Sci., 21, 393–415, https://doi.org/10.5194/nhess-21-393-2021, 2021.
Eberenz, S., Stocker, D., Röösli, T., and Bresch, D. N.: Asset exposure data for global physical risk assessment, Earth Syst. Sci. Data, 12, 817–833, https://doi.org/10.5194/essd-12-817-2020, 2020.
Emanuel, K.: Global Warming Effects on U.S. Hurricane Damage, Weather Clim. Soc., 3, 261–268, https://doi.org/10.1175/WCAS-D-11-00007.1, 2011.
Federal Emergency Management Agency: Hazus Hurricane Model Technical Manual, Hazuz 6.1, https://www.fema.gov/sites/default/files/documents/Hazus_6.1_Hurricane_Model_Technical_Manual.pdf (last access: 18 May 2025), 2024a.
Federal Emergency Management Agency: National Risk Index: Future Risk, Technical Documentation, https://eelp.law.harvard.edu/wp-content/uploads/2025/03/NRI_Future_Risk_Technical_Document.pdf (last access: 18 May 2025), 2024b.
Federal Emergency Management Agency: Building Code Adoption Tracking, https://www.fema.gov/emergency-managers/risk-management/building-science/bcat (last access: 18 May 2025), 2025.
Gahtan, J., Knapp, K., Schreck III, C., Diamond, H., Kossin, J., and Kruk, M. C.: International Best Track Archive for Climate Stewardship (IBTrACS), Version 4r01, NOAA National Centers for Environmental Information [data set], https://doi.org/10.25921/82ty-9e16, 2024.
Gettelman, A., Bresch, D. N., Chen, C. C., Truesdale, J. E., and Bacmeister, J. T.: Projections of future tropical cyclone damage with a high-resolution global climate model, Climatic Change, 146, 575–585, https://doi.org/10.1007/s10584-017-1902-7, 2018.
Gori, A., Lin, N., Schenkel, B., and Chavas, D.: North Atlantic Tropical Cyclone Size and Storm Surge Reconstructions From 1950-Present, J. Geophys. Res.-Atmos., 128, e2022JD037312, https://doi.org/10.1029/2022JD037312, 2023.
Gori, A., Lin, N., Chavas, D., Oppenheimer, M., and Xian, S.: Sensitivity of tropical cyclone risk across the US to changes in storm climatology and socioeconomic growth, Environ. Res. Lett., 20, 064050, https://doi.org/10.1088/1748-9326/add60d, 2025.
Grinsted, A., Ditlevsen, P., and Christensen, J. H.: Normalized US hurricane damage estimates using area of total destruction, 1900–2018, P. Natl. Acad. Sci. USA, 116, 23942–23946, https://doi.org/10.1073/pnas.1912277116, 2019.
Hersbach, H., Bell, B., Berrisford, P., Hirahara, S., Horányi, A., Muñoz-Sabater, J., Nicolas, J., Peubey, C., Radu, R., Schepers, D., Simmons, A., Soci, C., Abdalla, S., Abellan, X., Balsamo, G., Bechtold, P., Biavati, G., Bidlot, J., Bonavita, M., De Chiara, G., Dahlgren, P., Dee, D., Diamantakis, M., Dragani, R., Flemming, J., Forbes, R., Fuentes, M., Geer, A., Haimberger, L., Healy, S., Hogan, R. J., Hólm, E., Janisková, M., Keeley, S., Laloyaux, P., Lopez, P., Lupu, C., Radnoti, G., de Rosnay, P., Rozum, I., Vamborg, F., Villaume, S., and Thépaut, J.-N.: The ERA5 global reanalysis, Q. J. Roy. Meteor. Soc., 146, 1999–2049, https://doi.org/10.1002/qj.3803, 2020.
Holland, G. J., Belanger, J. I., and Fritz, A.: A Revised Model for Radial Profiles of Hurricane Winds, Mon. Weather Rev., 138, 4393–4401, https://doi.org/10.1175/2010MWR3317.1, 2010.
Hurricane Research Division: Detailed List of Continental United States Hurricane Impacts/Landfalls, http://www.aoml.noaa.gov/hrd/hurdat/UShurrs_detailed.html (last access: 18 May 2025), 2025.
Ibrahim, H. A., Elawady, A., and Prevatt, D. O.: Empirical hurricane fragility assessment of elevated and slab-on-grade residential houses, Int. J. Disast. Risk Re., 110, 104663, https://doi.org/10.1016/j.ijdrr.2024.104663, 2024.
Iglesias, V., Braswell, A. E., Rossi, M. W., Joseph, M. B., McShane, C., Cattau, M., Koontz, M. J., McGlinchy, J., Nagy, R. C., Balch, J., Leyk, S., and Travis, W. R.: Risky Development: Increasing Exposure to Natural Hazards in the United States, Earth's Future, 9, e2020EF001795, https://doi.org/10.1029/2020EF001795, 2021.
Jewson, S.: The Impact of Projected Changes in Hurricane Frequencies on U.S. Hurricane Wind and Surge Damage, J. Appl. Meteorol. Clim., 62, 1827–1843, https://doi.org/10.1175/JAMC-D-23-0087.1, 2023.
Kelman, I.: Saffir–Simpson Hurricane Intensity Scale, in: Encyclopedia of Natural Hazards, edited by: Bobrowsky, P. T., Springer, Dordrecht, https://doi.org/10.1007/978-1-4020-4399-4_306, 2013.
Kernkamp, H. W. J., Van Dam, A., Stelling, G. S., and de Goede, E. D.: Efficient scheme for the shallow water equations on unstructured grids with application to the Continental Shelf, Ocean Dynam., 61, 1175–1188, https://doi.org/10.1007/s10236-011-0423-6, 2011.
Klotzbach, P. J., Bell, M. M., Bowen, S. G., Gibney, E. J., Knapp, K. R., and Schreck III, C. J.: Surface Pressure a More Skillful Predictor of Normalized Hurricane Damage than Maximum Sustained Wind, B. Am. Meteorol. Soc., 101, E830–E846, https://doi.org/10.1175/BAMS-D-19-0062.1, 2020.
Klotzbach, P. J., Chavas, D. R., Bell, M. M., Bowen, S. G., Gibney, E. J., and Schreck III, C. J.: Characterizing Continental US Hurricane Risk: Which Intensity Metric Is Best?, J. Geophys. Res.-Atmos., 127, e2022JD037030, https://doi.org/10.1029/2022JD037030, 2022a.
Klotzbach, P. J., Wood, K. M., Schreck III, C. J., Bowen, S. G., Patricola, C. M., and Bell, M. M.: Trends in Global Tropical Cyclone Activity: 1990–2021, Geophys. Res. Lett., 49, e2021GL095774, https://doi.org/10.1029/2021GL095774, 2022b.
Knutson, T., Camargo, S. J., Chan, J. C. L., Emanuel, K., Ho, C.-H., Kossin, J., Mohapatra, M., Satoh, M., Sugi, M., Walsh, K., and Wu, L.: Tropical Cyclones and Climate Change Assessment: Part II: Projected Response to Anthropogenic Warming, B. Am. Meteorol. Soc., 101, E303–E322, https://doi.org/10.1175/BAMS-D-18-0194.1, 2020.
König, N.: Case Study of Hurricane Matthew: Loss Analysis with CLIMADA and Oasis LMF using ECMWF Forecast Data, Institute of Atmospheric and Climate Sciences, Eidgenössische Technische Hochschule Zürich, Zürich, https://doi.org/10.13140/RG.2.2.28957.72169, 2017.
Landsea, C. W. and Franklin, J. L.: Atlantic Hurricane Database Uncertainty and Presentation of a New Database Format, Mon. Weather Rev., 141, 3576–3592, https://doi.org/10.1175/mwr-d-12-00254.1, 2013.
Lavender, S. L., Walsh, K. J. E., Utembe, S., Caron, L.-P., and Guishard, M.: Estimation of maximum seasonal tropical cyclone damage in the Atlantic using climate models, Nat. Hazards, 110, 1025–1038, https://doi.org/10.1007/s11069-021-04977-2, 2022.
Lockwood, J. F., Dunstone, N., Hermanson, L., Saville, G. R., Scaife, A. A., Smith, D., and Thornton, H. E.: A Decadal Climate Service for Insurance: Skillful Multiyear Predictions of North Atlantic Hurricane Activity and U.S. Hurricane Damage, J. Appl. Meteorol. Clim., 62, 1151–1163, https://doi.org/10.1175/JAMC-D-22-0147.1, 2023.
Meiler, S., Ciullo, A., Kropf, C. M., Emanuel, K., and Bresch, D. N.: Uncertainties and sensitivities in the quantification of future tropical cyclone risk, Communications Earth & Environment, 4, 371, https://doi.org/10.1038/s43247-023-00998-w, 2023.
Meiler, S., Vogt, T., Bloemendaal, N., Ciullo, A., Lee, C.-Y., Camargo, S. J., Emanuel, K., and Bresch, D. N.: Intercomparison of regional loss estimates from global synthetic tropical cyclone models, Nat. Commun., 13, 6156, https://doi.org/10.1038/s41467-022-33918-1, 2022.
Meiler, S., Kropf, C. M., McCaughey, J. W., Lee, C.-Y., Camargo, S. J., Sobel, A. H., Bloemendaal, N., Emanuel, K., and Bresch, D. N.: Navigating and attributing uncertainty in future tropical cyclone risk estimates, Science Advances, 11, eadn4607, https://doi.org/10.1126/sciadv.adn4607, 2025.
Muller, J., Mooney, K., Bowen, S. G., Klotzbach, P. J., Martin, T., Philp, T. J., Dhruvkumar, B., Dixon, R. S., and Girimurugan, S. B.: Normalized Hurricane Damage in the United States: 1900–2022, B. Am. Meteorol. Soc., 106, E51–E67, https://doi.org/10.1175/BAMS-D-23-0280.1, 2025.
National Centers for Environmental Information: U.S. Billion-Dollar Weather and Climate Disasters, National Oceanographic and Atmospheric Administration, https://doi.org/10.25921/stkw-7w73, 2025.
National Oceanographic and Atmospheric Administration: Hurricane Costs, https://coast.noaa.gov/states/fast-facts/hurricane-costs.html (last access: 18 May 2025), 2024.
National Oceanographic and Atmospheric Administration: Tropical Cyclone Rainfall, https://www.wpc.ncep.noaa.gov/tropical/rain/tcrainfall.html (last access: 18 May 2025), 2025.
Oasis Loss Modelling Framework: Oasis Loss Modelling Framework (Oasis LMF) [open-source catastrophe modelling platform], https://oasislmf.org (last access: 18 May 2025), 2025.
Oliver-Smith, A.: Hurricanes, Climate Change, and the Social Construction of Risk, International Journal of Mass Emergencies & Disasters, 38, 1–12, https://doi.org/10.1177/028072702003800101, 2020.
Pesaresi, M. and Politis, P.: GHS-BUILT-S R2023A – GHS built-up surface grid, derived from Sentinel2 composite and Landsat, multitemporal (1975–2030), European Commission, Joint Research Centre [data set], https://doi.org/10.2905/9F06F36F-4B11-47EC-ABB0-4F8B7B1D72EA, 2023.
Pilkington, S. F. and Mahmoud, H. N.: Using artificial neural networks to forecast economic impact of multi-hazard hurricane-based events, Sustainable and Resilient Infrastructure, 1, 63–83, https://doi.org/10.1080/23789689.2016.1179529, 2016.
Qi, W., Yong, B., Ritchie, E. A., Tyo, J. S., and Toumi, R.: Global Increase of Tropical Cyclone Precipitation Rate Toward Coasts, Geophys. Res. Lett., 52, e2025GL115500, https://doi.org/10.1029/2025GL115500, 2025.
Rappaport, E. N.: Fatalities in the United States from Atlantic Tropical Cyclones: New Data and Interpretation, B. Am. Meteorol. Soc., 95, 341–346, https://doi.org/10.1175/BAMS-D-12-00074.1, 2014.
Schenkel, B. A., Chavas, D., Lin, N., Knutson, T., Vecchi, G., and Brammer, A.: North Atlantic Tropical Cyclone Outer Size and Structure Remain Unchanged by the Late Twenty-First Century, J. Climate, 36, 359–382, https://doi.org/10.1175/JCLI-D-22-0066.1, 2023.
Stansfield, A. M. and Reed, K. A.: Global tropical cyclone precipitation scaling with sea surface temperature, npj Climate and Atmospheric Science, 6, 60, https://doi.org/10.1038/s41612-023-00391-6, 2023.
Stansfield, A. M., Reed, K. A., Zarzycki, C. M., Ullrich, P. A., and Chavas, D. R.: Assessing Tropical Cyclones' Contribution to Precipitation over the Eastern United States and Sensitivity to the Variable-Resolution Domain Extent, J. Hydrometeorol., 21, 1425–1445, https://doi.org/10.1175/JHM-D-19-0240.1, 2020.
Tripathy, S. S., Jafarzadegan, K., Moftakhari, H., and Moradkhani, H.: Dynamic bivariate hazard forecasting of hurricanes for improved disaster preparedness, Communications Earth & Environment, 5, 12, https://doi.org/10.1038/s43247-023-01198-2, 2024.
U.S. Bureau of Economic Analysis: Current-cost net stock of fixed assets and consumer durable goods [K1WTOTL1ES000], https://fred.stlouisfed.org/series/K1WTOTL1ES000 (last access: 18 May 2025), 2023.
U.S. Bureau of Economic Analysis: National Data, Fixed Assets Accounts Tables, https://apps.bea.gov/iTable/?reqid=10&step=3&isuri=1&table_list=16 (last access: 18 May 2025), 2025.
U.S. Census Bureau: American Community Survey Housing Units by Year Built Variables — Tract, https://hub.scag.ca.gov/datasets/41c90eef3a12451faff10c2a6b26fc46_2/about (last access: 18 May 2025), 2024.
Vickery, P. J., Skerlj, P. F., Lin, J., Twisdale Jr., L. A., Young, M. A., and Lavelle, F. M.: HAZUS-MH Hurricane Model Methodology. II: Damage and Loss Estimation, Nat. Hazards Rev., 7, 94–103, https://doi.org/10.1061/(ASCE)1527-6988(2006)7:2(94), 2006.
Wang, D., Chavas, D. R., and Schenkel, B. A.: Tropical cyclones expand faster at warmer relative sea surface temperature, P. Natl. Acad. Sci. USA, 122, e2424385122, https://doi.org/10.1073/pnas.2424385122, 2025.
Wang, S. and Toumi, R.: On the relationship between hurricane cost and the integrated wind profile, Environ. Res. Lett., 11, 114005, https://doi.org/10.1088/1748-9326/11/11/114005, 2016.
Wang, S. and Toumi, R.: Recent migration of tropical cyclones toward coasts, Science, 371, 514, https://doi.org/10.1126/science.abb9038, 2021.
Wang, X., Verlaan, M., Apecechea, M. I., and Lin, H. X.: Computation-Efficient Parameter Estimation for a High-Resolution Global Tide and Surge Model, J. Geophys. Res.-Oceans, 126, e2020JC016917, https://doi.org/10.1029/2020JC016917, 2021.
Ward, P. J., Blauhut, V., Bloemendaal, N., Daniell, J. E., de Ruiter, M. C., Duncan, M. J., Emberson, R., Jenkins, S. F., Kirschbaum, D., Kunz, M., Mohr, S., Muis, S., Riddell, G. A., Schäfer, A., Stanley, T., Veldkamp, T. I. E., and Winsemius, H. C.: Review article: Natural hazard risk assessments at the global scale, Nat. Hazards Earth Syst. Sci., 20, 1069–1096, https://doi.org/10.5194/nhess-20-1069-2020, 2020.
Wehner, M. F. and Kossin, J. P.: The growing inadequacy of an open-ended Saffir–Simpson hurricane wind scale in a warming world, P. Natl. Acad. Sci. USA, 121, e2308901121, https://doi.org/10.1073/pnas.2308901121, 2024.
Weinkle, J., Landsea, C., Collins, D., Musulin, R., Crompton, R. P., Klotzbach, P. J., and Pielke, R.: Normalized hurricane damage in the continental United States 1900–2017, Nature Sustainability, 1, 808–813, https://doi.org/10.1038/s41893-018-0165-2, 2018.
Welker, C., Röösli, T., and Bresch, D. N.: Comparing an insurer's perspective on building damages with modelled damages from pan-European winter windstorm event sets: a case study from Zurich, Switzerland, Nat. Hazards Earth Syst. Sci., 21, 279–299, https://doi.org/10.5194/nhess-21-279-2021, 2021.
Wilson, K. M., Baldwin, J. W., and Young, R. M.: Estimating Tropical Cyclone Vulnerability: A Review of Different Open-Source Approaches, in: Hurricane Risk in a Changing Climate, edited by: Collins, J. M. and Done, J. M., Springer International Publishing, Cham, 255–281, https://doi.org/10.1007/978-3-031-08568-0_11, 2022.
Wong-Parodi, G. and Garfin, D. R.: Hurricane adaptation behaviors in Texas and Florida: exploring the roles of negative personal experience and subjective attribution to climate change, Environ. Res. Lett., 17, 034033, https://doi.org/10.1088/1748-9326/ac4858, 2022.
World Meteorological Organization: WMO Atlas of Mortality and Economic Losses from Weather, Climate and Water Extremes (1970–2019), WMO-No. 1267, https://library.wmo.int/idurl/4/57564 (last access: 18 May 2025), 2021.
WorldPop: Global High Resolution Population Denominators Project, WorldPop [data set], https://doi.org/10.5258/SOTON/WP00674, 2018.
Xu, Z., Guo, J., Zhang, G., Ye, Y., Zhao, H., and Chen, H.: Global tropical cyclone size and intensity reconstruction dataset for 1959–2022 based on IBTrACS and ERA5 data, Earth Syst. Sci. Data, 16, 5753–5766, https://doi.org/10.5194/essd-16-5753-2024, 2024.
Zhong, Q., Gan, J., Tu, S., Toumi, R., and Chan, J. C. L.: Global increase in rain rate of tropical cyclones prior to landfall, Nat. Commun., 17, 114, https://doi.org/10.1038/s41467-025-68070-z, 2026.
Zuzak, C., Goodenough, E., Stanton, C., Mowrer, M., Ranalli, N., Kealey, D., and Rozelle, J.: National risk index technical documentation, https://www.fema.gov/about/openfema/data-sets/national-risk-index-data (last access: 18 May 2025), 2021.
- Abstract
- Introduction
- Data and methodology
- Historical relationship between hurricane wind speed and loss
- Historical relationships between multiple hazard, exposure and vulnerability variables and loss
- Statistical prediction of historical hurricane loss
- A loss-based hurricane classification
- Summary and discussion
- Code and data availability
- Author contributions
- Competing interests
- Disclaimer
- Acknowledgements
- Review statement
- References
- Supplement
Please read the editorial note first before accessing the article.
- Article
(4587 KB) - Full-text XML
-
Supplement
(2544 KB) - BibTeX
- EndNote
- Abstract
- Introduction
- Data and methodology
- Historical relationship between hurricane wind speed and loss
- Historical relationships between multiple hazard, exposure and vulnerability variables and loss
- Statistical prediction of historical hurricane loss
- A loss-based hurricane classification
- Summary and discussion
- Code and data availability
- Author contributions
- Competing interests
- Disclaimer
- Acknowledgements
- Review statement
- References
- Supplement