the Creative Commons Attribution 4.0 License.
the Creative Commons Attribution 4.0 License.
 | 08 May 2026
Non-stationary dynamics of compound climate extremes: a WRF-CMIP6-GAMLSS framework for southeastern China
Yinchi Zhang
Wanling Xu
Chao Deng
Miaomiao Ma
Jianhui Wei
Ying Chen
Harald Kunstmann
Understanding future changes in compound climate extremes (CCEs) is critical for climate risk assessment. Existing research, however, has largely relied on stationary assumptions, overlooking the dynamic evolution of CCEs under non-stationary climate change. To address this gap, this study employs an enhanced Generalized Additive Model for Location, Scale, and Shape (GAMLSS) framework to provide novel insights into the non-stationary characteristics of hot-wet (HW), hot-dry (HD), cold-wet (CW), and cold-dry (CD) extremes under future climate scenarios. We focus on the Minjiang River Basin (MRB) in Southeast China. A high-resolution dataset for CEE detection was generated by dynamical downscaling a bias-corrected CMIP6 dataset, using the Weather Research and Forecasting (WRF) model. Our results indicate that (1) CCEs increase significantly at a rate of 3.55 d per decade under the SSP5-8.5 scenario, with hot extremes (HW and HD) being the dominant contributors. Spatially, the increases exhibit a distinct west to east gradient, peaking in the downstream areas of the MRB. (2) Under the SSP5-8.5 scenario, CCEs exhibit a marked shift from stationary to non-stationary characteristics, with non-stationarity detected in 95.20 % of grid cells. This transition is primarily driven by mean warming, which explains 80.81 % of the change, rather than by variability. (3) The non-stationary results demonstrate that the severity and recurrence frequency of CCEs are systematically underestimated under stationary assumptions. Most CCE types (except for CD) show an increasing recurrence frequency under the SSP5-8.5 scenario. For instance, the frequency of events with a 100-year return period increases at a stronger trend of 3.12 d per decade. This study emphasizes the necessity of updating the frequency changes of CCEs under a non-stationary framework.
- Article
(13868 KB) - Full-text XML
-
Supplement
(7245 KB) - BibTeX
- EndNote


Global warming is leading to more frequent and intense compound climate extremes (CCEs) (Sauter et al., 2023; Liu et al., 2024a; Zhang et al., 2024; You et al., 2025). CCEs have posed severe threats to global social, economic, and ecological systems, with impacts that surpass those of individual extremes in both range and severity (Mukherjee et al., 2023; Zeng et al., 2024; Miao et al., 2024). For example, the Yangtze River Basin in China experienced unprecedented compound hot-dry extremes in August 2022, characterized by record-breaking heatwaves and severe droughts, which directly affected over 50 million people (Jia et al., 2025). The Sixth Intergovernmental Panel on Climate Change (IPCC) report indicated that the probability and intensity of future CCEs are projected to increase (IPCC, 2021). Therefore, a systematic assessment of the future evolution of CCEs is critical for mitigating socio-economic risks and optimizing climate adaptation strategies.
Recent studies have increasingly focused on CCEs, highlighting their growing significance in the context of climate change. Zscheischler et al. (2018) were the first to clearly define the concept of compound events, emphasizing how the interaction of multiple climate and meteorological drivers can amplify extreme impacts. Building on this, Ridder et al. (2022) conducted the first global-scale assessment of the changes in compound events, specifically examining the co-occurrence of heatwaves and drought, extreme winds, and precipitation. Wu et al. (2023) revealed that under warming conditions, the risks associated with global compound pluvial–hot extreme events are projected to be significantly greater in the future than those observed during the historical period. Fang et al. (2025) investigated the future changes of sequential heatwaves and precipitation events as well as concurrent drought and heatwave events in China, with projections indicating an increase in both the frequency and intensity of these events.
While large-scale studies play a crucial role in advancing our understanding of global climate change and extreme events, their practical relevance for disaster risk management and adaptation strategies in medium- and small-scale regions is relatively limited due to their lower spatial and temporal resolution. To overcome this constraint, dynamical downscaling, which utilizes nested high-resolution regional climate models (RCMs), provides a critical technical pathway to investigate climate response mechanisms at fine-scales (Tapiador et al., 2020; Rahimi et al., 2024). Compared to Global Climate Models (GCMs), RCMs offer higher spatial resolution, allowing for more precise simulations of local climate effects induced by topography, such as local convective precipitation, orographic effects, and regional climate heterogeneity (Gilbert et al., 2025). In regions with complex terrain, RCMs are particularly effective at capturing spatial variations of climate variables, such as the differences in wind patterns, precipitation, and their distribution caused by topography in mountainous or basin areas (Imran and Evans, 2025). For example, Byun et al. (2023) assessed the ability of RCMs and GCMs to simulate storm tracks in East Asia, revealing that RCMs are better able to capture high-resolution topography, thereby reducing the biases found in GCMs. Lin et al. (2022) showed that RCMs driven by ERA-Interim reanalysis data are capable of capturing small-scale processes, such as orographic effects, and outperform GCMs in reproducing the large-scale features of the Heat Wave Magnitude Index-daily. Torrez-Rodriguez et al. (2023) also demonstrated that RCMs are better at reproducing the main spatio-temporal characteristics of precipitation in subtropical complex terrain regions. As an advanced convection-permitting RCM, the WRF model significantly enhances the simulation capability for meteorological processes at 1–10 km scales through its fully compressible, non-hydrostatic dynamic core framework (Talbot et al., 2012). This high-resolution simulation capability gives the WRF model a unique advantage in capturing small-scale meteorological phenomena. Zhou et al. (2024) developed a 9 km resolution regional reanalysis dataset covering the Tibetan Plateau based on the WRF model, and demonstrated its superior applicability compared to the fifth generation European Centre for Medium-Range Weather Forecasts Reanalysis (ERA5). Yang et al. (2024) revealed that the WRF model provides better accuracy in simulating snow depth during the cold season in high-elevation regions compared to ERA5-Land.
Additionally, traditional extreme event analyses rely on stationarity assumptions (when analyzing time series data, it is assumed that the statistical properties of the series remain constant over time), presuming that the probability and distributional parameters of climate variables are constant (Sun et al., 2018; Nerantzaki et al., 2023). However, driven by synergistic effects of global warming and anthropogenic forcing, extremes exhibit significant shifts in distributional characteristics (Gao et al., 2018). Therefore, traditional models fail to capture the non-stationary (the statistical properties of a time series change over time and do not remain constant) changes in these extreme events. Many studies have applied the Generalized Additive Models for Location, Scale, and Shape (GAMLSS) (Rigby and Stasinopoulos, 2005) to address non-stationary problems in hydrological and meteorological extremes, enabling updated risk analysis of evolving climate extremes. Lei et al. (2021) investigated the non-stationary changes of extreme precipitation in the Poyang Lake Basin and found that the stationary assumption underestimates the intensity of extreme precipitation in this region. Shao et al. (2022) innovatively proposed the Nonstationary Standardized Runoff Index (NSRI), and the results indicate that, compared to the stationary index, it can more accurately identify drought events. Salarijazi et al. (2023) evaluated the nonstationarity of maximum temperatures in multiple urban areas of Iran and concluded that traditional stationary approaches tend to underestimate the risk of annual maximum temperatures. However, existing non-stationary analyses only focus on individual extremes, and the potential non-stationarity of CCEs has not been established. The comprehensive assessment of future changes in CCEs within a non-stationary framework is also lacking.
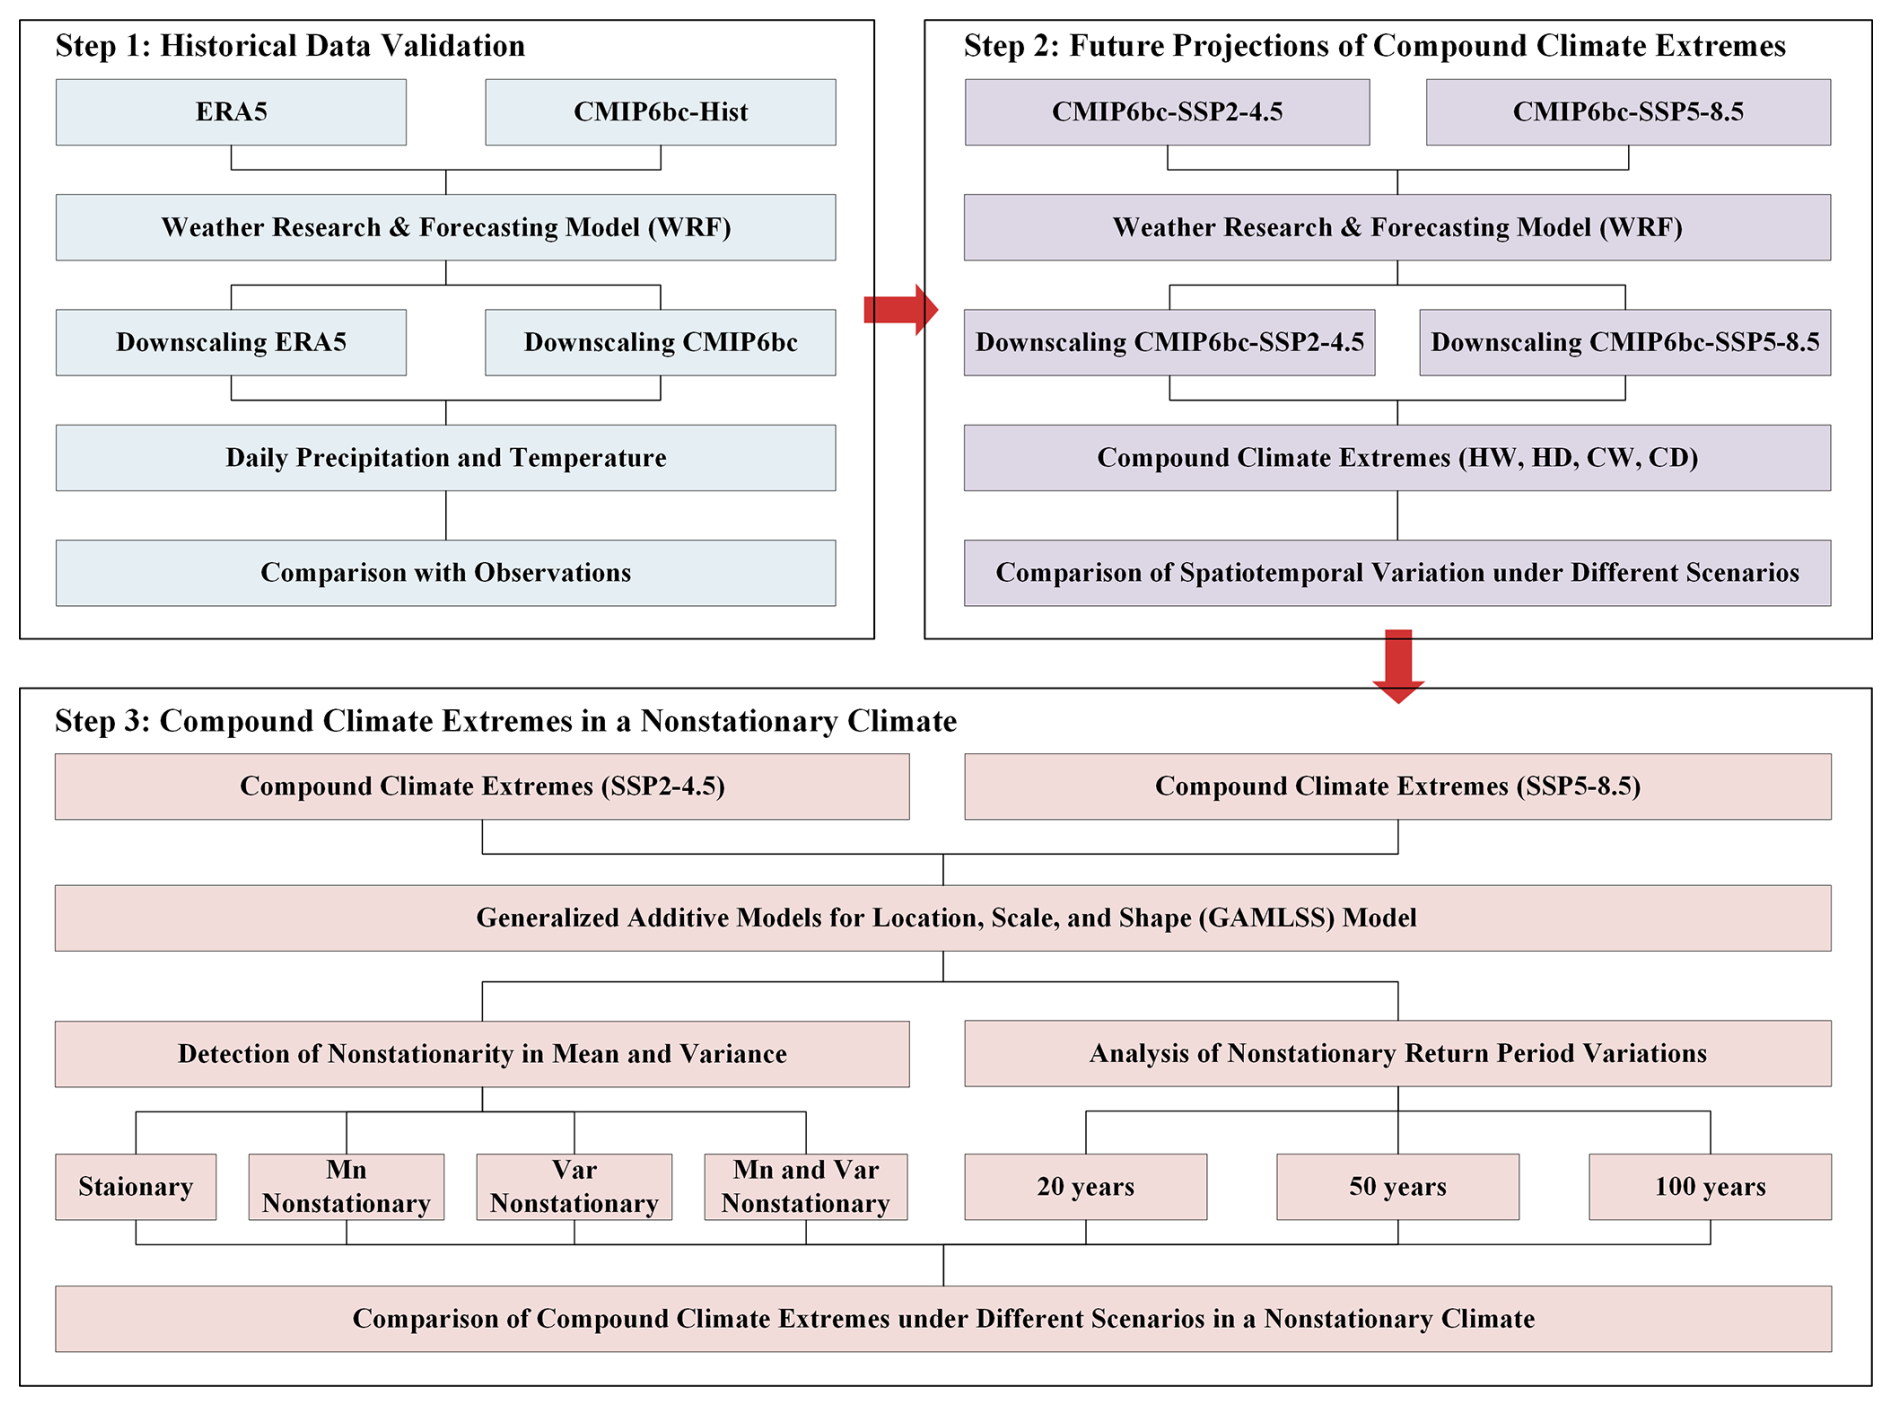
To address these research gaps, this study adopts a high-resolution approach by integrating the WRF model with GAMLSS. We first perform dynamical downscaling using the WRF model to refine the bias-corrected Coupled Model Intercomparison Project Phase 6 (CMIP6bc) data (1.25°×1.25°) to a 3 km resolution. Based on these high-resolution WRF outputs, CCEs are then identified and used as input for the GAMLSS framework to analyze their non-stationary characteristics. This methodology overcomes the limitations of traditional coarse-resolution models and addresses the shortcomings of stationary assumptions in CCE analysis. By focusing on the Minjiang River Basin (MRB) – a subtropical, monsoon-dominated basin in southeastern China where complex topographic–climatic interactions give rise to high-intensity compound hydroclimatic extremes (Gan et al., 2025; Geng et al., 2024; Wang et al., 2024) – this research aims to examine four types of CCEs: hot-wet (HW), hot-dry (HD), cold-wet (CW), and cold-dry (CD) events. The analysis proceeds as follows (Fig. 1): Supplement Sect. S1 presents the validation of CMIP6bc applicability. Section 3.1 characterizes the spatio-temporal patterns of CCEs under both a middle-of-the-road scenario (SSP2-4.5) and a high-emissions scenario (SSP5-8.5). The non-stationarity detection of CCEs is described in Sect. 3.2. The recurrence frequency changes in CCEs under non-stationary conditions is evaluated in Sect. 3.3. The work establishes a scientific basis for addressing the environmental and climatic challenges posed by CCEs, thereby contributing to effective strategies for regional sustainability and climate resilience.
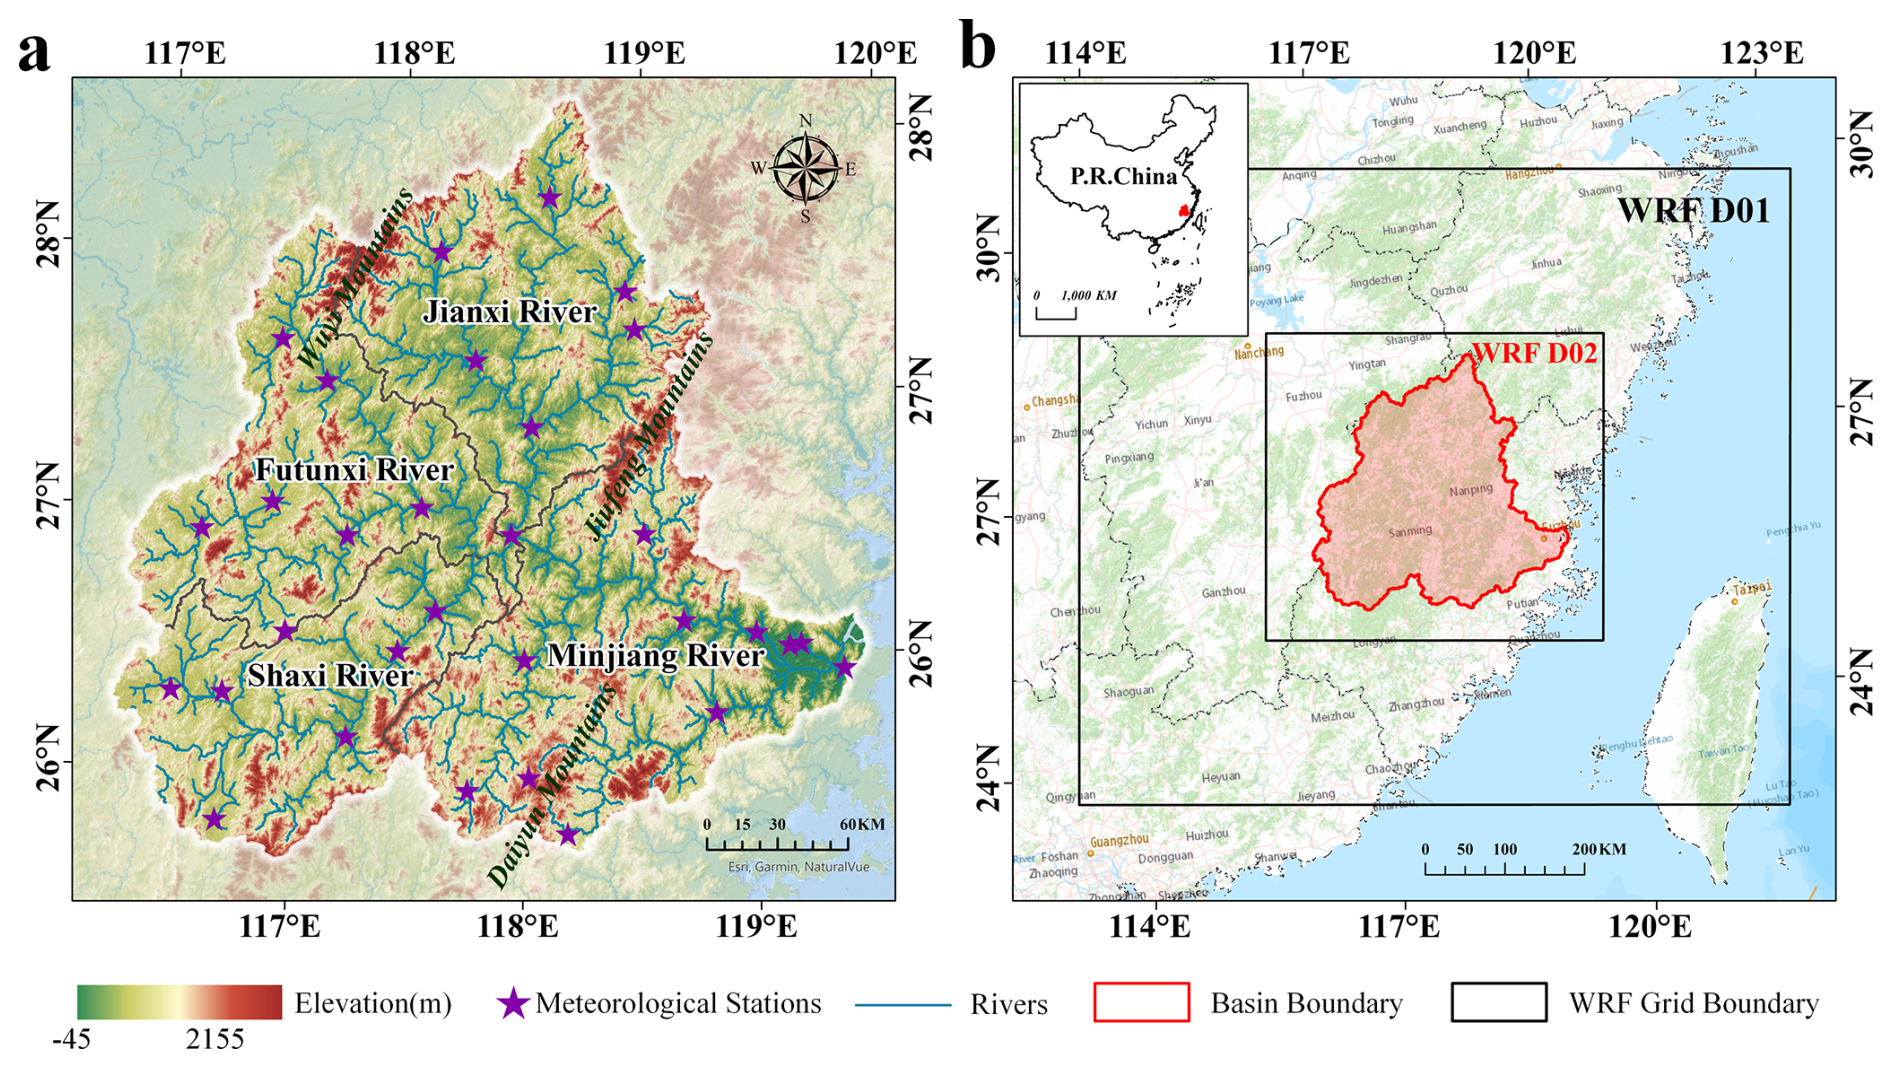
Figure 2Study area and model configuration. (a) Topographic features of the MRB (m) and (b) Model configuration with 9 km (D01) and 3 km (D02) nested domains (Zhang et al., 2025). Basemap source: Esri | Powered by Esri, https://services.arcgisonline.com (last access: 3 May 2026).
2.1 Study region
The MRB is a complex topographic basin in southeastern coastal China (Fig. 2a). The Minjiang River, the main stream of the basin, drains an area of 60 992 km2 – accounting for nearly half Fujian Province's territory. Encompassing three principal tributaries (Jianxi, Futunxi, and Shaxi rivers), the MRB experiences a subtropical monsoon climate characterized by 1700 mm mean annual precipitation and 18 °C mean temperature (Zheng et al., 2023). The basin displays spatio-temporal heterogeneity in precipitation, with flood seasons from April to September that often accompany CCEs. Particularly in the late flood season (July to September), the MRB experiences frequent typhoon-related compound disasters: the upper and middle reaches are commonly affected by typhoon-rainstorm-landslide events, while the lower reaches face high occurrences of typhoon-rainstorm-urban waterlogging and typhoon-rainstorm-flood events (Yang et al., 2025). In 2023, for example, typhoon Doksuri (No. 2305) caused approximately 66 794 people to be affected in Fuzhou, the downstream city of the MRB, with direct economic losses reaching 588 million RMB (Yan et al., 2024). In addition, the region also exhibits a climate characteristic of concurrent rainfall and heat, with CCEs frequently occurring during the warm season, driven by high temperature and heavy rainfall (Sun et al., 2025).
2.2 Data
Obtained from the Science Data Bank, the CMIP6bc dataset serves as the foundation for this investigation (Xu et al., 2021, https://www.scidb.cn, last access: 3 May 2026), which is constructed using the ERA5. This dataset incorporates an 18-model CMIP6 ensemble mean (Supplement Table S1), maintaining both climatological mean and interannual variability statistics while preserving nonlinear temporal trends. Compared with original CMIP6 data, CMIP6bc demonstrates superior performance in extreme event simulation. Despite its widespread application in previous studies (Jamal et al., 2023; Huang et al., 2024; Wu and Zheng, 2023), we conduct a 10-year validation over the MRB. Considering both the reliability of the dataset and the need to optimize computational resources (simulating one year over the MRB requires approximately four days on 80 CPU cores), we select a 10-year historical period (2005–2014) as sufficient to demonstrate the reliability of the CMIP6bc dataset for driving the WRF simulations. ERA5, as a widely used WRF-driven dataset (Arnault et al., 2021; Jiang et al., 2021; Varga and Breuer, 2022; Shang et al., 2022), is utilized here as a reference for the simulation results. Fujian Provincial Meteorological Bureau provides daily precipitation and temperature records from its 30 monitoring stations, which are used as validation data for this study. Future scenarios under SSP2-4.5 and SSP5-8.5 (2025–2065) are employed to project future changes in CCEs.
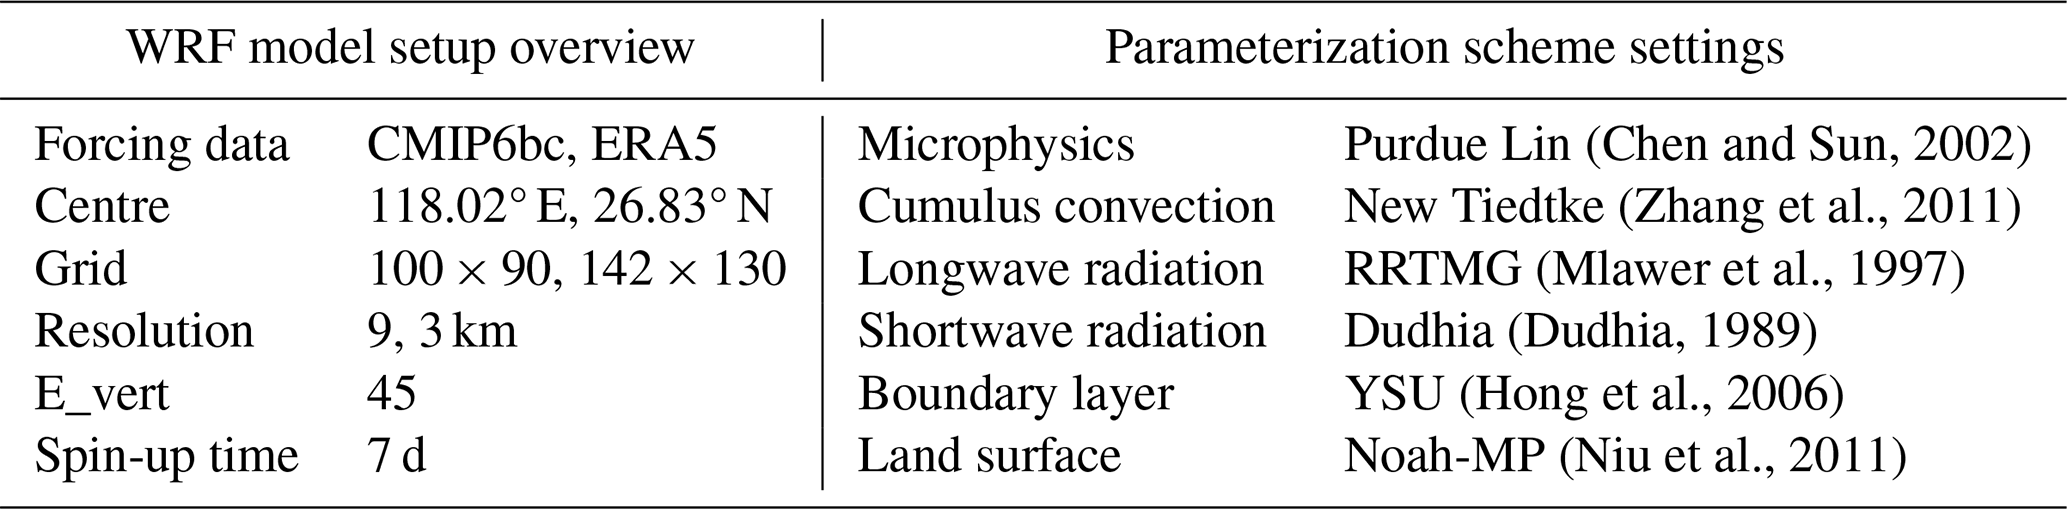
2.3 WRF model setup
This research utilizes the WRF Version 4.3 with two-domain nested configuration, featuring grid spacings of 9 and 3 km (Fig. 2b). Table 1 summarizes the optimal physics parameterization schemes selected through our comprehensive sensitivity experiments (Sect. S2) (Lin et al., 2023; Zhang et al., 2025). At sufficiently high model resolutions, deep convective processes can be explicitly resolved (Arakawa and Jung, 2011). Therefore, the cumulus parameterization scheme is deactivated in the inner domain (D02) to leverage convection-permitting capability. We first simulate daily precipitation and temperature over the MRB from 1 January 2005 to 31 December 2014, using both CMIP6bc and ERA5 forcing data. Subsequently, future projections from 1 January 2025 to 31 December 2065 are conducted using CMIP6bc under two climate projection scenarios.
2.4 Definition of CCEs
This study considers four types of CCEs: hot-wet events (HW), hot-dry events (HD), cold-wet events (CW) and cold-dry events (CD). We adopt the widely used thresholds (the 90th and 10th percentiles) to identify CCEs (Croitoru et al., 2016; Song et al., 2019; Patel et al., 2024). We first extract daily precipitation (>0.1 mm) and temperature data for each grid during 2025–2065, defining the 90th and 10th percentiles as thresholds to identify hot/cold and wet/dry extremes, respectively. Specifically, we define extreme temperature events as occurring when daily temperatures are higher (hot extremes) or lower (cold extremes) than the threshold. Wet events are characterized by rainfall surpassing the threshold (90th), while dry events are characterized by seven consecutive days without rainfall. For dry conditions defined as seven consecutive days without precipitation, each day within a dry spell is treated as a dry day in the counting of CCEs. We conduct calculations independently for each grid point, applying thresholds specific to each point. Specifically, for interannual variation, we sort the precipitation and temperature data over a 40-year period and determine the thresholds based on the 10th and 90th percentiles to identify CCEs. For seasonal variations, we separately extract the precipitation and temperature data for the summer (JJA) and winter (DJF) seasons, applying the same sorting method to calculate the respective thresholds, thus analyzing the distribution characteristics of CCEs for each season.
2.5 GAMLSS model
GAMLSS is a flexible statistical model used for analyzing distributions with non-stationary characteristics (Rigby and Stasinopoulos, 2005). It extends the traditional generalized linear models (GLMs) and generalized additive models (GAMs) by introducing joint modeling of all distribution parameters (location, scale, and shape). Unlike traditional regression models, GAMLSS effectively characterizes both linear and nonlinear dependencies linking predictors to response variables (Stasinopoulos and Rigby, 2007).
This study employs the semi-parametric GAMLSS, which accommodates parametric terms, nonparametric smooth functions, and random effects within a unified modeling structure (Gao et al., 2018). Consider z independent samples following a distribution Fy(yiθi), where the parameter vector contains k components representing location (Mn), scale (Var), and shape (skewness and kurtosis), with k normally not exceeding 4. Model selection is performed using Akaike's Information Criterion (AIC) (Akaike, 1974), with the optimal configuration identified through minimum AIC values, and model fitting quality is assessed by the Filliben correlation coefficient (Filliben, 1975). The GAMLSS is formally defined as follows:
where k denotes the indicator of distribution parameters, θk is the distribution parameter vector, ∅k represents n×jk matrix of covariate variables, βk is the coefficient vector of length jk. gk(⋅) is the link function connecting distribution parameter to linear predictor. defines how the distribution parameter varies with covariate variable . In the GAMLSS model, time (year) is used as the independent variable (x), and the number of days per year for each type of CCE is treated as the dependent variable (y), thereby enabling the calculation of the non-stationary characteristics of each CCE. We employ two types of GAMLSS models to capture potential changes in the distribution of meteorological variables. The first is the traditional two-parameter location–scale model (mean μ and variance σ), which assumes a fixed distributional shape. The second is a more flexible four-parameter location–scale–shape model (mean μ, variance σ, skewness ν, and kurtosis τ), allowing the distributional shape to evolve over time. These extended models retain the mean and variance parameters while incorporating two additional shape parameters to capture asymmetry and tail behavior. We assess the models by comparing their goodness of fit and select the one that best represents the data distribution for subsequent analyses. Regarding the calculation of stationarity, we consider the CCEs to be stationary if both the mean and variance remain stable. If either the mean or variance shows significant variation, the CCEs are considered non-stationary. Table S2 lists all the distribution functions implemented in our study. The R code for implementing GAMLSS model can be accessed at https://github.com/gamlss-dev/gamlss (last access: 3 May 2026).
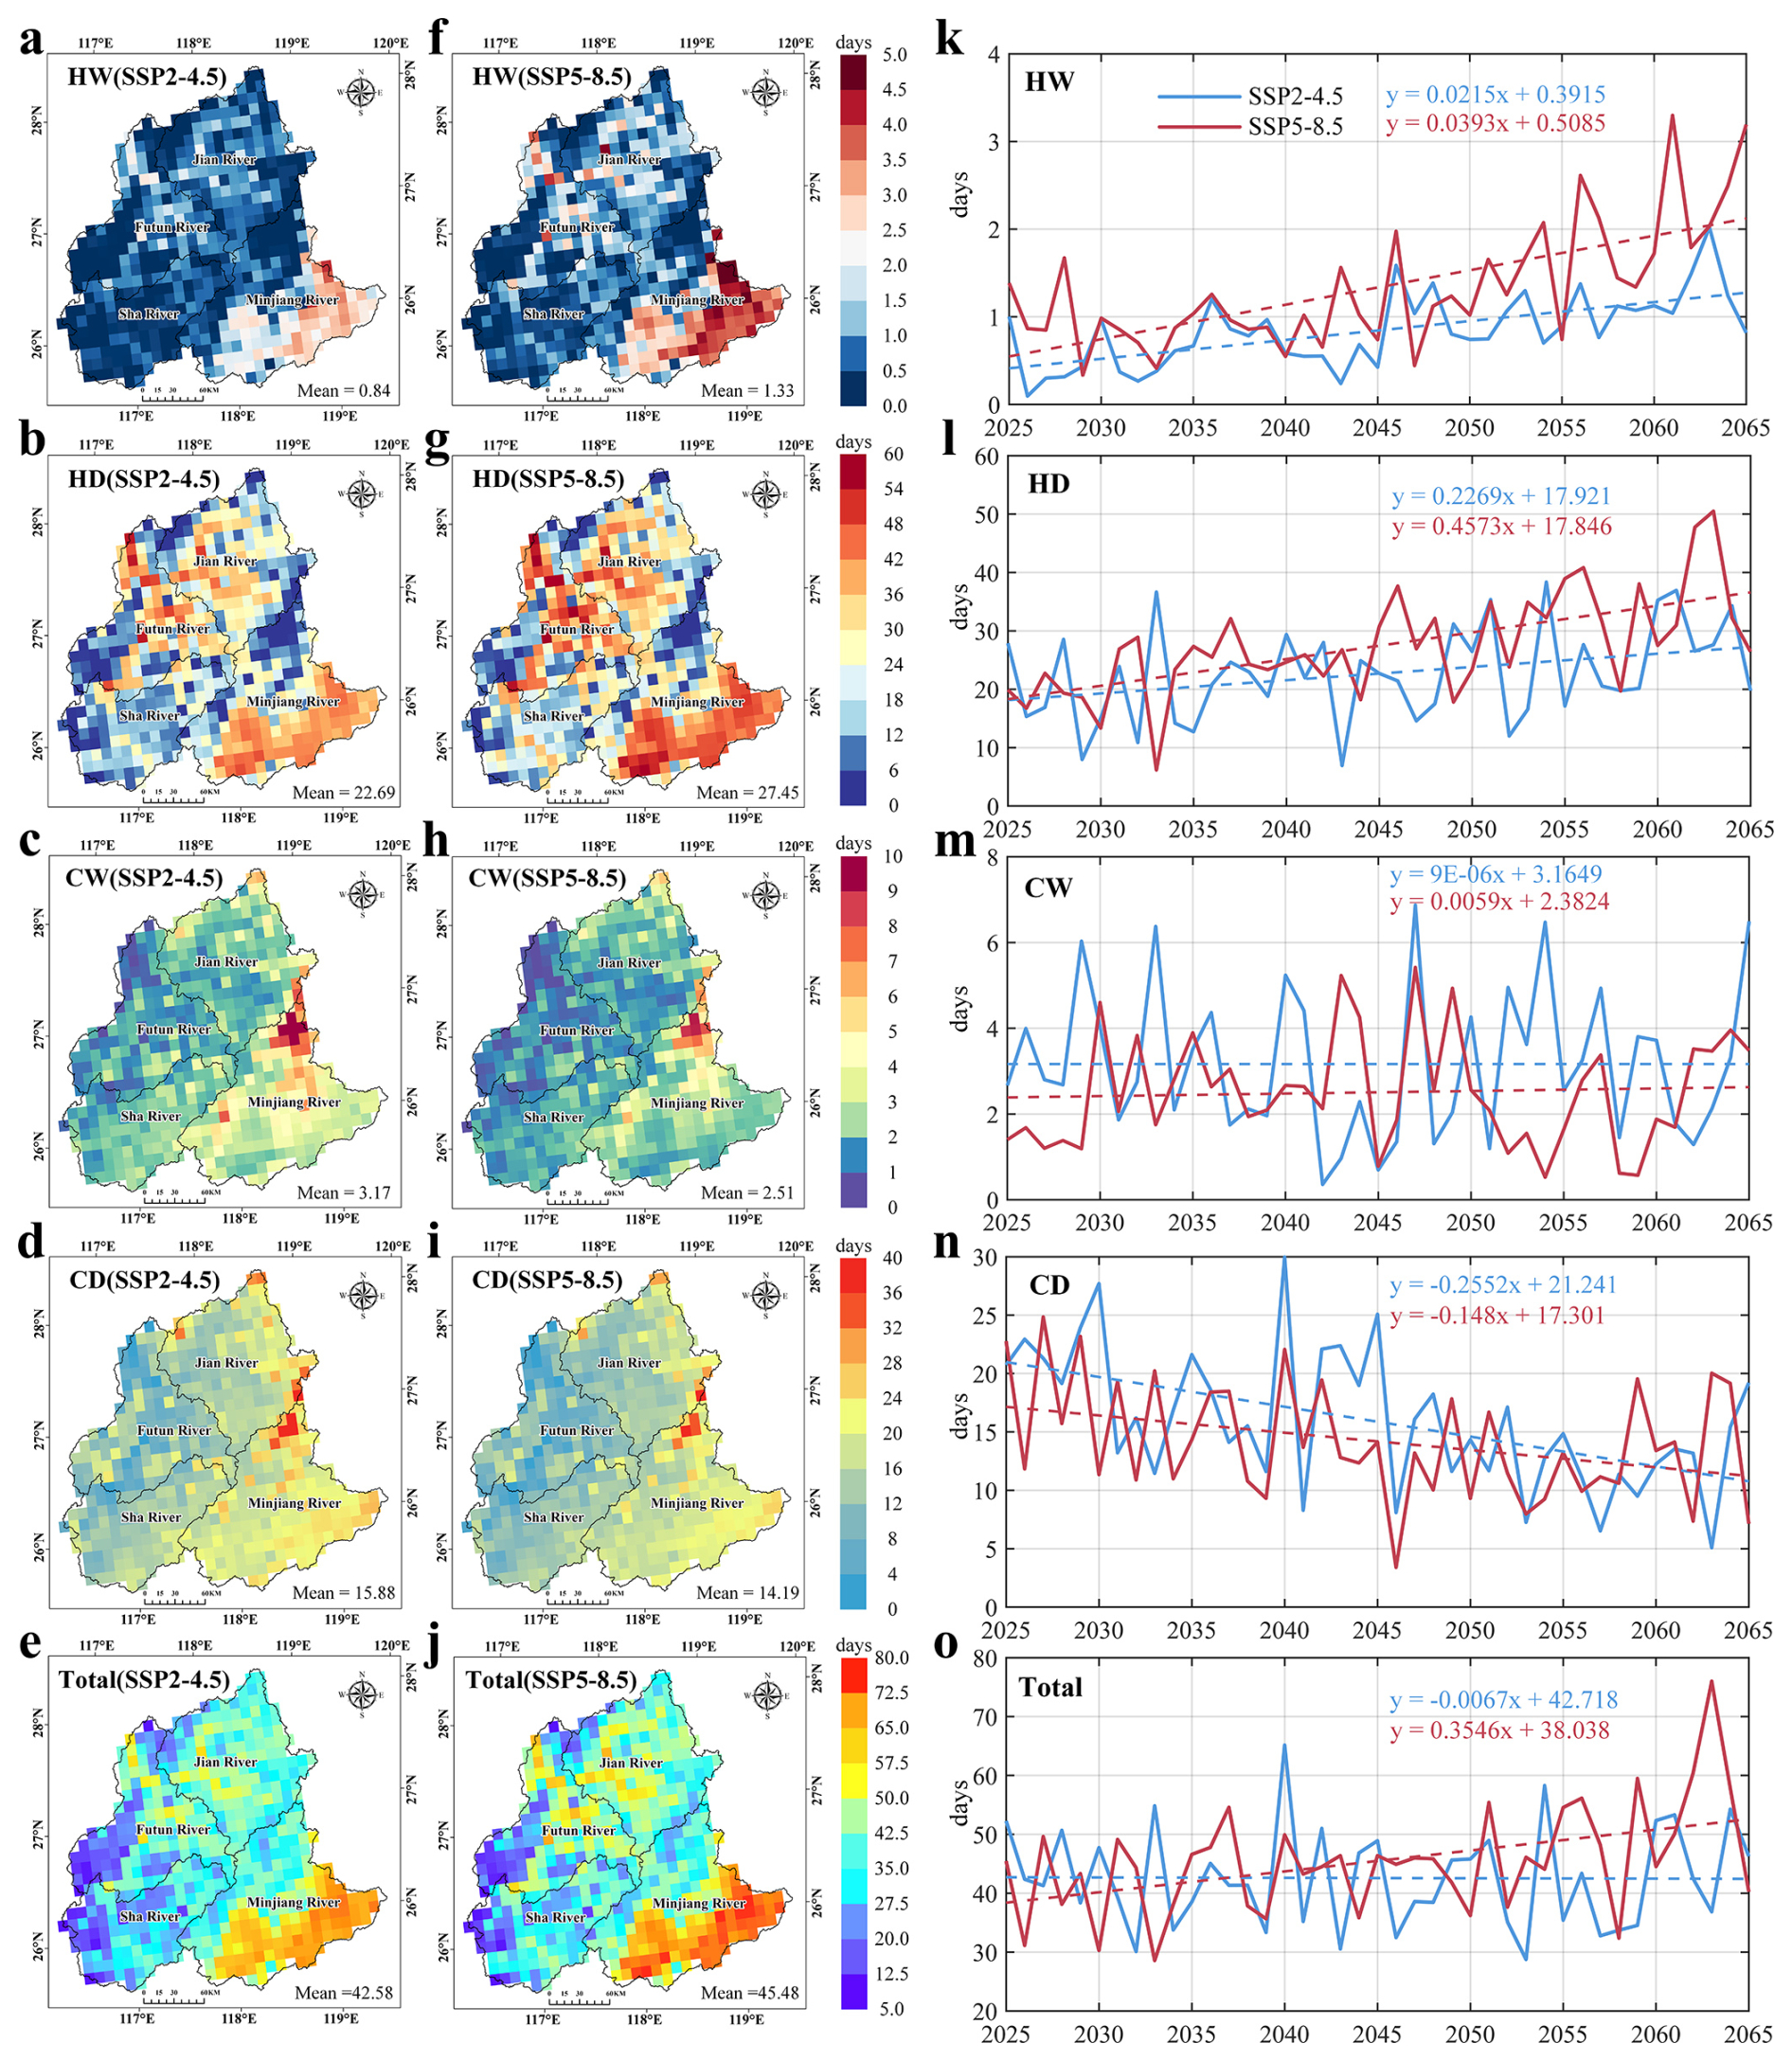
Figure 3Annual Spatio-temporal patterns of CCEs across the MRB from 2025 to 2065.
3.1 Spatio-temporal patterns of CCEs under future scenarios
Figure 3a–j illustrate the spatial distribution of annual CCEs over the MRB during 2025–2065. Overall, total CCEs are higher under the SSP5-8.5 scenario (45.48 d) than under the SSP2-4.5 scenario (42.58 d). Dry-related extremes (HD and CD) dominate across the basin, whereas wet-related extremes (HW and CW) are less frequent. Both hot extremes occur more frequently under SSP5-8.5 than SSP2-4.5: HW increases from 0.84 to 1.33 d, and HD rises from 22.69 to 27.45 d. In contrast, cold extremes decrease: CW declines from 3.17 to 2.15 d, and CD from 15.88 to 14.19 d.
Spatially, the two scenarios exhibit similar geographic patterns. The highest frequencies occurring in downstream regions, particularly for HD and HW. HD shows a wider spatial extent, extending into the Futun River and Jian River Basins. Meanwhile, CW and CD display a clear west-to-east increasing gradient, with the highest values concentrated near the Jiufeng Mountains.
Temporally (Fig. 3k–o), CCE trends diverge sharply between scenarios. Under high-emission SSP5-8.5, total CCEs increase significantly at 3.55 d per decade, whereas SSP2-4.5 projects stabilized frequencies. Hot extremes (HW and HD) increase more rapidly under SSP5-8.5, at rates nearly double those under SSP2-4.5. Conversely, the decline in CD is stronger under SSP2-4.5 – approximately 1.7 times that under SSP5-8.5.
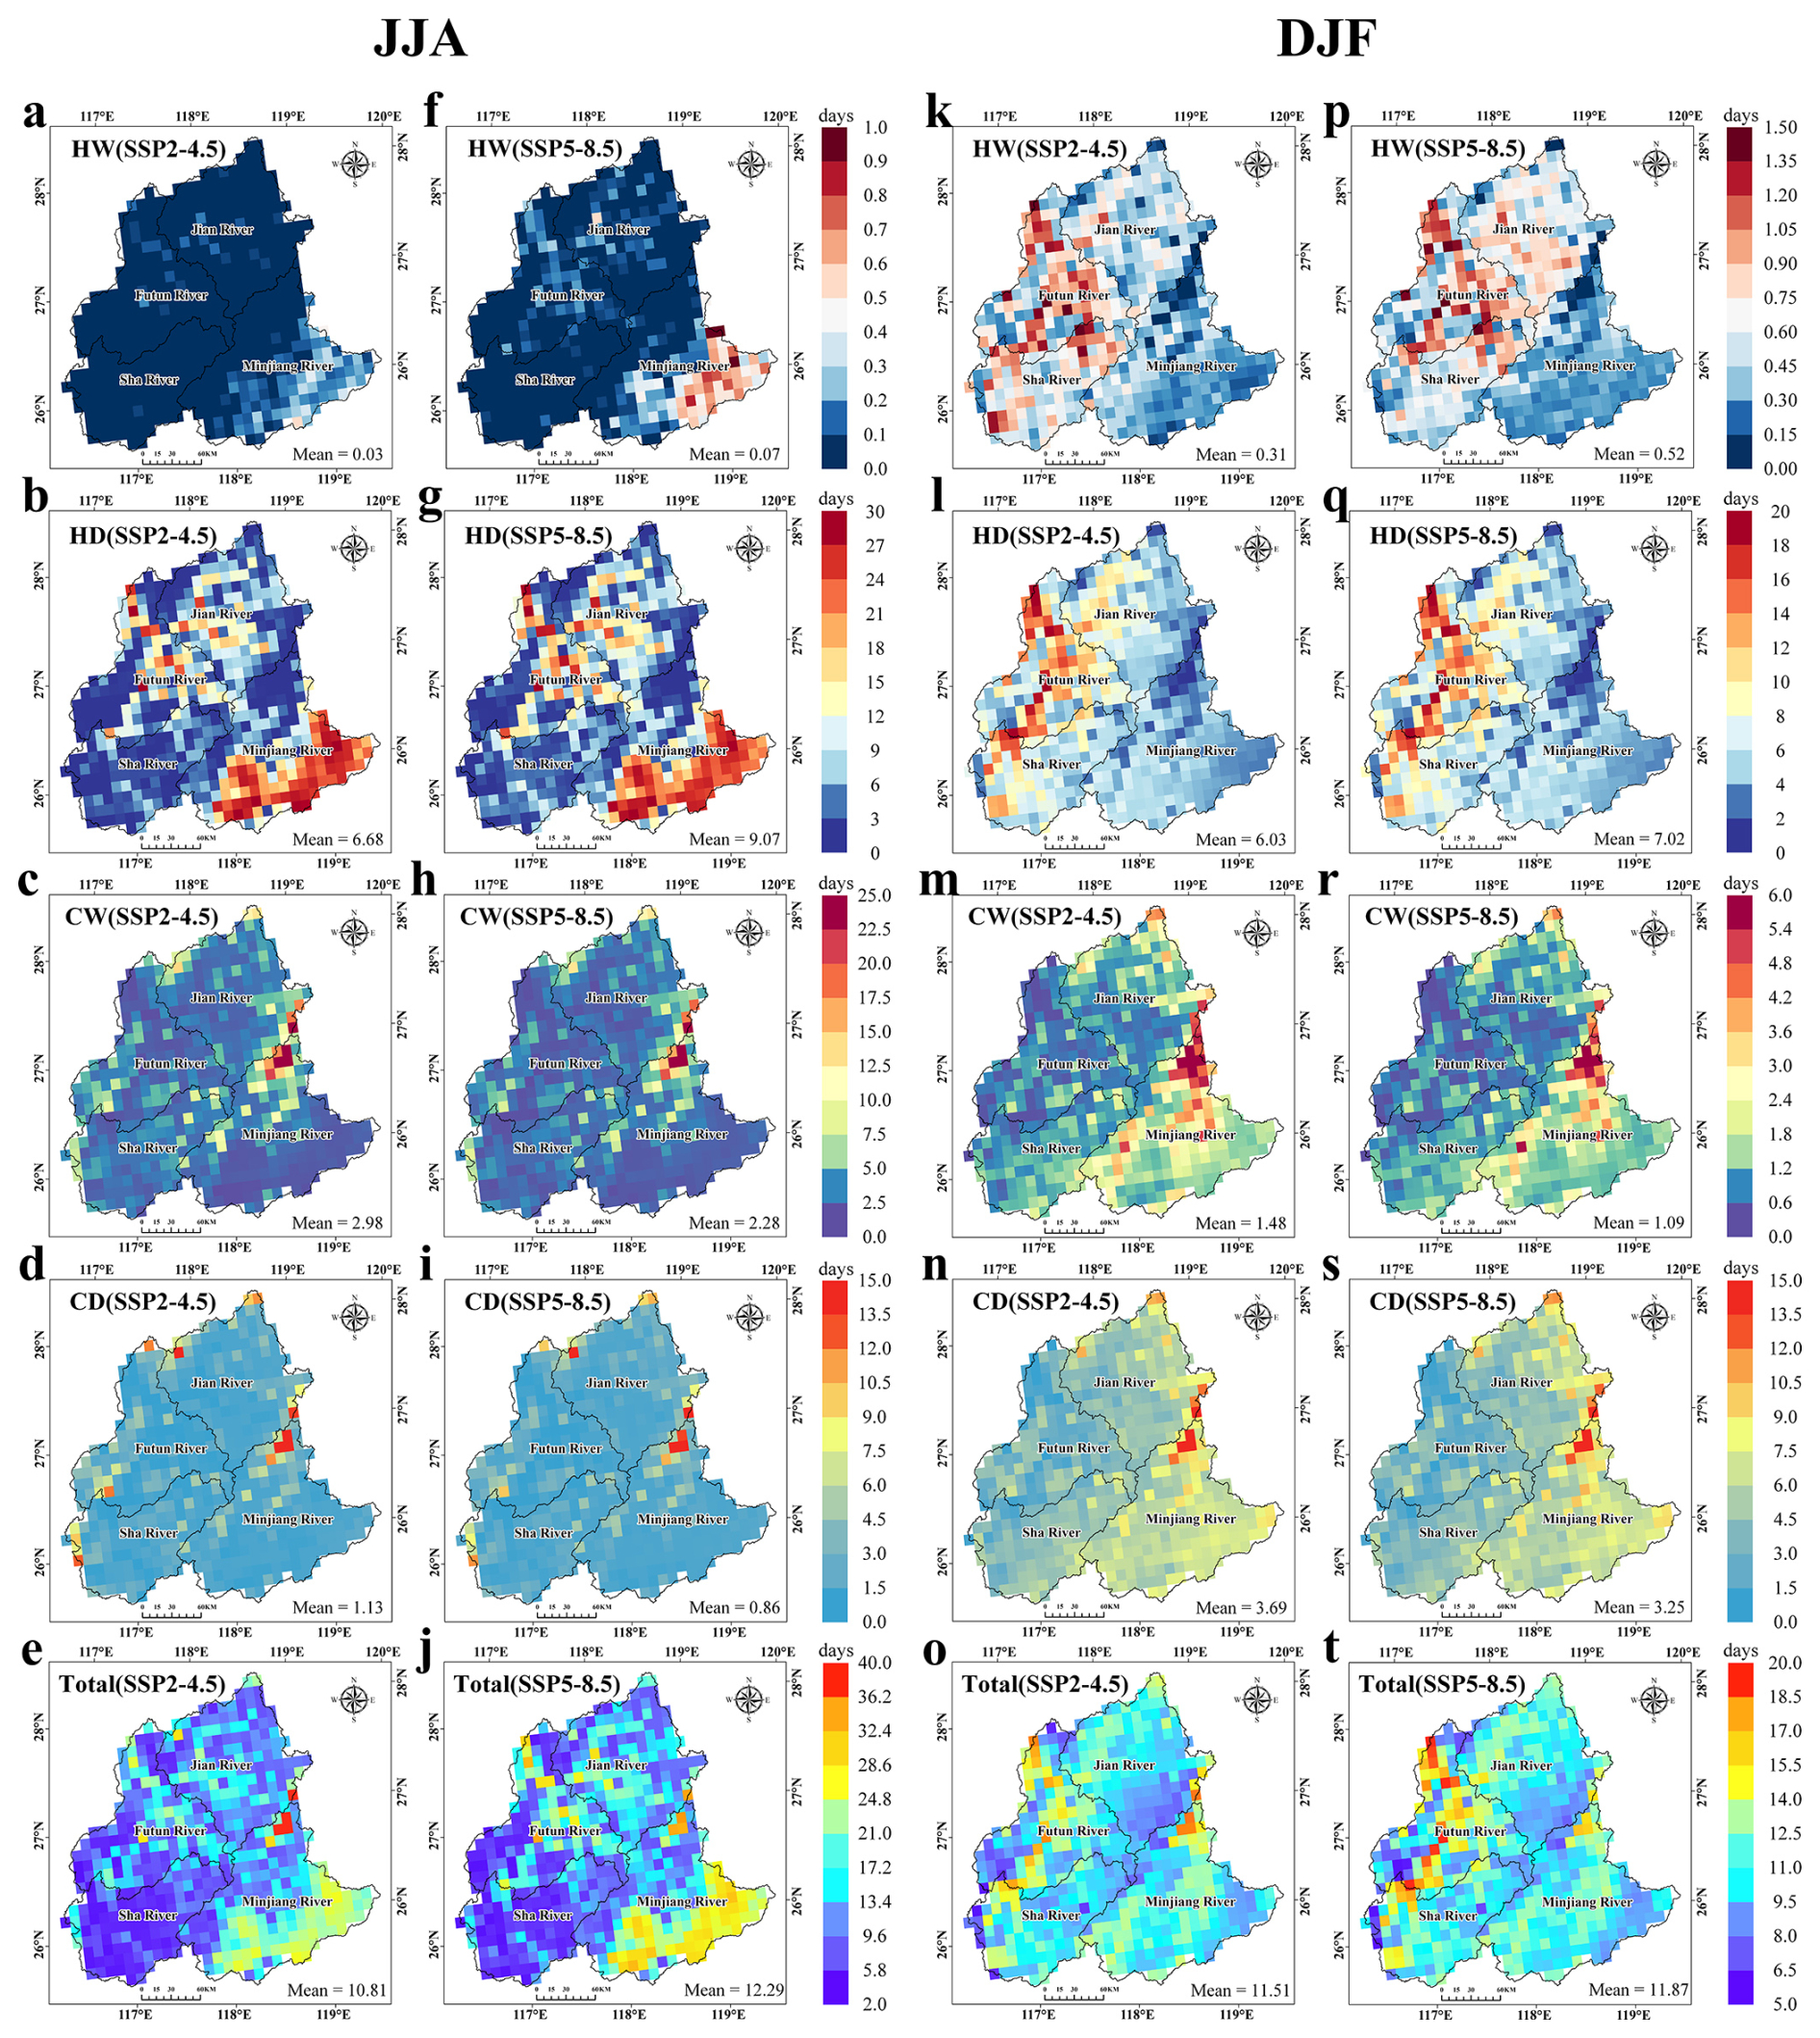
Figure 4Spatial patterns of CCEs in summer (JJA) and winter (DJF) across the MRB from 2025 to 2065.
Building on the analysis of annual changes, we further investigate the seasonal variations of CCEs. As shown in Fig. 4a–j, the spatial distribution of summer CCEs largely resembles the annual pattern, except for HW, which remain infrequent in this season. Nonetheless, a marked increase in HW under the SSP5-8.5 is observed in the downstream MRB. In summary, total CCEs increase during summer under both scenarios, rising more rapidly under SSP5-8.5 (2.26 d per decade) than under SSP2-4.5 (0.79 d per decade). Moreover, differences between scenarios are more pronounced for hot-related extremes (HW and HD) in summer than on the annual scale, whereas cold-related events (CW, CD) show consistent patterns (Fig. 5a–e).
In winter, CCEs exhibit a contrasting spatial distribution (Fig. 4k–t). They occur predominantly in the western MRB, particularly concentrated in the Futun River Basin, with higher frequencies under SSP5-8.5 (11.87 d) than under SSP2-4.5 (11.51 d). This shift is primarily driven by hot-related extremes (HW and HD), which move from the downstream MRB toward western mountainous areas. Meanwhile, cold-related extremes (CW and CD) remain most frequent in the Jiufeng Mountain areas. Winter CCEs show an increasing trend under SSP5-8.5 (0.76 d per decade) but a slight decreasing trend under SSP2-4.5 (Fig. 5f–j). Among individual event types, wet-related extremes (CW and HW) show insignificant trends, whereas HD increases (1.18 and 0.46 d per decade under SSP5-8.5 and SSP2-4.5, respectively) and CD deceases (−0.50 and −0.70 d per decade under the two scenarios).
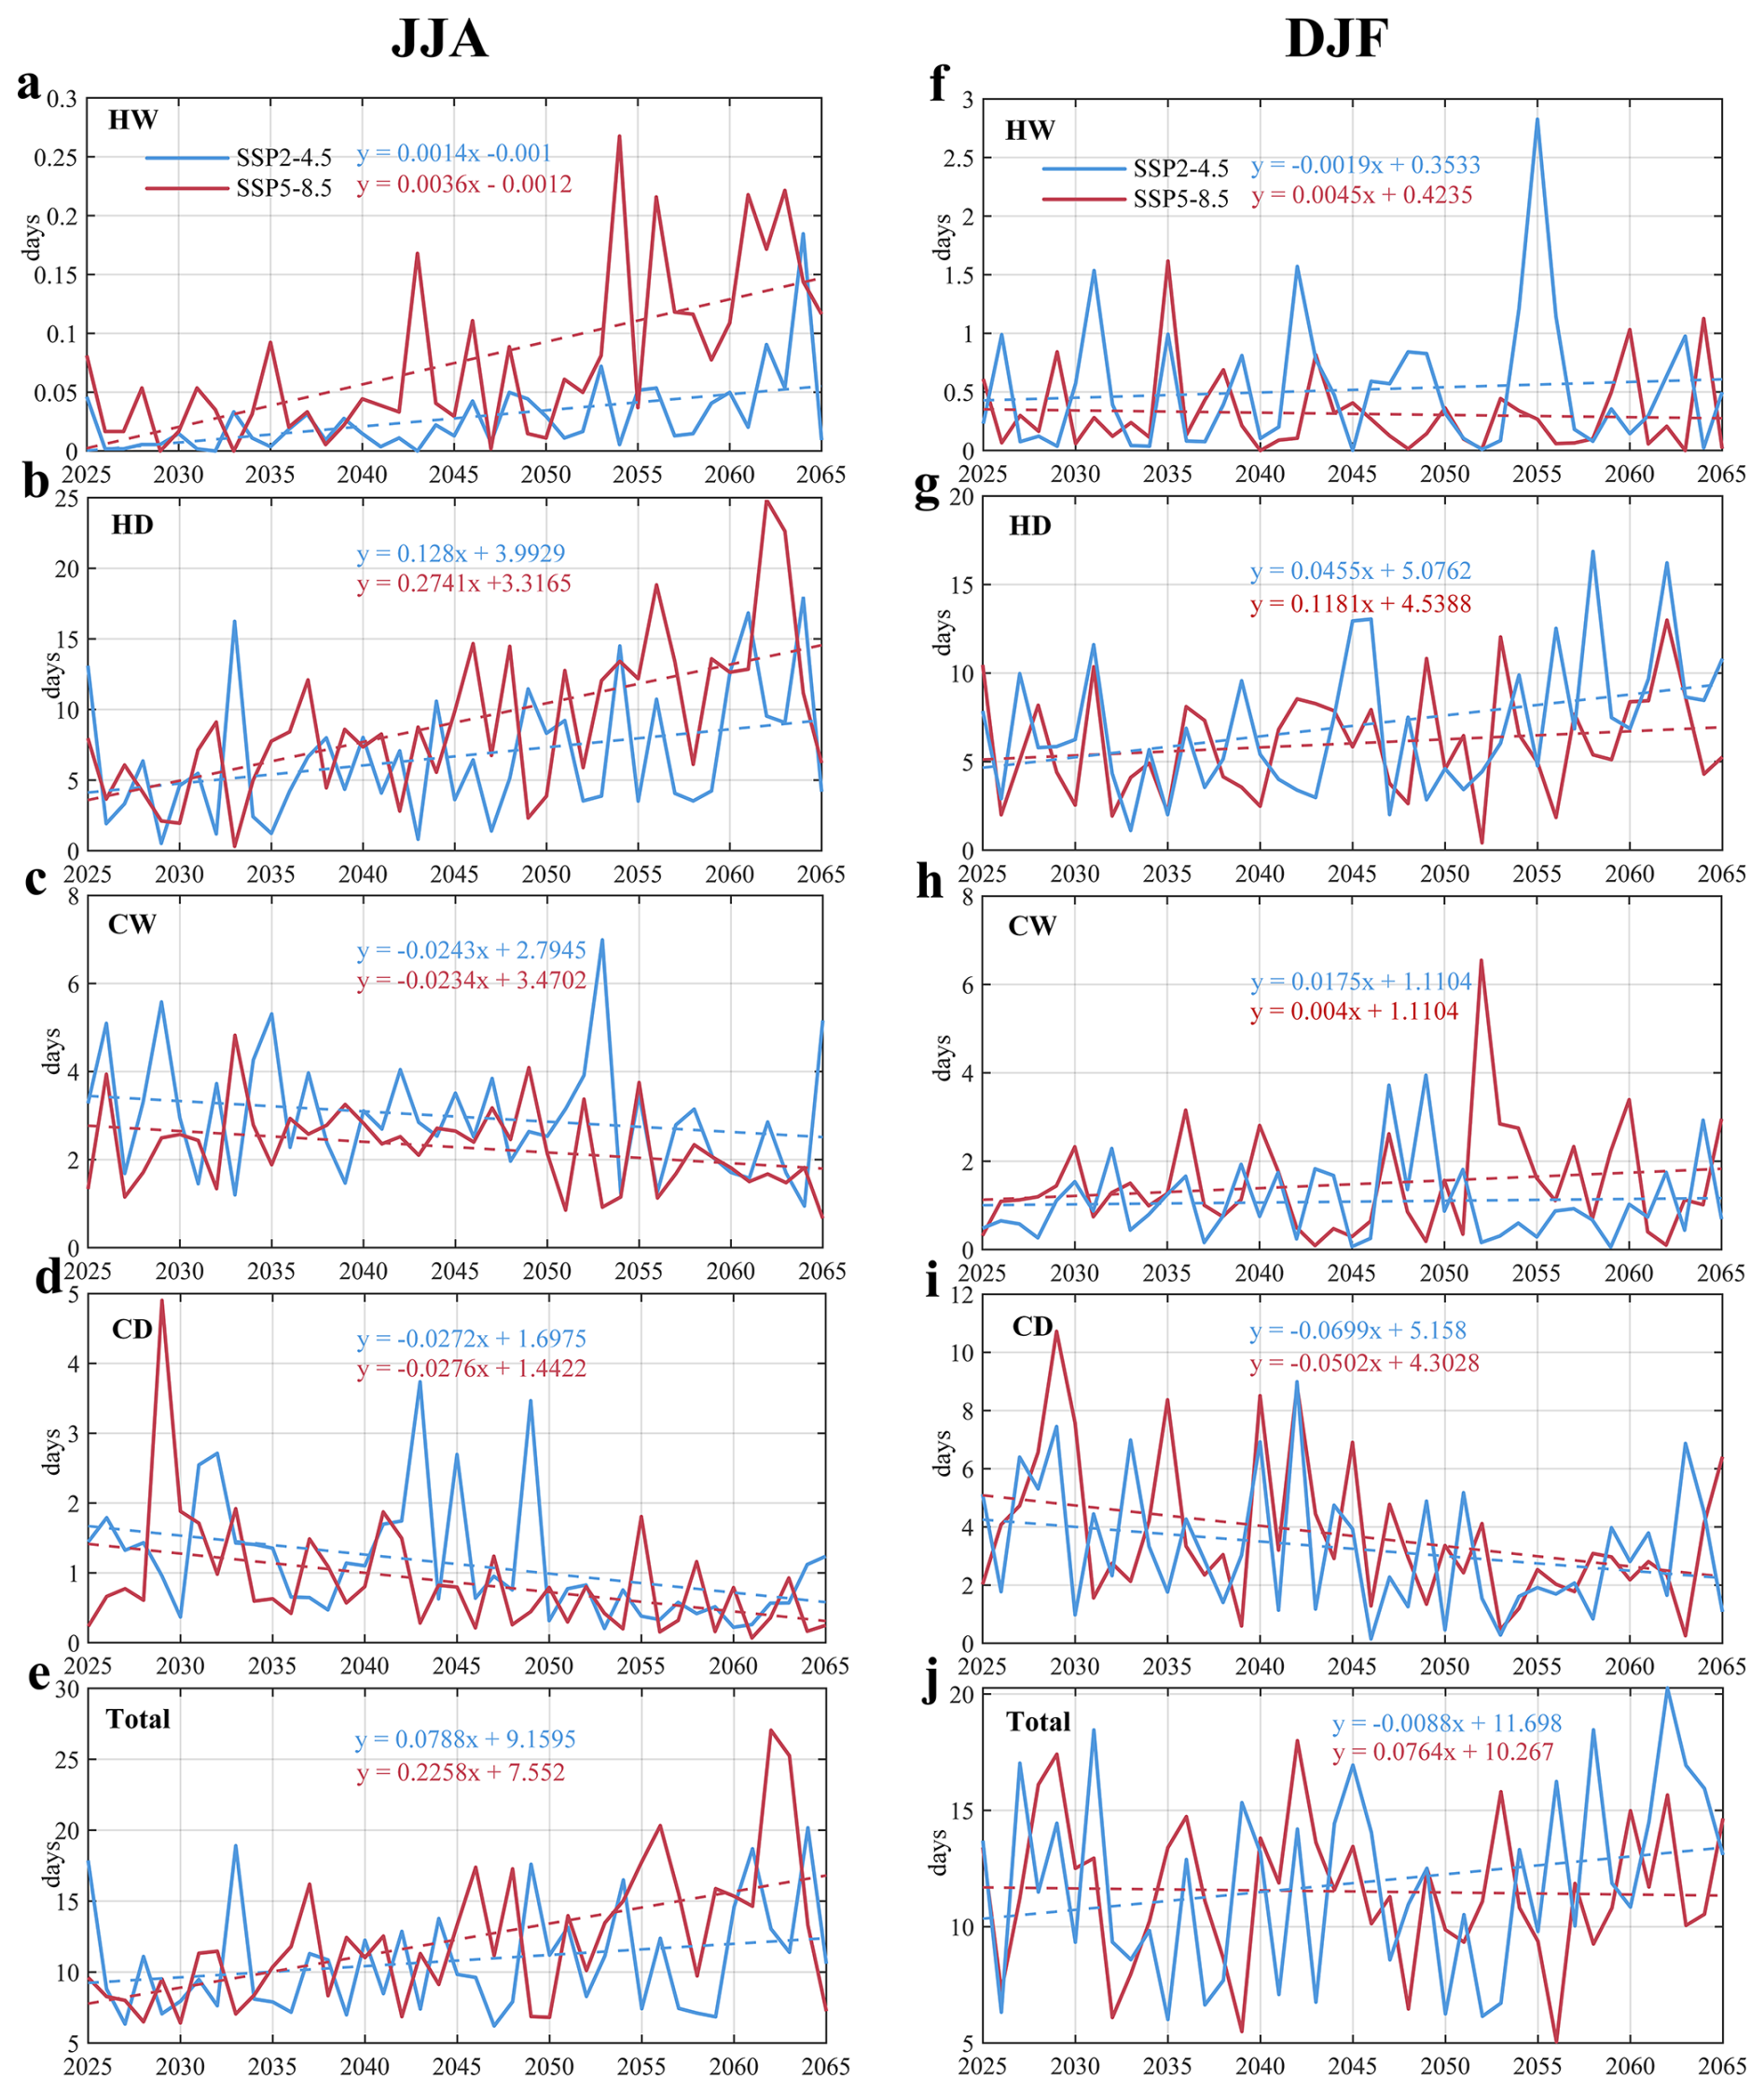
Figure 5Temporal patterns of CCEs in summer (JJA) and winter (DJF) across the MRB from 2025 to 2065.
Given the importance of precipitation and temperature as key climate indicators, we calculate their basin-averaged annual values and interannual trends (Supplement Fig. S5). Precipitation varies only slightly, maintaining relatively stable annual fluctuations. In contrast, temperature shows a distinct upward trend, which accelerates under high-emission SSP5-8.5 conditions (0.46 °C per decade). These results suggest that changes in CCEs across the MRB are primarily governed by temperature-driven physical processes – where intensifying hot extremes coincide with declining cold extremes – a conclusion supported by earlier studies (Wu et al., 2020; Zhao et al., 2024; Duan et al., 2024).
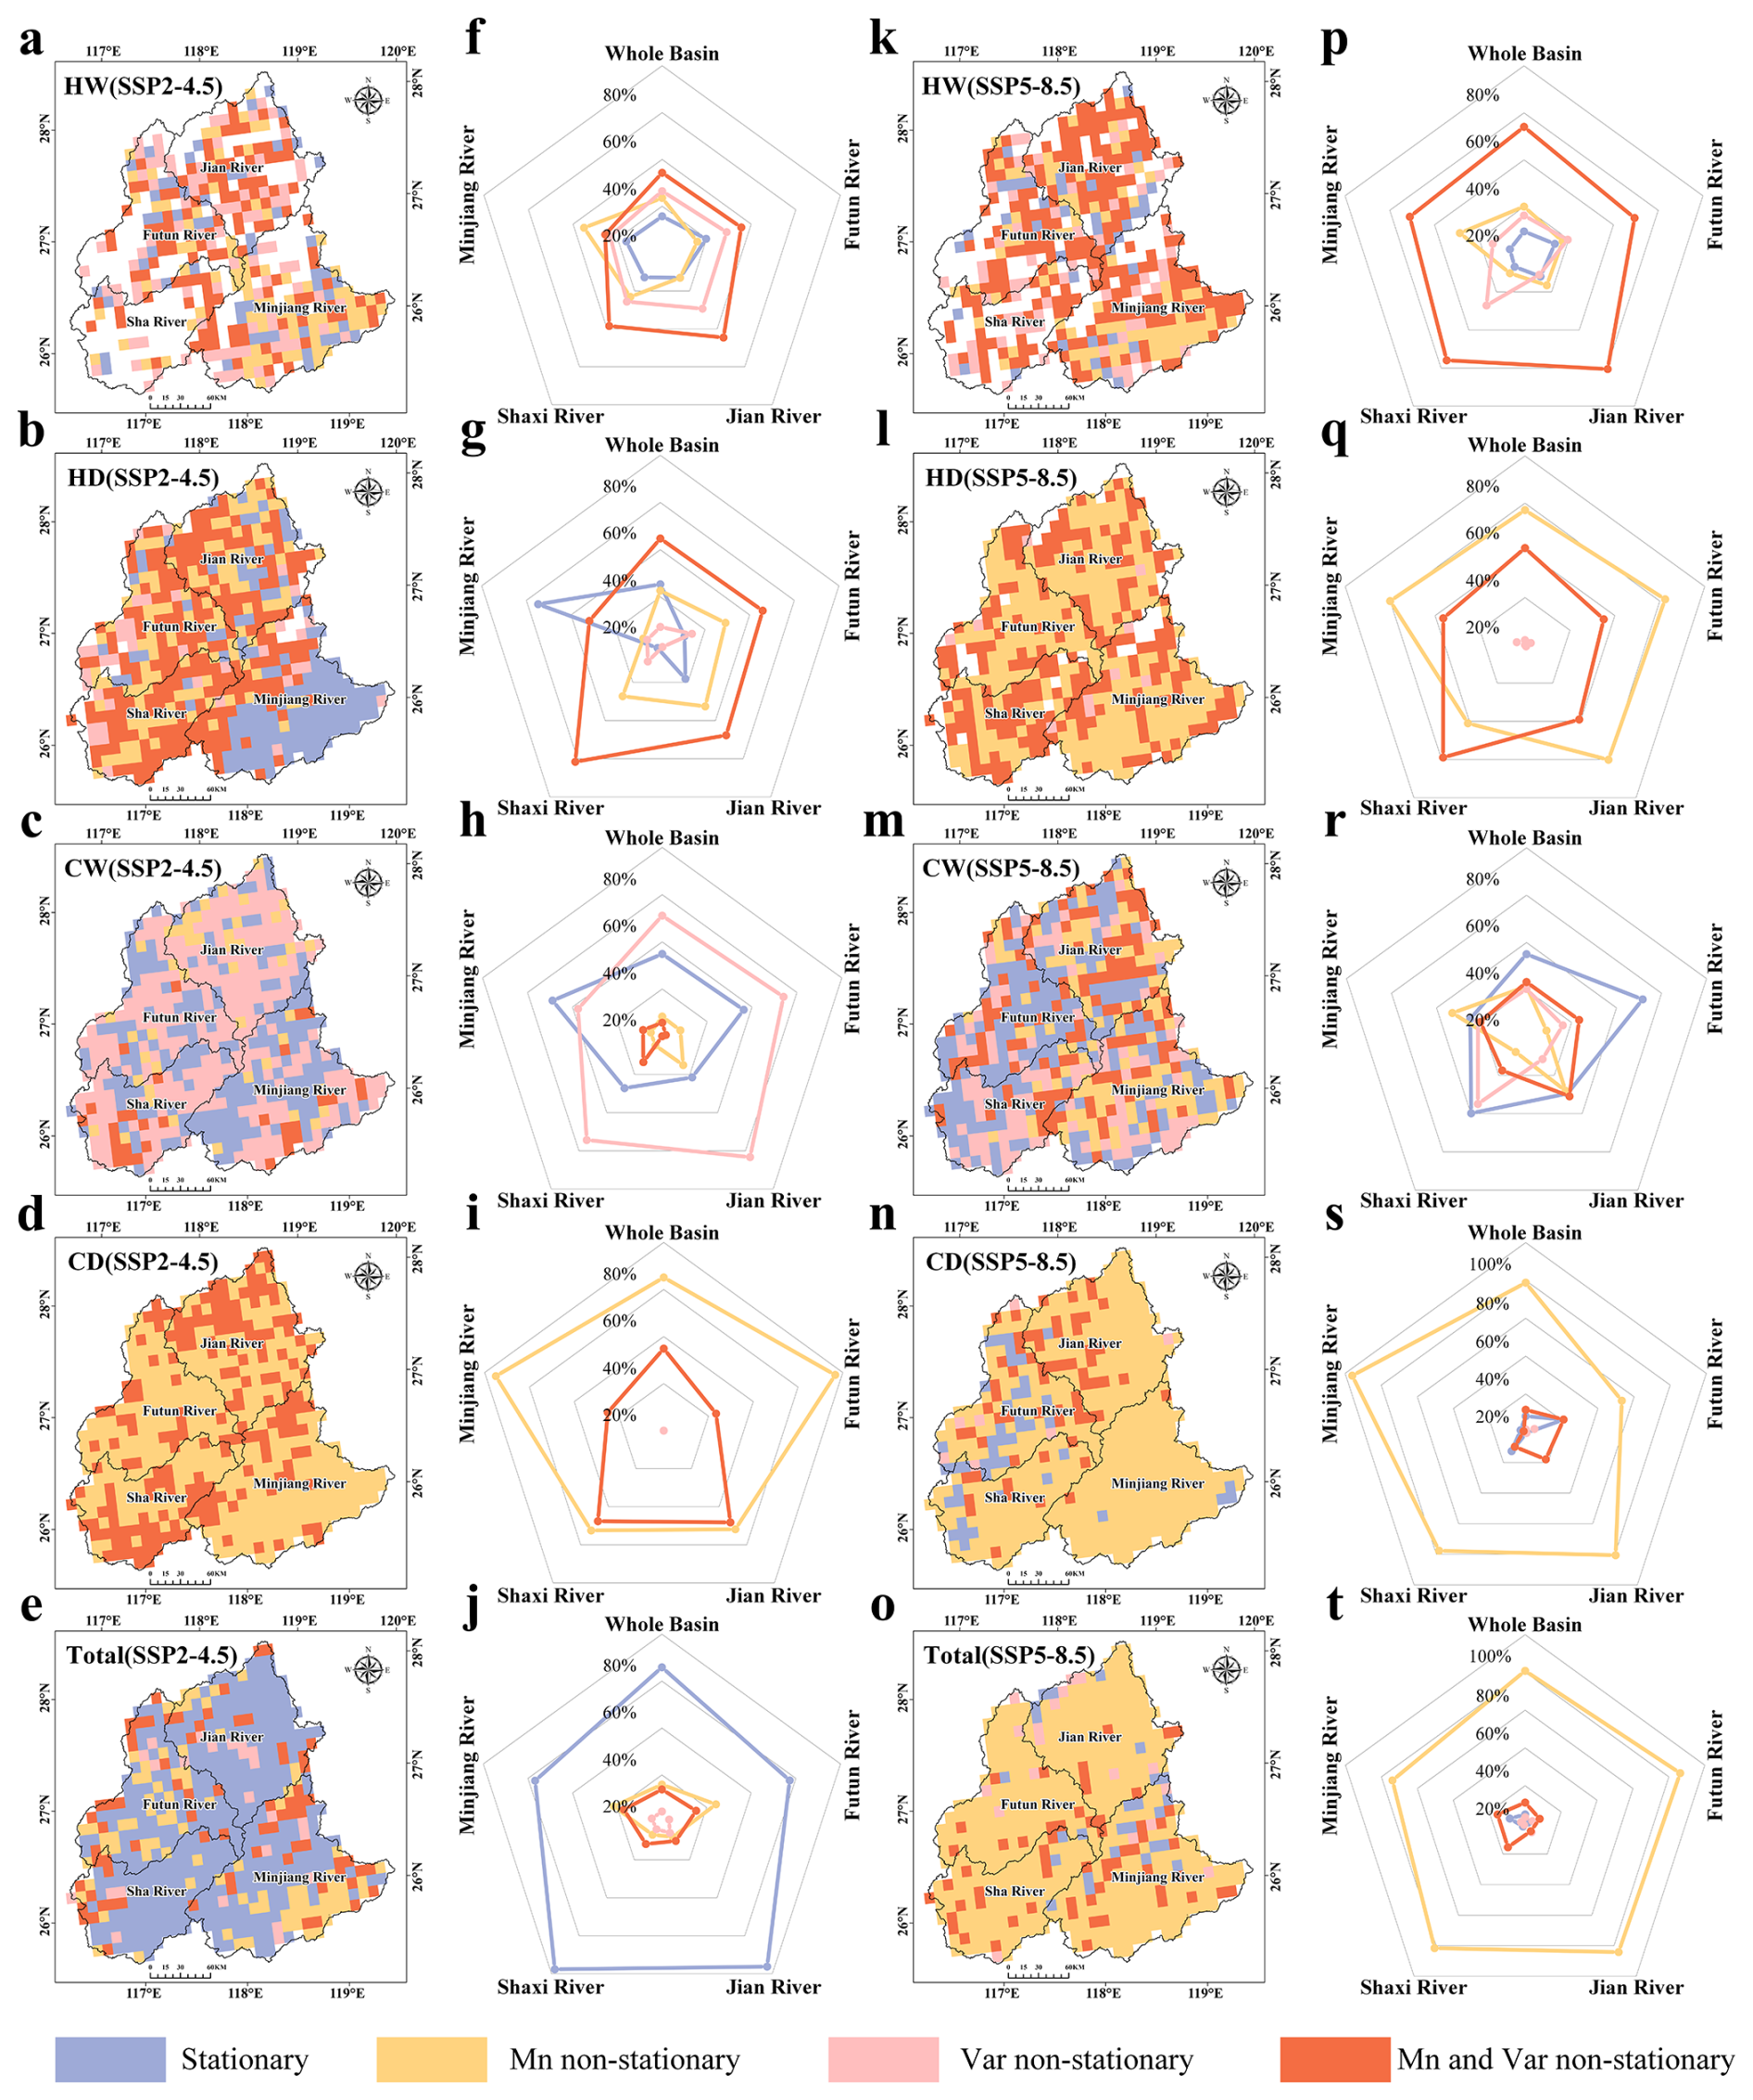
Figure 6Stationary and non-stationary characteristics for CCEs in the MRB (a–e, k–o), percentage of non-stationary and stationary characteristics across five basins (f–j, p–t).
3.2 Non-stationary characteristics of CCEs
To quantify the non-stationary characteristics of CCEs, we analyze variations in both the mean (Mn) and variance (Var) using GAMLSS (Fig. 6). The model demonstrates excellent fitting performance for all indices except HW, as indicated by Filliben coefficients exceeding 0.95 in Fig. S6.
Our results reveal a pronounced shift from stationary to non-stationary behavior in CCEs under SSP5-8.5 compared to SSP2-4.5. This shift is primarily driven by non-stationarity in Mn, which governs 80.81 % of grid cells across the MRB. An additional 11.07 % of grids are influenced by the combined effects of both Mn and Var, primarily distributed in the Shaxi River Basin and the downstream MRB. Dry-related extremes (HD and CD) show a transition from Var to Mn non-stationarity. For HD, the area dominated by Mn non-stationarity expands from 22.65 % to 57.03 % of grids, becoming the prevailing pattern (covering 60 % of grids) in downstream regions where stationarity was previously dominant (54.71 %). Similarly, Mn non-stationarity for CD expands to cover nearly the entire downstream MRB. For wet-related extremes (HW and CW), both Mn and Var non-stationarity increase notably. The area dominated by Mn non-stationarity for HW rises from 34.30 % to 54.02 % of grids, while for CW, it undergoes a more substantial increase from 0.06 % to 23.25 %. Overall, CCEs under SSP5-8.5 display more widespread non-stationarity, with dry-related extremes primarily governed by changes in Mn, whereas wet extremes are influenced by a combination of Mn and Var effects.
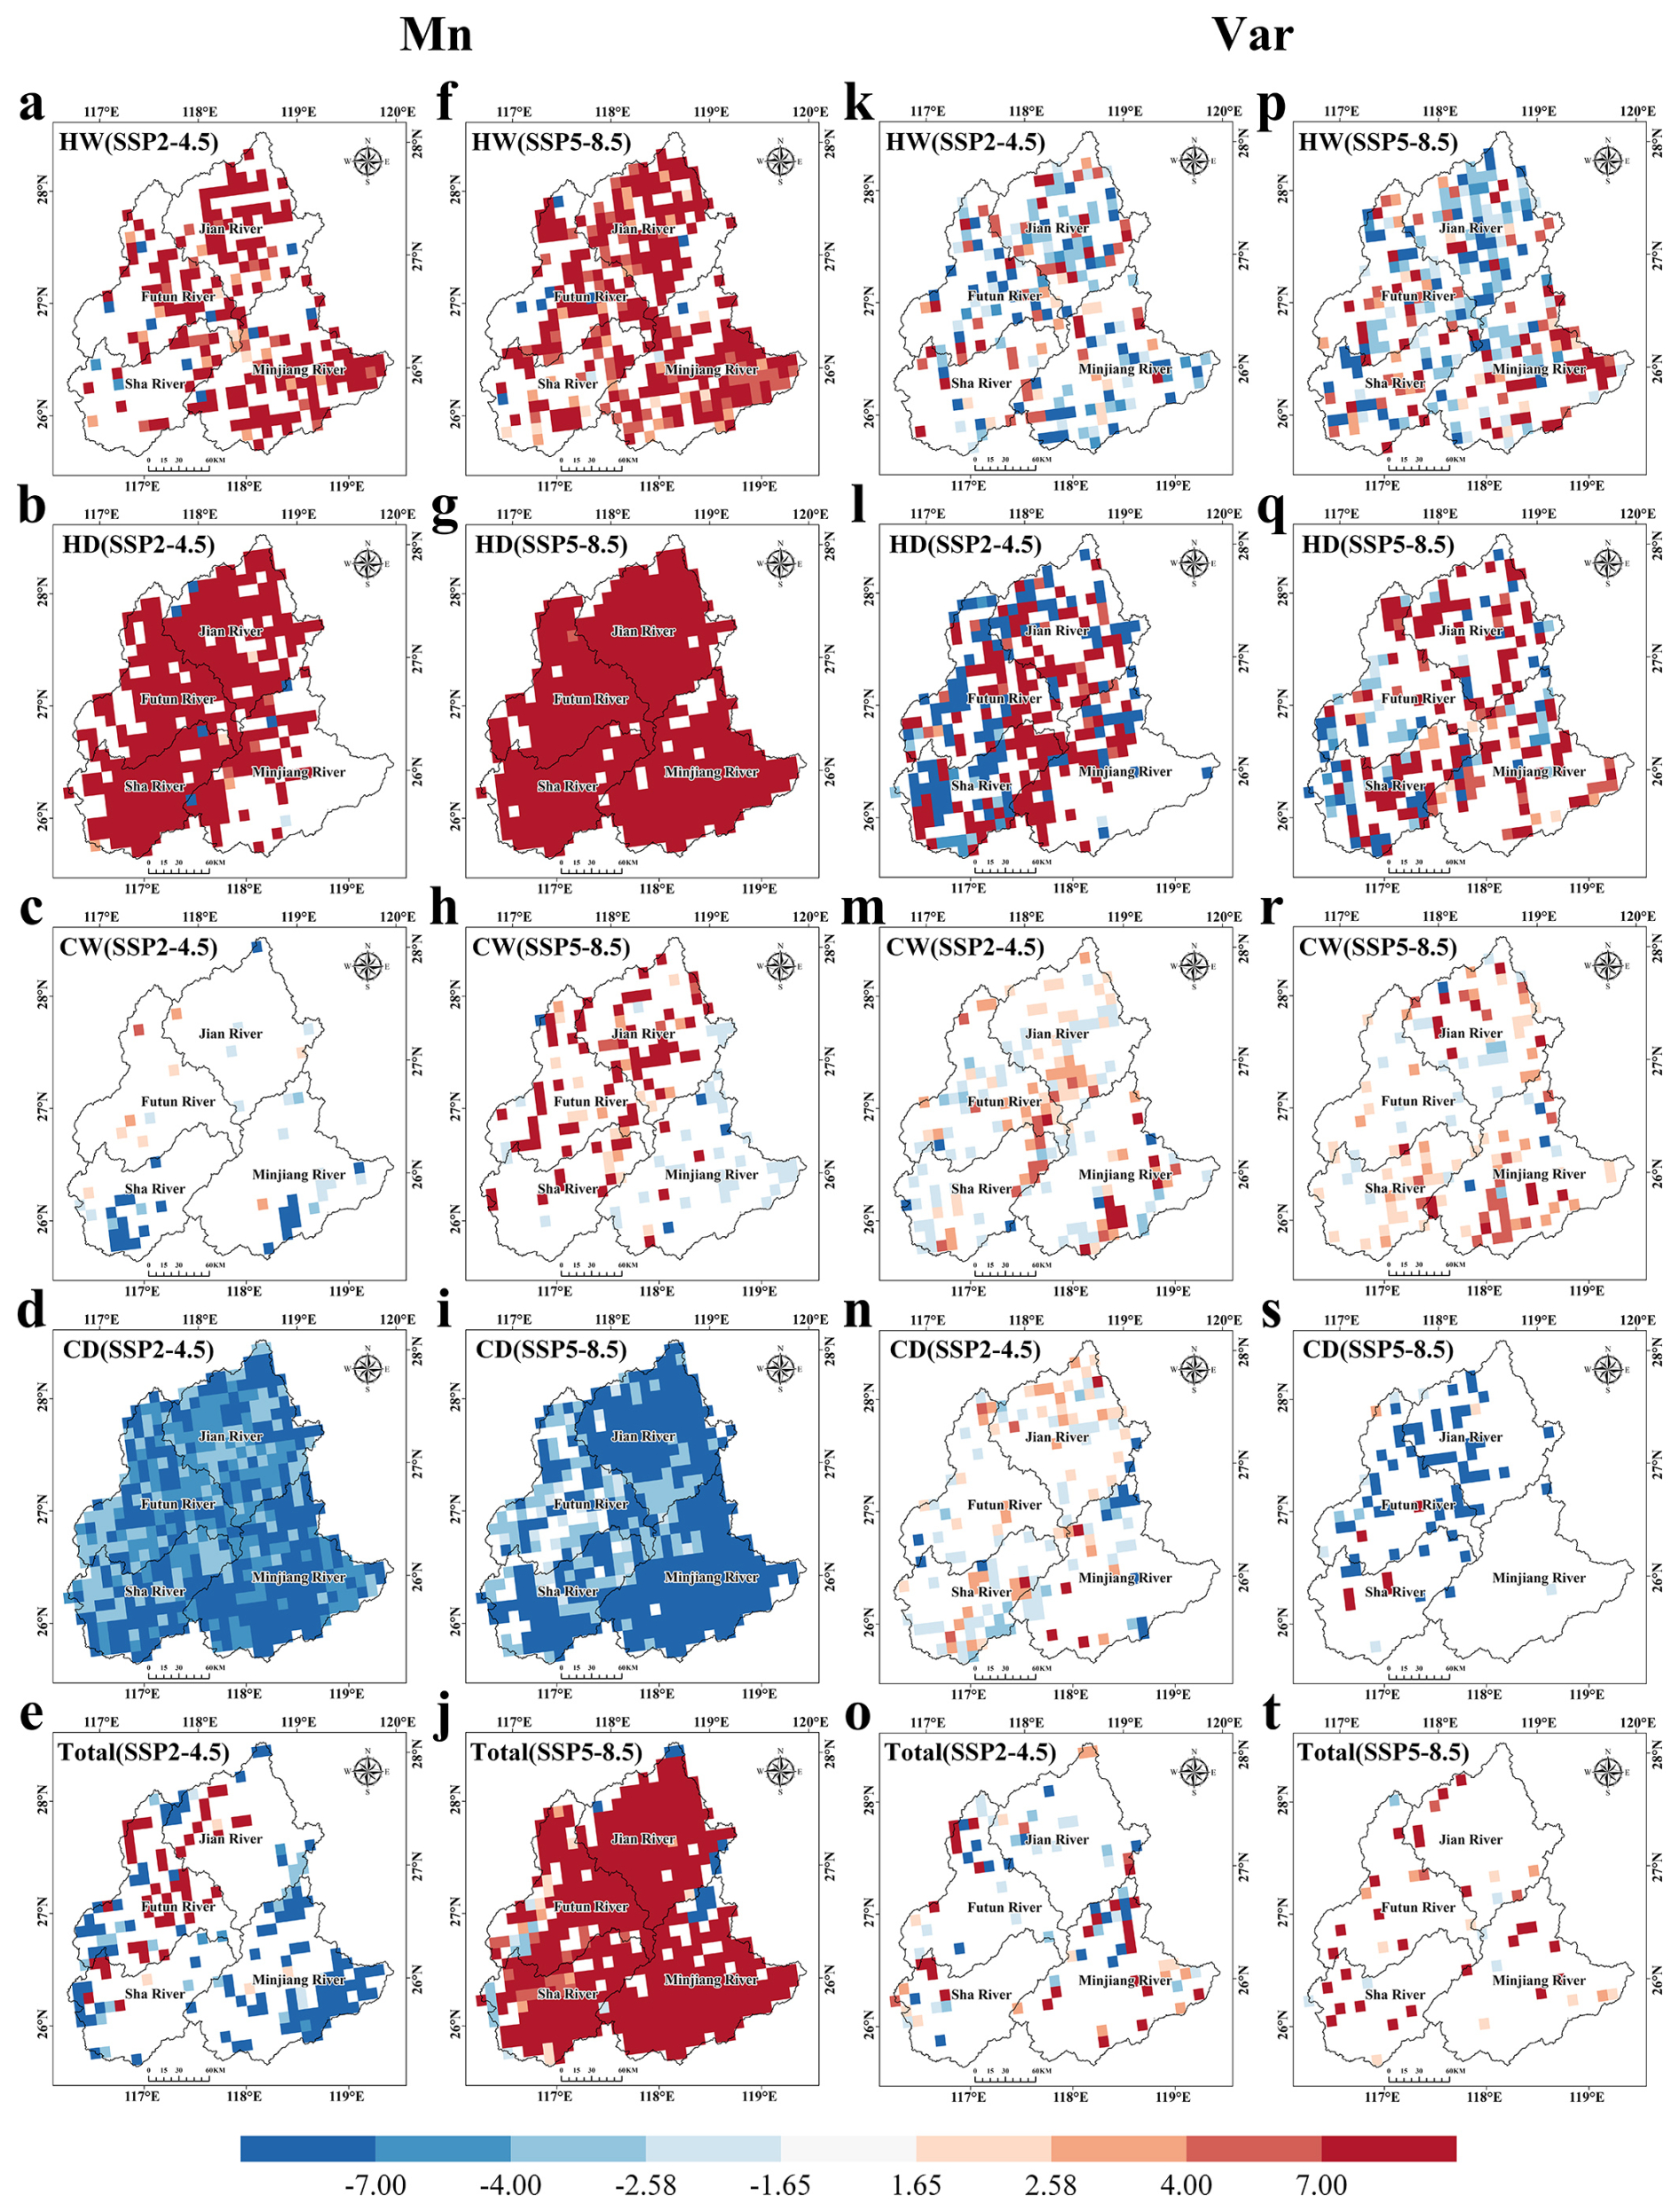
Figure 7Results of Mann-Kendall test for Mn (a–j) and Var (k–t), showing the spatial distribution of Z values. Z values indicate trend significance: denotes 90 % confidence, while corresponds to 99 % confidence.
Figure 7 further details the spatial patterns of Mn and Var in CCEs. Compared to Var, Mn exhibits more pronounced and spatially extensive variations. For hot-related extremes (HW and HD), Mn increases significantly across the entire basin under both SSP2-4.5 and SSP5-8.5 (at the 99 % confidence level), indicating that climate warming predominantly amplifies the mean frequency of hot-related extremes rather than their temporal variability. For cold-related extremes, CD exhibits more stronger changes than CW, which are also predominantly driven by reduction in Mn. Under SSP5-8.5, Mn for most CCEs increases significantly across nearly the entire basin, while under SSP2-4.5, it remains relatively stable. In contrast, Var exhibits only minimal changes under both scenarios.
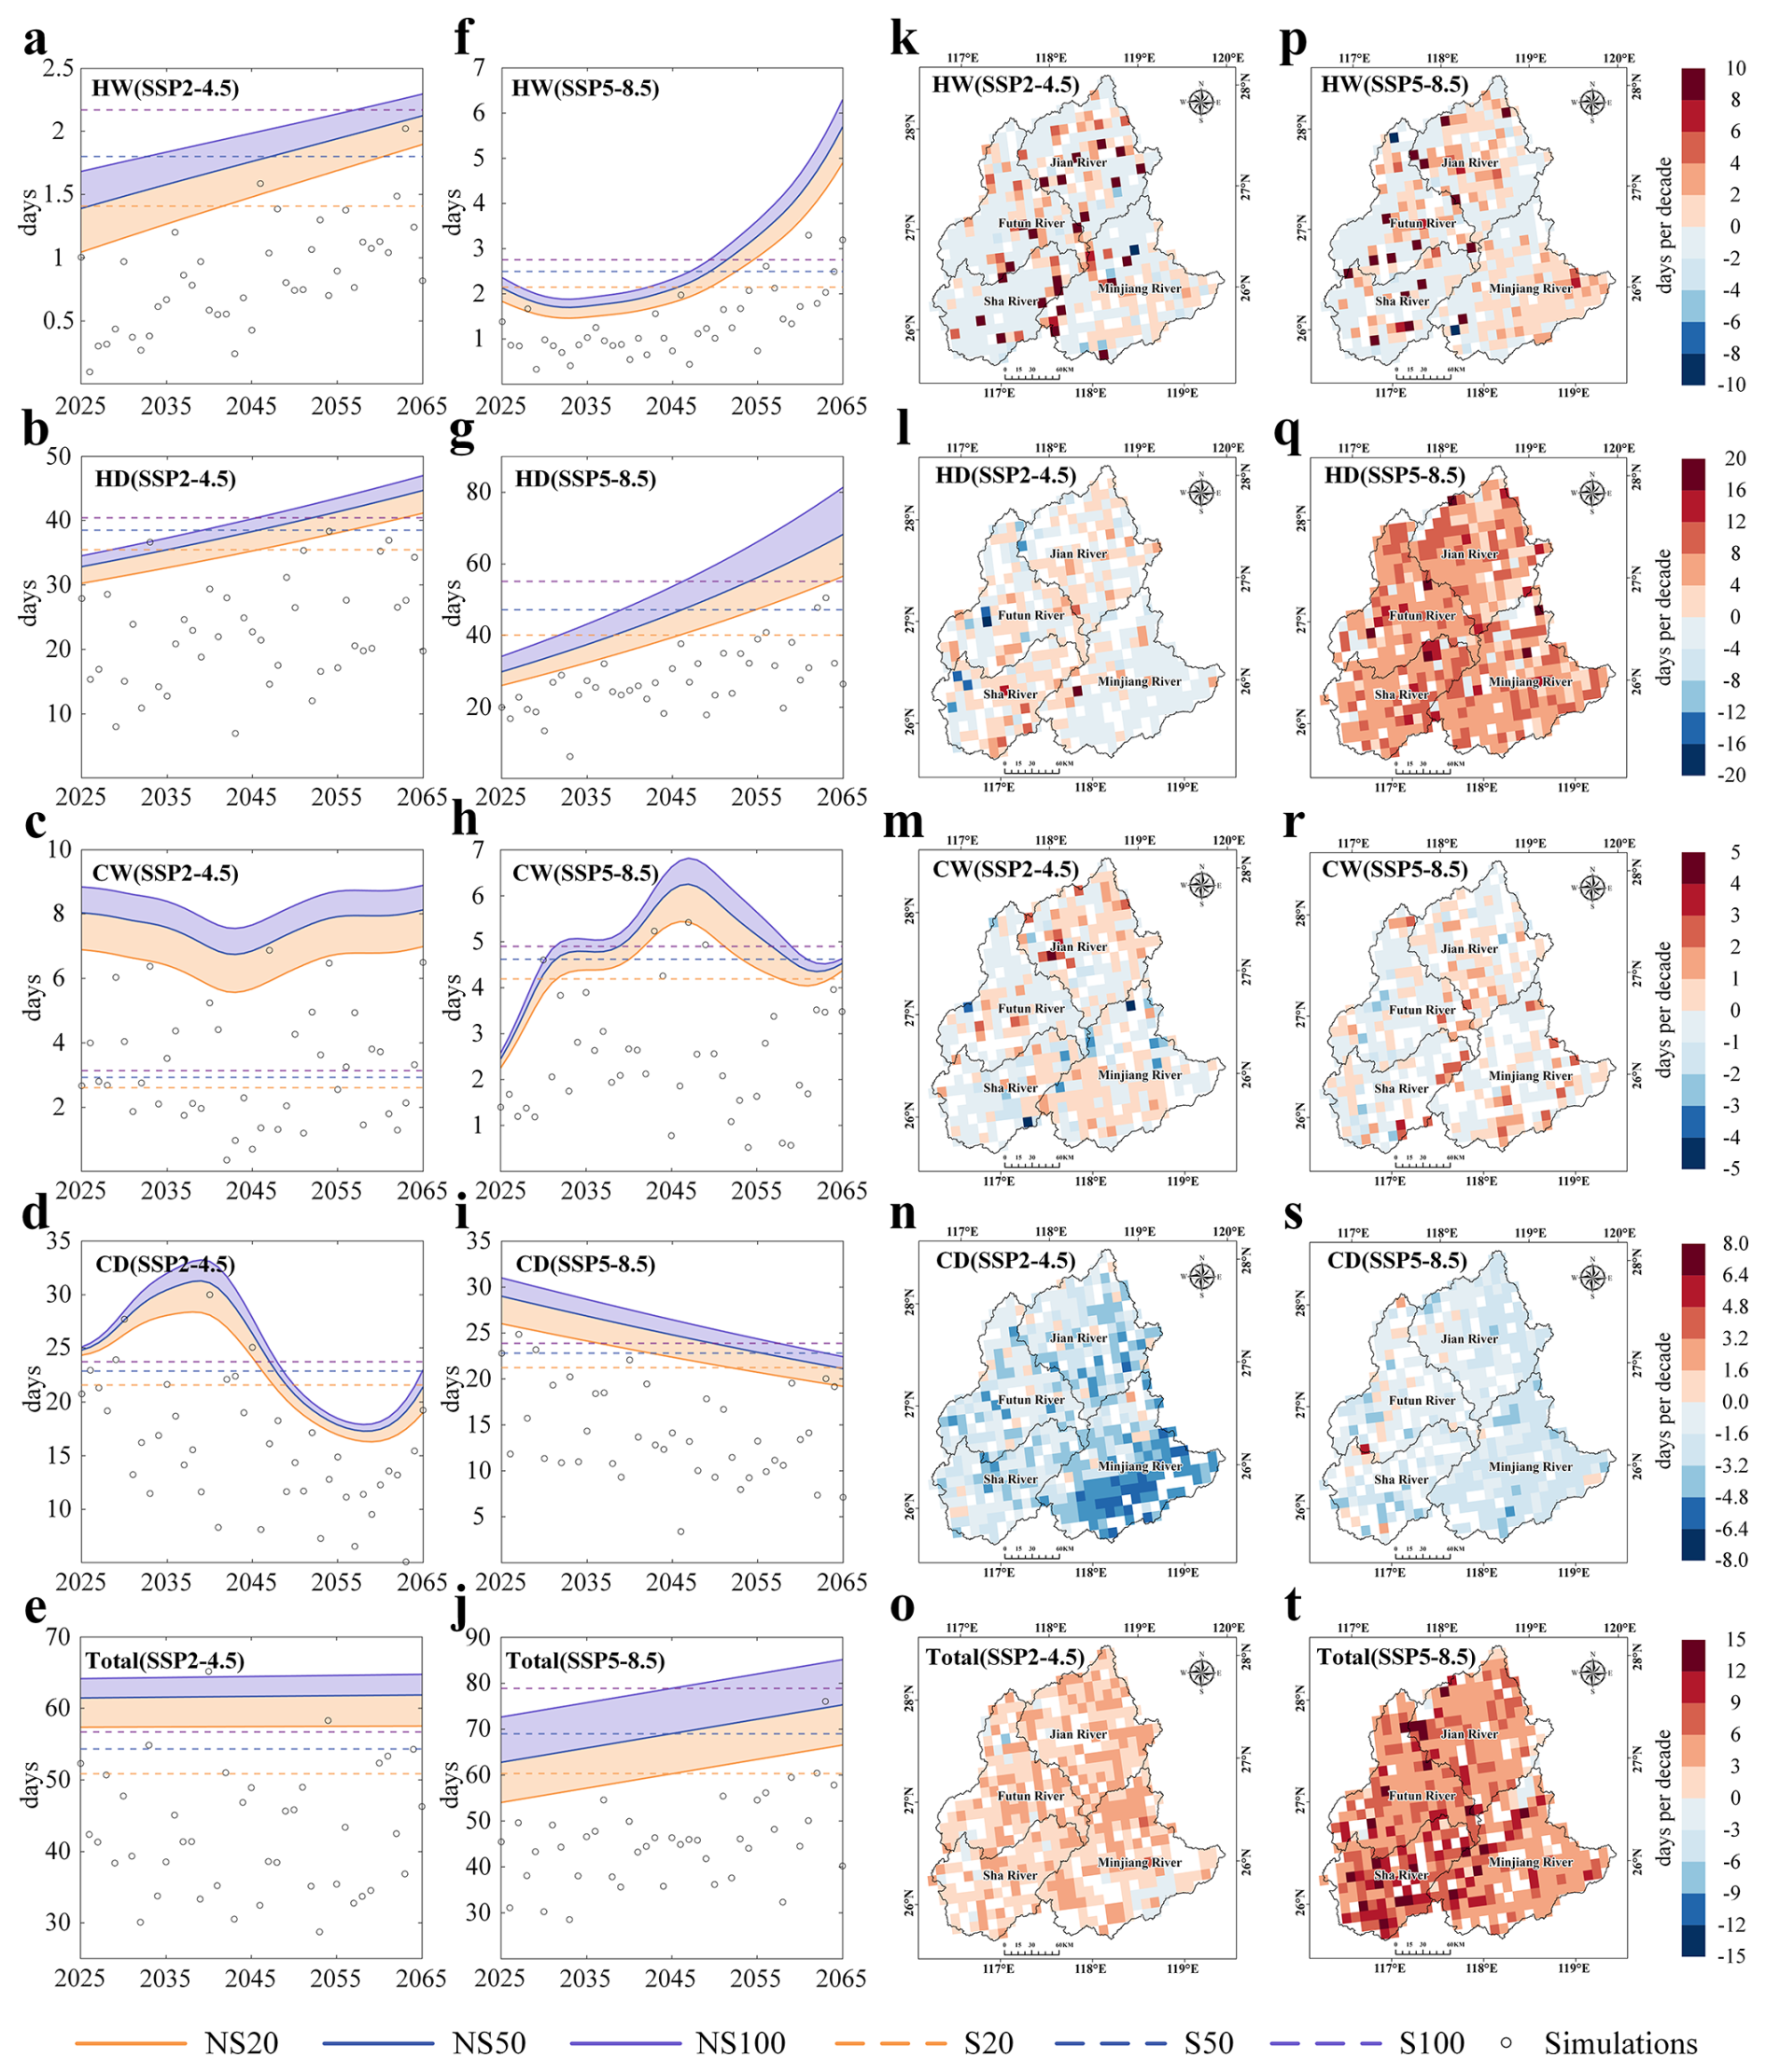
Figure 8Comparison of non-stationary (NS) and stationary (S) characteristics for CCEs under 20-, 50-, and 100-year return periods (a–j). Spatial distributions of trends in CCEs under 100-year return periods (k–t), 20- and 50-year return period result are provided in Fig. S7. Blank areas indicate grid points that failed to pass the 99 % confidence test.
3.3 Changes in the recurrence frequency of CCEs
To assess changes in the recurrence frequency of CCEs, we fit both stationary and non-stationary models. As shown in Fig. 8a–j, substantial differences emerge between the return periods estimated under stationary versus non-stationary assumptions. Our results reveal that stationary models systematically underestimate the future recurrence frequency of CCEs, whereas non-stationary models reasonably capture their time-evolving characteristics. This underestimation gap widens notably over time.
Under SSP5-8.5, non-stationary projections indicate significant increases in the frequency of CCEs corresponding to 20-, 50-, and 100-year return periods. For instance, total CCEs with a 100-year return period are projected to increase at a rate of 3.12 d per decade. Stationary models consistently underestimate CEE frequency after around 2045. Specifically, HW, HD, and CW all show positive trends in recurrence frequency under SSP5-8.5 with increases of 0.36, 11.65, and 0.30 d per decade, respectively. Under SSP2-4.5, the corresponding increases are lower (0.15, 2.53, and 0.06 d per decade). In contrast, CD exhibits a decreasing trend, with a more rapid decline under the SSP2-4.5 (−3.38 d per decade) than under SSP5-8.5. The 100-year return events display greater sensitivity to climate change, highlighting amplified non-stationary effects on these high-impact extremes.
We further quantify the deterministic trends in recurrence frequency using Empirical Mode Decomposition (EMD, Sect. S1). Figure 8k–t present the variations in the 100-year recurrence frequency (complete results for all return periods are provided in Fig. S7). Overall, CCE frequency shows strong upward trends under SSP5-8.5, with significant spatial heterogeneity. Frequency generally decreases from west to east, with notably high-value areas concentrated in the Shaxi River Basin (exceeding 12 d per decade in some grids). Among all indices, HD exhibits the most severe increase, with basin-wide trends exceeding 8 d per decade. CD is the only index showing a decreasing trend under both scenarios, with a less pronounced decline under SSP5-8.5, suggesting that greenhouse warming has only partially offset the reduction in CD recurrence frequency.
Although earlier research has emphasized the necessity of analyzing extreme events under non-stationary conditions (Cheng et al., 2014; Byun and Hamlet, 2020; Liu et al., 2024b), the evolution of CCEs within a non-stationary climate remains lacking. Our study develops an innovative non-stationary framework integrating WRF-based dynamical downscaling with GAMLSS to reassess future recurrence frequency of CCEs. The results indicate that traditional stationary models systematically underestimate the frequency of CCEs, highlighting the critical importance of incorporating time-varying risk assessments to avoid misleading projections and to inform robust climate adaptation strategies (Abdelmoaty and Papalexiou, 2023). This innovative framework enables regional-scale reassessment of CCEs which is transferable to other regions.
4.1 Dominance of hot extremes and temperature-driven shifts
The projected increase in CCEs, particularly under SSP5-8.5, aligns with global trends of intensifying hydroclimatic risks under continued warming (Asadieh and Krakauer, 2017; Zhang et al., 2021b; Shu et al., 2024). Our findings indicate that hot-dry extremes dominate both spatially and temporally, increasing at 2.26 d per decade in summer under SSP5-8.5, while cold extremes decline. This pattern is consistent with studies highlighting the rising prevalence of hot-stagnation and hot-dry extremes in East Asia (Yin et al., 2025). In particular, across China, hot–dry extremes are projected to double by 2050 under high-emission scenarios (Yao et al., 2024). Guo et al. (2023) also revealed that under global warming, extreme hot conditions are projected to dominate most regions of China, with some areas experiencing more than 50 extreme hot days. Moreover, there is evidence suggesting that both compound hot–dry and compound hot–wet events are projected to increase significantly under future climate scenarios. Notably, compound hot–dry events exhibit substantially higher frequency, longer duration, and greater intensity than compound hot–wet events (Fang et al., 2025). The reversal between hot and cold extremes has been robustly linked to enhanced radiative forcing from anthropogenic greenhouse gas emissions (Samset et al., 2018; Kramer et al., 2021). Our analysis further reveals that temperature – not precipitation – is the primary driver of CCE changes in the MRB, as evidenced by the strong warming trend (0.46 °C per decade under SSP5-8.5) alongside relatively stable precipitation (Fig. S5). This supports the hypothesis that thermodynamic effects, rather than dynamic ones, dominate mean-state changes in extremes (Horton et al., 2016; Van Der Wiel and Bintanja, 2021). However, it should be emphasized that precipitation responses are often manifested through pronounced changes in intensity and intermittency, rather than in long-term totals alone (Du et al., 2022; Maity and Maity, 2022). In particular, warming can lead to a redistribution of precipitation toward shorter duration but more intense events, even in regions where mean precipitation exhibits statistically insignificant trends (Fowler et al., 2021). For HW events, these changes are closely linked to both thermodynamic and moisture-related processes. As global and regional temperatures rise, the atmosphere's moisture holding capacity increases at an approximate rate of 6–7 % °C−1, consistent with Clausius–Clapeyron scaling (O'Gorman and Muller, 2010; Ali et al., 2021). Previous studies have demonstrated that such moistening effects can substantially intensify CCEs, even in regions where average precipitation remains relatively unchanged (Gimeno et al., 2022; Zhang et al., 2024).
4.2 Non-stationarity: mean shifts outpace variability
A key advance of this study is the explicit detection of non-stationary characteristics in CCEs, which has been largely overlooked in prior compound event analyses. We find that under SSP5-8.5, 95.20 % of grid cells exhibit non-stationarity, predominantly driven by changes in the Mn rather than Var, accounting for 80.81 % of the transitions. This suggests that climate warming amplifies extremes primarily through shifts in baseline intensity – a thermodynamic effect – rather than through increased temporal variability. Similar findings have been reported at global scales, where mean warming dominates changes in extreme temperature distributions (Patel et al., 2024; Nordling et al., 2025). The spatial concentration of Mn-driven non-stationarity in downstream MRB and the Shaxi River Basin may reflect localized warming amplification due to urban heat islands or land-atmosphere feedbacks, a phenomenon noted in other subtropical regions (Gao et al., 2018; Wu et al., 2020).
4.3 Frequency of recurrence systematically underestimated by stationary model
Our comparison between stationary and non-stationary model indicates that the latter captures a significant increase in recurrence risks, particularly for 100-year CCEs, which are projected to rise by 3.12 d per decade under the SSP5-8.5 scenario. Stationary model systematically underestimates recurrence frequency after 2045, and the stronger non-stationary response of 100-year events highlights the heightened vulnerability of high-impact, low-probability extremes. Additionally, the west-to-east gradient in recurrence frequency, with hotspots in the Shaxi River Basin, may be attributed to topographic and land-surface heterogeneity, which modulate local hydroclimatic responses (Zheng et al., 2023). The projected increase in the frequency of 100-year CCEs has important implications for flood control and water resources management in the MRB, particularly in the middle and lower reaches and densely populated urban centers such as Fuzhou. The basin's complex topography and highly heterogeneous land cover amplify the spatial variability of rainfall and runoff, while low-lying urban areas in Fuzhou are particularly vulnerable to both pluvial and fluvial flooding. More frequent HW events are likely to produce intense, concentrated rainfall, rapidly depleting reservoir flood control capacity and increasing the likelihood of spillway activation, while simultaneously exacerbating urban inundation in flood prone districts (He et al., 2024). HD events may reduce river storage, but if followed by subsequent heavy rainfall, they can increase uncertainty in peak flows and place additional stress on flood management systems (Hariharan Sudha et al., 2024). Previous studies have similarly shown that conventional extreme value models fail to capture the escalating severity of extreme events under climate change. Singh et al. (2021) demonstrated that under climate change, precipitation and temperature exhibit a non-stationary dependent structure, and treating them independently can substantially underestimate the occurrence of compound extremes. Feng et al. (2020) compared the recurrence probabilities of floods under stationary and non-stationary conditions and found that, under non-stationary conditions, the annual variability of floods is significantly greater. Xu et al. (2025) evaluated changes in global marine heatwaves and found that stationary models significantly underestimate their frequency, intensity, and duration. In summary, these studies collectively highlight that accounting for non-stationarity is crucial for accurately assessing various extreme events.
4.4 Methodological limitations
Our integrated “bias-corrected CMIP6–WRF dynamical downscaling–GAMLSS” framework represents a significant methodological advancement over the direct use of purely statistical downscaling for projecting CCEs. By resolving mesoscale circulations and explicitly simulating convective processes, our approach more faithfully captures the fine-scale spatiotemporal heterogeneity of precipitation and temperature fields in complex terrain, a capability that statistical methods, reliant on historically derived statistical relationships, fundamentally lack (Gutmann et al., 2012; Rahimi et al., 2024). Nevertheless, certain limitations persist. Even at convection-permitting resolution (3 km), the WRF model exhibits systematic biases in simulating orographic precipitation, a well-documented challenge often stemming from uncertainties in microphysical parameterization schemes and the representation of land-atmosphere energy and moisture exchanges over mountainous regions (Talbot et al., 2012; Zhang et al., 2025). Specifically, the overestimation of precipitation in high-elevation regions by WRF may artificially enhance the frequency of wet-related compound extremes, whereas the underestimation of precipitation in lowland and downstream areas may bias the detection of dry-related compound extremes. Because the identification of CCEs relies on precipitation and temperature thresholds and their co-occurrence, systematic precipitation biases can further influence threshold estimation and event classification, thereby affecting the spatial distribution and frequency of detected CCEs. To address this limitation in future work, we plan to explore machine learning based post-processing approaches (Yin et al., 2021; Xie et al., 2023), in which the residuals between historical WRF simulations and station observations are learned and subsequently transferred to future simulations in a physically constrained method. This approach offers a promising pathway to reduce systematic regional model biases while preserving the internally consistent climate change signal. Furthermore, while statistically robust, our current non-stationary GAMLSS framework employs time merely as a proxy covariate for climate change. While this formulation is widely adopted and effective for detecting long-term trends, time itself serves only as an indirect proxy for the underlying physical processes driving changes in CCEs (Ragno et al., 2019). From a physical perspective, the evolution of compound hot–dry events are governed by a combination of thermodynamic and dynamic mechanisms, including background warming, shifts in large-scale atmospheric circulation, and land–atmosphere feedbacks (Bevacqua et al., 2022; Zhang et al., 2021a; Tian et al., 2024). For example, global mean surface temperature (GMST) can serve as a physically meaningful indicator of anthropogenic thermodynamic forcing, directly linking greenhouse gas increases to enhanced surface heat stress (Gillett et al., 2021). In this subtropical monsoon dominated basin, variations in the intensity, westward extension, and persistence of the Western Pacific Subtropical High (WPSH) can regulate subsidence strength, cloud cover, and surface radiative forcing, thereby favoring persistent hot conditions while suppressing precipitation (Li et al., 2024; An et al., 2025). Changes in the strength and variability of the East Asian summer monsoon (EASM) influence large-scale moisture transport and rainfall timing, affecting both the onset and persistence of dry spells (Park et al., 2020; Dou et al., 2025). In addition, antecedent soil moisture has been shown to influence the persistence and amplification of heat extremes through soil moisture–temperature feedbacks (Jiang and Wang, 2024), further highlighting the value of including land-surface states as covariates. Therefore, incorporating physically based covariates into the GAMLSS framework may therefore improve the interpretation of non-stationarity.
Through this intensive case analysis, we establish a transferable framework for assessing the non-stationarity of CCEs. This work advances the understanding of the evolution of CCE recurrence frequency under climate change and offers important perspectives to support adaptive strategies and strengthen disaster risk governance. The main findings are summarized as follows:
-
CCEs increase significantly across the MRB, with a stronger trend under SSP5-8.5 (3.55 d per decade) than under SSP2-4.5. HD extremes dominate both spatially (downstream-focused) and seasonally (summer-peaked), rising at 2.26 d per decade, whereas cold extremes decline. These shifts are primarily temperature-driven, as pronounced warming amplifies hot-related extremes but suppresses cold-related extremes.
-
CCEs shift markedly toward Mn-dominated non-stationarity under SSP5-8.5 scenarios, contrasting with the largely stationarity under SSP2-4.5. Spatially, Mn non-stationarity governs 80.8 % of the MRB under SSP5-8.5, with dry-related extremes (HD and CD) showing the most abrupt transitions. For HD, Mn non-stationarity expands from 22.7 % to 57.0 % of the basin and dominates 60 % of downstream grids – an increase of nearly threefold relative to SSP2-4.5. For CD, Mn-driven shifts cover >90 % of the downstream MRB. Var contributes minimally in both scenarios, confirming that warming amplifies extremes primarily through shifts in mean intensity rather than through increased variability.
-
Non-stationary modeling reveals that stationary approaches systematically underestimate future CCEs recurrence frequency. Under SSP5-8.5, most CCEs types (except CD) exhibit increasing recurrence frequency. Climate change impacts are significantly amplified for 100-year return period events, which rise at 3.12 d per decade – a response highlighting their heightened non-stationary sensitivity. Spatially, recurrence frequency shows a distinct east-to-west gradient, with a significantly increase occurring in the western mountainous areas.
Code/Data will be made available on request.
The supplement related to this article is available online at https://doi.org/10.5194/nhess-26-2031-2026-supplement.
Conceptualization: YZ. Methodology: YZ, LG, WX, CD, MM, JW, HK. Software: YZ, WX, CD. Data curation: SS. Writing- Original draft preparation: YZ. Writing- Reviewing and Editing: WX, YW, LG. Supervision: SS, MM, YC, HK. Funding acquisition: LG, JW, YC.
The contact author has declared that none of the authors has any competing interests.
Publisher's note: Copernicus Publications remains neutral with regard to jurisdictional claims made in the text, published maps, institutional affiliations, or any other geographical representation in this paper. The authors bear the ultimate responsibility for providing appropriate place names. Views expressed in the text are those of the authors and do not necessarily reflect the views of the publisher.
This article is part of the special issue “Methodological innovations for the analysis and management of compound risk and multi-risk, including climate-related and geophysical hazards (NHESS/ESD/ESSD/GC/HESS inter-journal SI)”. It is not associated with a conference.
The “High Performance Computing Center” at Fujian Normal University provided computational resources for the WRF model simulations.
Supported by the National Natural Science Foundation of China (grant no. 42271030), the Scientific Project of Fujian Provincial Department of Science and Technology (grant no. 2022Y0007), the German Federal Ministry of Education and Research (BMBF) through funding of the KARE_II project (01LR2006D1) and the “Young Eagle Plan” Top Talents of Fujian Province. Lu Gao is financially supported by the Humboldt Research Fellowship for Experienced Researchers through Alexander von Humboldt Foundation. Yinchi Zhang gratefully acknowledge financial support from the China Scholarship Council (CSC).
This paper was edited by Marleen de Ruiter and reviewed by three anonymous referees.
Abdelmoaty, H. M. and Papalexiou, S. M.: Changes of Extreme Precipitation in CMIP6 Projections: Should We Use Stationary or Nonstationary Models, J. Climate, 36, 2999–3014, https://doi.org/10.1175/JCLI-D-22-0467.1, 2023.
Akaike, H.: A new look at the statistical model identification, IEEE Trans. Automat. Control, 19, 716–723, https://doi.org/10.1109/TAC.1974.1100705, 1974
Ali, H., Fowler, H. J., Lenderink, G., Lewis, E., and Pritchard, D.: Consistent Large-Scale Response of Hourly Extreme Precipitation to Temperature Variation Over Land, Geophys. Res. Lett., 48, e2020GL090317, https://doi.org/10.1029/2020GL090317, 2021.
An, X., Sun, S., Ma, Q., Wu, H., Li, D., and Wu, W.: Elucidating the Varied Characteristics of Compound Hot–Drought from Two Distinctive Extreme Events in the Yangtze River Valley, Int. J. Climatol., 45, e8809, https://doi.org/10.1002/joc.8809, 2025.
Arakawa, A. and Jung, J.-H.: Multiscale modeling of the moist-convective atmosphere – A review, Atmos. Res., 102, 263–285, https://doi.org/10.1016/j.atmosres.2011.08.009, 2011.
Arnault, J., Jung, G., Haese, B., Fersch, B., Rummler, T., Wei, J., Zhang, Z., and Kunstmann, H.: A Joint Soil-Vegetation-Atmospheric Modeling Procedure of Water Isotopologues: Implementation and Application to Different Climate Zones With WRF-Hydro-Iso, J. Adv. Model Earth Sy., 13, https://doi.org/10.1029/2021MS002562, 2021.
Asadieh, B. and Krakauer, N. Y.: Global change in streamflow extremes under climate change over the 21st century, Hydrol. Earth Syst. Sci., 21, 5863–5874, https://doi.org/10.5194/hess-21-5863-2017, 2017.
Bevacqua, E., Zappa, G., Lehner, F., and Zscheischler, J.: Precipitation trends determine future occurrences of compound hot–dry events, Nat. Clim. Change, 12, 350–355, https://doi.org/10.1038/s41558-022-01309-5, 2022.
Byun, K. and Hamlet, A. F.: A risk-based analytical framework for quantifying non-stationary flood risks and establishing infrastructure design standards in a changing environment, J. Hydrol., 584, 124575, https://doi.org/10.1016/j.jhydrol.2020.124575, 2020.
Byun, U., Chang, E., Kim, J., Ahn, J., Cha, D., Min, S., and Byun, Y.: Investigation of Added Value in Regional Climate Models for East Asian Storm Track Analysis, J. Geophys. Res.-Atmos., 128, e2023JD039167, https://doi.org/10.1029/2023JD039167, 2023.
Chen, S.-H. and Sun, W.-Y.: A One-dimensional Time Dependent Cloud Model, J. Meteorol. Soc. Jpn., 80, 99–118, https://doi.org/10.2151/jmsj.80.99, 2002.
Cheng, L., AghaKouchak, A., Gilleland, E., and Katz, R. W.: Non-stationary extreme value analysis in a changing climate, Climatic Change, 127, 353–369, https://doi.org/10.1007/s10584-014-1254-5, 2014.
Croitoru, A.-E., Piticar, A., Ciupertea, A.-F., and Roşca, C. F.: Changes in heat waves indices in Romania over the period 1961–2015, Global Planet. Change, 146, 109–121, https://doi.org/10.1016/j.gloplacha.2016.08.016, 2016.
Dou, Z., Liu, B., Henderson, M., Zhou, W., Ma, R., Chen, M., and Zhang, Z.: Changes in Timing and Precipitation of the East Asian Summer Monsoon over China Between 1960 and 2017, Earth, 6, 24, https://doi.org/10.3390/earth6020024, 2025.
Du, H., Donat, M. G., Zong, S., Alexander, L. V., Manzanas, R., Kruger, A., Choi, G., Salinger, J., He, H. S., Li, M.-H., Fujibe, F., Nandintsetseg, B., Rehman, S., Abbas, F., Rusticucci, M., Srivastava, A., Zhai, P., Lippmann, T., Yabi, I., Stambaugh, M. C., Wang, S., Batbold, A., Oliveira, P. T. D., Adrees, M., Hou, W., Silva, C. M. S. E., Lucio, P. S., and Wu, Z.: Extreme Precipitation on Consecutive Days Occurs More Often in a Warming Climate, B. Am. Meteor. Soc., 103, E1130–E1145, https://doi.org/10.1175/BAMS-D-21-0140.1, 2022.
Duan, R., Huang, G., Wang, F., Tian, C., and Wu, X.: Observations Over a Century Underscore an Increasing Likelihood of Compound Dry-Hot Events in China, Earth's Future, 12, e2024EF004546, https://doi.org/10.1029/2024EF004546, 2024.
Dudhia, J.: Numerical Study of Convection Observed during the Winter Monsoon Experiment Using a Mesoscale Two-Dimensional Model, J. Atmos. Sci., 46, 3077–3107, https://doi.org/10.1175/1520-0469(1989)046<3077:NSOCOD>2.0.CO;2, 1989.
Fang, P., Wang, T., Yang, D., Tang, L., and Yang, Y.: Substantial increases in compound climate extremes and associated socio-economic exposure across China under future climate change, npj Clim. Atmos Sci., 8, 17, https://doi.org/10.1038/s41612-025-00910-7, 2025.
Feng, Y., Shi, P., Qu, S., Mou, S., Chen, C., and Dong, F.: Nonstationary flood coincidence risk analysis using time-varying copula functions, Sci. Rep., 10, 3395, https://doi.org/10.1038/s41598-020-60264-3, 2020.
Filliben, J. J.: The Probability Plot Correlation Coefficient Test for Normality, Technometrics, 17, 111–117, https://doi.org/10.1080/00401706.1975.10489279, 1975.
Fowler, H. J., Lenderink, G., Prein, A. F., Westra, S., Allan, R. P., Ban, N., Barbero, R., Berg, P., Blenkinsop, S., Do, H. X., Guerreiro, S., Haerter, J. O., Kendon, E. J., Lewis, E., Schaer, C., Sharma, A., Villarini, G., Wasko, C., and Zhang, X.: Anthropogenic intensification of short-duration rainfall extremes, Nat. Rev. Earth Environ., 2, 107–122, https://doi.org/10.1038/s43017-020-00128-6, 2021.
Gan, B., Liu, M., Cui, H., Chen, X., Chen, Y., Gao, L., and Deng, H.: Spatiotemporal patterns and propagation of meteorological and hydrological drought in a humid basin of Southeast China, Sci. Rep., 15, 31720, https://doi.org/10.1038/s41598-025-17005-1, 2025.
Gao, L., Huang, J., Chen, X., Chen, Y., and Liu, M.: Contributions of natural climate changes and human activities to the trend of extreme precipitation, Atmos. Res., 205, 60–69, https://doi.org/10.1016/j.atmosres.2018.02.006, 2018.
Geng, K., Chen, X., Zheng, M., Gao, Y., Gu, Z., and Yao, H.: The influence of human activities on rainfall-runoff relationships at different time scales in the Minjiang River Basin, Theor. Appl. Climatol., 155, 8435–8454, https://doi.org/10.1007/s00704-024-05124-0, 2024.
Gilbert, E., Pishniak, D., Torres, J. A., Orr, A., Maclennan, M., Wever, N., and Verro, K.: Extreme precipitation associated with atmospheric rivers over West Antarctic ice shelves: insights from kilometre-scale regional climate modelling, The Cryosphere, 19, 597–618, https://doi.org/10.5194/tc-19-597-2025, 2025.
Gillett, N. P., Kirchmeier-Young, M., Ribes, A., Shiogama, H., Hegerl, G. C., Knutti, R., Gastineau, G., John, J. G., Li, L., Nazarenko, L., Rosenbloom, N., Seland, Ø., Wu, T., Yukimoto, S., and Ziehn, T.: Constraining human contributions to observed warming since the pre-industrial period, Nat. Clim. Chang., 11, 207–212, https://doi.org/10.1038/s41558-020-00965-9, 2021.
Gimeno, L., Sorí, R., Vázquez, M., Stojanovic, M., Algarra, I., Eiras-Barca, J., Gimeno-Sotelo, L., and Nieto, R.: Extreme precipitation events, WIREs Water, 9, e1611, https://doi.org/10.1002/wat2.1611, 2022.
Guo, J., Wang, X., Fan, Y., Liang, X., Jia, H., and Liu, L.: How Extreme Events in China Would Be Affected by Global Warming – Insights From a Bias-Corrected CMIP6 Ensemble, Earth's Future, 11, e2022EF003347, https://doi.org/10.1029/2022EF003347, 2023.
Gutmann, E. D., Rasmussen, R. M., Liu, C., Ikeda, K., Gochis, D. J., Clark, M. P., Dudhia, J., and Thompson, G.: A Comparison of Statistical and Dynamical Downscaling of Winter Precipitation over Complex Terrain, J. Climate, 25, 262–281, https://doi.org/10.1175/2011JCLI4109.1, 2012.
Hariharan Sudha, S., Ragno, E., Morales-Nápoles, O., and Kok, M.: Investigating meteorological wet and dry transitions in the Dutch Meuse River basin, Front. Water, 6, 1394563, https://doi.org/10.3389/frwa.2024.1394563, 2024.
He, K., Chen, X., Zhou, J., Zhao, D., and Yu, X.: Compound successive dry-hot and wet extremes in China with global warming and urbanization, J. Hydrol., 636, 131332, https://doi.org/10.1016/j.jhydrol.2024.131332, 2024.
Hong, S.-Y., Noh, Y., and Dudhia, J.: A New Vertical Diffusion Package with an Explicit Treatment of Entrainment Processes, Mon. Weather Rev., 134, 2318–2341, https://doi.org/10.1175/MWR3199.1, 2006.
Horton, R. M., Mankin, J. S., Lesk, C., Coffel, E., and Raymond, C.: A Review of Recent Advances in Research on Extreme Heat Events, Curr. Clim. Change Rep., 2, 242–259, https://doi.org/10.1007/s40641-016-0042-x, 2016.
Huang, Y., Xue, M., Hu, X., Martin, E., Novoa, H. M., McPherson, R. A., Liu, C., Chen, M., Hong, Y., Perez, A., Morales, I. Y., Ticona Jara, J. L., and Flores Luna, A. J.: Increasing frequency and precipitation intensity of convective storms in the Peruvian Central Andes: Projections from convection-permitting regional climate simulations, Q. J. Roy. Meteor. Soc., 150, 4371–4390, https://doi.org/10.1002/qj.4820, 2024.
Imran, H. M. and Evans, J. P.: Observational uncertainty in the added value of regional climate modelling over Australia, Clim. Dynam., 63, 73, https://doi.org/10.1007/s00382-024-07562-y, 2025.
IPCC: Weather and climate extreme events in a changing climate. In climate change: The physical science basis, Contribution of Working Group I to the Sixth Assessment Report of the Intergovernmental Panel on Climate Change, Cambridge University Press, Cambridge, United Kingdom and New York, NY, USA, 1513–1766, https://doi.org/10.1017/9781009157896.013, 2021.
Jamal, K., Li, X., Chen, Y., Rizwan, M., Khan, M. A., Syed, Z., and Mahmood, P.: Bias correction and projection of temperature over the altitudes of the Upper Indus Basin under CMIP6 climate scenarios from 1985 to 2100, J. Water Clim. Change, 14, 2490–2514, https://doi.org/10.2166/wcc.2023.180, 2023.
Jia, N., Cheng, J., Li, Y., Zheng, L., Song, W., Chen, R., and Zhu, A.: China's Yangtze River drought: A cascade of impacts from mountains to sea, Sci. China Earth Sci., 68, 957–962, https://doi.org/10.1007/s11430-024-1521-3, 2025.
Jiang, Q., Li, W., Fan, Z., He, X., Sun, W., Chen, S., Wen, J., Gao, J., and Wang, J.: Evaluation of the ERA5 reanalysis precipitation dataset over Chinese Mainland, J. Hydrol., 595, 125660, https://doi.org/10.1016/j.jhydrol.2020.125660, 2021.
Jiang, Y. and Wang, G.: Soil Moisture Dominates the Land Surface Feedback in the Development of Compound Drought–Heat Extremes in Tropical South America, J. Hydrometeorol., 25, 1649–1664, https://doi.org/10.1175/JHM-D-24-0005.1, 2024.
Kramer, R. J., He, H., Soden, B. J., Oreopoulos, L., Myhre, G., Forster, P. M., and Smith, C. J.: Observational Evidence of Increasing Global Radiative Forcing, Geophys. Res. Lett., 48, e2020GL091585, https://doi.org/10.1029/2020GL091585, 2021.
Lei, X., Gao, L., Ma, M., Wei, J., Xu, L., Wang, L., and Lin, H.: Does non-stationarity of extreme precipitation exist in the Poyang Lake Basin of China, J. Hydrol. Reg. Stud., 37, 100920, https://doi.org/10.1016/j.ejrh.2021.100920, 2021.
Li, Z., Ren, H.-L., Lu, M., and Zhou, F.: Interannual variations of westward extension area of western Pacific subtropical high and its relationship with precipitation in East Asia, Atmos. Res., 298, 107148, https://doi.org/10.1016/j.atmosres.2023.107148, 2024.
Lin, C., Kjellström, E., Wilcke, R. A. I., and Chen, D.: Present and future European heat wave magnitudes: climatologies, trends, and their associated uncertainties in GCM-RCM model chains, Earth Syst. Dynam., 13, 1197–1214, https://doi.org/10.5194/esd-13-1197-2022, 2022.
Lin, S., Zhang, Y., Sun, S., Guan, X., Jiang, C., and Gao, L.: Sensitivity study of WRF parameterization schemes and initial fields on simulation of rainstorm in the Minjiang River basin, Pearl River, 44, 35–46, https://https://doi.org/10.3969/j.issn.1001-9235.2023.10.004, 2023 (in Chinese).
Liu, H., Xiao, P., Zhang, X., Liang, Y., Tang, B., Chen, S., and Liu, Y.: Winter snowpack loss increases warm-season compound hot-dry extremes, Commun. Earth Environ., 5, 567, https://doi.org/10.1038/s43247-024-01734-8, 2024a.
Liu, Y., Chen, J., Xiong, L., and Xu, C.-Y.: Integrating heterogeneous information for modeling non-stationarity of extreme precipitation in the Yangtze River Basin, J. Hydrol., 645, 132159, https://doi.org/10.1016/j.jhydrol.2024.132159, 2024b.
Maity, S. S. and Maity, R.: Changing Pattern of Intensity–Duration–Frequency Relationship of Precipitation due to Climate Change, Water Resour. Manag., 36, 5371–5399, https://doi.org/10.1007/s11269-022-03313-y, 2022.
Miao, L., Ju, L., Sun, S., Agathokleous, E., Wang, Q., Zhu, Z., Liu, R., Zou, Y., Lu, Y., and Liu, Q.: Unveiling the dynamics of sequential extreme precipitation-heatwave compounds in China, npj Clim. Atmos. Sci., 7, 67, https://doi.org/10.1038/s41612-024-00613-5, 2024.
Mlawer, E. J., Taubman, S. J., Brown, P. D., Iacono, M. J., and Clough, S. A.: Radiative transfer for inhomogeneous atmospheres: RRTM, a validated correlated-k model for the longwave, J. Geophys. Res., 102, 16663–16682, https://doi.org/10.1029/97JD00237, 1997.
Mukherjee, S., Mishra, A. K., Zscheischler, J., and Entekhabi, D.: Interaction between dry and hot extremes at a global scale using a cascade modeling framework, Nat. Commun., 14, 277, https://doi.org/10.1038/s41467-022-35748-7, 2023.
Nerantzaki, S. D., Papalexiou, S. M., Rajulapati, C. R., and Clark, M. P.: Nonstationarity in High and Low-Temperature Extremes: Insights From a Global Observational Data Set by Merging Extreme-Value Methods, Earth's Future, 11, e2023EF003506, https://doi.org/10.1029/2023EF003506, 2023.
Niu, G.-Y., Yang, Z.-L., Mitchell, K. E., Chen, F., Ek, M. B., Barlage, M., Kumar, A., Manning, K., Niyogi, D., Rosero, E., Tewari, M., and Xia, Y.: The community Noah land surface model with multiparameterization options (Noah-MP): 1. Model description and evaluation with local-scale measurements, J. Geophys. Res., 116, D12109, https://doi.org/10.1029/2010JD015139, 2011.
Nordling, K., Fahrenbach, N. L. S., and Samset, B. H.: Climate variability can outweigh the influence of climate mean changes for extreme precipitation under global warming, Atmos. Chem. Phys., 25, 1659–1684, https://doi.org/10.5194/acp-25-1659-2025, 2025.
O'Gorman, P. A. and Muller, C. J.: How closely do changes in surface and column water vapor follow Clausius–Clapeyron scaling in climate change simulations, Environ. Res. Lett., 5, 025207, https://doi.org/10.1088/1748-9326/5/2/025207, 2010.
Park, J., Kim, H., Simon Wang, S.-Y., Jeong, J.-H., Lim, K.-S., LaPlante, M., and Yoon, J.-H.: Intensification of the East Asian summer monsoon lifecycle based on observation and CMIP6, Environ. Res. Lett., 15, 0940b9, https://doi.org/10.1088/1748-9326/ab9b3f, 2020.
Patel, R. N., Bonan, D. B., and Schneider, T.: Changes in the Frequency of Observed Temperature Extremes Largely Driven by a Distribution Shift, Geophys. Res. Lett., 51, e2024GL110707, https://doi.org/10.1029/2024GL110707, 2024.
Ragno, E., AghaKouchak, A., Cheng, L., and Sadegh, M.: A generalized framework for process-informed nonstationary extreme value analysis, Adv. Water Resour., 130, 270–282, https://doi.org/10.1016/j.advwatres.2019.06.007, 2019.
Rahimi, S., Huang, L., Norris, J., Hall, A., Goldenson, N., Risser, M., Feldman, D. R., Lebo, Z. J., Dennis, E., and Thackeray, C.: Understanding the Cascade: Removing GCM Biases Improves Dynamically Downscaled Climate Projections, Geophys. Res. Lett., 51, e2023GL106264, https://doi.org/10.1029/2023GL106264, 2024.
Ridder, N. N., Ukkola, A. M., Pitman, A. J., and Perkins-Kirkpatrick, S. E.: Increased occurrence of high impact compound events under climate change, npj Clim. Atmos. Sci., 5, https://doi.org/10.1038/s41612-021-00224-4, 2022.
Rigby, R. A. and Stasinopoulos, D. M.: Generalized Additive Models for Location, Scale and Shape, J. R. Stat. Soc. C-Appl., 54, 507–554, https://doi.org/10.1111/j.1467-9876.2005.00510.x, 2005.
Salarijazi, M., Ghorbani, K., Mohammadi, M., Ahmadianfar, I., Mohammadrezapour, O., Naser, M. H., and Yaseen, Z. M.: Spatial-temporal estimation of maximum temperature high returns periods for annual time series considering stationary/nonstationary approaches in Iran urban area, Urban Clim., 49, 101504, https://doi.org/10.1016/j.uclim.2023.101504, 2023.
Samset, B. H., Sand, M., Smith, C. J., Bauer, S. E., Forster, P. M., Fuglestvedt, J. S., Osprey, S., and Schleussner, C.-F.: Climate Impacts from a Removal of Anthropogenic Aerosol Emissions, Geophys. Res. Lett., 45, 1020–1029, https://doi.org/10.1002/2017GL076079, 2018.
Sauter, C., Fowler, H. J., Westra, S., Ali, H., Peleg, N., and White, C. J.: Compound extreme hourly rainfall preconditioned by heatwaves most likely in the mid-latitudes, Weather Clim. Extremes, 40, 100563, https://doi.org/10.1016/j.wace.2023.100563, 2023.
Shang, S., Arnault, J., Zhu, G., Chen, H., Wei, J., Zhang, K., Zhang, Z., Laux, P., and Kunstmann, H.: Recent Increase of Spring Precipitation over the Three-River Headwaters Region – Water Budget Analysis Based on Global Reanalysis (ERA5) and ET-Tagging Extended Regional Climate Modeling, J. Climate, 35, 7199–7217, https://doi.org/10.1175/JCLI-D-21-0829.1, 2022.
Shao, S., Zhang, H., Singh, V. P., Ding, H., Zhang, J., and Wu, Y.: Nonstationary analysis of hydrological drought index in a coupled human-water system: Application of the GAMLSS with meteorological and anthropogenic covariates in the Wuding River basin, China, J. Hydrol., 608, 127692, https://doi.org/10.1016/j.jhydrol.2022.127692, 2022.
Shu, Z., Jin, J., Zhang, J., Wang, G., Lian, Y., Liu, Y., Bao, Z., Guan, T., He, R., Liu, C., and Jing, P.: 1.5° and 2.0° of global warming intensifies the hydrological extremes in China, J. Hydrol., 635, 131229, https://doi.org/10.1016/j.jhydrol.2024.131229, 2024.
Singh, H., Najafi, M. R., and Cannon, A. J.: Characterizing non-stationary compound extreme events in a changing climate based on large-ensemble climate simulations, Clim. Dynam., 56, 1389–1405, https://doi.org/10.1007/s00382-020-05538-2, 2021.
Song, X., Zhang, J., Zou, X., Zhang, C., AghaKouchak, A., and Kong, F.: Changes in precipitation extremes in the Beijing metropolitan area during 1960–2012, Atmos. Res., 222, 134–153, https://doi.org/10.1016/j.atmosres.2019.02.006, 2019.
Stasinopoulos, D. M. and Rigby, R. A.: Generalized Additive Models for Location Scale and Shape (GAMLSS) in R, J. Stat. Soft., 23, https://doi.org/10.18637/jss.v023.i07, 2007.
Sun, F., Roderick, M. L., and Farquhar, G. D.: Rainfall statistics, stationarity, and climate change, P. Natl. Acad. Sci. USA, 115, 2305–2310, https://doi.org/10.1073/pnas.1705349115, 2018.
Sun, X., Tu, Y., Sun, S., Zhou, X., Jiang, L., Hao, X., Jiang, C., and Gao, L.: Identification and spatiotemporal characteristics of compound extreme climate events in the Minjiang River Basin. Water Resour. Hydropower Engineering, 56, 1–14, https://https://doi.org/10.13928/j.cnki.wrahe.2025.03.001, 2025 (in Chinese).
Talbot, C., Bou-Zeid, E., and Smith, J.: Nested Mesoscale Large-Eddy Simulations with WRF: Performance in Real Test Cases, J. Hydrometeorol., 13, 1421–1441, https://doi.org/10.1175/JHM-D-11-048.1, 2012.
Tapiador, F. J., Navarro, A., Moreno, R., Sánchez, J. L., and García-Ortega, E.: Regional climate models: 30 years of dynamical downscaling, Atmos. Res., 235, 104785, https://doi.org/10.1016/j.atmosres.2019.104785, 2020.
Tian, Y., Giaquinto, D., Di Capua, G., Claassen, J. N., Ali, J., Li, H., and De Michele, C.: Historical changes in the Causal Effect Networks of compound hot and dry extremes in central Europe, Commun. Earth Environ., 5, 764, https://doi.org/10.1038/s43247-024-01934-2, 2024.
Torrez-Rodriguez, L., Goubanova, K., Muñoz, C., and Montecinos, A.: Evaluation of temperature and precipitation from CORDEX-CORE South America and Eta-RCM regional climate simulations over the complex terrain of Subtropical Chile, Clim. Dynam., 61, 3195–3221, https://doi.org/10.1007/s00382-023-06730-w, 2023.
Van Der Wiel, K. and Bintanja, R.: Contribution of climatic changes in mean and variability to monthly temperature and precipitation extremes, Commun. Earth Environ., 2, https://doi.org/10.1038/s43247-020-00077-4, 2021.
Varga, Á. J. and Breuer, H.: Evaluation of convective parameters derived from pressure level and native ERA5 data and different resolution WRF climate simulations over Central Europe, Clim. Dynam., 58, 1569–1585, https://doi.org/10.1007/s00382-021-05979-3, 2022.
Wang, S., Chen, X., Yao, H., Ruan, W., Gu, Z., Li, X., Chen, Y., Liu, M., and Deng, H.: Separation and spatial variations of typhoon and non-typhoon rainfall at different timescales in typical region of southeast China, Int. J. Climatol., 44, 4611–4628, https://doi.org/10.1002/joc.8599, 2024.
Wu, H., Su, X., and Singh, V. P.: Increasing Risks of Future Compound Climate Extremes with Warming Over Global Land Masses, Earth's Future, 11, e2022EF003466, https://doi.org/10.1029/2022EF003466, 2023.
Wu, L. and Zheng, H.: Regional Climate Effects of Irrigation under Central Asia Warming by 2.0 ° C, Remote Sens., 15, 3672, https://doi.org/10.3390/rs15143672, 2023.
Wu, X., Hao, Z., Zhang, X., Li, C., and Hao, F.: Evaluation of severity changes of compound dry and hot events in China based on a multivariate multi-index approach, J. Hydrol., 583, 124580, https://doi.org/10.1016/j.jhydrol.2020.124580, 2020.
Xie, Y., Sun, W., Ren, M., Chen, S., Huang, Z., and Pan, X.: Stacking ensemble learning models for daily runoff prediction using 1D and 2D CNNs, Expert Syst. Appl., 217, 119469, https://doi.org/10.1016/j.eswa.2022.119469, 2023.
Xu, W., Liu, Z., Gao, L., Lei, X., and Zhang, Y.: Changes in Global Marine Heatwaves in a Non-stationary Climate, Geophys. Res. Lett., 52, e2024GL114497, https://doi.org/10.1029/2024GL114497, 2025.
Xu, Z., Han, Y., Tam, C.-Y., Yang, Z.-L., and Fu, C.: Bias-corrected CMIP6 global dataset for dynamical downscaling of the historical and future climate (1979–2100), Sci. Data, 8, 293, https://doi.org/10.1038/s41597-021-01079-3, 2021.
Yan, Y., Gao, L., Chen, R., Zhang, C., Ren, L., Zhang, X., and Chen, C.: Analysis of Disaster and Damage Process Caused by No. 2305 “Doksuri” Typhoon Disaster Chain in Fuzhou City, J. Catastrophology, 39, 228–234, https://doi.org/10.3969/j.issn.1000-811X.2024.04.033, 2024 (in Chinese).
Yang, T., Chen, X., Hamdi, R., Li, Q., Cui, F., Li, L., Liu, Y., De Maeyer, P., and Duan, W.: Assessment of snow simulation using Noah-MP land surface model forced by various precipitation sources in the Central Tianshan Mountains, Central Asia, Atmos. Res., 300, 107251, https://doi.org/10.1016/j.atmosres.2024.107251, 2024.
Yao, H., Zhao, L., He, Y., Dong, W., Shen, X., Wang, J., Hu, Y., Ling, J., Xiao, Z., and Huang, C.: Changes caused by human activities in the high health-risk hot-dry and hot-wet events in China, Commun. Earth Environ., 5, 464, https://doi.org/10.1038/s43247-024-01625-y, 2024.
Yin, C., Ting, M., Kornhuber, K., Horton, R. M., Yang, Y., and Jiang, Y.: CETD, a global compound events detection and visualisation toolbox and dataset, Sci. Data, 12, 356, https://doi.org/10.1038/s41597-025-04530-x, 2025.
Yin, H., Zhang, X., Wang, F., Zhang, Y., Xia, R., and Jin, J.: Rainfall-runoff modeling using LSTM-based multi-state-vector sequence-to-sequence model, J. Hydrol., 598, 126378, https://doi.org/10.1016/j.jhydrol.2021.126378, 2021.
You, J., Yin, F., and Gao, L.: Escalating wind power shortages during heatwaves, Commun. Earth Environ., 6, 245, https://doi.org/10.1038/s43247-025-02239-8, 2025.
Zeng, J., Zhang, S., Zhou, S., Obulkasim, O., Zhang, H., Lu, X., and Dai, Y.: Comparison of the risks and drivers of compound hot-dry and hot-wet extremes in a warming world, Environ. Res. Lett., 19, 114026, https://doi.org/10.1088/1748-9326/ad7617, 2024.
Zhang, C., Wang, Y., and Hamilton, K.: Improved Representation of Boundary Layer Clouds over the Southeast Pacific in ARW-WRF Using a Modified Tiedtke Cumulus Parameterization Scheme, Mon. Weather Rev., 139, 3489–3513, https://doi.org/10.1175/MWR-D-10-05091.1, 2011.
Zhang, M., Han, Y., Xu, Z., and Guo, W.: Assessing Climate Extremes in Dynamical Downscaling Simulations Driven by a Novel Bias-Corrected CMIP6 Data, J. Geophys. Res.-Atmos., 129, e2024JD041253, https://doi.org/10.1029/2024JD041253, 2024.
Zhang, W., Luo, M., Gao, S., Chen, W., Hari, V., and Khouakhi, A.: Compound Hydrometeorological Extremes: Drivers, Mechanisms and Methods, Front. Earth Sci., 9, 673495, https://doi.org/10.3389/feart.2021.673495, 2021a.
Zhang, W., Furtado, K., Wu, P., Zhou, T., Chadwick, R., Marzin, C., Rostron, J., and Sexton, D.: Increasing precipitation variability on daily-to-multiyear time scales in a warmer world, Sci. Adv., 7, eabf8021, https://doi.org/10.1126/sciadv.abf8021, 2021b.
Zhang, W., Zhou, T., and Wu, P.: Anthropogenic amplification of precipitation variability over the past century, Science, 385, 427–432, https://doi.org/10.1126/science.adp0212, 2024.
Zhang, Y., Deng, C., Xu, W., Zhuang, Y., Jiang, L., Jiang, C., Guan, X., Wei, J., Ma, M., Chen, Y., Peng, J., and Gao, L.: Long-term variability of extreme precipitation with WRF model at a complex terrain River Basin, Sci. Rep., 15, 156, https://doi.org/10.1038/s41598-024-84076-x, 2025.
Zhao, T., Xiong, S., Tian, Y., Wu, Y., Li, B., and Chen, X.: Compound dry and hot events over major river basins of the world from 1921 to 2020, Weather Clim. Extremes, 44, 100679, https://doi.org/10.1016/j.wace.2024.100679, 2024.
Zheng, M., Chen, X., Ruan, W., Yao, H., Gu, Z., Geng, K., Li, X., Deng, H., Chen, Y., and Liu, M.: Spatiotemporal variation of water cycle components in Minjiang River Basin based on a correction method for evapotranspiration products, J. Hydrol. Reg. Stud., 50, 101575, https://doi.org/10.1016/j.ejrh.2023.101575, 2023.
Zhou, P., Tang, J., Ma, M., Ji, D., and Shi, J.: High resolution Tibetan Plateau regional reanalysis 1961-present, Sci. Data, 11, 444, https://doi.org/10.1038/s41597-024-03282-4, 2024.
Zscheischler, J., Westra, S., Van Den Hurk, B. J. J. M., Seneviratne, S. I., Ward, P. J., Pitman, A., AghaKouchak, A., Bresch, D. N., Leonard, M., Wahl, T., and Zhang, X.: Future climate risk from compound events, Nat. Clim. Change, 8, 469–477, https://doi.org/10.1038/s41558-018-0156-3, 2018.