the Creative Commons Attribution 4.0 License.
the Creative Commons Attribution 4.0 License.
 | 25 Mar 2026
Toward early warning of drought impacts: a framework for predicting drought impacts in the UK
Eugene Magee
Rachael Armitage
Opeyemi E. Adedipe
Maliko Tanguy
Lucy J. Barker
Jamie Hannaford
Drought impact forecasting is essential for enhancing preparedness and mitigation strategies. However, identifying key predictors and achieving reliable predictions remains challenging. Previous studies have shown promise in developing indicator-impact relationships and yet these are often region- and impact type-specific. Here, we used data from the European Drought Impact Inventory (EDII, 1970–2012), and a wide range of meteorological and hydrological predictors, including the Standardized Precipitation Index (SPI), Standardized Precipitation-Evapotranspiration Index (SPEI), and soil moisture indices (SSMI), to develop a generalized forecasting framework for predicting drought impacts in the UK across multiple lead times. We firstly compared multiple machine learning models for drought impact prediction and identified Random Forest (RF) as the most effective model. Our results show that RF delivers the highest accuracy for up to three months forecasts, with performance declining beyond six months, similar to trends observed in weather prediction models. At longer lead times, the model incorporates a broader set of predictors to maintain accuracy. Key findings highlight the importance of long-accumulation-period drought indicators, particularly SPEI24, and deep-layer soil moisture (SSMI L4), which were identified as the most influential predictors. A generalized model approach was used, aggregating drought impacts from various regions, and the model was validated using unseen datasets from within the UK, using parts of the EDII UK dataset held back from the training, confirming its robustness. A pilot application to a completely different country (Germany) highlights the potential for extrapolation to new domains. Gridded impact predictions were also developed, and successfully captured the spatial distribution of observed impacts, and a spatially explicit evaluation showed reasonable agreement between predicted and observed drought impacts. Although uncertainties persist, particularly for long lead times, our findings suggest that a generalized approach based on hydrometeorological indices provides an effective framework for operational drought impact forecasting, supporting early warning systems and decision-making in drought risk management.
- Article
(3780 KB) - Full-text XML
-
Supplement
(752 KB) - BibTeX
- EndNote


1.1 Background to drought impact prediction and early warning
Globally, droughts are one of the most damaging natural hazards, causing severe and often catastrophic impacts on lives and livelihoods. Drought impacts are felt across all economic sectors as well as on terrestrial and freshwater ecosystems, and the ecosystem services that they sustain. Recent years have seen devastating droughts and, increasingly, these droughts have been attributed more confidently to anthropogenic warming (Faranda et al., 2023). Droughts are expected to become more severe in many parts of the world (e.g. Vicente-Serrano et al., 2022) with some of the greatest impacts likely in some of the most vulnerable regions of the Global South, where the impact of droughts has been shown to be a demonstrable constraint on economic development (Zaveri et al., 2023). Yet, given the ubiquity of droughts across all climate zones, and the dependence of economic sectors on water security, even in relatively wealthy countries, drought risk is increasing and projected to grow through the 21st century.
In recognition of the of ubiquitous and increasing impacts of drought, the international community has long called for improved systems to proactively manage drought. “Three Pillars” of drought management (IDMP, 2025; Wilhite et al., 2014) can be recognised, including: (i) monitoring and early warning, (ii) risk and impact assessment and risk mitigation, (iii) preparedness and response. Over recent decades, there have been a growth in drought early warning systems (DEWs), with many parts of the globe covered by existing systems, and huge investments to improve coverage in under-represented areas (e.g. EarlyWarningsforAll, 2022). Nevertheless, while there have been, and continue to be, major advances in the monitoring of hydrometeorological variables (e.g. precipitation and temperature), in general most early warning frameworks do not include impacts on society and the environment. Bachmair et al. (2016b) conducted a literature review and surveyed 33 drought monitoring systems globally. They concluded that while impacts are considered in some systems, in general there is a lack of incorporation of impact information in DEWs – even if impact information is being collected.
More generally, across all natural hazards, over the last decade there has been increasing recognition of the need to move beyond traditional hydrometeorological early warning systems and to develop “drought impact” forecasts that “bridge the gap” between physical science and actionable information. However, such systems are generally far more evolved for flooding and windstorms than they are for drought (e.g. see the review of Merz et al., 2020). This is due to many factors, including the different (generally wider and longer) spatial and temporal scales of drought hazard, as well as the complexities of drought impacts, which are often diffuse, non-structural and can occur at significant delays after the event (Bachmair et al., 2016b, 2017).
In a recent review, Shyrokaya et al. (2023) surveyed efforts to develop drought impacts forecast. They found that most studies were academic, with only a few practical applications. The review also noted that, although operational systems remain limited, the past decade has seen substantial growth in the science supporting impact-focused DEWS and drought impact forecasts. In particular, there has been a growth in studies that seek to link drought indicators (i.e. hydrometeorological variables used to quantify drought status) to impacts (e.g. Tanguy et al., 2023; Wang et al., 2020). In addition, a recent World Meteorological Organization (WMO) report provides a comprehensive review of current drought impact collection efforts and highlights the importance of forecasting, data requirements, and the diverse data types that can reveal impact signals (Smith et al., 2025). Shyrokaya et al. (2023) highlight seven challenges to the development of drought impact forecasting systems, including (among others): fundamental limitations of data availability; constraints in the statistical models used to develop drought impact functions; biases in the current literature towards certain drought indicators (meteorological), impact sectors (agriculture) and geographies (a focus on Europe). In the latter case, the focus on Europe largely reflects the existence of the European Drought Impact Report Inventory (EDII) (Stahl et al., 2016), a centralised dataset of consistently recorded drought impacts that has been the basis of a number of efforts to statistically link drought indicators to impacts (e.g. Stagge et al., 2015; Bachmair et al., 2016a, 2017; Blauhut et al., 2015; Shyrokaya et al., 2025).
1.2 The need for drought impact forecasts in the UK
Despite being stereotypically a wet country, the UK has experienced drought events that have had significant impacts on people, water supplies and the environment. Historic events are still viewed as benchmark droughts, in particular 1976, in terms of their impact (Barker et al., 2019; Marsh et al., 2007), but a string of events over the recent past (2010–2012 (Kendon et al., 2013), 2018–2019 (Turner et al., 2021) and 2022 (Barker et al., 2024)) have provided a focus for improving drought management, communication and investment in drought research. These efforts have resulted in practical tools to better monitor and prepare for droughts, including the UK Water Resources Portal (Barker et al., 2022) and the UK Hydrological Outlook (Prudhomme et al., 2017), but have focussed on monitoring/forecasting the hydrometeorological hazard of drought. Engagement with stakeholders as early as 2015 identified the understanding of when and where drought impacts were occurring as a key gap in managing droughts (Hannaford et al., 2019). More recent engagement has highlighted the need for drought impact information (both during and after an event) as a barrier to proactive event response and management (Facer-Childs et al., 2025).
The often-slow onset of droughts poses a significant challenge for monitoring and identifying impacts in real-time (although the rapid onset of flash droughts can be equally challenging), especially if additional resources need to be deployed (e.g., environmental monitoring and surveys) (AghaKouchak et al., 2023; Noguera et al., 2023; Wilhite et al., 2007). This means that in many cases most drought impact information is defined and/or collected after an event has ended, and with the distributed nature of drought management and response in the UK (both sectoral and in each of the constituent countries), much of this information is not openly nor widely available. Although impacts are a key factor in the official declaration of a drought event in England alongside hydrometeorological and environmental indicators (Environment Agency, 2025) , there is no objective definition of impact, nor the number, type or severity of impacts, nor how this should be combined with hydrometeorological and environmental indicators to define drought (other than suggested “possible” drought impacts associated with each stage of drought).
There has been a proliferation of drought impact datasets in recent years in the UK, although as noted above, many are still not yet available or openly available (in particular, those used operationally by the environmental regulators). Indirect measures for impacts, or datasets in which a drought signal can be seen, are also increasing in number – including those collected and used by environmental regulators or researchers (e.g. Biological Records Centre https://www.brc.ac.uk/, last access: 23 January 2025, e.g. Oliver et al., 2015), collected by citizen science initiatives (e.g., Crowd Water https://crowdwater.ch/, last access: 23 January 2025, Seibert et al., 2019) or using earth observation data (e.g. Bachmair et al., 2018). As such, there is a need to develop tools and methods that can harness these new streams of data that can turn them into information to support proactive drought management. In lieu of a holistic and complete UK focussed drought impact database, here we demonstrate the use of the European Drought Impact report Inventory (EDII), a European scale database manually populated from a range of documentary sources (Blauhut et al., 2022) to develop a generalised approach for forecasting drought impacts using machine learning methods.
1.3 Gaps in previous approaches
The existing literature can be assessed on several key aspects, including: whether the study aims to predict the number of impact occurrences or their likelihood; the application of one or multiple machine learning models with or without intercomparison; the focus on regional and/or sector-specific modelling versus lumped impact data; the validation of models using unseen datasets; the distinction between forecasting future impacts and making predictions based on historical data; and whether the results are presented in a gridded format. This framework provides a structured approach to evaluating prior research and identifying trends in impact prediction studies.
Blauhut et al. (2015) and Stagge et al. (2015) were among the first to model the likelihood of drought impact occurrences across various sectors in European countries with available impact data, using binary classifications of impact occurrence/non-occurrence using a logistic regression approach. Stagge et al. (2015) also applied Generalized Additive Models (GAMs) to relate impact occurrences to drought indices, marking the first use of a non-parametric alternative to Linear Regression (LR) in this context. Similarly, O'Connor et al. (2023) used Logistic LR and GAMs to examine the relationship between drought indices and impacts in Ireland.
Building on these approaches, Bachmair et al. (2015) examined the effectiveness of different drought indicators or combinations thereof in explaining impact occurrences at the region level in Germany. Unlike the earlier studies, they also considered the number of impact occurrences, identifying specific threshold values that link drought indicators to impact events. Expanding on this approach, Bachmair et al. (2016a) used a Random Forest (RF) model for number of impact reports prediction using impact data from the UK and Germany. Torelló-Sentelles and Franzke (2022) also used a region-specific RF model to predict the number of occurrences of drought impacts across Spain. In addition, Bachmair et al. (2017) further compared different modelling approaches, including LR, RF, and the Hurdle method, for the south-east of England.
Studies up to this point primarily focus on sector-specific or location-specific data, or both. However, Sutanto et al. (2019, 2020) conducted the first study that lumped categories both spatially within the selected region and at the country scale over Germany to predict the likelihood of impact occurrence. In addition, they were also the first to attempt forecasting these likelihoods using dynamical weather forecasts.
Hobeichi et al. (2022) compared nine different machine learning models to predict the likelihood of impact occurrences in Texas, USA, and provided gridded risk maps and forecasts with lead times of up to three months using the lagged indicators approach. Similarly, Stephan et al. (2023) assessed how well predicted impact estimates from one Alpine region aligned with reported drought impacts in other regions and evaluated the models' ability to re-forecast drought impacts.
Where reported drought impact data are not available, some studies have used proxies for impacts. For example, crop yields have been used as indicators of agricultural impacts (Parsons et al., 2019; Tanguy et al., 2023), and wildfire activity has served as an indicator of meteorological impacts (Gudmundsson et al., 2014) to establish the relationship between drought indicators and impacts.
Although these previous studies have attempted to predict drought impacts using different approaches individually, there is no comprehensive study that compiles and evaluates all these aspects together (i.e., occurrence, severity, likelihood, cross-validation, forecast performance). For example, while a general modelling approach using a lumped impact dataset was implemented by Sutanto et al. (2019, 2020), it was limited to likelihood estimation. Stephan et al. (2023) addressed model cross-validation across different time periods and spatial scales, but their study lacked independent validation. Moreover, most early studies pre-processed the data by censoring certain time periods when selecting drought events, which limited their ability to assess model accuracy over longer timeframes and reduced their applicability for operational decision-making. Furthermore, while impact prediction has been widely explored, only a few studies have incorporated forecasting, limiting the understanding of how well models perform in predicting future drought impacts.
These methodological limitations highlight gaps in the literature, emphasizing the need for a more integrated approach that combines multiple perspectives to improve the robustness and generalizability of drought impact predictions.
1.4 Aims and objectives
The aim of this study is to build on previous research that has established drought indicator–impact linkages and to extend this work by developing a generalized and transferable drought impact modelling framework. The framework is designed to capture nationwide variability using a lumped approach trained across all UK regions, while systematically integrating multiple drought indicators and evaluating a diverse set of modelling approaches. It seeks to test predictability for “unseen” cases, including independent UK validation datasets. We also assessed wider transferability by applying the best performing model in a new country (in this case Germany, chosen as a case study for reasons set out below) representing further unseen regions, and a more challenging test due to the different geographical setting and limited availability of impact data.
Additionally, and in keeping with the ultimate aim of developing early warning approaches for drought impacts the framework aims to explore the use of lagged drought indicators for forecasting impacts at multiple lead times and to produce spatially explicit impact predictions, enabling assessment of the variability and severity of drought impacts across regions.
Therefore, the objectives of this study are as follows:
-
Develop multiple machine learning and linear models based on a lumped drought impact approach for the whole UK.
-
Evaluate and compare the performance of these models' using metrics from both training and independent “unseen” validation datasets across UK regions and selected time periods to identify the most accurate approach for near-real-time drought impact prediction (zero lead time).
-
Apply the best-performing model to Germany to assess its transferability and demonstrate how models developed in data available regions can be applied to regions with insufficient impact data.
-
Evaluate the potential of lagged drought indicators for forecasting drought impacts at multiple lead times.
-
Produce and assess gridded spatial drought impact predictions to characterise the spatial variability and severity of drought impacts.
Note: Prediction refers to estimating drought impacts at the current time step (zero lead time), while forecasting refers to estimating impacts at one or more future lead times.
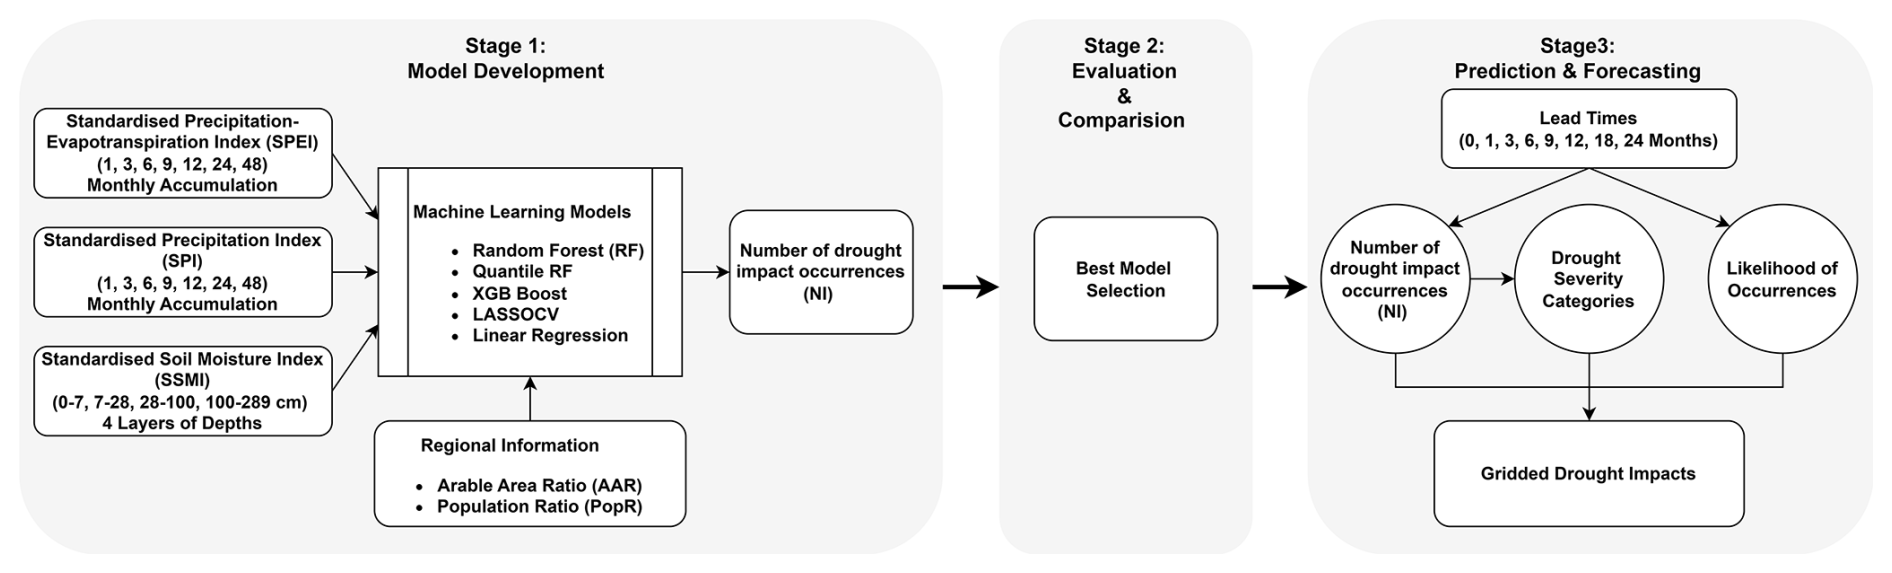
This section outlines the methodological framework and data utilized for predicting and forecasting drought impacts through machine learning (ML) approaches. The methodology includes impact data preprocessing, drought indicator calculation, model selection, and performance evaluation. Detailed steps in preparing the input data for ML integration, alongside the training, testing, and validation strategies for the models, are given below to ensure reproducibility and robustness in the predictions. Figure 1 shows the overall workflow of this study, which consists of three stages.
Stages 1 and 2 together form the generalized framework for predicting UK drought impacts, with Stage 1, Model Development, establishing the core framework by training multiple models on drought impact data for the whole UK using a range of drought indicators, and Stage 2, Evaluation & Comparison, assessing model performance both on training and validation periods to select the best-performing approach. To evaluate the accuracy of the lumped approach, performance metrics for the selected model are reported for all regions, enabling fair comparison with previous regional models. Stage 3, Prediction & Forecasting, applies the best-performing model for operational use, producing near-real-time drought impact estimates, forecasts at multiple lead times, and gridded maps capturing spatial variability and severity across the UK. The transferability of the selected model is further tested by applying it to Germany, chosen due to the availability of EDII datasets and prior studies on drought impacts (Bachmair et al., 2016a; Shyrokaya et al., 2025).
2.1 Data Sources
We used the European Drought Impact Inventory (EDII), a comprehensive database that systematically documents drought impacts across Europe, for the drought impact dataset. The study period of 1970–2012 was selected according to the drought impact data availability for the UK in the EDII. The EDII organises impacts into 15 categories spanning various sectors, such as agriculture, water resources, ecosystems, and society, and provides detailed event-based records (Stahl et al., 2016). To be included in the EDII, the impact must be negative and must also meet two criteria: (i) the observed impact must be clearly attributable to drought, and (ii) the source of the report must be credible and properly cited. While several studies have used EDII reports to model the statistical relationship between drought indices and categorised impacts, we considered drought impacts collectively, without distinguishing specific categories, to focus on the overall relationship between drought conditions and their reported consequences. We focus on the EDII database for the UK at the NUTS1 level, where NUTS (Nomenclature of Units for Territorial Statistics) is a geocode standard for subdividing countries into regions for statistical analysis, with NUTS1 representing major socio-economic regions. Although the UK has adopted the ITL (International Territorial Levels) system post-Brexit, we use the NUTS classification as our study period primarily covers the pre-Brexit era.
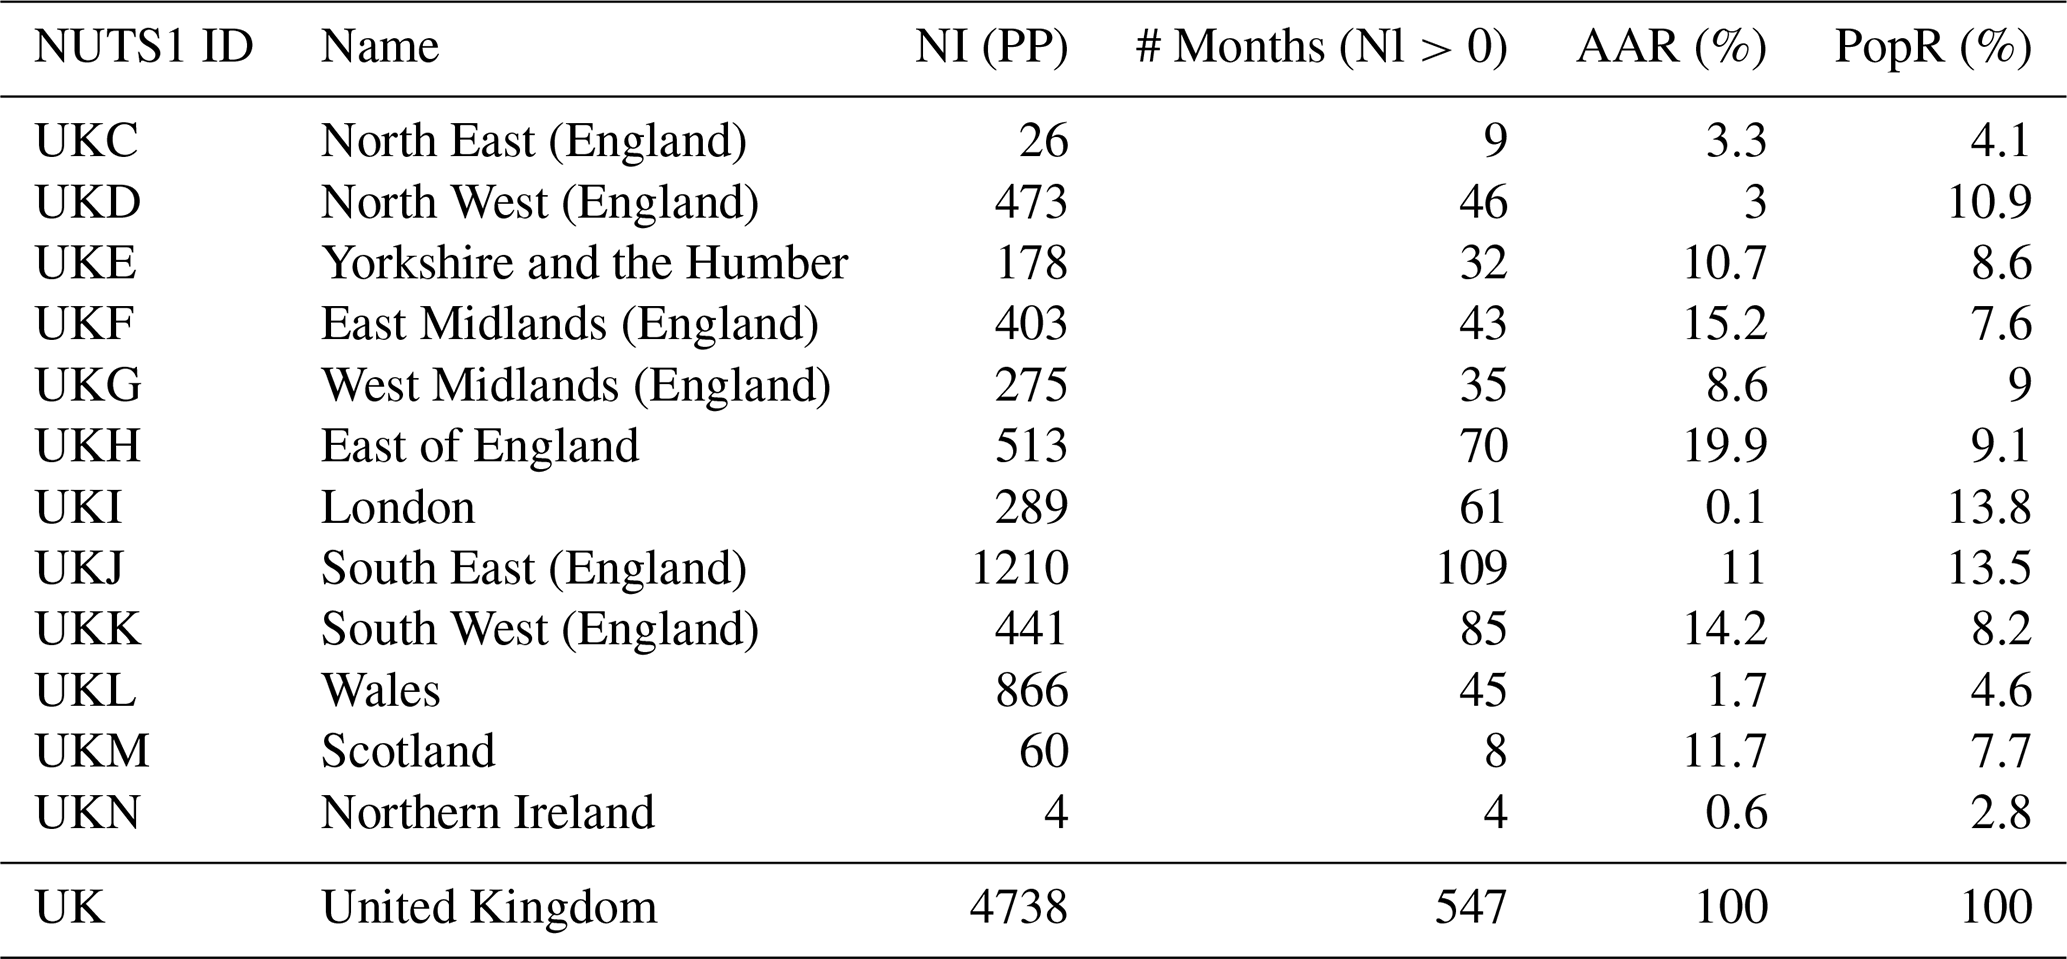
Before using the impact dataset, a post-processing was applied to the “drought impact report” (EDII entry), following the methods used in previous studies (Bachmair et al., 2015, 2016a, 2017; Blauhut et al., 2015). Specifically, records without start or end dates (month/season) were excluded from the dataset. For entries containing only seasonal information, the season is divided into monthly intervals, with the start month as the beginning date and the end month as the concluding date. Once the season is broken down into months, all impact reports are assigned to each of the three months, ensuring that the full seasonal information is captured for each month. After the post-processing, we converted the EDII entries into a “drought impact occurrence” (I) by determining the total number of impact occurrences (NI) for each NUTS1 region and month. The EDII data for UK NUTS1 regions, both before and after post-processing, is presented in Table 1. Three regions; North East England, Scotland, and Northern Ireland are excluded from the model development stage as there was insufficient drought impact data for the modelling approach.
Table 1Information about NUTS1 Regions: post-processed total number of impact occurrences (NI (PP)), Number of months with observed impact data (# Months (NI >0), Arable Area Ratio (AAR) and Population Ratio (PopR)).
In this study, we utilised key drought indicators; Standardised Precipitation Index (SPI) (McKee et al., 1993), Standardised Precipitation Evapotranspiration Index (SPEI) (Vicente-Serrano et al., 2010), and Standardised Soil Moisture Index (SSMI) (Afshar et al., 2022) to quantify drought conditions. All indicators are derived from the ERA5-Land (Muñoz-Sabater et al., 2021) precipitation, temperature, and soil moisture dataset. The primary reason for selecting the ERA5-Land reanalysis dataset was its global availability, which ensures the consistency and scalability of the data across different regions, although the data quality varies from place to place. This feature not only allowed us to comprehensively analyse drought conditions in the UK but also provided the potential to apply the machine learning models developed in this study to other regions, where appropriate. In practical terms, ERA-5-Land also offers potential for supporting near-real-time application in the UK, unlike current in-situ data streams available within current early warning tools such as the UK Water Resources Portal.
SPI measures precipitation anomalies, making it effective for identifying meteorological droughts, while SPEI incorporates both precipitation and potential evapotranspiration (PET) as an index of climatic water balance, to capture the combined effects of temperature and precipitation on drought severity. For the PET calculation, we used the FAO Penman-Monteith equation (Allen et al., 1998), a widely recognised method for estimating PET based on physical and climatic principles. This approach integrates various meteorological variables, including solar and thermal radiation, wind speed, dew temperature, and air temperature, all of which were sourced from the ERA5-Land dataset. SPI and SPEI were calculated using a 1969 to 2010 reference period for 1, 3, 6, 9, 12, 24-, and 48-month accumulation periods to capture a range of drought conditions.
The SSMI, on the other hand, evaluates soil moisture variability, offering critical insights into agricultural and hydrological drought impacts. For the SSMI, we used all four levels of soil moisture (volumetric soil water) data available in the ERA5-Land dataset. These levels correspond to different soil depths: 0–7, 7–28, 28–100, and 100–255 cm. By incorporating soil moisture data across multiple depths, we were able to capture a more comprehensive view of soil moisture dynamics, which is crucial for understanding both short-term and long-term drought impacts on agriculture and hydrology. For the SSMI calculation, normalisation was applied to the soil moisture by first calculating the long-term (1970–2022) mean and standard deviation of soil moisture for each month across the study period. The SSMI was then computed by subtracting the long-term mean for a given month from the soil moisture value and dividing the result by the long-term standard deviation (Afshar et al., 2022).
In addition to the drought indicators, we also incorporated regional information, such as Land Cover Class (LCC) based arable area ratio (AAR) and Population Ratio (PopR), as predictors in the models. These regional variables were treated as static values, reflecting the underlying characteristics of the region. The AAR was obtained from the CORINE Land Cover dataset (Copernicus Land Monitoring Service, 2020), where we calculated the ratio of non-irrigated agricultural land in each NUTS1 region over the UK. This metric provided valuable context for understanding the vulnerability of different regions to drought impacts, particularly in terms of agricultural land use. Although most of the drought impact reports across the UK are dominated by hydrological impacts, we included the AAR as a predictor to assess whether the model would reflect this pattern by assigning lower importance to it. The PopR obtained from the WorldPop 2020 dataset (Tatem, 2017), representing the proportion of the population in each NUTS1 region, was also included as a predictor. Regions with higher population densities may not only experience different drought impacts due to increased human exposure but are also more likely to have those impacts reported. These regional variables included into model to enhance its ability to predict drought impacts by accounting for regional susceptibility and socio-economic factors that could also influence the report-based impact dataset. The AAR and PopR values for UK NUTS1 regions, are given in Table 1.
All drought indicators in this study were calculated by first averaging the required input variables such as precipitation, PET, or soil moisture over the NUTS1 region. This regional averaging process ensures that the data is representative of the regional conditions, capturing spatial variability within the defined area. Once the regional averages were computed, the drought indices, including SPI, SPEI, and SSMI, were calculated. A total of 20 predictors (18 drought indicators and 2 regional variables) were used to predict the NI.
Multicollinearity, a condition where predictors are highly correlated, can negatively impact the accuracy of linear models by inflating coefficient estimates and making the model unstable. However, in this study, we chose not to eliminate collinear variables initially to ensure the development of a generalizable model that could be applied across different NUTS1 regions or other locations. By including all drought indicators as predictors, we aimed to capture the full range of potential influences on drought impacts, recognising that while these indicators may be collinear in some regions, they might not exhibit the same relationships in others. Subsequently, we discarded indicators step by step to analyse their effects on prediction performance, enabling us to better understand the contribution of individual predictors while maintaining the model's overall adaptability.
2.2 Machine Learning Algorithms
In this study, we evaluated five machine learning algorithms to predict drought impacts. Random Forest (RF) (Breiman, 2001), an ensemble method based on decision trees, was used for its ability to handle non-linear relationships and interactions between variables. Quantile Random Forest (Quantile RF) (Meinshausen, 2006) extends RF by providing not only point predictions but also uncertainty estimates, making it suitable for predicting drought impacts with varying levels of confidence. The eXtreme Gradient Boost (XGBoost) (Chen and Guestrin, 2016), a powerful gradient-boosting algorithm, was selected for its efficiency and high performance in handling large, complex datasets. Additionally, we employed Least Absolute Shrinkage and Selection Operator (Tibshirani, 1996) with Cross-Validation (LASSOCV), a regression method that performs both variable selection and regularization to improve model interpretability and prevent overfitting. Finally, LR was included as a baseline model to compare with more complex algorithms, offering insights into the relationship between drought indicators and impacts through a simple, interpretable approach. The caret package in R (Kuhn, 2008) was used for all model implementations.
All details regarding the ML models used in this study can be found in the relevant references and the model parameters used can be found in the Supplement in Table S1. These sources provide comprehensive information on the algorithms, their implementation, and their application in similar contexts, allowing for a deeper understanding of the methods employed.
2.3 Model Development, Training and Validation
For the model development, we used the monthly NI values as the predictand, representing the observed drought impacts in the UK. The drought indicators (SPI, SPEI calculated over various accumulation periods and SSMI at 4 different levels) served as the predictors in the models, alongside regional information such as AAR and PopR. The generalized ML models were developed using datasets from all UK regions at the NUTS1 level, with all sectoral impact reports aggregated into a single category representing drought impact, rather than adopting a region- or sector-specific modelling strategy. This country-scale framework enhances the model's applicability across diverse spatial contexts and enables the use of a larger, more diverse dataset, providing the necessary data points (3108 data points from 12 months ×7 NUTS1 regions ×37 years; 1970–2006) to train models that are both accurate and generalizable across the entire country. To ensure robust model performance and prevent overfitting during training of the models, we applied two different cross-validation (CV) approaches.
Type 1 CV: We applied a repeated 10-fold cross-validation method, which involves partitioning the data into ten subsets, training the model on nine subsets, and testing it on the remaining subset. This 10-fold process was repeated three times, and the results were averaged to provide a more reliable estimate of the model's performance.
Type 2 CV: To further evaluate the model's ability to generalize across both spatial and temporal dimensions, we implemented an additional cross-validation strategy. In this approach, the data was divided into 44 subsets (comprising 37 years and seven NUTS1 regions). The model was trained using data from 36 years and then used to predict the drought impact for each of the 44 subsets, at each step. Additionally, predictions were made for each NUTS1 region using data from the other six regions. The overall performance of the model was assessed based on the accuracy of these 44 independent predictions, encompassing both temporal and spatial validation.
The Type 2 CV approach was applied only to the best-performing model identified through the Type 1 CV process. This additional validation was conducted to assess whether there was any improvement in the model's performance when accounting for both spatial and temporal variation. This also ensures the model's spatial-temporal transferability, as considered in Stephan et al. (2023).
Additionally, data from two NUTS1 regions (East of England and South East (England)) and six years (2007–2012) from the remaining regions were reserved for independent validation (1536 data points), providing an unseen dataset to assess the model's ability to predict drought impacts for data that were not part of the training phase. This method allowed us to comprehensively evaluate the model's predictive power and ensure its applicability across different regions and time periods in the UK. To extend the independent validation beyond the UK border, we also ran the model over three selected NUTS1 regions in Germany for period between 1970–2018 (1764 data points), based on drought impact data availability. Details of the selected NUTS1 regions are provided in Table S2.
After generating predictions for the monthly number of drought impact reports (NI), we converted these predicted values into drought severity measures using the percentile methodology, which preserves the true scale of impacts while addressing biases present in reports across different regions (Shyrokaya et al., 2024). Predicted values were ranked within the historical distribution of predicted drought impact reports for each NUTS1 region, and a corresponding percentile rank was assigned. The conversion used the tercile methodology, with the lower, middle, and upper terciles now referred to as minor (0 %–33 %), moderate (33 %–66 %), and significant impacts (66 %–100 %), respectively; this updated terminology replaces the original names from Shyrokaya et al. (2024) to better reflect the statistical distribution of the data while maintaining a drought impact interpretation. Any predicted values less than one were set to zero prior to conversion. To evaluate model accuracy in predicting the occurrence or non-occurrence of drought impacts, both observed and predicted NI values were converted into binary form (0 and 1), with 1 indicating months with impacts and 0 indicating no impact. This procedure provides a standardized way to interpret predicted drought impact reports in the context of past events, allowing a clearer understanding of drought severity and its potential impacts based on model predictions.
2.4 Performance Metrics
All machine learning models were trained using Root Mean Squared Error (RMSE) as the performance metric during the training phase based on observed and predicted monthly NI values, with Mean Absolute Error (MAE) and r2 also reported for comparison with previous studies. However, to assess the final model performance and overall accuracy, we used Area Under the Curve (AUC) as the evaluation metric. The AUC metric was calculated to evaluate model performance, both for the binary classification (0–1) of drought impacts and for drought severity categories. To assess the model's ability to discriminate between drought and non-drought conditions, the AUC for the binary classification (AUCbinary) was computed. The model performance of predicting severity categories was evaluated using macro averaging (Baccianella et al., 2009), which calculates the AUC for each class individually and then takes the arithmetic mean of the results (AUCclass). This macro averaging approach ensures that the performance of the model is assessed across all drought severity categories, providing a balanced evaluation of its predictive capability across different levels of drought impact. In interpreting the results, higher AUC values correspond to greater predictive accuracy, with an AUC of 0.5 indicating performance equivalent to random chance, and values approaching 1.0 reflecting a model with strong discriminatory capability.
In addition to evaluating overall model performance, we also assessed the importance of individual features to understand their influence on the model's predictions. To do this, we used the varImp function from the caret package in the R environment, which calculates variable importance based on the specific model type employed (Kuhn, 2008). For tree-based models, such as random forests and decision trees, importance is typically measured by metrics reflecting the reduction in node impurity, such as the total decrease in Gini impurity or the mean decrease in accuracy. These metrics indicate the relative contribution of each feature to the predictive capability of the model. Beyond the performance metrics, we also assessed the multicollinearity of the predictors in the linear models by calculating the Variance Inflation Factor (VIF) and the Pearson correlations among the drought indicators.
2.5 Impact Forecasting and Gridded Impacts
Impact forecasting involves predicting the potential impacts of an event, such as drought, using relevant data and ML techniques. In this approach, we used lagged drought indices at various time scales (e.g., 1, 3, 6, 9, 12, 18, and 24-months lead times) as predictors to generate forecasts. Therefore, the forecast models for different lead times were trained using corresponding lagged predictors. For example, to forecast drought impacts in May 1995 at a 3-month lead time, the model was trained using predictors from February 1995. Additionally, the likelihood of drought occurrences was calculated using the same lagged indices approach. For this purpose, the model was retrained in classification mode rather than regression mode to classify the occurrence or non-occurrence of drought impacts, thereby enabling probabilistic predictions of drought impact likelihood. This dual use of regression and classification enhances both the precision of forecasts and the ability to assess drought risk. All forecast models were also trained by using the Type 2 CV approach. For the forecasting module (Fig. 1 – Stage3), we only used the best-performing ML algorithm evaluated based on its prediction phase (where all the predictors are obtained from the same month as impact observed) accuracy. Differing from the ML algorithm comparison section, we developed two individual models to forecasts NI values (to later converted into severity categories) and likelihood of occurrences.
In the final step, to produce gridded impact predictions and forecasts, all predictors were calculated at the original spatial resolution of approximately 9 km grid cells across the UK, while AAR and PopR were kept constant for all grid cells within each NUTS1 region. These gridded predictors were then input into the best-performing machine learning model, enabling impact predictions at the same high spatial resolution. This approach provides detailed spatial information, allowing for a clearer and more precise understanding of the geographic distribution of drought impacts across the country.
Building upon the established methodological framework and data preparation, this section presents a comprehensive evaluation of the machine learning models' performance, along with the forecasts and gridded results produced by the best-performing model.
3.1 Comparison of Models
As the first step of our evaluation, we compared the performance of the models based on the RMSE obtained during both the training and independent validation periods. Table 2 shows the performance metrics of various models based on Mean Absolute Error (MAE), Root Mean Squared Error (RMSE), r2, and Area Under the Curve (AUC) values for both binary and classification tasks. The training MAE, RMSE, and r2 values are calculated from cross-validation (average of the metrics obtained from each k-fold prediction), while the AUC values are derived from the final run of the calibrated models.
Focusing on RMSE, which measures the prediction error between the observed and predicted total number of impact occurrences, Random Forest (RF) achieves the lowest RMSE values in both training (3.74) and independent validation (4.77) periods compared to the other models. This suggests that RF has the best predictive accuracy, making it the most reliable model for minimising error. In contrast, models such as LASSOCV and LR exhibit significantly higher RMSE values (5.25 and 5.06, respectively, in the validation phase), indicating worse predictive performance. The XGBoost model, despite being known for its high efficiency in many machine-learning tasks, has an RMSE of 4.95 during validation, slightly higher than RF, which suggests it may be not generalising well to the unseen data.
Examining AUC values, RF also performs well in both binary and classification tasks, with AUCbinary values of 0.94 (training) and 0.78 (validation), which are higher than those of the other models. Quantile Random Forest (QRF) has similar AUC values in training (0.94) but lower in validation (0.60). XGBoost, which often excels in classification problems, has lower AUC values (0.76 in training and 0.70 in validation), suggesting that it may not be as effective in handling the dataset compared to RF. The LASSOCV and LR models show the weakest AUC values, indicating poor classification capability.
Overall, the superior performance of RF in terms of lower RMSE and higher AUC values suggests that it captures the underlying patterns in the data better than the other models. The relatively poor performance of models like LASSOCV and LR stem from their inability to capture complex nonlinear relationships, leading to higher prediction errors. XGBoost, despite being a strong model, might require further hyperparameter tuning or additional feature engineering to improve its generalisation capability (Chen and Guestrin, 2016).
The selection of RF as the best-performing model is further supported by previous studies (e.g. Hobeichi et al., 2022), which have consistently identified RF as the most effective model for drought impact prediction using indicators. Additionally, RF is not only accurate but also easy to use, making it a practical choice for similar predictive tasks and/or operational systems.
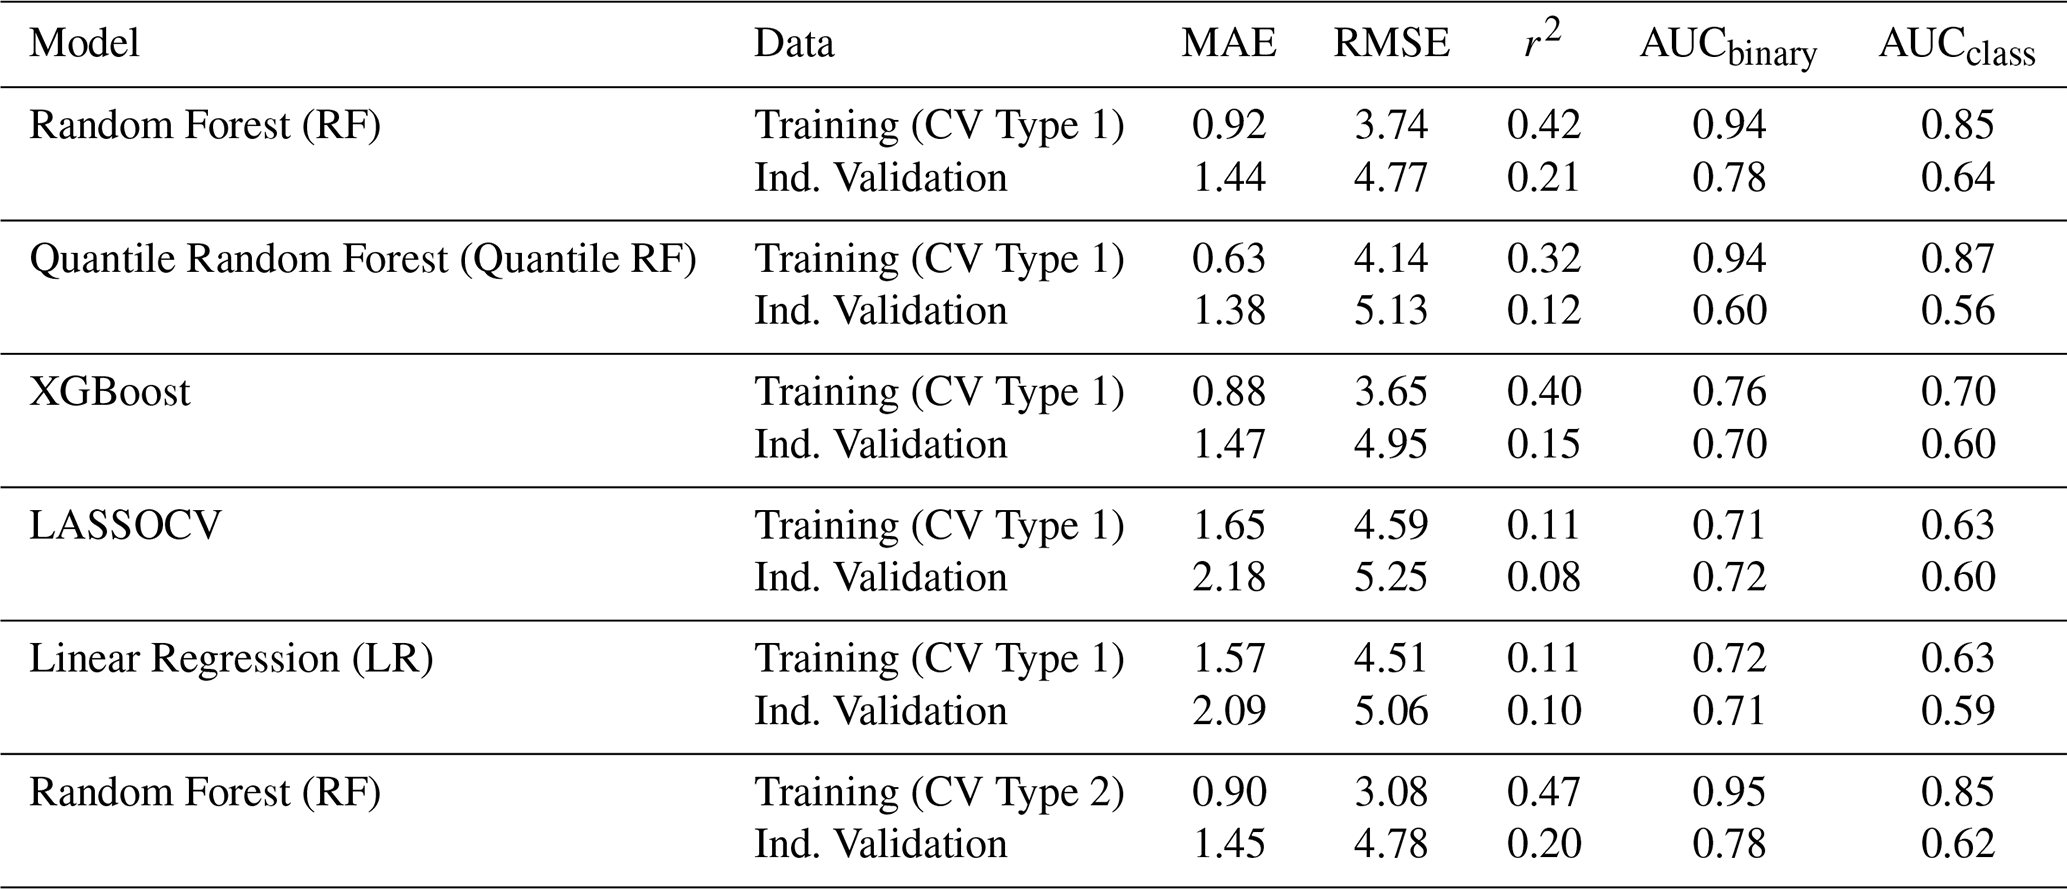
After the RF model was evaluated as the best-performing model according to the CV Type 1 approach, we further calibrated it using the CV Type 2 approach, which allows us to assess its accuracy across different time periods and spatial regions. RF CV Type 2 achieved strong training metrics (RMSE =3.08 and r2=0.47) and maintained competitive validation results (RMSE =4.78), comparable to RF CV Type 1 but with slightly improved training performance. Additionally, RF CV Type 2 achieved high AUCbinary (0.95) and AUCclass (0.85) scores, reflecting its robustness in classification tasks. Therefore, from this point onward, the following analysis refers to the results of the CV Type 2 RF model (hereafter referred to as RF).
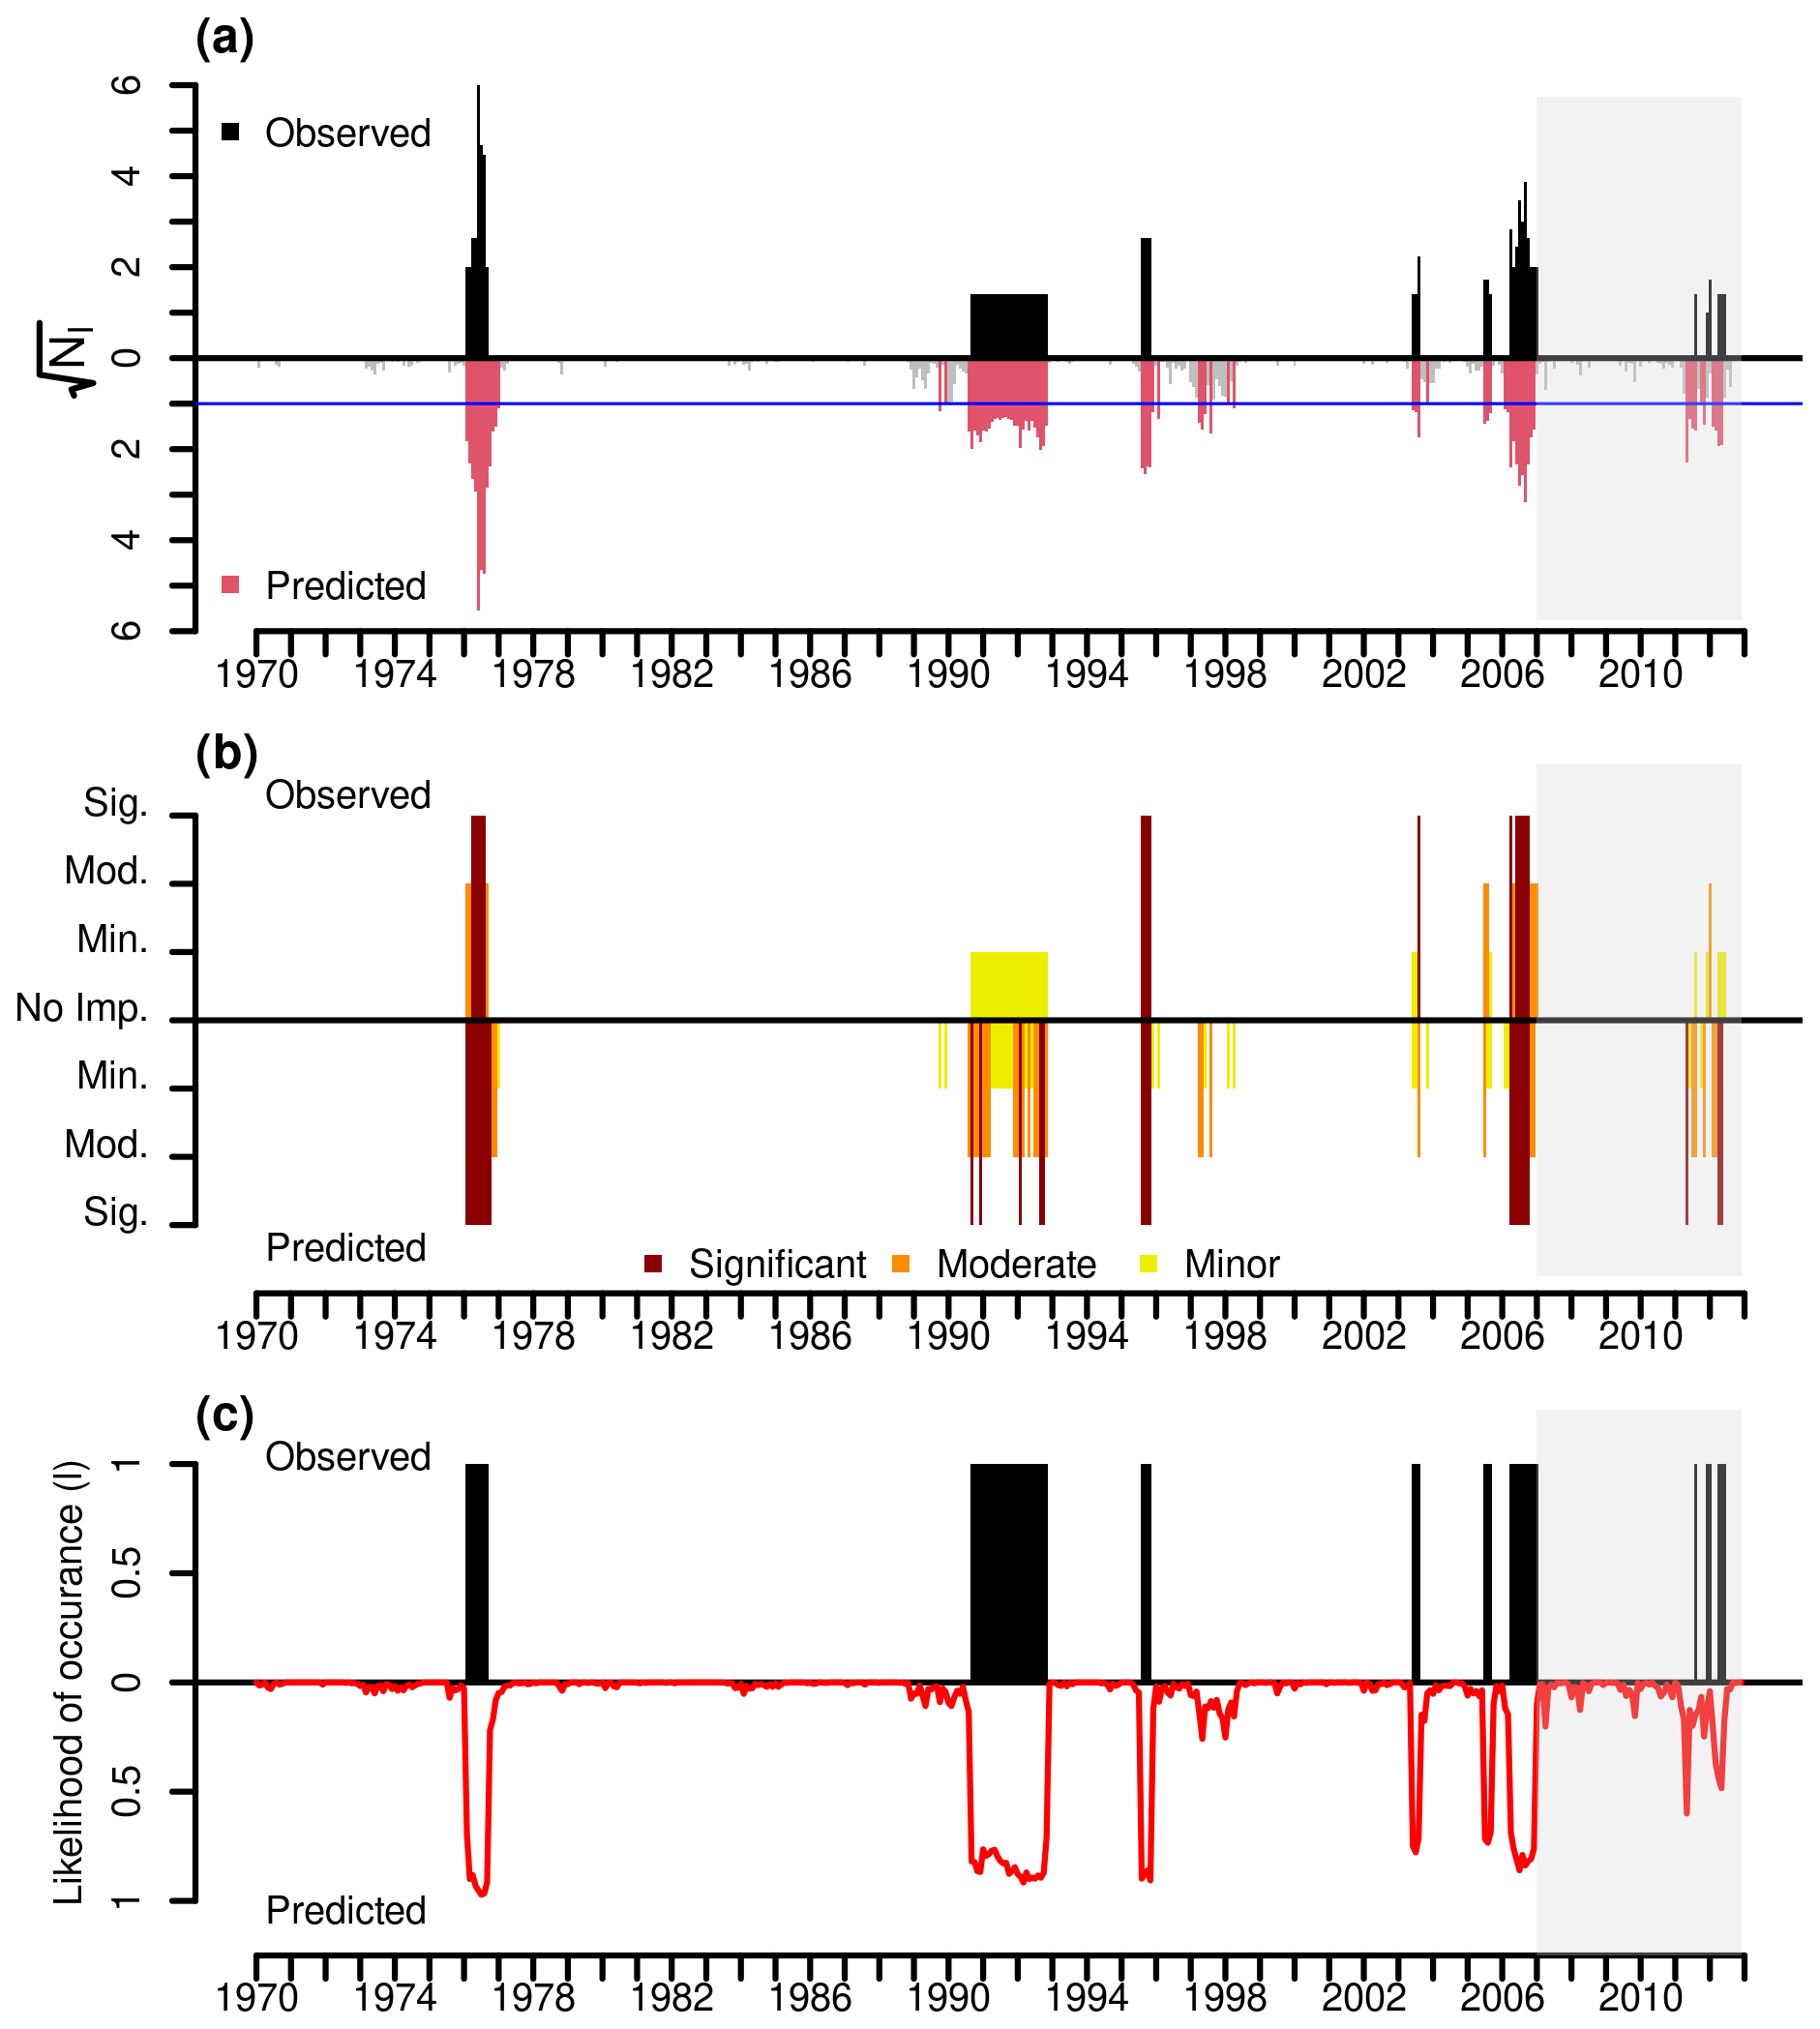
Figure 2Observed and predicted number of impacts (NI), severity categories, and likelihood of occurrences for the NUTS1 London region. In all panels, the positive y-axis shows observed values and the negative y-axis shows predicted values. Panel (a) shows NI values (square root transformed) from the Random Forest model, with the blue line marking the threshold below which NI is set to zero. Panel (b) shows severity categories (tercile method), and panel (c) shows likelihood of occurrence. Grey shading indicates the independent validation period (2007–2012).
3.2 Predictive Performance of the Generalized ML Model for the UK
In Table 2, the overall results for the UK were compared, and the best-performing model was identified. From this point onward, we will evaluate the performance of the generalized RF model across each NUTS1 region. London was initially selected as a representative NUTS1 region to demonstrate the conversion of predicted NI into severity categories and to generate likelihood of occurrence plots. In this case, the model first predicted NI values, which were then classified into predefined severity levels. Additionally, a separate Random RF model, using the same input variables, was developed to estimate the likelihood of occurrence. The results of both models are presented in Fig. 2.
The figure shows an example of the conversion of both predicted and observed NI values (Fig. 2a) into severity categories (Fig. 2b) and predicted likelihood of the occurrences (Fig. 2c) for London. The variation across different classes is clearly visible in panel (b), where the differences in raw NI values are less pronounced, as shown in panel (a). However, the model predicts the time of occurrences with good accuracy, regardless of the severity category. Panel (c) indicates that the predicted likelihood of occurrence (red line) remains relatively responsive in the independent validation period, but some observed events (black bars) are not fully anticipated by the model, suggesting potential false negatives. The similar severity category and likelihood of occurrence plots for the four selected NUTS1 (Wales, North West England, South East (England), and East of England) are shown in Fig. 3. The South East (England) and East of England regions were used as spatially independent validation regions.
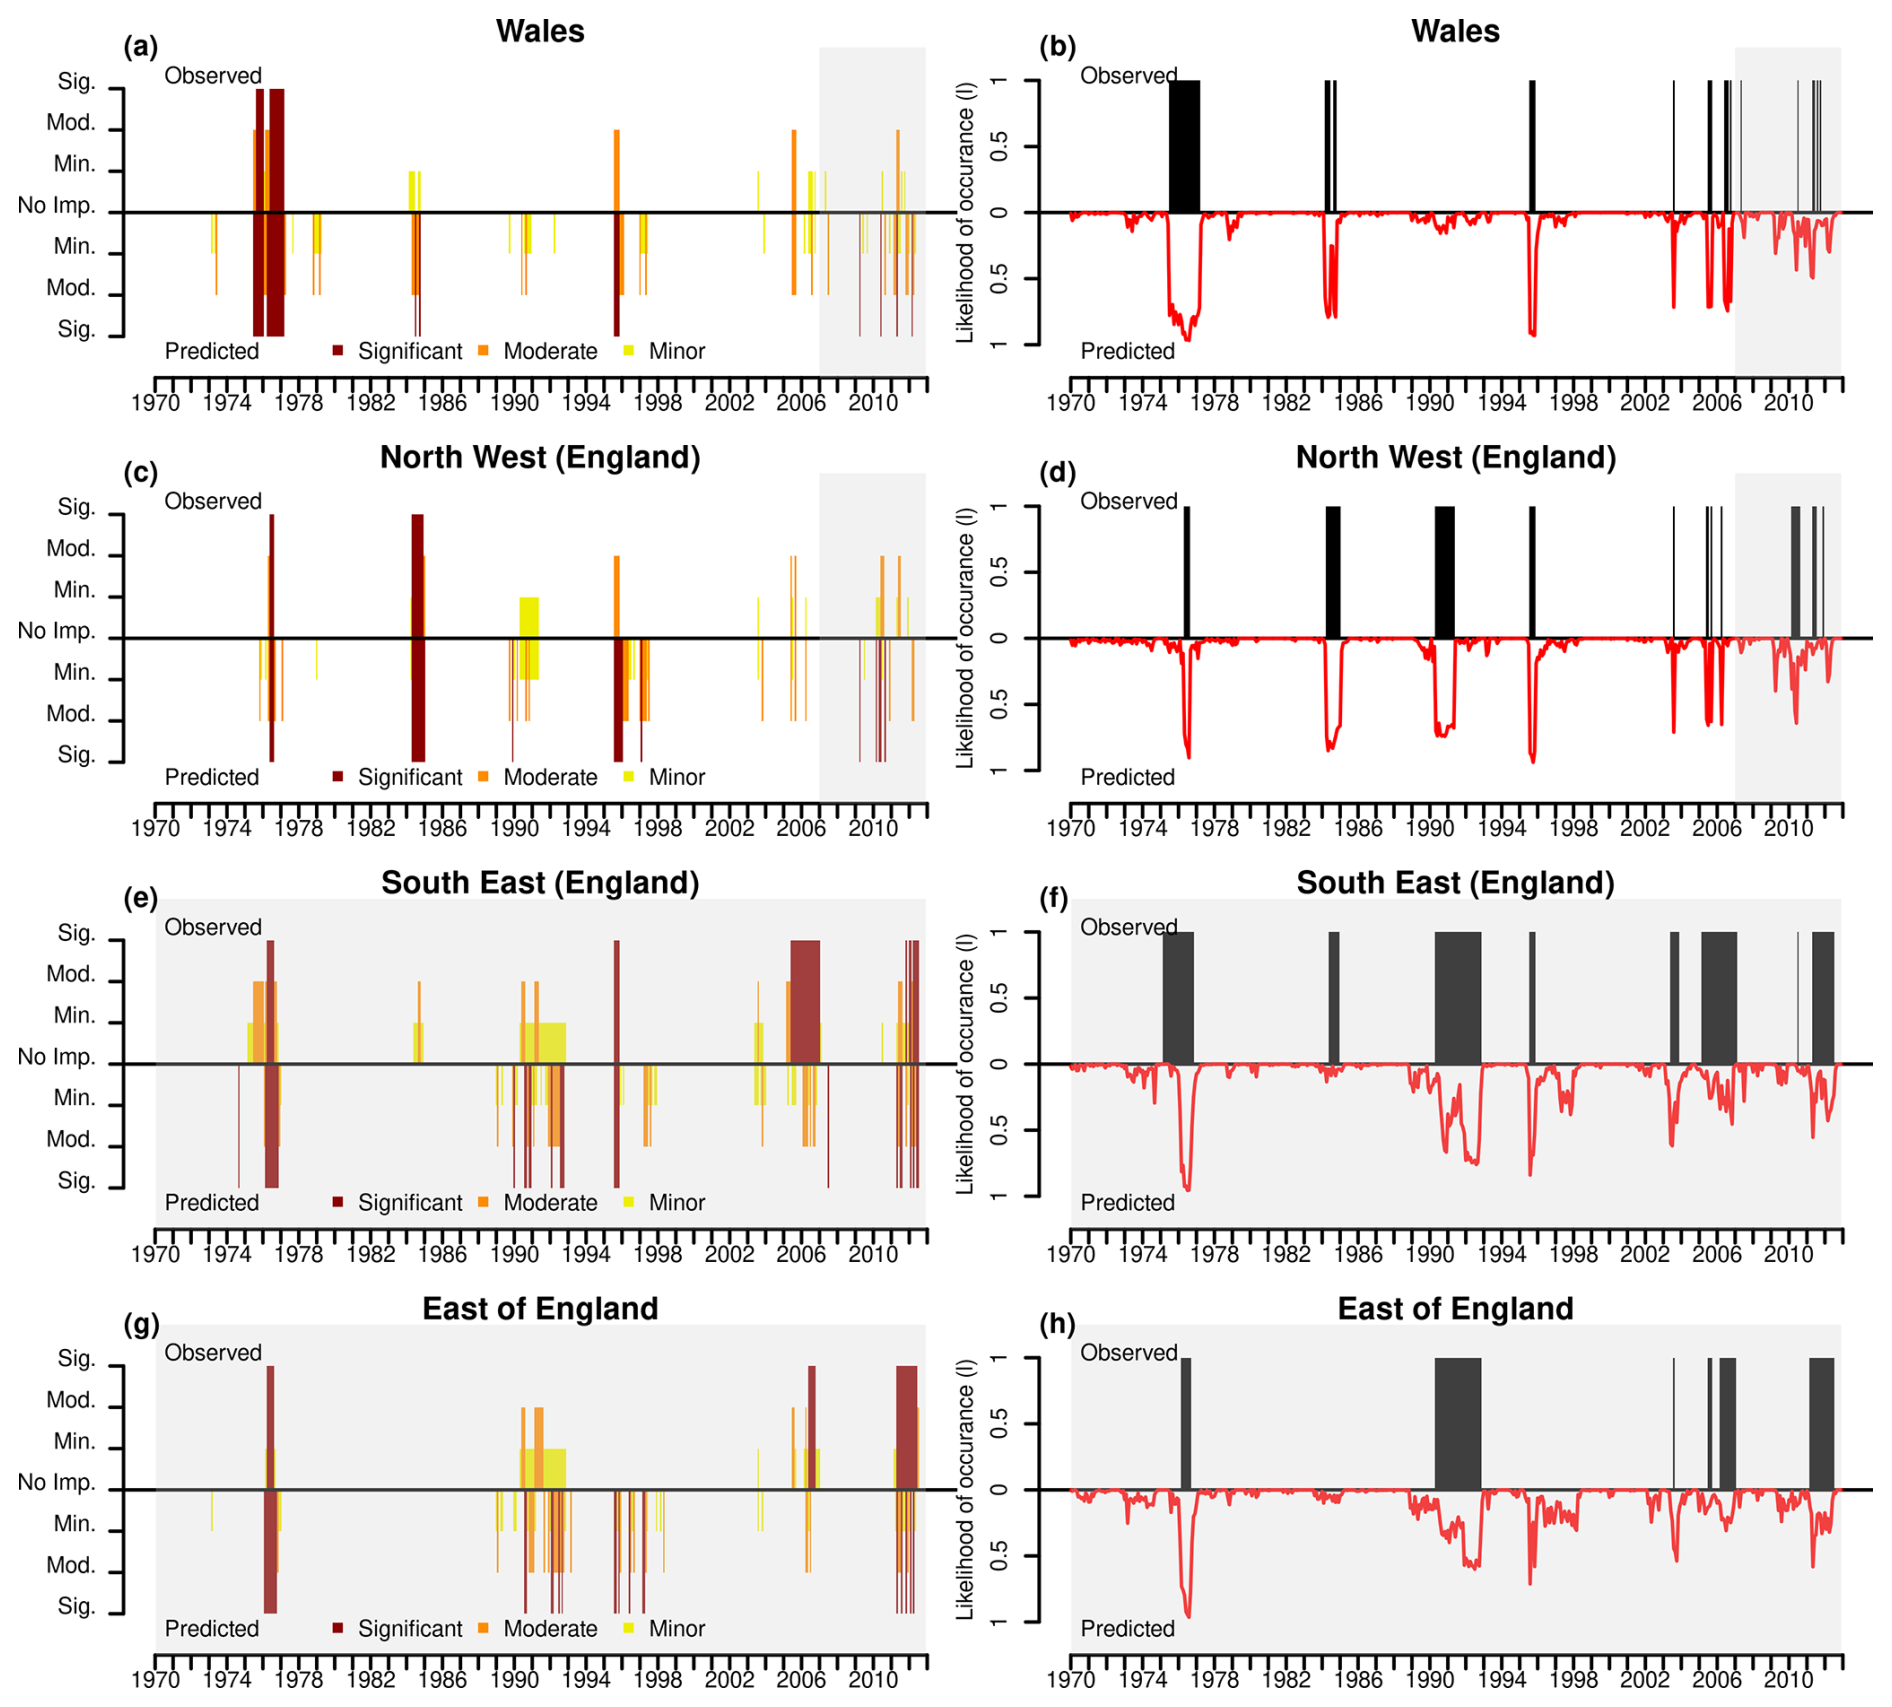
Figure 3Observed and predicted drought severity categories (a, c, e, g) and likelihoods of occurrence (b, d, f, h) for selected UK NUTS1 regions (1970–2012). In all panels, the negative y-axis shows predicted values and the positive y-axis shows observed values. Grey shading in panels (a)–(d) indicates the temporally independent validation period (2007–2012), while panels (e)–(h) (South East and East of England) indicate spatially independent validation.
In the severity categories plots (Fig. 3a, c, e, g), the model successfully captures significant and moderate drought impact periods, particularly in the early 1970s and mid-1970s across all regions. In Wales and North West England, the highest observed impact severities correspond well with the predicted ones, although there are some instances where the model underestimates or overestimates the magnitude of impacts (e.g. 1990 and 2010). South East (England) and East of England, as spatially independent validation regions, show a reasonable agreement between observed and predicted impact severities, with the model generally detecting periods of increased drought severity. However, there are some overpredictions in minor severity categories, particularly in more recent years (e.g. 1990–1995 period and around 1997), where the model assigns drought impacts even when none were observed.
The likelihood of occurrence plots (Fig. 3b, d, f, h) provide further insight into the model's predictive skill. Peaks in observed drought impact occurrences (black bars) align well with the predicted likelihood (red line) in several key drought periods. For example, in Wales and North West England, the model predicts high likelihood values during major drought events in 1974 and 1975, indicating that it successfully identifies periods of increased risk. In South East (England) and East of England, the model's likelihood values fluctuate more, but still demonstrate the ability to capture broad trends in drought impact occurrences. However, there are cases where the predicted likelihood remains relatively high even when no observed impacts occur, suggesting some false positives.
During the independent validation periods (grey-shaded areas in Fig. 3), the predictive performance of the model is particularly important. The model continues to provide reasonable impact severity predictions and likelihood estimates, reinforcing its capability to generalise beyond the training period. In spatially independent validation regions, such as South East (England) and East of England, the results remain meaningful, as the model can still identify drought-prone periods even without prior exposure to data from these areas. While some uncertainty remains, the overall patterns suggest that the model is effective in predicting drought impacts and capturing key drought events across different regions. The predictions of NI for all NUTS1 regions 1970–2012 are provided in Fig. S1 in th Supplement.
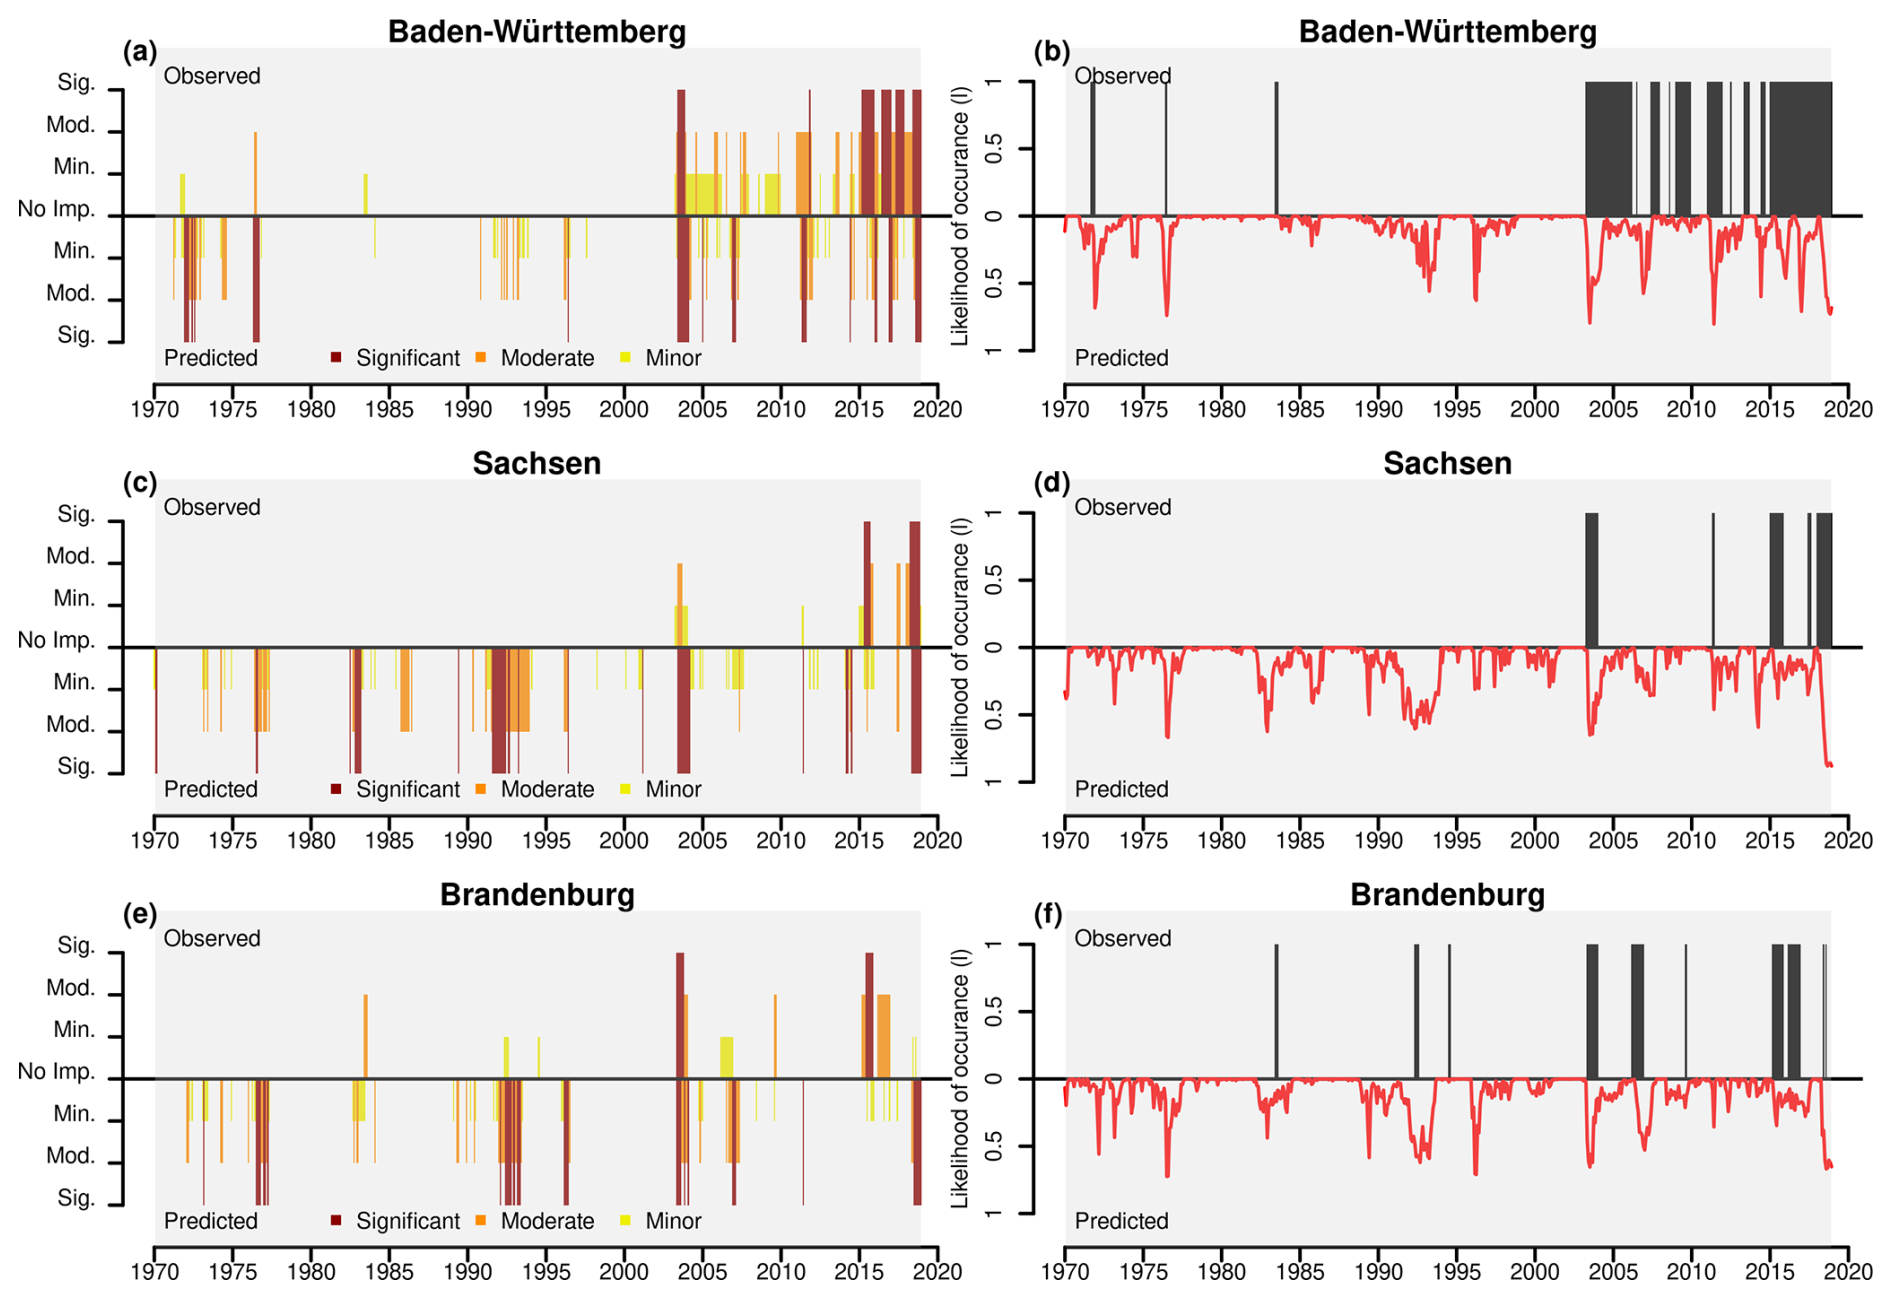
Figure 4Observed and predicted drought severity categories (a, c, e) and likelihoods of occurrence (b, d, f) for three German NUTS1 regions (1970–2020). In all panels, the positive y-axis shows observed values. Grey-shaded areas show the regions used for spatially independent validation.
To further evaluate the robustness of the model beyond the UK, we extended our validation to Germany to assess its predictive performance in a different geographical context (despite the model being exclusively trained on data from the UK). This validation allows us to examine whether the model can generalise well to new regions with potentially different environmental and socioeconomic conditions. The results, including both severity category classifications and the likelihood of occurrence predictions for occurrence in three German NUTS1 regions – Baden-Württemberg, Sachsen, and Brandenburg, are presented in Fig. 4.
The results demonstrate that the model performs well despite being trained on UK data, successfully capturing many observed moderate and significant events. Notably, in panels (a) and (b) for Baden-Württemberg, even single impact reports are detected by the model in both severity and likelihood, highlighting its sensitivity to capturing rare events. Similarly, around 1984 in panels (e) and (f) for Brandenburg, the model successfully identifies an observed impact, reinforcing its effectiveness in detecting individual occurrences or drought periods which have impacts. Some discrepancies exist where predicted severity does not align with recorded observations (e.g. 1976, 1990–1995). Likewise, the likelihood graphs reveal cases where the model predicts high occurrence probabilities without corresponding observed impacts. Overall, these findings emphasise the model's strong predictive capability, even when applied outside its original calibration region, while also underscoring the importance of comprehensive impact data to validate and refine predictions.
Table 3Performance Metrics of the RF Model for NUTS1 Regions in UK and Germany.
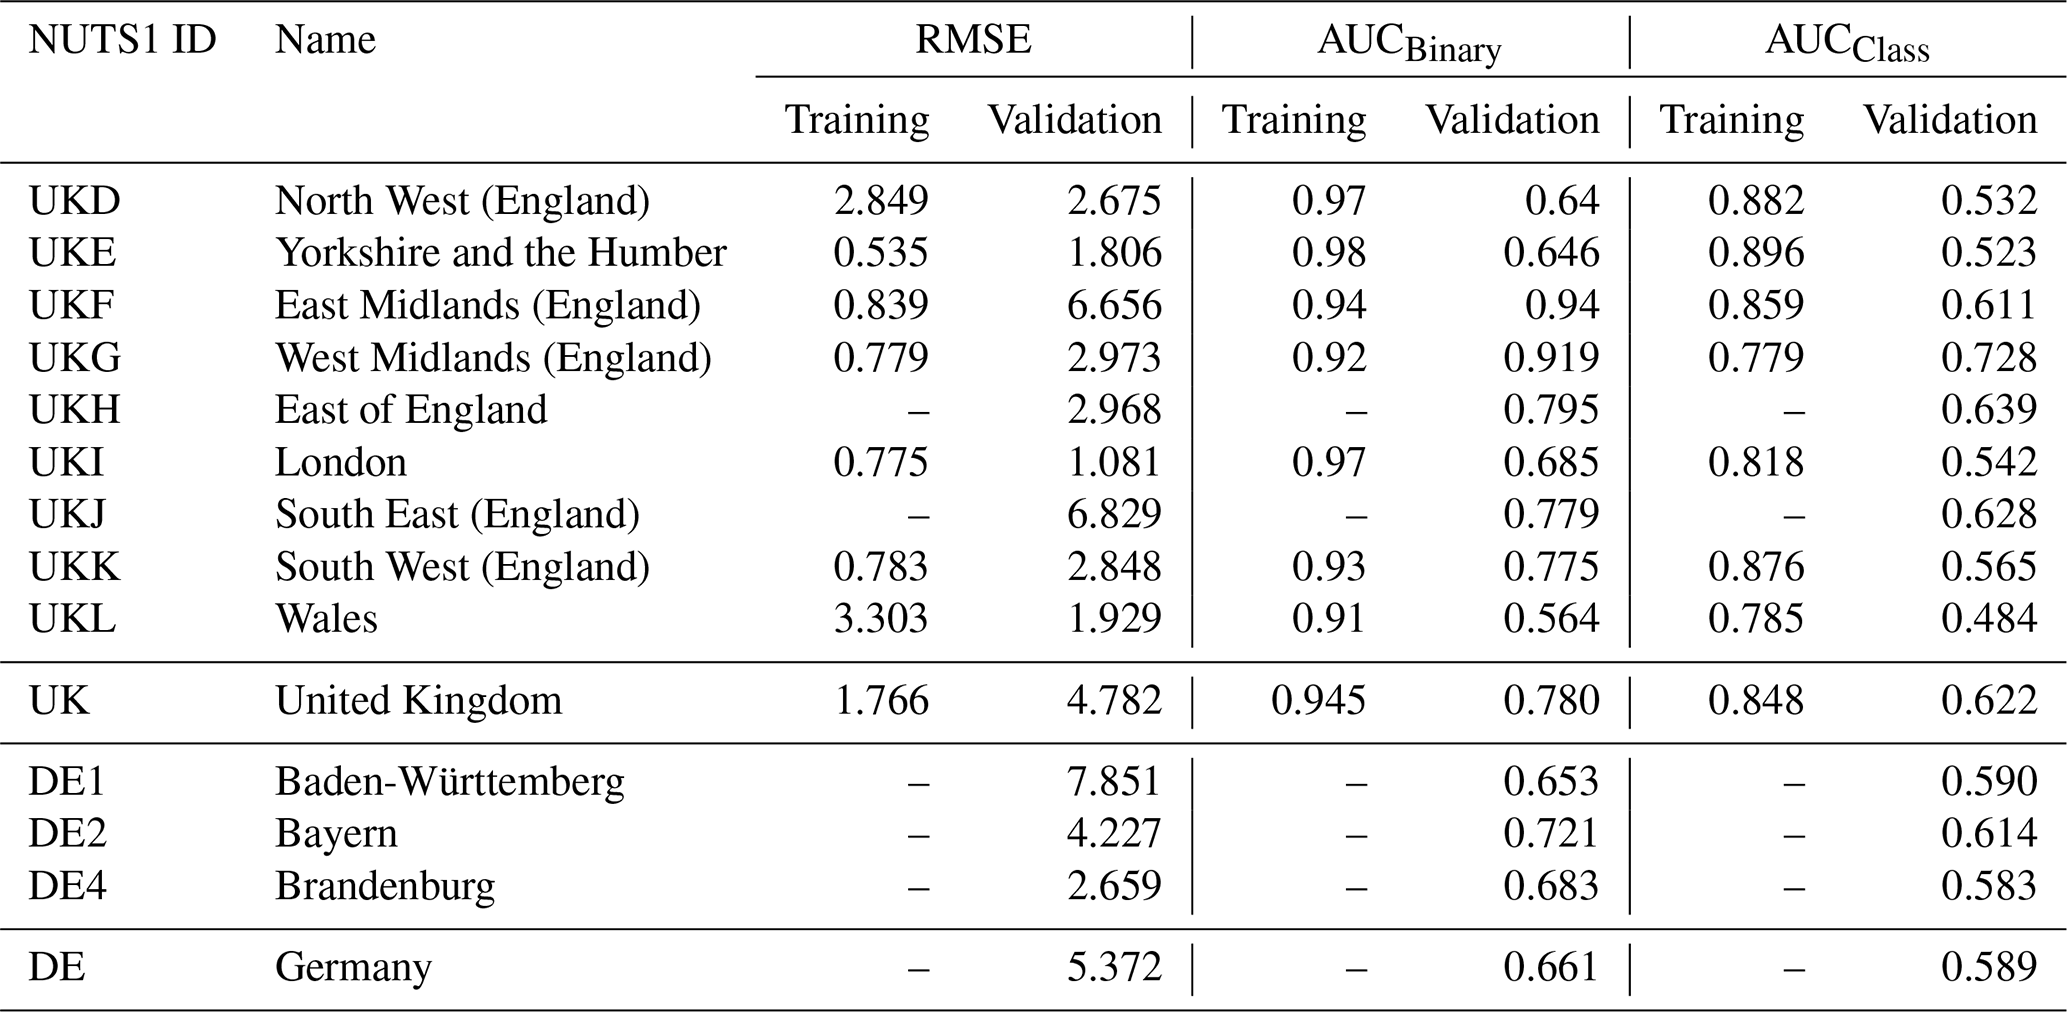
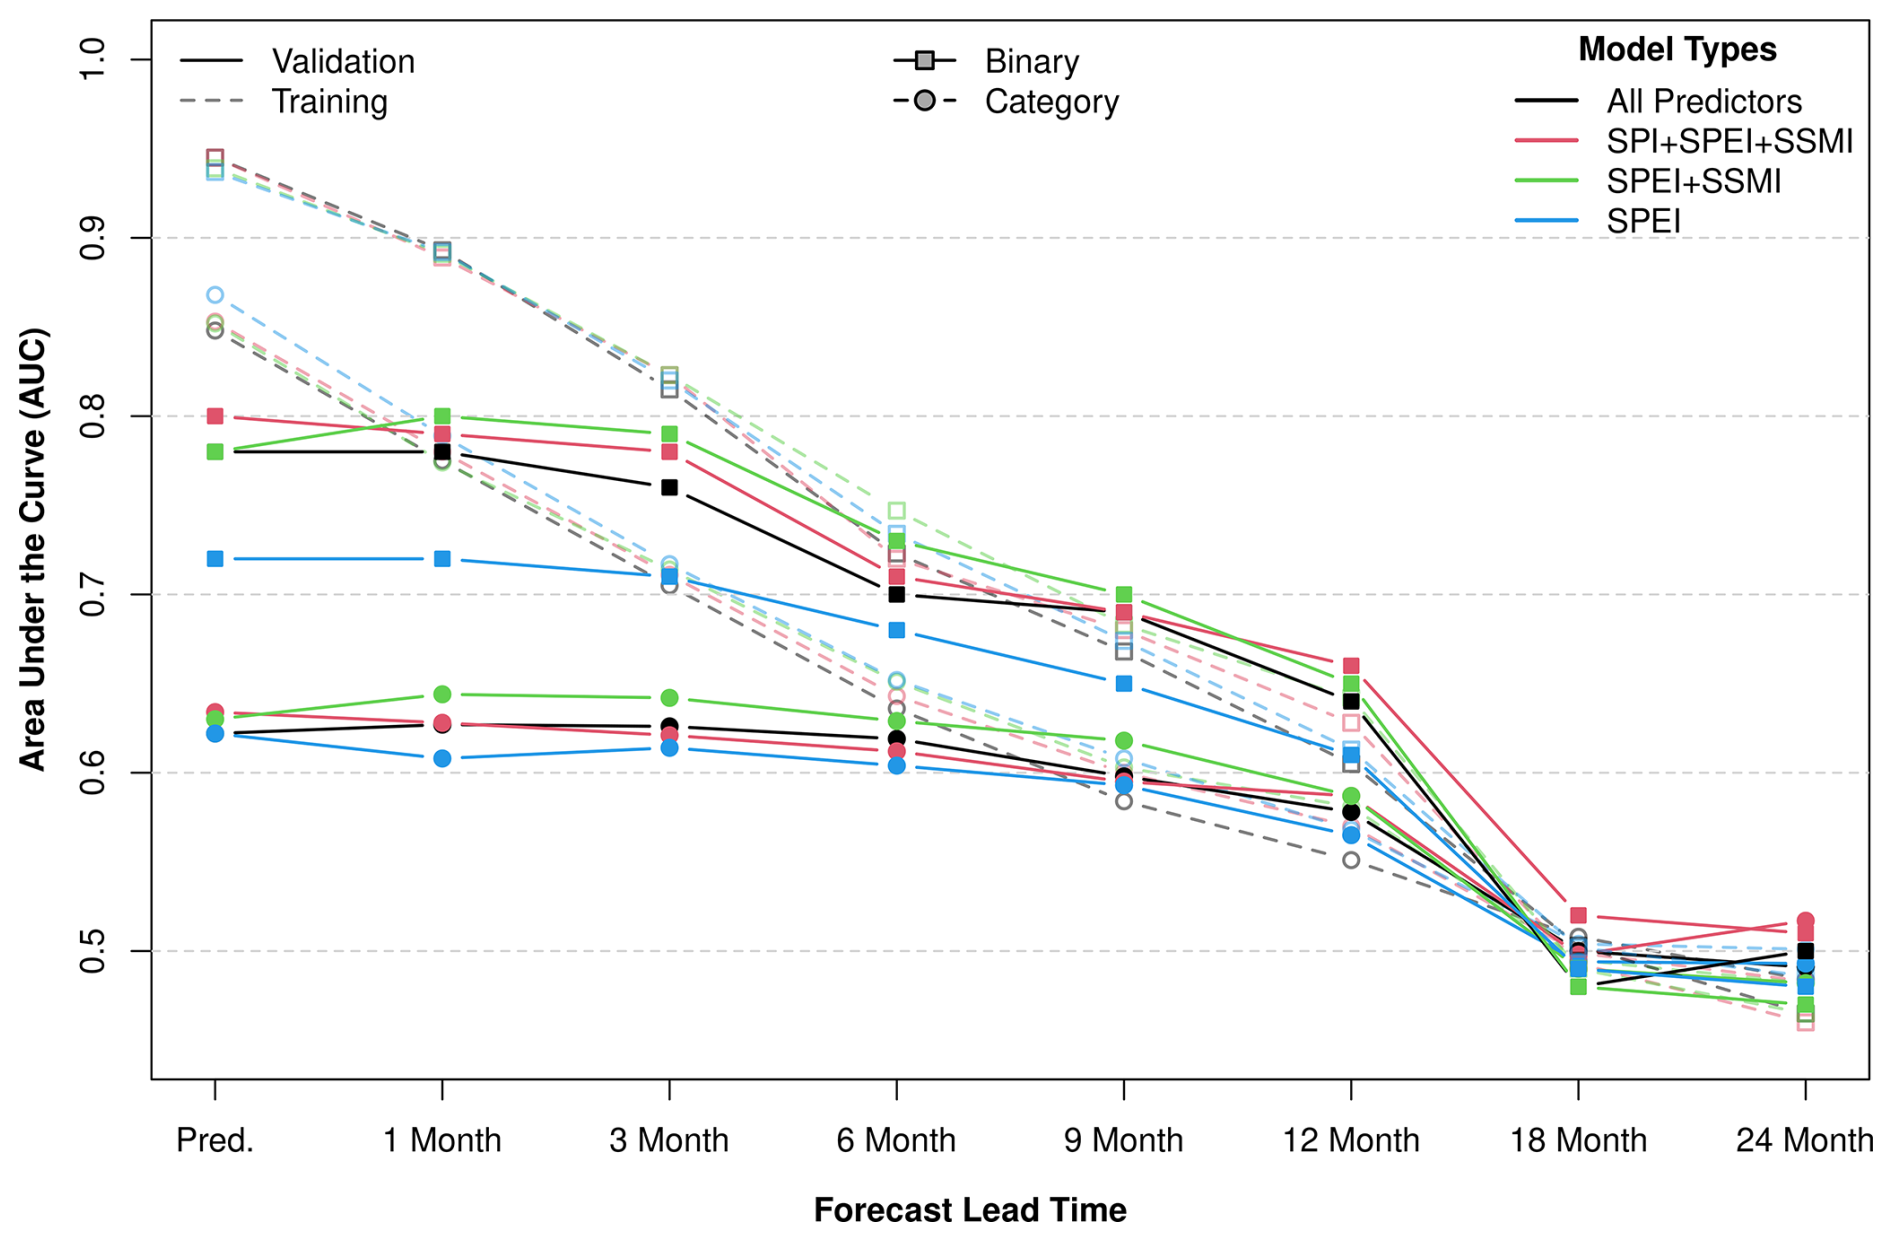
Figure 5Impact prediction and forecast accuracy (AUC) of the RF model for the UK in binary (squares) and categorical severity (circles) classifications. The x-axis shows lead times from prediction (“Pred.”) to 24-month forecasts, and the y-axis shows AUC. Colours indicate model configurations with different predictor sets (top-right legend), with the black line using all predictors. Dashed lines represent training performance and solid lines represent validation performance.
Table 3 provides the performance metrics (RMSE and AUC values) of the generalised RF model for predicting drought impacts across NUTS1 regions in the UK and Germany. The AUC values are presented separately for binary (AUCBinary) and categorical (AUCCategory) predictions where RMSE values are obtained from predicted and observed NI values. As expected, the UK achieves higher overall AUC values for both binary and categorical predictions, with validation averages of 0.780 (binary) and 0.622 (categorical). Germany shows lower performance, with validation averages of 0.661 (binary) and 0.589 (categorical). For binary predictions (validation), the East Midlands achieves the highest AUC value (0.940), reflecting excellent model performance. For categorical predictions (validation), the West Midlands achieves the highest AUC value (0.728), indicating strong prediction capability in this region. Relatively, the model performance was poorer in Wales and Brandenburg, particularly for categorical predictions in the validation phase. In general, the AUCclass values were notably lower than the AUCbinary values due to the stringent sensitivity of the macro-average AUC metric and the fact that the model was not specifically calibrated to predict severity classes (Table 3). These class values were determined separately for each region using percentiles derived from both predicted and observed impact reports. Consequently, lower AUCclass values are expected. For instance, if an observed “significant” impact is classified as “moderate” in the predictions, it is considered a misclassification, leading to a reduced AUC score.
3.3 Impact based Forecasting Results
We evaluated the RF model's ability to predict drought impacts over varying lead times by comparing different input datasets (i.e. varying combinations drought indicators and regional statistics). In this analysis, we systematically reduced the type of predictors to assess their individual contributions to prediction and forecasting accuracy.
Figure 5 presents the Area Under the Curve (AUC) values over different lead times, comparing model performances in both training (dashed lines) and validation (solid lines) phases. Notably, when AUC values drop below 0.6 or approach 0.5, this indicates poor predictive skill or no predictability, meaning the model performs only marginally better than random guessing. The general trend across all models shows a decline in AUC as lead time increases, indicating a decrease in predictive accuracy over longer periods. The binary classification results (squares) tend to achieve higher AUC values compared to categorical classification (circles), reflecting the higher sensitivity of categorical metrics. Notably, the training AUC (dashed lines) remains higher than the validation AUC (solid lines), especially at shorter lead times, suggesting some degree of model overfitting. The SPEI only model (light blue lines) had the lowest performance, meaning that using only predictors based on SPEI leads to weaker predictions. Beyond 12 months, AUC values for all models converge, suggesting that long-term predictions become less reliable regardless of the input data. The PopR and AAR does not significantly affect model accuracy, as similar AUC values are obtained from models with (black lines) and without (coloured lines) these predictors.
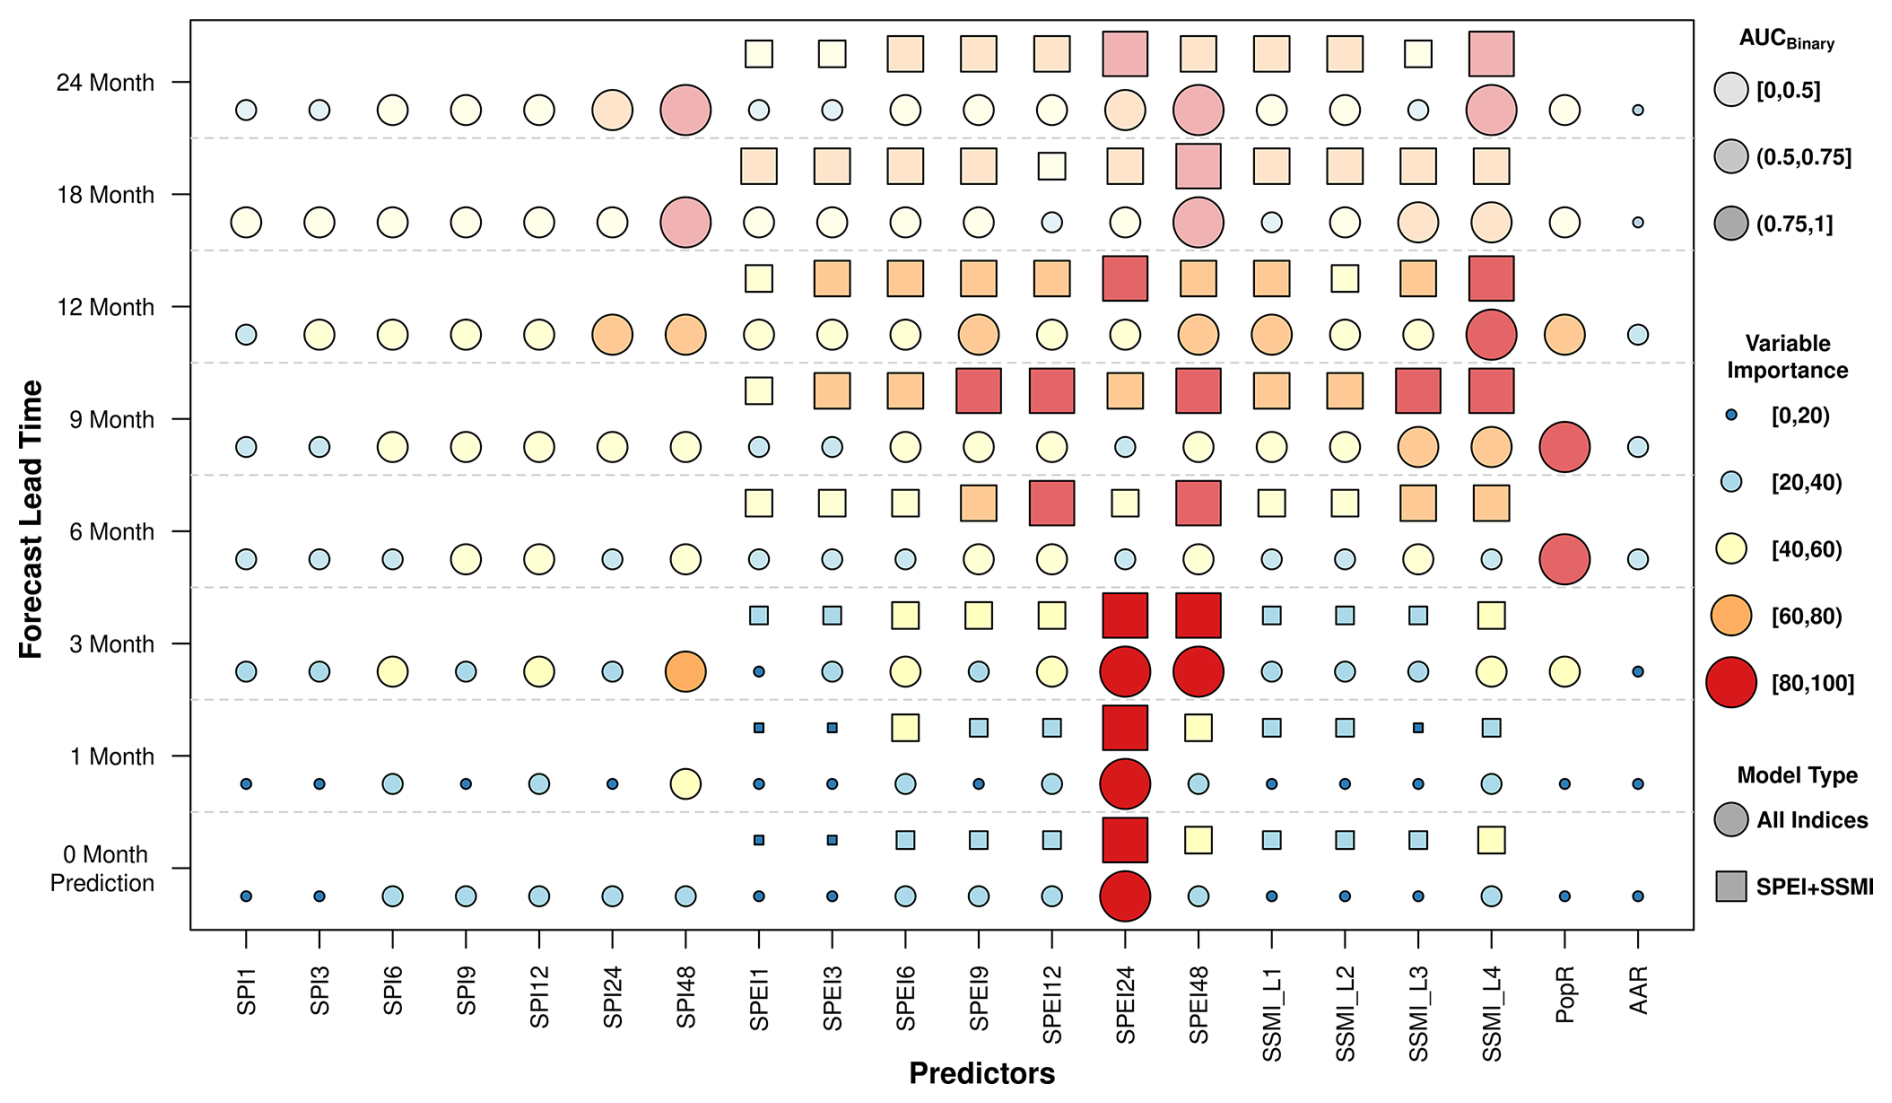
Figure 6Variable Importance values for Prediction and Forecast Lead Times obtained from two model types – “All Indices” (circles) and “SPEI+SSMI” (squares). The size of the markers represents variable importance, the colour indicates different levels of importance, and the transparency of the markers reflects the AUC values, with darker shades indicating higher predictive performance.
3.4 Impact of Drought Indices on Model Accuracy (Variable Importance)
After reviewing the overall performance trends shown in Fig. 5, we selected two model types (“All Indices” and “SPEI+SSMI”) to better understand the key variables influencing drought impact predictions. By comparing these model types, we aim to determine whether including all indices provides meaningful improvements or if a more focused selection of drought-related indicators (SPEI and SSMI) is sufficient. The results offer insights into how drought impact forecasts evolve over time, highlighting shifts in variable importance and the challenges associated with long-term predictions.
Figure 6 shows the importance of different predictors in forecasting across various lead times for the “All Indices” and “SPEI+SSMI” models. Up to a 3-month lead time, both models agree on variable importance by selecting SPEI24 as the most important variable. Similarly, at the 3-month lead time, both models also highlight SPEI48 and SSMI Level 4 as significant predictors. However, beyond 3 months, where the AUC values less than 0.75, the “All Indices” model starts prioritising population ratio (PopR) as the most important variable, while the AAR does not show any significant importance at any lead time. Beyond 6 months, the models show a noticeable shift in variable importance, with both approaches beginning to assign relevance to nearly all available predictors. This widespread distribution of importance suggests that rather than relying on a few dominant variables, the models attempt to incorporate as much information as possible to maintain predictive skill. This behaviour indicates that as lead time increases, the strength of individual predictor signals weakens, forcing the model to compensate by utilising a broader range of input variables. However, this does not necessarily improve accuracy, as seen in the overall transparency increase, indicating decreasing AUC values. The increased reliance on multiple predictors at longer lead times highlights the challenge of long-term drought forecasting, where the relationships between predictors and impacts become less distinct due to the influence of external, unmodeled factors.
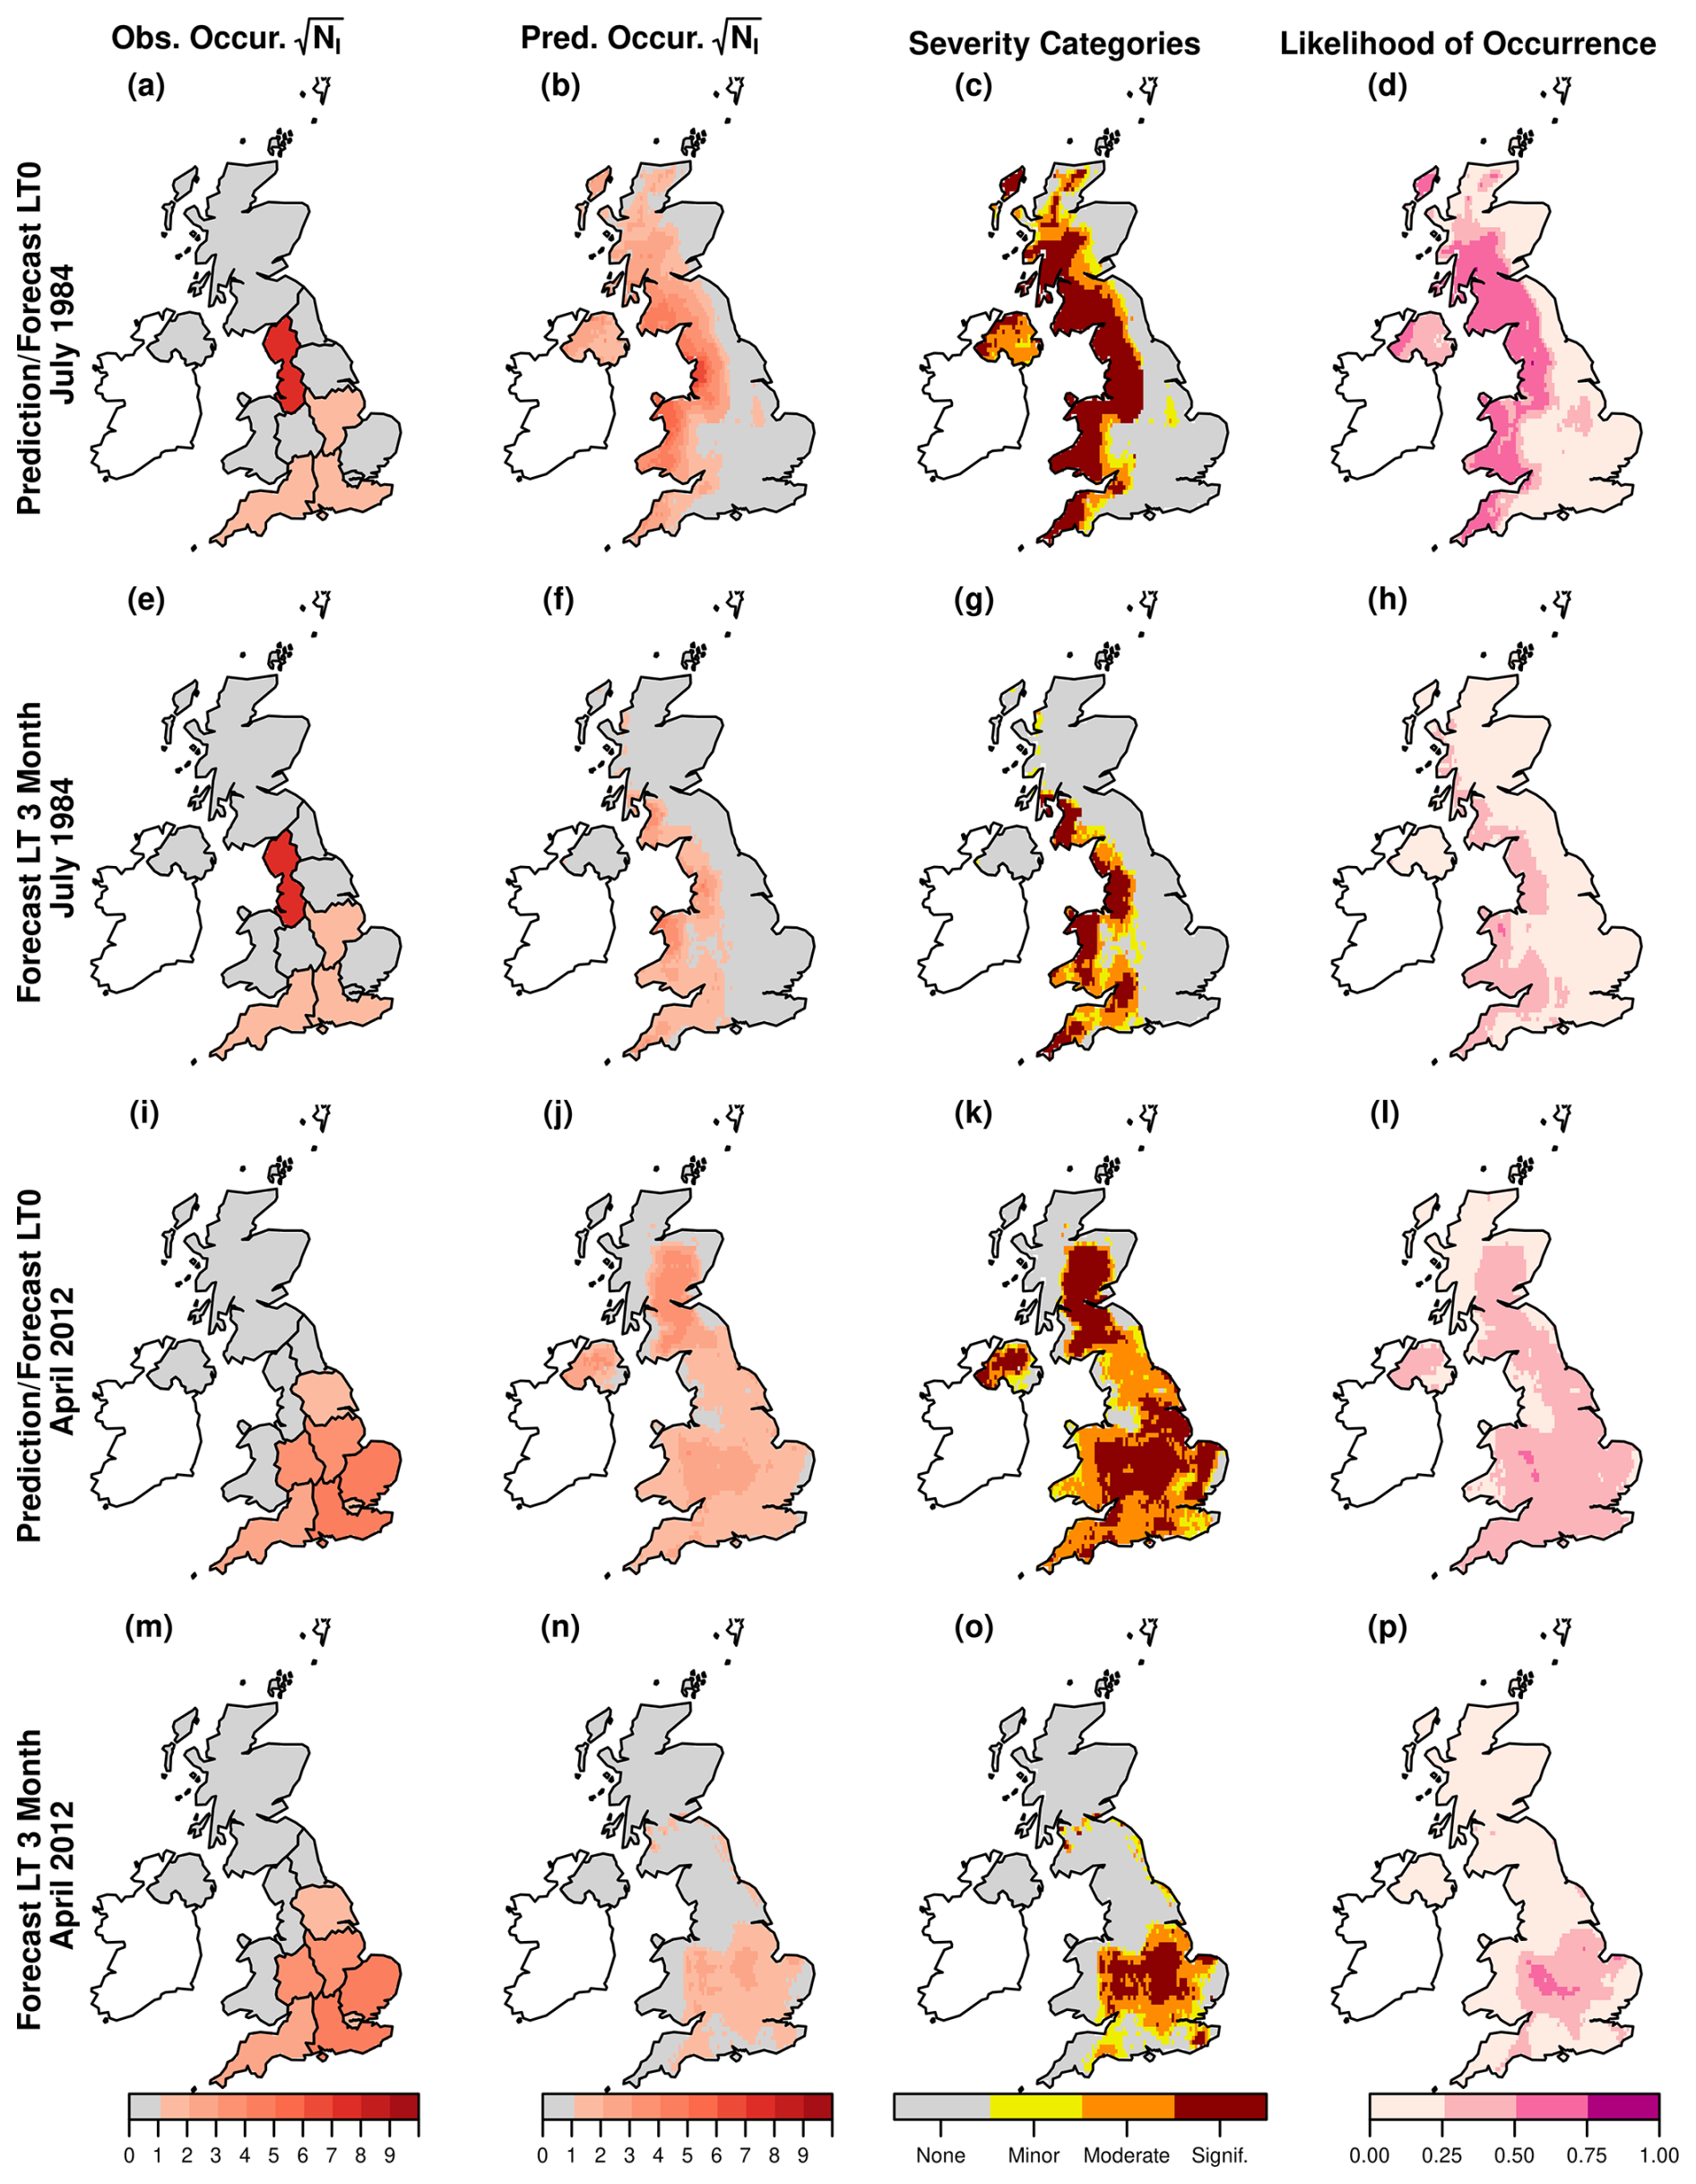
Figure 7Observed NUTS1-level and predicted/forecasted gridded model results over the UK for July 1984 and April 2012, with forecast lead times (LT) of 0 and 3 months. Panels (a)–(d) show July 1984 at LT0 (observed, predicted, severity, likelihood), panels (e)–(h) show July 1984 at LT3, panels (i)–(l) show April 2012 at LT0, and panels (m)–(p) show April 2012 at LT3. Within each group, panels are ordered as: observed occurrences (√NI), predicted occurrences (√NI), severity categories, and likelihood of occurrences.
3.5 Gridded Impacts
To evaluate the spatial distribution of predicted drought impacts, we ran the models using gridded inputs. This approach allows for a more detailed assessment of how well the model captures regional variations in drought impact severity and assess its ability to generalise across different temporal and spatial conditions. Figure 7 presents comparisons between observed and predicted drought impacts for two known drought periods, July 1984 and April 2012, with forecasts made at both 0-month and 3-month lead times. There is a strong spatial agreement between observed and predicted values, with high-impact areas in central and southeastern England aligning well in both observed and modelled datasets. The severity categories (Fig. 7c, k) further confirm this agreement, showing that the most moderate drought conditions are concentrated in similar regions, particularly in southeastern and central parts of the UK. The likelihood of occurrence maps (Fig. 7d, l) provide additional support, demonstrating high probabilities of impact in these focal regions. Notably, April 2012 is a completely unseen event that was not included in the model training, yet the model still captures meaningful spatial patterns, demonstrating its ability to generalise beyond the training dataset.
The 3-month lead time (Fig. 7e–h, m–p) show a notable decline in prediction accuracy. While the spatial patterns in panels (f) and (n) still capture some aspects of the observed occurrences (Fig. 7e, m), the intensity and extent of high-impact areas are less pronounced. The severity maps (Fig. 7g, o) continue to highlight the general drought-prone areas but exhibit more dispersed patterns, suggesting increased uncertainty at longer lead times. Most importantly, the likelihood of occurrence maps (Fig. 7h, p) show a clear decrease in probability values relative to the lead time 0 versions (Fig. 7d, l).
4.1 A generalized framework for drought impact prediction
This study aimed to develop a general and adaptable framework for predicting drought impacts, including in regions lacking sufficient impact data. Several machine learning methods and combinations of predictor variables were evaluated to identify the most effective approach for forecasting drought impacts. Validation on unseen data was conducted to assess model robustness, and the potential benefits of incorporating lagged indicators were also explored. A method was developed to generate spatial, grid-based drought impact maps to support localized assessments.
A key distinction of this study lies in its generalized modelling approach, which aggregates all available impact data across the UK to forecast the total number of drought impact reports using regression techniques. This approach combines data from all sectors and regions and transforms the predicted report counts into severity categories for classification-based forecasting. Importantly, these severity categories were defined using the frequency distribution of observed impacts, rather than traditional drought index thresholds. Additionally, a binary classification model was trained to estimate the likelihood of drought impact occurrence (presence vs. absence), enhancing the framework's predictive scope. By integrating regression-based, classification-based, and probabilistic predictions, this study provides a comprehensive modelling framework that encompasses a range of widely-used approaches to communicate and visualize impact forecasts. These complementary approaches collectively enhance the relevance and practicality of drought impact forecasts for a wide range of users, including analysts, planners, and policy-makers. Regression-based predictions offer continuous estimates of impact severity, supporting trend analysis and model validation. Classification outputs translate these into clear, actionable categories that facilitate decision-making. Probabilistic forecasts capture uncertainty, making them valuable for risk-informed planning and early warning efforts.
Although this generalized strategy contrasts with region-specific modelling suggested by Shyrokaya et al. (2023), it addresses the critical challenge of applying drought impact forecasting in data-scarce regions. This is particularly relevant in light of findings by Sutanto et al. (2020), who noted that insufficient impact data often limit the development of drought impact functions for certain regions and sectors. Our approach contributes towards closing this gap by incorporating independent spatial validation and assessing model performance in regions not included in the training data. However, it is important to acknowledge that the model has, so far, only been tested in Germany, a region that is hydroclimatologically and socio-economically comparable to the UK. While this supports the feasibility of a generalised modelling framework, its performance in regions with contrasting climates or socio-economic conditions (e.g., the Mediterranean) remains uncertain. Further testing across a broader set of EDII regions is therefore essential, and future work could involve developing region-specific models using a similar framework for more divergent contexts.
4.2 Key findings from model development and validation
In this study we used uncensored drought impact time series that span the full range of hydrological conditions, including normal and wet periods. Unlike many prior studies that focused solely on drought event periods, this approach offers a more comprehensive assessment of model performance across varying conditions. Evaluating the model's ability to perform consistently during both dry and non-dry periods is crucial for developing operational forecasting systems, which must function reliably regardless of the current drought status. This broader framework enhances the applicability of the model in real-time early warning systems, further solidifying its real-world utility.
The results support the feasibility of a general framework for accurately predicting drought impacts. Among the tested methods, the RF model consistently outperformed others in predicting impacts, both in the UK and in cross-regional validation with German data. These findings are consistent with previous studies conducted in both the UK and Germany, which also identified the RF model as the most effective approach for drought impact modelling (Bachmair et al., 2016a; Sutanto et al., 2020). Although we applied accuracy metrics consistent with those used in previous studies, direct comparison of model performance remains challenging due to methodological differences, such as the use of censored time periods and differing prediction targets, which limit the fairness of a one-to-one performance assessment.
We tested different predictor combinations to evaluate their contribution to model performance (Fig. 5). Regional features such as population density and arable land area were included but did not significantly improve the model, suggesting that broader climatic and hydrological indicators exert a greater influence on drought impacts at the regional scale. The uncertain role of population density (PopR) may stem from inconsistent reporting patterns, as areas with higher population density are generally associated with more frequent impact submissions. However, its relevance (particularly at longer lead times) may not be purely a statistical artefact. While we used static regional values for PopR, it is still plausible that this variable captures underlying patterns of exposure or reporting likelihood, which become more influential as the predictive power of dynamic hydrometeorological variables weakens over time. For example, in forecasts issued during winter for the upcoming summer, drought-related impacts such as hosepipe bans, restrictions on recreational water use, or changes in landscaping practices may be more prevalent or more likely to be reported in densely populated areas. In this context, PopR may not influence the physical manifestation of drought, but it can still inform where and when impacts are observed and reported. Therefore, PopR could be selected as an important predictor at longer lead times due to its association with reporting behaviour and human exposure, rather than representing a spurious correlation alone. Similarly, the fact that AAR is not identified as an important predictor does not diminish the potential significance of the variable. Rather, it reflects its limited effectiveness in the UK context, where agricultural impact reports constitute only a small minority of the EDII data (Stagge et al., 2015). This alignment suggests that the variable's predictive value may be context-dependent and influenced by the relative prevalence of reported agricultural impacts. These predictors were included as trial exemplars, but future work should explore more comprehensive vulnerability indicators. The UNCCD report (Barker et al., 2021) and its references highlight alternative social, economic, and infrastructural factors that may better capture regional drought vulnerability.
SPI and SPEI indices are highly correlated in the UK, and our analysis shows that this multicollinearity substantially affects the performance of LR and LASSOCV. The correlation matrix of predictors (Fig. S3) revealed strong interdependence among drought indices across time scales, and the Variance Inflation Factor (VIF) values for the LR model (Table S3) frequently exceeded 30–60, indicating severe multicollinearity. LASSOCV also failed to mitigate this issue: the best penalty parameter selected via cross-validation was λ=0, effectively reducing the model to an unregularized linear regression. These results showed that both LR and LASSOCV performed lower accuracy relative to other ML approaches for the UK because they cannot reliably disentangle the effects of highly correlated predictors.
In contrast, the RF model is inherently robust to multicollinearity and can effectively handle redundant or correlated inputs. For this reason, and to maintain the model's transferability to other regions where relationships between SPI and SPEI may differ, we intentionally included both indices as predictors. However, limitations remain regarding the accuracy and regional consistency of input data such as ERA5-Land climate variables and soil moisture indices (SSMI), particularly due to their potential inability to fully capture local conditions. These include overestimation of low-intensity precipitation events, uncertainties in soil moisture estimates, and reduced reliability in complex terrain (Lavers et al., 2022; Muñoz-Sabater et al., 2021). Nevertheless, the model's flexible structure allows for the integration of more regionally validated datasets, including satellite-based soil moisture products, to improve performance. The generalizability of this framework and its potential applicability to other climatic regions require further testing across diverse environments in future work. Finally, as machine learning models are entirely dependent on their training data, the selection of the reference period used to calculate drought indicators is critical. Inconsistencies between the reference period used during model training and that employed during operational implementation can introduce significant bias, potentially leading to over- or underestimation of drought impacts. Ensuring consistency in the reference period across both phases is therefore essential for maintaining model reliability.
Discrepancies between the model outputs and historical records were observed in both the UK and Germany. For example, the model overestimated the impacts of the 1976 and 1990–1995 droughts in the UK (Marsh et al., 2007). Similarly, during the 1976 (Baker et al., 2021) and 1990–1995 droughts in Germany, the model produced high likelihood scores despite the absence of recorded impact observations. These inconsistencies are likely due to incomplete, missing, or underreported impact records rather than deficiencies in the model itself, especially given that drought conditions during these periods are well-documented in the literature and supported by drought indicators (Bachmair et al., 2016a; Marsh et al., 2007). In addition, regarding model validation in the German case, differences in national reporting practices and variations in data availability may also contribute to these discrepancies, as reflected in the lower AUC scores for Germany (Fig. 4). Furthermore, evidence of the impacts associated with the drought events discussed here can be found in alternative sources such as 1990–1995 UK drought (Parry et al., 2011) and Germany droughts (Schellnhuber et al., 1994), supporting the interpretation that these model predictions should not be considered false alarms. In contrasts, Bachmair et al. (2016a) also suggested that the use of RF modelling can aid in identifying detailed impacts during periods when the model predicts drought impacts, but no corresponding observed data is recorded.
4.3 Forecasting drought impacts and possible applications
Similar to previous studies over the UK using EDII data, where different metrics were calculated due to the varying nature of each study, long-accumulation-period drought indicators, particularly SPEI24 (Bachmair et al., 2016a, 2017; Stagge et al., 2015), along with deep-layer soil moisture (SSMI L4), were consistently identified as the most influential predictors. This highlights the importance of long-term drought conditions and deep soil moisture in determining drought impacts, particularly in hydrologically driven events. Beyond a six-month lead time, model performance relied on a wider set of indicators, compensating for weaker signals from individual variables. This demonstrates both the value of multi-indicator forecasting and the inherent challenge of declining accuracy over extended forecast periods.
To avoid introducing additional uncertainty into the model, we deliberately chose to use lagged drought indicators rather than forecast-based indices, which depend on seasonal climate forecasts. The strong predictive performance of long-accumulation SPEI values (e.g., SPEI24 and SPEI48) supports this decision, as such indicators are assumed to provide more temporal stability than the inherently variable extended- or long-range meteorological forecasts. The combination of “SPEI + SSMI” proved to be a particularly robust predictor set, especially at longer lead times, while also reducing reliance on less consistent predictors such as population data (Fig. 6). These findings reinforce the notion that forecasts up to three months are generally more dependable, while caution is necessary when extending beyond six months due to heightened uncertainty. In future work, a comparative analysis of forecast-based drought indicators (derived from seasonal climate forecasts) and lagged indicators could help clarify the relative accuracy and reliability of these two approaches for drought impact modelling.
Gridded impact forecasts further demonstrate the model's ability to reproduce high-resolution spatial patterns of drought severity and potential for impacts (Fig. 7). Observed and predicted high-impact areas aligned particularly well in central and southeastern England. The severity maps confirmed consistency across spatial scales, and the likelihood of occurrence maps revealed high probabilities in the same focal regions. Notably, the model accurately captured the April 2012 drought (an event entirely excluded from training data) demonstrating its potential for generalization. Predictive confidence declined with increasing lead time, as expected, due to the influence of external and unmodeled factors. Still, the model consistently identified key drought-prone regions, showing that spatially explicit drought impact forecasting remains viable at extended lead times, albeit with more caution needed in interpretation. In contrast, validating predictions in northern UK regions remains challenging due to sparse reporting, likely related to lower population density and underreporting rather than an absence of drought conditions. This underscores the need for improved data collection in underrepresented areas. Nevertheless, the key point is that this exercise demonstrates clear potential for using models trained with impact data aggregated at the regional scale to be applied at the higher resolution available via the hydrometerological predictors. While the outputs should be treated as “indicative” at present, such “on the ground” information could be very valuable for water managers (regulators, water utilities, conservation groups) who are charged with managing drought impacts at the sub-regional (typically catchment) scale.
4.4 Suggestions
A key factor in developing reliable ML models for drought impact prediction is the availability of comprehensive and high-quality datasets. While meteorological drought indicators are readily accessible, impact records remain limited and inconsistent, both in the UK and indeed internationally (Bachmair et al., 2016b; Shyrokaya et al., 2024). Although the model achieved high recall, uncertainty persists around whether false positives reflect true model error or unreported impacts. Improving dataset coverage and consistency would support more robust model validation and clearer interpretation of predictions. One way to improve model accuracy may involve excluding training periods with known drought events but no recorded impacts, reducing noise in the data. Additionally, drought impact reporting depends on observers, which can lead to underreporting in sparsely populated or less-monitored regions. Future work can build on the work presented here to use the growing range of impact datasets (as highlighted in the introduction) to progress in this space. Firstly, alternative high-resolution impact datasets (in situ ecological impact monitoring datasets, high-resolution incident data like NIRS, crop-yield data, citizen science (e.g. Bloomin' Algae maps, 2025; Freshwater data explorer, 2025) as well as at the global scale (e.g. EO data) could be used to validate some of the high-resolution gridded impacts presented here. More generally, these datasets could also be used to refine the ML approach and develop finer resolution models.
Finally, there are emerging avenues that could be used to generate impact datasets for training and validation of impact forecasting models in the UK. The news media is a potentially valuable source. Drought impact datasets have been developed for both the UK (Dayrell et al., 2022), Ireland (O'Connor et al., 2023) using selected media resources and with significant manual intervention. A very high-resolution dataset has been developed for a catchment in southeast England (Ascott et al., 2025) using a range of documentary sources assembled by community interest groups. Meanwhile in other countries, Natural Language Processing, Large Language Models and ML approaches have shown some promise for generating impact datasets (López-Otal et al., 2025; Madruga de Brito et al., 2020, 2025).
In conclusion, this study presents a generalizable and adaptable machine learning framework for forecasting drought impacts, demonstrating robust performance in both predicting the total number of impact occurrences (NI) and estimating the likelihood of occurrence. By adopting a lumped modelling approach and validating the model on temporally and spatially unseen datasets, including cross-national applications, we highlight the framework's potential to support drought impact forecasting even in data-scarce regions. The RF model consistently emerged as the most effective, particularly in capturing drought impacts in the UK, and showed promising transferability when applied to Germany. While model performance was influenced by the characteristics of the training data, where it's dominated by hydrological impacts in the UK, the results indicate strong potential for broader application. Future improvements could be achieved by incorporating more spatially diverse and sector-balanced impact datasets, which would enhance model generalization to data-sparse areas. Nonetheless, additional evaluation and refinement are necessary to assess how well the model performs across varying climate zones, ecosystems, and socioeconomic conditions. Overall, this study contributes to advancing operational impact based drought forecasting by offering a scalable approach that performs reliably across different conditions, regions, and data constraints.
The R code used for data processing and analysis in this study is available from the contact author upon request.
All drought indicators used in this study were calculated using ERA5-Land climate variables, which are publicly available from the Copernicus Climate Data Store (https://doi.org/10.24381/cds.68d2bb30, Muñoz Sabater, 2019). Drought impact data were referenced from the European Drought Impact Inventory (EDII V2.0), which is available at https://freidok.uni-freiburg.de/data/230922 (last access: 14 January 2025).
The supplement related to this article is available online at https://doi.org/10.5194/nhess-26-1515-2026-supplement.
Conceptualization: BB, EM, RA, MT, LB, and JH; data curation: BB, EM, RA and OA; formal analysis: BB, and EM; funding acquisition: MT, LB, and JH; investigation: BB, and EM; methodology: BB, EM, RA, OA, MT, LB, and JH; supervision: MT, LB, and JH; visualization: BB; writing (original draft preparation): BB; writing (review and editing): EM, RA, MT, LB, and JH.
The contact author has declared that none of the authors has any competing interests.
Publisher's note: Copernicus Publications remains neutral with regard to jurisdictional claims made in the text, published maps, institutional affiliations, or any other geographical representation in this paper. The authors bear the ultimate responsibility for providing appropriate place names. Views expressed in the text are those of the authors and do not necessarily reflect the views of the publisher.
We dedicate this work to the memory of Opeyemi E. Adedipe, who sadly left us too soon. His valuable contributions and dedication during his internship at UK Centre for Ecology & Hydrology (UKCEH) greatly enriched this research.
This research has been supported by the Natural Environment Research Council, Centre for Ecology and Hydrology (grant nos. NE/X012727/1 and NE/Y006208/1).
This paper was edited by Ankit Agarwal and reviewed by Kerstin Stahl and one anonymous referee.
Afshar, M. H., Bulut, B., Duzenli, E., Amjad, M., and Yilmaz, M. T.: Global spatiotemporal consistency between meteorological and soil moisture drought indices, Agr. Forest Meteorol., 316, 108848, https://doi.org/10.1016/J.AGRFORMET.2022.108848, 2022.
AghaKouchak, A., Huning, L. S., Sadegh, M., Qin, Y., Markonis, Y., Vahedifard, F., Love, C. A., Mishra, A., Mehran, A., Obringer, R., Hjelmstad, A., Pallickara, S., Jiwa, S., Hanel, M., Zhao, Y., Pendergrass, A. G., Arabi, M., Davis, S. J., Ward, P. J., Svoboda, M., Pulwarty, R., and Kreibich, H.: Toward impact-based monitoring of drought and its cascading hazards, Nat. Rev. Earth Environ., 4, 582–595, https://doi.org/10.1038/s43017-023-00457-2, 2023.
Allen, R. G., Pereira, L. S., Raes, D., and Smith, M.: FAO Irrigation and drainage paper No. 56, Rome: Food and Agriculture Organization of the United Nations, 56, e156, http://www.fao.org/docrep/X0490E/X0490E00.htm (last access: 15 June 2025), 1998.
Ascott, M. J., Graves, K. A., Marchant, B., and Bloomfield, J. P.: Participatory data collation and standardized hydrometeorological indicators improve understanding of the extent and drivers of flood and drought impacts at the catchment scale, Sci. Total Environ., 982, 179608, https://doi.org/10.1016/J.SCITOTENV.2025.179608, 2025.
Baccianella, S., Esuli, A., and Sebastiani, F.: Evaluation measures for ordinal regression, ISDA 2009 – 9th International Conference on Intelligent Systems Design and Applications, 283–287, https://doi.org/10.1109/ISDA.2009.230, 2009.
Bachmair, S., Kohn, I., and Stahl, K.: Exploring the link between drought indicators and impacts, Nat. Hazards Earth Syst. Sci., 15, 1381–1397, https://doi.org/10.5194/nhess-15-1381-2015, 2015.
Bachmair, S., Svensson, C., Hannaford, J., Barker, L. J., and Stahl, K.: A quantitative analysis to objectively appraise drought indicators and model drought impacts, Hydrol. Earth Syst. Sci., 20, 2589–2609, https://doi.org/10.5194/hess-20-2589-2016, 2016a.
Bachmair, S., Stahl, K., Collins, K., Hannaford, J., Acreman, M., Svoboda, M., Knutson, C., Smith, K. H., Wall, N., Fuchs, B., Crossman, N. D., and Overton, I. C.: Drought indicators revisited: the need for a wider consideration of environment and society, Wiley Interdisciplinary Reviews: Water, 3, 516–536, https://doi.org/10.1002/WAT2.1154, 2016b.
Bachmair, S., Svensson, C., Prosdocimi, I., Hannaford, J., and Stahl, K.: Developing drought impact functions for drought risk management, Nat. Hazards Earth Syst. Sci., 17, 1947–1960, https://doi.org/10.5194/nhess-17-1947-2017, 2017.
Bachmair, S., Tanguy, M., Hannaford, J., and Stahl, K.: How well do meteorological indicators represent agricultural and forest drought across Europe?, Environ. Res. Lett., 13, 034042, https://doi.org/10.1088/1748-9326/AAAFDA, 2018.
Baker, L., Shaffrey, L., and Hawkins, E.: Has the risk of a 1976 north-west European summer drought and heatwave event increased since the 1970s because of climate change?, Q. J. Roy. Meteor. Soc., 147, 4143–4162, https://doi.org/10.1002/QJ.4172, 2021.
Barker, L. J., Hannaford, J., Parry, S., Smith, K. A., Tanguy, M., and Prudhomme, C.: Historic hydrological droughts 1891–2015: systematic characterisation for a diverse set of catchments across the UK, Hydrol. Earth Syst. Sci., 23, 4583–4602, https://doi.org/10.5194/hess-23-4583-2019, 2019.
Barker, L. J., Rickards, N. J., Sarkar, S., Hannaford, J., King-Okumu, C., and Rees, G.: Good practice guidance for national reporting on UNCCD strategic objective 3: To mitigate, adapt to, and manage the effects of drought in order to enhance resilience of vulnerable populations and ecosystems, United Nations Convention to Combat Desertification (UNCCD), 2021.
Barker, L. J., Fry, M., Hannaford, J., Nash, G., Tanguy, M., and Swain, O.: Dynamic High Resolution Hydrological Status Monitoring in Real-Time: The UK Water Resources Portal, Front. Environ. Sci., 10, 752201, https://doi.org/10.3389/fenvs.2022.752201, 2022.
Barker, L. J., Hannaford, J., Magee, E., Turner, S., Sefton, C., Parry, S., Evans, J., Szczykulska, M., and Haxton, T.: An appraisal of the severity of the 2022 drought and its impacts, Weather, 79, 208–219, https://doi.org/10.1002/WEA.4531, 2024.
Blauhut, V., Gudmundsson, L., and Stahl, K.: Towards pan-European drought risk maps: Quantifying the link between drought indices and reported drought impacts, Environ. Res. Lett., 10, https://doi.org/10.1088/1748-9326/10/1/014008, 2015.
Blauhut, V., Stephan, R., and Stahl, K.: The European Drought Impact report Inventory (EDII V2.0), FreiDok Plus, University of Freiburg, https://doi.org/10.6094/UNIFR/230922, 2022.
Bloomin' Algae maps: Bloomin' Algae maps, https://bloominalgae.ceh.ac.uk/, last access: 30 January 2025.
Breiman, L.: Random forests, Mach. Learn., 45, 5–32, https://doi.org/10.1023/A:1010933404324, 2001.
Chen, T. and Guestrin, C.: XGBoost: A scalable tree boosting system, Proceedings of the ACM SIGKDD International Conference on Knowledge Discovery and Data Mining, 13–17 August-2016, 785–794, https://doi.org/10.1145/2939672.2939785, 2016.
Copernicus Land Monitoring Service: CORINE Land Cover 2018 (CLC2018), Version 2020_20u1, Copernicus Land Monitoring Service (EEA), https://doi.org/10.2909/71c95a07-e296-44fc-b22b-415f42acfdf0, 2020.
Dayrell, C., Svensson, C., Hannaford, J., McEnery, T., Barker, L. J., Baker, H., and Tanguy, M.: Representation of Drought Events in the United Kingdom: Contrasting 200 years of News Texts and Rainfall Records, Front. Environ. Sci., 10, 760147, https://doi.org/10.3389/fenvs.2022.760147, 2022.
EarlyWarningsforAll: The UN Global Early Warning Initiative for the Implementation of Climate Adaptation, Executive Action Plan 2023–2027, https://library.wmo.int/idurl/4/58209 (last access: 15 June 2025), 2022.
Environment Agency: Drought: how it is managed in England, https://www.gov.uk/government/publications/drought-management-for-england (last access: 24 March 2026), 2025.
Facer-Childs, K., Collins, K., Hannaford, J., and Barker, L.: Reviewing approaches for communicating drought status and risk (RADAR), Department for Environment, Food & Rural Affairs (Defra), 20 pp., https://nora.nerc.ac.uk/id/eprint/538795/ (last access: 15 June 2025), 2025.
Faranda, D., Pascale, S., and Bulut, B.: Persistent anticyclonic conditions and climate change exacerbated the exceptional 2022 European-Mediterranean drought, Environ. Res. Lett., 18, 034030, https://doi.org/10.1088/1748-9326/ACBC37, 2023.
Freshwater data explorer: https://eip.ceh.ac.uk/hydrology/freshwater-data-explorer/, last access: 30 January 2025.
Gudmundsson, L., Rego, F. C., Rocha, M., and Seneviratne, S. I.: Predicting above normal wildfire activity in southern Europe as a function of meteorological drought, Environ. Res. Lett., 9, 84008, https://doi.org/10.1088/1748-9326/9/8/084008, 2014.
Hannaford, J., Collins, K., Haines, S., and Barker, L. J.: Enhancing Drought Monitoring and Early Warning for the United Kingdom through Stakeholder Coinquiries, Weather Clim. Soc., 11, 49–63, https://doi.org/10.1175/WCAS-D-18-0042.1, 2019.
Hobeichi, S., Abramowitz, G., Evans, J. P., and Ukkola, A.: Toward a Robust, Impact-Based, Predictive Drought Metric, Water Resour. Res., 58, https://doi.org/10.1029/2021WR031829, 2022.
IDMP: The Three Pillars of Drought Management, https://www.droughtmanagement.info/pillars/, last access: 8 May 2025.
Kendon, M., Marsh, T., and Parry, S.: The 2010–2012 drought in England and Wales, Weather, 68, 88–95, https://doi.org/10.1002/WEA.2101, 2013.
Kuhn, M.: Building predictive models in R using the caret package, J. Stat. Softw., 28, 1–26, https://doi.org/10.18637/jss.v028.i05, 2008.
Lavers, D. A., Simmons, A., Vamborg, F., and Rodwell, M. J.: An evaluation of ERA5 precipitation for climate monitoring, Q. J. Roy. Meteor. Soc., 148, 3152–3165, https://doi.org/10.1002/qj.4351, 2022.
López-Otal, M., Domínguez-Castro, F., Latorre, B., Vela-Tambo, J., and Gracia, J.: SeqIA: A Python framework for extracting drought impacts from news archives, Environ. Modell. Softw., 187, 106382, https://doi.org/10.1016/J.ENVSOFT.2025.106382, 2025.
Madruga De Brito, M., Kuhlicke, C., and Marx, A.: Near-real-time drought impact assessment: A text mining approach on the 2018/19 drought in Germany, Environ. Res. Lett., 15, https://doi.org/10.1088/1748-9326/aba4ca, 2020.
Madruga de Brito, M., Rotaru, A. M., Wang, J., Gesualdo, G., Hasbini, L., Severino, L., and Nunes Carvalho, T. M.: Developing a multi-hazard impact and response dataset for the Global South, EGU General Assembly 2025, Vienna, Austria, 27 Apr–2 May 2025, EGU25-17817, https://doi.org/10.5194/egusphere-egu25-17817, 2025.
Marsh, T., Cole, G., and Wilby, R.: Major droughts in England and Wales, 1800–2006, Weather, 62, 87–93, https://doi.org/10.1002/WEA.67, 2007.
McKee, T., Doesken, N., and Kleist, J.: The relationship of drought frequency and duration to time scales, in: Proceedings of the 8th Conference on Applied Climatology, 17–22 January 1993, Anaheim, California, 179–183, https://climate.colostate.edu/pdfs/relationshipofdroughtfrequency.pdf (last access: 15 June 2025), 1993.
Meinshausen, N.: Quantile Regression Forests, J. Mach. Learn. Res., 7, 983–999, 2006.
Merz, B., Kuhlicke, C., Kunz, M., Pittore, M., Babeyko, A., Bresch, D. N., Domeisen, D. I. V., Feser, F., Koszalka, I., Kreibich, H., Pantillon, F., Parolai, S., Pinto, J. G., Punge, H. J., Rivalta, E., Schröter, K., Strehlow, K., Weisse, R., and Wurpts, A.: Impact Forecasting to Support Emergency Management of Natural Hazards, Rev. Geophys., 58, e2020RG000704, https://doi.org/10.1029/2020RG000704, 2020.
Muñoz Sabater, J.: ERA5-Land monthly averaged data from 1950 to present, Copernicus Climate Change Service (C3S) Climate Data Store (CDS) [data set], https://doi.org/10.24381/cds.68d2bb30, 2019.
Muñoz-Sabater, J., Dutra, E., Agustí-Panareda, A., Albergel, C., Arduini, G., Balsamo, G., Boussetta, S., Choulga, M., Harrigan, S., Hersbach, H., Martens, B., Miralles, D. G., Piles, M., Rodríguez-Fernández, N. J., Zsoter, E., Buontempo, C., and Thépaut, J.-N.: ERA5-Land: a state-of-the-art global reanalysis dataset for land applications, Earth Syst. Sci. Data, 13, 4349–4383, https://doi.org/10.5194/essd-13-4349-2021, 2021.
Noguera, I., Domínguez-Castro, F., Vicente-Serrano, S. M., and Reig, F.: Near-real time flash drought monitoring system and dataset for Spain, Data Brief, 47, 108908, https://doi.org/10.1016/J.DIB.2023.108908, 2023.
O'Connor, P., Murphy, C., Matthews, T., and Wilby, R. L.: Relating drought indices to impacts reported in newspaper articles, Int. J. Climatol., 43, 1796–1816, https://doi.org/10.1002/joc.7946, 2023.
Oliver, T. H., Marshall, H. H., Morecroft, M. D., Brereton, T., Prudhomme, C., and Huntingford, C.: Interacting effects of climate change and habitat fragmentation on drought-sensitive butterflies, Nat. Clim. Change, 5, 941–945, https://doi.org/10.1038/nclimate2746, 2015.
Parry, S., Hannaford, J., Prudhomme, C., Lloyd-Hughes, B., and Williamson, J.: Objective drought and high flow catalogues for Europe, WATCH Technical Report No. 33, 57 pp., https://nora.nerc.ac.uk/id/eprint/15044 (last access: 15 June 2025), 2011.
Parsons, D. J., Rey, D., Tanguy, M., and Holman, I. P.: Regional variations in the link between drought indices and reported agricultural impacts of drought, Agr. Syst., 173, 119–129, https://doi.org/10.1016/j.agsy.2019.02.015, 2019.
Prudhomme, C., Hannaford, J., Harrigan, S., Boorman, D., Knight, J., Bell, V., Jackson, C., Svensson, C., Parry, S., Bachiller-Jareno, N., Davies, H., Davis, R., Mackay, J., McKenzie, A., Rudd, A., Smith, K., Bloomfield, J., Ward, R., and Jenkins, A.: Hydrological Outlook UK: an operational streamflow and groundwater level forecasting system at monthly to seasonal time scales, Hydrolog. Sci. J., 62, 2753–2768, https://doi.org/10.1080/02626667.2017.1395032, 2017.
Schellnhuber, H. J., Enke, W., and Flechsig, M.: The extreme summer of 1992 in northern Germany, PIK reports, 2, Potsdam, 98 pp., https://www.pik-potsdam.de/en/output/publications/pikreports/summary-report-no-2 (last access: 6 June 2025), 1994.
Seibert, J., Strobl, B., Etter, S., Hummer, P., and van Meerveld, H. J. I.: Virtual staff gauges for crowd-based stream level observations, Front. Earth Sci., 7, 423781, https://doi.org/10.3389/feart.2019.00070, 2019.
Shyrokaya, A., Pappenberger, F., Pechlivanidis, I., Messori, G., Khatami, S., Mazzoleni, M., and Di Baldassarre, G.: Advances and gaps in the science and practice of impact-based forecasting of droughts, Wiley Interdisciplinary Reviews: Water, https://doi.org/10.1002/wat2.1698, 2023.
Shyrokaya, A., Messori, G., Pechlivanidis, I., Pappenberger, F., Cloke, H. L., and Di Baldassarre, G.: Significant relationships between drought indicators and impacts for the 2018–2019 drought in Germany, Environ. Res. Lett., 19, https://doi.org/10.1088/1748-9326/ad10d9, 2024.
Shyrokaya, A., Pappenberger, F., Messori, G., Pechlivanidis, I., Cloke, H., and Di Baldassarre, G.: How good is my drought index? Evaluating predictability and ability to estimate impacts across Europe, Environ. Res. Lett., 20, 034051, https://doi.org/10.1088/1748-9326/ADB869, 2025.
Smith, K., Walker, D., Zhang, B., Veness, W., Lam, M., Knutson, C., Stefanski, R., Aich, V., and Svoboda, M.: Baseline Assessment of Drought Impact Monitoring, Integrated Drought Management Programme (IDMP), Integrated Drought Management Tools and Guidelines Series 3, World Meteorological Organization (WMO) and Integrated Drought Management Programme (IDMP), Geneva, WMO No. 1355, https://www.gwp.org/globalassets/global/about-gwp/publications/integrated-drought-management-programme/baseline-assessment-of-drought-impact-monotoring.pdf (last access: 6 June 2025), 2025.
Stagge, J. H., Kohn, I., Tallaksen, L. M., and Stahl, K.: Modeling drought impact occurrence based on meteorological drought indices in Europe, J. Hydrol., 530, 37–50, https://doi.org/10.1016/j.jhydrol.2015.09.039, 2015.
Stahl, K., Kohn, I., Blauhut, V., Urquijo, J., De Stefano, L., Acácio, V., Dias, S., Stagge, J. H., Tallaksen, L. M., Kampragou, E., Van Loon, A. F., Barker, L. J., Melsen, L. A., Bifulco, C., Musolino, D., de Carli, A., Massarutto, A., Assimacopoulos, D., and Van Lanen, H. A. J.: Impacts of European drought events: insights from an international database of text-based reports, Nat. Hazards Earth Syst. Sci., 16, 801–819, https://doi.org/10.5194/nhess-16-801-2016, 2016.
Stephan, R., Stahl, K., and Dormann, C. F.: Drought impact prediction across time and space: limits and potentials of text reports, Environ. Res. Lett., 18, https://doi.org/10.1088/1748-9326/acd8da, 2023.
Sutanto, S. J., van der Weert, M., Wanders, N., Blauhut, V., and Van Lanen, H. A. J.: Moving from drought hazard to impact forecasts, Nat. Commun., 10, https://doi.org/10.1038/s41467-019-12840-z, 2019.
Sutanto, S. J., van der Weert, M., Blauhut, V., and Van Lanen, H. A. J.: Skill of large-scale seasonal drought impact forecasts, Nat. Hazards Earth Syst. Sci., 20, 1595–1608, https://doi.org/10.5194/nhess-20-1595-2020, 2020.
Tanguy, M., Eastman, M., Magee, E., Barker, L. J., Chitson, T., Ekkawatpanit, C., Goodwin, D., Hannaford, J., Holman, I., Pardthaisong, L., Parry, S., Rey Vicario, D., and Visessri, S.: Indicator-to-impact links to help improve agricultural drought preparedness in Thailand, Nat. Hazards Earth Syst. Sci., 23, 2419–2441, https://doi.org/10.5194/nhess-23-2419-2023, 2023.
Tatem, A. J.: WorldPop, open data for spatial demography, Sci. Data, 4, 170004, https://doi.org/10.1038/sdata.2017.4, 2017.
Tibshirani, R.: Regression Shrinkage and Selection Via the Lasso, J. R. Stat. Soc. B, 58, 267–288, https://doi.org/10.1111/J.2517-6161.1996.TB02080.X, 1996.
Torelló-Sentelles, H. and Franzke, C. L. E.: Drought impact links to meteorological drought indicators and predictability in Spain, Hydrol. Earth Syst. Sci., 26, 1821–1844, https://doi.org/10.5194/hess-26-1821-2022, 2022.
Turner, S., Barker, L. J., Hannaford, J., Muchan, K., Parry, S., and Sefton, C.: The 2018/2019 drought in the UK: a hydrological appraisal, Weather, 76, 248–253, https://doi.org/10.1002/WEA.4003, 2021.
Vicente-Serrano, S. M., Beguería, S., and López-Moreno, J. I.: A multiscalar drought index sensitive to global warming: The standardized precipitation evapotranspiration index, J. Climate, 23, 1696–1718, https://doi.org/10.1175/2009JCLI2909.1, 2010.
Vicente-Serrano, S. M., Peña-Angulo, D., Beguería, S., Domínguez-Castro, F., Tomás-Burguera, M., Noguera, I., Gimeno-Sotelo, L., and El Kenawy, A.: Global drought trends and future projections, Philos. T. R. Soc. A, 380, https://doi.org/10.1098/rsta.2021.0285, 2022.
Wang, Y., Lv, J., Hannaford, J., Wang, Y., Sun, H., Barker, L. J., Ma, M., Su, Z., and Eastman, M.: Linking drought indices to impacts to support drought risk assessment in Liaoning province, China, Nat. Hazards Earth Syst. Sci., 20, 889–906, https://doi.org/10.5194/nhess-20-889-2020, 2020.
Wilhite, D. A., Svoboda, M. D., and Hayes, M. J.: Understanding the complex impacts of drought: A key to enhancing drought mitigation and preparedness, Water Resour. Manag., 21, 763–774, https://doi.org/10.1007/s11269-006-9076-5, 2007.
Wilhite, D. A., Sivakumar, M. V. K., and Pulwarty, R.: Managing drought risk in a changing climate: The role of national drought policy, Weather Clim. Extrem., 3, 4–13, https://doi.org/10.1016/J.WACE.2014.01.002, 2014.
Zaveri, E. D., Damania, R., and Engle, N. L.: Droughts and Deficits: The Global Impact of Droughts on Economic Growth, No. 10453, The World Bank, 2023.