the Creative Commons Attribution 4.0 License.
the Creative Commons Attribution 4.0 License.
 | 01 Dec 2025
Effective storm surge risk assessment and deep reinforcement learning based evacuation planning: a case study of Daya Bay Petrochemical Industrial Zone
Chuanfeng Liu
Yan Li
Hao Qin
Wenjuan Li
Darong Liu
Kai Zhou
Storm surge is one of the most destructive marine disasters, characterized by abnormal and temporary rises in water levels during intense storms, leading to extreme inland flooding in the coastal area. storm surge risk assessment and evacuation planning, play a crucial role in saving lives and mitigating disasters. Conventional risk assessment struggles to meet the demands of refined risk evaluation research for small-scale elements, such as roads, and current evacuation plans are generally based on broader regional scales, failing to provide effective road-level evacuation planning for evacuees. This study developed five typical typhoon scenarios for the coupled ADCIRC-SWAN model to simulate storm surge inundation. Combining these simulations with road network, storm surge risk assessment was conducted in the Daya Bay Petrochemical Industrial Zone, a vulnerable low-lying coastal region of Huizhou City, China. Based on the risk assessment, a combination of the Deep Q-Network (DQN) model and raster environment was employed to develop real-time evacuation plans during storm surge events. To address the DQN model's convergence challenges, compressed search space and navigational reward methods were proposed. 1000 starting points were randomly selected for route planning, and the results indicate that the proposed method is highly effective in devising optimal evacuation routes with minimal deviation, offering valuable guidance for evacuees during real-world storm surges.
- Article
(20323 KB) - Full-text XML
- BibTeX
- EndNote


A storm surge is an abnormal and temporary rise of water that occurs during intense storms. This sudden rise in sea level can lead to extreme inland flooding in coastal communities (Wang et al., 2021b). Storm surge is one of the most dangerous and destructive natural hazards to life and property along the coastline and kilometers inland in the world (CRED, 2015). In the US, coastal flooding from storm surge was responsible for 49 % of storm-related fatalities during the period from 1994 to 2003 (Rappaport, 2014). When Hurricane Katrina struck the southeastern United States in 2005, an estimated 1577 people died, causing USD 108 billion in property losses (Knabb et al., 2006). The storm surge from Super Typhoon “Haiyan”, hitting the Philippines in 2013, led to more than 7000 persons losing their lives (Mas et al., 2015). In China, from 1998 to 2020, the average annual economic losses resulting from storm surge flooding each year is approximately RMB 10.17 billion, which is equivalent to 96 % of the total direct economic losses from all types of marine disasters (Ministry of Natural Resources of the People's Republic of China, 2022). Recent studies indicated a potential escalation in the number of individuals at risk from storm surge flooding, along with associated property damage and loss of life (Merkens et al., 2016; Oppenheimer et al., 2019; Snaiki et al., 2020). Physical barriers, while parallel to the shoreline, are insufficient to prevent all potential damages to urban settlements and infrastructure during storm surge events. With increasing potential victims and economic losses, it is of paramount importance to perform risk assessments and develop evacuation plans to mitigate the risk associated with storm surge.
Storm surge risk assessment, based on simulated inundation scenarios, can provide predictive and analytical information on the danger of storm surge disasters in a region (Wang et al., 2021a). The risk assessment approach aims to quantify the damage and risk into value, where the value is the interaction between the geographic coverage of the hazard, the exposure of elements to the hazard, and the vulnerability of exposed elements (Granger, 2003; Kron, 2005; Lavell et al., 2012; Koks et al., 2015). In recent years, various storm surge risk assessment models have been established in various countries, and some case studies have been conducted (e.g. Zerger, 2002; Benavente et al., 2006; Lin et al., 2010). In the study of storm surge risk assessment, a comprehensive assessment of storm surge risk was obtained by using numerical models to simulate the inundation scenarios and considering the damage of different types of vulnerable elements. The Advanced Circulation (ADCIRC, Luettich et al., 1992) model, designed to address two- and three-dimensional hydrodynamic free surface circulation challenges, has been widely applied to simulate tide- and wind-driven circulations. The Simulating Waves Nearshore (SWAN, Booij et al., 1999) model is a numerical wave model, which computes the wave action density spectrum by solving the wave action balance equation. By employing a bidirectional coupling approach, the ADCIRC+SWAN model is a widely used model to simulate coastal storm surges and tidal floods induced by tropical cyclones, and has shown good performance in previous studies (e.g. Dietrich et al., 2011; Suh et al., 2015; Wang et al., 2018).
The research on emergency evacuation originated in the early 20th century, and its core task is the development of evacuation plans, including the identification of disaster shelters and the planning of evacuation routes (Alsnih and Stopher, 2004). Conventional shortest-path algorithms, such as Dijkstra's and A* algorithms, have been enhanced and employed in evacuation planning (Samah et al., 2015; Astri, 2020, e.g.,). Additionally, heuristic approaches, including the PSO algorithm, genetic algorithm, and ant colony algorithm have been introduced to identify optimal routes within intricate environments (e.g., Li et al., 2020; Goerigk et al., 2014; Forcael et al., 2014). In recent years, reinforcement learning (RL), has been a hot topic in the field of machine learning, and the basic idea is to learn the optimal strategy by maximizing the cumulative reward obtained from the interaction between the intelligent agent and the environment (Sutton and Barto, 2018). In the increasingly complex real-world tasks, deep learning (DL) can be utilized to better learn the abstract features of large-scale input data, which can then be used to optimize the RL's strategy learning process. In 2013, Mnih et al. (2013) proposed the Deep Q-Network (DQN), which was applied to solve visual-based control decision problems. Since then, the field of deep reinforcement learning (DRL) has experienced rapid development, arising numerous efficient algorithms, such as Deep Deterministic Policy Gradient (DDPG, Lillicrap et al., 2015), Asynchronous Advantage Actor-Critic (A3C, Mnih et al., 2016), and Proximal Policy Optimization (PPO, Schulman et al., 2017). DRL, based on Markov decision processes and deep neural networks, offers an effective solution for the optimization of evacuation route planning. Yu et al. (2017) utilized DRL model to develop a navigation system for an agent in a maze. Zhang et al. (2021) created a scenario with obstacles in a room and addressed the problem of emergency evacuation within the room using DRL. Ni et al. (2022) simulated buildings in a fire scenario and used an improved double deep Q network to solve evacuation route planning. The merit of DRL algorithms in emergency evacuation stems from their capacity to function without a priori comprehension of the entire environment.
Storm surge risk assessment and evacuation route planning can provide decision-making support for local governments in disaster prevention and reduction, and provide timely and effective emergency evacuation guidance for affected area residents. This study focused on the low-elevation coastal regions of the Daya Bay district, utilizing the coupled ADCIRC+SWAN numerical model to simulate storm surge scenarios, and subsequently conducting a comprehensive risk assessment of the road network. Based on the risk assessment, a DRL model was utilized to provide intelligent evacuation route planning for evacuees. The main contributions of this work are summarized as follows:
-
By analyzing historical typhoon data, five typical typhoon intensities affecting the study area were identified. Using the coupled ADCIRC+SWAN model, the storm surge inundation process in the study area under the five typhoon scenarios was simulated.
-
Developing a refined road risk assessment model for storm surges, taking into account the extent of inundation, inundation depth, and type of road, to analyze the traffic conditions and conduct a fine-grained risk assessment of the road network in the study area.
-
Reframing the route planning problem in a raster environment as a continuous decision-making problem, and using a DRL algorithm to plan evacuation routes on road networks, which can provide real-time and effective evacuation guidance based on the limited environment around evacuees.
-
To address the challenges faced by the DQN model in a large raster environment for route planning, this study proposed compressed search space and navigational rewards methods to optimize the traditional DQN model, enabling it to better suit evacuation route planning.
Daya Bay district is located in the southern region of Huizhou City, Guangdong Province. It has a total land area of 293 km2 and a population of 0.45 million, which is concentrated most highly in coastal areas, in 2021. The Daya Bay Petrochemical Industrial Zone, situated in the north-eastern part of Daya Bay, was listed as a national petrochemical industrial base. It has formed an annual production capacity of 22 million t of oil refining and 2.2 million t of ethylene in 2021, which ranks first in China in terms of the scale of petrochemical-refining integration. Industrial facilities and critical infrastructure in this area are vulnerable to storm surge-driven coastal flooding during typhoon events, leading to devastating losses of life and property. In the context of substantial sea-level rise and urban extent along low-lying coastal areas, most communities across the Daya Bay district will likely face higher storm surge flooding risk in the future. It is crucial and essential to create the storm surge risk maps for raising awareness about areas at risk and making evacuation plans to minimize the loss and damage. The study area is shown in Fig. 1.
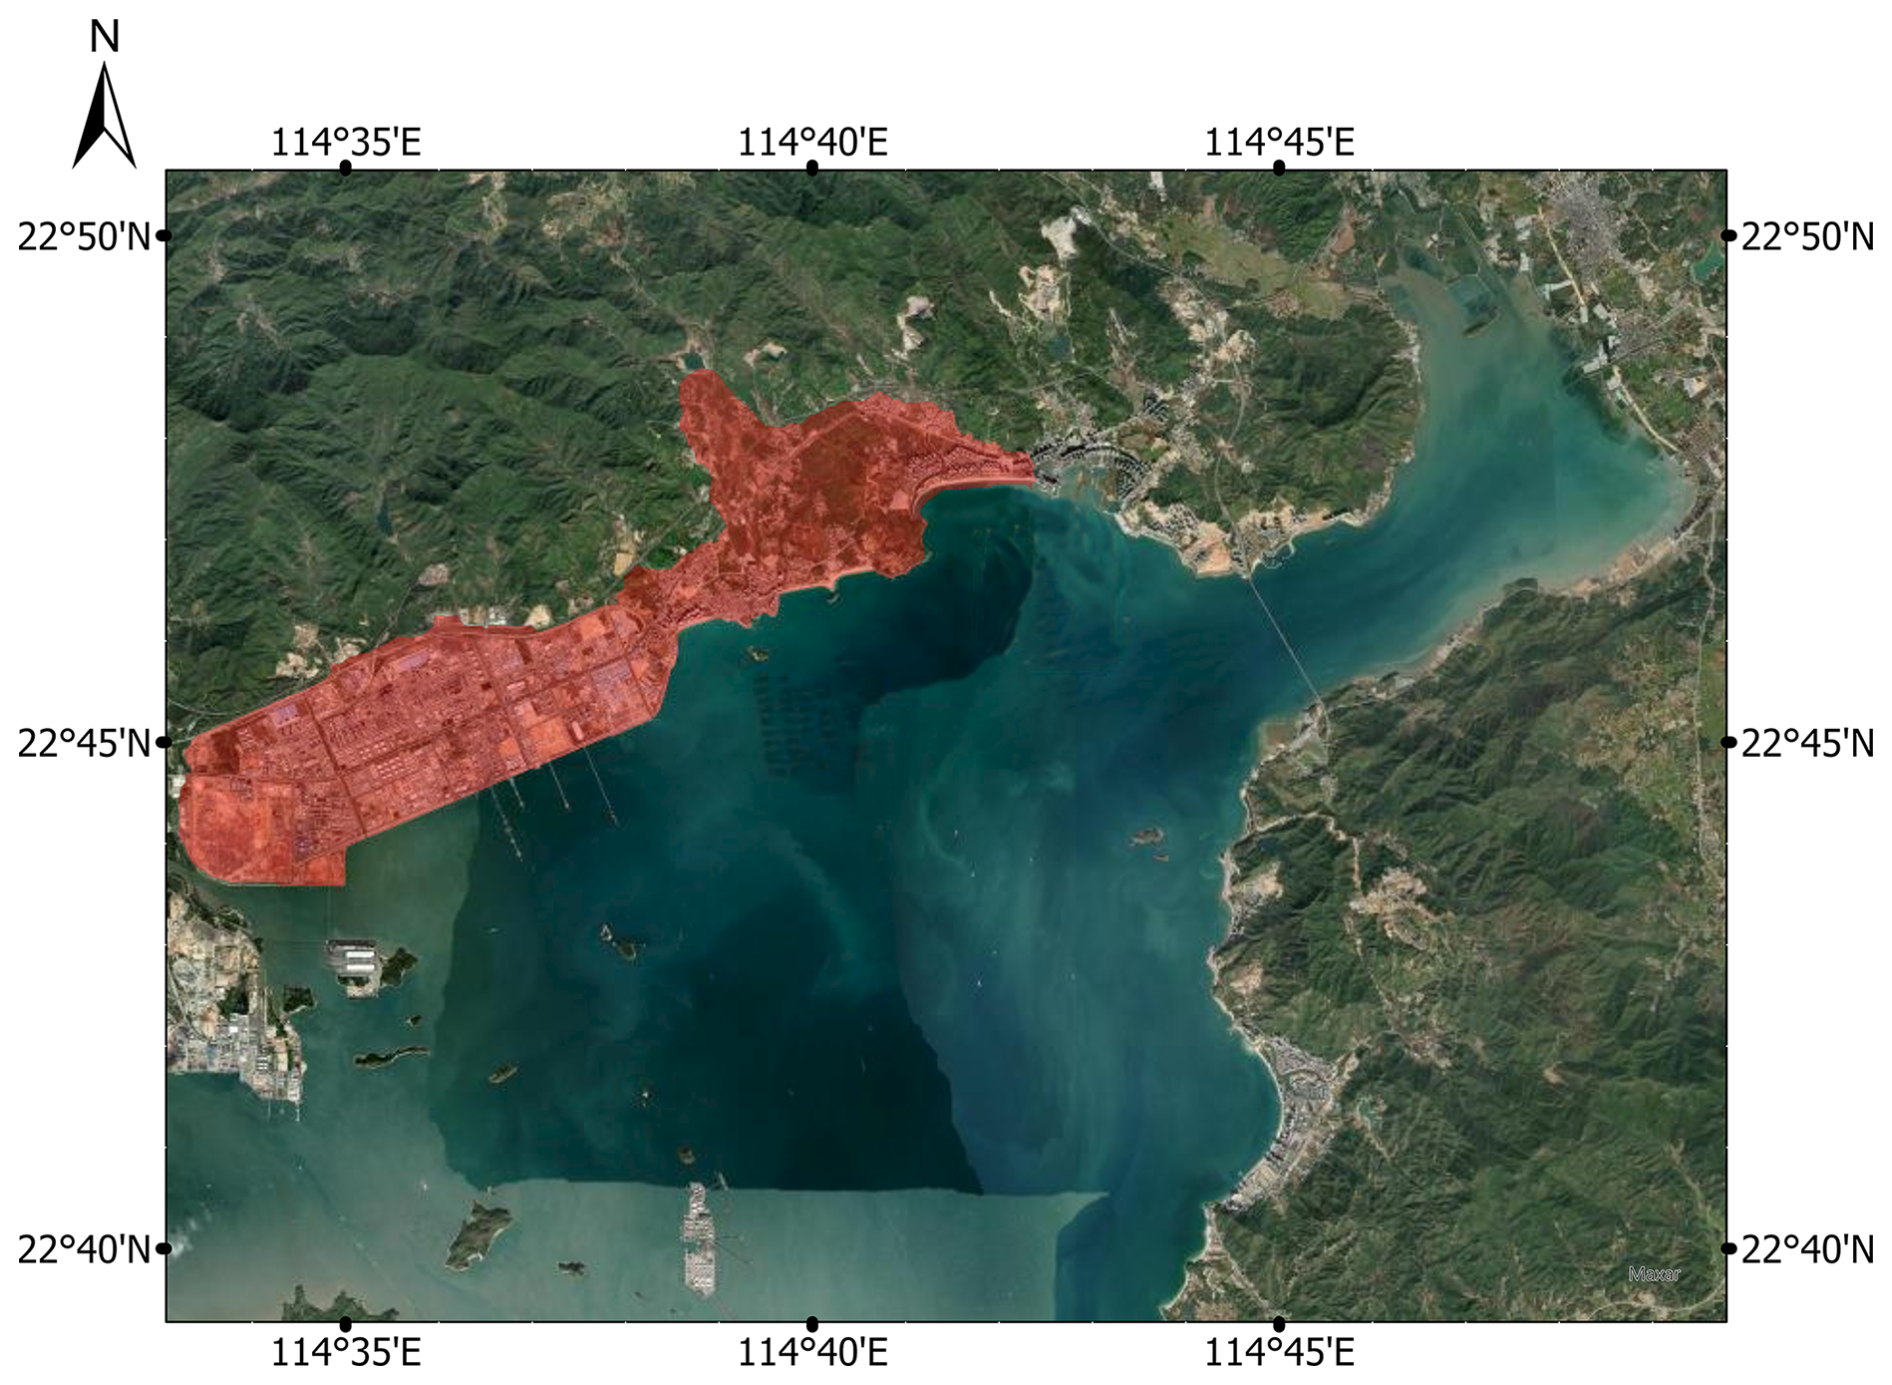
Figure 1The Daya Bay. The study area is in red. Basemap sources: Esri.
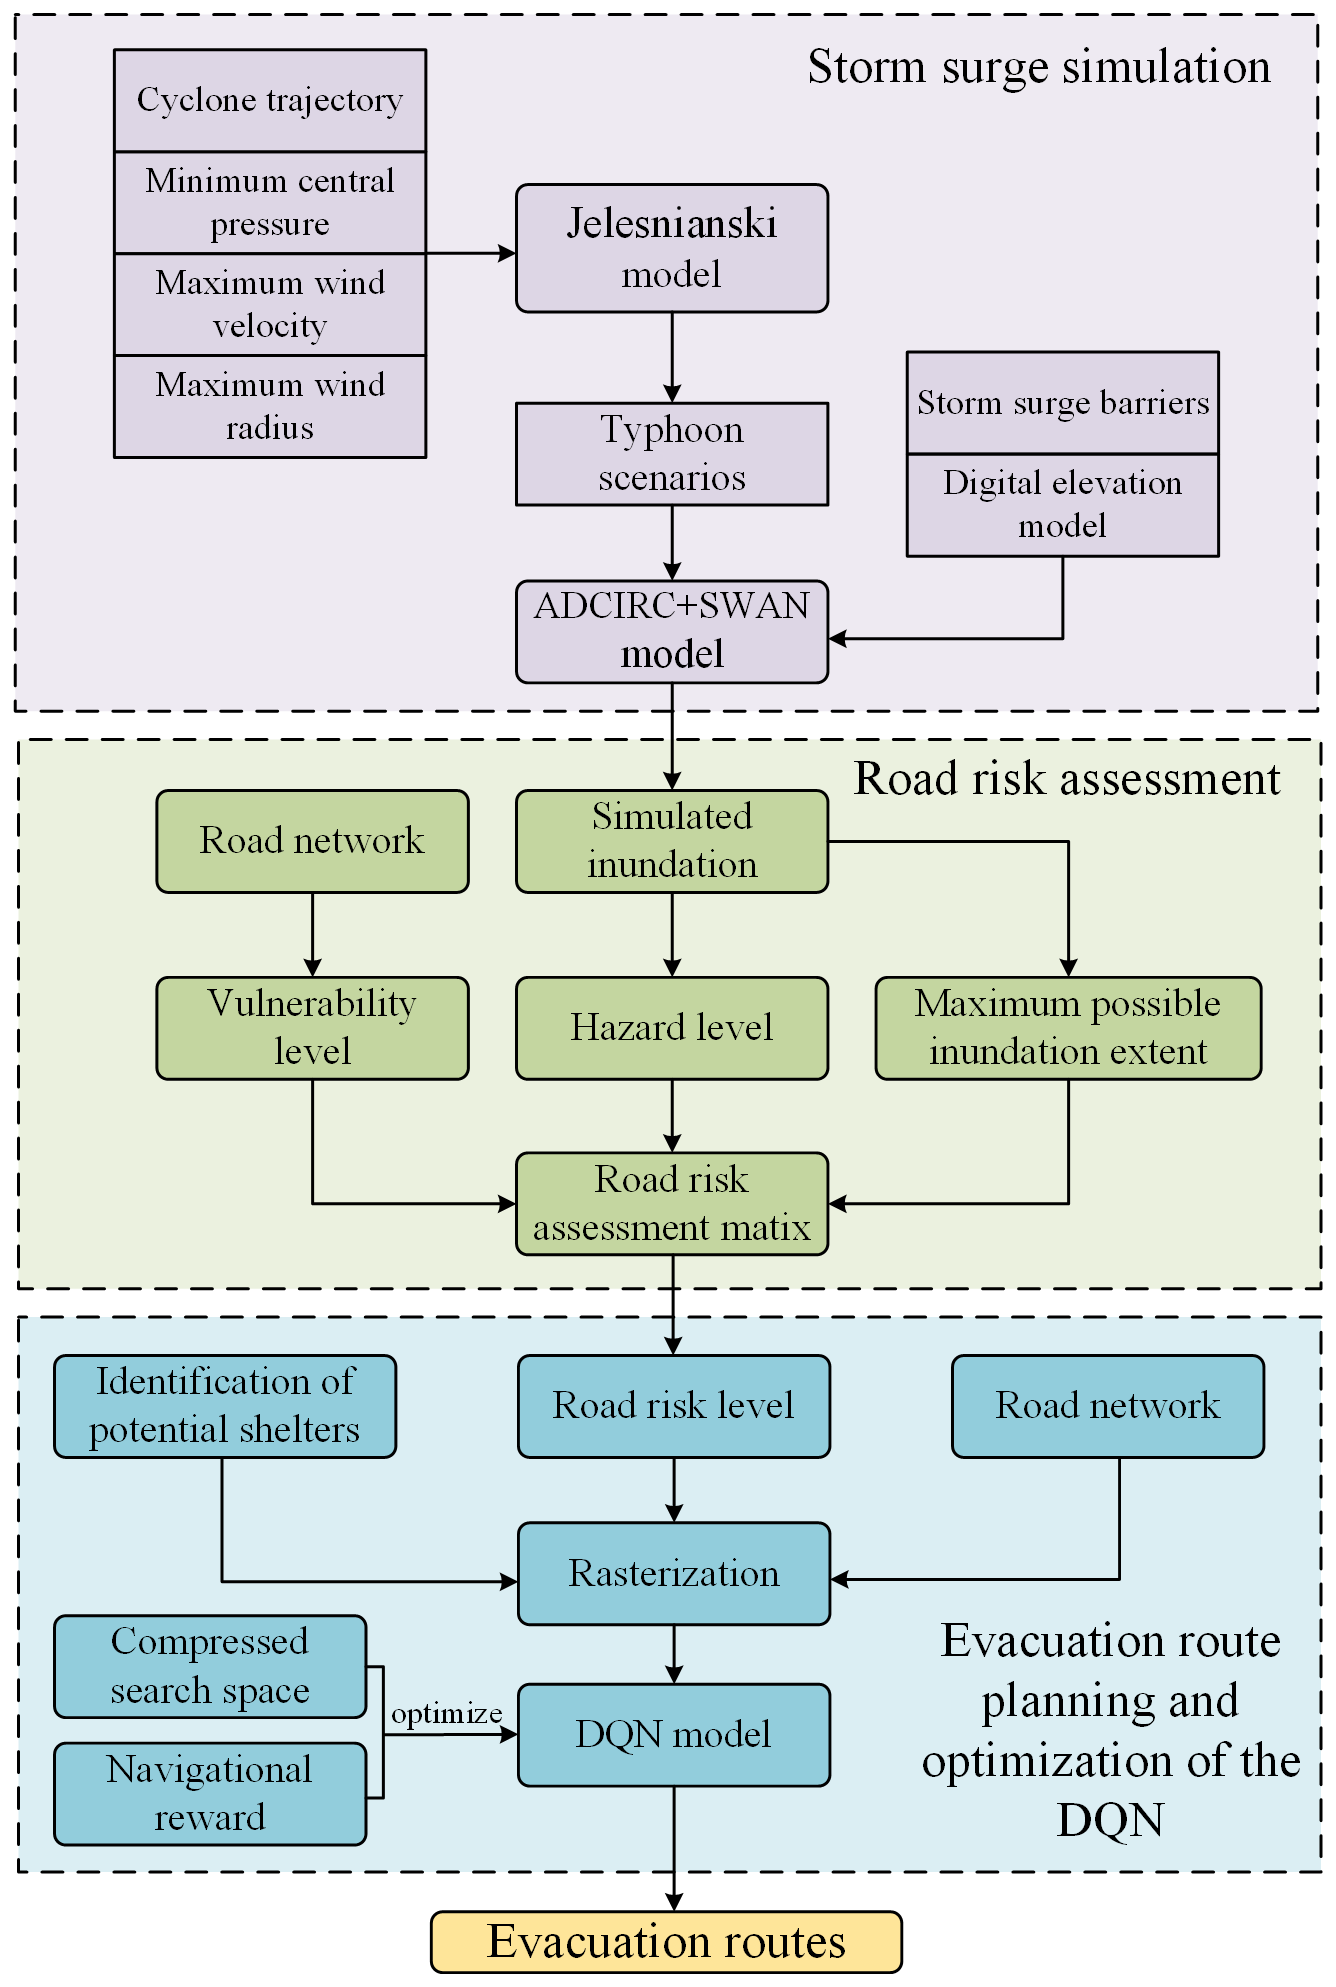
The risk assessment and evacuation route planning for storm surge play a crucial role in saving lives and mitigating disasters. The significance of this work lies in the ability to simulate storm surge flooding for risk assessments and to find routes to the nearest disaster on the road network. In this study, the method used to perform risk assessment and evacuation route plan consists of following four sections: (1) storm surge simulation; (2) road risk assessment; (3) evacuation route planning; (4) optimization of the DQN. Please refer to Fig. 2 for an overview and the sections for more information.
3.1 Storm surge simulation
Given the difficulty in obtaining measured typhoon data, a widely adopted method is to construct a theoretical wind field model using the wind gradient formula (Jelesnianski, 1965; Willoughby and Rahn, 2004). In this study, the Jelesnianski hurricane model (Jelesnianski, 1965) was used to provide wind forcing. This approach requires the specification of four critical parameters: the cyclone trajectory T, the minimum central pressure Pc, the maximum wind velocity Vmax, and the maximum wind radius Rmax. The Rmax may be approximated through several empirical equations (Vickery et al., 2000; Cheung et al., 2007), as delineated below:
where ΔP indicates the pressure difference between the minimum central pressure Pc and ambient pressure, and in this study, the ambient pressure is 1010 hPa; θ represents the latitude of the storm's center; Rk is an empirical constant usually taking the value range of [30, 60], and we take the Rk=50. The are all estimates of Rmax and the final Rmax we adopted was their average, i.e.
Given a pressure difference ΔP, the maximum wind velocity Vmax can be estimated by a empirical equation(Atkinson and Holliday, 1977):
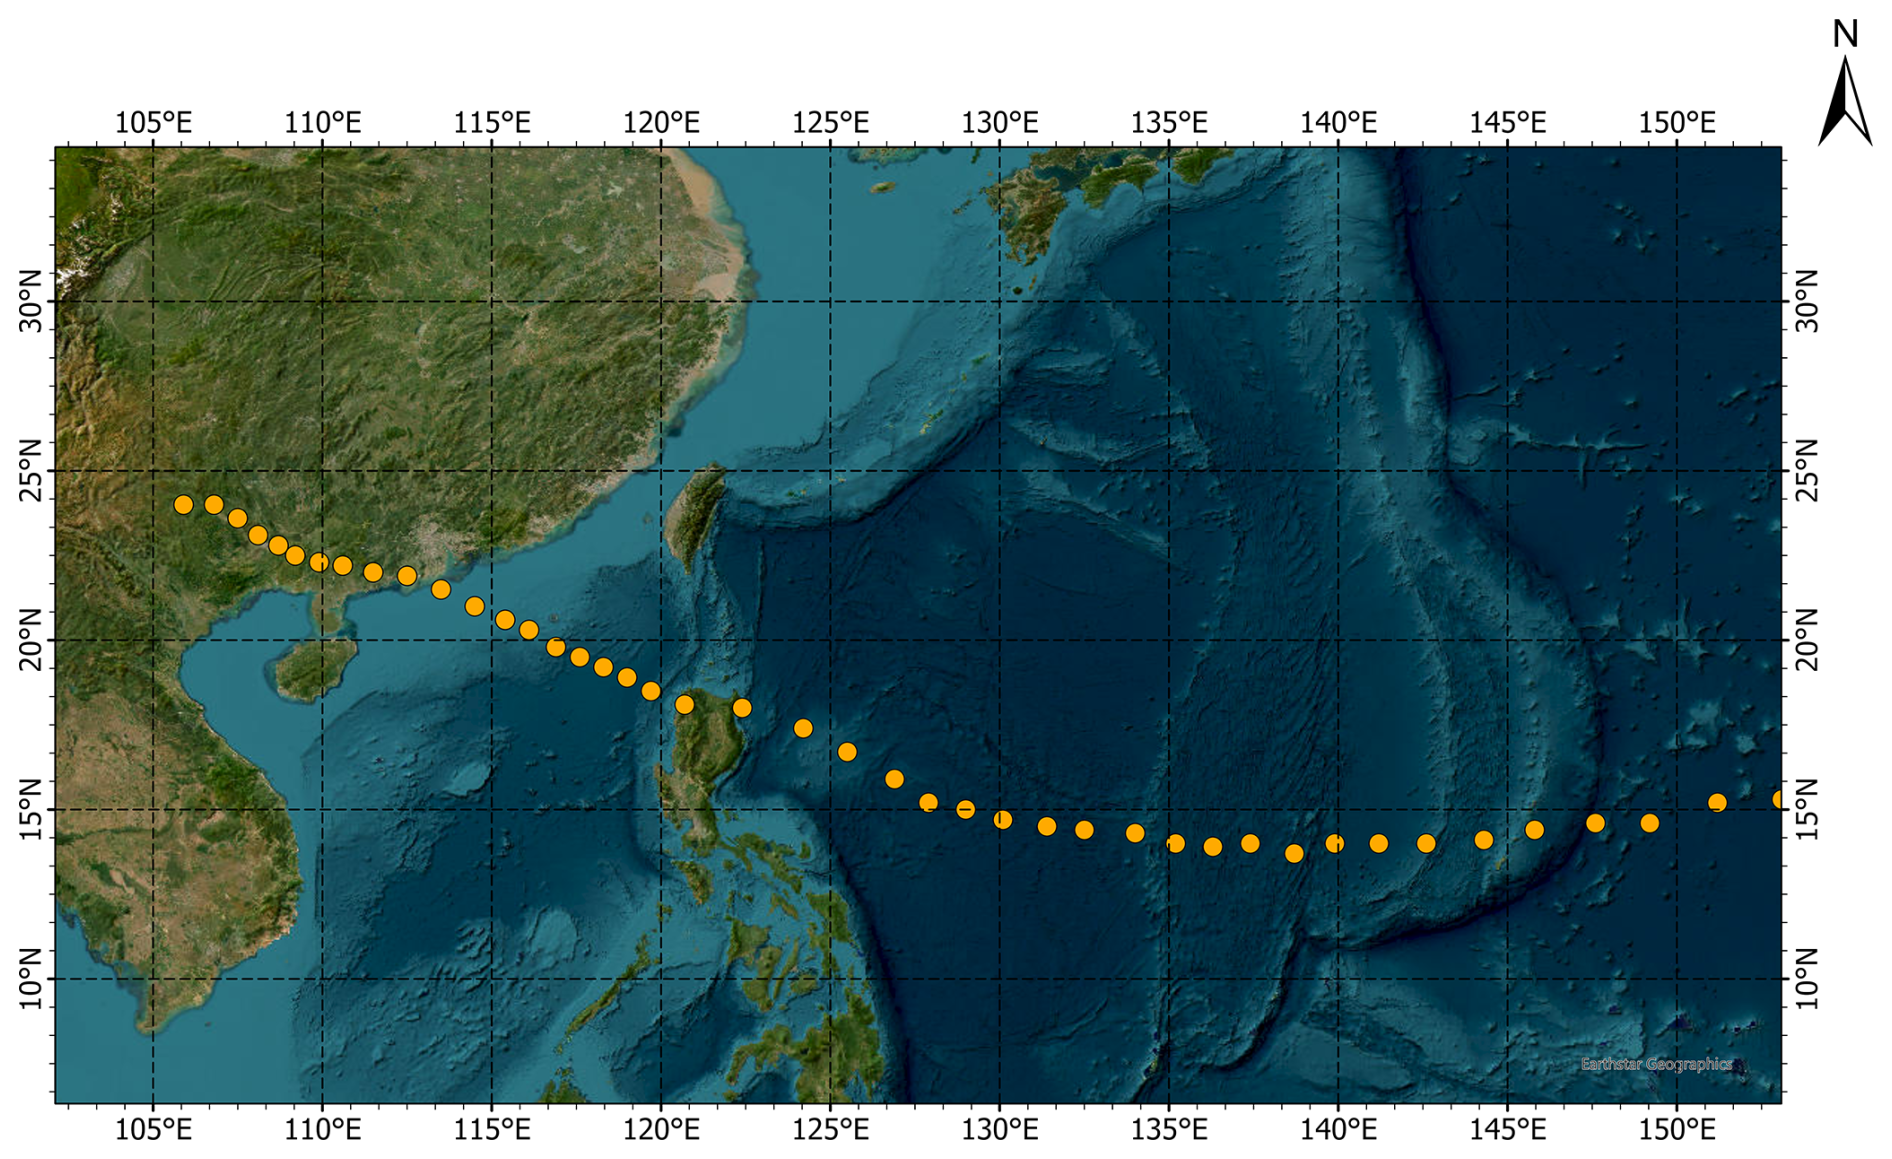
Figure 3The trajectory of “Mangkhut”. Basemap sources: Esri.
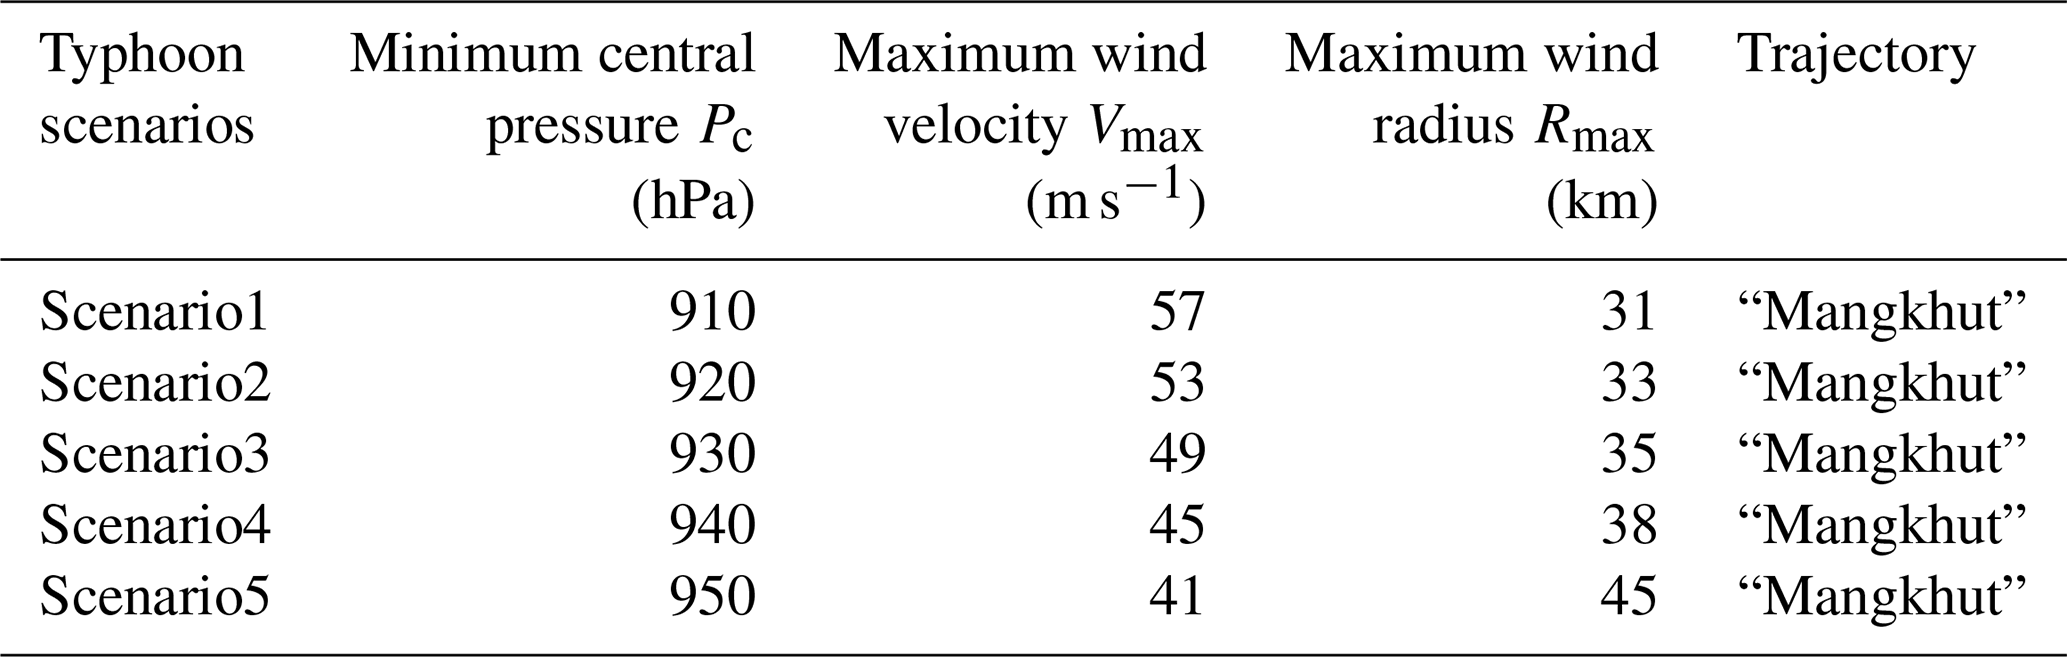
According to the Tropical Cyclone Dataset of the China Meteorological Administration (CMA, Ying et al., 2014; Lu et al., 2021), from 1949 to 2022, Huizhou was impacted by tropical cyclones of typhoon intensity or greater, account for 58.9 % of all events, with central pressures ranging from 900 to 960 hPa. Among these cyclones, 57.7 % moved a westerly or northwesterly path. In this study, the trajectory of Super Typhoon “Mangkhut” (No. 1822) was selected to construct a simulated wind field for storm surge inundation simulations for its northwestward movement and its status as the strongest cyclone in the Asia-Pacific region in recent years. Employing the trajectory of “Mangkhut” is significant, as it potentially introduces the maximum storm surge inundation to the study area. As shown in Fig. 3, the trajectory of “Mangkhut” spanned a vast geographical area, originating in the tropical Pacific region, traversing the Philippine Sea, and culminating in landfall along the southern coast of China. Based on Jelesnianski model, five typhoon scenarios were constructed as demonstrated in Table 1.
Using the Jelesnianski hurricane model (Jelesnianski, 1965) to provide wind forcing, and combining the coupled ADCIRC+SWAN model with topographic data, bathymetric data, and barrier data to simulate the storm surge inundation in the study area. The computational domain is discretized using an unstructured triangular mesh, with the mesh shown in as shown in Fig. 4. The predominant tidal type in the northern China' South Sea is the 8 major tidal components of semidiurnal and diurnal frequencies (M2, S2, N2, K2, K1, O1, P1, Q1). The elevation data of the land grid was obtained from the digital elevation model (DEM) data of Huizhou acquired in 2015. The storm surge barriers data in study area were obtained from the actual measured barrier engineering data and elevation measurement data. The ADCIRC+SWAN model was evaluated using real historical disaster events. (Detailed validation results between observed and simulated water levels is provided in Appendix A).
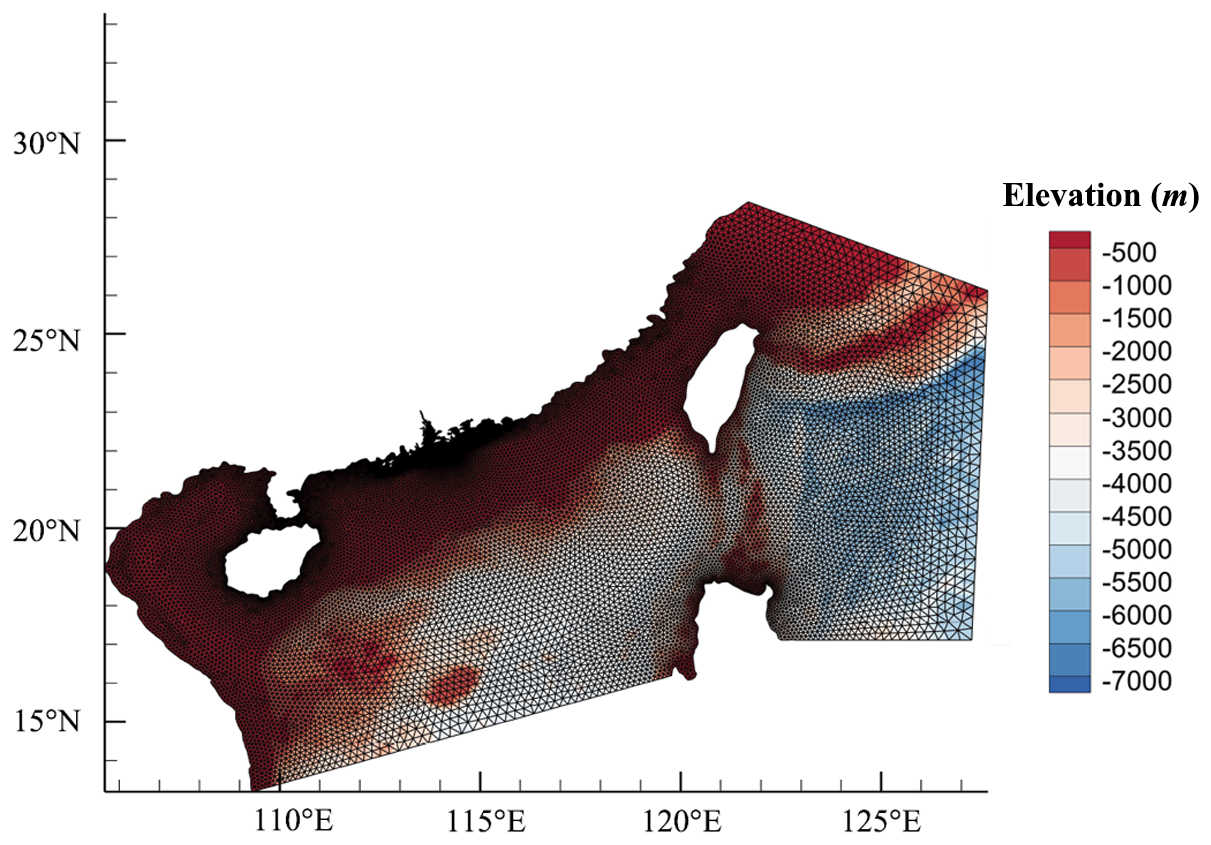
Figure 4The computational domain. The model's computational domain covers the central and northern China' South Sea, as well as part of the eastern Philippine Sea and some areas of the northwest Pacific, extended from 106.0 to 128.0° E and from 13.0 to 28.0° N. The grid resolution on the open boundaries ranges from approximately 5 to 110 km, while the grid resolution along the coast of Huizhou is approximately 150 m. The mesh is optimized using local truncation error analysis, with a minimum grid resolution of approximately 100 m. The model contained grids consisting of 74 328 units and 38 407 nodes.
3.2 Road risk assessment
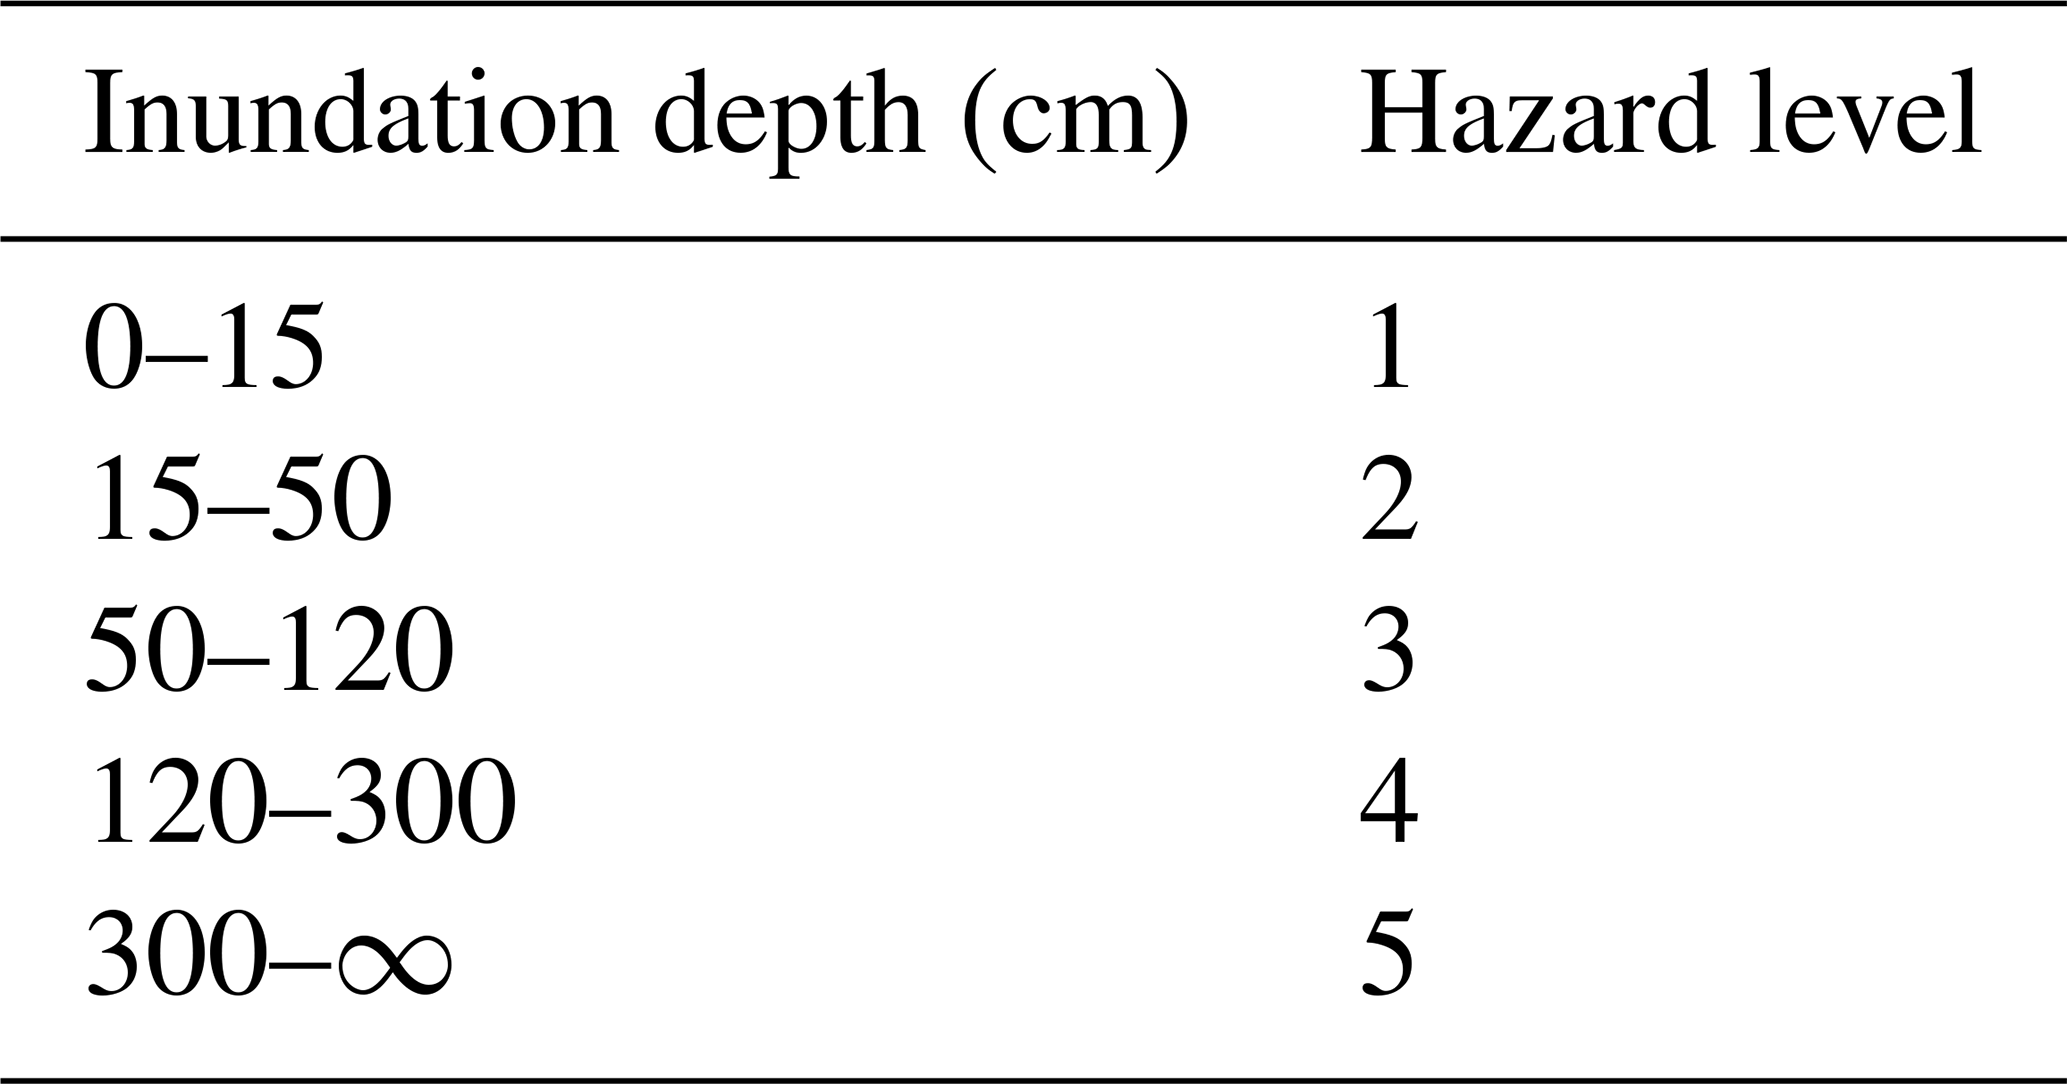
In this study, a fine-grained road risk assessment was conducted by comprehensively combining exposure, vulnerability, and hazard. The maximum possible extent of inundation under the storm surge scenario was determined to identify the roads that would be affected. To conduct hazard assessment, the roads were categorized into different vulnerability levels based on their traffic conditions. The evaluation of storm surge-related hazards is conducted by quantifying the extent of damage sustained by road infrastructures at varying inundation depths. The work of Huizinga et al. (2017) in 2017 provided a reference for the correlation between inudation depth and facility damage rate (Huizinga et al., 2017). Among all examined vulnerable elements, transportation facilities exhibited the highest damage rate due to their sensitivity to flooding and their importance in urban functions, as shown in Fig. 5. Based on the correlation, this study conducts a storm surge hazard assessment, dividing the inundation depth into five hazard levels, as illustrated in Table 2.
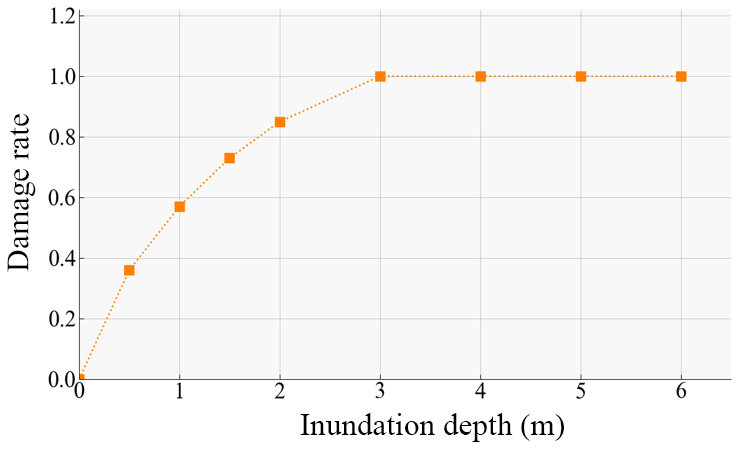
Figure 5Relationship of inundation depth and transportation facilities damage rate. As the inundation depth increases from 0 to 3 m, the damage rate of the transportation facilities also increases. However, this curve also delineates a saturation threshold in the damage rate when the inundation depth reaches 3 m. This suggests that once road transport facilities reach a state of severe damage, further increases in inundation depth cannot cause a higher damage.
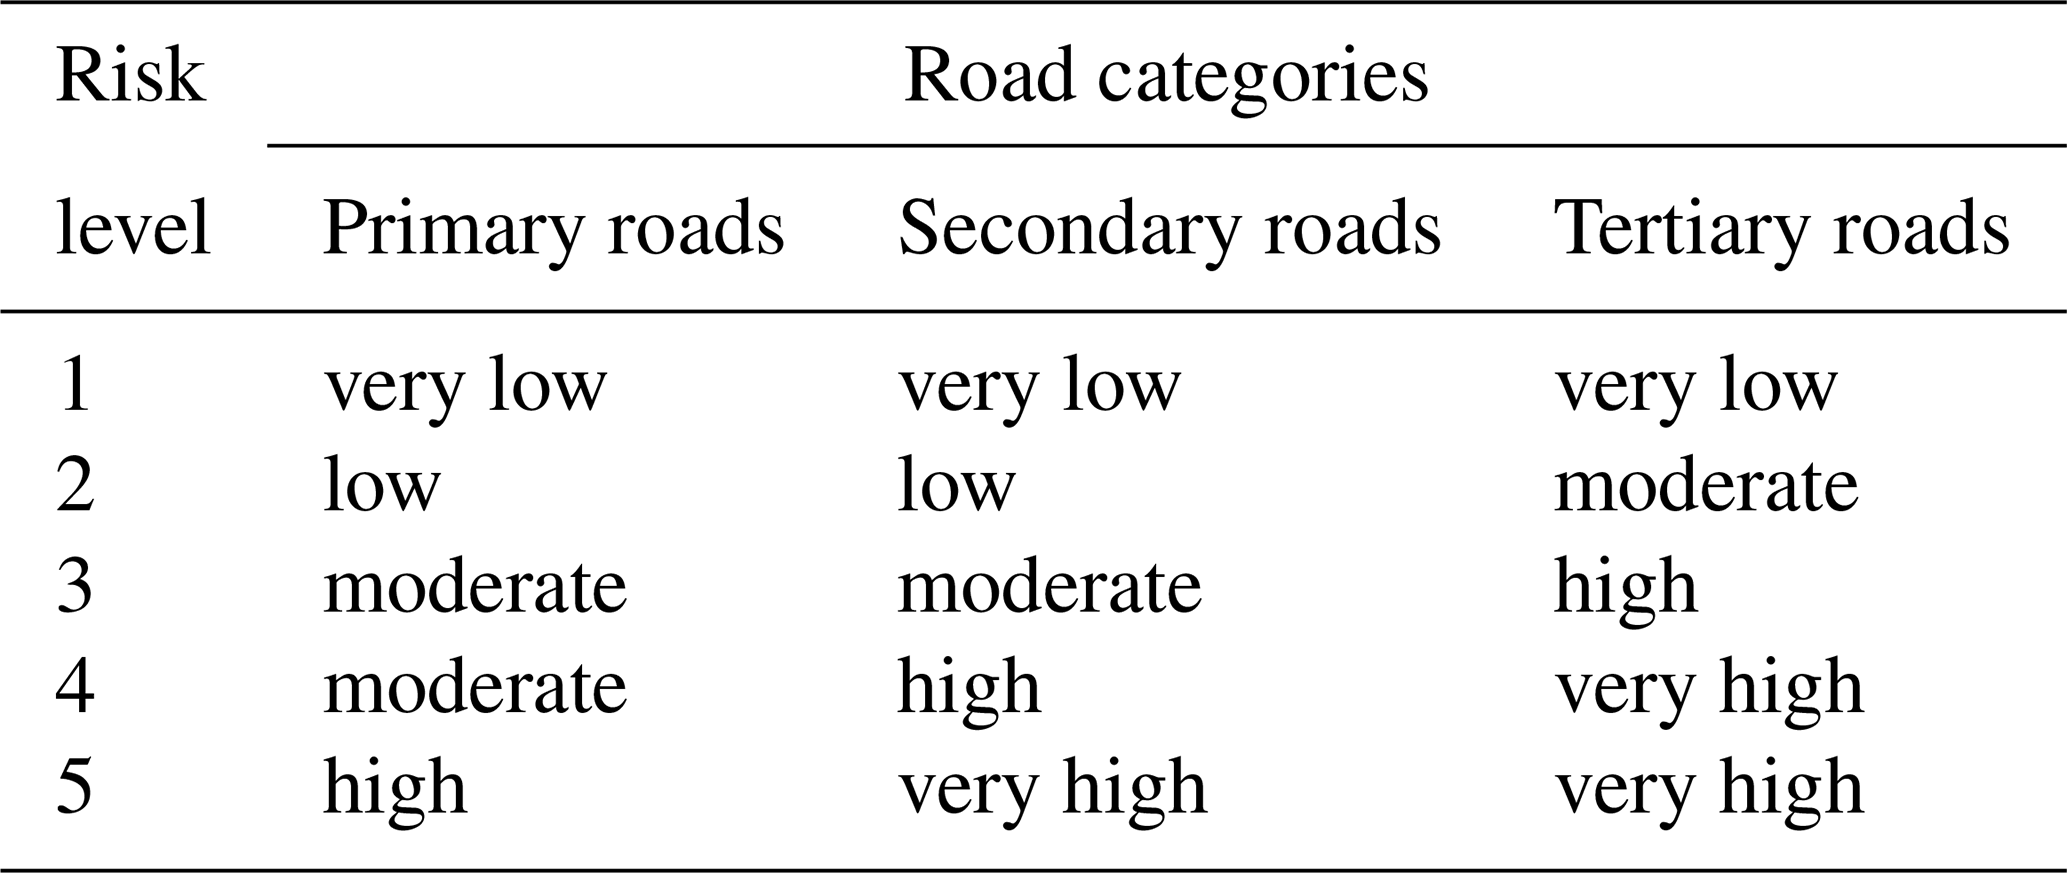
In the construction of transportation facilities, roads are categorized based on criteria such as significance, capacity, and function, as follows: (1) Primary roads, also known as arterial roads, include highways, national and provincial roads. These roads typically have the highest design standards and firmer constructions. Consequently, their vulnerability is lowest, and they can maintain service even under extreme weather conditions. (2) Secondary roads typically serve to link pivotal urban areas, facilitating intra-city transportation. Although designed to lower standards than primary roads, they are still required to accommodate substantial traffic volumes and meet stringent safety demands. (3) Tertiary roads, encompassing rural pathways and minor unnamed thoroughfares, typically represent the extremities of the transportation network. These roads are designed and constructed to the lowest standards, primarily serving residents in rural areas. The vulnerability of the three categories of roads in ascending order is as: primary roads < secondary roads < tertiary roads. When considering the roads affected by the maximum inundation extent, combining the vulnerability of roads with the hazard level, a refined road risk assessment matrix was proposed, as shown in Table 3.
3.3 Evacuation route planning
Although the road network in the study area exhibits full connectivity, its complexity hampers the construction of the topological structure. To apply DRL algorithm for evacuation route planning, this study utilized a raster environmental modeling; raster data can be perceived as images stored in matrices, with a concise structure that facilitates subsequent computational processing. The study area, a rectangular region of 9 km × 15 km, is divided into a cell of 16 m × 16 m.
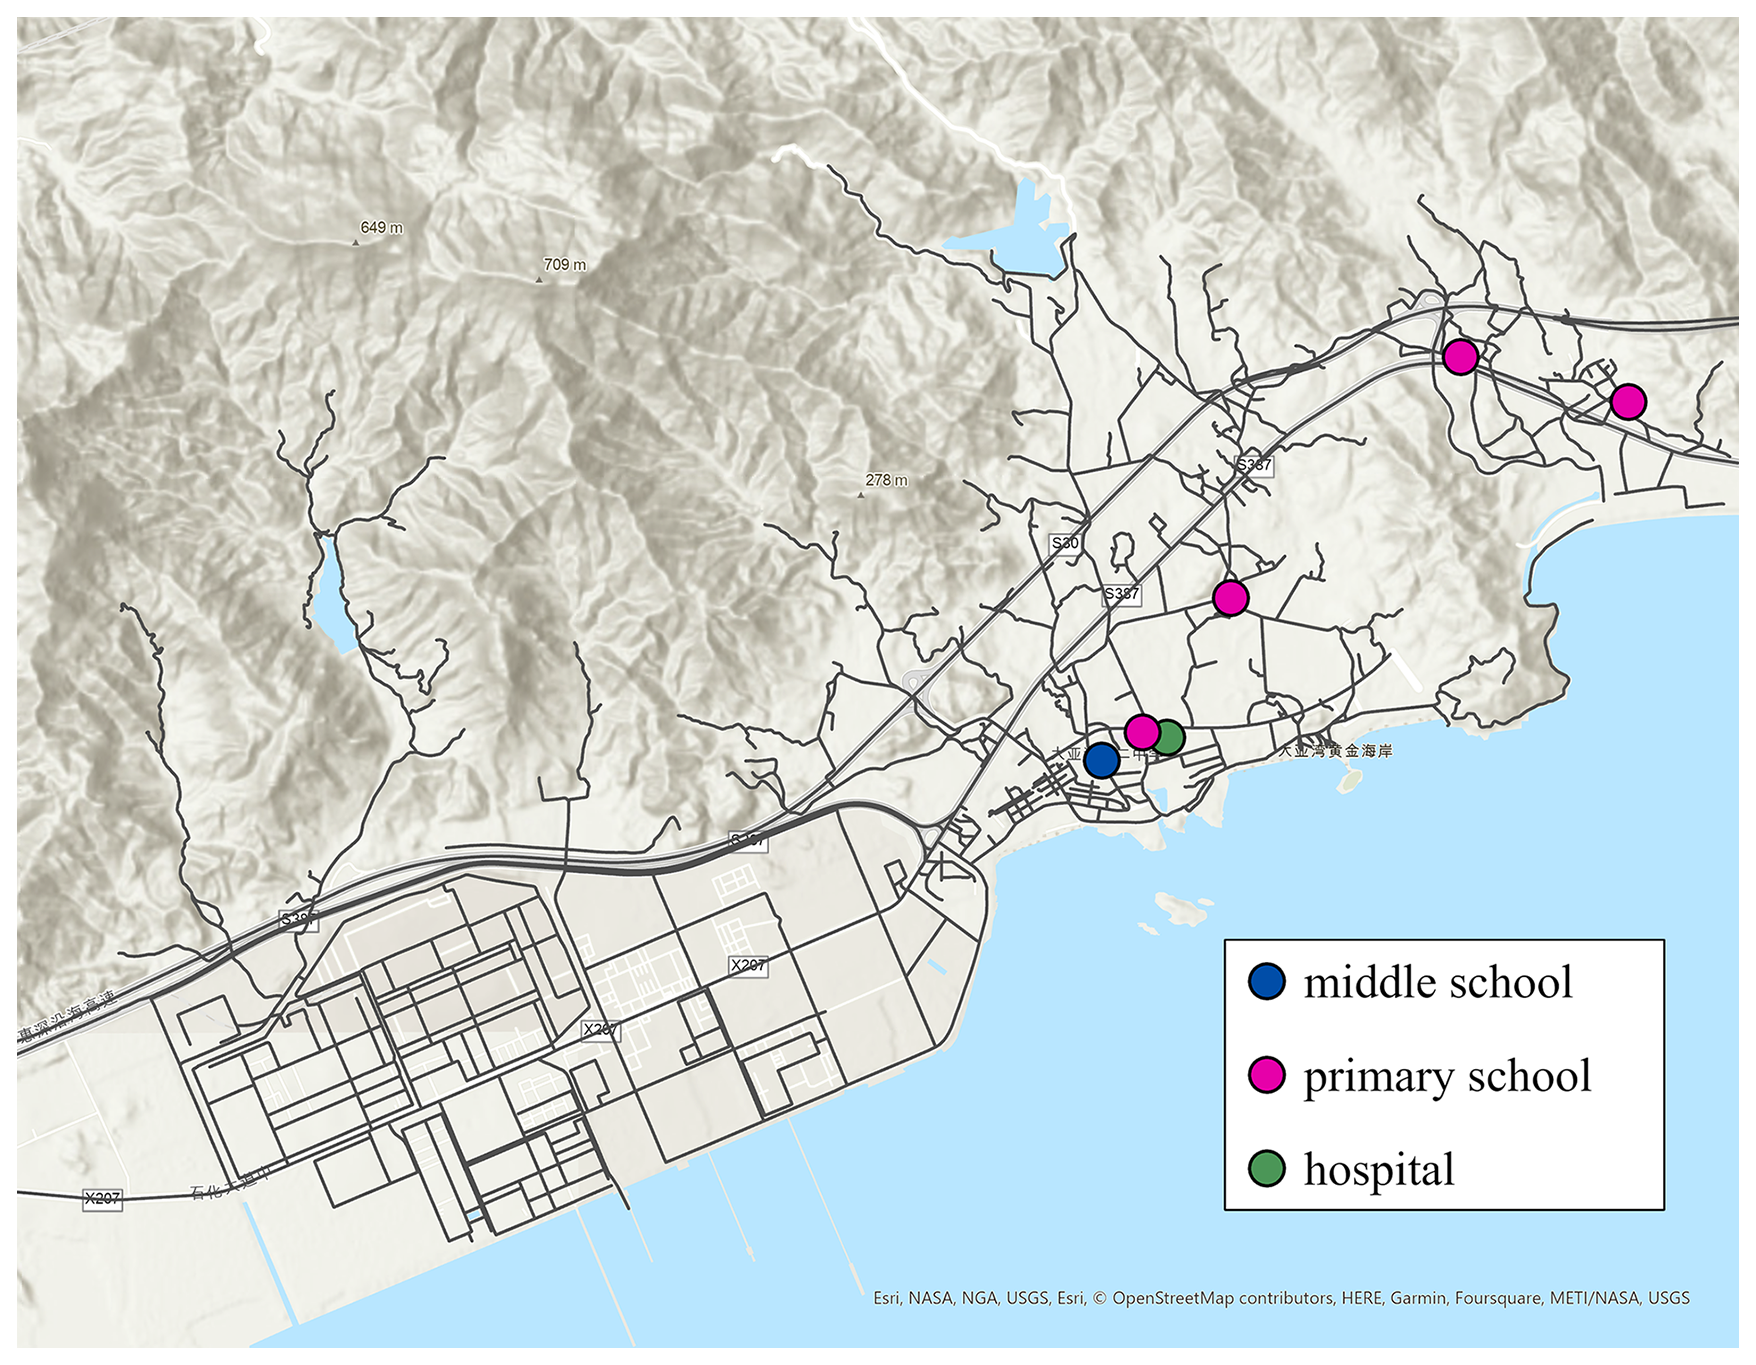
Figure 6The spatial distribution of potential shelters in study area.
Identifying potential shelters for swift evacuation is essential, especially in suburban areas where dedicated disaster shelter facilities are limited. This study employed three criteria: structural stability, waterproofing, and capacity to assess potential shelters. Hospitals are inherently designed to withstand various natural disasters. Hospitals, inherently resilient to natural disasters, are prioritized due to their Class II waterproofing and Class I seismic resistance as per GB50011-2021 and GB50345-2021. Schools, with Class III waterproofing and enhanced seismic construction (GB50011-2021 and GB50223-2021), are also considered suitable. By integrating local population density, traffic, and disaster risks, this research has identified several potential shelters. Their spatial distribution is depicted in Fig. 6, which clearly marks the positions of each recommended shelter within the road network. For route planning, since shelters are not typically located on roads, proximity to a shelter is defined by reaching road cells within a “shelter range” of 128 m, equating to access to the shelter itself.
Deep reinforcement learning is a new paradigm that focuses on formulating suitable policies and taking action to achieve a specific goal. A DRL agent learns autonomously through continuous interactions with a environment by performing actions and receiving rewards without supervision. The interaction model between the agent and environment is illustrated in Fig. 7. The primary objective of the agent is to maximize cumulative rewards, which can be advantageous for evacuation route planning. In this study, the Deep Q-Network was employed to maximize the cumulative rewards.
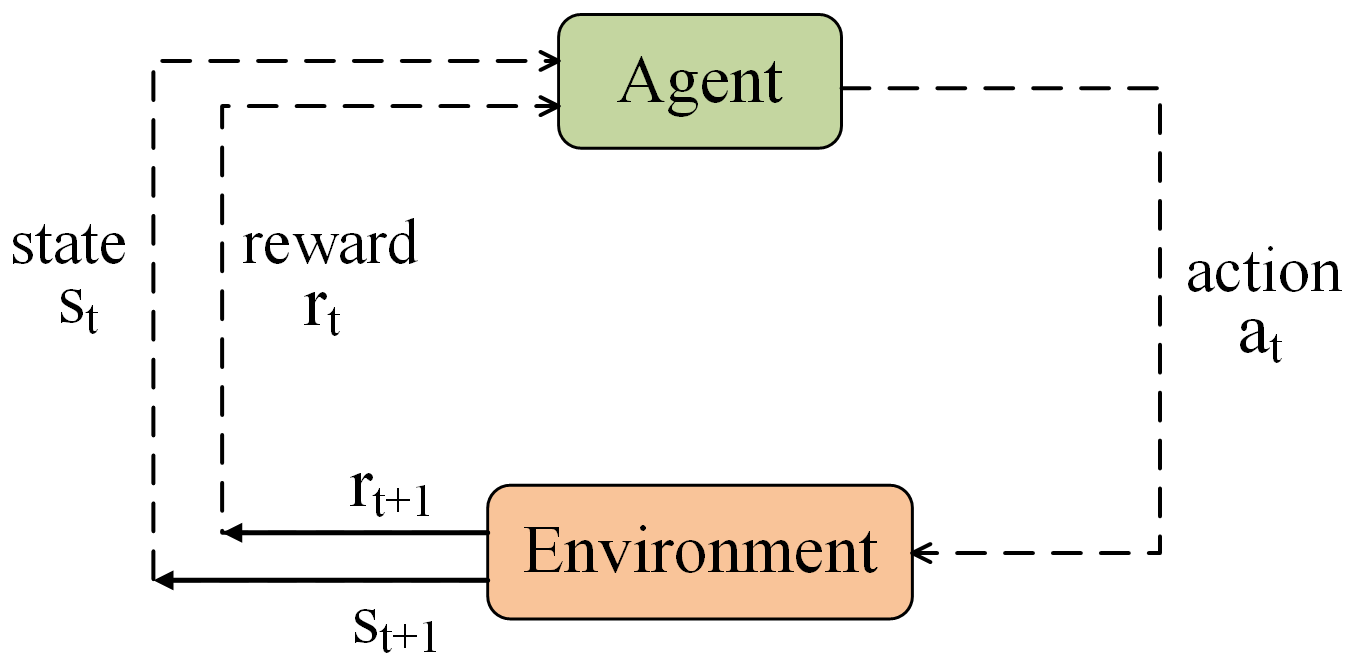
Figure 7The DRL model, adapted from Sutton and Barto (2018). The environment is objective and refers to everything outside the agent that interacts with him, and the knowledge of the agent is reinforced through the interaction agent-environment. State (st) represents the current state of the agent, which contains the current environmental feature, and the state space (S) represents the set of all possible environmental states. Action (at) represents the action taken by the agent in state st according to policy π, and the action space (A) comprises all possible actions that an agent can take in a specific state. The feedback mechanism called reward rt+1 is introduced to quantify the value of the state st and the action at.
The route planning can be reformulated as a continuous position state transition process based on Markov chains. This approach discretizes the route into states and actions, employing the Markov Decision Process (MDP) to address the uncertainties inherent in navigation. Given a state space S, an action space A, and a set of rewards R, the Markov decision process (MDP, Bellman, 1957) and the Markov reward process (MRP, Bertsekas, 2012) are defined as Eqs. (6) and (7):
where represents the transition probablility from state s to state s′ after performing action a, and is the reward obtained after transition . MDP can be regarded as a continuous decision-making process, and the next action to be performed is only dependent on the current state. It is important to clarify the nature of the transition probability in our model. In a general MDP, the state transition function can be stochastic, representing inherent uncertainty in an environment's dynamics. In contrast, the raster-based environment in this study is deterministic. Specifically, any action taken from a given state (a grid cell) deterministically leads to a single, known subsequent state (the adjacent cell). This means the transition probability is 1 for the resulting state and 0 for all others. As the environment's transition model is perfectly known, it does not need to be learned or estimated from real data.
In the setting of raster environment, the route planning can be described as: the agent chooses the subsequent action based on the current state until it reaches the destination. The location of the agent serves as the state, and the state transition is memoryless, satisfying the Markov property. Under the fixed-size raster environment and the same-size cells setting, the basic state space is , and the basic action space is potential moves to the 8 adjacent cells , while the following state transition is available:
The route planning problem in raster environmrnt based on the MDP is defined as follows:
where d(s,se) is the Chebyshev distance between cell s and the destination cell se. In the study area, the destination is represented by a cluster of shelter facilities, collectively constituting the destination set D. Let signifies the distance to the nearest shelter facility. We defined the reward as a function of the difference , implying that the reward is related to the agent's proximity to the destination.
DQN is a value-based DRL algorithm where the output for a given state st is a vector of action values denoted as , with θ representing the parameters of the online network. The agent's policy is to perform the action associated with the highest value. A DQN is a multi-layered neural network that estimates the value of states and actions. State value is the expected reward that the agent can obtain from a state to give an estimate of how good a state is, and action value is the expected reward that the agent can obtain from a state after performing a specific action. DQN incorporates an experience replay mechanism (Mnih et al., 2015), which mitigates temporal correlations by randomly drawing from a stored memory of past experiences. This approach allows the agent to learn effectively from rare events. Additionally, DQN utilizes a separate target network (Mnih et al., 2015) to estimate the , thereby enhancing the stability of the learning process. Under a policy π, the value of a state s is denoted as Vπ(s) and the value of a action a in the state s is denoted as Qπ(s,a):
where Gt is the total discounted reward from state st and is the discount factor.
The goal of DQN is to find an optimal policy π* to maximize the state value and action value. Under the optimal policy π*, the optimal state value function V*(s) and the optimal action value function can be obtained by:
The DQN searches for the optimal policy to maximize the largest long-term cumulative reward that the target is:
And using the Mean squared error loss (RMSE) as loss function, the DQN can be trained by optimizing the following loss:
The update process is based on the Monte Carlo method. By continuously interacting with the environment, the agent observes immediate rewards and accumulates them to count value information, which can then be transformed into a regression problem.
3.4 Optimization of the DQN
Deep reinforcement learning is imperative for this research due to the high-dimensional state space of the problem. The agent's state is not a simple coordinate but a rich, image-like observation, rendering traditional tabular methods like Q-learning computationally infeasible. More importantly, a deep neural network provides powerful generalization, learning abstract environmental features – such as intersections or flooded zones – rather than memorizing individual states. This allows the agent to make intelligent decisions in novel situations, a critical requirement for a practical navigation system. Lastly, its end-to-end learning capability allows for policy optimization directly from raw environmental data, bypassing manual feature engineering.
The DQN model, when applied in a raster environment, faces significant convergence challenges from two aspects: (1) the extensive search space; (2) the issue of sparse rewards. The search space is composed of the state space and the action space. In this study, the rasterized environment consisting of over 19 000 cells with each cell possessing eight actions, resulting in a vast search space. Coupled with the issue of sparse rewards, where the agent receives feedback only occasionally, the model's training process becomes even more complex and the convergence becomes notably difficult.
To reduce of the search space, two innovative methods were proposed: the masked action space and the masked state space. Typically, a cell in the action space allows movement in eight directions, but not all are relevant. By leveraging a mask, the masked action space method efficiently narrows down the available actions from 8 to an approximate average of 3. This method focuses particularly on the transition of the action space, emphasizing the interaction between action and state transitions. The action space transition is dependent on the state transition, as illustrated in Fig. 8, where As denotes the action space associated with state s. According to Eq. (8), the action space of the current state relies on the preceding state and the last performed action, and the transition of action space is defined as:
where a∈As, , represents the probability of taking action a′ after taking action a in cell s. In raster-based route planning, two exceptional scenarios arise: (1) For a state transition , an action a′ exists such that , then the action a′ is deemed redundant for state s′. (2) Diagonal movement, which equates to a combination of horizontal and vertical movements, presents a unique case. Specifically, given the following transitions: , , and , then a′ is redundant following the initial transition s+a. Figure 9 depicts two of eight compressed action spaces, namely action patterns. There are a total of 8 action patterns, which can be saved in 8 binary matrices.
Figure 8The action space transition. The red line represents the state transition and the green line represents the action space transition.
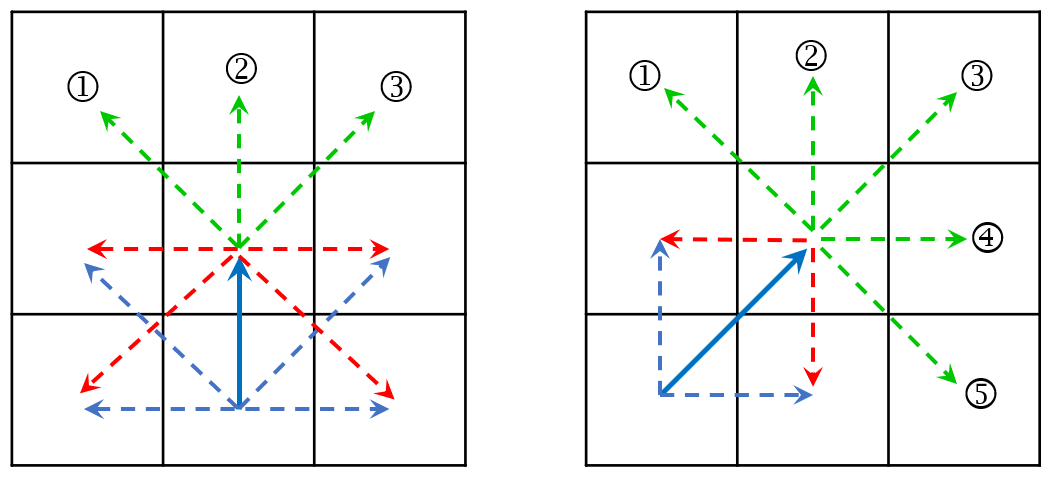
Figure 9Action patterns for up and up-right. The blue solid line denotes the last action, while the red dashed lines represent redundant next actions. The green dashed lines signify the masked action space.
Additionally, as route planning operates on the road network, exploring areas devoid of roads is considered futile. The compressed action space A(s′) for each state transition s+a can be calculated using the raster road network and the action patterns:
where I is the basic action space of size 3×3 with all elements equal to 1, R_N(s) is the road information of size 3×3 centered at cell s, the A_P(a) is the action pattern for a, and the operator ∘ is the Hadamard product. For each pair (s,a), the is the mask of the action space. All the masks were computed in parallel and saved in a table prior to initiating training. Given a transition , consulting the table using the tuple (s,a), and the action space of s′ can be obtained.
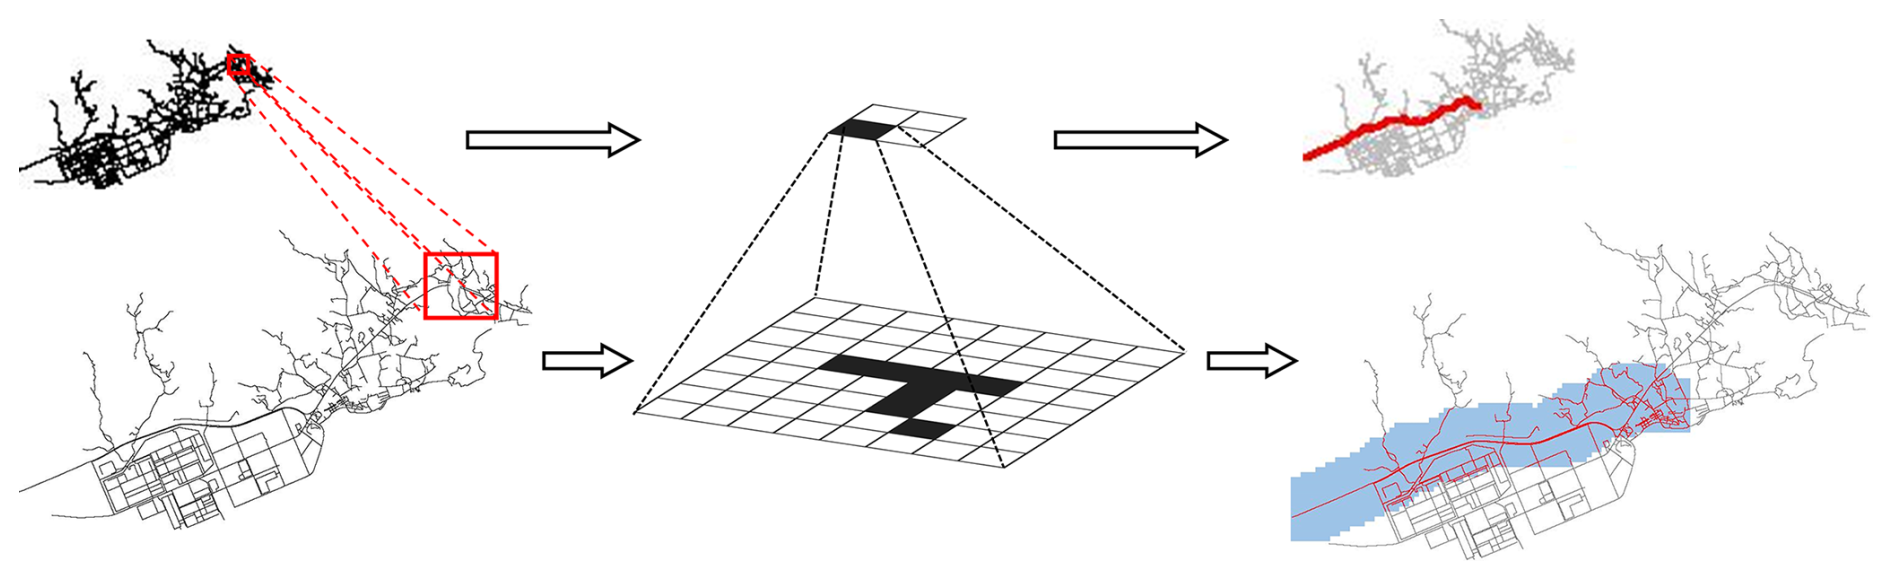
Figure 10The low-resolution image and the high-resolution image. For each cell c(i,j) in the low-resolution image, uniquely corresponds to a rectangular area rec(i,j): , in the high-resolution image. The blue region in the high-resolution image represents the “premium region”.
In large-scale route planning, focusing on a “premium region” – where the optimal route is most likely to be found – is essential, rather than considering the entire network of roads. A masked state space method was proposed to determine the “premium region”. We employed a base path, derived from a low-resolution raster image of the original map, to provide guidance in determining the “premium region”. This base path is quickly identified using a breadth-first search algorithm on the downsampled image. The low-resolution image represents an equally scaled-down projection of the original high-resolution image, and the cell size was set to 128 m × 128 m, which is 64 times larger than the cell size of the high-resolution image (16 m × 16 m). Given the base path in the low-resolution image, the “premium region” , where pi is a rectangular region of to and to . δ=96 m is the tolerance range. In the example depicted in Fig. 10, based on a red base path, the blue region in the high-resolution image represents the “premium region”. By considering only the road information situated in the “premium region” during the route planning, the state space can be substantially compressed, with a compression ratio below 0.4.
Additionally, to tackle the issue of sparse rewards, we proposed the navigational reward mechanism. This mechanism offers a structured approach to categorize rewards into three aspects: basic rewards, distance rewards, and risk rewards. Basic rewards encourage the agent to reach the goal (shelters) in the fewest steps as possible, with goal cells assigned a substantial positive reward, while other cells receive a negative reward. Distance rewards guide the agent towards the goal, providing a reward for moving closer and a punishment otherwise. Risk rewards are negative incentives, designed to deter the agent from high-risk roads whenever feasible. The settings of navigational reward mechanism as illustrated in Table 4. Such a multi-layered reward structure provides the agent with more frequent and meaningful feedback, ensuring a consistent learning trajectory and fostering faster convergence.
Table 4Settings of navigational reward.
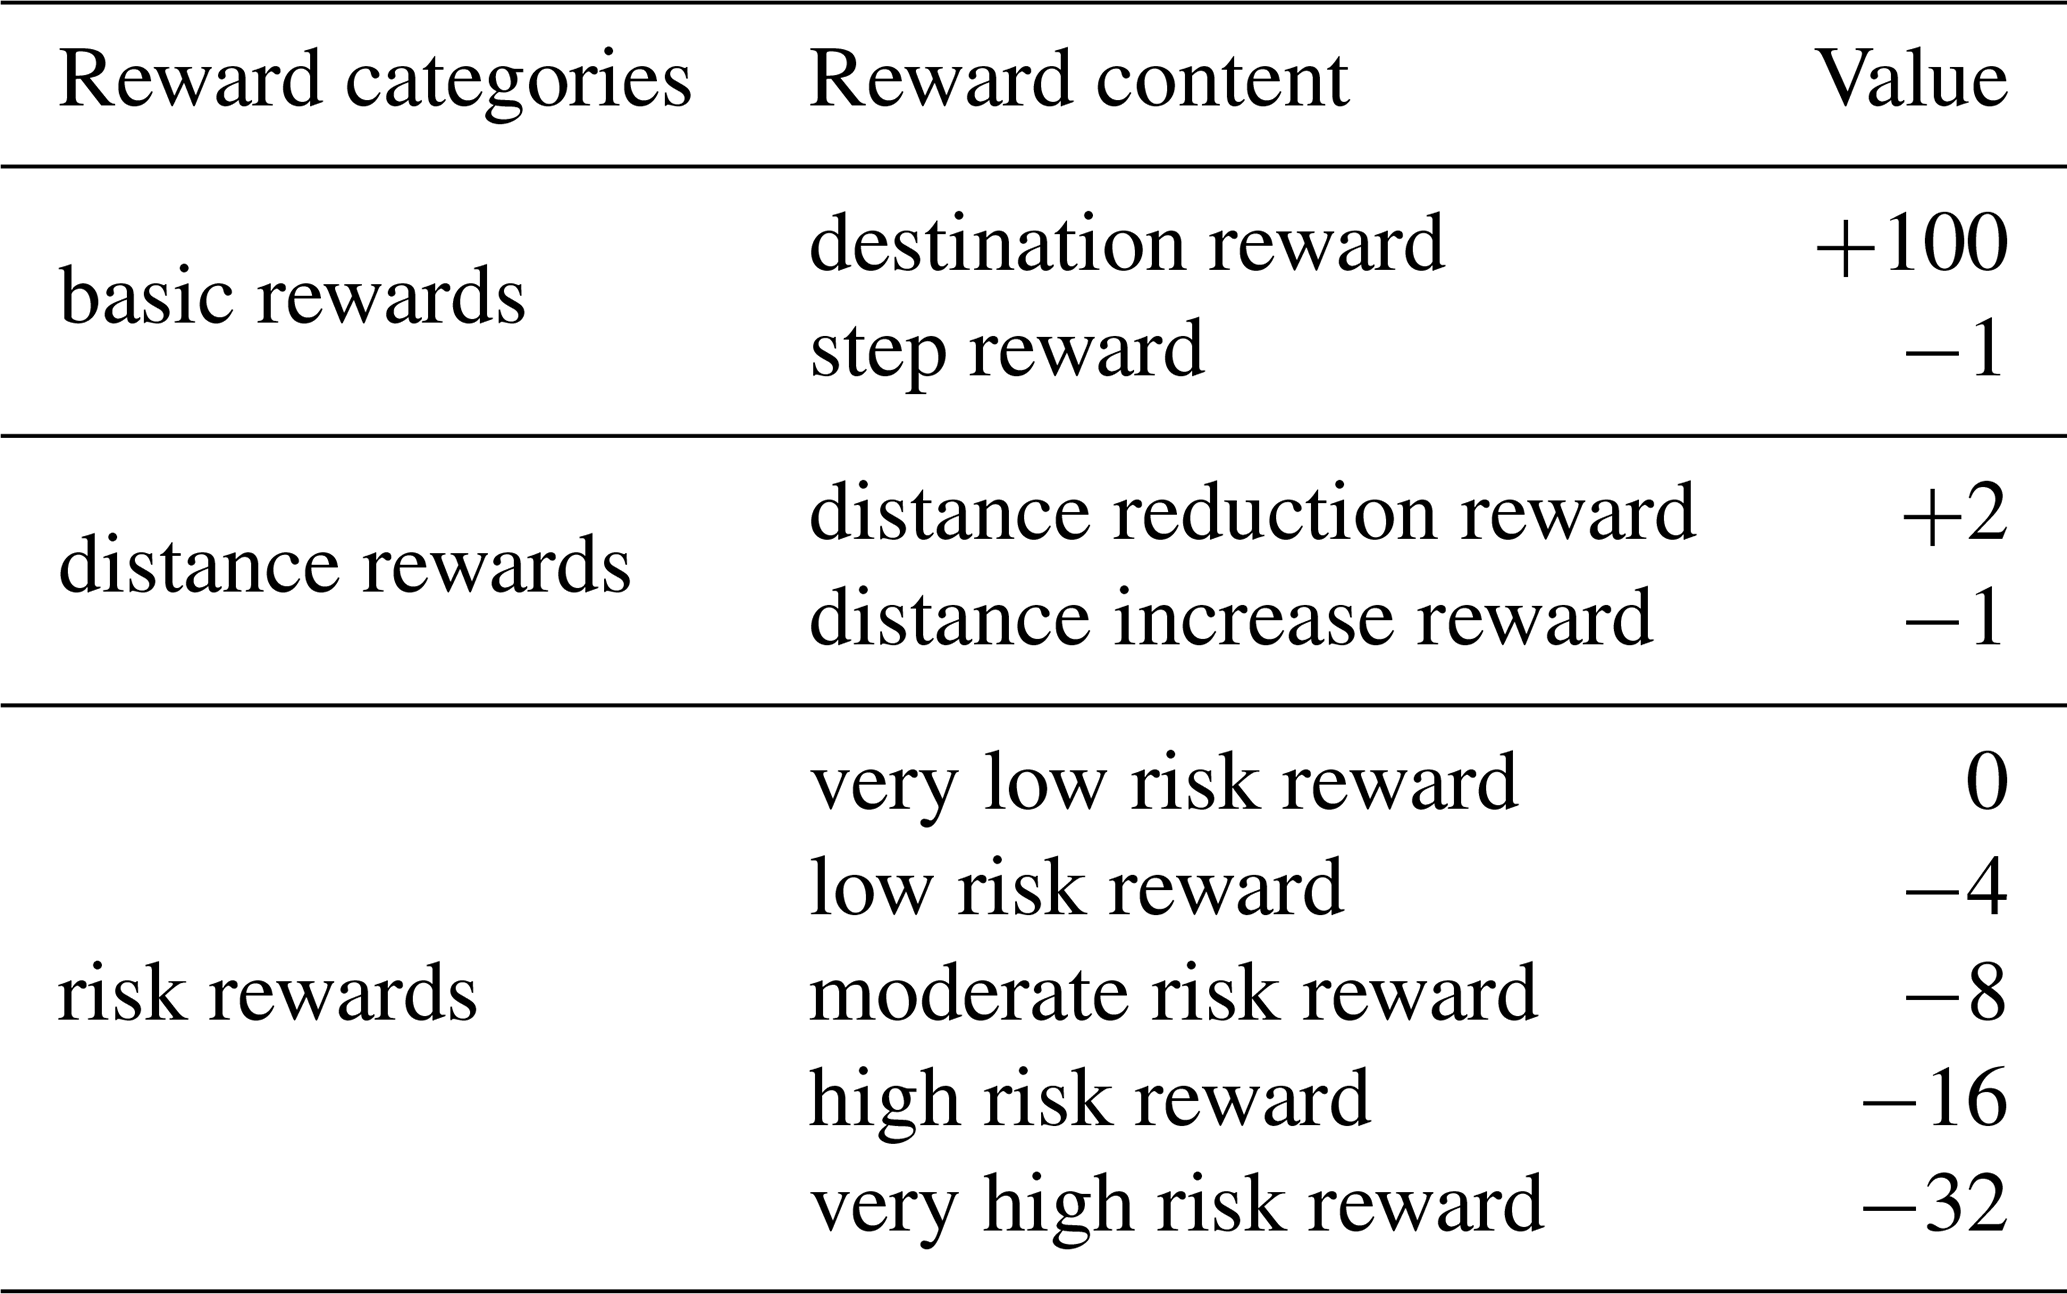
The values presented are relative weights designed to structure the learning objective. In practice, these rewards may be normalized or scaled during training to ensure stable learning dynamics.
The reward function detailed in Table 4 was designed heuristically based on the principle of reward shaping (Ng et al., 1999; Ibrahim et al., 2024), a common approach for creating dense and informative signals to accelerate learning. The specific values were calibrated empirically against the environment's scale. Our analysis indicated that a medium-length evacuation route comprises approximately 100 steps, which established the step reward as a baseline unit. The destination reward (+100) was thus set to counteract the cumulative penalty of a medium-length path, while risk penalties were scaled significantly higher to prioritize safety over minor efficiency gains. This empirically-grounded calibration proved highly effective in guiding the agent toward optimal and safe evacuation routes.
The DQN agent's policy is learned through direct interaction with the simulated environment. The training process is driven by a multi-layered neural network that acts as a function approximator. At each step, the network takes the agent's local observation as input – a multi-channel tensor of size containing information on roads, shelters, risks, and distances. The output is a vector of 8 Q-values, predicting the expected cumulative reward for each possible action. Here, the rob was set to 160 m, reflecting the human field of vision in real-world scenarios. The network's weights are optimized by minimizing the Mean Squared Error between these predicted Q-values and target Q-values, which are generated using the Bellman equation.
Figure 11The DQN training process with the masked action and state spaces compression, features three components: green sections represent the classical DQN, blue sections correspond to compressed search space method, and orange sections indicate navigational reward.
Each training episode begins with the agent at a randomly chosen road cell s0 within a “premium region”, which is defined by a base path from a low-resolution map. The episode proceeds step-by-step until the agent reaches a shelter, which serves as the terminal state. At each step, the agent's action ai is chosen probabilistically based on the outputted Q-values, following an ϵ-greedy policy:
where , if a=b; , otherwise. denotes the action space. dictates the degree to which selection favors random exploration over the highest-value action. During the early training stages, a larger ϵ encourages agents to explore the unknown environment more extensively. As the model converges, ϵ should decrease to facilitate agent focus on high-value states and actions. Under the DQN framework, the training process is demonstrated in Fig. 11.
4.1 Results of road risk assessment
In this study, five distinct wind fields, each characterized by a minimum central pressure of 910, 920, 930, 940, and 950 hPa were constructed using Jelesnianski model. These wind fields were subsequently integrated into the coupled ADCIRC-SWAN model to simulate the extent and depth of storm surge inundation within the study area. Considering the maximum inundation extent to conduct exposure assessment, and according to the Table 2, the storm surge hazard assessment across the five wind scenarios is graphically represented in Fig. 12. The results indicate that the intensification of typhoons correlates with more extensive and severe inundation, elevating the associated hazard levels. For instance, Fig. 12a illustrates a scenario where, at a central pressure of 910 hPa, nearly half of the study area is submerged, with a significant portion experiencing high-hazard conditions. Figure 12c delineates a pivotal moment; at 930 hPa, the typhoon's central pressure marks a significant decrease in both the inundation's extent and severity. In the last scenario, as depicted in Fig. 12e, the inundation is confined to the peripheral parts of the study area, exhibiting limited capacity to affect the inland road network. Consequently, the last scenario was excluded from consideration in the subsequent road risk assessment and evacuation route planning processes.
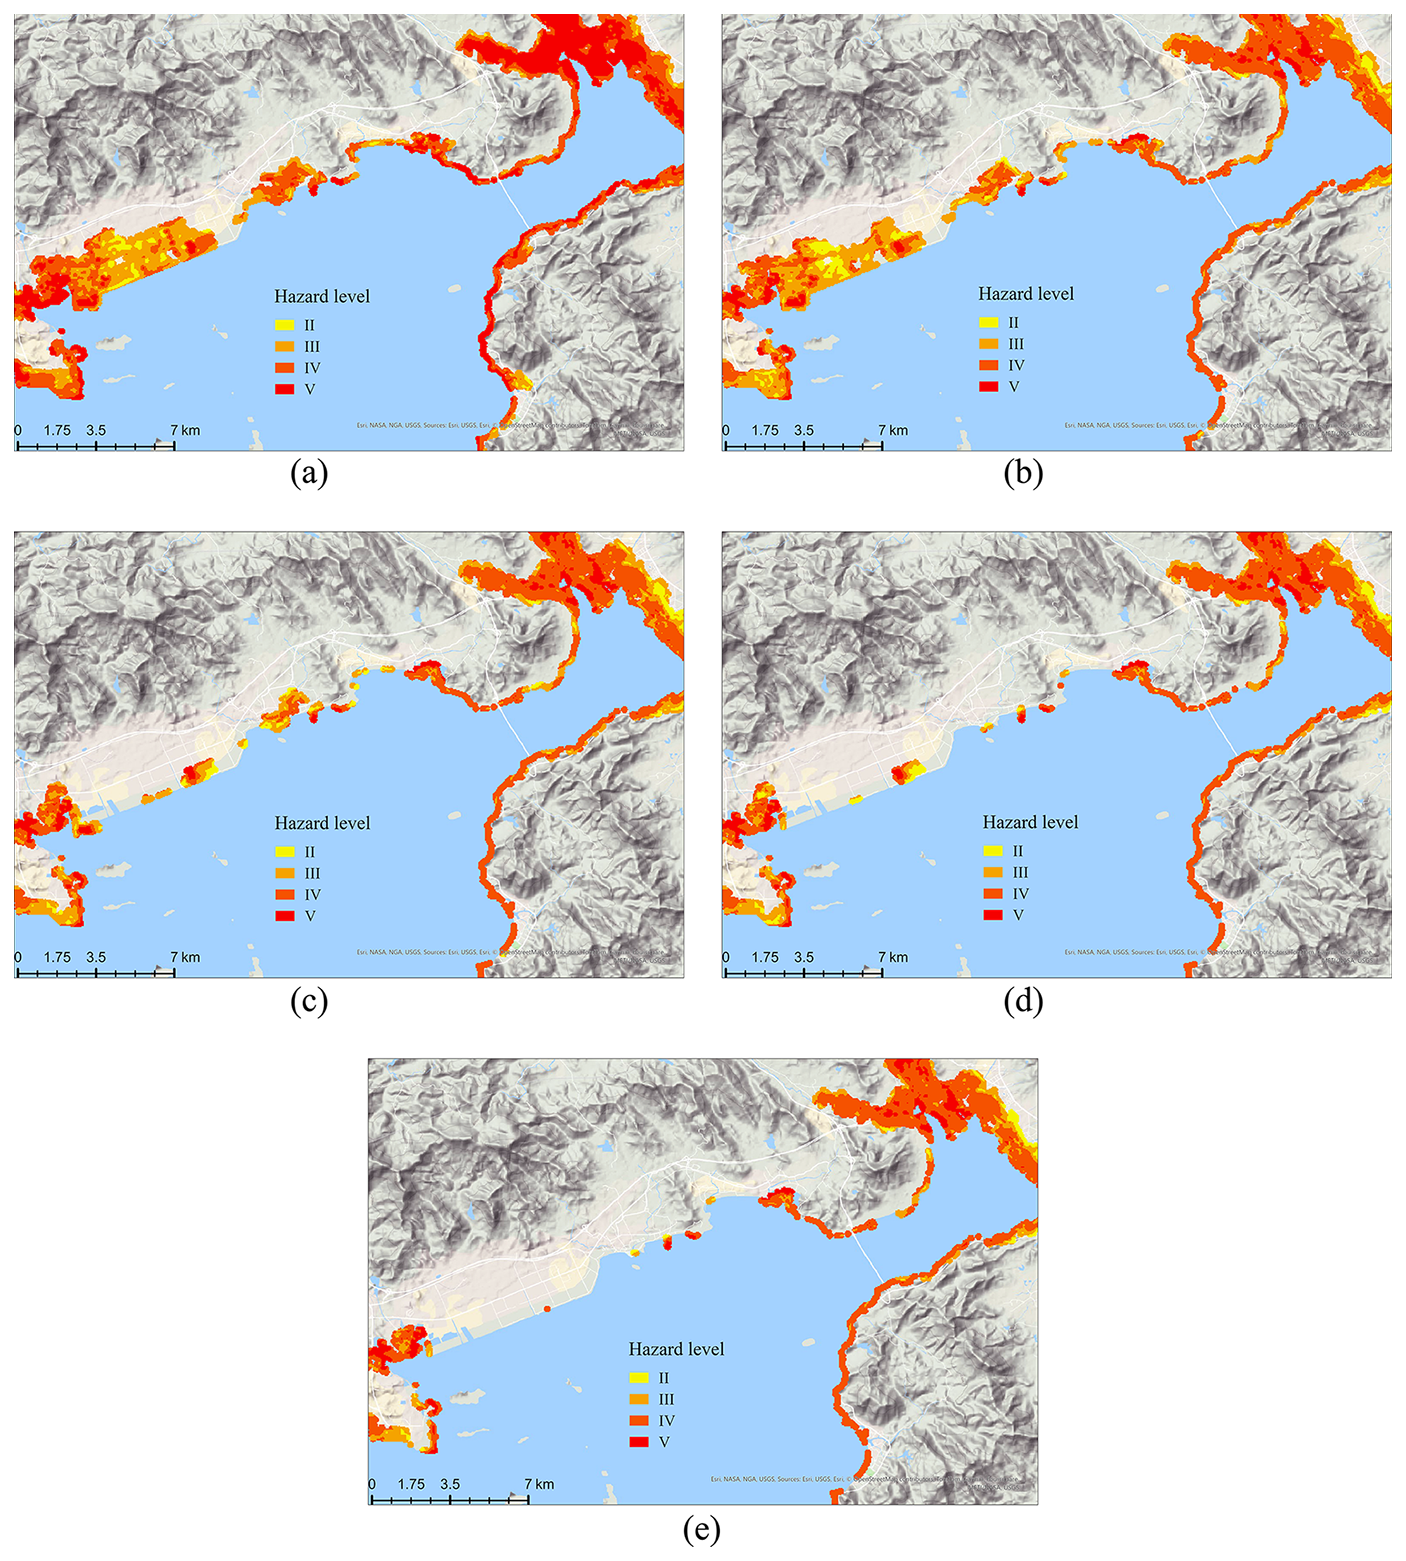
Figure 12The hazard assessment for five typhoon scenarios. (a) Scenario 1. (b) Scenario 2. (c) Scenario 3. (d) Scenario 4. (e) Scenario 5. Noted that, this study omitted factors such as surface drainage and ground infiltration. Consequently, the actual inundation depths are expected to be lower than those simulated. Given this discrepancy, the risk level of 1 for inundation depths ranging from 0 to 15 cm can be classified as negligible.
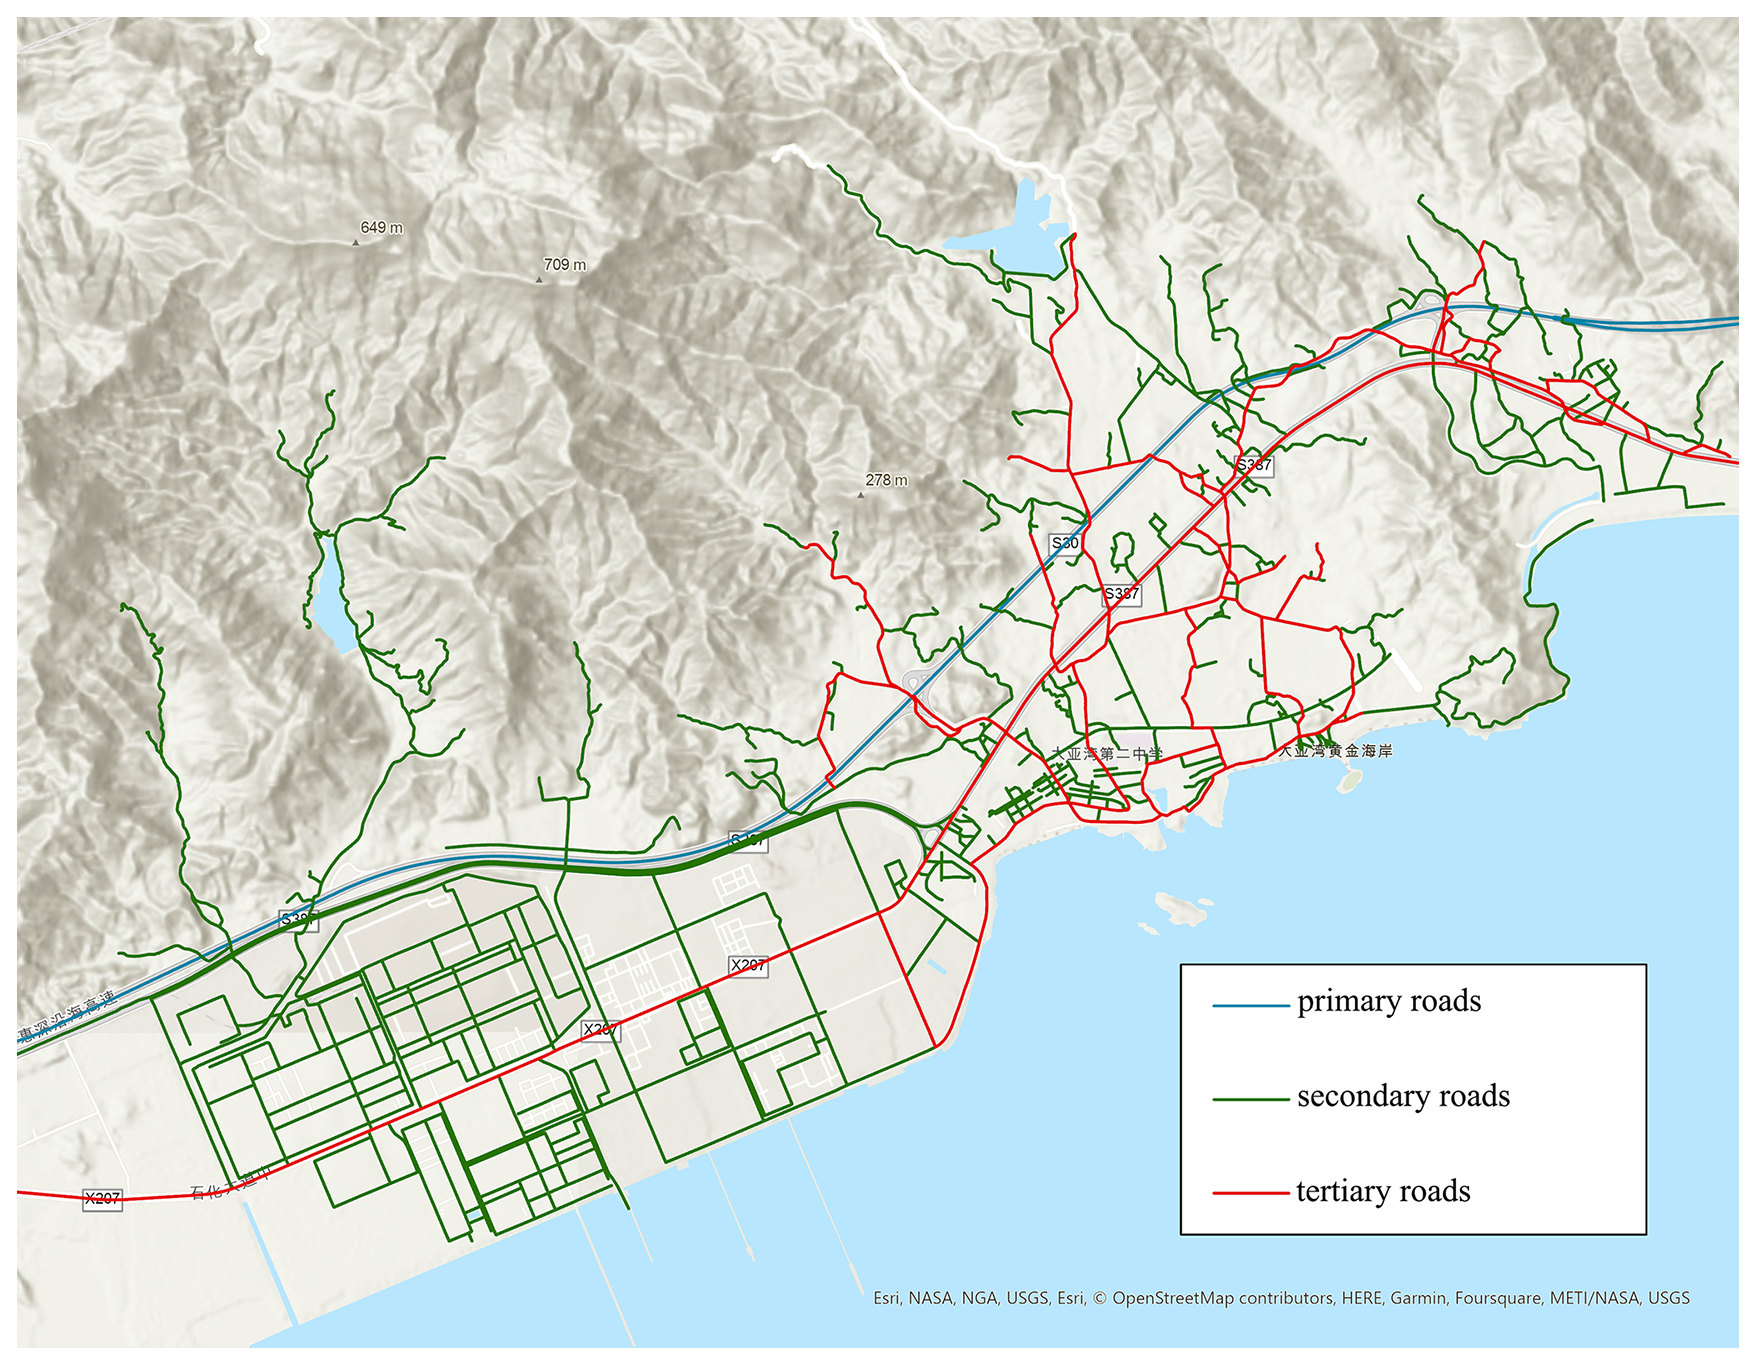
Figure 13The road network and road categories in the study area.
This study focuses on the road risk assessment of storm surge in the study area, which is located in a coastal suburb characterized by winding and discontinuous roads. To enhance the road network within the study area, additional road data was collected using geographic information system (GIS) technology, including minor and unnamed roads that often represent fine branches and extensions of existing roads and highways, which became an important basis for classifying roads and evaluating their vulnerability. The road network and road categories in the study area is shown in Fig. 13.
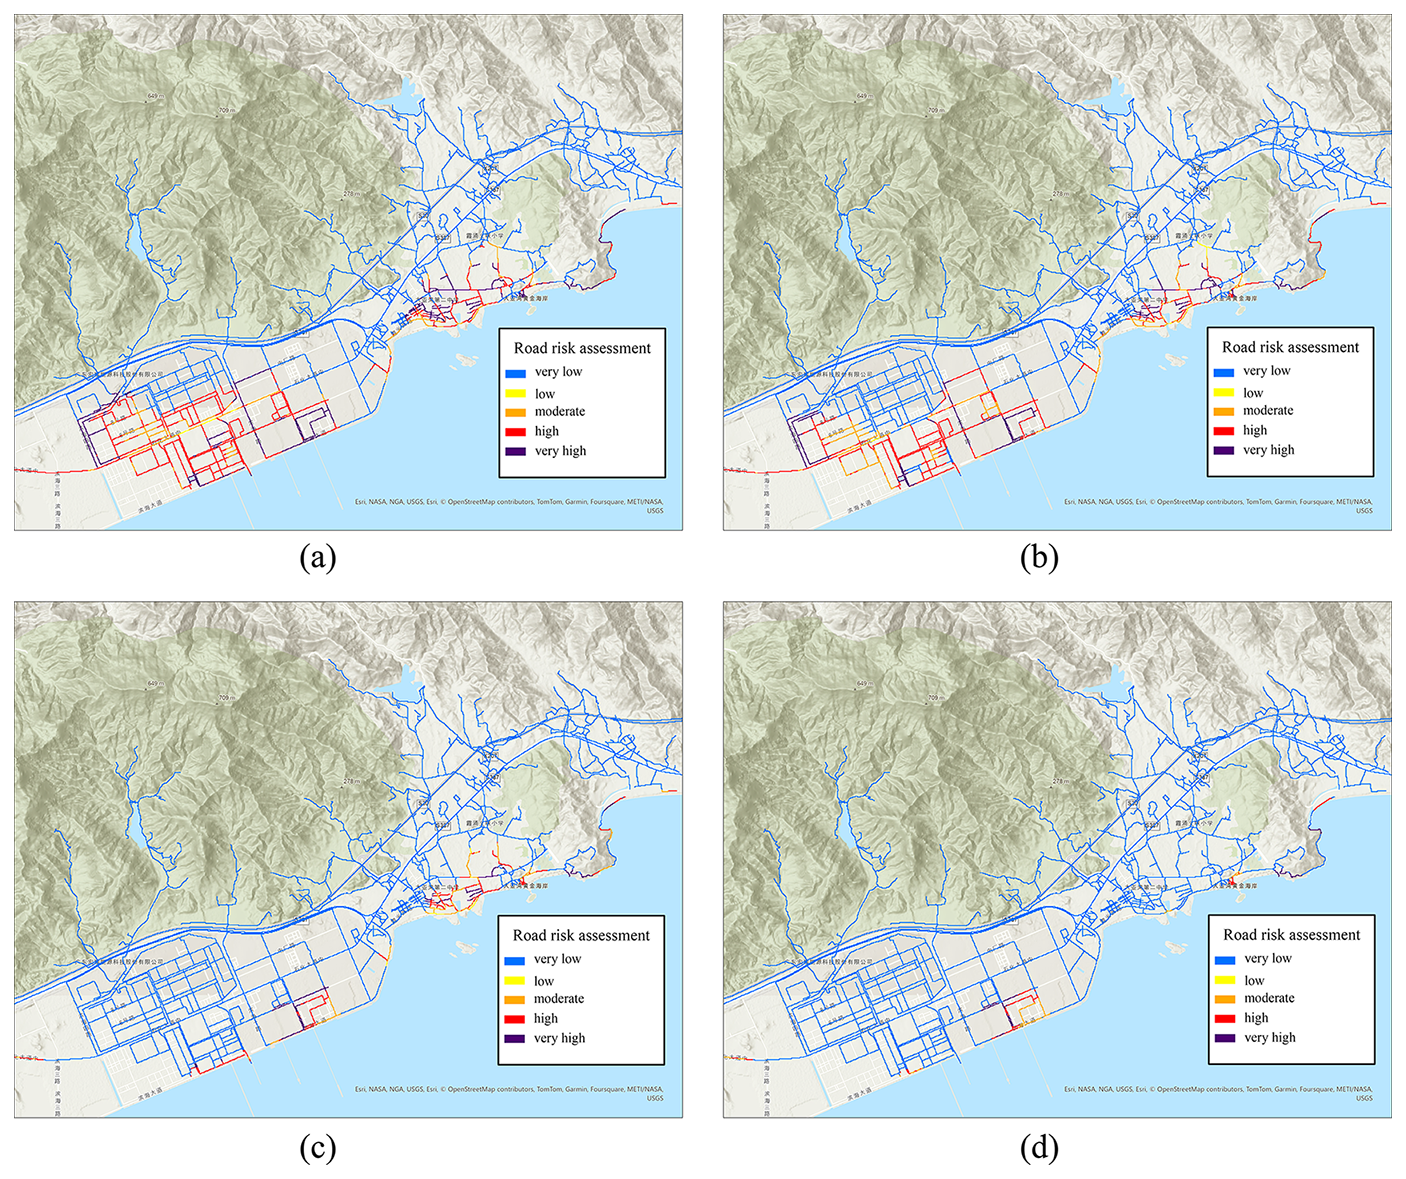
Figure 14The road risk assessment. (a) Scenario 1. (b) Scenario 2. (c) Scenario 3. (d) Scenario 4.
As presented the Table 3, the road risk assessment for the study area under the four scenarios is shown in Fig. 14, where storm surge mainly threatened the secondary and tertiary roads in the coastal road network, mainly concentrated in the southern part of the Daya Bay petrochemical industrial zone and the Daya Bay Golden Coast vicinity. In the scenarios depicted in Fig. 14a and b, a storm surge causes widespread flooding in the petrochemical industrial zone, rendering most roads at high risk and impassable. In such situations, evacuation routes should guide individuals north into primary roads and then eastward to shelters. Similarly, the area surrounding the Daya Bay Golden Coast faces a critical situation, necessitating swift evacuation along secondary and tertiary roads to the northwest or northeast towards shelters. Figure 14c presents a pivotal scenario, demonstrating a significant reduction in the storm surge's impact on the roads of petrochemical industrial zone. However, the Golden Coast vicinity remains significantly affected, primarily due to the prevalence of vulnerable tertiary roads. As depicted in Fig. 14d, when the typhoon's central pressure drops to 940 hPa, the storm surge's impact on the Golden Coast's roads diminishes substantially. Consequently, the typhoon's minimum central pressure at 930 and 940 hPa are critical thresholds for the storm surge's impact. Below 940 hPa, the roads in the Daya Bay Golden Coast area are at high risk, and when the pressure is below 930 hPa, the Daya Bay Petrochemical Industrial Zone's roads experience severe disruption.
4.2 Performance of DQN model for evacuation route planning
The goal of this work is to enable real-time route planning to the shelter from any given start based on the surrounding environment. The experiment utilized three simulated scenarios (Scenario 2, 3, and 4) designated for training DQN model, while Scenario 1 served as the test case. 1000 starting cells were randomly selected in Scenario 1 to conduct route planning and the enumeration method is used to find the true optimal routes. In Scenario 1, the generated routes covered about 71 % of the road network, with an average length of 4776 m. Refer to Appendix B for exemplifications of the route planning.
To evaluate the overall model performance, five metrics were introduced, including: (1) proportion of optimal routes, (2) Dynamic time warping (DTW, Müller, 2007) distance, (3) Hausdorff distance (Huttenlocher et al., 1993), (4) overlap rate, and (5) destination distance. The proportion of optimal routes measures the degree of correspondence between the generated routes and the optimal routes by calculating the percentage of generated routes that completely coincide with the optimal routes. The DTW evaluates the similarity between two time series, and the DTW distance is used to measure the average deviated distance of the generated route from the optimal route. Given a optimal route popt of length lopt and a generated path pgen of length lgen, the DTW can be discribed as a dynamic programming (DP):
where and d(p,q) is the Chebyshev distance between the cell p∈popt and cell q∈pgen. and w(i,j) is the binary DP variable . The DTW distance is defined as:
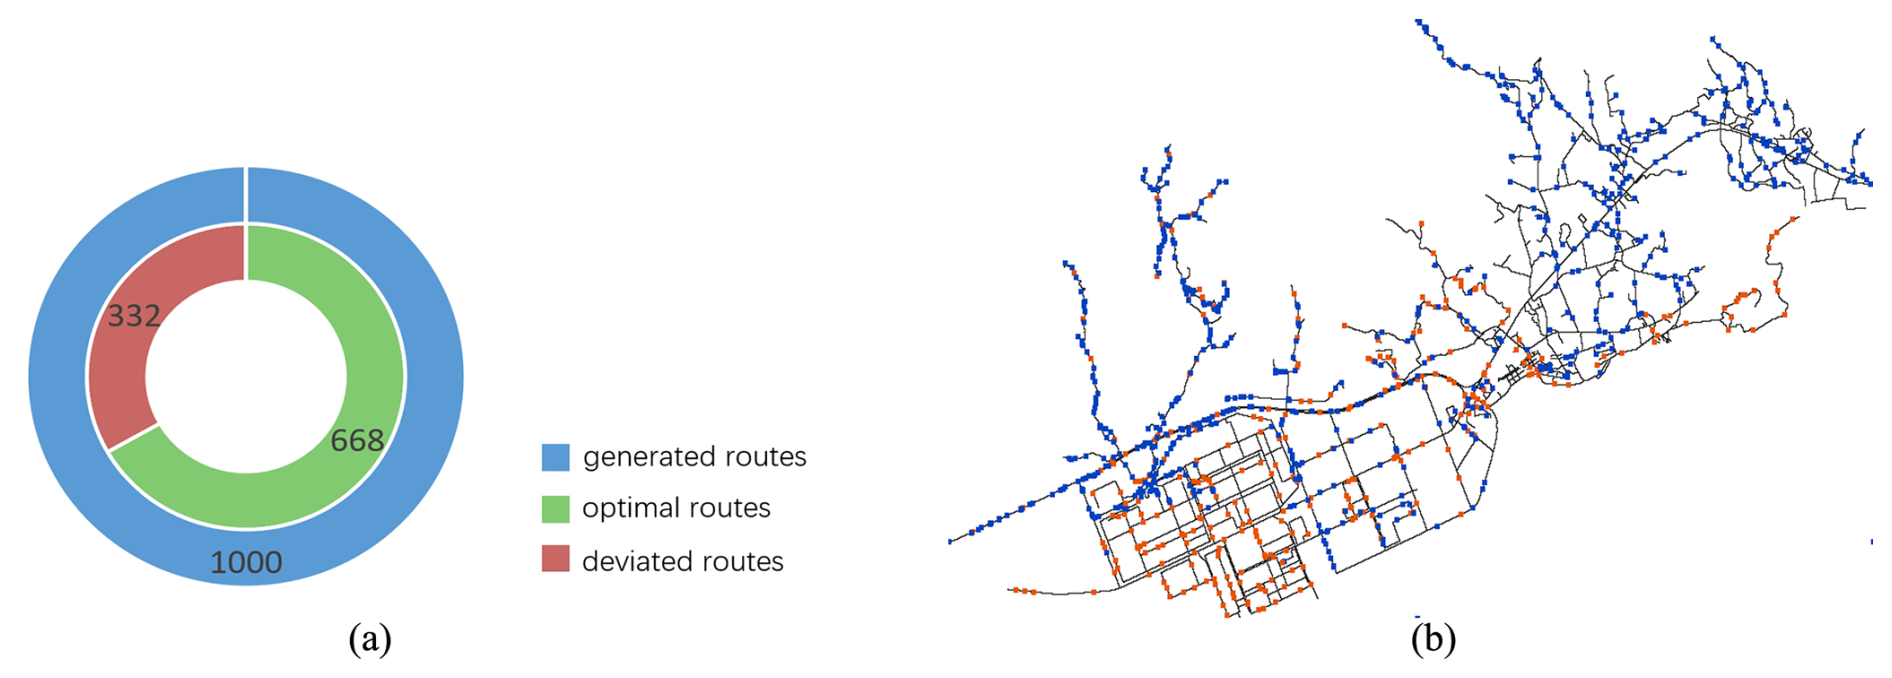
Figure 15The optimal and deviated routes. (a) The proportion of optimal and deviated routes. (b) the distribution of 1000 starting points.
Consider a route as a set of locations, and utilize the Hausdorff distance dHaus(popt,pgen) to measure the distance between two sets, which can be calculated by:
where sup is the supremum and inf is the infimum. The Hausdorff distance measures the maximum deviated distance of the generated route. Let lov denote the length of the longest common sub-route between the generated and optimal routes, the overlap rate is defined as the ratio . The destination distance is a metric for assessing the efficacy of evacuation route planning, reflecting the distance between the endpoint of the generated route and the designated shelter.
Among generated routes, a route that deviates from the optimal route is termed a deviated route. Figure 15 depicts the proportion of optimal and deviated routes, as well as the distribution of their starting points, where blue and orange markers represent the optimal and deviated routes, respectively.
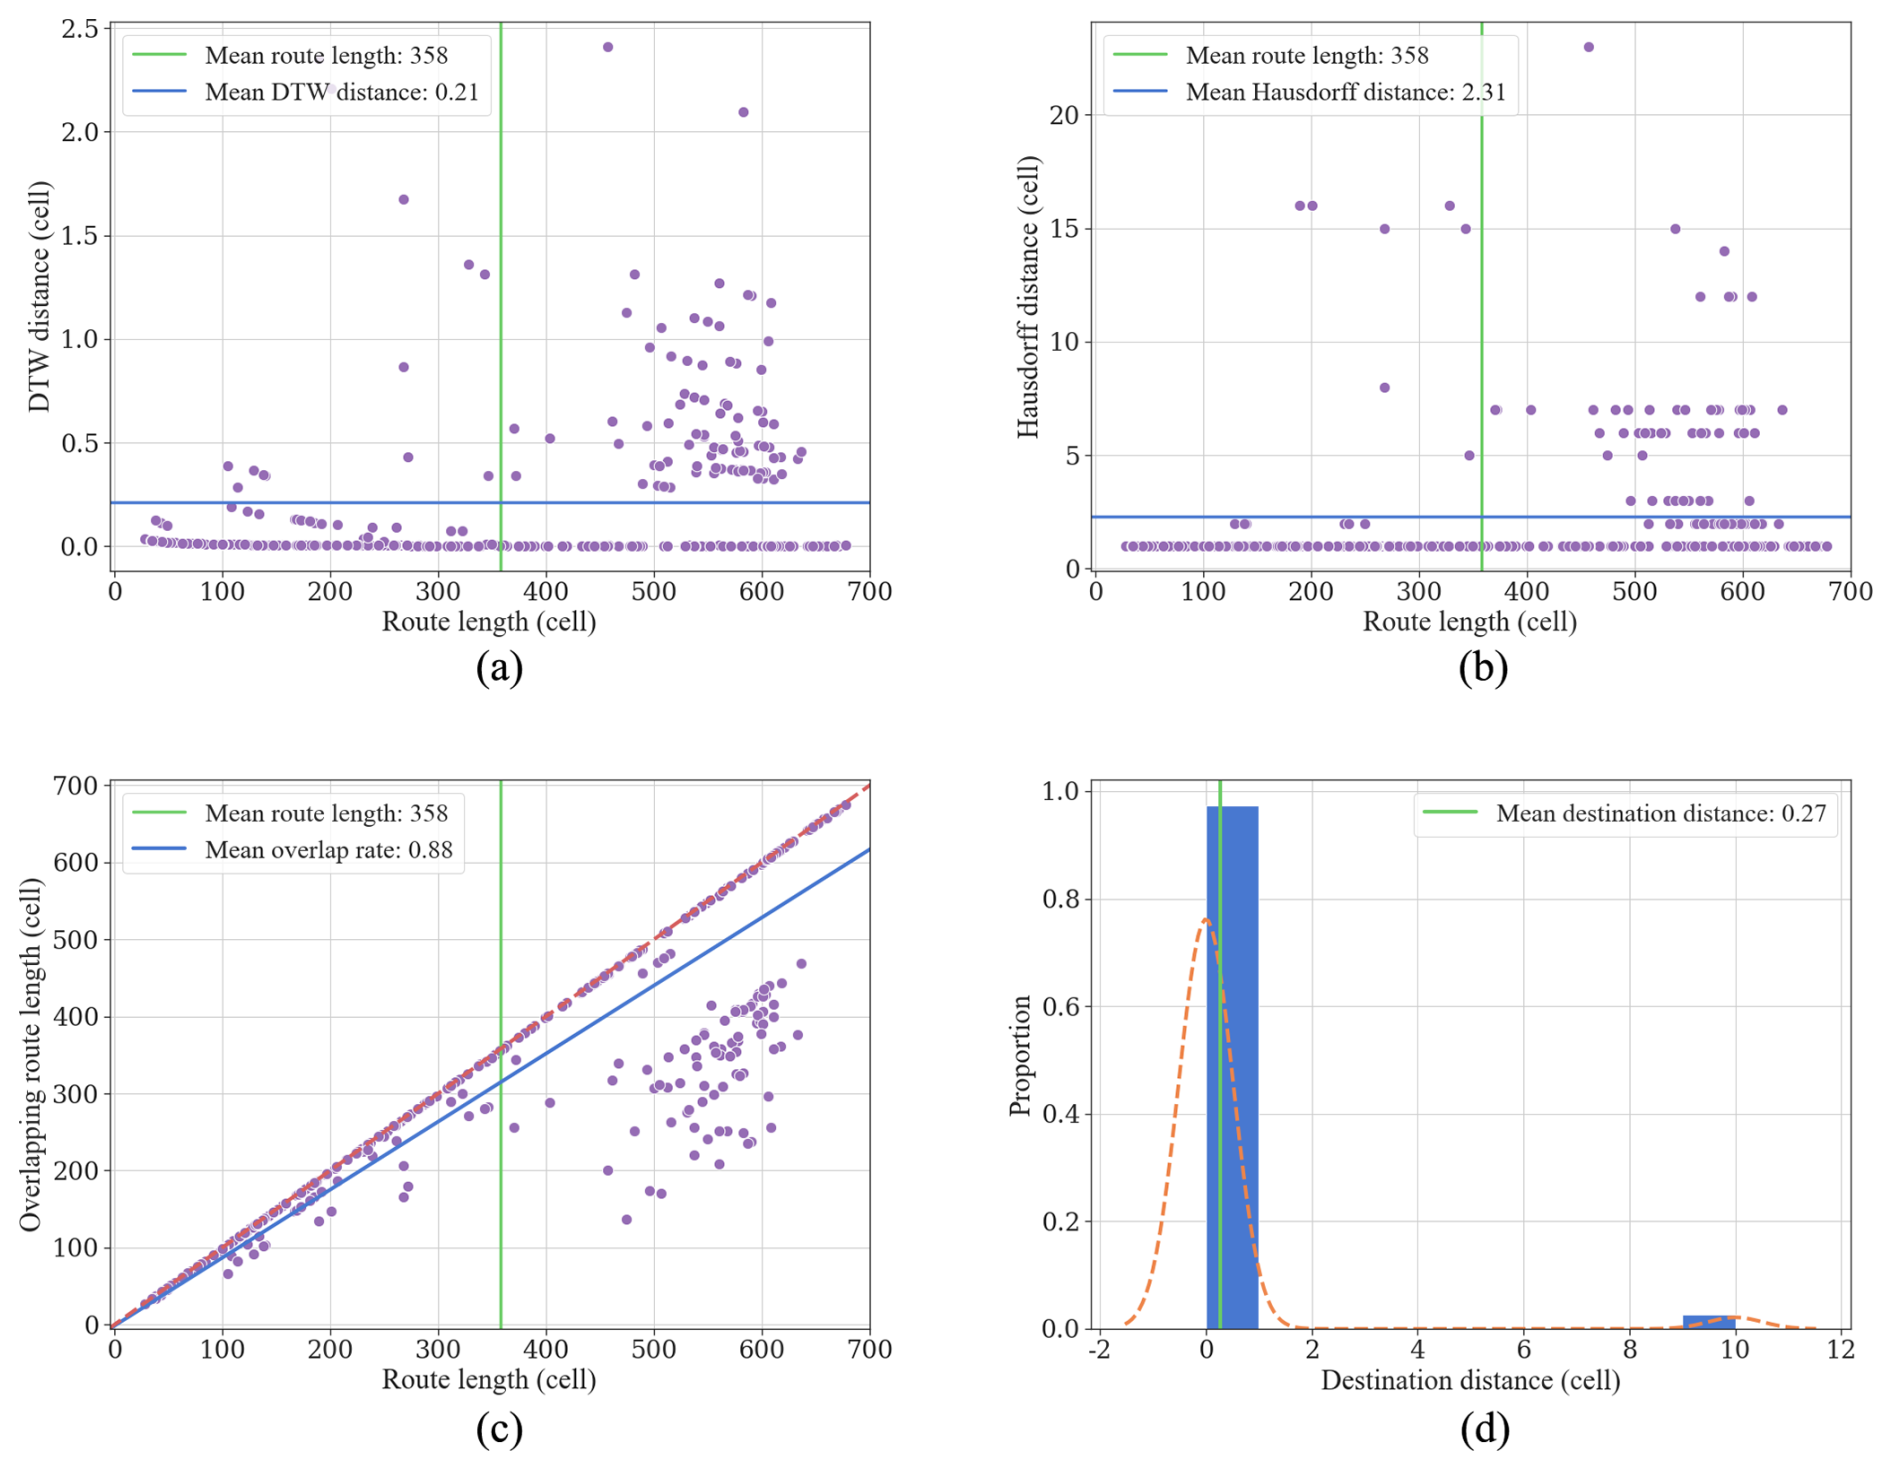
Figure 16Model evaluation metrics for (a) DTW distance, (b) Hausdorff distance, (c) destination distance and (d) overlap rate with one cell representing 16 m.
The 1000 test cases evaluated the model's performance amidst severe storm surges and complex inundation environments. Among the 1000 generated routes, 668 routes are optimal with 332 routes deviated. Focusing on the deviated routes, the DTW distance, the Hausdorff distance, the overlap rate, and the destination distance are illustrated as Fig. 16. The mean length of 332 deviated routes is 5728 m, indicating that longer routes tend to exhibit greater deviations. In Fig. 16a, the average DTW distance for deviated routes is a mere 3.36 m, and the majority of these routes exhibit DTW distances below this average, although a minority exceed 16 m. The average Hausdorff distance is 36.96 m. An analysis combining Fig. 16a and b indicates that the routes exhibit minor deviations from the optimal routes in the majority of cases, with significant deviations occurring infrequently. In Fig. 16c, the average overlap rate is 0.88, with most cases approaching a perfect overlap of 1, demonstrating that the deviated routes mostly remain consistent with the optimal routes. Finally, in Fig. 16d, the destination distances were calculated with an average value of 4.32 m. The majority of destination distances fall within the 0–16 m range, although a few outlier routes exceed 144 m, suggesting that deviated paths, despite process discrepancies from the optimal routes, can still reach the optimal shelter with high accuracy. The experimental results demonstrate that the proposed method exhibits strong performance in generality, providing emergency evacuation route planning for the entire study area.
This study presents a comprehensive approach to conduct the storm risk assessment and evacuation route planning in the Daya Bay Petrochemical Industrial Zone. It facilitates a thorough understanding for local government regarding the spatial distribution of road risks and aids residents in swiftly devising optimal evacuation routes to shelters, contingent upon their immediate surroundings. This approach significantly bolsters efforts in storm surge disaster prevention, mitigation, and contributes to the sustainable development of the region.
This study utilized the ADCIRC+SWAN model to simulate five storm surge scenarios, identifying maximum inundation levels within the study area. Integrating inundation data with road network information facilitated a fine-grained risk assessment, revealing high vulnerability in the petrochemical industrial zone and Golden Coast region's road networks to storm surges. The minimum central pressure of typhoons, with key thresholds at 930 and 940 hPa, serves as a critical factor in determining the impact severity: roads in the Golden Coast are at risk when the central pressure is below 940 hPa, while central pressure below 930 hPa significantly disrupt the petrochemical zone's roads. Focusing on evacuation route planning, the study developed a high-resolution raster environmental model to explore deep reinforcement learning methods for large-scale raster environments. To address DQN model's convergence challenges, a compressed search space and a navigational reward mechanism were introduced, enhancing the DQN model's capacity in route planning. In Scenario 1, 1000 starting points were randomly sampled to generate evacuation routes, with nearly 70 % proving optimal and the rest showing minimal deviation, averaging a DTW distance of 3.36 m and an overlap rate of approximately 0.9.
This study demonstrates the efficacy of the proposed method in assessing road risks and enhancing emergency evacuation plans. It underscores the worth of leveraging advanced modeling techniques to improve emergency response and preparedness in vulnerable areas. Yet, there are opportunities for refinement. Current road risk assessments consider flooding and road types but could be improved to include road width, population density and other factors to enhance the effectiveness of road risk assessment. Looking ahead, transitioning from raster to topological environments, potentially through graph neural networks, presents a promising path to overcome the limitations in training speed and large data handling. Additionally, the current model's exclusion of infiltration and drainage dynamics may affect inundation depth accuracy. Future research should integrate these factors for more precise storm surge simulations. In summary, this study represents a pivotal step in developing storm surge risk assessment and real-time evacuation planning. The scope for advancement is considerable, inviting ongoing research and innovation in this critical domain.
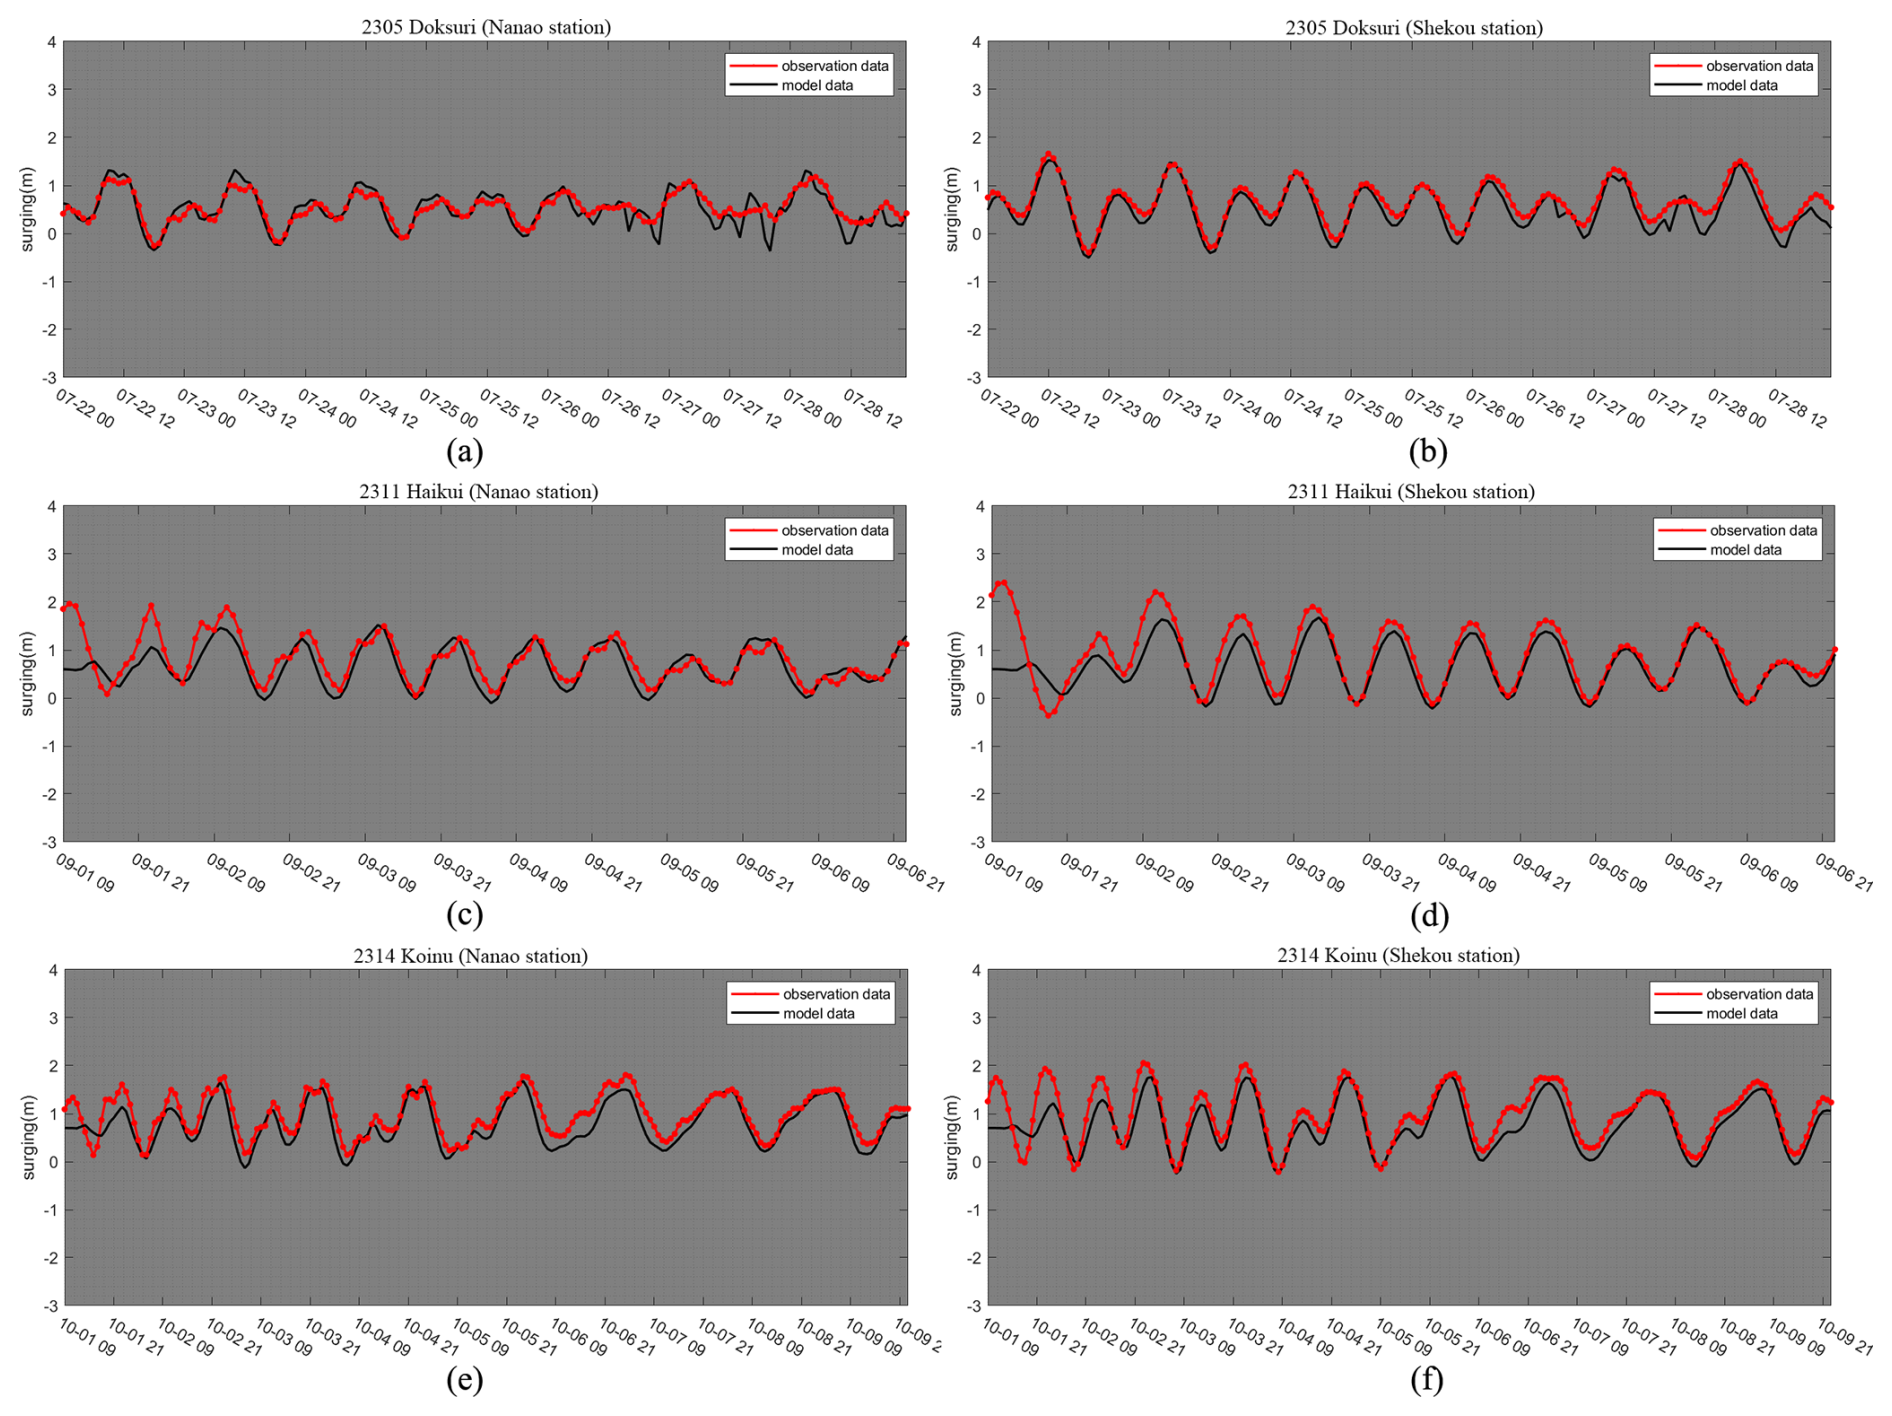
Figure A1The validation of ADCIRC+SWAN model. The real historical typhoon events (2305, 2311, 2314) were used to validate water levels. The black line represents the simulated water levels and the redline represents the observed water levels record by Nanao station and Shekou station. (a) 2305 Doksuri (Nanao station). (b) 2305 Doksuri (Shekou station). (c) 2311 Haikui (Nanao station). (d) 2311 Haikui (Shekou station). (e) 2314 Koinu (Nanao station). (f) 2314 Koinu (Shekou station).
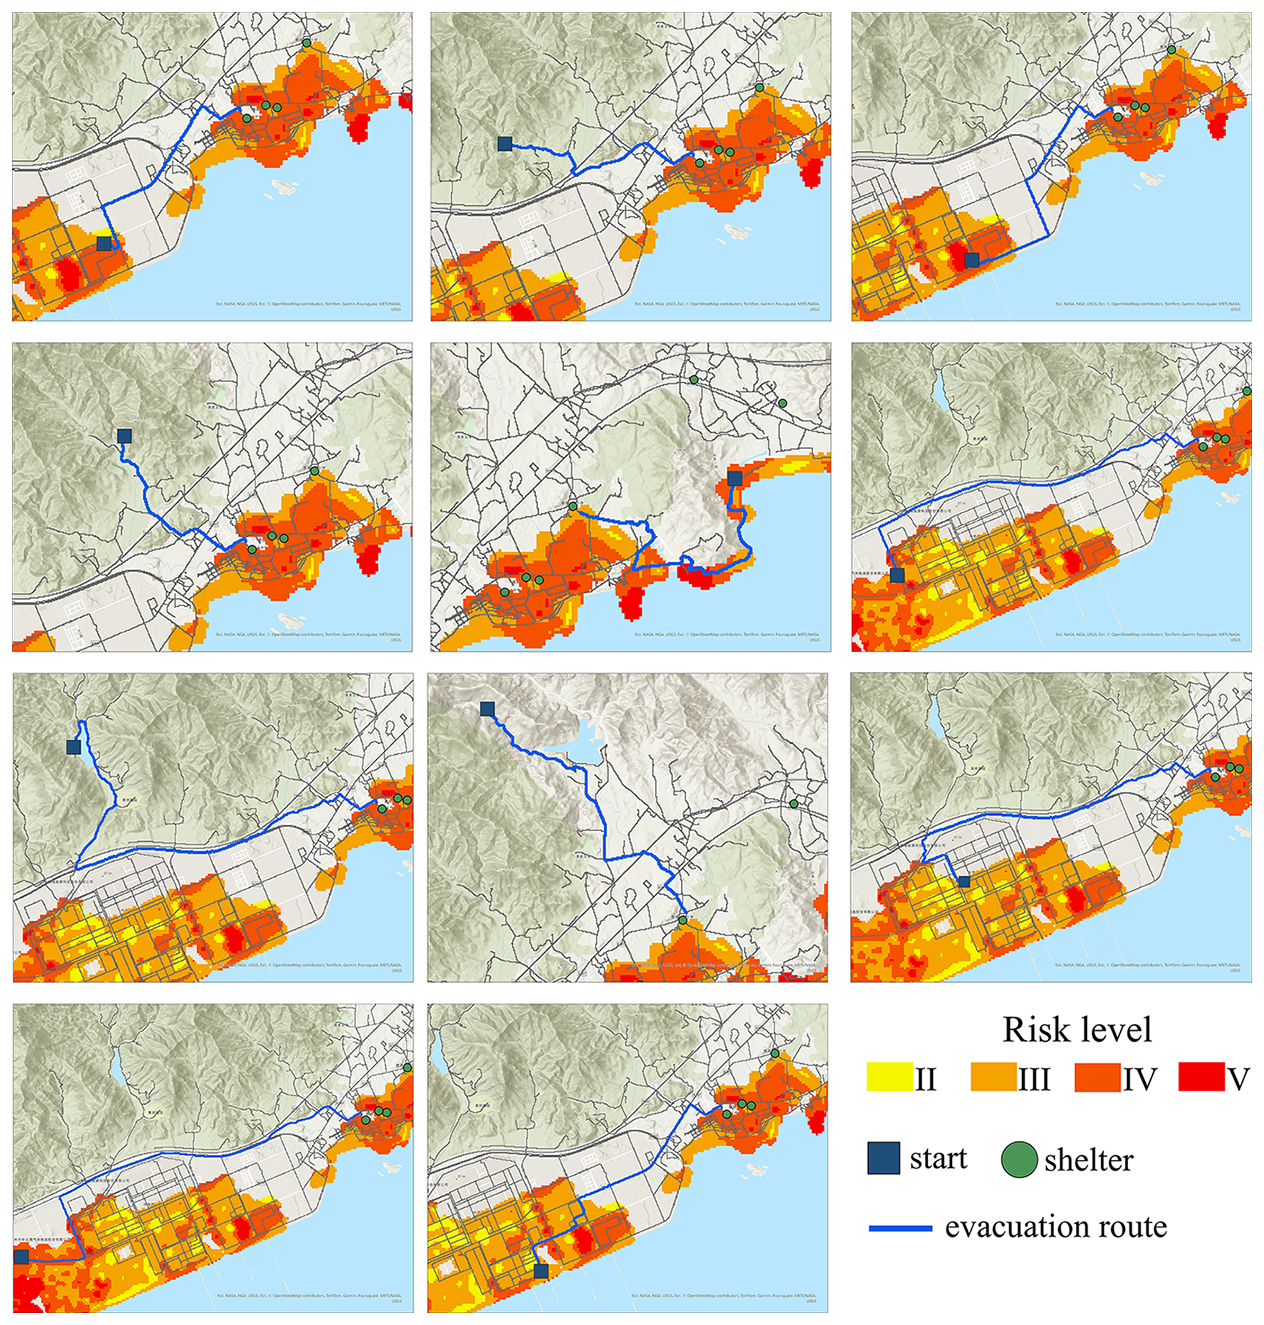
Figure B1Examples of evacuation route planning. In this study, the goal of evacuation route planning is to find the optimal route from arbitrary starting points to designated shelters. While the inclusion of planning routes from non-flooded areas to shelters may be not reasonable in real-world applications, this approach effectively evaluate the model's route planning capabilities.
The numerical models used in this study include the Advanced Circulation (ADCIRC, Luettich et al., 1992) model and the Simulating Waves Nearshore (SWAN, Booij et al., 1999) model. Both models are open-source. The ADCIRC model (version V55) source code and documentation are available at its official website: https://adcirc.org/ (last access: 16 November 2025). The SWAN model (version 41.1) source code and documentation are available from the Delft University of Technology at: https://swanmodel.sourceforge.io/ (last access: 16 November 2025). The deep reinforcement learning (DQN, Mnih et al., 2013) based evacuation model code was developed by the authors specifically for this case study. This code is not publicly available because it is highly integrated with the study area's specific environmental data and involves sensitive regional information related to the Daya Bay Petrochemical Industrial Zone. The code may be made available from the corresponding author upon reasonable request for academic and non-commercial purposes.
The best-track data for Typhoon Mangkhut used in this study are publicly available from the China Meteorological Administration (CMA, Ying et al., 2014; Lu et al., 2021) Tropical Cyclone Data Center (available at: http://tcdata.typhoon.org.cn/, last access: 16 November 2025). The water level verification data were obtained from the National Tidal Gauge Station of China. The Digital Elevation Model (DEM) data and the road network data were provided by the Huizhou Land and Resources Bureau. These datasets (water level, DEM, and road network) are not publicly available due to national and regional security regulations concerning hydrological and geospatial information. Further details may be discussed with the corresponding author upon reasonable request, subject to data usage agreements.
YL and HQ designed the research and optimized the overall structure of this paper. CL and SW completed most of the main work, including the programming, debugging of parameters, and final drafting of the article. LM and DL contributed some important algorithm ideas and completed the work of the comparison part. WL and KZ provided the original algorithm ideas and framework for this study and provides valuable suggestions for program optimization and parameter adjustment.
The contact author has declared that none of the authors has any competing interests.
Publisher's note: Copernicus Publications remains neutral with regard to jurisdictional claims made in the text, published maps, institutional affiliations, or any other geographical representation in this paper. While Copernicus Publications makes every effort to include appropriate place names, the final responsibility lies with the authors. Views expressed in the text are those of the authors and do not necessarily reflect the views of the publisher.
This article is part of the special issue “Reducing the impacts of natural hazards through forecast-based action: from early warning to early action”. It is not associated with a conference.
This work was supported by Shenzhen Science and Technology Program (grant no. KCXFZ20240903093100001), National Key R&D Program of China (grant no. 2021YFC3101800), National Natural Science Foundation of China (grant no. 52471303) and Research Team Cultivation Program (grant no. 2023JCT002).
This paper was edited by Liz Stephens and reviewed by three anonymous referees.
Alsnih, R. and Stopher, P. R.: Review of procedures associated with devising emergency evacuation plans, Transportation Research Record, 1865, 89–97, 2004. a
Astri, R.: Implementation of A-Star Algorithm for Searching Routes Near the Tsunami Evacuation Shelter Point, Jurnal RESTI (Rekayasa Sistem Dan Teknologi Informasi), 4, 254–259, 2020. a
Atkinson, G. D. and Holliday, C. R.: Tropical cyclone minimum sea level pressure/maximum sustained wind relationship for the western North Pacific, Monthly Weather Review, 105, 421–427, 1977. a
Bellman, R.: A Markovian decision process, Journal of Mathematics and Mechanics, 679–684, https://www.jstor.org/stable/24900506 (last access: 16 November 2025), 1957. a
Benavente, J., Del Río, L., Gracia, F. J., and Martínez-del Pozo, J. A.: Coastal flooding hazard related to storms and coastal evolution in Valdelagrana spit (Cadiz Bay Natural Park, SW Spain), Continental Shelf Research, 26, 1061–1076, 2006. a
Bertsekas, D.: Dynamic programming and optimal control: Volume I, Athena scientific, ISBN 978-1-886529-43-4, 2012. a
Booij, N., Ris, R. C., and Holthuijsen, L. H.: A third-generation wave model for coastal regions: 1. Model description and validation, Journal of Geophysical Research: Oceans, 104, 7649–7666, 1999. a, b
Cheung, K. F., Tang, L., Donnelly, J. P., Scileppi, E. M., Liu, K.-B., Mao, X.-Z., Houston, S. H., and Murnane, R. J.: Numerical modeling and field evidence of coastal overwash in southern New England from Hurricane Bob and implications for paleotempestology, Journal of Geophysical Research: Earth Surface, 112, https://doi.org/10.1029/2006JF000612, 2007. a
Ministry of Natural Resources of the People's Republic of China: 2021 Bulletin of China Marine Disaster, Beijing, https://commons.wikimedia.org/wiki/File:2021_Bulletin_of_China_Marine_Disaster.pdf (last access: 18 November 2025), 2022 a
Dietrich, J., Zijlema, M., Westerink, J., Holthuijsen, L., Dawson, C., Luettich Jr, R., Jensen, R., Smith, J., Stelling, G., and Stone, G.: Modeling hurricane waves and storm surge using integrally-coupled, scalable computations, Coastal Engineering, 58, 45–65, 2011. a
Centre for Research on the Epidemiology of Disasters (CRED): The Human Cost of Natural Disasters: A Global Perspective, Centre for Research on the Epidemiology of Disasters, https://www.cred.be/sites/default/files/The_Human_Cost_of_Natural_Disasters_CRED.pdf (last access: 16 November 2025), 2015 a
Forcael, E., González, V., Orozco, F., Vargas, S., Pantoja, A., and Moscoso, P.: Ant colony optimization model for tsunamis evacuation routes, Computer-Aided Civil and Infrastructure Engineering, 29, 723–737, 2014. a
Goerigk, M., Deghdak, K., and Heßler, P.: A comprehensive evacuation planning model and genetic solution algorithm, Transportation Research Part E: Logistics and Transportation Review, 71, 82–97, 2014. a
Granger, K.: Quantifying storm tide risk in Cairns, Natural Hazards, 30, 165–185, 2003. a
Huizinga, J., De Moel, H., and Szewczyk, W.: Global flood depth-damage functions: Methodology and the database with guidelines, Tech. rep., Joint Research Centre, ISBN 978-92-79-67781-6, 2017. a, b
Huttenlocher, D. P., Klanderman, G. A., and Rucklidge, W. J.: Comparing images using the Hausdorff distance, IEEE Transactions on Pattern Analysis and Machine Intelligence, 15, 850–863, 1993. a
Ibrahim, S., Mostafa, M., Jnadi, A., Salloum, H., and Osinenko, P.: Comprehensive overview of reward engineering and shaping in advancing reinforcement learning applications, IEEE Access, https://doi.org/10.1109/ACCESS.2024.3504735, 2024. a
Jelesnianski, C. P.: A numerical calculation of storm tides induced by a tropical storm impinging on a continental shelf, Monthly Weather Review, 93, 343–358, 1965. a, b, c
Knabb, R. D., Rhome, J. R., and Brown, D. P.: Tropical Cyclone Report: Hurricane Katrina 23-30 August 2005, National Hurricane Center, https://www.nhc.noaa.gov/data/tcr/AL122005_Katrina.pdf, 2006. a
Koks, E. E., Jongman, B., Husby, T. G., and Botzen, W. J.: Combining hazard, exposure and social vulnerability to provide lessons for flood risk management, Environmental Science & Policy, 47, 42–52, 2015. a
Kron, W.: Flood risk = hazard• values• vulnerability, Water international, 30, 58–68, 2005. a
Lavell, A., Oppenheimer, M., Diop, C., Hess, J., Lempert, R., Li, J., Muir-Wood, R., Myeong, S., Moser, S., Takeuchi, K., Cardona, O.-D., Hallegatte, S., Lemos, M., Little, C., Lotsch, A., and Weber, E.: Climate change: new dimensions in disaster risk, exposure, vulnerability, and resilience, in: Managing the risks of extreme events and disasters to advance climate change adaptation: Special report of the intergovernmental panel on climate change, Cambridge University Press, 25–64, https://doi.org/10.1017/CBO9781139177245.004, 2012. a
Li, C., Bi, C., and Li, Z.: Crowd evacuation model based on improved PSO algorithm, Journal of System Simulation, 32, 1000, https://doi.org/10.16182/j.issn1004731x.joss.18-0782, 2020. a
Lillicrap, T. P., Hunt, J. J., Pritzel, A., Heess, N., Erez, T., Tassa, Y., Silver, D., and Wierstra, D.: Continuous control with deep reinforcement learning, arXiv [preprint], https://doi.org/10.48550/arXiv.1509.02971, 9 September 2015. a
Lin, N., Emanuel, K. A., Smith, J. A., and Vanmarcke, E.: Risk assessment of hurricane storm surge for New York City, Journal of Geophysical Research: Atmospheres, 115, https://doi.org/10.1029/2009JD013630, 2010. a
Lu, X., Yu, H., Ying, M., Zhao, B., Zhang, S., Lin, L., Bai, L., and Wan, R.: Western North Pacific tropical cyclone database created by the China Meteorological Administration, Advances in Atmospheric Sciences, 38, 690–699, 2021. a, b
Luettich Jr., R. A., Westerink, J. J., and Scheffner, N. W.: ADCIRC: an advanced three-dimensional circulation model for shelves, coasts, and estuaries. Report 1, Theory and methodology of ADCIRC-2DD1 and ADCIRC-3DL, https://hdl.handle.net/11681/4618 (last access: 16 November 2025), 1992. a, b
Mas, E., Bricker, J., Kure, S., Adriano, B., Yi, C., Suppasri, A., and Koshimura, S.: Field survey report and satellite image interpretation of the 2013 Super Typhoon Haiyan in the Philippines, Nat. Hazards Earth Syst. Sci., 15, 805–816, https://doi.org/10.5194/nhess-15-805-2015, 2015. a
Merkens, J.-L., Reimann, L., Hinkel, J., and Vafeidis, A. T.: Gridded population projections for the coastal zone under the Shared Socioeconomic Pathways, Global and Planetary Change, 145, 57–66, 2016. a
Mnih, V., Kavukcuoglu, K., Silver, D., Graves, A., Antonoglou, I., Wierstra, D., and Riedmiller, M.: Playing atari with deep reinforcement learning, arXiv [preprint], https://doi.org/10.48550/arXiv.1312.5602, 19 December 2013. a, b
Mnih, V., Kavukcuoglu, K., Silver, D., Rusu, A. A., Veness, J., Bellemare, M. G., Graves, A., Riedmiller, M., Fidjeland, A. K., Ostrovski, G., Petersen, S., Beattie, C., Sadik, A., Antonoglou, I., King, H., Kumaran, D., Wierstra, D., Legg, S., and Hassabis, D.: Human-level control through deep reinforcement learning, Nature, 518, 529–533, 2015. a, b
Mnih, V., Badia, A. P., Mirza, M., Graves, A., Lillicrap, T., Harley, T., Silver, D., and Kavukcuoglu, K.: Asynchronous methods for deep reinforcement learning, in: International conference on machine learning, arXiv [preprint], https://doi.org/10.48550/arXiv.1602.01783, 2016. a
Müller, M.: Dynamic time warping, Information retrieval for music and motion, 69–84, https://doi.org/10.1007/978-3-540-74048-3_4, 2007. a
Ng, A. Y., Harada, D., and Russell, S.: Policy invariance under reward transformations: Theory and application to reward shaping, in: Machine learning: Sixteenth international conference on machine learning (ICML'99), 27–30 June 1999, Bled, Slovenia, 278–287, ISBN 1-55860-612-2, 1999. a
Ni, L., Huang, X., Li, H., and Zhang, Z.: Research on Fire Emergency Evacuation Simulation Based on Cooperative Deep Reinforcement Learning, Journal of System Simulation, 34, 1353–1366, 2022. a
Oppenheimer, M., Glavovic, B.C. , Hinkel, J., van de Wal R., Magnan A.K., Abd-Elgawad, A. ,Cai, R., Cifuentes-Jara, M., DeConto, R. M., Ghosh T., Hay, J., Isla, F., Marzeion B., Meyssignac B., and Sebesvari Z.: Sea Level Rise and Implications for Low-Lying Islands, Coasts and Communities, in: Pörtner, H.-O., Roberts, D. C., Masson-Delmotte, V., Zhai, P., Tignor, M., Poloczanska, E., Mintenbeck, K., Alegría, A., Nicolai, M., Okem, A., Petzold, J., Rama, B., and Weyer, N. M. (Eds.): IPCC Special Report on the Ocean and Cryosphere in a Changing Climate, Cambridge University Press, 321–445, https://doi.org/10.1017/9781009157964.006, 2019. a
Rappaport, E. N.: Fatalities in the United States from Atlantic tropical cyclones: New data and interpretation, Bulletin of the American Meteorological Society, 95, 341–346, 2014. a
Samah, K., Hussin, B., and Basari, A.: Modification of Dijkstra's algorithm for safest and shortest path during emergency evacuation, Applied Mathematical Sciences, 9, 1531–1541, 2015. a
Schulman, J., Wolski, F., Dhariwal, P., Radford, A., and Klimov, O.: Proximal policy optimization algorithms, arXiv [preprint], https://doi.org/10.48550/arXiv.1707.06347, 20 July 2017. a
Snaiki, R., Wu, T., Whittaker, A. S., and Atkinson, J. F.: Hurricane wind and storm surge effects on coastal bridges under a changing climate, Transportation Research Record, 2674, 23–32, 2020. a
Suh, S. W., Lee, H. Y., Kim, H. J., and Fleming, J. G.: An efficient early warning system for typhoon storm surge based on time-varying advisories by coupled ADCIRC and SWAN, Ocean Dynamics, 65, 617–646, 2015. a
Sutton, R. S. and Barto, A. G.: Reinforcement learning: An introduction, MIT press, https://doi.org/10.1109/TNN.1998.712192, 2018. a, b
Vickery, P., Skerlj, P., and Twisdale, L.: Simulation of hurricane risk in the US using empirical track model, Journal of structural engineering, 126, 1222–1237, 2000. a
Wang, S., Mu, L., Qi, M., Yu, Z., Yao, Z., and Zhao, E.: Quantitative risk assessment of storm surge using GIS techniques and open data: A case study of Daya Bay Zone, China, Journal of Environmental Management, 289, 112514, https://doi.org/10.1016/j.jenvman.2021.112514, 2021a. a
Wang, S., Mu, L., Yao, Z., Gao, J., Zhao, E., and Wang, L.: Assessing and zoning of typhoon storm surge risk with a geographic information system (GIS) technique: a case study of the coastal area of Huizhou, Nat. Hazards Earth Syst. Sci., 21, 439–462, https://doi.org/10.5194/nhess-21-439-2021, 2021b. a
Wang, Y., Mao, X., and Jiang, W.: Long-term hazard analysis of destructive storm surges using the ADCIRC-SWAN model: A case study of Bohai Sea, China, International Journal of Applied Earth Observation and Geoinformation, 73, 52–62, 2018. a
Willoughby, H. and Rahn, M.: Parametric representation of the primary hurricane vortex. Part I: Observations and evaluation of the Holland (1980) model, Monthly Weather Review, 132, 3033–3048, 2004. a
Ying, M., Zhang, W., Yu, H., Lu, X., Feng, J., Fan, Y., Zhu, Y., and Chen, D.: An overview of the China Meteorological Administration tropical cyclone database, Journal of Atmospheric and Oceanic Technology, 31, 287–301, 2014. a, b
Yu, H., Zhang, H., and Xu, W.: A deep compositional framework for human-like language acquisition in virtual environment, arXiv [preprint], https://doi.org/10.48550/arXiv.1703.09831, 28 March 2017. a
Zerger, A.: Examining GIS decision utility for natural hazard risk modelling, Environmental Modelling & Software, 17, 287–294, 2002. a
Zhang, Y., Chai, Z., and Lykotrafitis, G.: Deep reinforcement learning with a particle dynamics environment applied to emergency evacuation of a room with obstacles, Physica A: Statistical Mechanics and its Applications, 571, 125845, https://doi.org/10.1016/j.physa.2021.125845, 2021. a
- Abstract
- Introduction
- Study Area
- Methodology
- Results and discussions
- Conclusions
- Appendix A: The validation of ADCIRC+SWAN model
- Appendix B: Examples of evacuation route planning
- Code availability
- Data availability
- Author contributions
- Competing interests
- Disclaimer
- Special issue statement
- Financial support
- Review statement
- References