the Creative Commons Attribution 4.0 License.
the Creative Commons Attribution 4.0 License.
 | 08 Oct 2025
Could seismo-volcanic catalogs be improved or created using weakly supervised approaches with pre-trained systems?
Carmen Benítez
Luca D'Auria
Milad Kowsari
Jesús Miguel Ibáñez
Real-time monitoring of volcano-seismic signals is complex. Typically, automatic systems are built by learning from large seismic catalogs, where each instance has a label indicating its source mechanism. However, building complete catalogs is difficult owing to the high cost of data labeling. Current machine learning techniques have achieved great success in constructing predictive monitoring tools; nevertheless, catalog-based learning can introduce bias into the system. Here, we show that while monitoring systems trained on annotated data from seismic catalogs achieve performance of up to 90 % in event recognition, other information describing volcanic behavior is not considered but is either discarded. We found that weakly supervised learning approaches have the remarkable capability of simultaneously identifying unannotated seismic traces in the catalog and correcting misannotated seismic traces. When a system trained on a master dataset and catalog from Deception Island Volcano (Antarctica) is used as a pseudo-labeler in other volcanic contexts, such as Popocatépetl (Mexico) and Tajogaite (Canary Islands) volcanoes, within the framework of weakly supervised learning, it can uncover and update valuable information related to volcanic dynamics. Our results offer the potential for developing more sophisticated semi-supervised models to increase the reliability of monitoring tools. For example, the use of more sophisticated pseudo-labeling techniques involving data from several catalogs could be tested. Ultimately, there is potential to develop universal monitoring tools that are able to consider unforeseen temporal changes in monitored signals at any volcano.
- Article
(12495 KB) - Full-text XML
- BibTeX
- EndNote


Understanding the dynamics of active volcanoes and, even more so, carrying out early warning protocols for volcanic eruptions require multiparametric observations focused on accomplishing accurate and effective monitoring (Sparks, 2003). The objective of identifying precursors that warn of a possible volcanic eruption involves the analysis of long temporal series of data, characterizing and relating them to source models associated with the internal dynamics of the volcano (Witze, 2019; Palmer, 2020). Currently, the availability of multiparametric long-time data series, such as seismology, deformation, measurements of volcanic gases and fluids, space imaging, and other processes, is limited to a few volcanoes around the world. For this reason, volcanic seismology continues to be the backbone of the analysis, both in real time and in data from previous eruptive episodes (Chouet, 2003; McNutt and Roman, 2015). This is because the installation and acquisition of seismic data continue to be the most efficient procedure for volcanic monitoring, and the existence of numerous open-access repositories allows the scientific community to review consolidated databases to understand what occurred in the past for modeling future eruptions.
Ibáñez et al. (2000)Table 1Representative volcano-seismic scientific labels and associated source models proposed by Ibáñez et al. (2000) and followed in this work. Other labels and associated source models proposed by different authors are included for comparison.
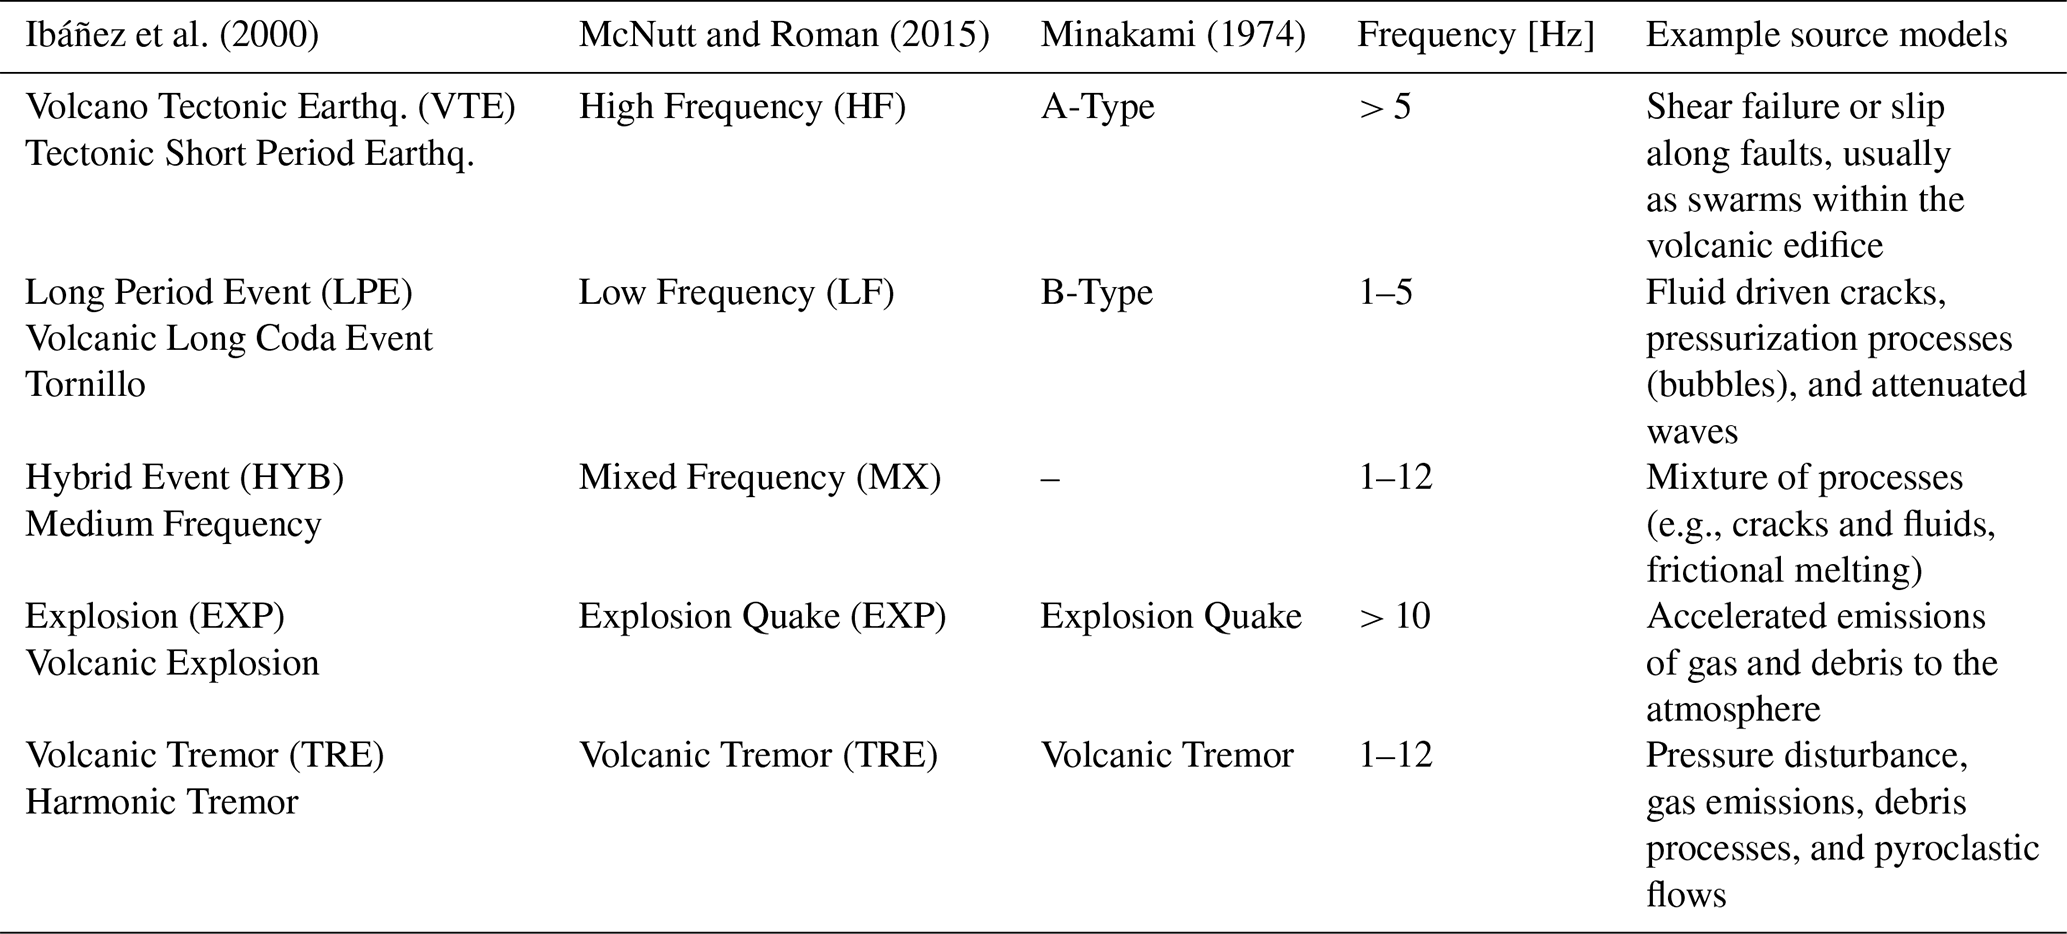
In volcanic seismology, the presence of various seismic signals – such as volcano-tectonic earthquake (VTE), long-period event (LPE), ultra-long-period (ULP) event, hybrid (HYB) event, explosion (EXP), and volcanic tremor (TR) – indicates the existence of multiple seismic sources, which can sometimes operate simultaneously and must be considered. Thus, models of brittle rock fracturing, conduit resonance, pressure transients in fluids, bubbles, cracking in viscoelastic media, elastic energy transfer by fluid flow, debris flows, and many others are used (Ibáñez et al., 2000; McNutt and Roman, 2015; Minakami, 1974). Table 1 summarizes the source models and the classification of events for different authors. The complexity of seismic sources leads to varying interpretations of volcanic dynamics, influenced by the predominant signal type and its spatio-temporal evolution. Comprehending the underlying physics of eruptions, and therefore why they occur, cannot be fully explained through signal processing alone. It requires knowledge of the frequency of occurrence and the types of seismic events that occur. This understanding is primarily achieved through the construction of seismic catalogs, which are then analyzed to infer volcanic dynamics during future crises. However, building complete catalogs presents significant challenges due to factors such as noisy signals, human error, intense seismic activity, and overlapping signals, all of which complicate the identification and classification of seismic events.
Historically, seismic catalogs have been manually created by experts, with the classification of seismic signals based on time-frequency characteristics and wave field properties. The process relies heavily on expert knowledge, which, while essential, can introduce potential bias. These biases can arise from factors like the scientific knowledge at the time of labeling, intense seismic activity where only the strongest events are focused on due to time limits, or cases where overlapping signals are grouped as one event, mixing different types of signals under a single label. This issue was notably observed during the 2011 eruption on the island of El Hierro, where continuous VTE events resulted in a high-frequency signal resembling volcanic tremor due to the overlap of hundreds of VTEs per hour (Ibáñez et al., 2012; Díaz-Moreno et al., 2015). Despite the efforts made, such challenges remain widespread across seismic databases worldwide, highlighting the need for improved methods of signal classification and event labeling.
The introduction of automatic recognition procedures for earthquake-volcanic signals almost two decades ago (e.g., Ohrnberger (2001); Scarpetta et al. (2005); Alasonati et al. (2006); Benítez et al. (2007); Ibáñez et al. (2009); Curilem et al. (2009); Bhatti et al. (2016); Canario et al. (2020); Cortés et al. (2021); Rodriguez et al. (2021); Rodríguez et al. (2021); Martínez et al. (2021); Titos et al. (2018a, b, 2023); Bicego et al. (2023)) has made the process of identifying and characterizing signals more efficient, faster, and comprehensive, allowing progress in both building robust catalogs and real-time monitoring of active volcanoes. However, the results obtained have begun to reveal potential problems: monitoring systems lose effectiveness when recognizing events over time, which biases the construction of seismic catalogs and, in turn, affects experts' ability to analyze and understand volcanic dynamics (Titos et al., 2018b, 2024).
These outcomes raise open questions that should be efficiently addressed to adequately comprehend and solve such problems: (a) Why do monitoring systems lose effectiveness? Could it be because volcanoes do not behave uniformly over time, displaying different unrest patterns from eruption to eruption and from one volcano to another? (b) Could it be that automatic monitoring systems show weakness due to seismic catalog-induced bias in their development? That is, is the database used during the development process properly labeled? Are the signal names or labels accurately identified? Could upgrades and updates to seismic instrumentation over the decades complicate the review of historical seismicity, given that the digital signals may not share a consistent framework? (c) Finally, how do seismic attenuation processes or source radiation patterns influence changes in the appearance of a signal, thus confounding the associated source models? How could background seismic noise affect the identification of seismic events?
For the last open question, it is well-known that seismic waves carry information not only about volcanic activity but also about the intricate internal structure of the volcanic edifice, which influences the seismic wave field and complicates its interpretation (Titos et al., 2018b). At many volcanoes, rugged and pronounced topography introduces additional complexities, such as wave interference, high attenuation, and path alterations for direct seismic waves. Consequently, even for the same volcano and the same originating seismic source, recordings vary in shape and wave field characteristics depending on seismometer placement. Furthermore, even at the same seismic station, similar sources may produce different signal patterns due to variations in the source's energy radiation. These effects are broadly categorized into path-related (attenuation) and source-related (energy and radiation pattern) influences (Titos et al., 2018b). As a potential solution, experts propose using a network of multiple seismic stations for signal recognition and defining rules or conditions to identify signals simultaneously.
The first and second open questions may potentially be more difficult to resolve. Volcanic behavior is highly variable, exhibiting different signs of unrest between eruptions and between volcanoes. Environmental and geological factors, such as geology, magma composition, and the volcanic edifice, influence how seismic signals propagate and are recognized. This variability poses a challenge for automatic recognition systems, which are typically built by learning from large seismic catalogs, where each instance has a label indicating its source mechanism. The more diverse the data, the better the system's adaptability. However, constructing complete catalogs is challenging because of the high cost of data labeling, which often leads to inaccuracies or mislabeling in seismic catalogs. Such inaccurate or mislabeled seismic catalogs could bias the effectiveness of the systems, meaning that their performance may be influenced not only by changes in volcanic dynamics but also by inadequate modeling of those dynamics.
In this work, we propose a comprehensive analysis of seismic catalog-induced bias when developing automatic recognition systems. We evaluated the ability of several monitoring systems trained using a master seismic catalog from Deception Island volcano (referred to as the “Master database”) to adapt to new volcanic environments from Popocatépetl (Mexico) and Tajogaite (Canary Islands, Spain) volcanoes. We hypothesize that, often, automatic recognition systems are not capable of modeling the spatio-temporal evolution of seismic events. Instead, they learn to recognize the probabilistic pattern-matching observed in their training data. In other words, rather than simply learning to characterize volcanic dynamics by describing the latent physical model, catalog-induced learning biases the system's performance as it learns the description of the data annotated in the catalog, potentially discarding useful data that describes volcanic dynamics. Therefore, we conclude that using systems trained with a master database (complete and large) as a pseudo-labeler could help create less biased catalogs from which the systems can be retrained and adapted to different volcanic environments.
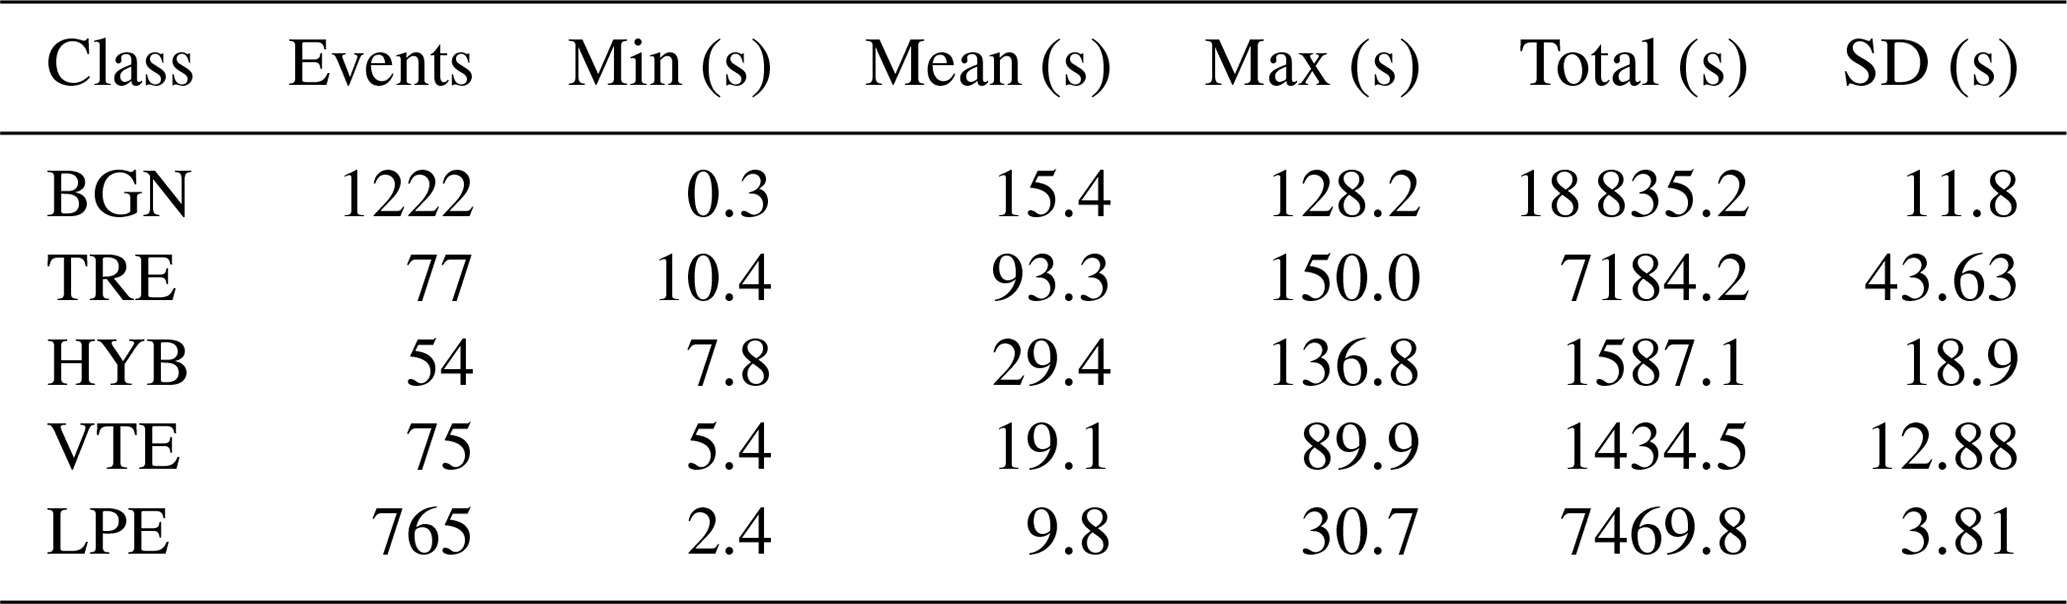
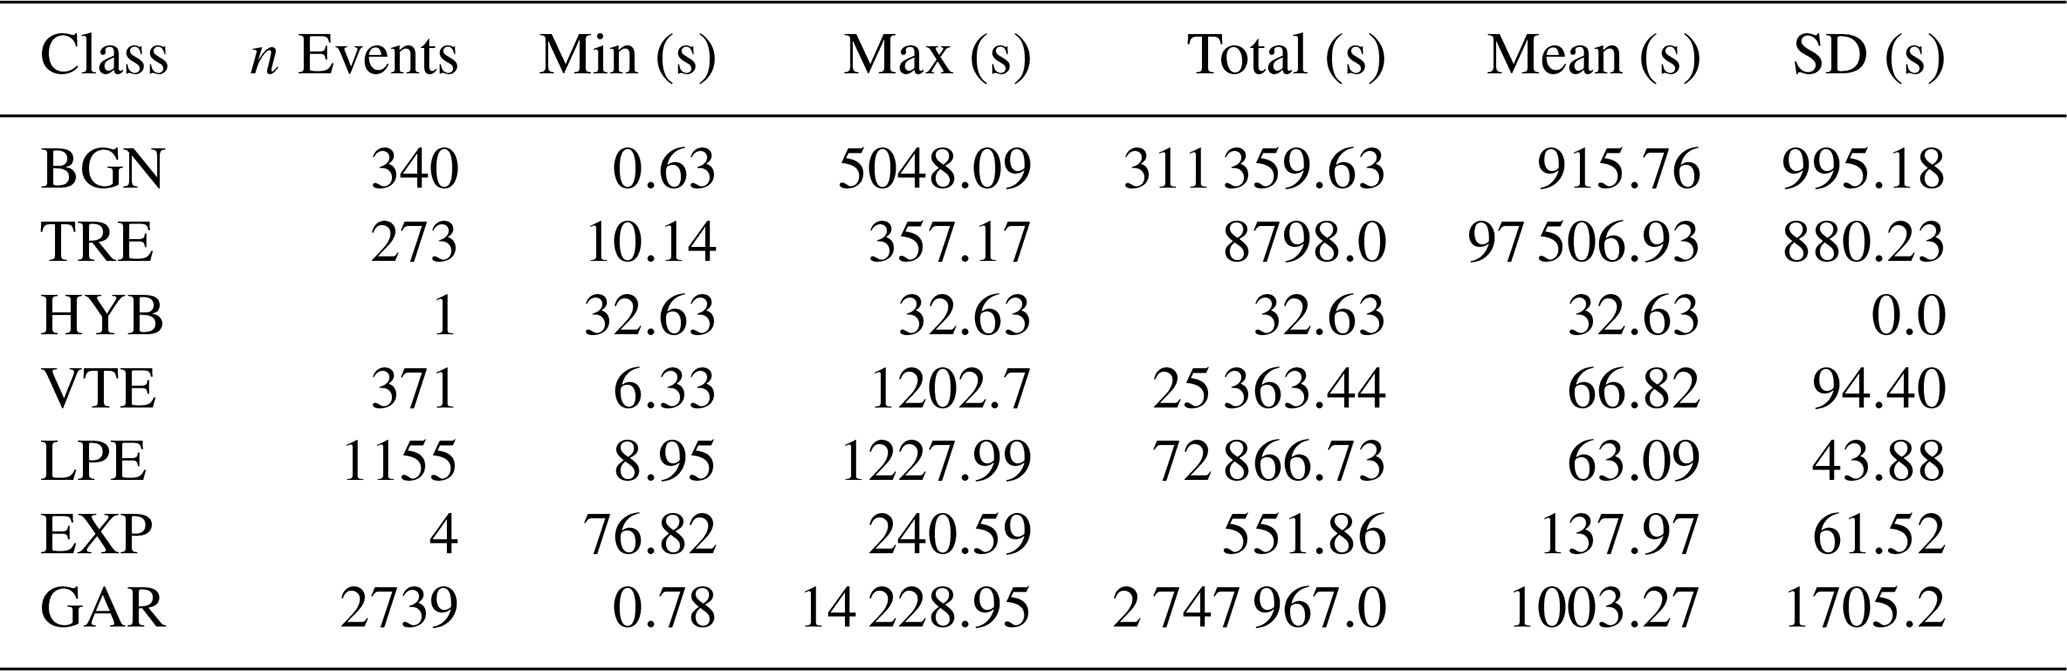
Table 2MASTER-DEC summary (Benítez et al., 2007). The table reflects statistics on the duration of the signals and the number of events for each class. Seismic categories: background seismic noise (BGN), volcanic tremor (TRE), long period event (LPE), volcano-tectonic earthquake (VTE), and hybrid event (HYB). Duration is in seconds (s).
To test this hypothesis, we conducted three independent experiments using three different automatic monitoring systems.
-
In the first experiment, we aimed to demonstrate that any state-of-the-art machine learning model can effectively learn from the information in a seismic catalog. To achieve this, we built monitoring systems within the transfer learning framework (Weiss et al., 2016). In this approach, systems previously trained on data from Deception Island volcano were retrained using a seismic catalog from the Popocatépetl volcano. Once trained, the models were evaluated for performance and thoroughly analyzed. The results highlighted a key issue: when the catalog is not carefully constructed and events are inaccurately annotated – such as when multiple events are combined under a single label – the systems fail to recognize each individual event. This results in the loss of valuable data that could describe volcanic dynamics.
-
In the second experiment, rather than retraining pre-existing models using a catalog, we used the pre-trained systems as a foundational seed (pseudo-labeler) to label the new data and construct new catalogs. Using these newly generated catalogs as training data, we then retrained the systems. The results showed that significantly more events were recognized than in the original catalog, offering a new perspective on volcanic dynamics.
-
Finally, we conducted a third experiment using data from the 2021 eruption of Tajogaite volcano, for which only an earthquake catalog is available. This experiment demonstrates that automatic seismo-volcanic monitoring systems, based on weakly supervised techniques, can provide an effective alternative for both constructing and revising seismic catalogs.
The rest of this paper is organized as follows. Section 2 describes the seismic dataset and signals used in this study. Section 3 provides the experimental framework and describes how weakly supervised techniques can be used for developing automatic volcano-seismic recognition systems. Sections 4 and 5 present the results and discussion. Section 6 concludes this paper.
This study will use three datasets from three volcanoes of different natures: Deception Island (Antarctica), Popocatépetl (Mexico), and Tajogaite (Canary Islands, Spain). Due to the extensive expertise and in-depth knowledge our research group has on Deception Island volcano, which has provided a comprehensive understanding of its structure and dynamics through numerous campaigns conducted since 1994 (Ibáñez et al., 2000; Martınez-Arévalo et al., 2003; Zandomeneghi et al., 2009; Carmona et al., 2012; Ibáñez et al., 2017), we will consider the dataset associated with this volcano as the reference or “master” dataset. Therefore, to corroborate the performance of the weakly supervised approach proposed in this work, we will use the Popocatépetl and Tajogaite databases as benchmarks.
2.1 Deception Island volcano
Deception Island (62°59′ S, 60°41′ W) is a horseshoe-shaped volcanic island that emerged during the Quaternary period. It is located within a marginal basin-spreading center of the Bransfield Strait, where the South Shetland Islands and the Antarctic Peninsula are separating (Smellie, 1988; Martí et al., 2013; Carmona et al., 2012). The Deception Island dataset (hereafter referred to as MASTER-DEC) was created using seismic data collected during the 1994–1995 campaign organized by the Andalusian Institute of Geophysics (IAG) with a short-period array of eight channels. The array consisted of a three-component Mark L4C seismometer with a lower frequency band of 1 Hz and five Mark L25 sensors with a vertical component frequency of 4.5 Hz, electronically extended to 1 Hz. After analyzing the eight channels, the one with the highest signal-to-noise ratio (SNR) was selected (Ibáñez et al., 2000). The data were sampled at a frequency of 100 Hz. Since this sampling frequency allows for the analysis of frequencies up to 50 Hz and our parameterization workflow primarily operates within the 1–20 Hz range, the data were filtered within this range. This filtering minimizes the influence of the sensors used for signal recording and ensures the comparability of the data recorded by different sensors over various time periods or at different volcanoes (it does not fully eliminate variations related to the temporal evolution of the volcanic system nor those stemming from differences in volcanic processes or path properties between the source and the sensor).
By integrating our understanding of the structural, source, and dynamic models of Deception Island volcano with advancements in signal processing and machine learning (ML), MASTER-DEC has played a crucial role in the development of automatic seismo-volcanic recognition systems. It has also served as the foundation for studies involving hidden Markov models, artificial neural networks, parameter reduction algorithms, and more (e.g., Rodriguez et al. (2021); Titos et al. (2018a, b, 2019, 2022); Cortés et al. (2021). Therefore, we can confidently assert that this database is both highly reliable and ideally suited for our intended purpose. While it is true that not all types of signals are represented in MASTER-DEC – especially those associated with ongoing eruptive processes – its primary objective aligns with our application, which focuses on understanding pre-eruptive processes (set of geological, geophysical, and geochemical phenomena occurring before an eruption).
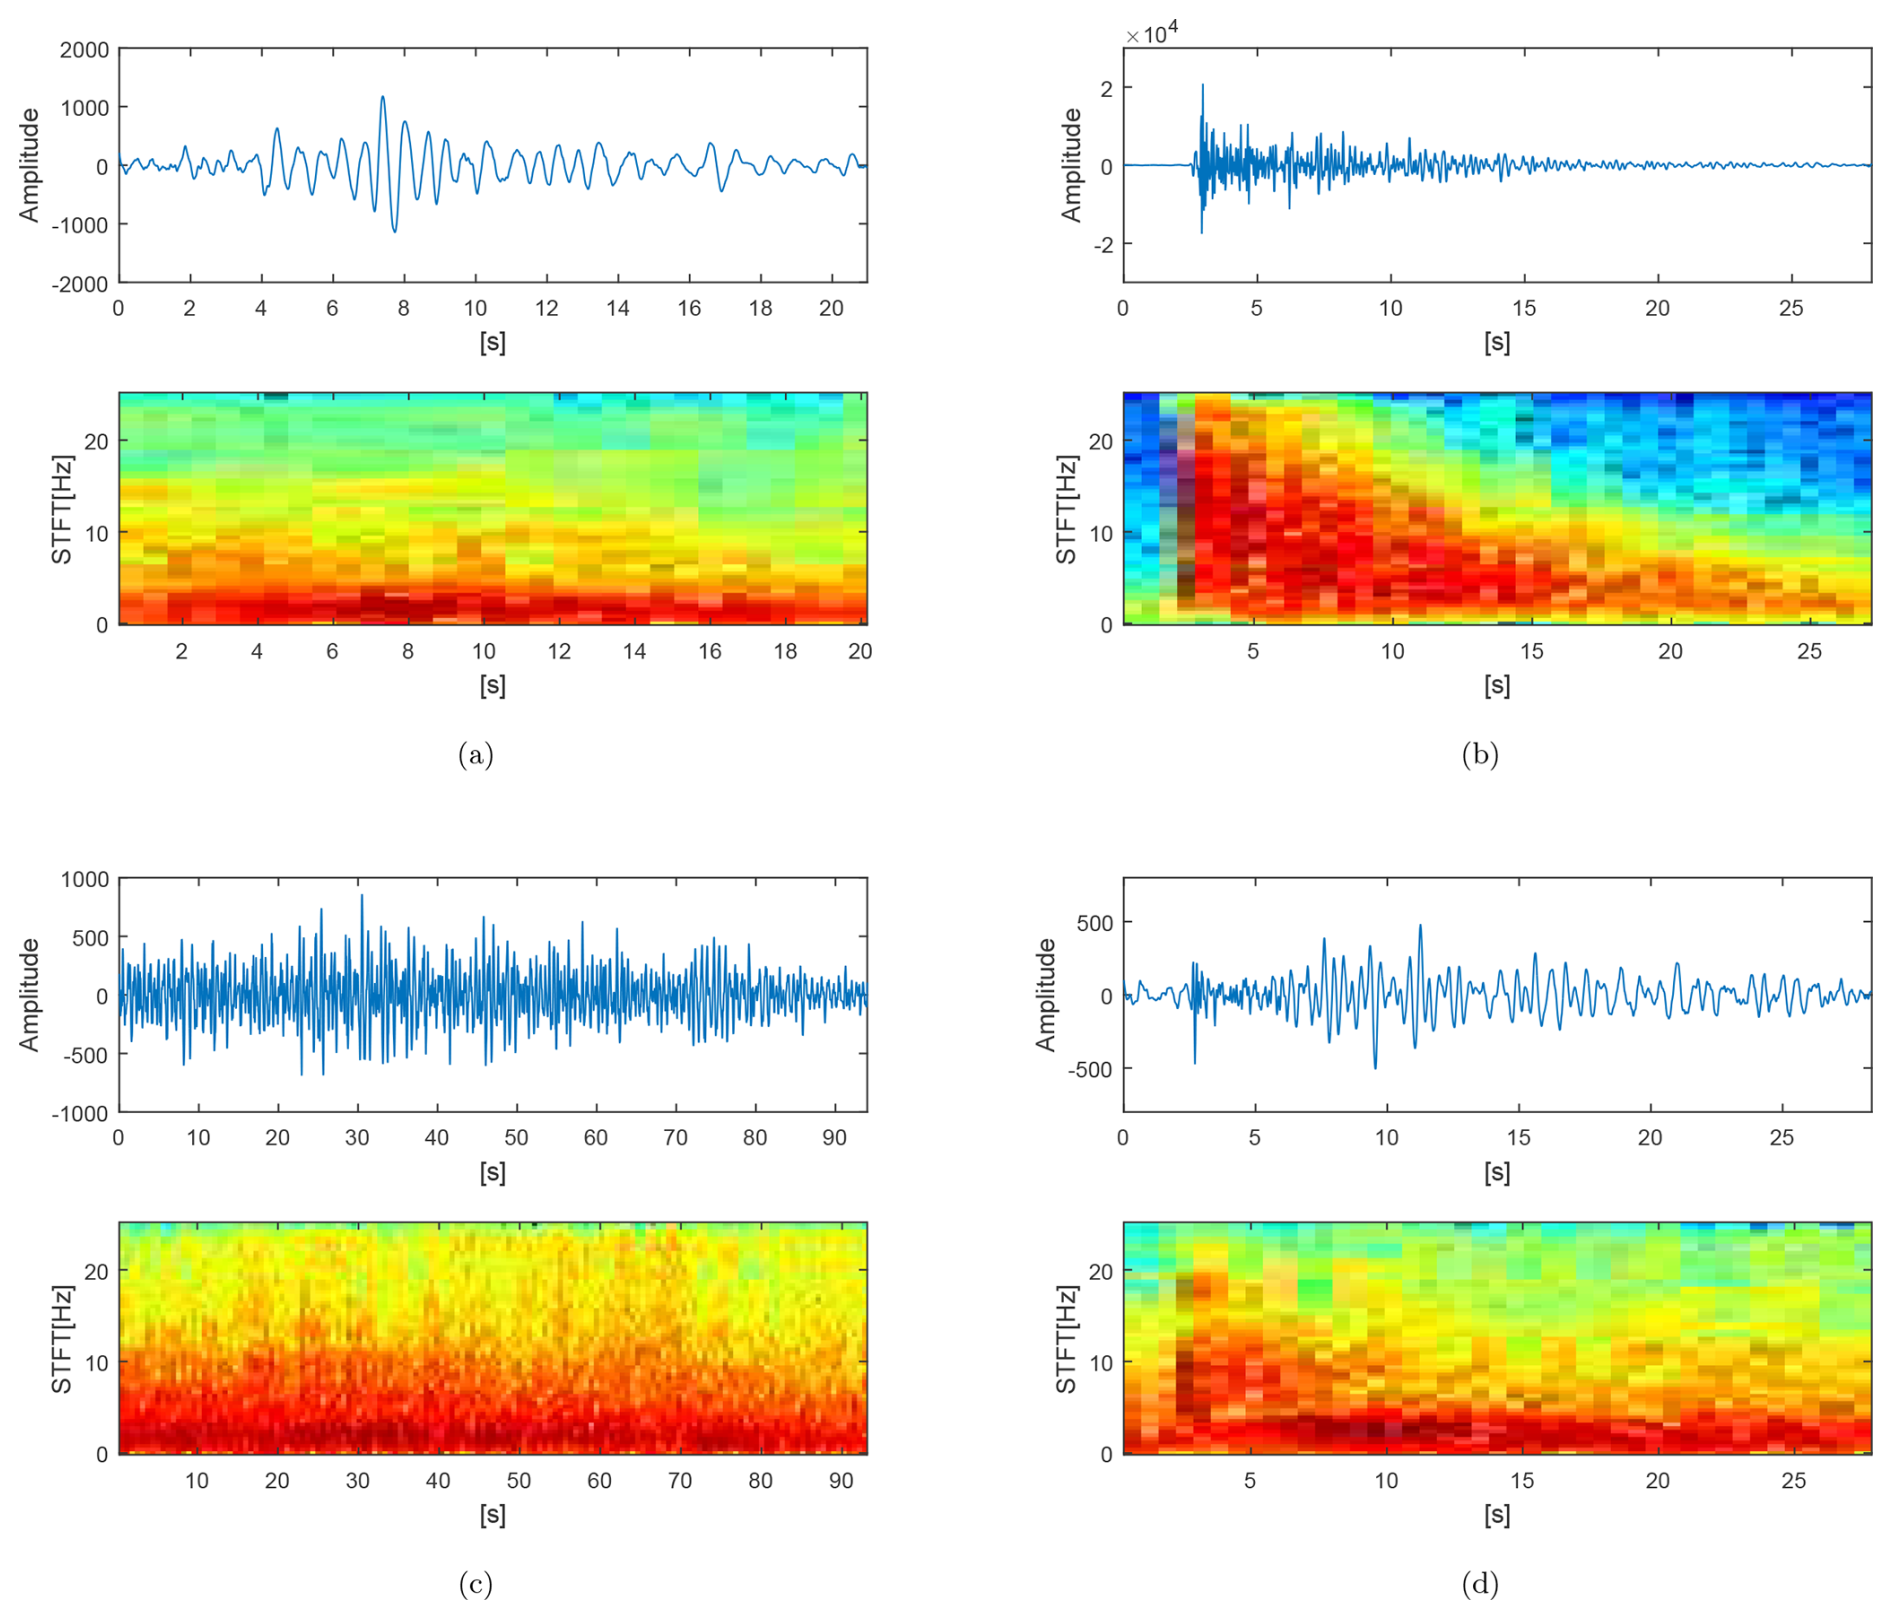
Figure 1Amplitude and spectrograms of the main four prototypes of volcano-seismic events recorded at Deception Island volcano. (a) Long period event (LPE), (b) volcano-tectonic earthquake (VTE), (c) volcanic tremor (TRE), and (d) hybrid event (HYB).
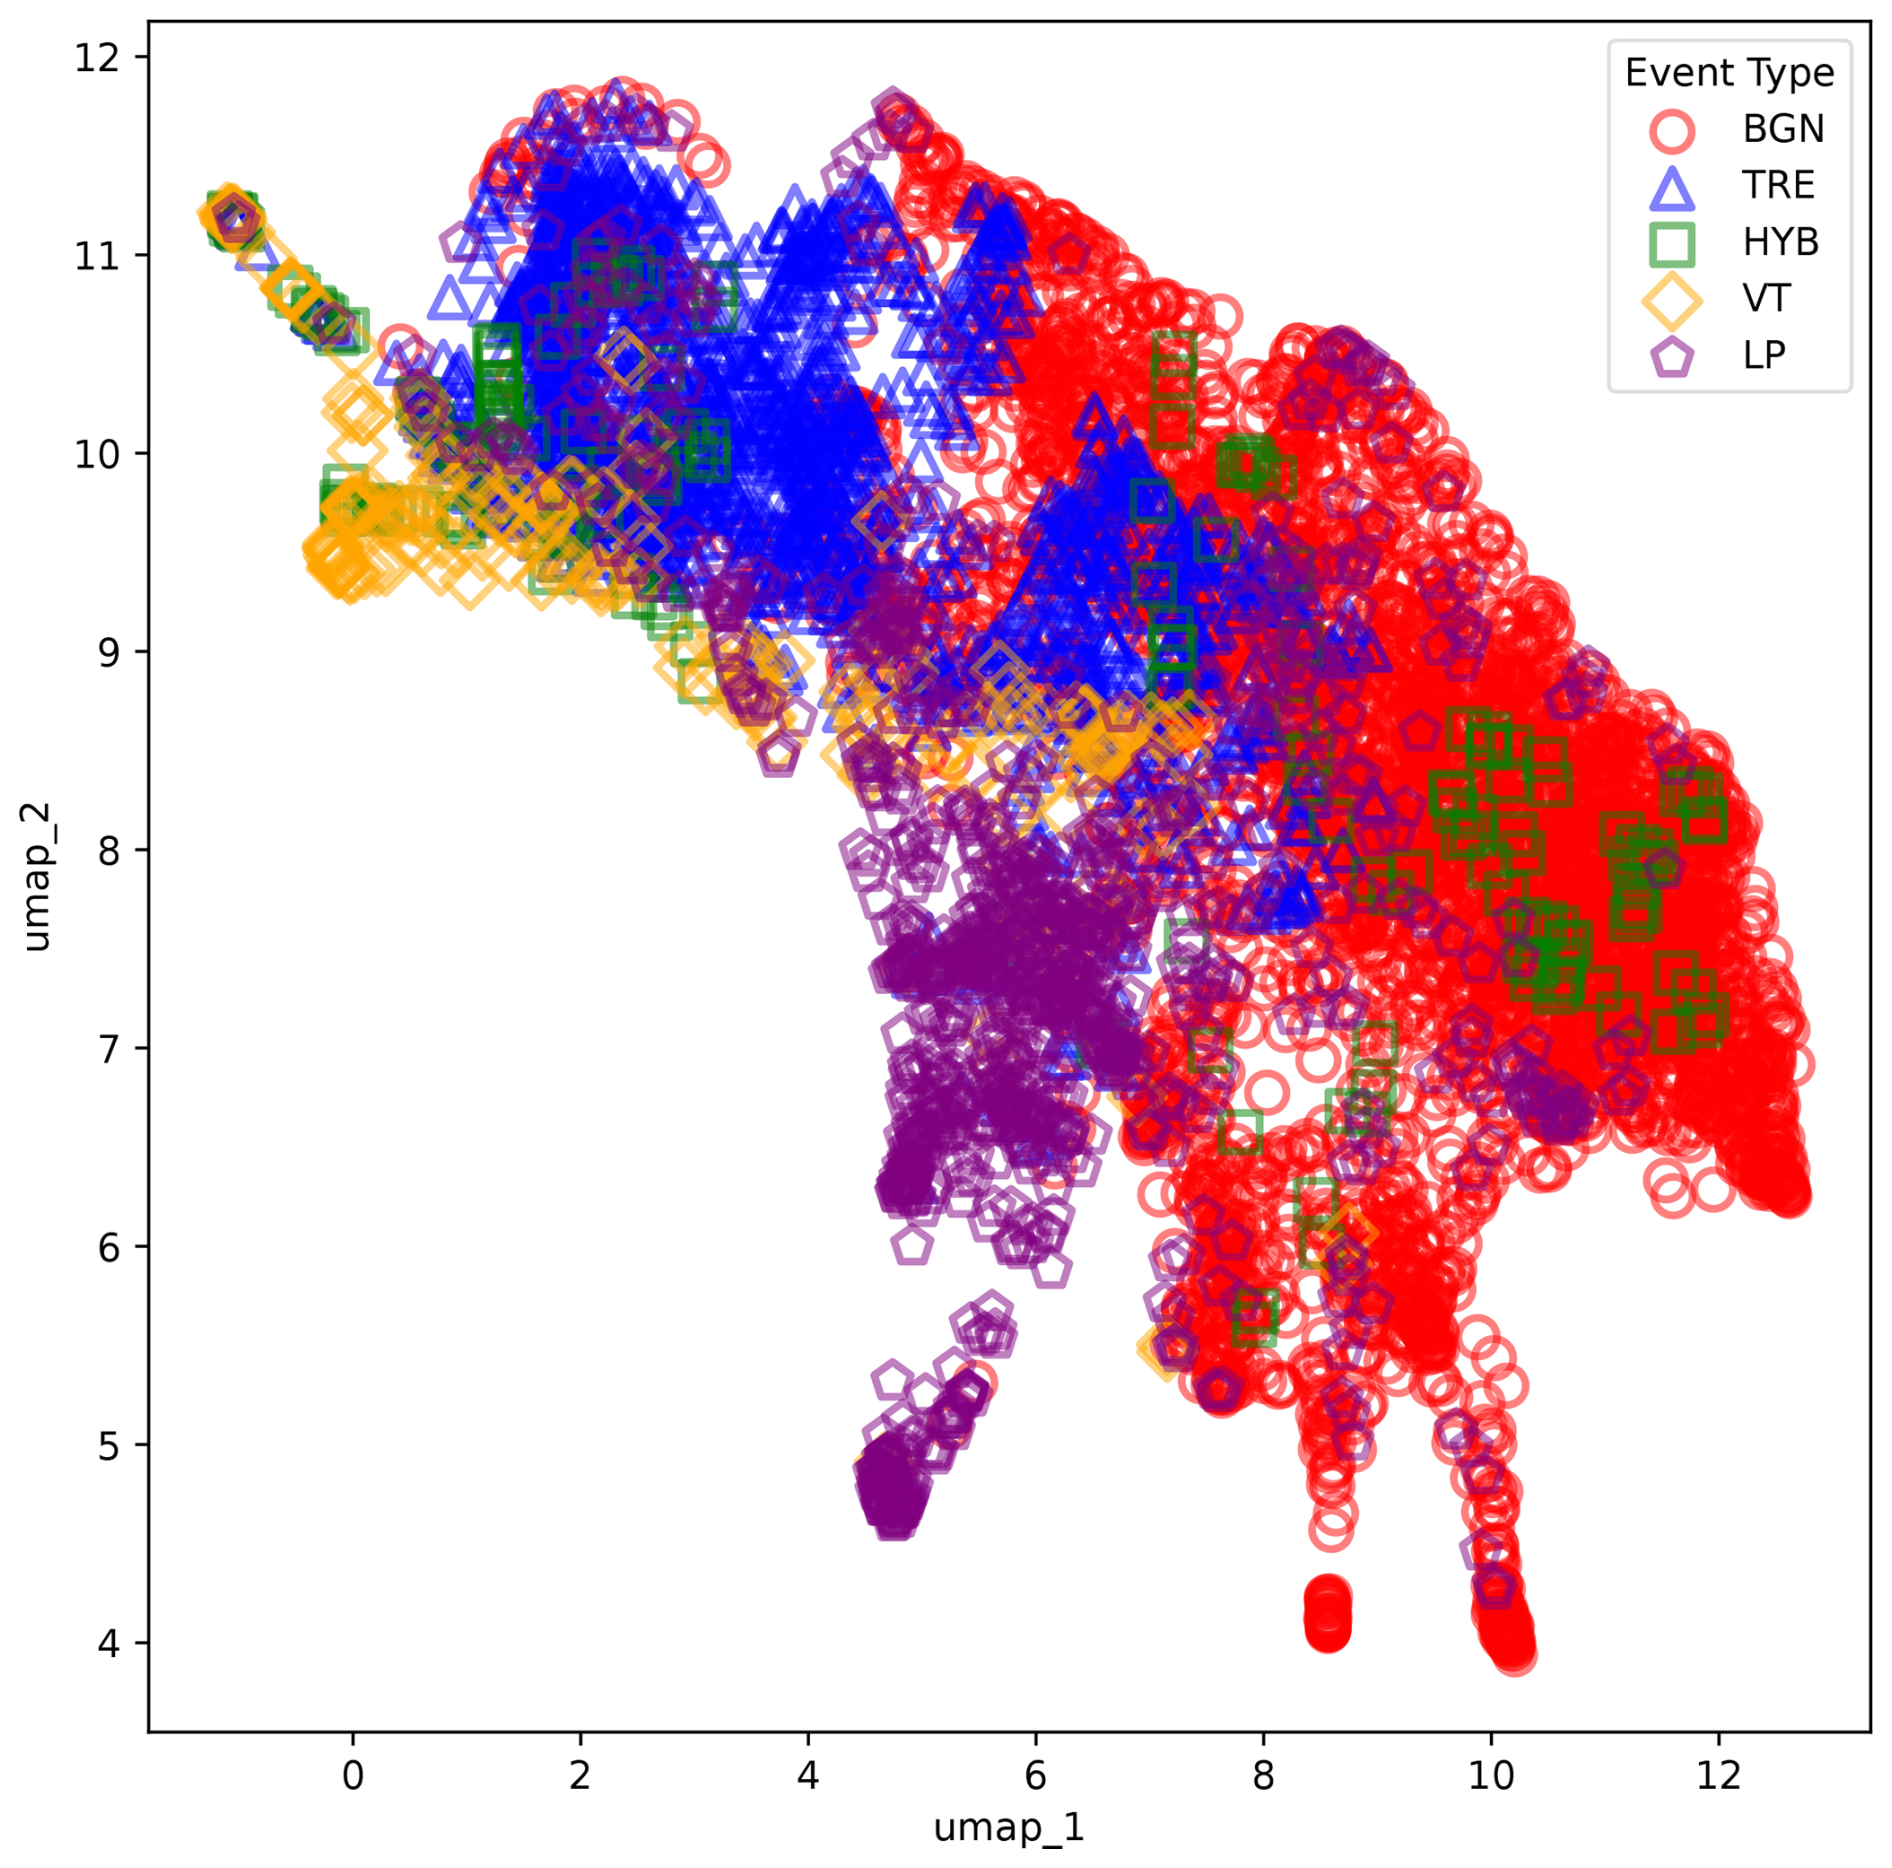
Figure 2Uniform Manifold Approximation and Projection (UMAP) representation obtained for the input vector forming the original data of the MASTER-DEC dataset. Different seismic categories (e.g., BGN-TRE or VTE-LPE) may have elements located in overlapping areas of the representation space, where they share similar projected features.
For the current study, we extracted a subset of data, consisting of 2193 seismic events. These data were categorized into five classes, which align with the volcano-seismic scientific labels and the accompanying source models proposed by Ibáñez et al. (2000) (Table 1). Table 2 presents a detailed summary of the seismic events and their distribution. Figure 1 depicts an example of each type of event corresponding to the prototypes in the database. Figure 2 illustrates the Uniform Manifold Approximation and Projection (UMAP) representation (McInnes et al., 2018), showing the distribution of the five MASTER-DEC event types within the feature representation space. The representation space aligns with a log frequency scale filter bank, which captures the energy distribution of each event across various frequency bands. For a more detailed explanation of how the workflow constructs the feature vectors, please review Titos et al. (2024). This visualization highlights how different seismic events occupy unique but sometimes overlapping regions, revealing potential challenges in distinguishing between event categories. The projection provides an intuitive view of the clustering tendencies and the proximity of events with shared characteristics, underscoring the inherent variability and possible misclassification risk in automatic seismic event recognition systems even in thoroughly analyzed and refined datasets.
Table 3POPO2002 dataset. The table reflects statistics on the duration of the signals and the number of events for each class. Seismic categories: explosion (EXP), garbage (GAR), hybrid event (HYB), long period event (LPE), volcano-tectonic earthquake (VTE), background seismic noise (BGN), and volcanic tremor (TRE). Duration is in seconds (s).
2.2 Popocatépetl volcano
Popocatépetl volcano (19°1′ N, 98°37′ W) is placed within a different geodynamic framework and exhibits a different eruptive style compared to Deception Island: a subduction setting in contrast to a rift environment. Popocatépetl is a large dacitic–andesitic stratovolcano covering > 500 km2 of the eastern Trans-Mexican Volcanic Belt (Barra, 2008; Siebe et al., 2017). It is surrounded by a densely populated area with around 25 million inhabitants (Arango-Galván et al., 2020). The volcano is highly active, with the current active period beginning in December 1994 (Arango-Galván et al., 2020). The dataset used in this study (hereinafter called POPO2002) was collected during a seismic experiment conducted between November and December 2002, using short-period seismic stations. There is no detailed information regarding the type or specifications of the sensors used to record the seismic signals. Data labeling was manually performed by a group of geophysicists with extensive knowledge and experience of the volcano's dynamics. It consists of 4883 events, divided into similar classes as the MASTER-DEC catalog (again aligning with the volcano-seismic scientific labels and accompanying source models proposed by Ibáñez et al. (2000)). Additionally, the catalog includes noisy events (labeled as GAR) (2739 events), and due to Popocatépetl's activity, there is a category for explosion (EXP). Along with the event catalog, we have continuous seismograms from this period that will be used for segmentation and identification processes. Table 3 summarizes the POPO2002 dataset. With the aim of minimizing the influence of the sensors used for signal recording and ensuring data comparability, the signals were first filtered to match the frequency range of MASTER-DEC (1–50 Hz), followed by a subsampling process to adjust the sampling frequency accordingly.
2.3 Tajogaite volcano
Tajogaite volcano (28°40′ N, 17°52′ E) is located on the island of La Palma in the Canary Islands, Spain. The eruptive activity started on 19 September 2021, following a period of seismic activity, marked by several VTE swarms and then carried out by continuous volcanic tremor, becoming the first eruption on La Palma since 1971. The eruption started with the opening of a fracture in the southwest part of the island, and the emission of material persisted for nearly three months, generating extensive lava flows and pyroclastic deposits (D'Auria et al., 2022). This event significantly affected the surrounding environment, infrastructure, and regional air traffic. The volcanic process yielded comprehensive seismic and geochemical data, providing valuable insights into volcanic behavior in the Canary Islands and serving as a key reference for improvements in volcanic monitoring and hazard assessment. The seismic catalog for this volcano (from this point forward referred to as LAPALMA2021) differs from previous seismic catalogs in that it only includes annotations of the occurrence of VTE-type events. That is, the catalog consists solely of a series of entries describing the date of the event's occurrence, along with its magnitude and depth. There is no detailed information regarding the type or specifications of the sensors used to record the seismic signals. Given the nature of this catalog and database, analyzing it could provide valuable insight into the ability of the proposed approach to improve a catalog from scratch. Again, to minimize the impact of sensor differences and ensure data comparability, the signals were first filtered to match MASTER-DEC's frequency range (1–50 Hz) and then adjusted to the same sampling frequency.
Finally, it is important to mention that an interesting use case to be evaluated would be the “temporal transferability” of the system for Deception Island volcano across different analysis periods. Given that some of our previous studies (Titos et al., 2018b, 2024) have examined the transferability of the baseline systems to different periods, including the 2016 campaign, and demonstrated a high degree of transferability, we conclude that the algorithm's performance, if applied, is justified since the core of the proposed algorithm relies on prototype event recognition. Therefore, this study would benefit more from focusing on use cases involving volcanoes with diverse characteristics.
This section outlines the methodology and experiments conducted in this work. The proposed algorithm will be described, followed by a detailed explanation of the three experiments conducted. The results of these experiments will be presented in the results section.
3.1 Methodology
Transfer learning (TL) algorithms facilitate the adaptation of a pre-trained model from a source domain to a target domain (Weiss et al., 2016). In their most direct formulation, this process necessitates the availability of a labeled dataset to perform fine-tuning, enabling the optimization of the model's parameters to align with the statistical properties of the target domain. However, in many practical applications, the lack of labeled data, such as restricted access to a database catalog, poses a major challenge for effective domain adaptation, often requiring alternative strategies. In this work, we propose a weakly supervised transfer learning approach to generate new seismic catalogs, allowing systems to be retrained with minimal human supervision. Our method uses pre-trained systems as a starting point (pseudo-labeler) to weakly label the new database and construct updated catalogs. These catalogs then serve as training data, enabling the systems to adapt to a new volcanic environment.
Weakly supervised learning is a branch of machine learning that covers the construction of predictive models with minimal or indirect supervision (Zhou, 2018). Such techniques focus on learning with incomplete, inexact, and/or inaccurate information derived from noisy, limited, or imprecise supervision processes. The objective is to automatically provide supervision for labeling large amounts of data using labeling functions derived from domain knowledge. This approach replaces the costly and impractical hand-labeled process with inexpensive weak labels, understanding that although imperfect, they can be used to create a strong predictive model. In our framework, the source domain (denoted as 𝒟S) is the MASTER-DEC dataset (based on refined physical models and a strong revision process). The target domain (denoted as 𝒟T) is a new given dataset POPO2002 or LAPALMA2021 (whose available seismic catalog will not be considered). The goal is to address a domain adaptation task (Kouw and Loog, 2019; Farahani et al., 2021) to reduce the cost of developing a reliable seismic catalog and database for a new dataset with minimal initial human supervision. That is, automatically provide supervision for labeling large amounts of data from 𝒟T using labeling functions derived from domain knowledge 𝒟S.
In a domain adaptation framework, typically 𝒟S and 𝒟T have the same feature space X and label space Y but different marginal and conditional distributions:
-
The marginal distributions P(XS) and P(XT) may differ, meaning that the distribution of seismic events or seismic signals in 𝒟S and 𝒟T domains may not be the same.
-
The conditional distributions P(Y|XS) and P(Y|XT) may also differ, meaning that the relationship between features derived from seismic signals and labels (seismic categories) may vary between domains.
However, in this study, we make the following assumptions to enable pseudo-labeling:
-
The feature spaces of 𝒟S and 𝒟T are the same: 𝒳S=𝒳T. This implies that the seismic signals in both domains can be represented using a similar set of features.
-
The label spaces of 𝒟S and 𝒟T may overlap but are not necessarily identical: . This means that some seismic categories may be shared between domains, while others may be unique to one domain.
These assumptions have important implications. While the feature spaces are assumed to be similar, the marginal and conditional distributions may differ between domains. Specifically:
-
If P(XS)≠P(XT), the distribution of seismic signals may vary between 𝒟S and 𝒟T, leading to a domain shift.
-
If , the relationship between seismic signals and event categories may differ between domains, leading to a category shift.
This scenario aligns with the open set domain adaptation paradigm, where the target domain may contain seismic events not present in the source domain. Therefore, the model must be designed to handle both shared and novel categories in the target domain.
By leveraging the probabilistic detection matrices generated by the system trained on 𝒟S, we can apply a weakly supervised learning technique as a pseudo-labeler on 𝒟T to construct a new dataset. This dataset can then be used to train a new system in a supervised manner. Specifically, those parts of the unlabeled dataset in 𝒟T with high per-class probability are selected and added to the new training set. This approach implicitly assumes that, for high confidence predictions, the conditional distributions P(Y|XS) and P(Y|XT) are approximately similar, at least for the shared classes between domains (the model's confidence reflects a degree of similarity in the feature–label relationships). Although this method is not perfect, it ensures that events exhibiting characteristics similar to those annotated in the master catalog (𝒟S) are included in the new training dataset. As a result, after the retraining phase, the target catalog is both enlarged and updated, improving the model's ability to generalize to the target domain. It is important to note that this experiment does not aim to correct the catalog created by our colleagues with utmost dedication and effort; it simply seeks to highlight that a pseudo-labeler can be a valuable tool in constructing and reviewing it with success and low time consumption. However, our method has a significant limitation: the catalogs generated through weakly supervised learning will only include the seismic categories present in the master database used for training. Even if other classes exist in the new data, the labeling process will always assign each analysis window to one of the predefined categories. To develop a more universal pseudo-labeler, a master database containing a broader range of seismic categories would need to be constructed. Although our method only labels categories present in the master catalog, potential novel classes in the target domain may still be revealed through analysis of the probabilistic detection matrices, especially when combined with unsupervised techniques for event discovery.
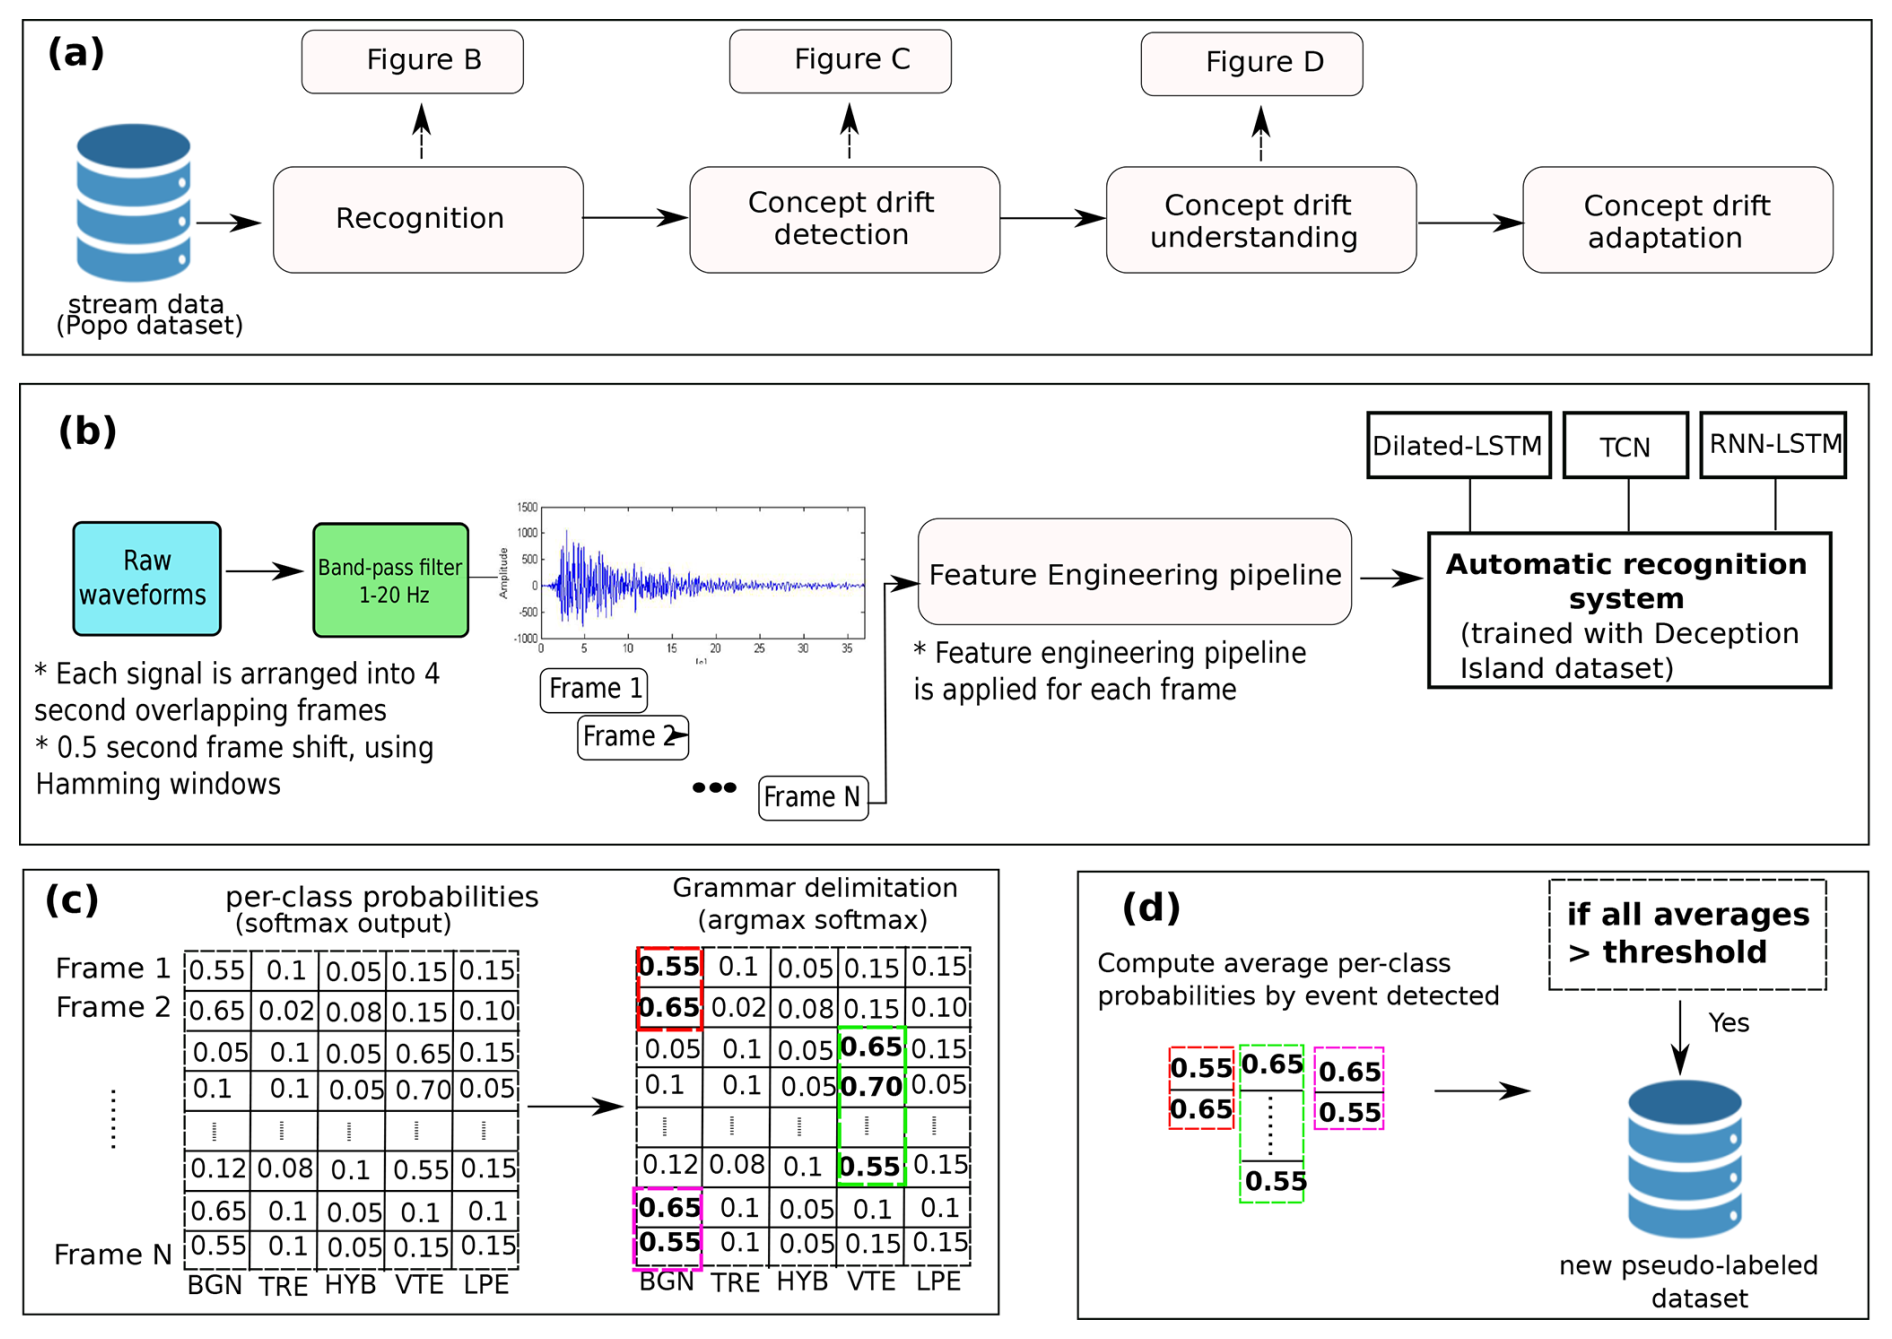
Figure 3(a) Overview of the weakly supervised event selection algorithm developed. A subset of the dataset (in our case 40 % of the total) is used as a training set by the reference pre-trained systems. The rest of the data are used as a test set. Only high per-class probability recognized events are selected as new training instances. (b) Workflow structure and the specific pre-processing steps employed, which rely on frequency analysis within the log frequency filter bank domain (Titos et al., 2022). (c) For each detected event, the confidence of the detection is analyzed using a probabilistic event detection matrix with per-class probabilities output by the systems. (d) Drift adaptation mechanism based on an adaptive threshold is then adopted. Those events whose average per-class probability is greater than a given threshold are selected and included as new training instances.
Taking these factors into account, our proposed approach is outlined as follows and depicted in Fig. 3:
-
Recognition: According to Fig. 3a, the recognition block analyzes a subset of data from the new dataset using a pre-trained system. The data stream illustrates continuous analysis (allowing near real-time processing). While the literature offers a variety of accurate machine learning architectures for uncovering descriptive patterns in seismic signals (Alasonati et al., 2006; Benítez et al., 2007; Köhler et al., 2010; Bhatti et al., 2016; Hibert et al., 2017; Malfante et al., 2018; Titos et al., 2018a, 2019; Canario et al., 2020; Lara et al., 2021; Rodriguez et al., 2021; Titos et al., 2022; Bicego et al., 2023), some of these methods may not be as effective for the specific challenges posed by continuous or near real-time data processing. Given the inherent variability and complexity of these data, consisting of seismic signal sequences containing multiple events, where the goal is to detect and classify each individual event, specialized approaches capable of adapting to these conditions are required. More specifically, we will base our experimental framework on the pre-trained systems previously published in Titos et al. (2018b, 2022, 2024). These systems correspond to the Recurrent and Dilated Recurrent Neural Networks (Hochreiter and Schmidhuber, 1997; Schmidhuber, 2015; Chang et al., 2017), both with LSTM cells (henceforth referred to as RNN-LSTM and Dilated-LSTM), along with Temporal Convolutional Networks (Lea et al., 2017) (referred to as TCN). These models generate a probabilistic event detection matrix with per-class membership outputs. To carry out the recognition, the same algorithm of feature extraction used in the MASTER-DEC is applied. Streaming or continuous signals are filtered between 1 and 20 Hz and split into frames or windows. For each window, a feature engineering pipeline based on a logarithmic scale filter bank is applied. This pipeline reduces the dimensionality of the input vector associated with each analysis window compared to raw signals. It facilitates the training and convergence of the systems, as it increases the separability of the data based on a well-studied feature space (see Titos et al. (2024) for a detailed understanding of the parameterization pipeline).
-
Event detection and confidence analysis (concept drift detection): The concept drift detection block analyzes the confidence of each detected event using the previously obtained probabilistic event detection matrix with per-class membership output. This step allows us to quantify the severity of drift between datasets (usually known as “concept drift”) (Lu et al., 2018). High or extremely high per-class recognition probabilities for each event type indicate that the systems are well-fitted to the master database. Low per-class probabilities indicate a change in the description of the analyzed information. Accurate and robust dissimilarity measurement and statistical hypothesis evaluation are not strictly necessary, given the well-known dissimilarity between volcanic environments. Here, we disregard the information contained in the available seismic catalog.
-
Concept drift adaptation: An adaptive threshold mechanism selects events for the new database, considering only those whose average per-class probability exceeds the specified threshold. The system's sensitivity is directly influenced by the chosen threshold: a lower value increases sensitivity, allowing more events to be included but potentially reducing specificity. Conversely, a higher threshold enhances specificity by selecting only the most confident detections, though at the risk of lowering sensitivity. The threshold value will be determined by the user based on their needs when addressing the problem. In our case, we have set it at 60 %, allowing the inclusion of a greater number of events and better adaptation to the new domain.
-
Retraining process: Finally, the pre-trained systems used in step 1 are retrained using the selected instances and labels obtained in step 3. This approach applies a transfer learning strategy in which all model parameters are fine-tuned, while experimenting with different learning rates and regularization techniques and employing early stopping to prevent overfitting.
-
Iterative refinement: Repeat steps 2 through 4 iteratively until no further improvements are observed in the catalog creation or until the user deems it appropriate.
3.2 Experimental framework
3.2.1 Developing automatic recognition systems through a transfer learning approach leveraging available catalogs
The standard procedure for developing an automatic volcano-seismic recognition system from scratch using supervised machine learning techniques involves having a sufficiently representative seismic catalog (selecting and segmenting a large, reliable set of well-labeled seismic events that cover the maximum possible range of events occurring in the studied volcanic area). These events serve as the initial seed for the training procedure. This training can be carried out using different approaches, ranging from training the system from scratch to using transfer learning techniques.
In the first experiment, to demonstrate that ML models can effectively learn the information contained in a seismic catalog (assuming catalog-induced learning biases), a recognition system based on transfer learning approaches will be developed from scratch, utilizing three different architectures. To achieve this, the three systems pre-trained on MASTER-DEC (RNN-LSTM, Dilated-LSTM, and TCN) will serve as the foundation for adapting recognition systems to the Popocatépetl volcano. Specifically, these systems will be retrained with the available data and catalog from the POPO2002 dataset. Since the POPO2002 catalog includes seven seismic categories while MASTER-DEC has only five, a transfer learning-based recognition system can be designed in different ways. One option is to train the system using only the categories present in MASTER-DEC. Another approach is to include all categories in POPO2002. From an ML perspective, both approaches follow standard procedures, although they differ slightly in implementation. In the first case, where only five seismic categories are considered, the models are fully retrained using the new catalog. In the second case, which includes seven categories, the output layer is modified to accommodate the two additional classes, while the pre-trained parameters from the original model are retained. The model is then fine-tuned on the new data, allowing efficient adaptation without retraining from scratch.
3.2.2 Developing automatic recognition systems using the proposed weakly supervised pseudo-labeling approach
The second experiment differs from the previous one primarily in the source of the labels used for training: instead of relying on true annotations, it leverages pseudo-labels generated by the pre-trained models themselves. This experiment highlights the use of weakly supervised approaches to enhance seismic-volcanic catalogs. The process involves using each of the three pre-trained reference systems (RNN-LSTM, Dilated-LSTM, and TCN) to recognize (detect and classify) the seismic events in the new dataset and then retrain the systems based on these pseudo-labels. Therefore, each system will analyze a subset of the total POPO2002 database to create a new training set for the retraining process. Once retrained, the systems will generate a new seismic catalog, which will then be compared and analyzed against the original POPO2002 catalog to assess the results.
Since MASTER-DEC is composed of five seismic categories and the weakly supervised approach relies on pre-trained models, the experiments presented here are based solely on these five categories. This limitation is a consequence of the methodology and must be properly understood to ensure a correct interpretation and discussion of the results, as it directly influences the way the data are analyzed and compared with the original catalog. An important consideration in this experiment is that the recognition percentage obtained by the systems before and after retraining, using the original catalog annotations as a reference, can provide valuable insights into the algorithm's behavior. Therefore, both results will be taken into account in this experiment, with the aim of analyzing in detail how the retraining process with the new pseudo-catalog affects the system's performance.
3.3 Building a new catalog during an eruptive crisis: the Tajogaite volcano use case, 2021
The third and final experiment aims to analyze the robustness of the proposed methodology by building a seismic catalog from scratch in a highly demanding use case, such as during an eruptive crisis. Since we have not had the opportunity to test it in an actual eruptive scenario, we propose using data from the Tajogaite volcano during the 2021 eruptive episode. We also suggest abstracting this offline test to simulate a real-time episode, as if data were being analyzed in real time, since the functionality would be exactly the same. As previously mentioned, the selected pre-trained systems are capable of operating in near real time, with particularly short latency times, analyzing (not retraining) 24 h of data in a few seconds.
Therefore, for this experiment, a pair of 24 h seismic records from the PPMA and PLPI seismic stations, corresponding to 12 September 2021, just a few days before the eruption began when an increase in activity was detected, was used. To conduct an analysis and comparison of the results, we have a seismic catalog created by geophysical experts from that volcano during the eruption crisis itself. Given the large number of recorded events, the significance, and the urgency of the moment, we believe that this catalog meets the requirements of the time. Again, just as we argued in the case of the POPO2002 catalog, this experiment does not aim to correct the catalog created by our colleagues with utmost dedication and effort; it simply seeks to highlight that a pseudo-labeler can be a valuable tool in constructing and reviewing it.
For each experiment, tables describing the system performances in terms of accuracy, along with detailed confusion matrices, are presented. These confusion matrices were constructed by comparing the model predictions against the labeled events in the catalog. This approach allows for a granular analysis of the classification behavior, revealing not only the global accuracy but also class-specific performance, misclassification patterns, and possible confusion between seismic event types. For experiments 1 and 2, the accuracy (%) metric evaluates the capability of the developed systems to accurately recognize the events annotated in the POPO2002 seismic catalog. The normalized confusion matrices provide a breakdown of true positives, false positives, false negatives, and true negatives, allowing a thorough analysis of each system's robustness. All results were obtained using a leave-one-out cross-validation process with four random partitions. Each time, we select T % of the entire database as the training set, and the remaining (100−T) % as the test set to evaluate the performance of the systems. This analysis helps to identify specific areas where the model may struggle, such as misclassification between event types with similar features. To perform a robust analysis of system performance based on the accuracy metric (%) and build confusion matrices, it is necessary to transform the information contained in the catalog into labels from which the study can be conducted. Since in experiments 1 and 2 we start with a seismic catalog that contains annotations for the start and end of each event present in each seismic signal, once the signals are preprocessed and windowed, we can associate a label with each window. In this way, each window can be analyzed based on its classification according to its label.
Finally, in experiment 3, where only partial knowledge of the earthquakes recorded during the crisis is available, the results evaluate the model's ability to generate a more comprehensive and reliable catalog. This catalog will serve as a basis for inferring potential volcanic dynamics, which is critical in real-world eruptive crisis scenarios.
The optimal RNN-LSTM configuration consists of a single hidden layer with 210 units and no dilations. For the Dilated-LSTM model, the configuration that yielded the best performance included three hidden layers, each with 50 units and 2–4 dilated recurrent skip connections per layer. The TCN model achieved optimal performance with 50 filters, a kernel size of 2, and dilation values of 8, 16, and 32. Only one residual block was used, as additional blocks are more suitable for longer sequences, such as waveforms with extensive time samples. Data normalization was performed using standard deviation normalization, where each feature was normalized by subtracting its mean and dividing by its standard deviation, calculated from the training set. The systems were optimized using stochastic gradient descent (SGD) with a fixed learning rate, ranging from 0.004 to 0.01, with the optimal learning rate found to be 0.001. To prevent overfitting, early stopping and L2 regularization were applied during training.
4.1 Developing automatic recognition systems through a transfer learning approach leveraging available catalogs
Table 4 shows the recognition results achieved by the systems after being trained on the POPO2002 catalog using a transfer learning approach. Since using a transfer learning approach allows for more efficient use of computational resources and the fine-tuning phase typically requires fewer resources than training a system from scratch, two experiments were conducted. These experiments considered five and seven seismic categories, each using 20 % and 40 % of the total data for the training set (T=20 and T=40). This means that the results were obtained using 80 % and 60 % of the data in the test partition, respectively. Table 5 summarizes the averaged normalized confusion matrices belonging to the test using five seismic categories and 40 % of the total data for the training set. The appendix provides additional information on both the F1-score metrics and the recognition confidence analysis to support and complement the main results presented in this section.
Table 4Self-consistency results using five and seven seismic categories, with 20 % and 40 % of the data for training and 80 % and 60 % for testing, respectively. The results correspond to the average accuracy over the four partitions. The values in bold indicate the best result for each model for each experiment.
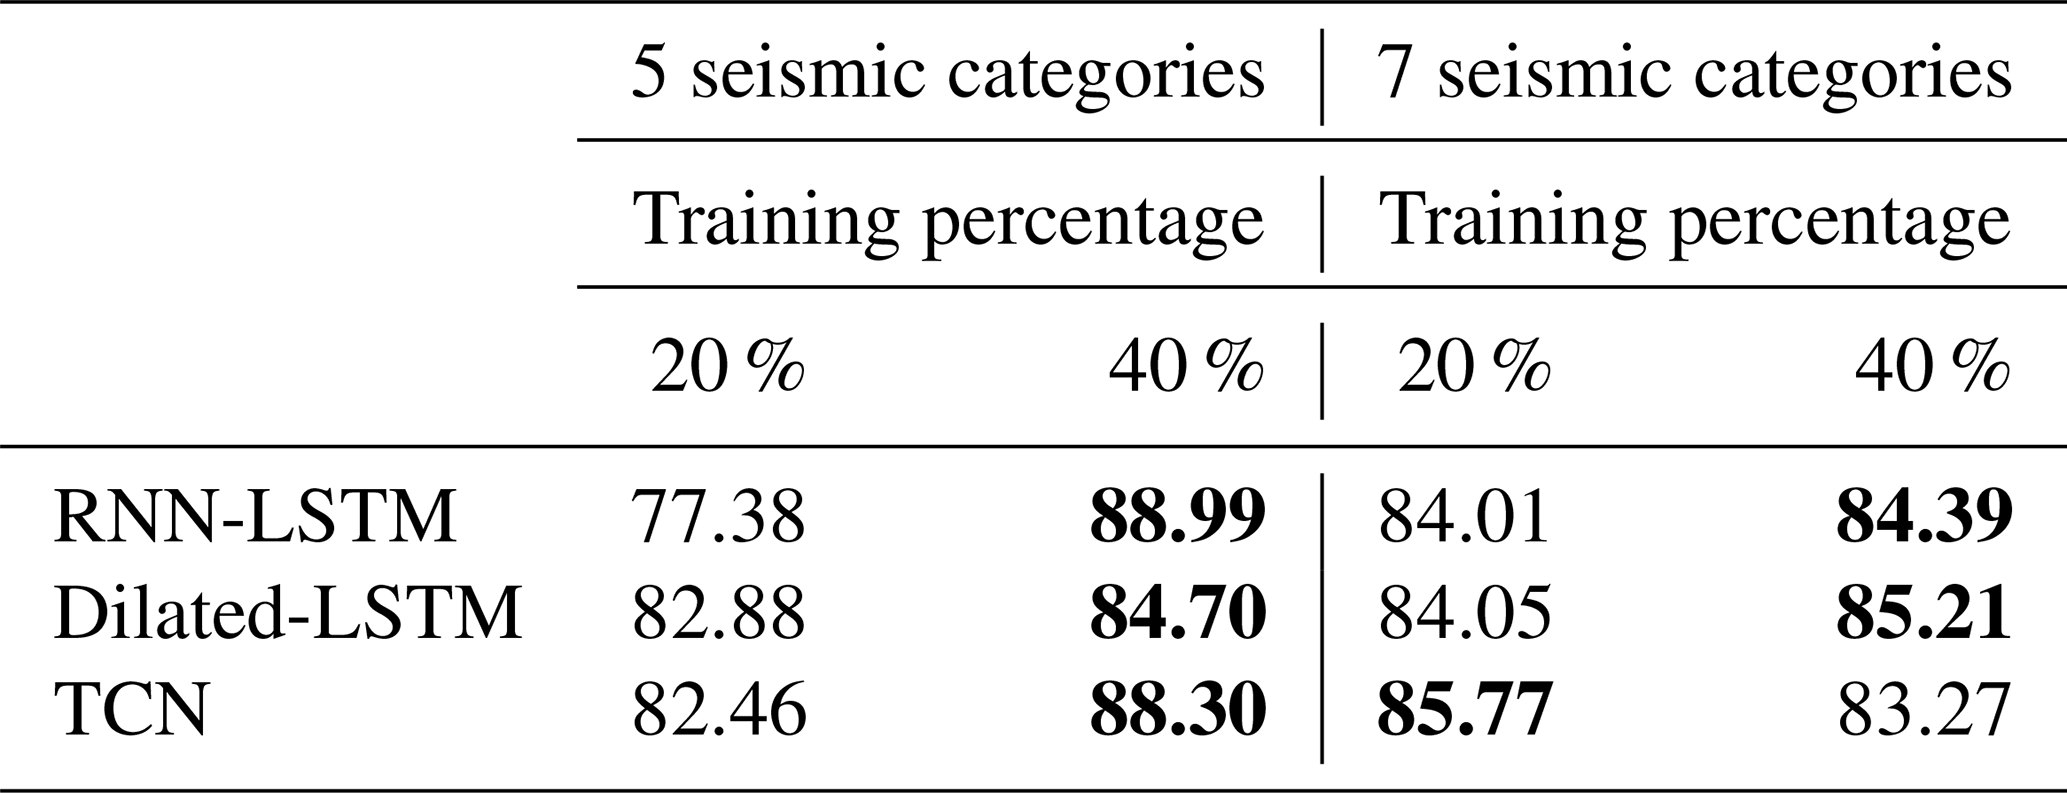
Table 5Averaged normalized confusion matrices associated with the leave-one-out cross-validation process for the POPO2002 dataset. These results belong to the test using five seismic categories. The values in bold mean the percentage of events properly classified.
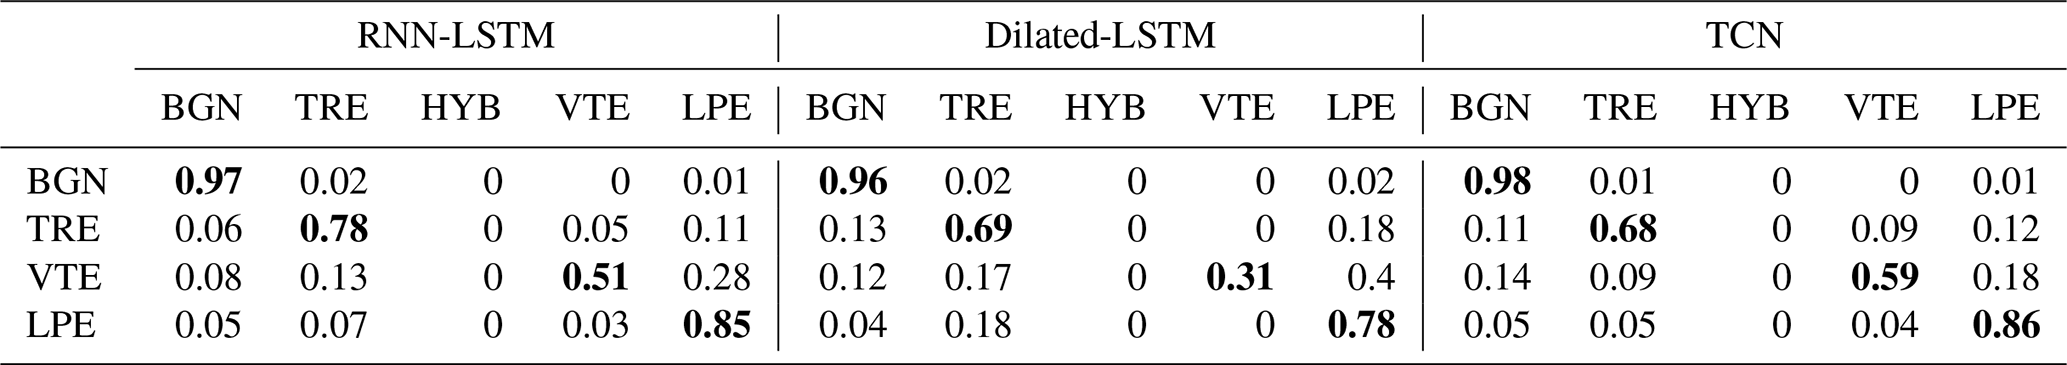
Table 6Classification accuracy (acc. %) on the test set achieved by the pre-trained systems, which were retrained using the proposed weakly supervised approach with the training partition set to 40 % of the total POPO2002 dataset and only five seismic categories.
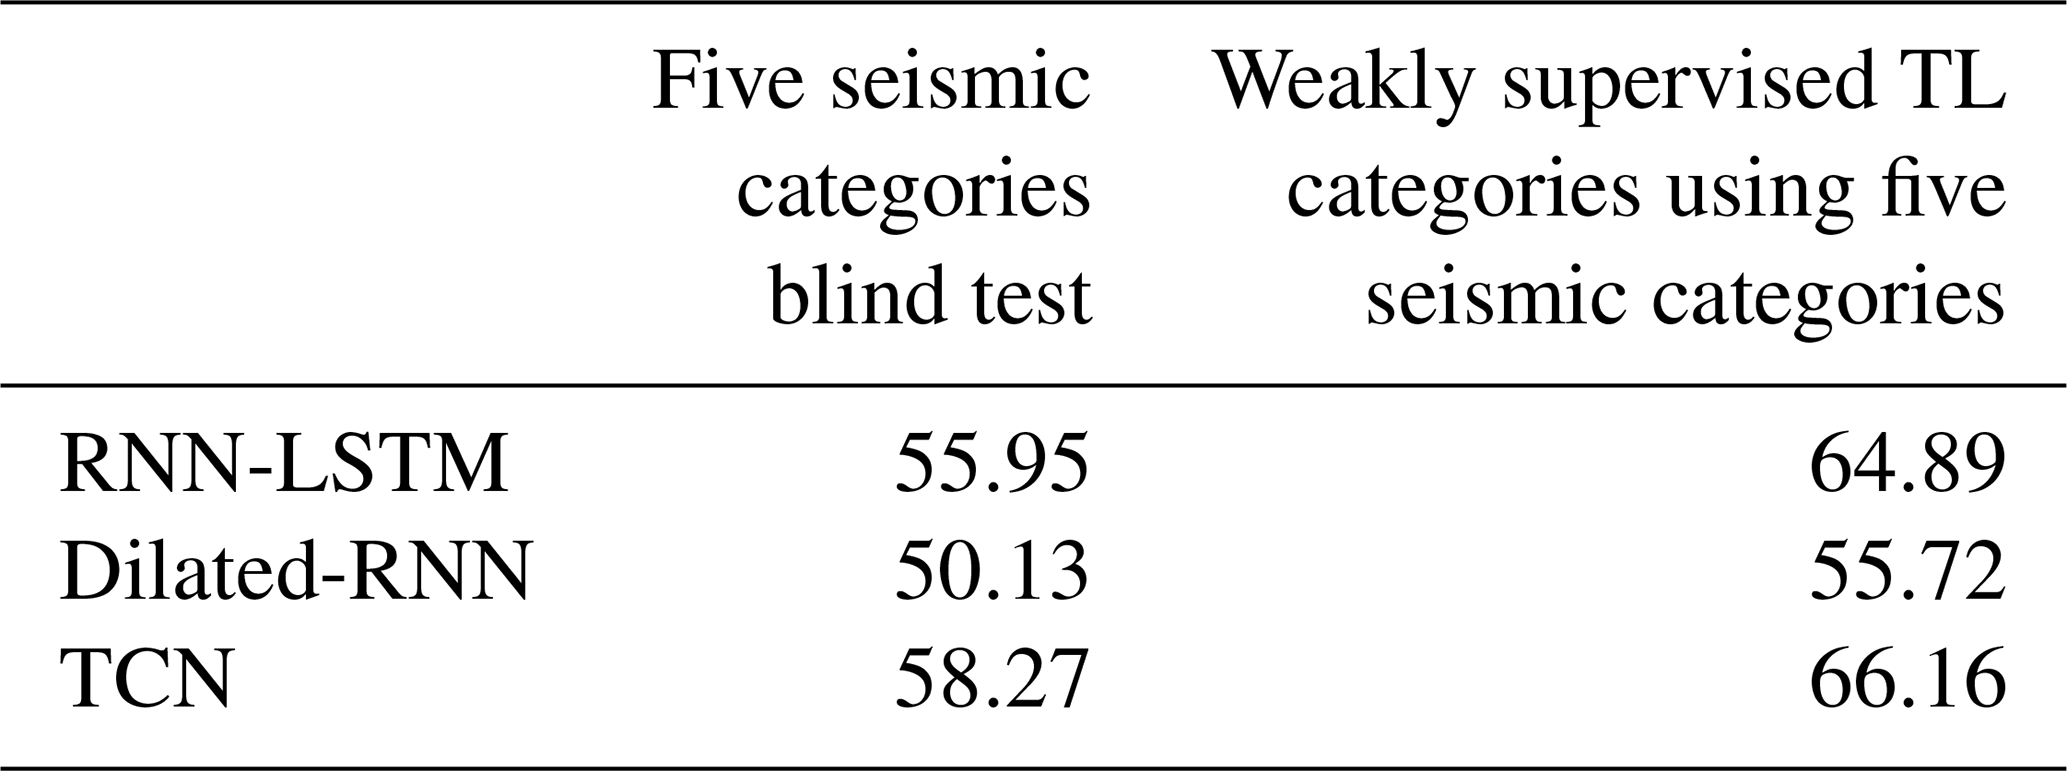
Table 7Normalized confusion matrices for the new retrained system using a weakly supervised approach, with the POPO2002 catalog as reference. The results are based on the whole test set using 40 % of the whole set for training and five seismic categories. The y-axis corresponds to the real label or ground truth, and the x-axis corresponds to predicted labels with the POPO2002 catalog as the reference. The values in bold mean the events properly classified according to the catalog available.
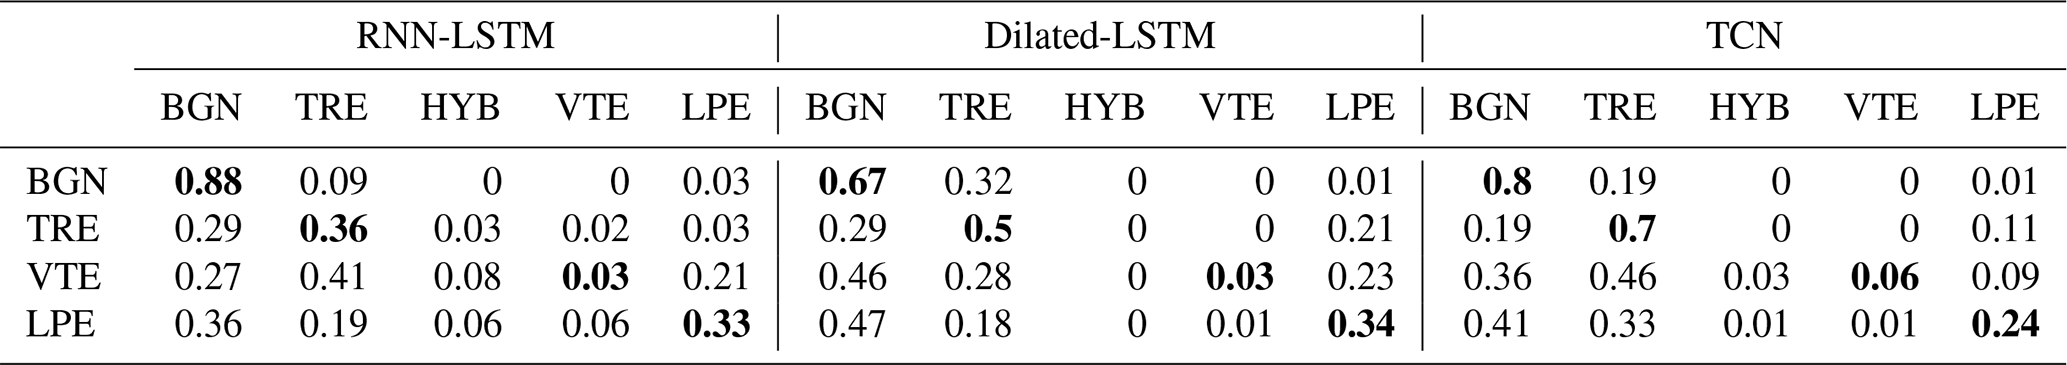
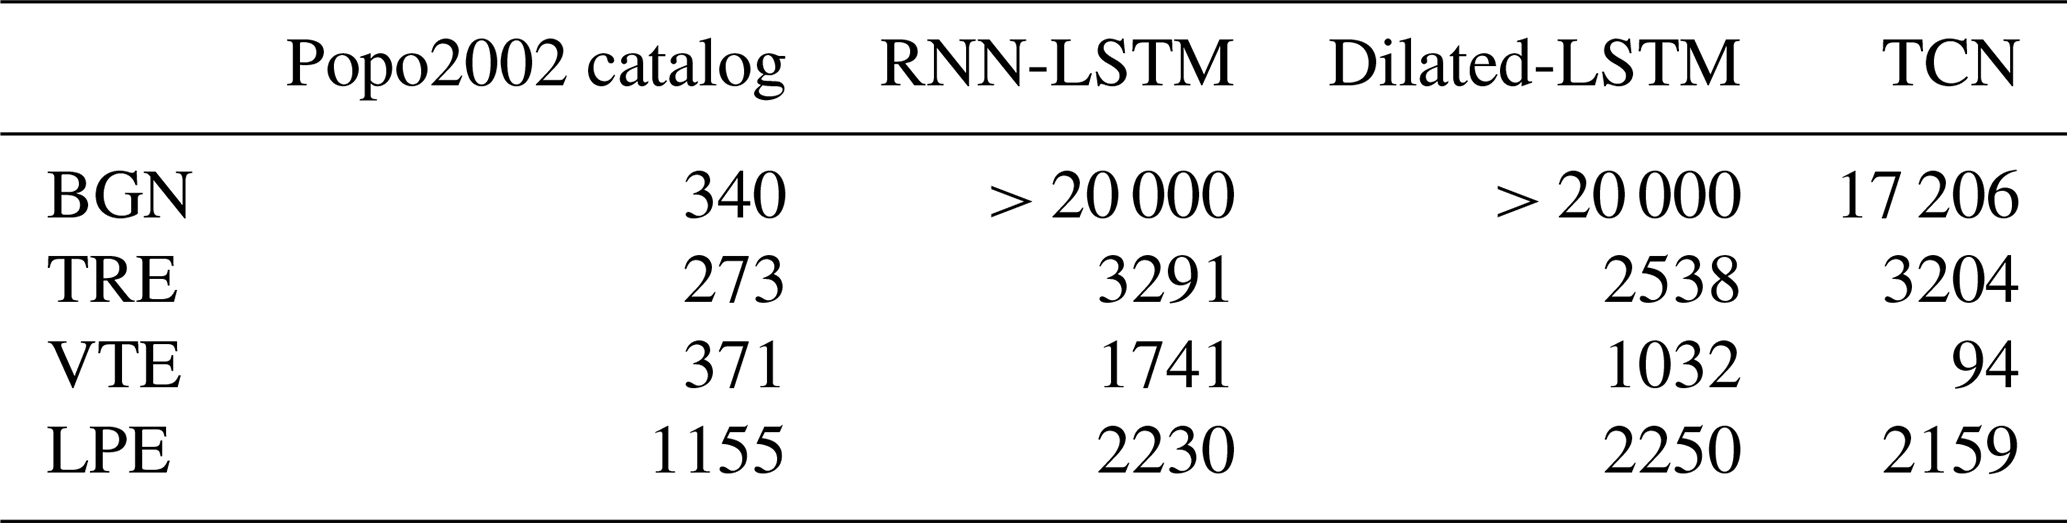
Table 8Comparison between the events initially annotated in the catalog and the events detected by the new automatic systems following the implementation of a weakly supervised approach.
4.2 Developing automatic recognition systems using the proposed weakly supervised pseudo-labeling approach
Table 6 presents the recognition accuracy achieved by the systems, which were retrained using the proposed weakly supervised approach with the training partition set to 40 % of the total POPO2002 dataset and a probability detection threshold set at 50 %. The first column of the table represents the results obtained by directly applying recognition with the pre-trained models. This column shows the degree of similarity between the original POPO2002 catalog and the pseudo-catalog constructed using the pre-trained systems as pseudo-labelers. The second column reflects recognition results compared to the original POPO2002 catalog after the systems have been retrained using the previously constructed pseudo-catalog. Table 7 summarizes the averaged normalized confusion matrices of the new systems based on the weakly supervised approach, with the POPO2002 catalog as the reference. The y-axis corresponds to the real label or ground truth, and the x-axis corresponds to predicted labels. Finally, Table 8 summarizes the comparison between the events initially annotated in the POPO2002 catalog and the events detected by the new automatic systems following the weakly supervised approach.
4.3 Building a new catalog during an eruptive crisis: the Tajogaite volcano use case, 2021
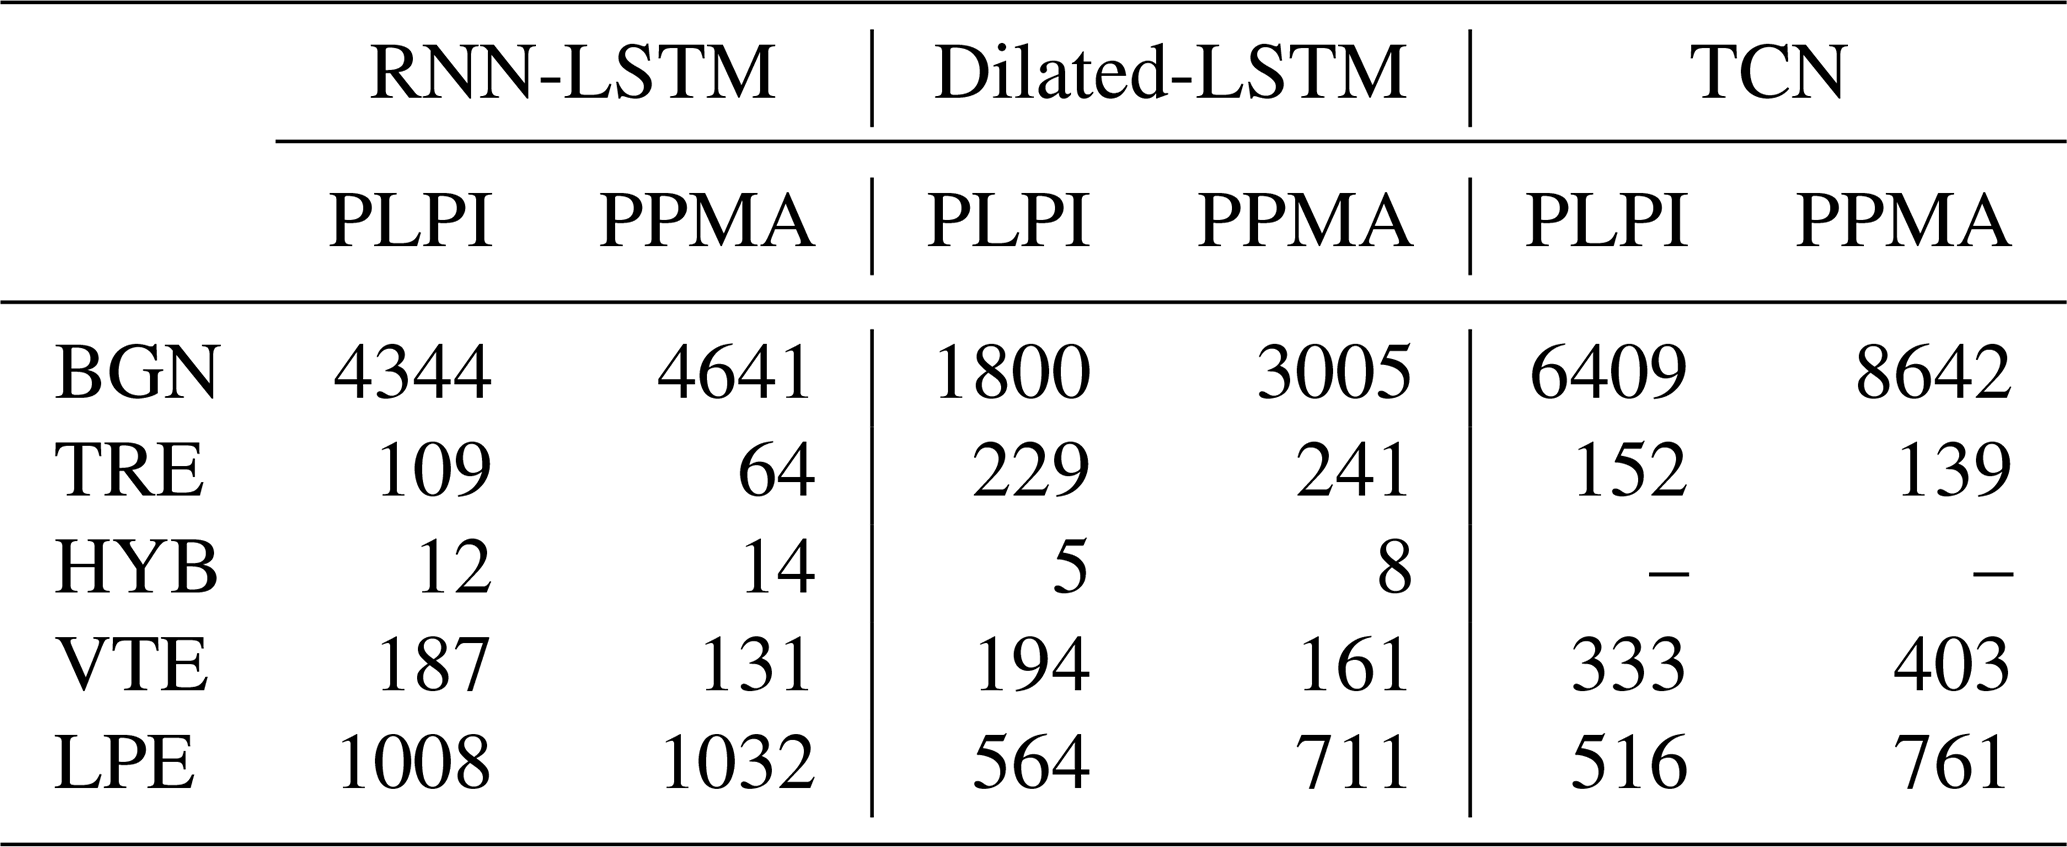
Table 9 shows the recognition results obtained in this experiment using 24 h seismic traces from the PLPI and PPMA stations on 12 September 2021 at Tajogaite volcano. On the analyzed day, experts manually annotated a total of 247 events, including both tectonic and volcanic earthquakes, which served as a reference for the subsequent analysis. It is important to highlight that these results correspond to an experiment where only a tentative earthquake catalog (constructed during the eruptive crisis under the urgency and challenges that such situations entail) is available. For this reason, to conduct a rigorous comparative analysis, we have included the recognition results from a widely used tool like PhaseNet (Zhu and Beroza, 2019).
Table 9Earthquakes recognized by the pre-trained reference models on the seismic traces recorded on 12 September 2021 at the PLPI and PPMA stations. Results are without considering the retraining process.
PhaseNet is a neural network-based system designed for automatic phase picking of seismic events. It detects and labels seismic phases and estimates the probability of each phase type (P and S) across the trace. After analyzing the two seismic stations, PLPI and PPMA, for 12 September 2021, 1173 P phases and 1518 S phases were obtained for PLPI, and 390 P phases and 522 S phases were obtained for PPMA.
5.1 Developing automatic recognition systems from available catalogs
The classical way to assess the robustness of an automatic recognition system is by evaluating its recognition accuracy across all events included in the catalog. Typically, a system with an average performance below 75 % is considered unreliable. However, this low performance is often not due to the system's ability to learn to distinguish between different events but rather results from the way the catalog is constructed. Specifically, if the seismic categories are not homogeneous and events of different natures are assigned to the same type, the system's performance will drop. If events classified as part of the same category are not consistent, the system will struggle to make accurate predictions, as the inherent variability within each type undermines the learning process. Therefore, Tables 4 and 5 not only provide information about the reliability of the developed systems but also about the consistency of the catalog itself.
According to such results, the systems are shown to achieve a high degree of recognition in both experiments (including five and seven seismic categories), allowing us to conclude that the systems effectively learn to recognize the events annotated in the catalog. It is worth noting, however, that in the second experiment, with seven seismic categories, the recognition rate of the three systems is slightly affected. This result is clearly influenced by the imbalance in the dataset. The seismic category explosion (EXP), with only four events, has no impact on the outcome. In contrast, the inclusion of the garbage (GAR), with 2739 events of varying durations, significantly changes the system's performance. Firstly, because it is the predominant category in terms of both number and duration, performing an analysis by windows results in a considerable increase in labels of this type, biasing system learning. Secondly, the spectral characteristics describing GAR events are very similar to those of BGN events. The former represents a set of events without a clear definition, while the latter represents seismic noise. Therefore, including both in the training process leads the systems to confuse the two, with GAR emerging as the more dominant category due to its imbalance.
Regarding the confusion matrices across the three systems, the analysis suggests that the POPO2002 catalog is consistent and that, within each seismic category, there is coherence among the elements classified within the same category. However, propagation and source effects can influence seismic event characterization. For instance, VTE events are not well identified, with confusion rates exceeding 40 % in some cases, meaning only 50 % of VTE events are accurately classified. The highest confusion levels are observed between the VTE and LPE categories, possibly due to shared characteristics, as LPE events may resemble highly attenuated VTEs, causing potential biases in event categorization. This overlap indicates that certain seismic categories contain elements located in overlapping regions of the representation space, the space in which data points are mapped based on learned features. These elements share similar projected characteristics, and as a result, events assigned to a specific cluster could potentially transition between categories (similar to MASTER-DEC and described in Fig. 3). Thus, although system performances range between 85 % and 90 %, this does not always reflect a complete or unbiased seismic catalog. Rather than solely learning to characterize volcano dynamics based on an underlying physical model, the systems may be learning the information contained within the catalog itself. Consequently, catalog-induced learning could limit a system's ability to generalize, potentially obscuring information relevant to advancing our understanding of volcanic behavior.
5.2 Developing automatic recognition systems with weakly supervised pseudo-labeling
Results demonstrate that, when applied effectively, these methods can significantly improve the detection and identification of diverse earthquake-volcanic signals. According to Table 6, using pre-trained systems as pseudo-labelers results in a substantial decrease in overall performance compared to building automatic monitoring systems from available catalogs (Table 4). However, a closer inspection of Table 8 shows other aspects of the performance that are very encouraging.
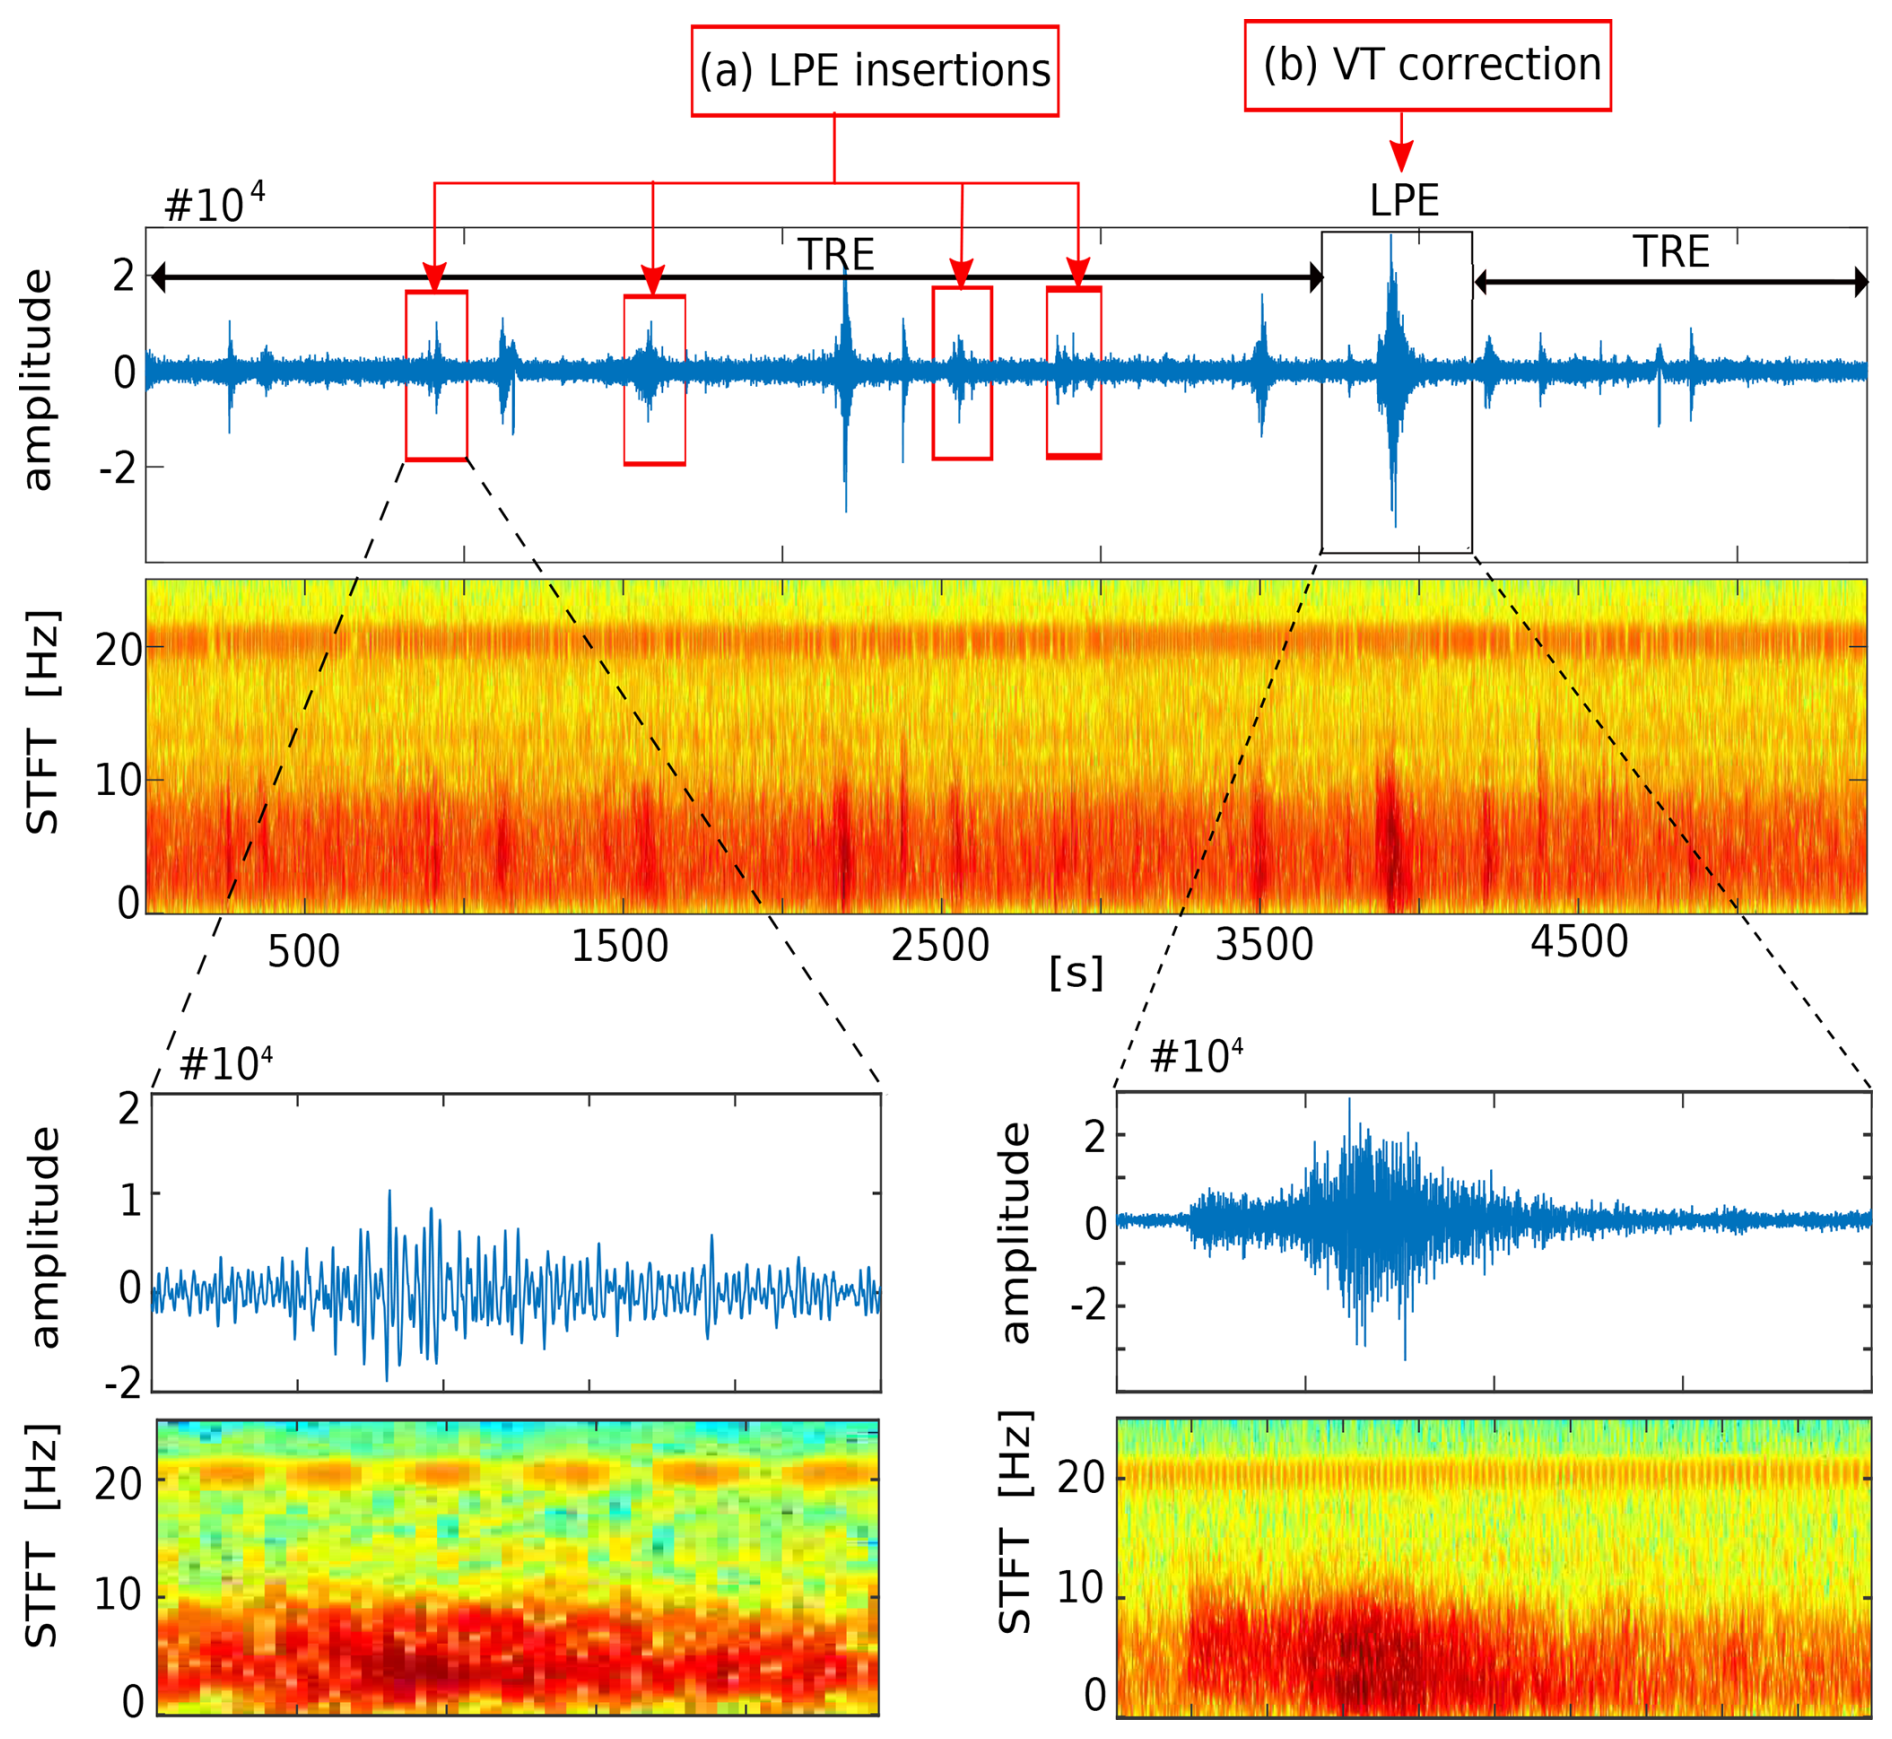
Figure 4Insertion-based errors when retraining systems using a weakly supervised approach: First, detection of LPE events (red boxes) that were initially overlooked during the labeling process within a trace labeled as TRE–LPE–TRE. Second, correction of an event originally labeled as LPE, which the system now relabels as VTE. This scenario occurs frequently throughout the dataset, and these additions reduce per-frame recognition accuracy compared to the original labeling; however, they do not always indicate errors. The blue color corresponds to the minimum energy, while the red color corresponds to the maximum energy.
First, the new systems recognized events that were originally not annotated in the preliminary catalog during data labeling. The vast majority of such recognized events were discovered within long segments labeled as GAR or TRE. An example of this behavior can be seen in Fig. 4, which shows LPE events (red boxes) that were not initially annotated during labeling within a trace labeled as TRE, along with the correction of an event originally labeled as LPE, which is now relabeled by the system as VTE. This scenario occurs many times throughout the dataset, and these additional labels reduce overall recognition accuracy relative to the original labeling, although they do not necessarily represent errors.
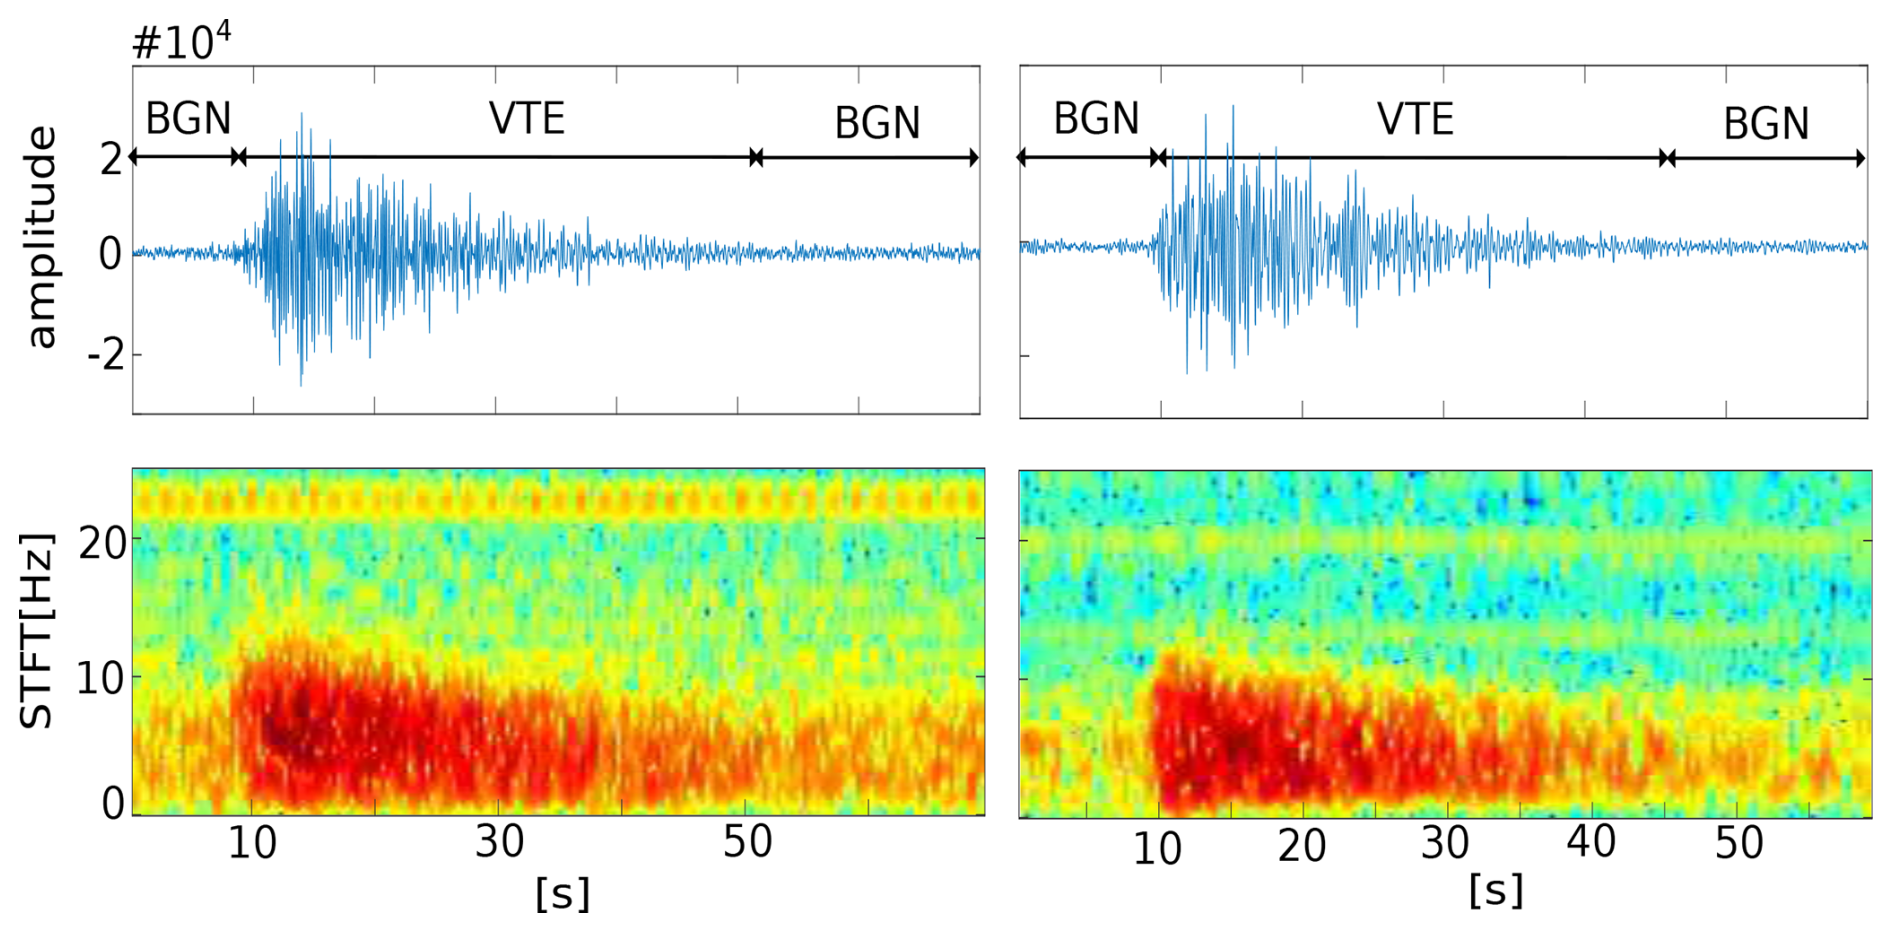
Figure 5Insertion-based errors when retraining systems using a weakly supervised approach. Event delimitation: examples of the labeling process by the systems. Instead of recognizing entire seismic traces such as volcano-tectonic earthquakes (VTE) as annotated in the original catalog, the systems detect background noise (BGN) segments before and after the earthquakes. These additional detections reduce per-frame recognition accuracy; however, after a posterior revision, they should not be considered errors. The current color map in the spectrogram represents the energy levels. The blue color corresponds to the minimum energy, while the red color corresponds to the maximum energy.
Second, among the seismological community, there is a marked interest in associating different types of seismo-volcanic signals with models of seismic sources in order to better understand the physics of the underlying processes. At present, there are two main complementary lines of research within volcano seismology: a) the detection and identification of different types of volcanic events and b) the investigation of physical source models that explain the origin of these signals. As scientific knowledge has advanced, a paradoxical situation has developed: there is a lack of uniformity in the naming of observed seismic signals. Therefore, the subjectivity of human operators during the labeling process can lead to discrepancies in catalog construction. As a result, catalogs and automatic recognition outcomes often vary across different volcanoes and researchers, which ultimately reduces the system's ability to be universally applied and impacts its performance. A clear example of this discrepancy can be seen in Table 7. Based on that table, on average, only 5 % of the analysis windows labeled as VTE in the original catalog were identified by the retrained systems. On initial inspection, these results might suggest poor system recognition for this seismic category, but interestingly, it is one of the most distinctive events due to its high-frequency content and exponential energy decay. So, what accounts for the low recognition rate? A detailed analysis shows that it is mainly due to labeling discrepancies between the MASTER-DEC event prototypes and the POPO2002 catalog annotations. On the one hand, the start and end points of some events are often marked in positions that differ significantly from those annotated by the automatic systems. Instead of recognizing entire seismic traces such as volcano-tectonic earthquakes (VTE) as annotated in the original catalog, the systems detect background noise (BGN) segments before and after the earthquakes. While segments with high spectral content were detected and classified as VTE, those with low spectral content were classified as BGN or TRE. These additional detections reduce per-frame recognition accuracy. This can be clearly seen in Fig. 5 in earthquake recognition.
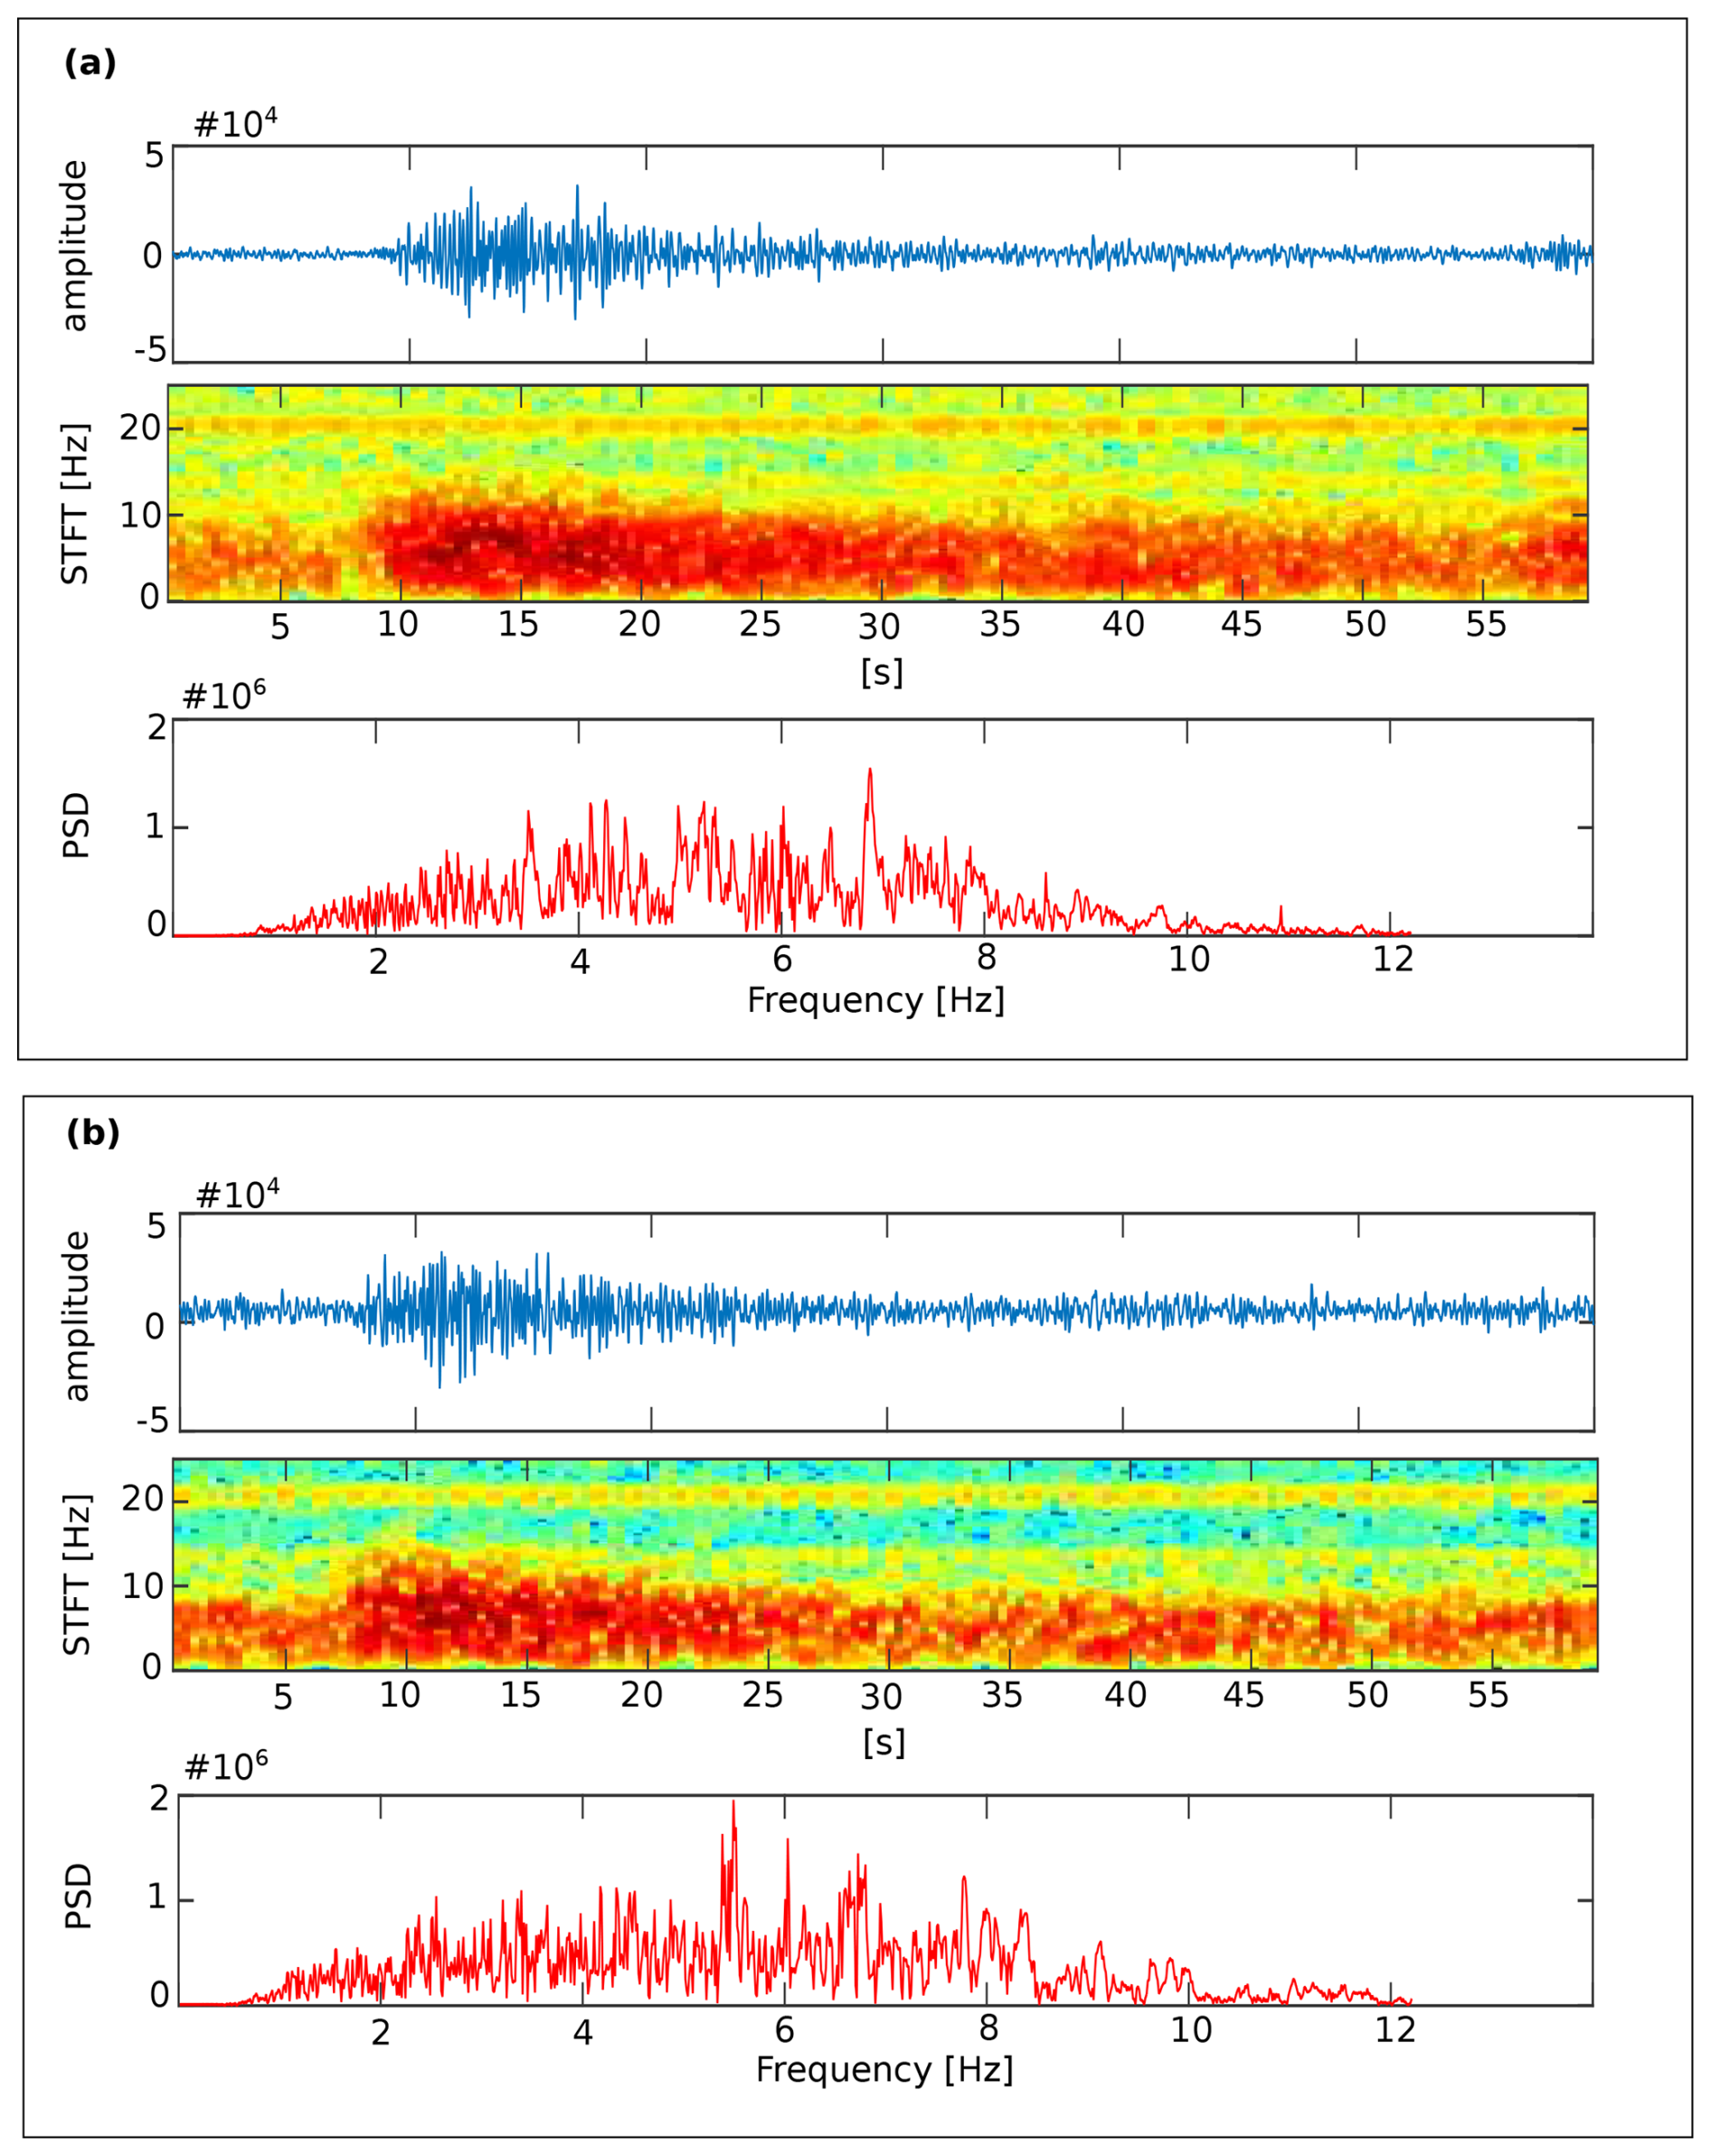
Figure 6Two examples of events annotated as VTE in the POPO2002 catalog being recognized as TRE by the classifiers. The current color map in the spectrogram represents the energy levels. The blue color corresponds to the minimum energy, while the red color corresponds to the maximum energy. The PSD reflects the distribution of signal energy among the frequencies.
On the other hand, the VTE prototype events used in MASTER-DEC have very specific characteristics. However, some of the VTE events labeled in POPO2002 do not reliably share these characteristics. This may be due to the fact that catalogs are often constructed using data from multiple seismic stations, with strong attenuation and source effects, while imposing rules or conditions for identifying signals. Therefore, the original labeling of an event does not always align with the waveform and spectral content of the analyzed signal, as it may vary depending on the station being analyzed. As a result, if the signal being analyzed does not align with the characteristics of the prototype event used to construct the system, the signal will be labeled or associated with the event prototype that most probabilistically resembles it. This behavior reduces the recognition rate for this seismic category. Figure 6 illustrates this behavior, showing two examples of events annotated as VTE in the POPO2002 catalog that are recognized as TRE by the systems. The power spectral density (PSD) of both events shows clear content in low and intermediate frequencies (1–12 Hz), perfectly aligning with the source model proposed by Ibáñez et al. (2000), as shown in Table 1, which is also used by MASTER-DEC. Similar to the previous analysis, this behavior is repeated throughout the database, not only with TRE but also with LPE events, which explains the high degree of confusion addressed. A potential solution to this situation would be to apply the algorithm to different stations.
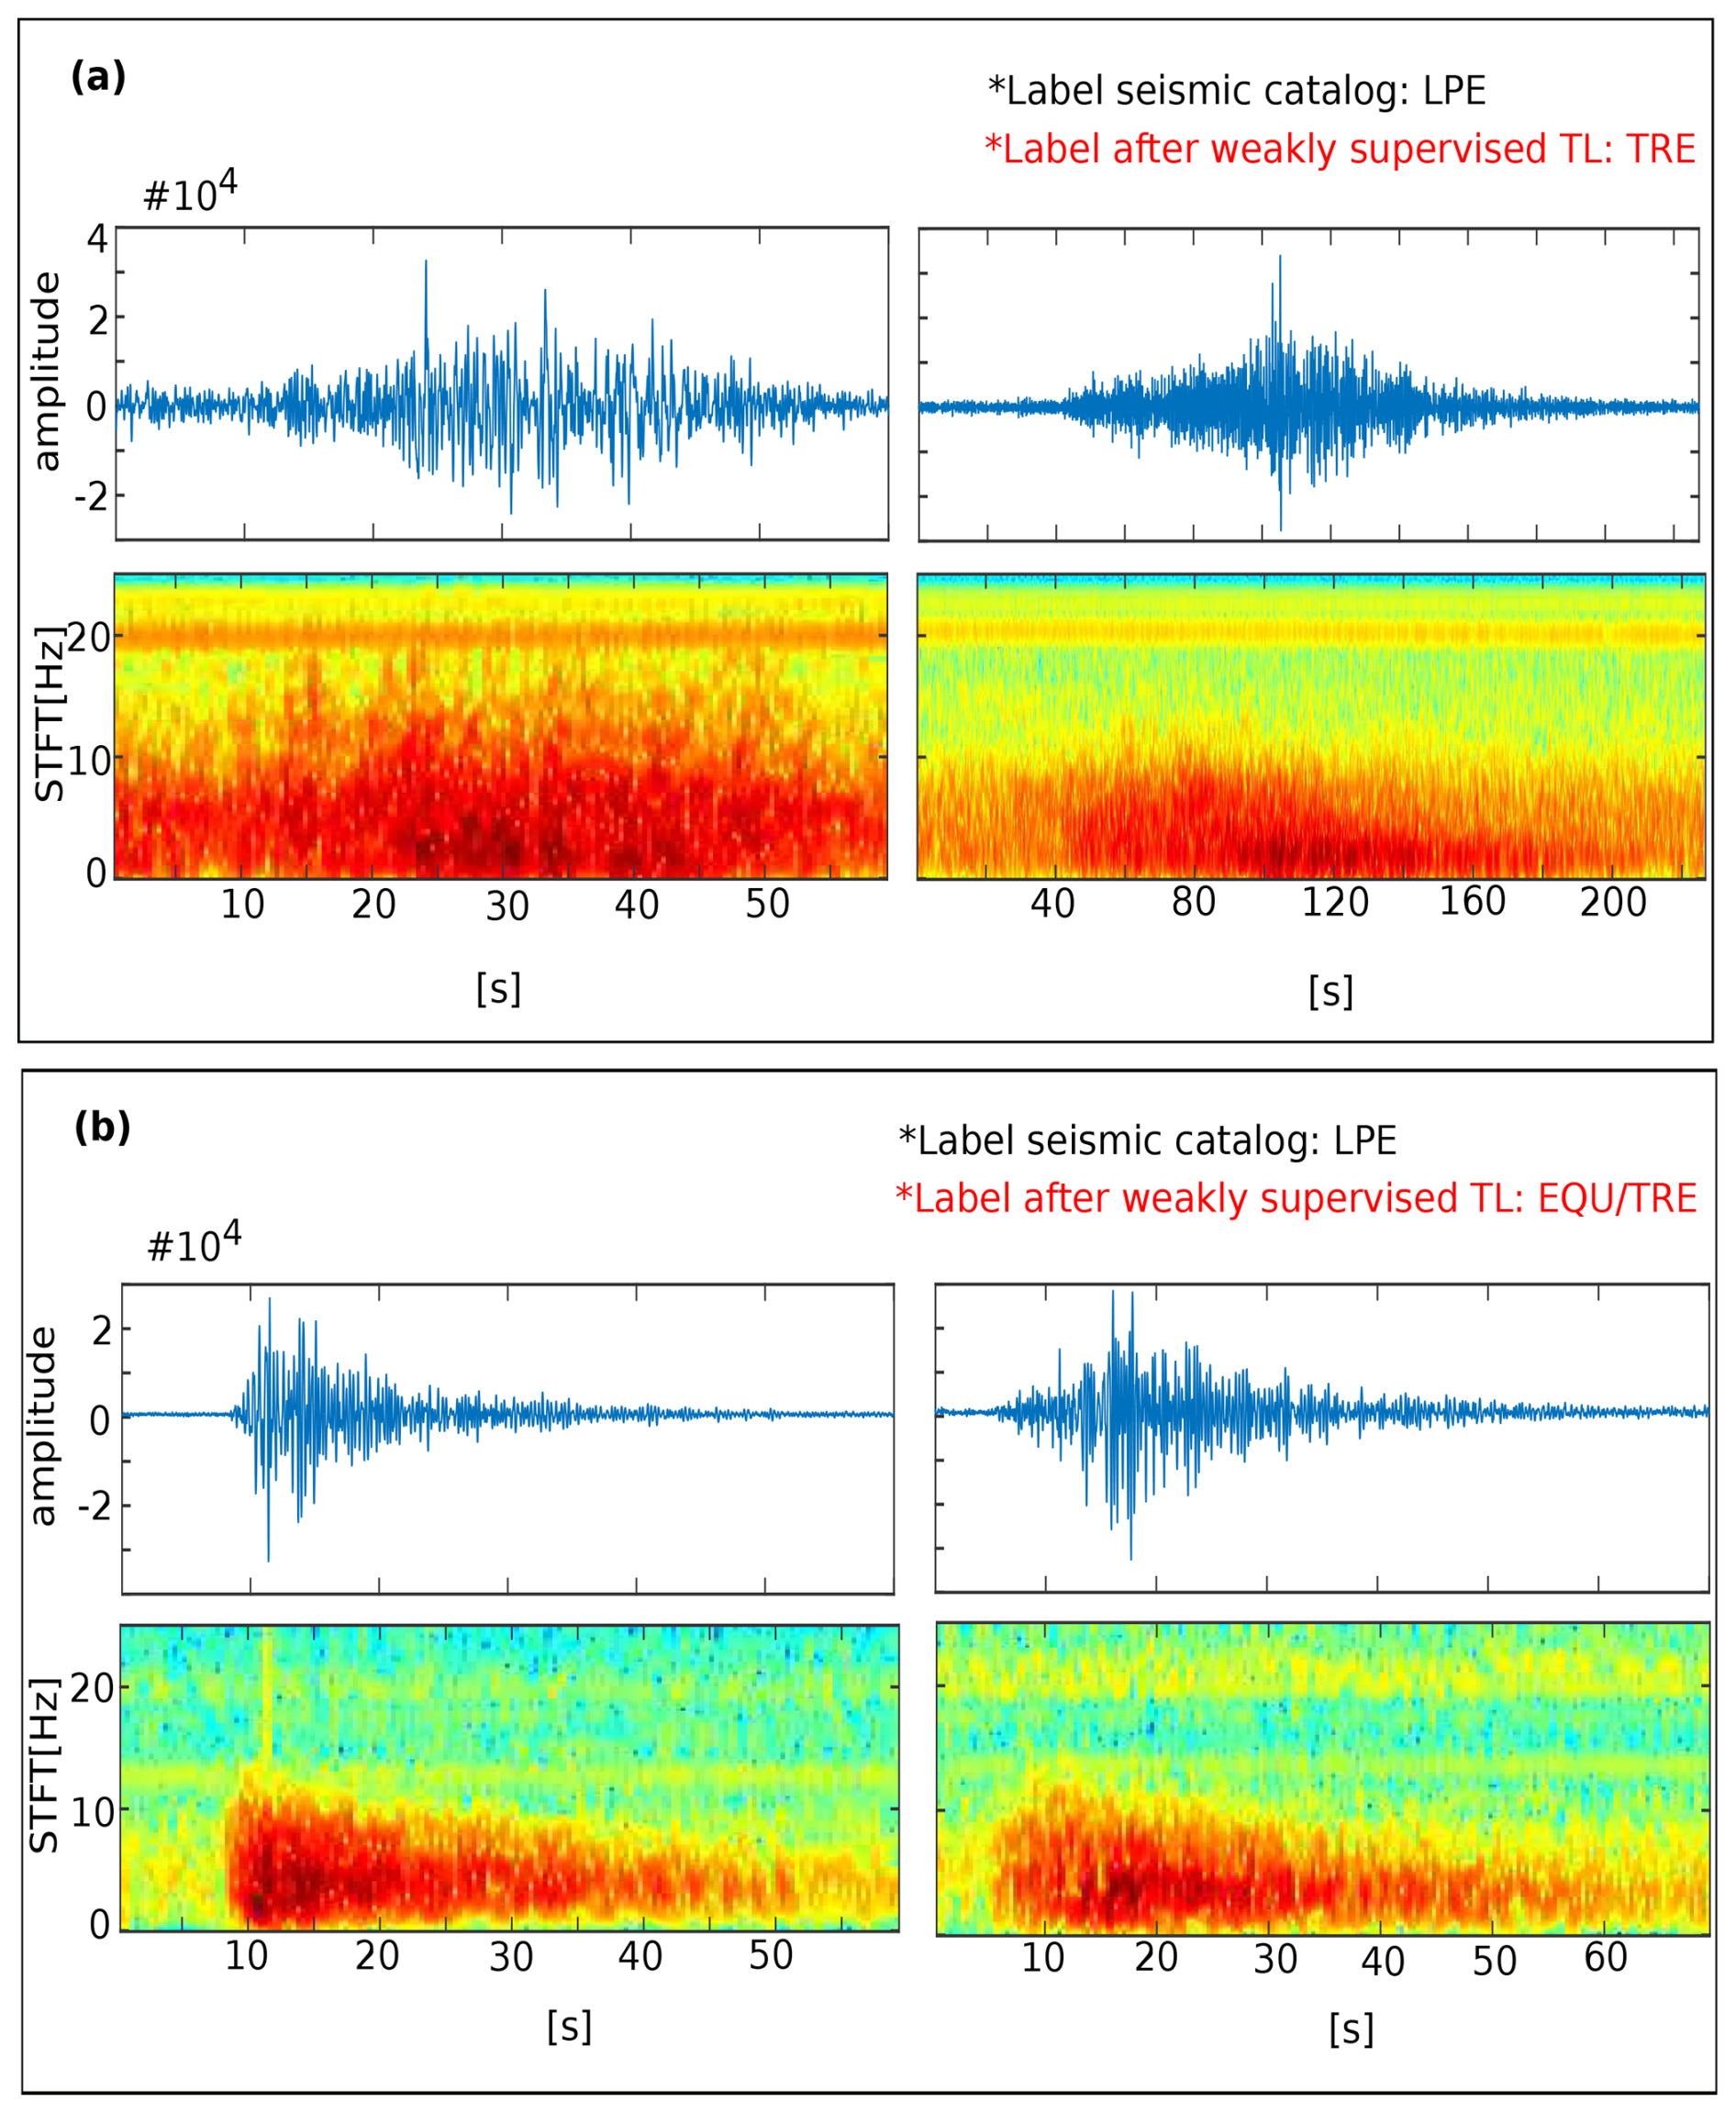
Figure 7Detailed analysis of intra-class variability and attenuation-based errors when applying a weakly supervised approach. (a) Intra-class variability-based errors: some long period event (LPE) subcategories in POPO2002 are very close to the representation of tremor (TRE) in MASTER-DEC. Therefore, they were classified as TREs. (b) Two attenuated earthquakes labeled as LPE in the seismic catalog now reclassified as volcano-tectonic earthquake (VTE) and Tremor (TRE). The current color map in the spectrogram represents the energy levels. The blue color corresponds to the minimum energy, while the red color corresponds to the maximum energy.
Third, intra-category variability can also affect the overall recognition of the systems. The new dataset exhibits high variability within certain categories, where events with distinct characteristics but shared features are grouped together. For example, different LPEs, TRE events, and regional or volcano-tectonic earthquakes. Within the feature space, the representation of events belonging to a given subcategory in the new domain (POPO2002) was closely related to the representation of events belonging to a different category in the source domain (MASTER-DEC). For example, similar to what occurs with some events in Fig. 3, the representations of some LPEs in POPO2002 are very close to the representations of TRE in MASTER-DEC (Fig. 7a). As such, the algorithm assigns the TRE label during the training phase. This decreased the overall system performance since many frames (33 %, 19 %, and 18 % for TCN, RNN-LSTM, and Dilated-LSTM, respectively) were detected as TRE. The same issue arose for some attenuated earthquakes, which were labeled as LPE in the original seismic catalog but classified as VTE or TRE since, even when attenuated, they align with the feature space representation of an earthquake event in MASTER-DEC (Fig. 7b). Finally, low-energy TRE events were clearly misclassified as BGN because the peak-to-peak amplitude degradation of the signals was related to attenuation effects. This complex scenario was widely discussed by Titos et al. (2018b); therefore, to correctly deal with these errors, further information from several seismic stations is needed.
The results suggest that overall recognition can be strongly biased by the intrinsic limitations encountered when developing the seismic catalog and from which the comparative metrics were obtained. Therefore, if labeling criteria between datasets differ, per-frame recognition results will vary widely. Until now, the development of new monitoring systems has focused primarily on improving existing recognition rates. However, our findings confirm that by leveraging an existing unbiased master catalog, we can incorporate prior knowledge into the new dataset under review. Using automatic pseudo-labelers has the remarkable capability of simultaneously identifying unannotated seismic traces in the catalog and helping to correct the labels of misannotated seismic traces. Although the general performance of the system seems to decrease relative to the original catalog, unannotated information that can improve knowledge of the volcanic dynamic background can still be obtained.
5.3 Building a new catalog during an eruptive crisis: the Tajogaite volcano use case, 2021
This experiment considered the seismic traces from two stations, PLPI and PPMA, for 12 September 2021, a few days before the eruption of Tajogaite volcano began. On this day, given the volcanic activity and monitoring conditions, only 247 earthquakes, both tectonic and volcanic, were annotated in the catalog.
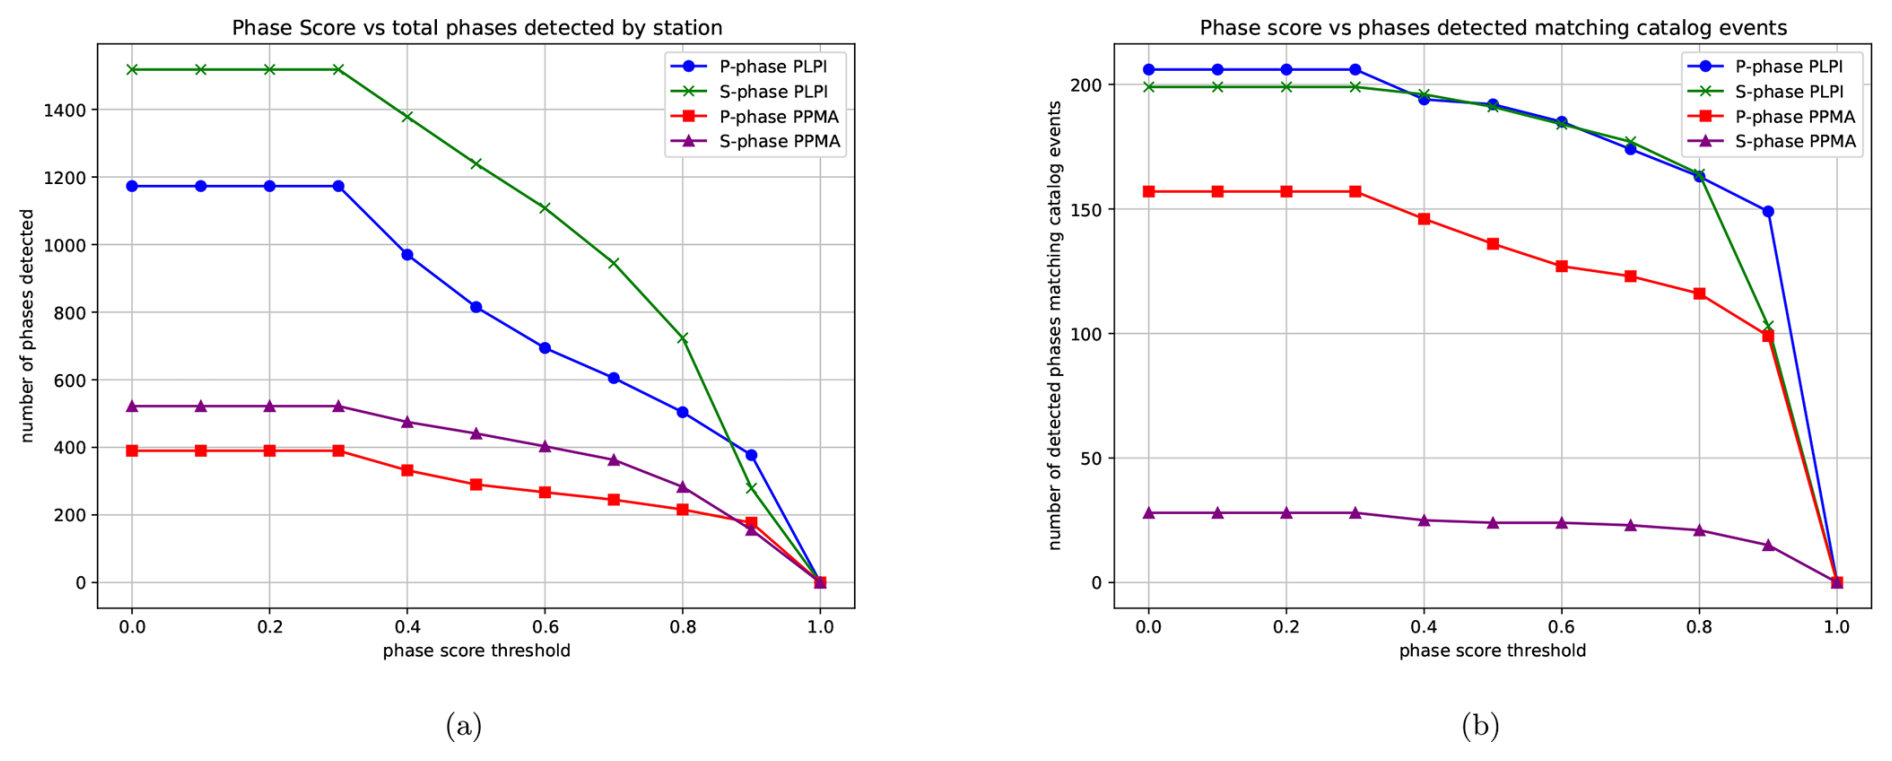
Figure 8Evolution of the number of detected phases at the seismic stations as the phase score threshold varies using PhaseNet. (a) Total number of phases detected at both stations. (b) Number of phases matching the 247 events recorded in the LAPALMA2021 catalog on 12 September 2021.
For the sake of comparison, we will begin analyzing the outcomes obtained by PhaseNet. PhaseNet detected several hundreds of P and S phases, with the number of S phases being higher at both stations. This is due to the greater energy associated with these waves. However, as can be seen in Fig. 8a, when fixing a phase score threshold highlighting the reliability of the detections, the number of detections decreases rapidly with high values. For example, for values close to 80 %, only approximately 722 P phases and 503 S phases at PLPI and 282 P phases and 216 S phases at PPMA are detected. This significantly reduces the number of potential events that could be included in the catalog. Figure 8b shows the match between detections and the cataloged events. Of these 247 annotated events, PhaseNet detects 206 P phases and 199 S phases at PLPI and 157 P phases and 28 S phases at PPMA, all without applying any probability threshold. Again, when setting the phase score threshold greater than or equal to 80 %, the detections decrease to 163 P phases and 164 S phases at PLPI and 116 P phases and 21 S phases at PPMA. This behavior underscores the complexity of constructing seismic catalogs, because even when focusing solely on seismic phase detections, there is no consistent criterion for agreement between human operators and advanced automatic systems. More importantly, even when considering the inclusion of these potential events, extensive human supervision would be required to validate and categorize them.
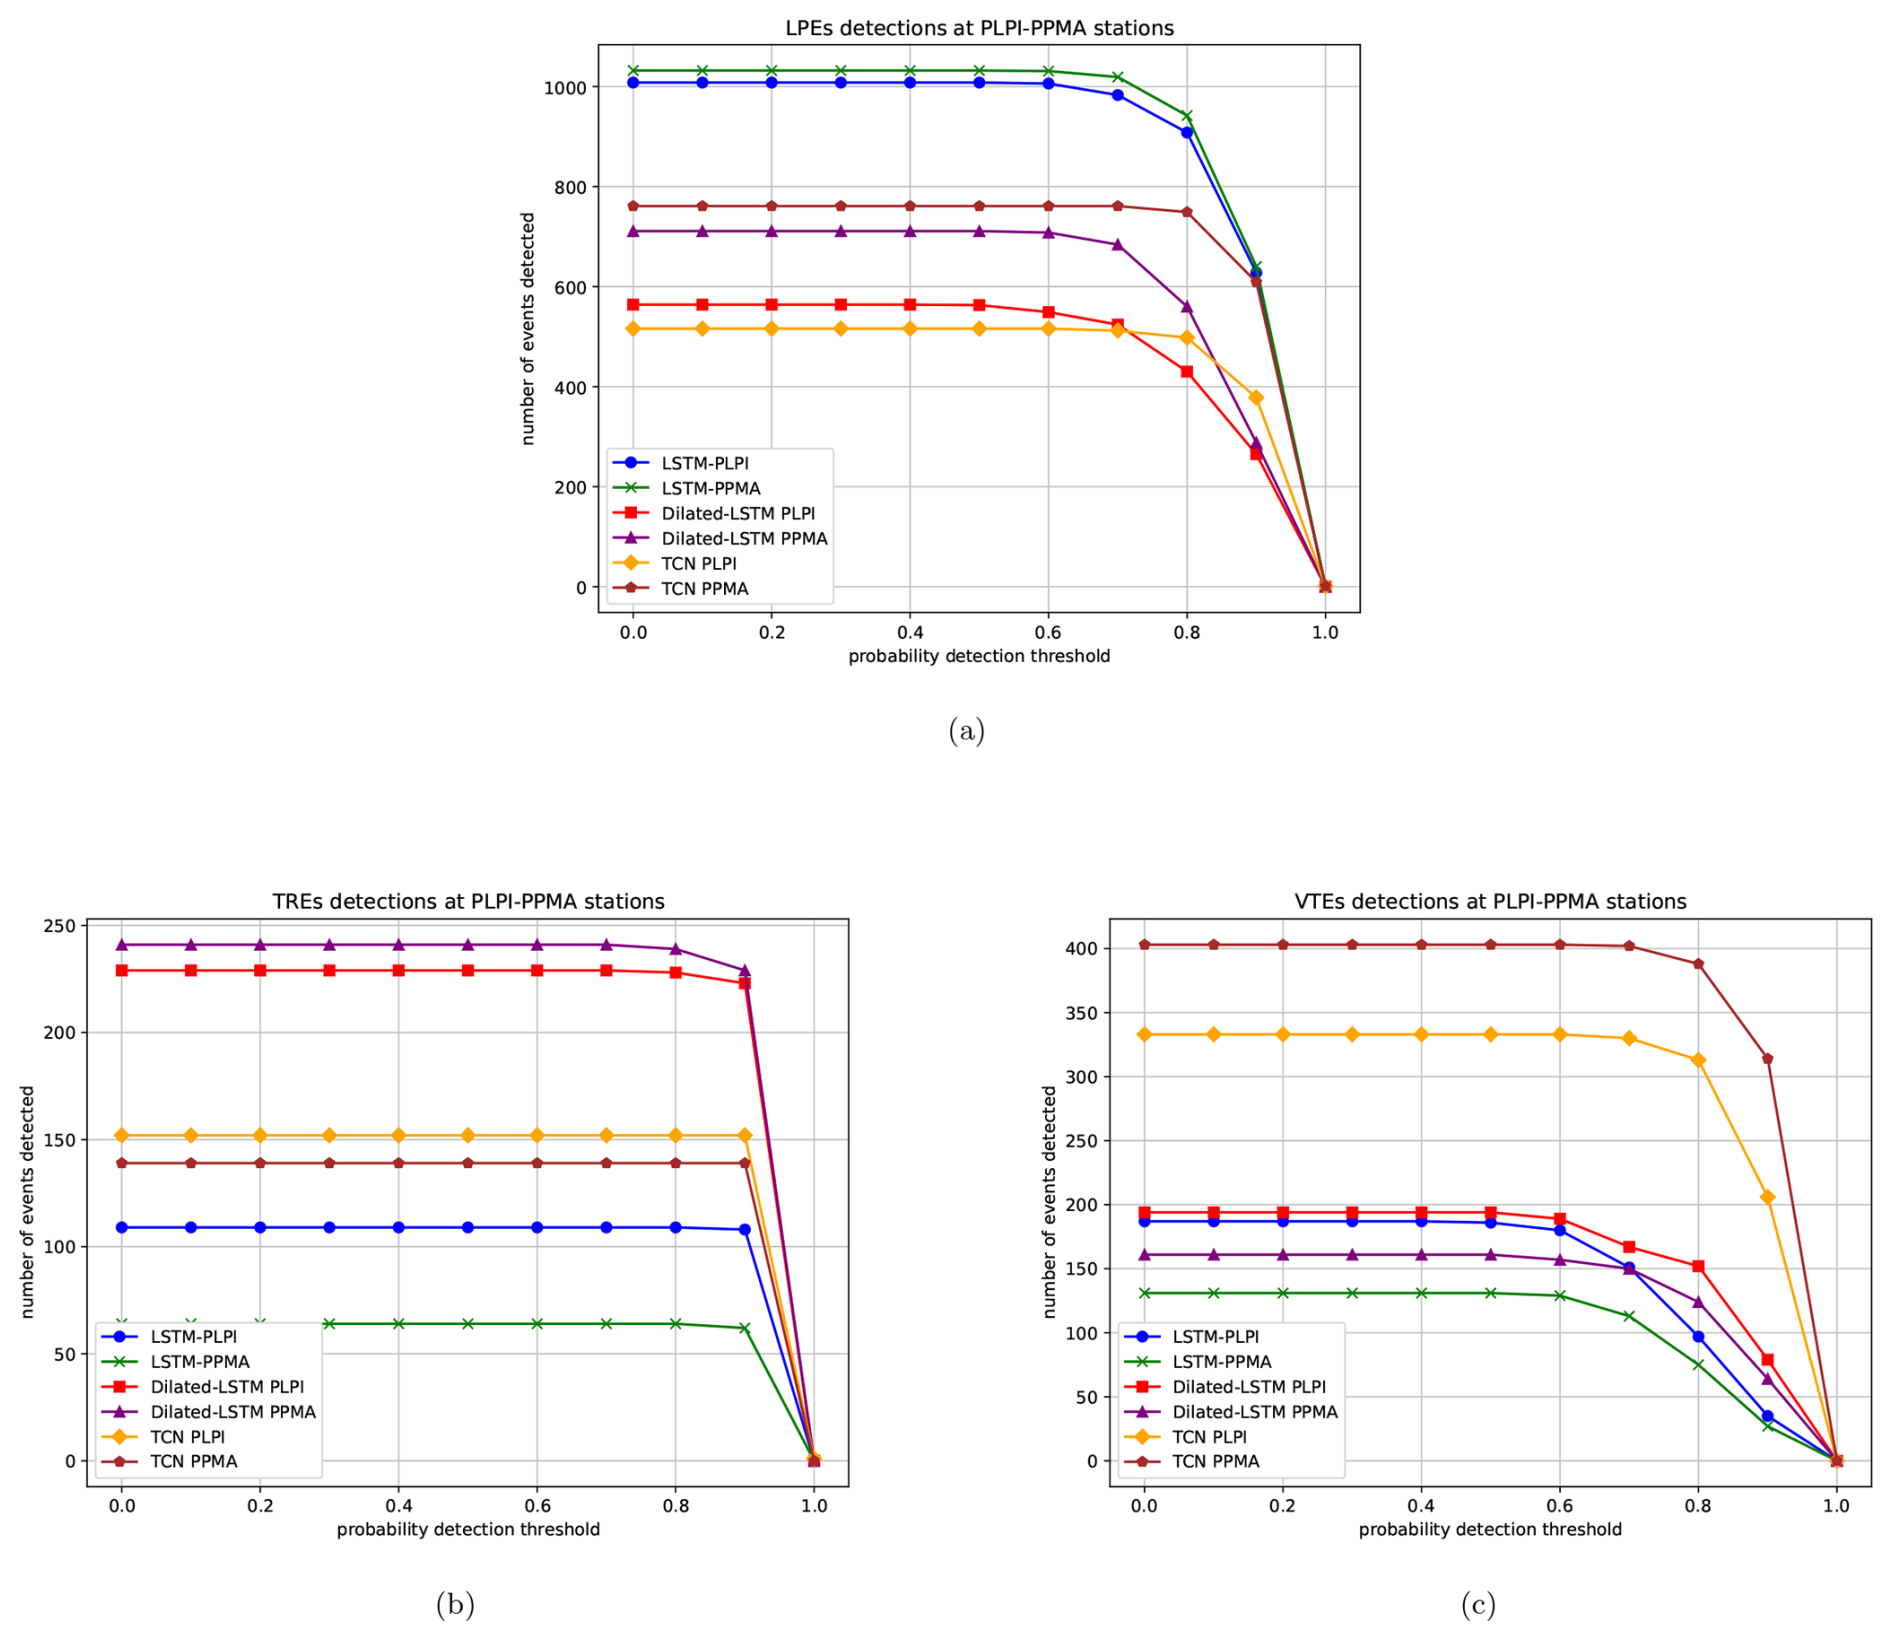
Figure 9Evolution of the number of detected events at the seismic stations as the belonging probability threshold varies using PhaseNet. (a) Total number of LPEs detected at both stations. (b) Total number of TREs detected at both stations. (c) Total number of VTEs detected at both stations.
Looking at the recognition results obtained by the pre-trained reference systems in Table 9, it can be observed that a large number of events are being detected. However, similar to PhaseNet, some of these events should be discarded for the sake of reliability in recognition. Figure 9 depicts such reliability based on the belonging probabilities outputted by the systems. To explore these results, we will: (1) analyze how the number of detections varies as reliability changes, with a focus on more specific or sensitive systems; (2) evaluate the performance of the systems using the 247 events annotated in the catalog as a reference; and (3) assess the reliability of the remaining detected events to evaluate the reliability of the new pseudo-catalogs.
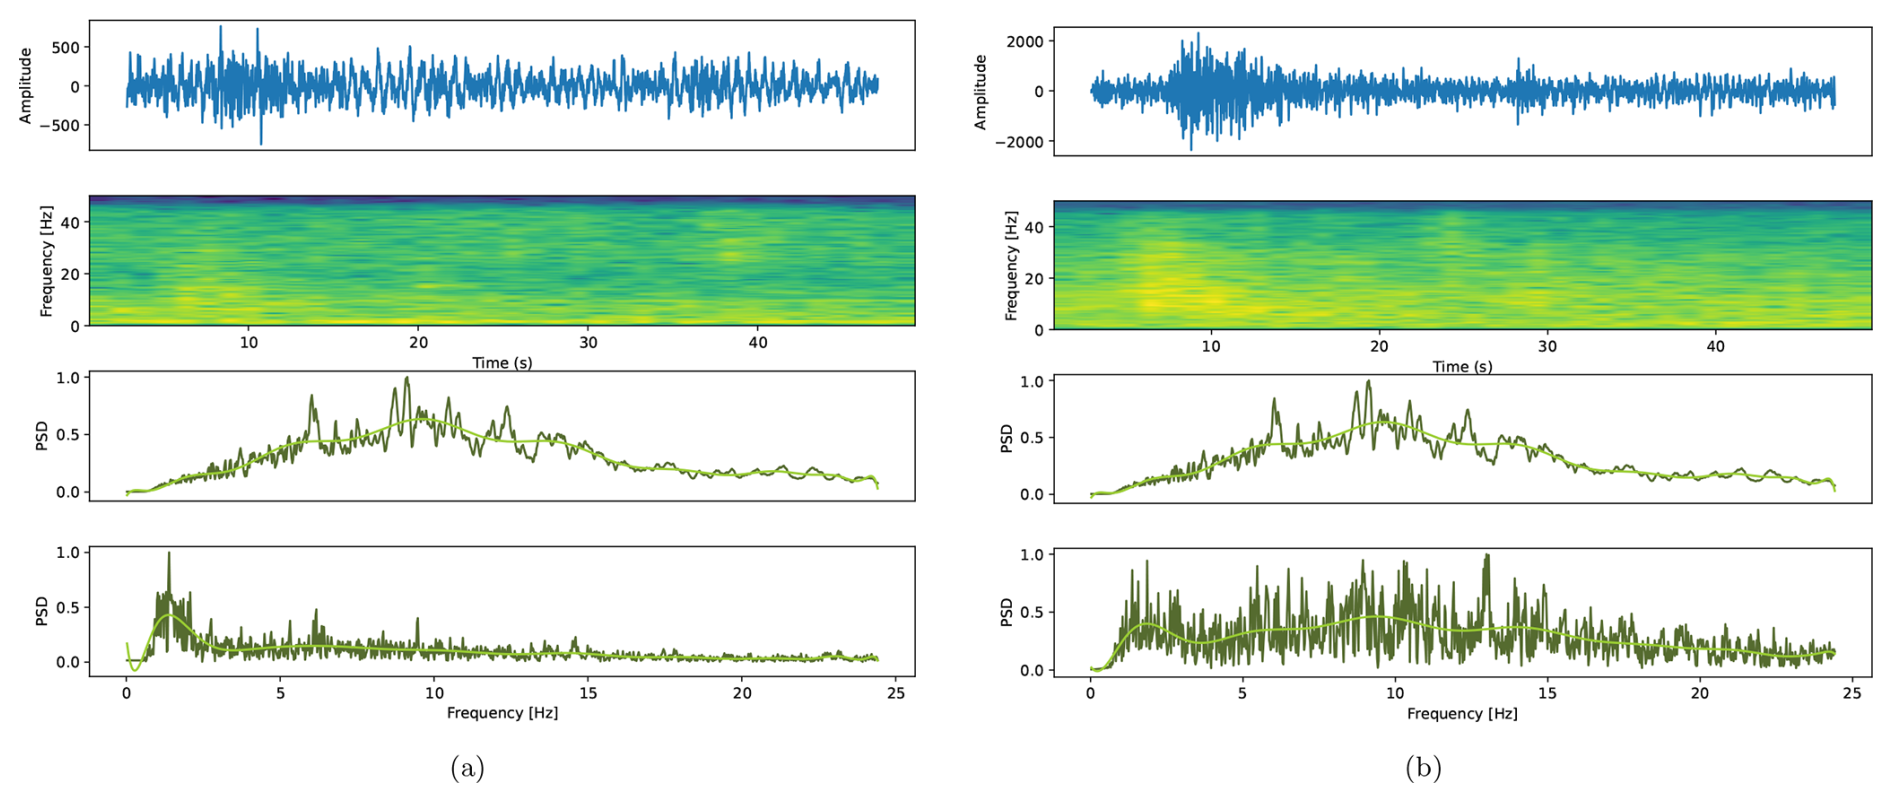
Figure 10Example of two earthquakes annotated in the LAPALMA2021 catalog that were not detected by any of the three reference systems. The first row corresponds to the seismogram of the event being analyzed (annotated in the catalog but not detected by any of the systems). The second row corresponds to its spectrograms. The third and fourth rows show the average power spectral density (PSD) of all events annotated in the catalog for that day and the PSD of the event under analysis. (a) Spectral analysis of an undetected earthquake, where a clear attenuation of energy at high frequencies is observed. (b) Spectral analysis of an undetected earthquake, where a high energy distribution in intermediate frequencies and attenuation at high frequencies are observed.
Across all systems and at both stations, the number of detected events decreases significantly as the probability threshold increases, particularly for values above 80 %. At higher thresholds, the detections are predominantly limited to events closely correlated with the prototype events on which the systems were trained. Figure 9c shows that for thresholds above 80 %, the number of detected earthquakes by both RNN-LSTM and Dilated-LSTM averages between 120 and 150 events at both stations. For TCN, the number of detected earthquakes is significantly higher, highlighting that its specificity could be set at slightly higher thresholds, around 85 %–90 %. The main reason for the non-detection of certain catalog-annotated events was their differing spectral content compared to the average spectral content of the earthquakes annotated in the catalog. Specifically, by comparing the spectral content of the undetected events with the average spectral content of all the annotated events, a clear attenuation of energy is observed at higher frequencies (> 15 Hz). This characteristic is crucial, as the systems were trained with prototype events that had a clear energy component at high frequencies. Figure 10 illustrates a couple of examples of this behavior. The fourth row of both Fig. 10a and b shows a clear attenuation of energy at high frequencies and a higher level of energy at lower and intermediate frequencies. In general, these events reflect belonging probabilities ranging between 50 % and 80 %. This highlights the importance of adjusting the specificity or sensitivity threshold when creating new pseudo-catalogs.
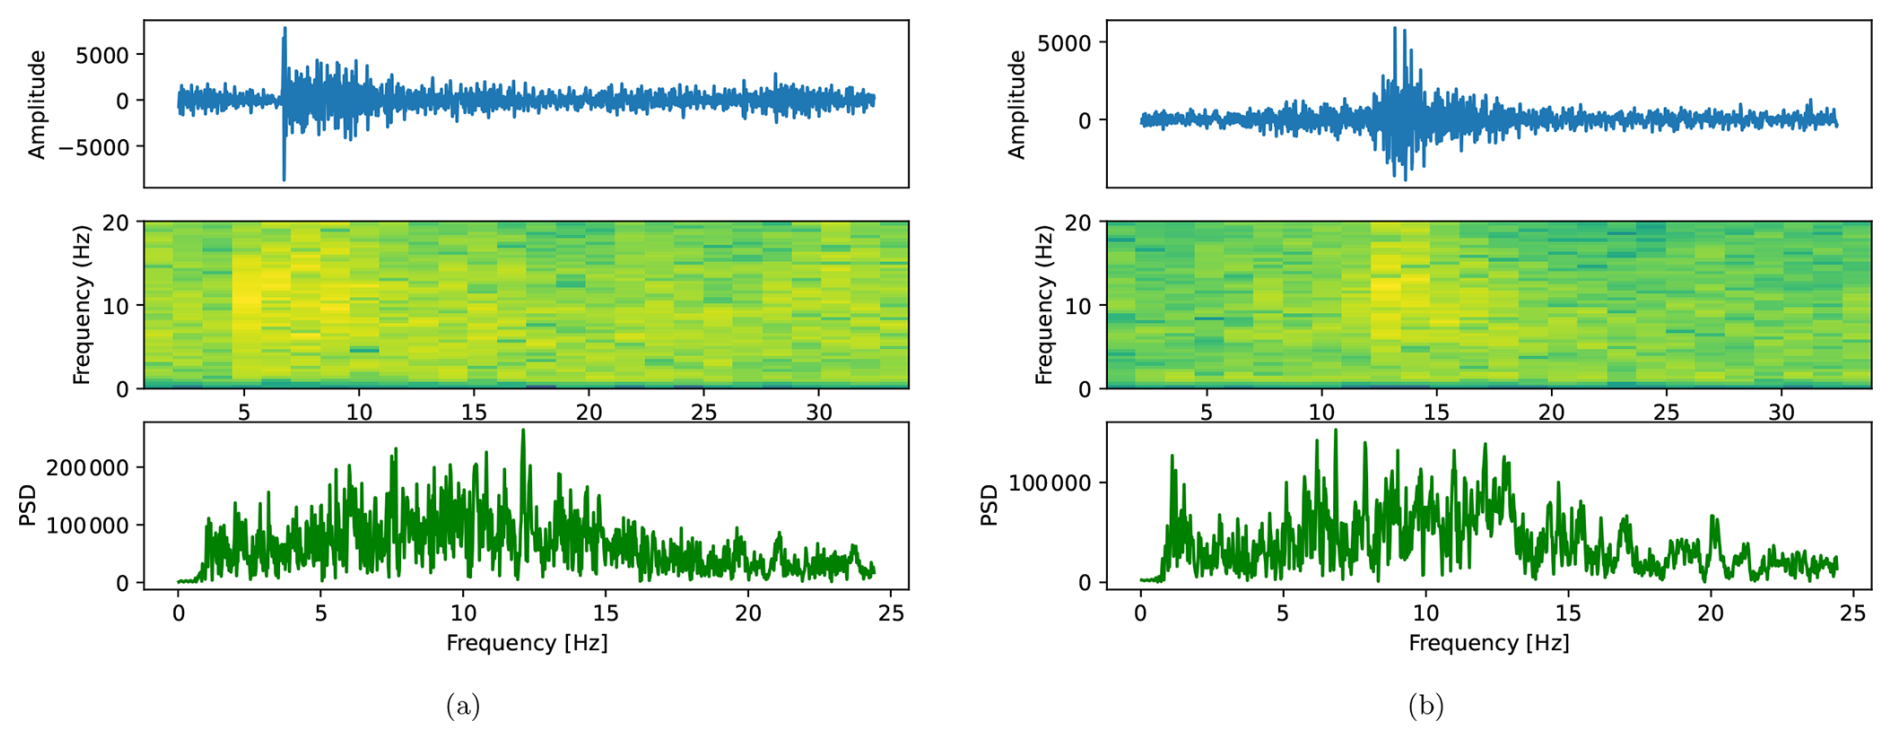
Figure 11Example of two earthquakes not annotated in the LAPALMA2021 catalog that were detected by the three reference systems with probabilities ranging from 63 % to 78 %.
Regarding the detection of events identified by the systems but not annotated in the catalog, on average, RNN-LSTM and Dilated-LSTM detected approximately 60 earthquake-type events, while TCN identified over 150. Figure 11 presents a couple of examples of such earthquakes. The PSDs reveal that they share characteristics consistent with those of earthquakes. However, as indicated by the probabilities shown at the top of the figure, their partial similarity in spectral content prevented them from being classified with higher confidence.
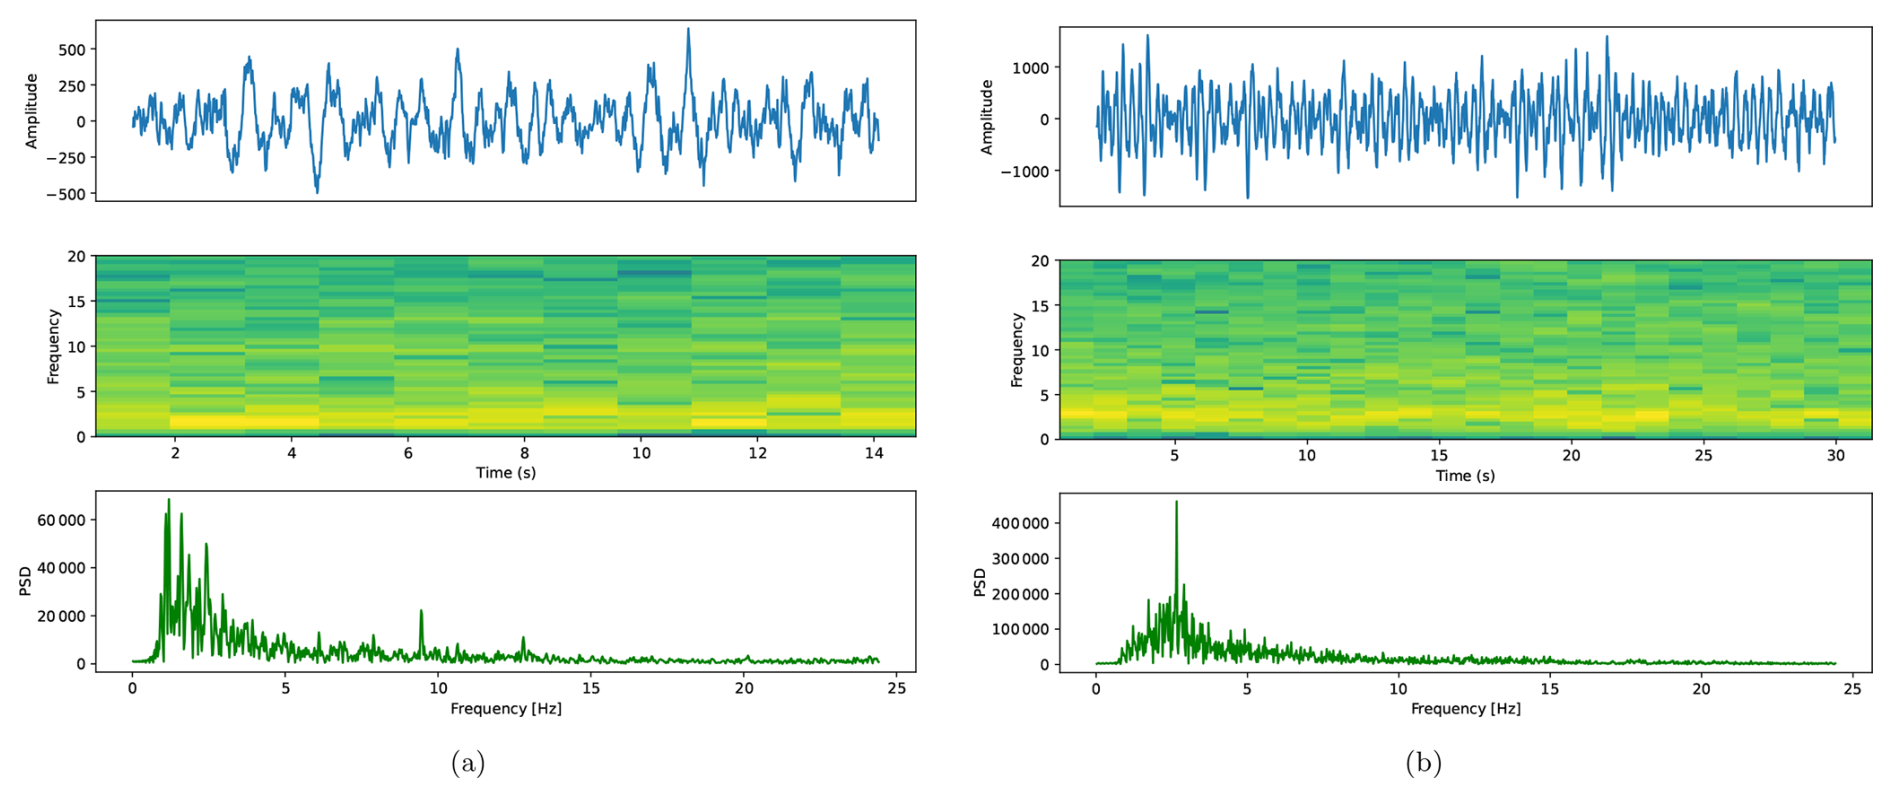
Figure 12Example of (a) LPE detected but not annotated and (b) TRE detected but not annotated in the LAPALMA2021 catalog.
Finally, it is important to discuss the recognition of events other than earthquakes, for which no information is available to contrast the results. Figure 9a and b shows the number of LPE and TRE events recognized by the systems, along with their corresponding membership probabilities. From these figures, it can be concluded that the number of detected events is high for both categories, and the assigned membership probabilities are also relatively high, ranging from 80 % to 95 %. Unlike earthquakes, where high-frequency energy from external factors can lead to errors, TRE and LPE events are highly distinctive and well-defined at low frequencies. Since the systems were trained using parameter vectors based on log frequency scale filter banks, which provide higher resolution at low frequencies than at high frequencies, the analysis of energy distribution across low frequencies is highly reliable. Figure 12 shows an example of the LPE and TRE detections. As shown, these events were recognized with very high probabilities. Analyzing their spectral content, waveform, and energy reveals a perfect correlation with the characteristics of the prototype events on which the systems were trained, as illustrated in Fig. 1. Therefore, we can conclude that a large percentage of the detected TRE and LPE events correspond to prototype events from MASTER-DEC, which indicates the associated source mechanism of their label. It will be the responsibility of the volcano experts to analyze whether these detected events share the same source mechanism or whether they should be relabeled before pre-training the systems to adjust to the volcanic environment under analysis.
5.4 Summary of findings
The results presented in each experiment provide valuable insights into the development of automatic recognition systems with weakly supervised pseudo-labeling, highlighting both the strengths and limitations of the proposed methods. By synthesizing the outcomes, we aim to offer a comprehensive understanding of how leveraging an existing automatic pseudo-labeler based on a master catalog can incorporate prior knowledge into the new dataset under review, which can inform future research and applications in the field.
One of the main strengths of the proposed system is its ability to recognize previously learned prototype events, even in volcanic environments that differ significantly from those present in the training datasets. This feature enhances its usefulness in reducing biases when creating or updating catalogs. The results suggest that training on a broader variety of volcanic settings with diverse event prototype distributions could improve recognition performance, fostering the development of more generalizable and less biased catalogs. Nonetheless, the system also presents limitations. Since the pseudo-catalogs are generated using models trained on a fixed set of known seismic categories, the system is forced to assign one of these categories to each analyzed window even when the event does not match any known prototype. This constraint can lead to the mislabeling of truly novel events and, consequently, affect the performance of systems retrained using such pseudo-labels. Addressing this issue would require the creation of more comprehensive master databases that incorporate a wider range of event types, ideally from multiple volcanic settings. Moreover, determining the appropriate membership threshold for including events in the new pseudo-catalogs remains a key challenge. Low thresholds may increase sensitivity but also introduce many false positives – events that are dissimilar to any known prototype. Retraining the systems with these catalogs could reduce performance and detection skills. High thresholds, on the other hand, may improve specificity but may not be sufficient to allow the system to adapt to the new volcanic environment. This trade-off highlights the importance of post-analysis tools that assess detection confidence, which, in addition to offering insights into the presence of potentially novel classes not covered by the original training data, also contributes to evaluating the reliability and effectiveness of the domain adaptation process by revealing how well the system distinguishes between learned and unfamiliar patterns in new volcanic environments, that is, how volcano-specific the results are and how relevant they may be to other volcanoes.
This study provides the first comprehensive analysis of seismic catalog-induced bias when developing automatic recognition systems. We evaluated the ability of several monitoring systems trained using a master seismic catalog from Deception Island volcano to adapt to a new seismic catalog from Popocatépetl volcano through our novel, proposed weakly supervised framework. Our results confirm the robustness of data-driven approaches as a basis for the construction of short-term early warning systems. However, quantitative and qualitative analyses confirmed that the reliability of a system is strongly biased by the incomplete coverage of the seismic catalog. While system performance reached almost 90 % per-frame recognition accuracy, intrinsic limitations in developing seismic catalogs led to extremely useful information describing the volcanic behavior being ignored. Instead of simply learning to characterize volcanic dynamics by describing the latent physical model, catalog-induced learning can bias the system by discarding useful data describing volcanic dynamics. However, when a weakly supervised learning approach based on a master seismic catalog is applied, an indeterminate amount of information related to volcano dynamics is revealed.
This study raises important questions about the relevance of catalog-induced learning when developing new monitoring systems. Our results demonstrate that systems based on iterative weakly supervised or even unsupervised learning techniques could offer a more successful approach than supervised techniques under crude seismic catalogs. Therefore, we conclude that ensuring appropriate seismic catalogs and support for developing monitoring tools should be a priority to the same extent as applying new and more effective AI techniques. The use of more sophisticated pseudo-labeling techniques involving data from several catalogs could help develop universal monitoring tools capable of working accurately across different volcanic systems, even when faced with unforeseen temporal changes in monitored signals.
This section contains the information related to the F1-score metrics and the cumulative distribution functions (CDFs) that support the results obtained and constitute the foundation of the conducted study.
A1 Recognition confidence analysis on the MASTER-DEC dataset
To further support the results obtained with the MASTER-DEC dataset, this section presents the CDFs of the recognition probabilities. These CDFs demonstrate that, beyond achieving favorable confusion matrix metrics, the system assigns high confidence scores to most correctly classified events, indicating strong and reliable recognition performance.
A2 F1-score metrics and recognition confidence analysis on the POPO2002 dataset
Table 5 in the paper refers to the best results obtained in Table 4, which were achieved using a training split of 40 % of the total data and considering five seismic classes. This section presents the results primarily in terms of the F1 score. This metric provides an evaluation of the model's performance by considering both precision and recall, thereby strengthening the interpretation and discussion of the results.
Table A1Precision, recall, and F1 score for the RNN-LSTM architecture.
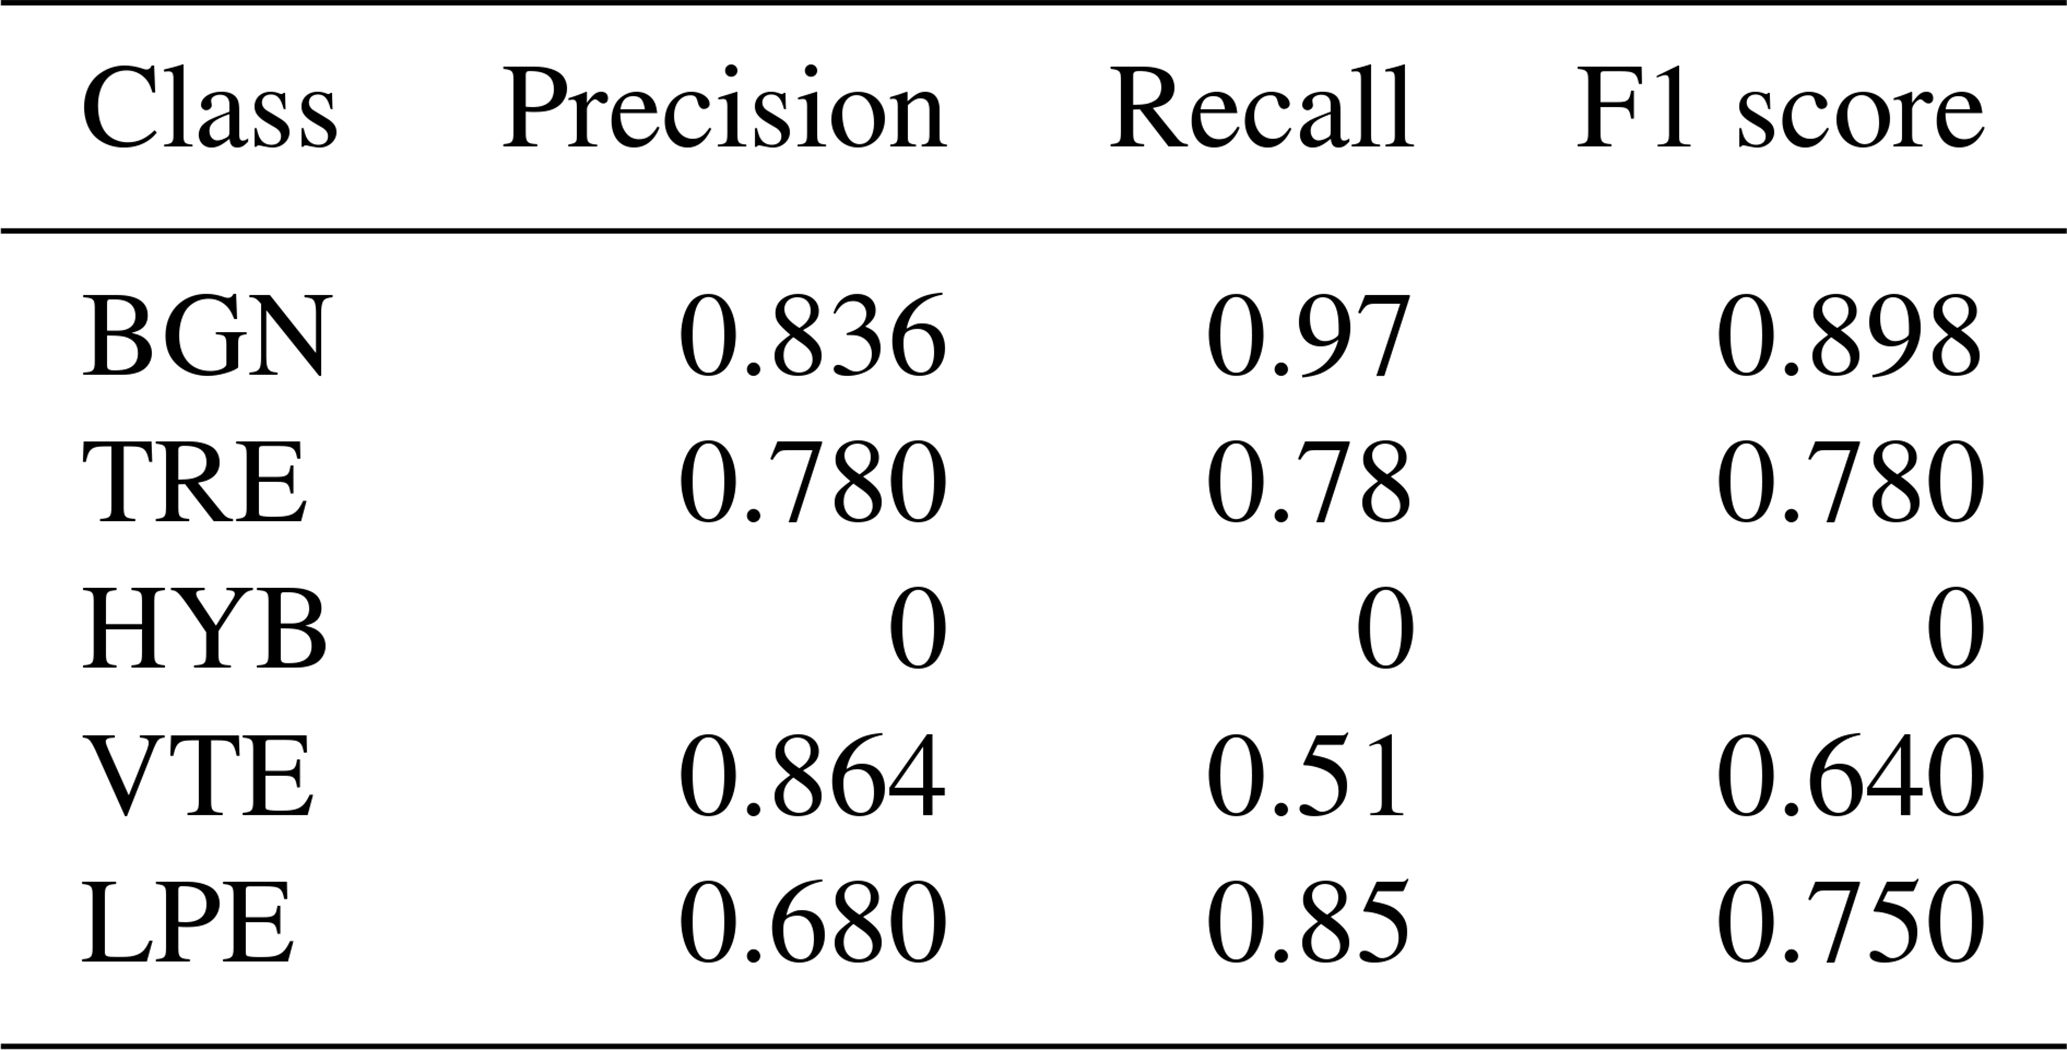
Table A2Precision, recall, and F1 score for the Dilated-LSTM architecture.
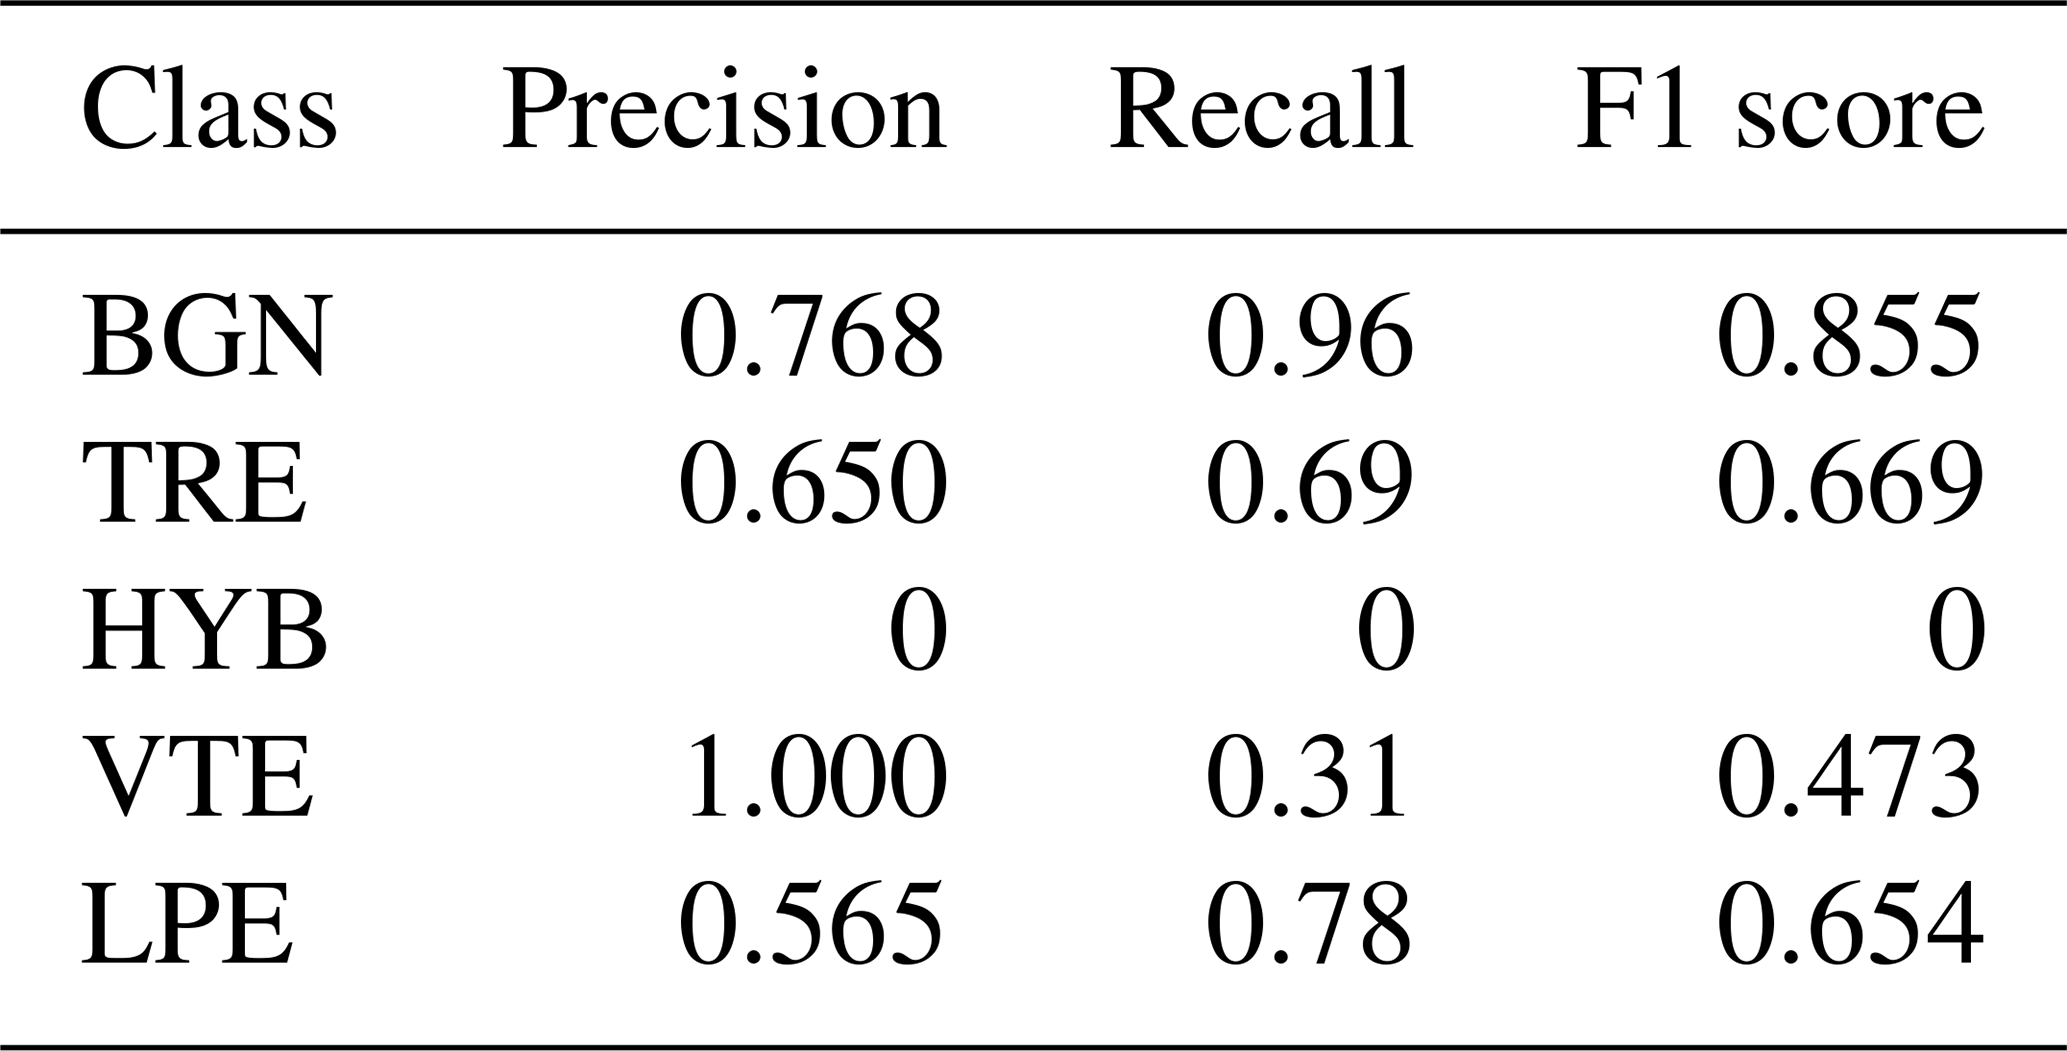
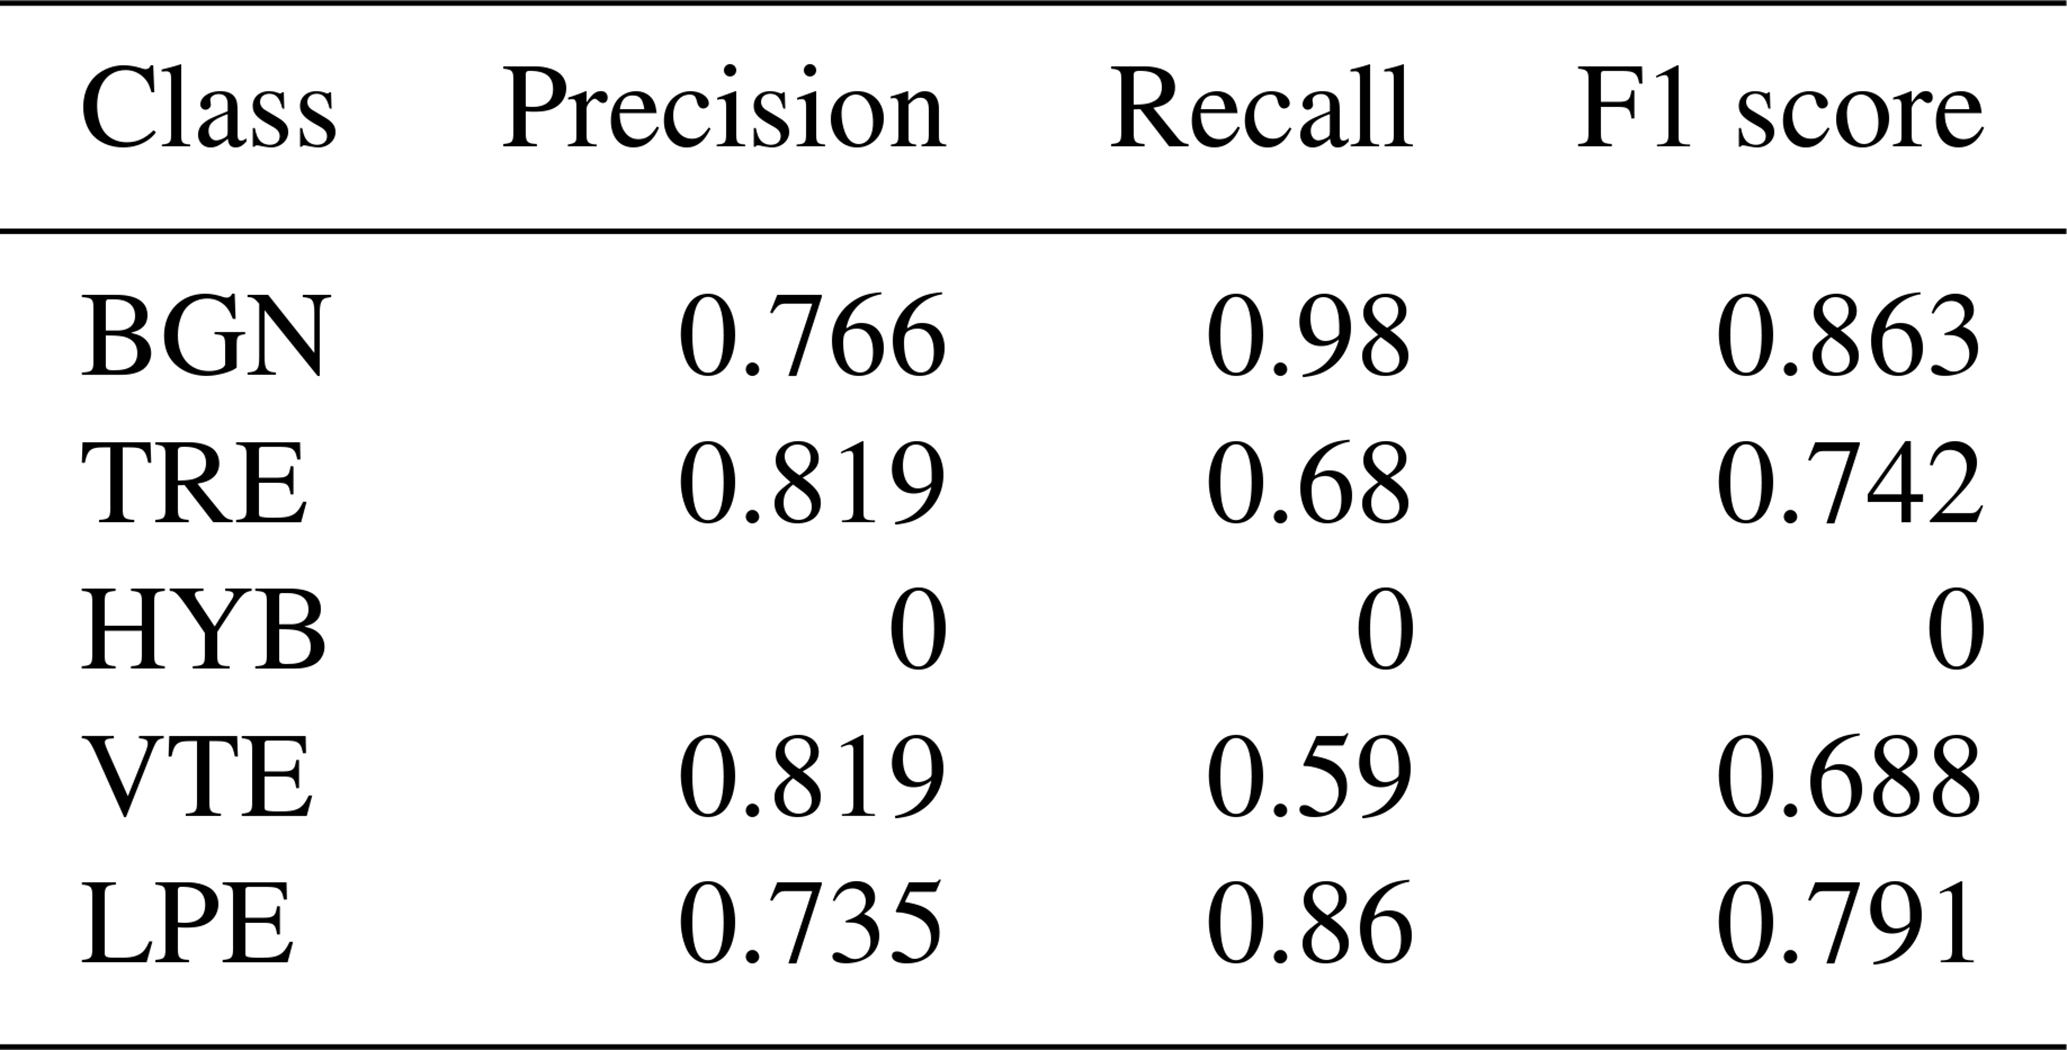
Table A3Precision, recall, and F1 score for the TCN architecture.
To further support the results obtained with the POPO2002 dataset, this section also presents the CDFs of the recognition probabilities. These results demonstrate that the system assigns high confidence scores to most correctly classified events, indicating strong and reliable recognition performance.
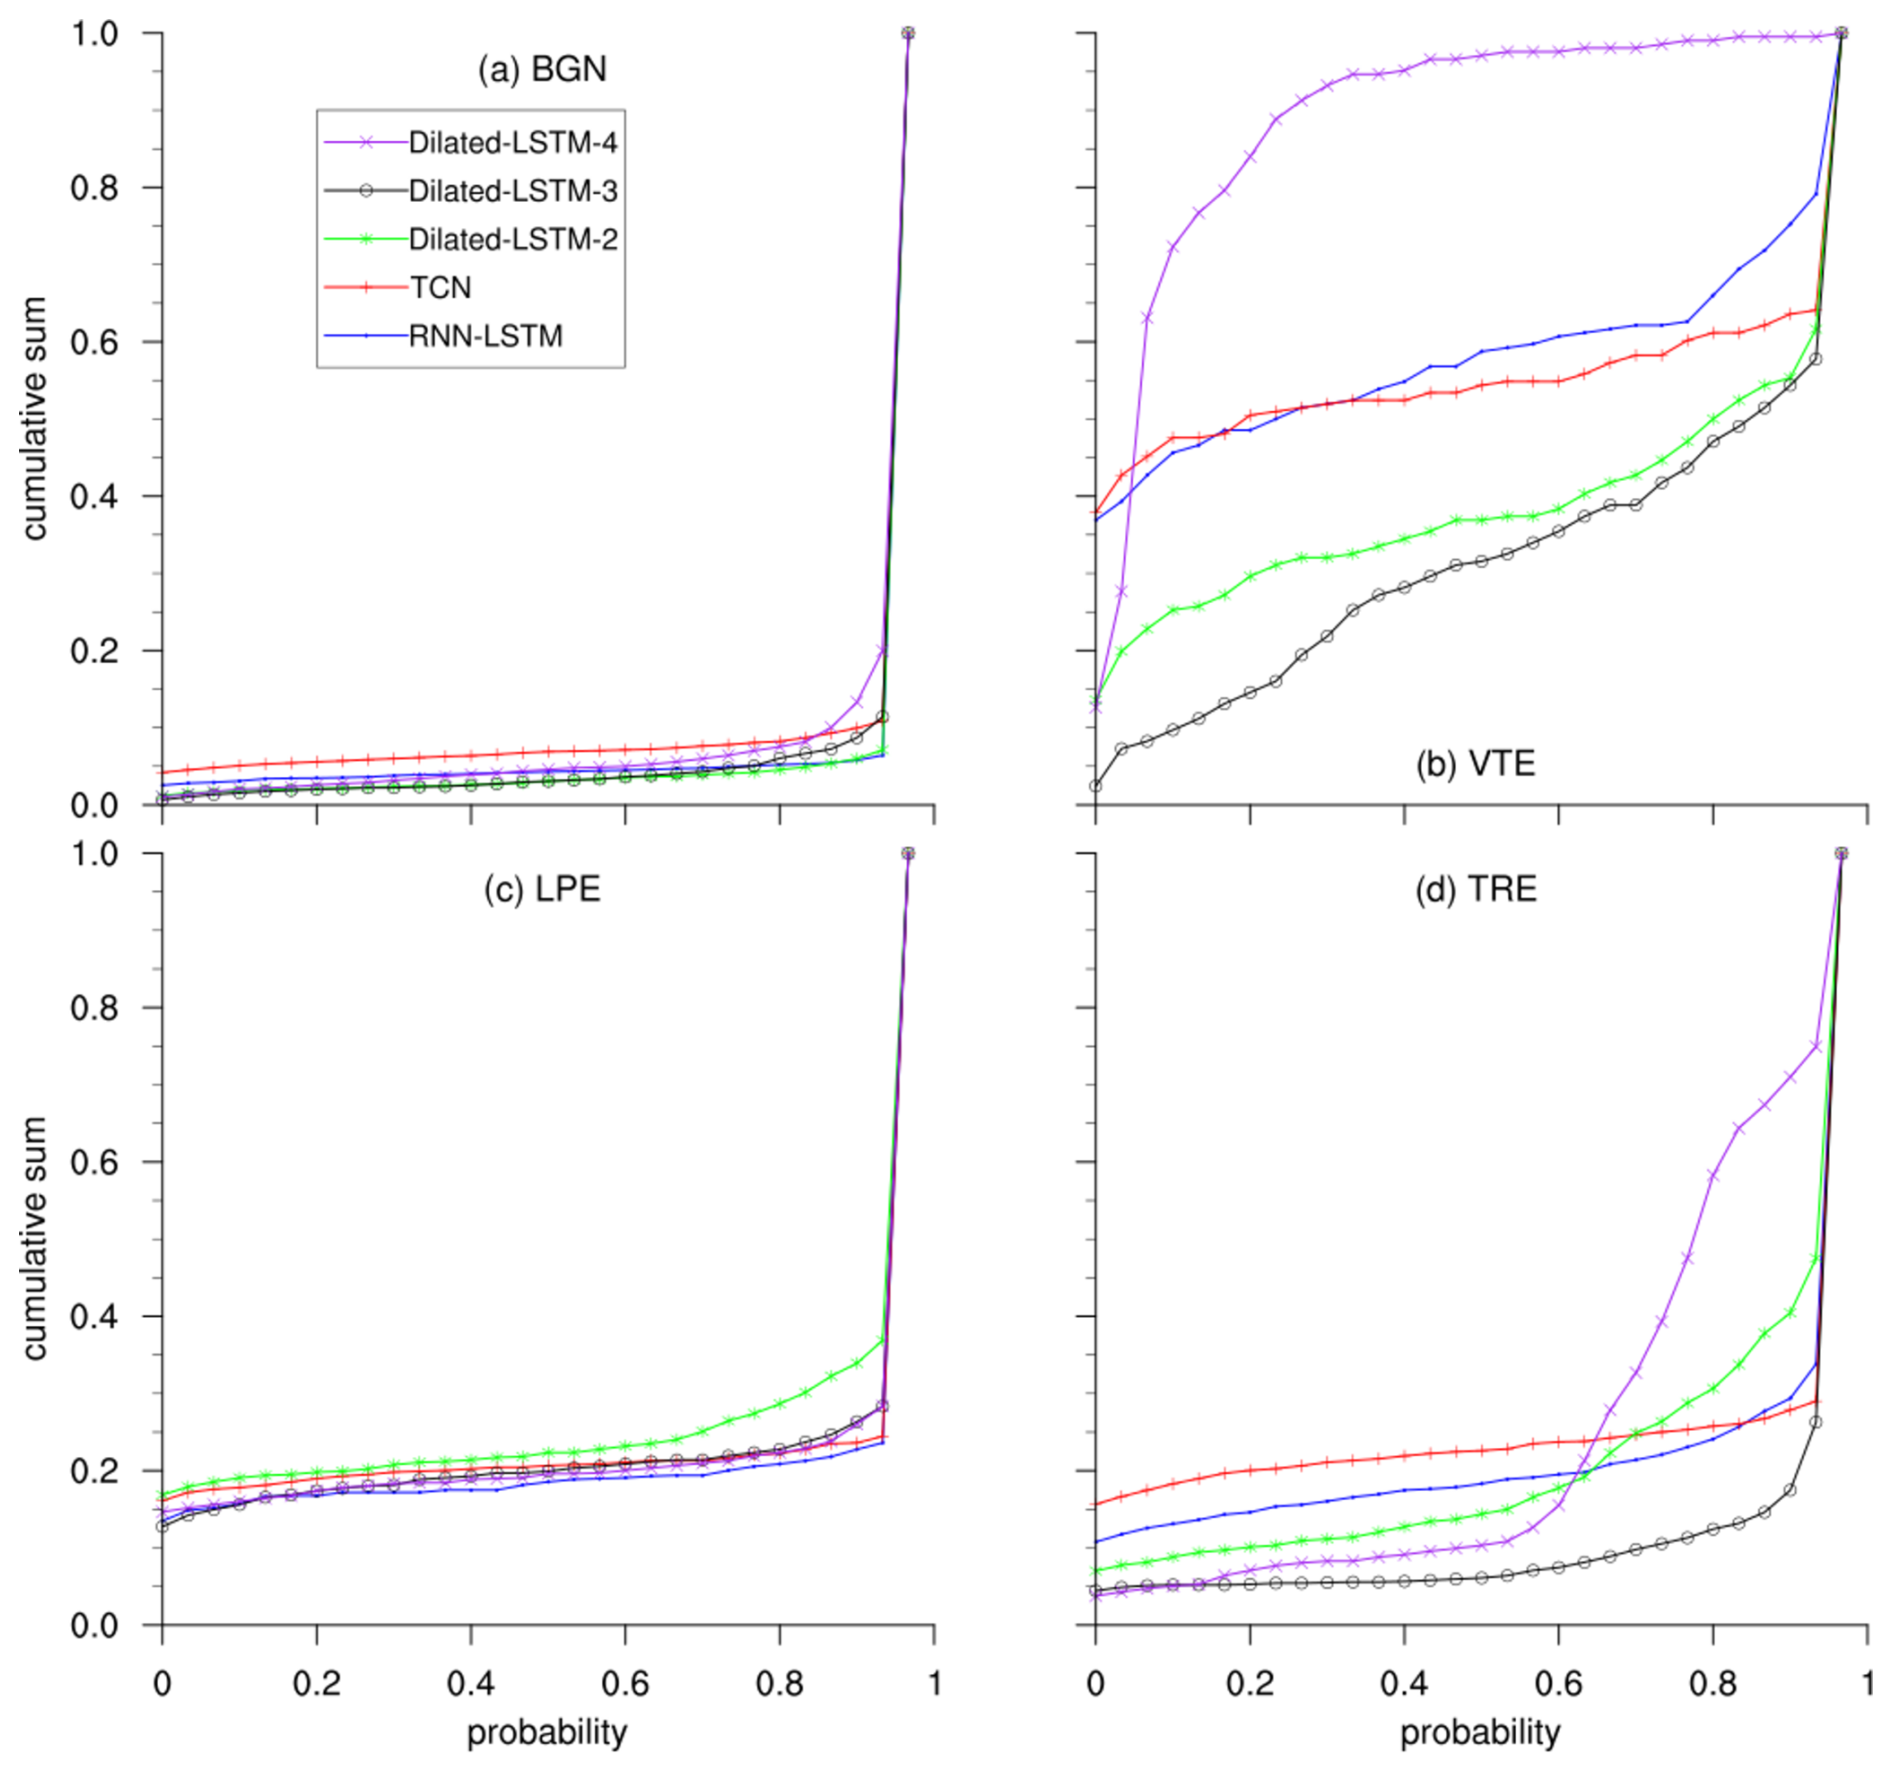
Figure A1Recognition confidence analysis on the MASTER-DEC dataset. CDFs of the recognition probabilities for each event in the master database are shown. Dilated-LSTM-2, Dilated-LSTM-3, and Dilated-LSTM-4 refer to the Dilated-LSTM architectures with two, three, and four hidden layers, respectively, for the sake of comparison.
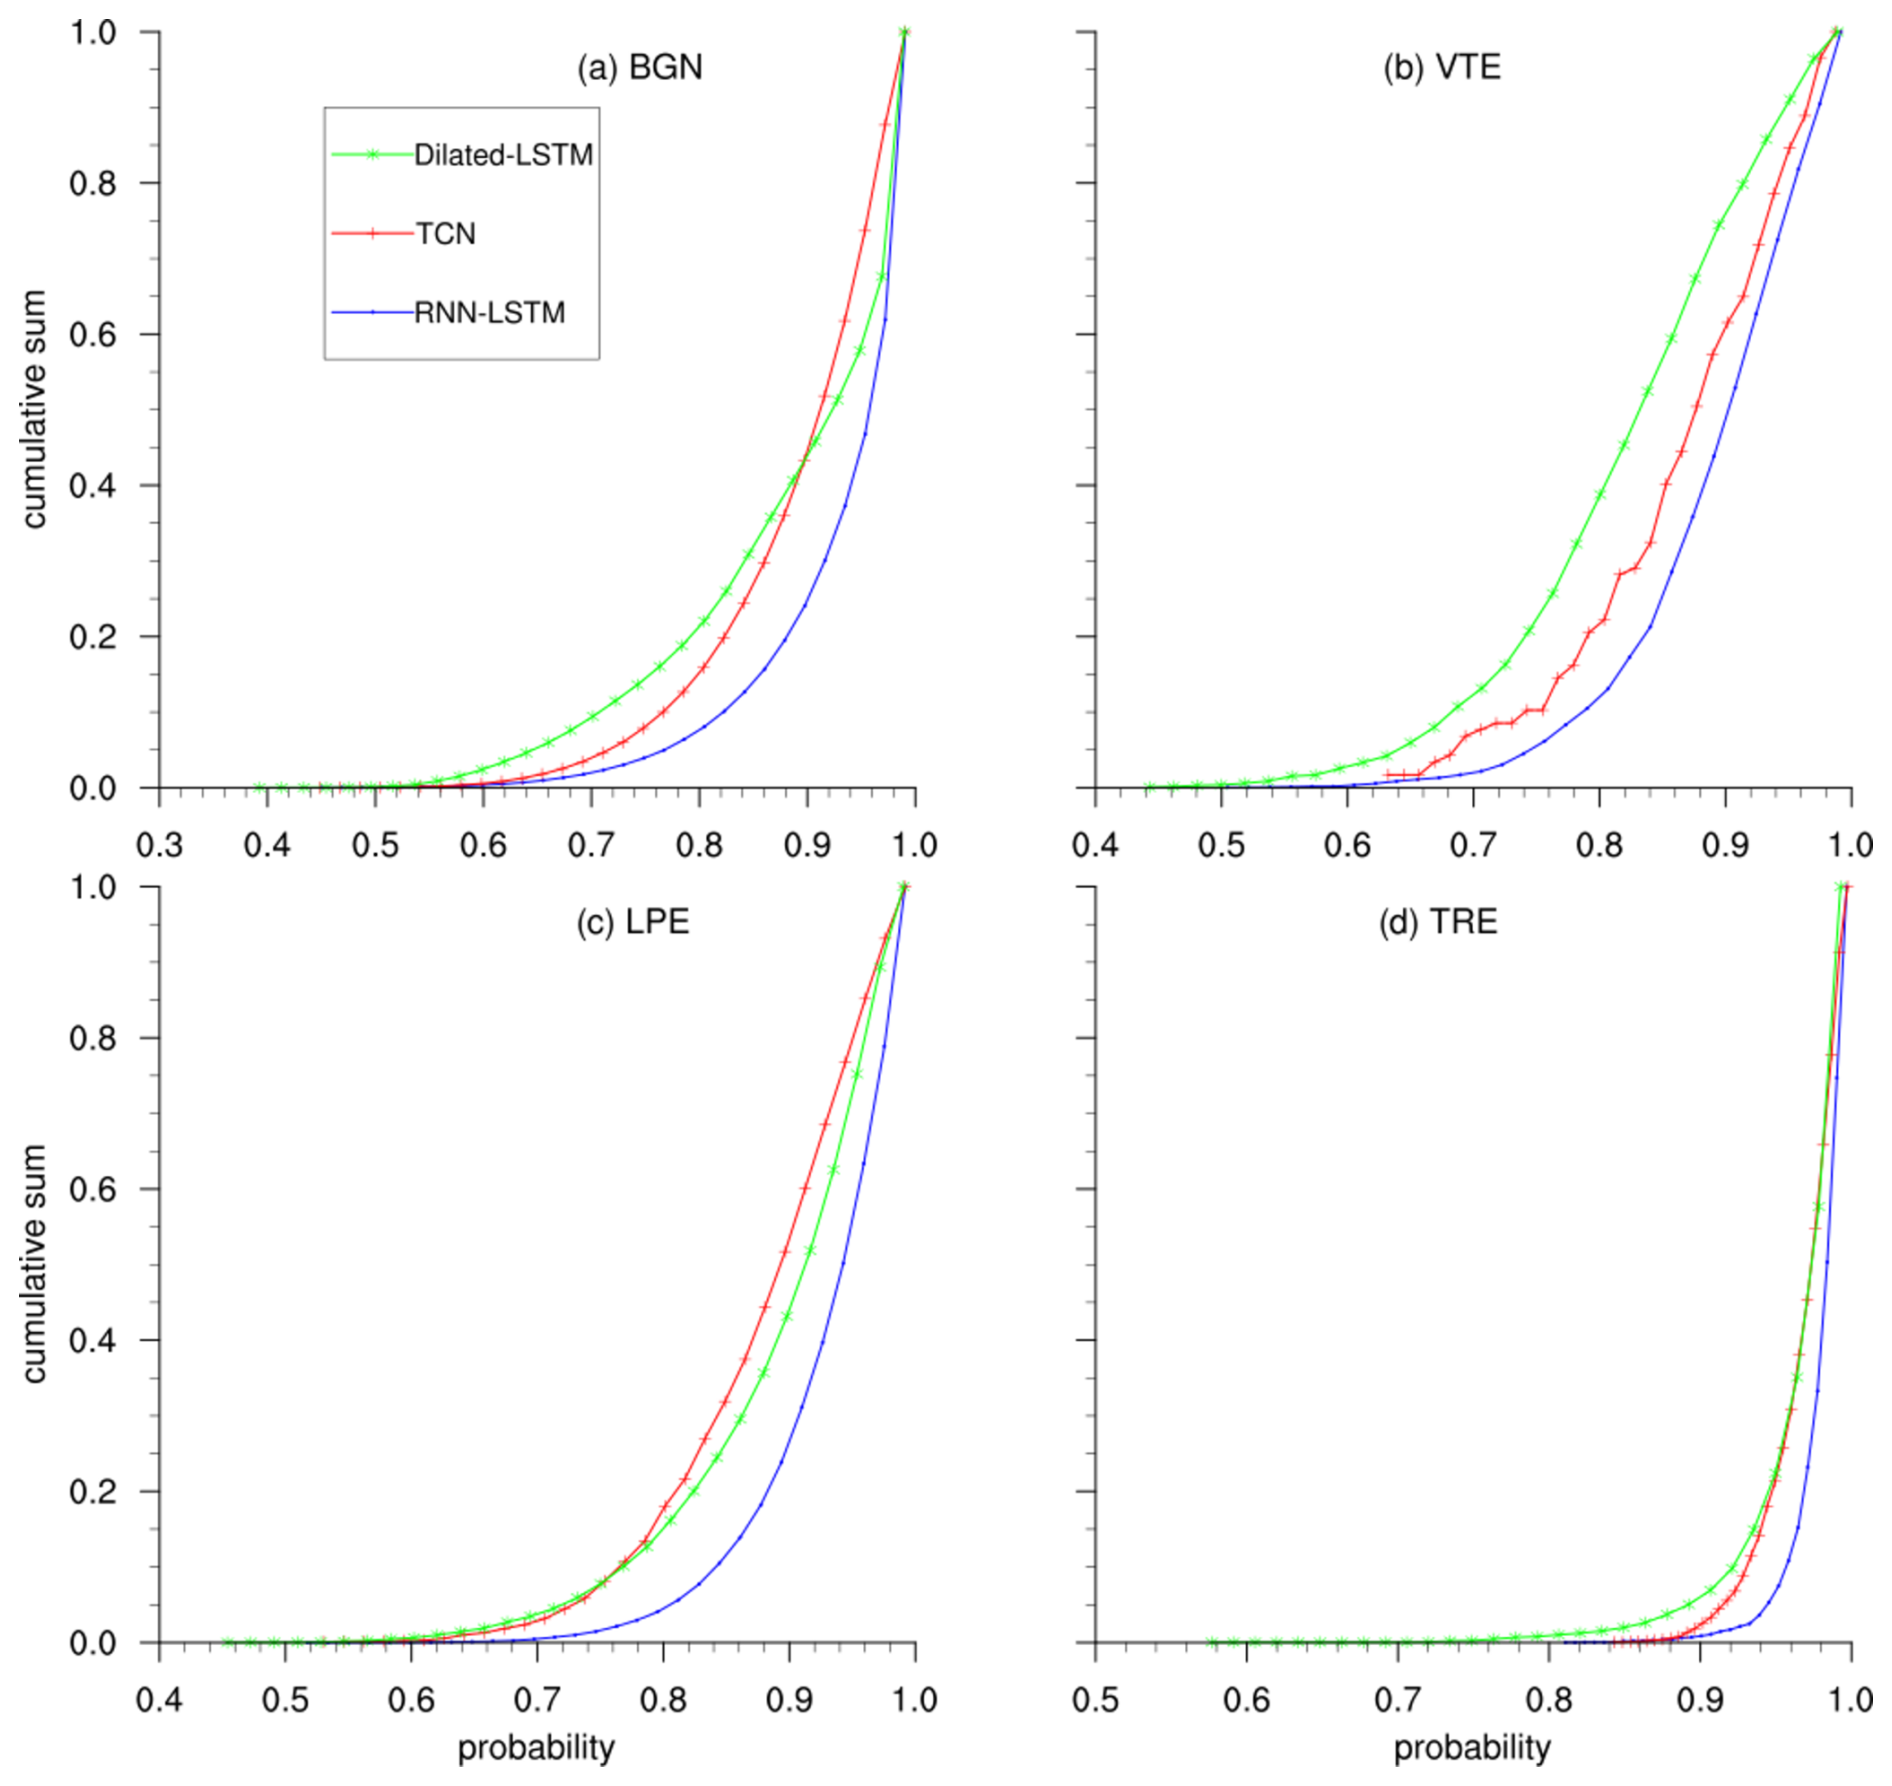
Figure A2Recognition confidence analysis on the POPO2002 dataset. CDFs of the recognition probabilities for each event in the master database, obtained using the best-performing architectures detailed in the paper.
The code related to this paper can be found at the following repository: https://github.com/mmtitos/ML-DIGIVOLCAN (last access: 1 October 2025; https://doi.org/10.5281/zenodo.17235276, Manuel Marcelino Titos Luzon, 2025). The data that support the findings of this study are available from the corresponding author upon reasonable request. Correspondence and requests for materials should be addressed to Manuel Titos.
All authors contributed to the conception of the study. MT and CB conceived and conducted the experiments. All authors analyzed and interpreted the results. All authors reviewed the paper.
The contact author has declared that none of the authors has any competing interests.
Any opinions, findings, conclusions, or recommendations expressed in this research are those of the authors and do not necessarily reflect the views of the funding agencies.
Publisher's note: Copernicus Publications remains neutral with regard to jurisdictional claims made in the text, published maps, institutional affiliations, or any other geographical representation in this paper. While Copernicus Publications makes every effort to include appropriate place names, the final responsibility lies with the authors.
This work has been funded by the Spanish Project PID2022-143083NB-I00, “LEARNING”, by MICIU/AEI/10.13039/501100011033, and by FEDER, UE. This work has been partially funded by the Spanish Project PLEC2022-009271 “DigiVolCan”, by MCIN/AEI, by MCIN/AEI/10.13039/501100011033, and by EU NextGenerationEU/PRTR, 10.13039/501100011033 and SDAS (B-TIC-542-UGR20). The authors would also like to acknowledge Instituto Andaluz de Geofísica, Instituto Volcanológico de Canarias (INVOLCAN), Raúl Arámbula-Mendoza, and CENAPRED for providing the data from Deception Island, Popocatépetl, and Tajogaite volcanoes in support of this work.
This research has been supported by the Ministerio de Ciencia e Innovación (grant no. PID2022-143083NB-I00).
This paper was edited by Veronica Pazzi and Maria Ana Baptista and reviewed by eight anonymous referees.
Alasonati, P., Wassermann, J., and Ohrnberger, M.: Signal classification by wavelet-based hidden Markov models: application to seismic signals of volcanic origin, Geophysical Journal International, 165, 452–466, https://doi.org/10.1111/j.1365-246X.2006.02878.x, 2006. a, b
Arango-Galván, C., Martin-Del Pozzo, A. L., Flores-Márquez, E. L., González-Morán, T., Vidal-Amaro, M., and Ruiz-Aguilar, D.: Unraveling the complex structure of Popocatépetl volcano (Central Mexico): new evidence for collapse features and active faulting inferred from geophysical data, Journal of Volcanology and Geothermal Research, 407, 107091, https://doi.org/10.1016/j.jvolgeores.2020.107091, 2020. a, b
Barra, F.: Geology of Mexico: Celebrating the Centenary of the Geological Society of Mexico. edited by: Alaniz-Alvarez, S. A. and Nieto-Samaniego, A. F., Geological Society of America, Special Paper 422, 465 pp., Boulder, Colorado, 2007, ISBN 13-978-0-8137-2422-5, Economic Geology, 103, 653–654, https://ui.adsabs.harvard.edu/abs/2008EcGeo.103..653B/abstract (last access: 29 September 2025), 2008. a
Benítez, M. C., Ramírez, J., Segura, J. C., Ibanez, J. M., Almendros, J., García-Yeguas, A., and Cortes, G.: Continuous HMM-based seismic-event classification at Deception Island, Antarctica, IEEE Transactions on Geoscience and Remote Sensing, 45, 138–146, https://doi.org/10.1109/TGRS.2006.882264, 2007. a, b, c
Bhatti, S. M., Khan, M. S., Wuth, J., Huenupan, F., Curilem, M., Franco, L., and Yoma, N. B.: Automatic detection of volcano-seismic events by modeling state and event duration in hidden Markov models, Journal of Volcanology and Geothermal Research, 324, 134–143, https://doi.org/10.1016/j.jvolgeores.2016.01.002, 2016. a, b
Bicego, M., Rossetto, A., Olivieri, M., Londoño-Bonilla, J. M., and Orozco-Alzate, M.: Advanced KNN approaches for explainable seismic-volcanic signal classification, Mathematical Geosciences, 55, 59–80, https://doi.org/10.1007/s11004-022-10026-w, 2023. a, b
Canario, J. P., Mello, R., Curilem, M., Huenupan, F., and Rios, R.: In-depth comparison of deyep artificial neural network architectures on seismic events classification, Journal of Volcanology and Geothermal Research, 401, 106881, https://doi.org/10.1016/j.jvolgeores.2020.106881, 2020. a, b
Carmona, E., Almendros, J., Serrano, I., Stich, D., and Ibáñez, J. M.: Results of seismic monitoring surveys of Deception Island volcano, Antarctica, from 1999–2011, Antarctic Science, 24, 485–499, https://doi.org/10.1017/S0954102012000314, 2012. a, b
Chang, S., Zhang, Y., Han, W., Yu, M., Guo, X., Tan, W., Cui, X., Witbrock, M., Hasegawa-Johnson, M. A., and Huang, T. S.: Dilated recurrent neural networks, Advances in Neural Information Processing Systems, 30, https://proceedings.neurips.cc/paper_files/paper/2017/file/32bb90e8976aab5298d5da10fe66f21d-Paper.pdf (last access: 29 September 2025), 2017. a
Chouet, B.: Volcano seismology, Pure and Applied Geophysics, 160, 739–788, 2003. a
Cortés, G., Carniel, R., Lesage, P., Mendoza, M. Á., and Della Lucia, I.: Practical volcano-independent recognition of seismic events: VULCAN. ears project, Frontiers in Earth Science, 8, 616676, https://doi.org/10.3389/feart.2020.616676, 2021. a, b
Curilem, G., Vergara, J., Fuentealba, G., Acuña, G., and Chacón, M.: Classification of seismic signals at Villarrica volcano (Chile) using neural networks and genetic algorithms, Journal of Volcanology and Geothermal Research, 180, 1–8, https://doi.org/10.1016/j.jvolgeores.2008.11.008, 2009. a
Díaz-Moreno, A., Ibáñez, J., De Angelis, S., García-Yeguas, A., Prudencio, J., Morales, J., Tuvè, T., and García, L.: Seismic hydraulic fracture migration originated by successive deep magma pulses: The 2011–2013 seismic series associated to the volcanic activity of El Hierro Island, Journal of Geophysical Research: Solid Earth, 120, 7749–7770, https://doi.org/10.1002/2015JB012249, 2015. a
D'Auria, L., Koulakov, I., Prudencio, J., Cabrera-Pérez, I., Ibáñez, J. M., Barrancos, J., García-Hernández, R., Martínez van Dorth, D., Padilla, G. D., Przeor, M., Ortega, V., Hernández, P., and Peréz, N. M.: Rapid magma ascent beneath La Palma revealed by seismic tomography, Scientific Reports, 12, 17654, https://doi.org/10.1038/s41598-022-21818-9, 2022. a
Farahani, A., Voghoei, S., Rasheed, K., and Arabnia, H. R.: A brief review of domain adaptation, Advances in Data Science and Information Engineering: Proceedings from ICDATA 2020 and IKE 2020, 877–894, https://doi.org/10.1007/978-3-030-71704-9_65, 2021. a
Hibert, C., Provost, F., Malet, J.-P., Maggi, A., Stumpf, A., and Ferrazzini, V.: Automatic identification of rockfalls and volcano-tectonic earthquakes at the Piton de la Fournaise volcano using a Random Forest algorithm, Journal of Volcanology and Geothermal Research, 340, 130–142, https://doi.org/10.1016/j.jvolgeores.2017.06.003, 2017. a
Hochreiter, S. and Schmidhuber, J.: Long short-term memory, Neural Computation, 9, 1735–1780, https://doi.org/10.1162/neco.1997.9.8.1735, 1997. a
Ibáñez, J., De Angelis, S., Díaz-Moreno, A., Hernández, P., Alguacil, G., Posadas, A., and Pérez, N.: Insights into the 2011–2012 submarine eruption off the coast of El Hierro (Canary Islands, Spain) from statistical analyses of earthquake activity, Geophysical Journal International, 191, 659–670, https://doi.org/10.1111/j.1365-246X.2012.05609.x, 2012. a
Ibáñez, J. M., Pezzo, E. D., Almendros, J., La Rocca, M., Alguacil, G., Ortiz, R., and García, A.: Seismovolcanic signals at Deception Island volcano, Antarctica: Wave field analysis and source modeling, Journal of Geophysical Research: Solid Earth, 105, 13905–13931, https://doi.org/10.1029/2000JB900124, 2000. a, b, c, d, e, f, g, h
Ibáñez, J. M., Benítez, C., Gutiérrez, L. A., Cortés, G., García-Yeguas, A., and Alguacil, G.: The classification of seismo-volcanic signals using Hidden Markov Models as applied to the Stromboli and Etna volcanoes, Journal of Volcanology and Geothermal Research, 187, 218–226, https://doi.org/10.1016/j.jvolgeores.2009.08.008, 2009. a
Ibáñez, J. M., Díaz-Moreno, A., Prudencio, J., Zandomeneghi, D., Wilcock, W., Barclay, A., Almendros, J., Benítez, C., García-Yeguas, A., and Alguacil, G.: Database of multi-parametric geophysical data from the TOMO-DEC experiment on Deception Island, Antarctica, Scientific Data, 4, 1–18, https://doi.org/10.1038/sdata.2017.20, 2017. a
Köhler, A., Ohrnberger, M., and Scherbaum, F.: Unsupervised pattern recognition in continuous seismic wavefield records using self-organizing maps, Geophysical Journal International, 182, 1619–1630, https://doi.org/10.1111/j.1365-246X.2010.04754.x, 2010. a
Kouw, W. M. and Loog, M.: A review of domain adaptation without target labels, IEEE Transactions on Pattern Analysis and Machine Intelligence, 43, 766–785, https://doi.org/10.1109/TPAMI.2019.2945942, 2019. a
Lara, F., Lara-Cueva, R., Larco, J. C., Carrera, E. V., and Leon, R.: A deep learning approach for automatic recognition of seismo-volcanic events at the Cotopaxi volcano, Journal of Volcanology and Geothermal Research, 409, 107142, https://doi.org/10.1016/j.jvolgeores.2020.107142, 2021. a
Lea, C., Flynn, M. D., Vidal, R., Reiter, A., and Hager, G. D.: Temporal convolutional networks for action segmentation and detection, in: Proceedings of the IEEE Conference on Computer Vision and Pattern Recognition, 156–165, https://doi.org/10.1109/CVPR.2017.74, 2017. a
Lu, J., Liu, A., Dong, F., Gu, F., Gama, J., and Zhang, G.: Learning under concept drift: A review, IEEE Transactions on Knowledge and Data Engineering, 31, 2346–2363, https://doi.org/10.1109/TKDE.2018.2876857, 2018. a
Malfante, M., Dalla Mura, M., Métaxian, J.-P., Mars, J. I., Macedo, O., and Inza, A.: Machine learning for volcano-seismic signals: Challenges and perspectives, IEEE Signal Processing Magazine, 35, 20–30, https://doi.org/10.1109/MSP.2017.2779166, 2018. a
Manuel Marcelino Titos Luzon: mmtitos/ML-DIGIVOLCAN: ML-DIGIVOLCAN V1.0.0 (v1.0.0), Zenodo [code], https://doi.org/10.5281/zenodo.17235276, 2025. a
Martí, J., Geyer, A., and Aguirre-Diaz, G.: Origin and evolution of the Deception Island caldera (South Shetland Islands, Antarctica), Bull. Volcanol., 75, 732, https://doi.org/10.1007/s00445-013-0732-3, 2013. a
Martínez, V. L., Titos, M., Benítez, C., Badi, G., Casas, J. A., Craig, V. H. O., and Ibáñez, J. M.: Advanced signal recognition methods applied to seismo-volcanic events from Planchon Peteroa Volcanic Complex: Deep Neural Network classifier, Journal of South American Earth Sciences, 107, 103115, https://doi.org/10.1016/j.jsames.2020.103115, 2021. a
Martınez-Arévalo, C., Bianco, F., Ibáñez, J. M., and Del Pezzo, E.: Shallow seismic attenuation and shear-wave splitting in the short period range of Deception Island volcano (Antarctica), Journal of Volcanology and Geothermal Research, 128, 89–113, https://doi.org/10.1016/S0377-0273(03)00248-8, 2003. a
McInnes, L., Healy, J., and Melville, J.: Umap: Uniform manifold approximation and projection for dimension reduction, arXiv preprint arXiv:1802.03426, https://doi.org/10.48550/arXiv.1802.03426, 2018. a
McNutt, S. R. and Roman, D. C.: Volcanic seismicity, in: The encyclopedia of volcanoes, Elsevier, 1011–1034, https://doi.org/10.1007/PL00012556, 2015. a, b
Minakami, T.: Prediction of volcanic eruptions, in: Developments in Solid Earth Geophysics, vol. 6, Elsevier, 313–333, https://doi.org/10.1016/B978-0-444-41141-9.50020-6, 1974. a
Ohrnberger, M.: Continuous automatic classification of seismic signals of volcanic origin at Mt. Merapi, Java, Indonesia, PhD thesis, Univ., Diss., Potsdam, 2001. a
Palmer, J.: The new science of volcanoes harnesses AI, satellites and gas sensors to forecast eruptions, Nature, 581, 256–260, https://doi.org/10.1038/d41586-020-01445-y, 2020. a
Rodriguez, A. B., Benitez, C., Zuccarello, L., De Angelis, S., and Ibanez, J. M.: Bayesian monitoring of seismo-volcanic dynamics, IEEE Transactions on Geoscience and Remote Sensing, 60, 1–14, https://doi.org/10.1109/TGRS.2021.3076012, 2021. a, b, c
Rodríguez, Á. B., Balestriero, R., De Angelis, S., Benítez, M. C., Zuccarello, L., Baraniuk, R., Ibanez, J. M., and de Hoop, M. V.: Recurrent scattering network detects metastable behavior in polyphonic seismo-volcanic signals for volcano eruption forecasting, IEEE Transactions on Geoscience and Remote Sensing, 60, 1–23, https://doi.org/10.1109/TGRS.2021.3134198, 2021. a
Scarpetta, S., Giudicepietro, F., Ezin, E. C., Petrosino, S., Del Pezzo, E., Martini, M., and Marinaro, M.: Automatic classification of seismic signals at Mt. Vesuvius volcano, Italy, using neural networks, Bulletin of the Seismological Society of America, 95, 185–196, https://doi.org/10.1785/0120030075, 2005. a
Schmidhuber, J.: Deep learning in neural networks: An overview, Neural Networks, 61, 85–117, https://doi.org/10.1016/j.neunet.2014.09.003, 2015. a
Siebe, C., Salinas, S., Arana-Salinas, L., Macías, J. L., Gardner, J., and Bonasia, R.: The~ 23,500 y 14C BP White Pumice Plinian eruption and associated debris avalanche and Tochimilco lava flow of Popocatépetl volcano, México, Journal of Volcanology and Geothermal Research, 333, 66–95, https://doi.org/10.1016/j.jvolgeores.2016.11.012, 2017. a
Smellie, J. L.: Recent observations on the volcanic history of Deception Island, South Shetland Islands, British Antarctic Survey Bulletin, 83–85, https://www.bas.ac.uk/data/our-data/publication/recent-observations-on-the-volcanic-history-of-deception-island-south/ (last access: 29 September 2025), 1988. a
Sparks, R. S. J.: Forecasting volcanic eruptions, Earth and Planetary Science Letters, 210, 1–15, https://doi.org/10.1016/S0012-821X(03)00124-9, 2003. a
Titos, M., Bueno, A., Garcia, L., and Benitez, C.: A deep neural networks approach to automatic recognition systems for volcano-seismic events, IEEE Journal of Selected Topics in Applied Earth Observations and Remote Sensing, 11, 1533–1544, https://doi.org/10.1109/JSTARS.2018.2803198, 2018a. a, b, c
Titos, M., Bueno, A., García, L., Benítez, M. C., and Ibañez, J.: Detection and classification of continuous volcano-seismic signals with recurrent neural networks, IEEE Transactions on Geoscience and Remote Sensing, 57, 1936–1948, https://doi.org/10.1109/TGRS.2018.2870202, 2018b. a, b, c, d, e, f, g, h
Titos, M., Bueno, A., García, L., Benítez, C., and Segura, J. C.: Classification of isolated volcano-seismic events based on inductive transfer learning, IEEE Geoscience and Remote Sensing Letters, 17, 869–873, https://doi.org/10.1109/LGRS.2019.2931063, 2019. a, b
Titos, M., Garcia, L., Kowsari, M., and Benitez, C.: Toward knowledge extraction in classification of volcano-seismic events: Visualizing hidden states in recurrent neural networks, IEEE Journal of Selected Topics in Applied Earth Observations and Remote Sensing, 15, 2311–2325, https://doi.org/10.1109/JSTARS.2022.3155967, 2022. a, b, c, d
Titos, M., Gutiérrez, L., Benítez, C., Rey Devesa, P., Koulakov, I., and Ibáñez, J. M.: Multi-station volcano tectonic earthquake monitoring based on transfer learning, Frontiers in Earth Science, 11, 1204832, https://doi.org/10.3389/feart.2023.1204832, 2023. a
Titos, M., Carthy, J., García, L., Barnie, T., and Benítez, C.: Dilated-RNNs: A Deep Approach for Continuous Volcano-Seismic Events Recognition, IEEE Journal of Selected Topics in Applied Earth Observations and Remote Sensing, 17, 11857–11865, https://doi.org/10.1109/JSTARS.2024.3421921, 2024. a, b, c, d, e
Weiss, K., Khoshgoftaar, T. M., and Wang, D.: A survey of transfer learning, Journal of Big Data, 3, 9, https://doi.org/10.1186/s40537-016-0043-6, 2016. a, b
Witze, A.: AI could help to predict eruptions, Nature, 567, 156–157, https://doi.org/10.1038/d41586-019-00752-3, 2019. a
Zandomeneghi, D., Barclay, A., Almendros, J., Ibañez Godoy, J. M., Wilcock, W. S., and Ben-Zvi, T.: Crustal structure of Deception Island volcano from P wave seismic tomography: Tectonic and volcanic implications, Journal of Geophysical Research: Solid Earth, 114, https://doi.org/10.1029/2008JB006119, 2009. a
Zhou, Z.-H.: A brief introduction to weakly supervised learning, National Science Review, 5, 44–53, https://doi.org/10.1093/nsr/nwx105, 2018. a
Zhu, W. and Beroza, G. C.: PhaseNet: a deep-neural-network-based seismic arrival-time picking method, Geophysical Journal International, 216, 261–273, https://doi.org/10.1093/gji/ggy423, 2019. a