the Creative Commons Attribution 4.0 License.
the Creative Commons Attribution 4.0 License.
 | 25 Jul 2025
Exploring the interplay between observed warming, atmospheric circulation, and soil–atmosphere feedbacks on heatwaves in a temperate mountain region
Marc Lemus-Canovas
Sergi Gonzalez-Herrero
Laura Trapero
Anna Albalat
Damian Insua-Costa
Martin Senande-Rivera
Gonzalo Miguez-Macho
This study investigates the exceptional heatwaves of 2022 in the Pyrenees, focusing on their physical drivers and environmental influences. The June heatwave was advective in nature, with stronger mountain-induced circulations resulting in heterogeneous temperature anomalies, while the July event had subsiding and weaker atmospheric flow, leading to more uniform temperatures. The interplay of the synoptic circulation with the complex topography or the pre-existing soil moisture deficits played an important role in driving the spatial variability of temperature anomalies in the heatwaves and contributed significantly to their regional amplification. In addition, human-induced climate change has exacerbated these extreme weather phenomena, with more intense heatwaves in the recent period (1986–2021) compared with the past (1950–1985). This research contributes to a more realistic assessment of the impact of climate change on heatwaves in mountain regions.
- Article
(12985 KB) - Full-text XML
-
Supplement
(1372 KB) - BibTeX
- EndNote


The Pyrenees constitute one of the southernmost alpine mountain ranges in Europe, and they are prone to severe heatwaves due to their location in a climatic transition zone between the humid temperate domain of higher latitudes and the dry warm domain of subtropical latitudes. Numerous observation-based studies in this region have shown a consistent temperature increase during the last few decades, across all seasons (Pérez-Zanón et al., 2017; Moreno et al., 2018; Lemus-Canovas and Lopez-Bustins, 2021). The observed changes in temperature increase have already impacted ecosystems (Camarero, 2017; Gazol et al., 2020), leading to a reduction in snow cover and ice mass loss (López-Moreno et al., 2016, 2020; Vidaller et al., 2021), among other effects.
Despite the observed upward trend in mean temperatures, the relationship between specific extreme temperature events, such as the 2022 summer heatwaves, and global warming has not yet been thoroughly investigated in the Pyrenees. Studies from other regions (Barriopedro et al., 2020; Yiou and Jézéquel, 2020; Xu et al., 2021; White et al., 2023) have demonstrated that extreme temperatures are often associated with significant anomalies in large-scale atmospheric circulation patterns. In southwestern Europe, where the Pyrenees are located, high-temperature episodes or heatwaves are usually driven by subtropical high-pressure systems known as subtropical ridges (García-Herrera et al., 2005). These systems manifest as narrow bands of positive geopotential height anomalies extending from subtropical latitudes into southern Europe (Sousa et al., 2018). Prolonged periods of elevated geopotential heights promote atmospheric subsidence, leading to substantial adiabatic warming and increased surface radiative fluxes (Zschenderlein et al., 2019). Such adiabatic processes allow for the maintenance of high surface temperatures during heatwaves, as observed in numerous studies in different regions (Miralles et al., 2014; Sousa et al., 2019; Zschenderlein et al., 2019; González-Herrero et al., 2022, among others). Heatwaves can also be intensified by land–atmospheric coupling effects. Soil with low moisture prior to a heatwave event can exacerbate extreme conditions as latent heat fluxes are reduced and sensible heat fluxes increase, which in turn reduces evaporative cooling and thus increases air temperature (Fischer et al., 2007; Seneviratne et al., 2010). The contribution of very dry soil to the intensification of heatwaves has been demonstrated at both large scales and in specific events (Miralles et al., 2014; Schumacher et al., 2019; Sousa et al., 2020), such as the 2010 and 2018 heatwaves in Europe. However, a more regionally focused approach that explicitly accounts for the complex topography and local climate dynamics in mountain areas and their surrounding region is still lacking in the above-mentioned studies.
In this study, we focus on two heatwaves that occurred in the summer of 2022, one in June and one in July. Such heatwaves broke several temperature records in western Europe (Witze, 2022; Yule et al., 2023; Serrano-Notivoli et al., 2023) and had severe impacts on ecosystems, such as provoking an acute wildfire outbreak in Spain (Rodrigues et al., 2023) or causing extreme glacial melting in Switzerland (Cremona et al., 2023). The Pyrenees area was no exception in the context of summer 2022. Both the duration and, especially, the intensity of heatwaves associated with this extremely warm season were unprecedented in this mountain system and its surrounding areas (Fig. 1a). Therefore, the specific objectives of the present study are (1) to assess the dynamic and thermodynamic mechanisms that contributed to the two extreme heatwaves of summer 2022 in the Pyrenees and surrounding areas, (2) to examine the role of the observed anthropogenic forcing in these heatwaves that made this summer the warmest on record (1950–2022), and based on reanalysis data and observations, (3) to study the soil moisture–temperature feedbacks during these events and analyse the possible differential temperature amplification induced by them in the study region.
2.1 Data
Daily minimum and maximum 2 m temperatures (hereafter, Tn and Tx, respectively) were extracted from the European Centre of Medium range Weather Forecast (ECMWF) ERA-5-Land reanalysis (Copernicus Climate Change Service, C3S, Muñoz-Sabater et al., 2021). These variables were used to characterise anomalies and extremes during the 2022 events and to compute the heatwave algorithm. In addition, Tx was used as a predictand in the analogue's exercises. Apart from temperature data, volumetric soil moisture (in m3 m−3) in a layer of 0 to 7 cm depth (SM) was also retrieved and used for computing anomalies and for the analogue exercise, with respect to the climatological seasonal cycle (1950–2021). Finally, cumulative daily surface solar and thermal net radiation (Rn), evaporation (E), and potential evaporation (Ep) were employed to examine land–atmosphere interactions during heatwave events. Meteorological fields for atmospheric levels were retrieved from the ERA-5 reanalysis daily dataset (Hersbach et al., 2020), starting in 1950. The following variables were considered on a 0.25° × 0.25° horizontal-resolution grid for the pressure levels comprised between 1000 and 500 hPa: air temperature, potential temperature, geopotential height, zonal/meridional wind components, and vertical velocity. These fields were used to (i) characterise the synoptic drivers of both heatwaves, (ii) generate vertical profiles, (iii) compute the contributing terms to the temperature tendency equation, and (iv) perform the analogue exercises. Specific methods for products derived from these variables are explained below. In all cases, anomalies were also computed with respect to the climatological seasonal cycle (1950–2021).
For validation purposes, Tx of the summer season (JJA) was extracted from the database of the CLIMPY project; this cross-border initiative aimed to perform a comprehensive analysis of recent trends in temperature, precipitation, and snow cover in the Pyrenees and their future projection (Cuadrat et al., 2024). Data for these variables were provided on a high-resolution grid of 1 km × 1 km, covering the period 1981–2015. This dataset was derived from observations collected at 1343 weather stations located in Andorra, France, and Spain; the grid was developed following the quality control, reconstruction, and gridding processes outlined by Serrano-Notivoli et al. (2017, 2019). Finally, three in situ weather stations' time series of daily Tx and total precipitation located in Huesca (Aragon, Spain), Encamp (Andorra), and Tarbes (Hautes-Pyrénées, France) were retrieved from the Spanish National Meteorological Agency (AEMET), FEDA (Forces Elèctriques d'Andorra), and the European Climate Assessment & Dataset (ECA&D), respectively. Three stations comprise the period 1950–2022. As mentioned above, both the CLIMPY grid and in situ stations were used to support the results obtained through ERA5-Land.
2.2 Methods
2.2.1 Heatwave definition
Heatwaves were defined as periods of 3 or more consecutive days with daily Tx and Tn values above the climatological (1950–2021) 99th percentile, calculated based on a 31 d moving window centred in the specific calendar day, following a similar approach as Russo et al. (2014). The heatwave incidence per summer season (June–August 1950–2022) was explored by accounting for both heatwave duration and heat intensity. The intensity indicator was defined as the cumulative temperature anomaly during an event with respect to the above-mentioned Tx and Tn climatological thresholds. This indicator was also provided annually by summing all the heatwave intensities recorded each summer season. For the attribution analysis, the two heatwaves of summer 2022 accumulating the greatest heat intensity were selected as study cases. To obtain the most geographically extensive heatwaves, another criterion was used whereby at least 80 % of the study area was affected by a heatwave situation.
2.2.2 Thermodynamic equation
We assessed the contribution of physical processes to preconditioning, build-up, maintenance, and decay of the heatwaves using the thermodynamic equation:
where is the horizontal wind, T the temperature, ω the vertical velocity in pressure coordinates, θ the potential temperature, and p the pressure. We evaluated Eq. (1) at 700 hPa in order to measure the processes that regionally affect the study area while avoiding surface effects and intersecting mountains. The left-hand-side term represents the temperature tendency, while the right-hand-side terms represent the horizontal advection, the adiabatic term, and the diabatic processes, respectively. The first three terms were computed for every grid point in the Pyrenees area and then averaged regionally. To compute the adiabatic vertical gradients, we used the fields at 750 and 850 hPa. The diabatic term was calculated as the residual of the other components and therefore might include other factors, such as numerical errors.
2.2.3 Soil moisture–temperature coupling metric
To assess and quantify the magnitude of soil moisture–temperature coupling, we used the π diagnostic proposed by Miralles et al. (2012). This indicator estimates two terms based on near-surface air temperature (T), evaporation (E), potential evaporation (Ep), and surface net radiation (Rn). The π metric is defined as the product of a standardised temperature term (T′) and energy term ().
where H′ represents the actual sensible heat derived from the estimated evaporation and surface net radiation, and denotes the sensible heat that would occur under potential evaporation. Both H′ and are expressed as standard deviations relative to their expected mean.
Here, λE is the latent heat flux of vaporisation, calculated as a function of T and Rn following Priestley and Taylor (1972). The energy term () effectively represents the short-term potential of soil moisture to influence T by altering the partitioning of available radiative energy. When soil moisture is sufficient to meet the atmospheric demand for water, evaporation equals the potential evaporation, and the energy term is zero. Under dry conditions, as atmospheric water demand increases and soil moisture gradually decreases, the energy term increases. Consequently, the soil moisture–temperature coupling (π) attains high values when positive values of T′ co-occur with elevated levels of (). The π diagnostic was computed daily for each grid point during the summer season (JJA). The resulting spatial π time series was used in one of the analogue exercises and to draw a cross-section to estimate the extent of the coupling across the study area for the 1950–2022 summer period.
2.2.4 Flow analogues
To understand the role of different drivers exacerbating the intensity of the heatwaves under study, we used the analogue approach, which infers the probability distribution of a target field from the atmospheric circulation during a considered time interval (Jézéquel et al., 2018). Here, two analogue experiments were designed for each heatwave event but with different target fields, one to examine climate warming attribution and the other to establish the role of soil moisture. They are explained in detail below. In both cases, flow analogue days are defined from their root-mean-square differences (RMSD) with respect to the actual z500 anomaly field at the time of the heatwave event over the following synoptic domain (30–50° N, 20° W–10° E), centred on the Pyrenean domain (41.9–43° N, 1.5° W–2.9° E, rectangle box in Fig. 1e–j). For each day of the considered heatwave event, the search for flow analogues was restricted to the boreal summer months (JJA), excluding the year of occurrence of the heatwave. Analogue days are used to reconstruct the target field by randomly picking one of the N best flow analogues for each day of the heatwave event. This reconstruction was repeated up to 5000 times. This N value was set to 30, being the ∼ 1 % of the sample size close to the event. For both analogue experiments, we employed z500 at the daily scale as a predictor in the search for flow analogues. In all cases, anomalies were defined with respect to the 1950–2021 period.
In the first analogue experiment, we spatially reconstructed the expected mean Tx and π for each event and for both study periods: 1950–1985 and 1986–2021. In addition, we reconstructed the SM fraction for the 15 d period ( d interval) preceding each day of the June and July heatwave by using the same technique. Specifically, the flow-conditioned reconstructions of Tx and SM were also averaged over the Pyrenean domain for each subperiod. Since the atmospheric circulation is constrained, the differences between the past and present reconstructions can primarily be attributed to overall climatological variations between the two subperiods. To estimate the contribution of regional warming to the amplification of such events, we then repeated this flow analogue experiment by linearly removing the trend in z500 and Tx.
A second flow analogue experiment was based on the approach proposed by Sousa et al. (2020) to address whether the previously accumulated soil moisture deficits over the Pyrenean domain could have contributed to intensifying the temperature anomalies over that region at the time of the July heatwave. In this case, we reconstructed Tx anomalies expected from the circulation during the June and July heatwave, distinguishing between analogue days preceded by dry and wet conditions. Wet and dry conditions were defined as summer days of the full period with 15 d mean regional anomalies for the previous 15 d interval staying above the 66th percentile and below the 33rd percentile of the climatological SM distribution, respectively. In this way, soil moisture departures of a given analogue day represent previously accumulated values and are not the direct response to the actual atmospheric circulation conditions. To avoid the effects of long-term trends that may further complicate the causality of the relationships between soil moisture and temperature, these fields and z500 were detrended by linearly removing their trends. This second experiment was repeated using the high-resolution Tx CLIMPY dataset to provide a validation of the results obtained with ERA-5-Land. The results achieved with the latter experiment were extended beyond the aforementioned Pyrenean domain in order to better understand the spatial patterns obtained.
3.1 The two extreme warm events and their associated atmospheric circulation
During the summer of 2022, successive heatwaves affected the Pyrenees reaching intensities never recorded in the instrumental data period in 52 % of its area (Fig. 1a). Additionally, 10 % of the region experienced a record number of cumulative days in heatwave conditions. The most intense heatwaves occurred between 12 and 19 June (June Heatwave, June HW, Fig. S1a in the Supplement) and between 15 and 19 July (July heatwave, July HW, Fig. S1b). These extreme heat events resulted in positive near-surface maximum temperature (Tx) anomalies ranging between 6 and 12 °C for the June event (Fig. 1e) and between 9 and 14 °C for the July event (Fig. 1f). These anomalies generated absolute record values in the Aquitaine Basin (Tarbes) (Fig. 1d) and mountainous areas such as Encamp in Andorra (Fig. 1b). The July heatwave (Fig. 1f) was the most intense of the summer, with Tx anomalies generally higher than those of the June heatwave (Fig. 1g). However, to the south and north of the mountain range, both heatwaves showed similar anomalies.
South of the Pyrenees, in the Ebro Valley, some precipitation was recorded during the period between the two heatwaves, yielding a higher SM before the July heatwave (Fig. 1h, i). This could have increased evaporative cooling, therefore favouring less of a Tx amplification of the second heatwave in that specific area. In contrast, within the Pyrenees Mountain range itself and mainly on its southern slope, the amplification of the July heatwave compared to the June heatwave was more than 3 °C in some areas. Nevertheless, no significant variations in soil moisture were observed between the two heatwaves (Fig. 1j), which indicates that such differences in the intensity of the events were not caused by diabatic mechanisms alone.
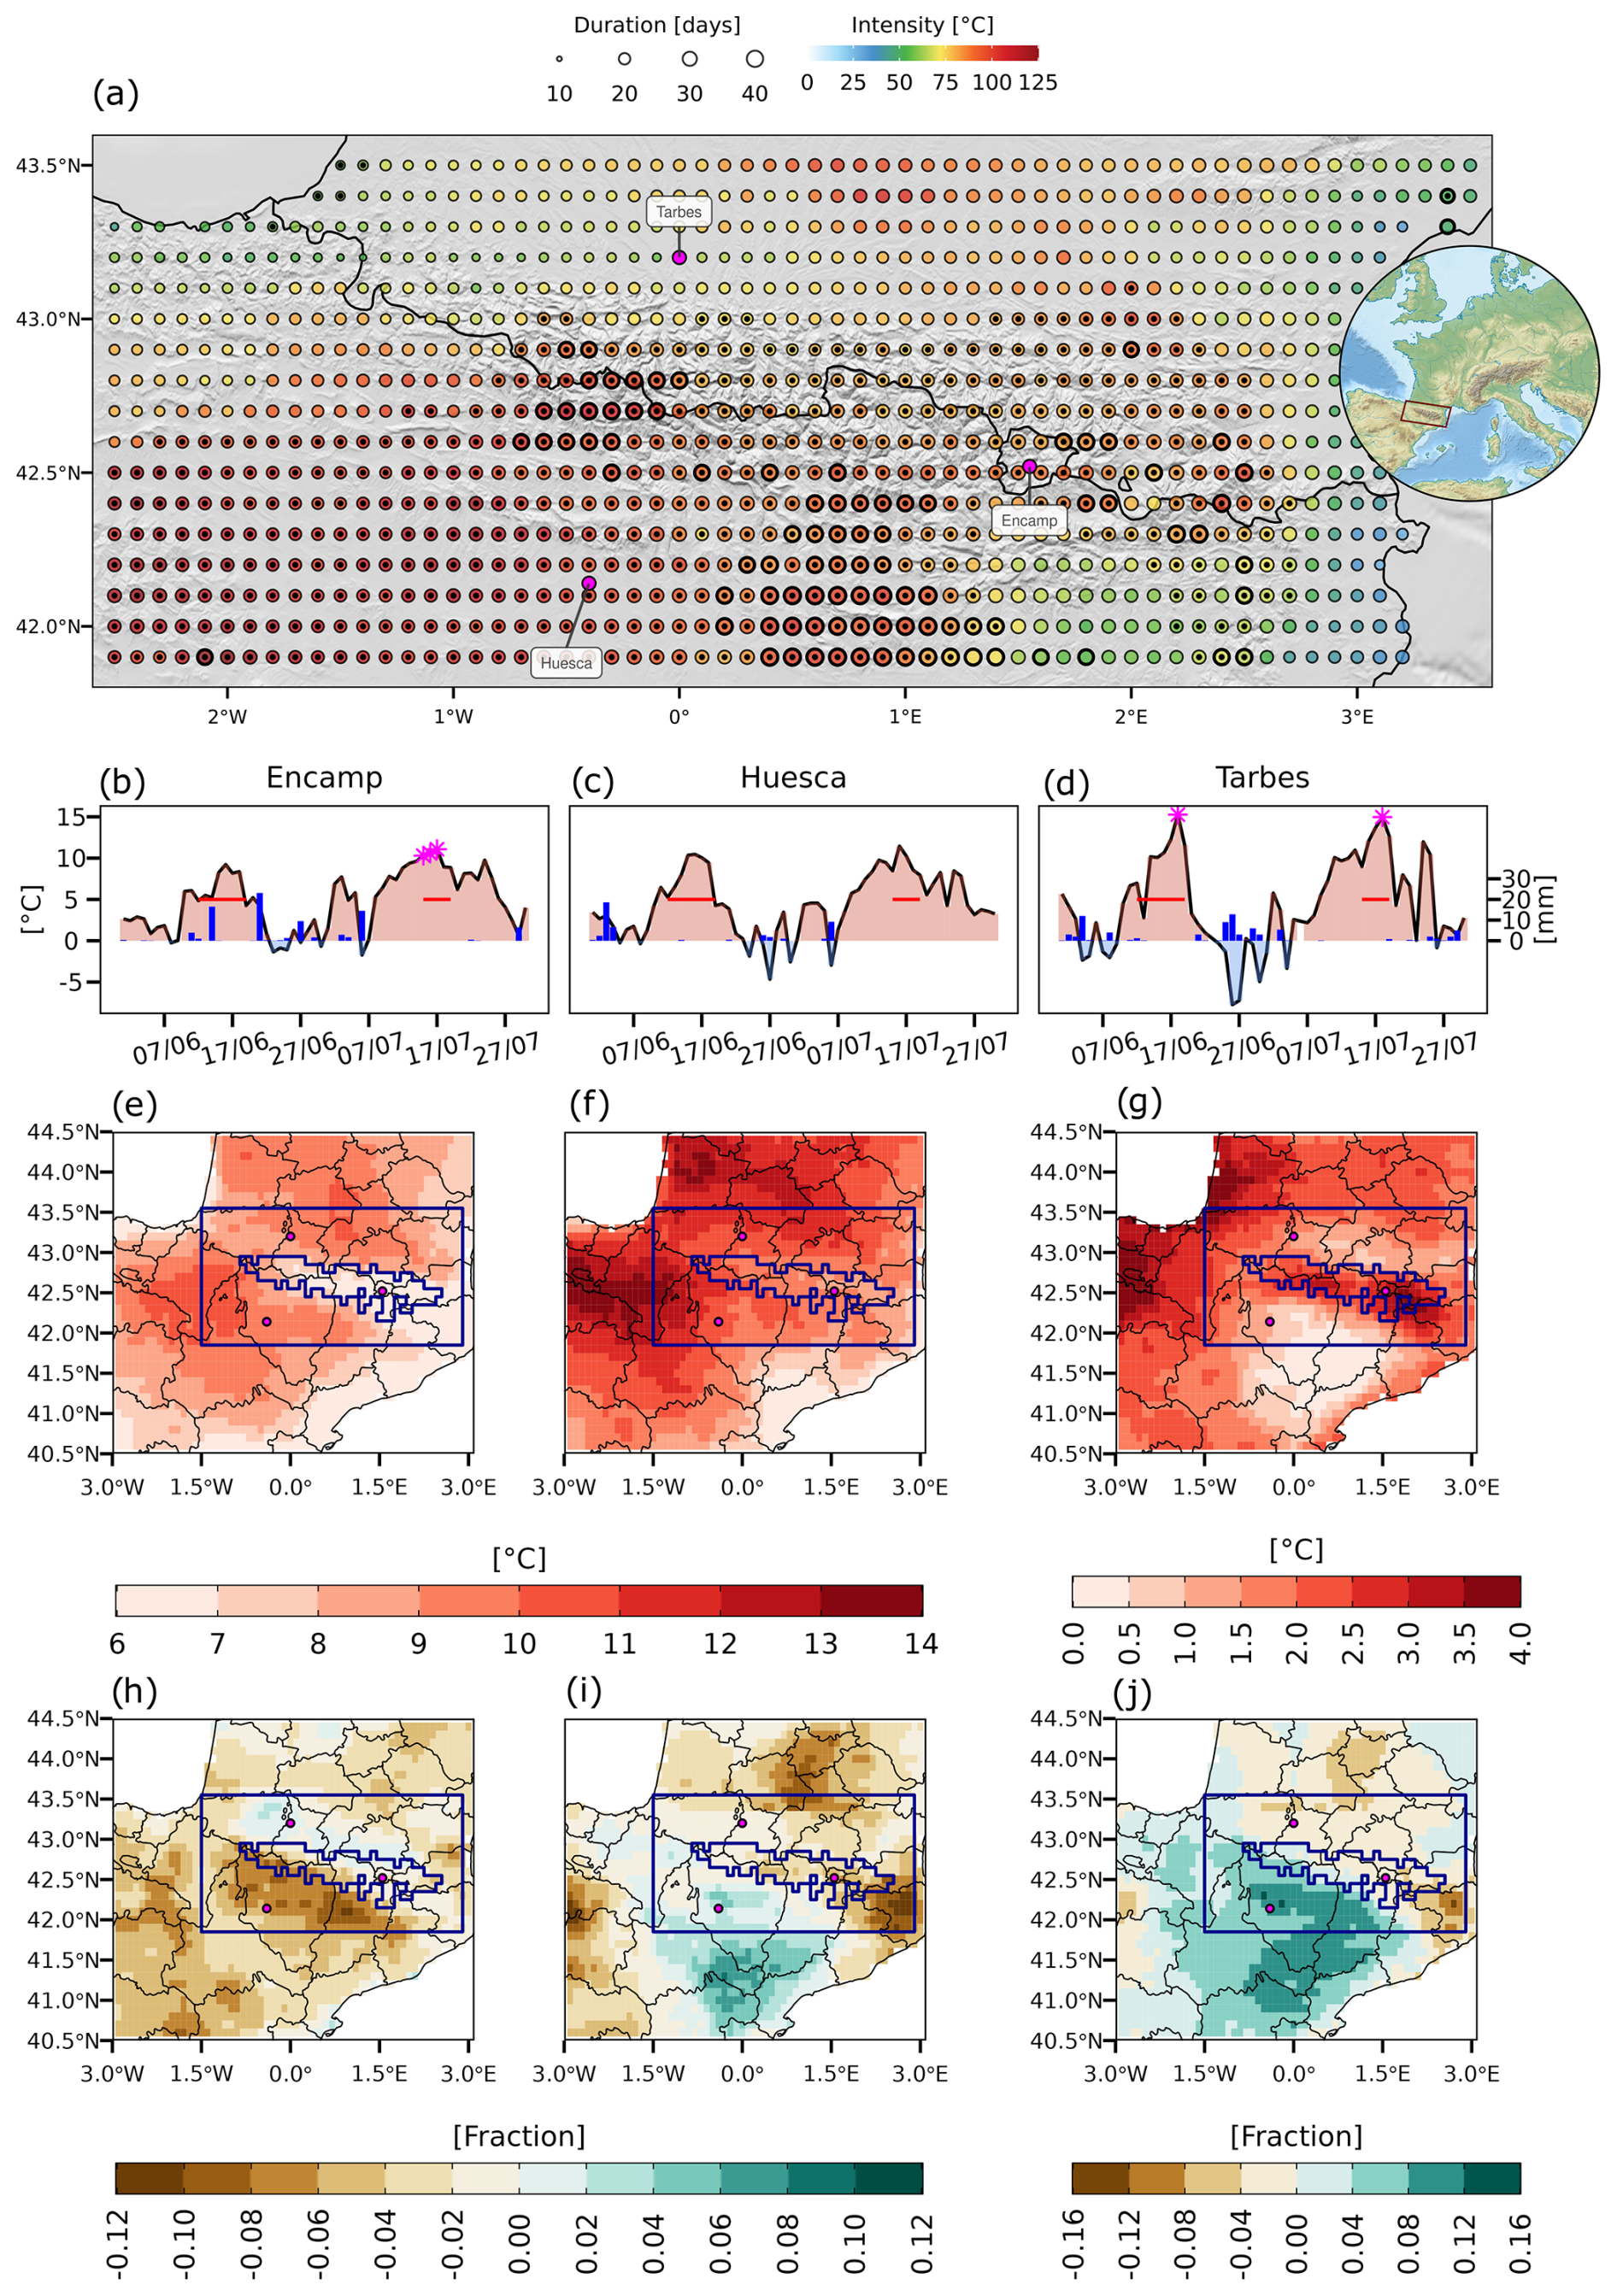
Figure 1Climatological description of the 2022 heatwave events in the Pyrenees. (a) Intensity (colours) and duration (sizes) of summer 2022 heatwaves (JJA). Dots inside the circle in panel (a) denote a record in the accumulative summer heatwave intensity, whereas thicker borders represent a record in duration for the period 1950–2021. (b, c, d) Time series of observed temperature anomalies (red- and blue-shaded) and precipitation (vertical bars) in Encamp, Huesca, and Tarbes. Horizontal red lines represent the heatwave periods and magenta asterisks show absolute records. (e, f) Temperature anomalies during the (e) June and (f) July heatwaves and (g) the difference between July and June heatwaves. (h, i) Soil water fraction anomaly in the first soil layer (0–7 cm depth) (SM, m3 m−3) during the (h) June heatwave and the (i) July heatwave, and (j) the difference between July and June heatwaves. The solid blue rectangles and regions highlighted in panels (e–j) show the Pyrenean domain and the areas above 1000 m a.s.l., respectively. Red points in the same panels indicate the location of Encamp, Huesca, and Tarbes. Anomalies are calculated with respect to the period 1950–2021.
Atmospheric dynamics could also partly explain the aforementioned temperature differences (Fig. 2). The two main heatwaves of summer 2022 were driven by a deep subtropical ridge in the mid-troposphere (500 hPa) (Fig. 2a), resulting in exceptional geopotential height anomalies (Fig. 2b) over a large part of western Europe, consecutively breaking records (Fig. 2c). In both events, the 850 hPa temperature anomalies exceeded the 100th percentile across the Pyrenees area (Fig. 2d), implying a thermal anomaly between 6 and up to 10 °C at this pressure level (Fig. 2b). However, the exhibited 500 hPa geopotential height anomalies were up to 40 m greater during the July HW than the June HW. Furthermore, the 700 hPa wind field displayed a marked difference between the two episodes. The June heatwave was clearly dominated by strong southwestern winds at mid-levels and low levels, while in the second case the wind was much weaker and, therefore, the advection was lower (Fig. 2a).
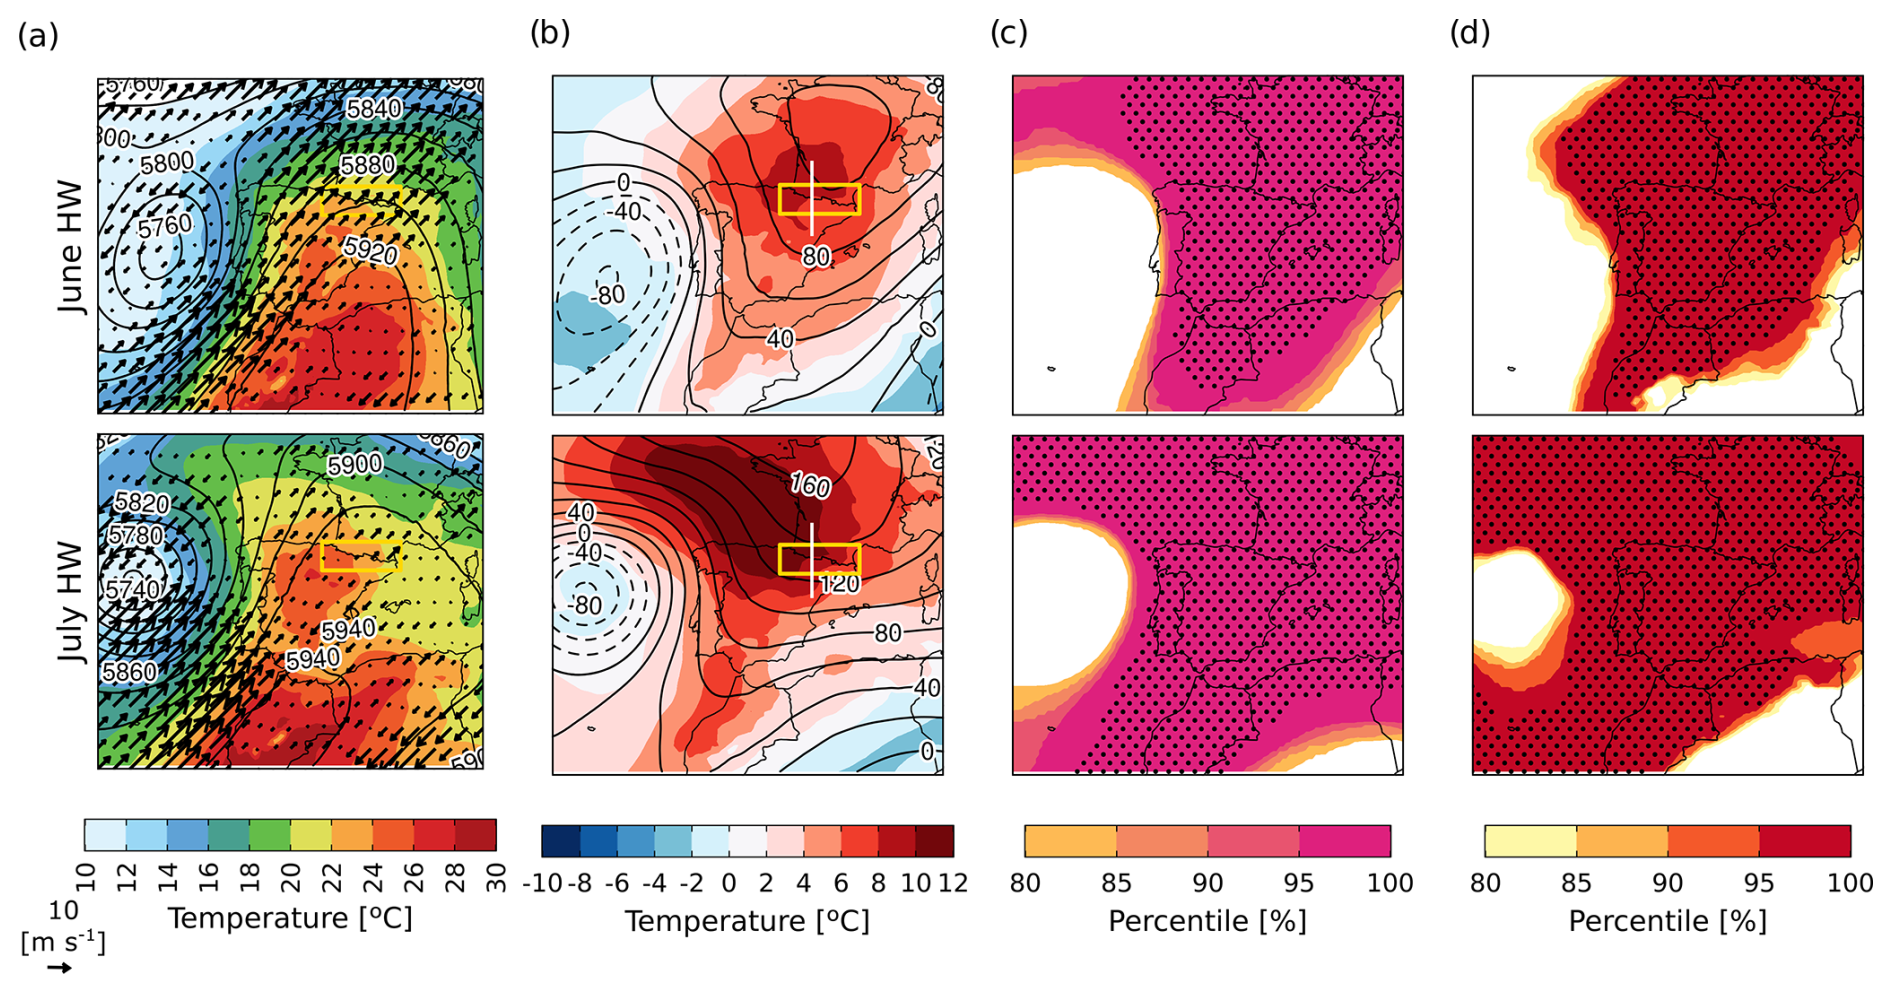
Figure 2Mean synoptic setting of the June and July heatwaves. (a) Geopotential at 500 hPa (m, contours), temperature at 850 hPa (shaded), and wind at 700 hPa (arrows). (b) Geopotential at 500 hPa (m, contours) and temperature at 850 hPa (shaded) anomalies with respect to 1950–2021. (c, d) Percentile of (c) geopotential at 500 hPa and (d) temperature at 850 hPa, with respect to the climatological values calculated from a 6 d running mean of all summer days in the period 1950–2021. Stippling shows record-breaking values. Top and bottom rows show the June and July heatwaves (HWs), respectively. The solid yellow box in panel (b) highlights the Pyrenean domain, whereas the vertical white line indicates the area used for the cross-section in Fig. S2.
3.2 Distinct physical processes led to different intensities for each heatwave in the mountains
As noted in the previous section, although both heatwaves were synoptically dominated by a subtropical ridge, they were dynamically different in terms of the physical processes leading to the Tx anomalies (Röthlisberger and Papritz, 2023). Specifically, the July event was more favourable for adiabatic processes due to the larger geopotential height anomalies combined with weak mid- and low-level winds, in contrast to the June heatwave, which had a more advective nature owing to the lower geopotential height values and the significantly stronger wind flow.
To better understand the different physical mechanisms that gave rise to the high temperatures in the Pyrenees region, we separately quantified the temperature changes aloft of the mountains due to adiabatic, diabatic, and advective processes (Fig. 3). We conducted this analysis for both heatwaves at 700 hPa, to avoid the influence of the terrain in the analysis. For each heatwave, we identified three phases. The first phase involved preconditioning (Fig. 3, purple shading), with a sudden temperature increase preceding the heatwave, providing a high baseline temperature. Adiabatic heating dominated this phase, indicating the importance of the ridge placement and associated subsidence for the subsequent heatwave development. During the build-up and maintenance phase (Fig. 3, red shading), key processes differed between the heatwaves. The June heatwave was primarily driven by a warm advection during the first 2 d, associated with the southwesterly winds noted in the previous section. All components then remained almost neutral during the maintenance phase. In contrast, the July heatwave slowly developed over 4 d through adiabatic processes, with only 2 d of maintenance when the adiabatic warming decreased and was counteracted by diabatic cooling. Both heatwaves declined when the sum of components turned negative, resulting in a decrease in the absolute temperature tendency (Fig. 3, the grey shading).
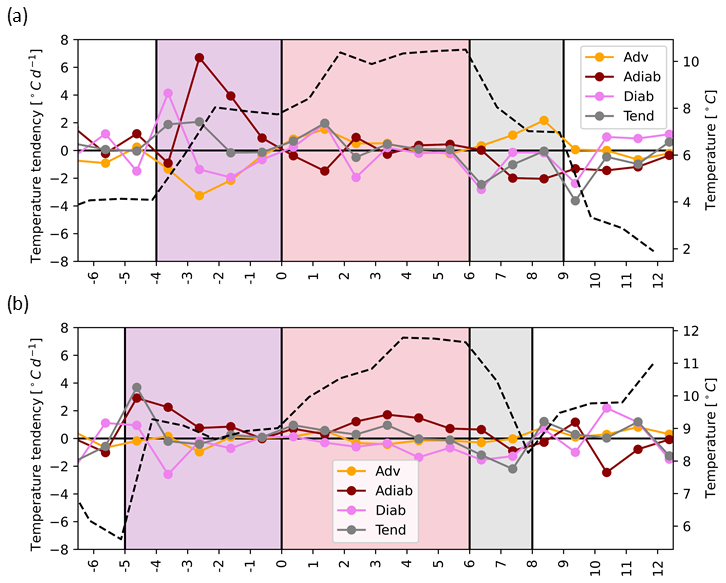
Figure 3The physical processes contributing to the summer 2022 heatwaves. Time series in days from the beginning of the episode of the components of the heat tendency equation at 700 hPa during the (a) June heatwave and (b) July heatwave. The coloured lines indicate the temperature tendency for each component and the dashed black line indicates the temperature at 700 hPa. Shaded areas indicate the three phases of the heatwave: preconditioning (purple), build-up and maintenance (red), and decline (grey). The x axis dates are provided with respect to the initial build-up date.
The divergence in processes between the two heatwaves partially accounts for the varying amplification observed in the July heatwave compared with the June heatwave in the Pyrenees. During the June heatwave, higher horizontal wind speeds aloft generated mountain circulations characterised by updrafts on the windward side (south) and downdrafts on the leeward side of the Pyrenees (Fig. 4a). As a result, although advection caused a temperature increase across the entire region, the compression caused by the downdrafts on the lee side led to an increase in the temperature anomaly to the north of the Pyrenees (Fig. 4b). Conversely, the higher areas of the Pyrenees experienced fewer temperature anomalies during the June heatwave, due to windward updrafts to the mountain tops causing slight cooling by expansion, all of which led to a temperature gradient between both sides of the mountain range exceeding 3°. In contrast, the July heatwave featured reduced atmospheric flow and more subsidence (Fig. 4c), resulting in a more homogeneous temperature distribution on both sides of the mountains and the absence of a cooling effect at the summits (Fig. 4d). This explains the amplification of the July heatwave over the Pyrenees with respect to the June heatwave observed in Fig. 1g but cannot explain the low amplification that occurs in the Ebro Valley south of the Pyrenees.
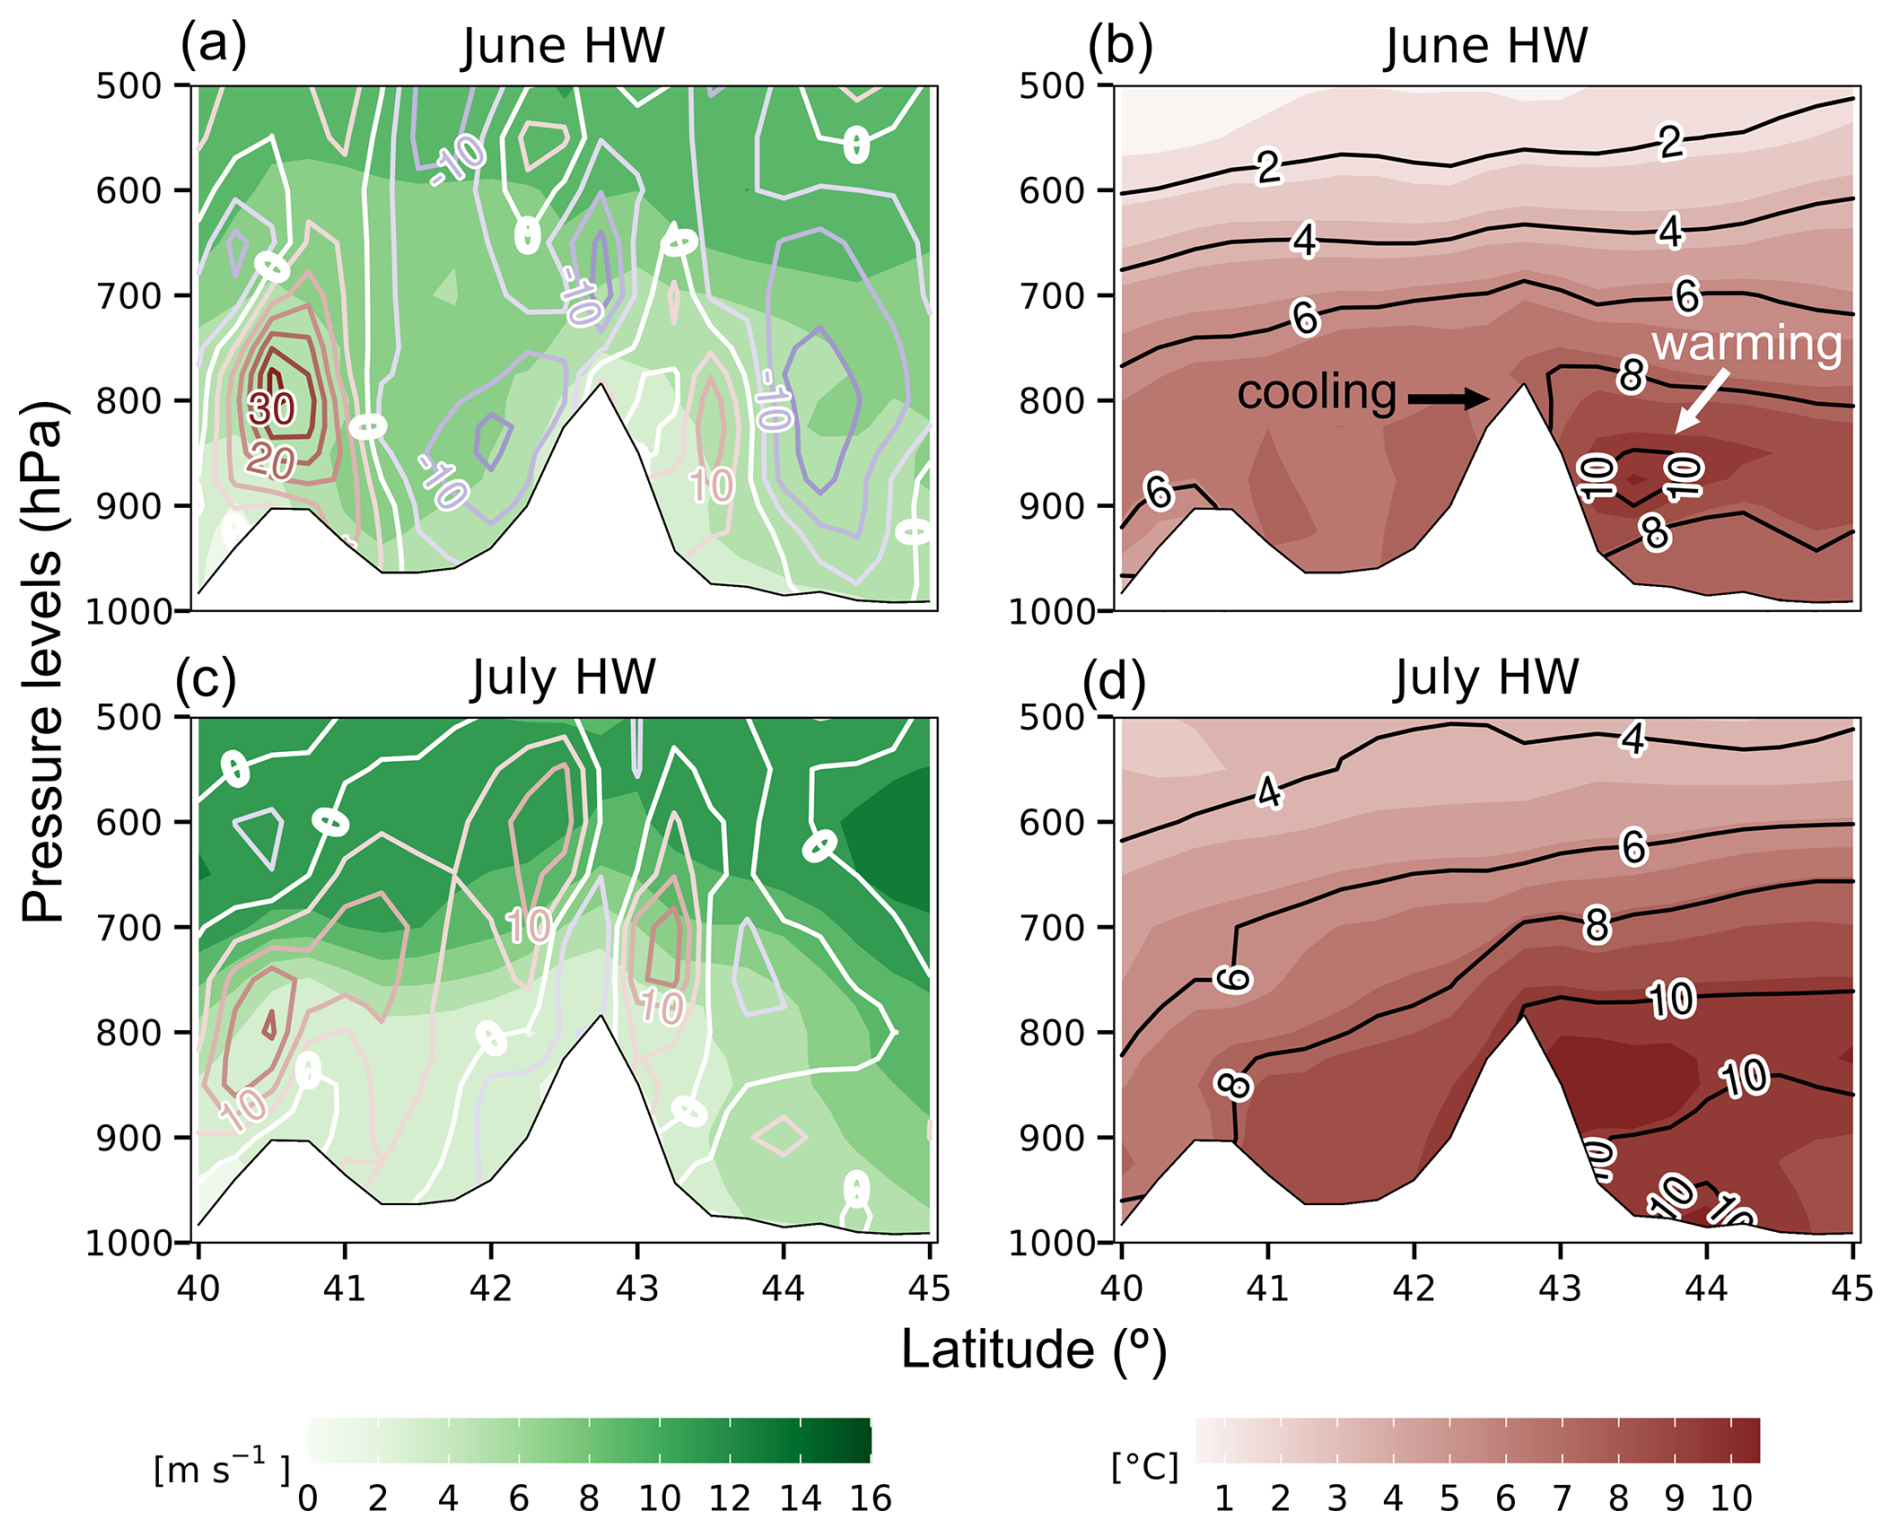
Figure 4Cross-sections through the Pyrenees at longitude 0° during the June and July heatwaves. (a, c) Wind speed (shaded, m s−1) and vertical velocity (contours, hPa d−1, negative values indicate updrafts) are shown for June (a) and July (b) heatwaves (HWs). (b, d) Temperature anomalies (shaded, °C) and potential temperature anomalies (contours, °C). (a, b) June HW. (c, d) July HW.
3.3 Exploring the role of observed warming and soil moisture–temperature feedbacks by means of flow analogues
3.3.1 Analysis of analogous situations
To investigate the role of the anthropogenic forcing in the amplification of these heatwaves, we analysed the 30 analogous days closest to the actual atmospheric configurations leading to the case studies. Specifically, we intercompare the Tx anomalies between the 30 circulation analogues in the more recent period (1986–2021) and 30 in the past period (1950–1985). These circulation analogues showed a temperature intensification for both the June and July heatwave events in the Pyrenees region (Fig. 5a, d); in both cases, the median Tx in the group of more recent analogues presented a Tx anomaly that clearly exceeded the anomalies reached in the group of past analogues by more than 1°.
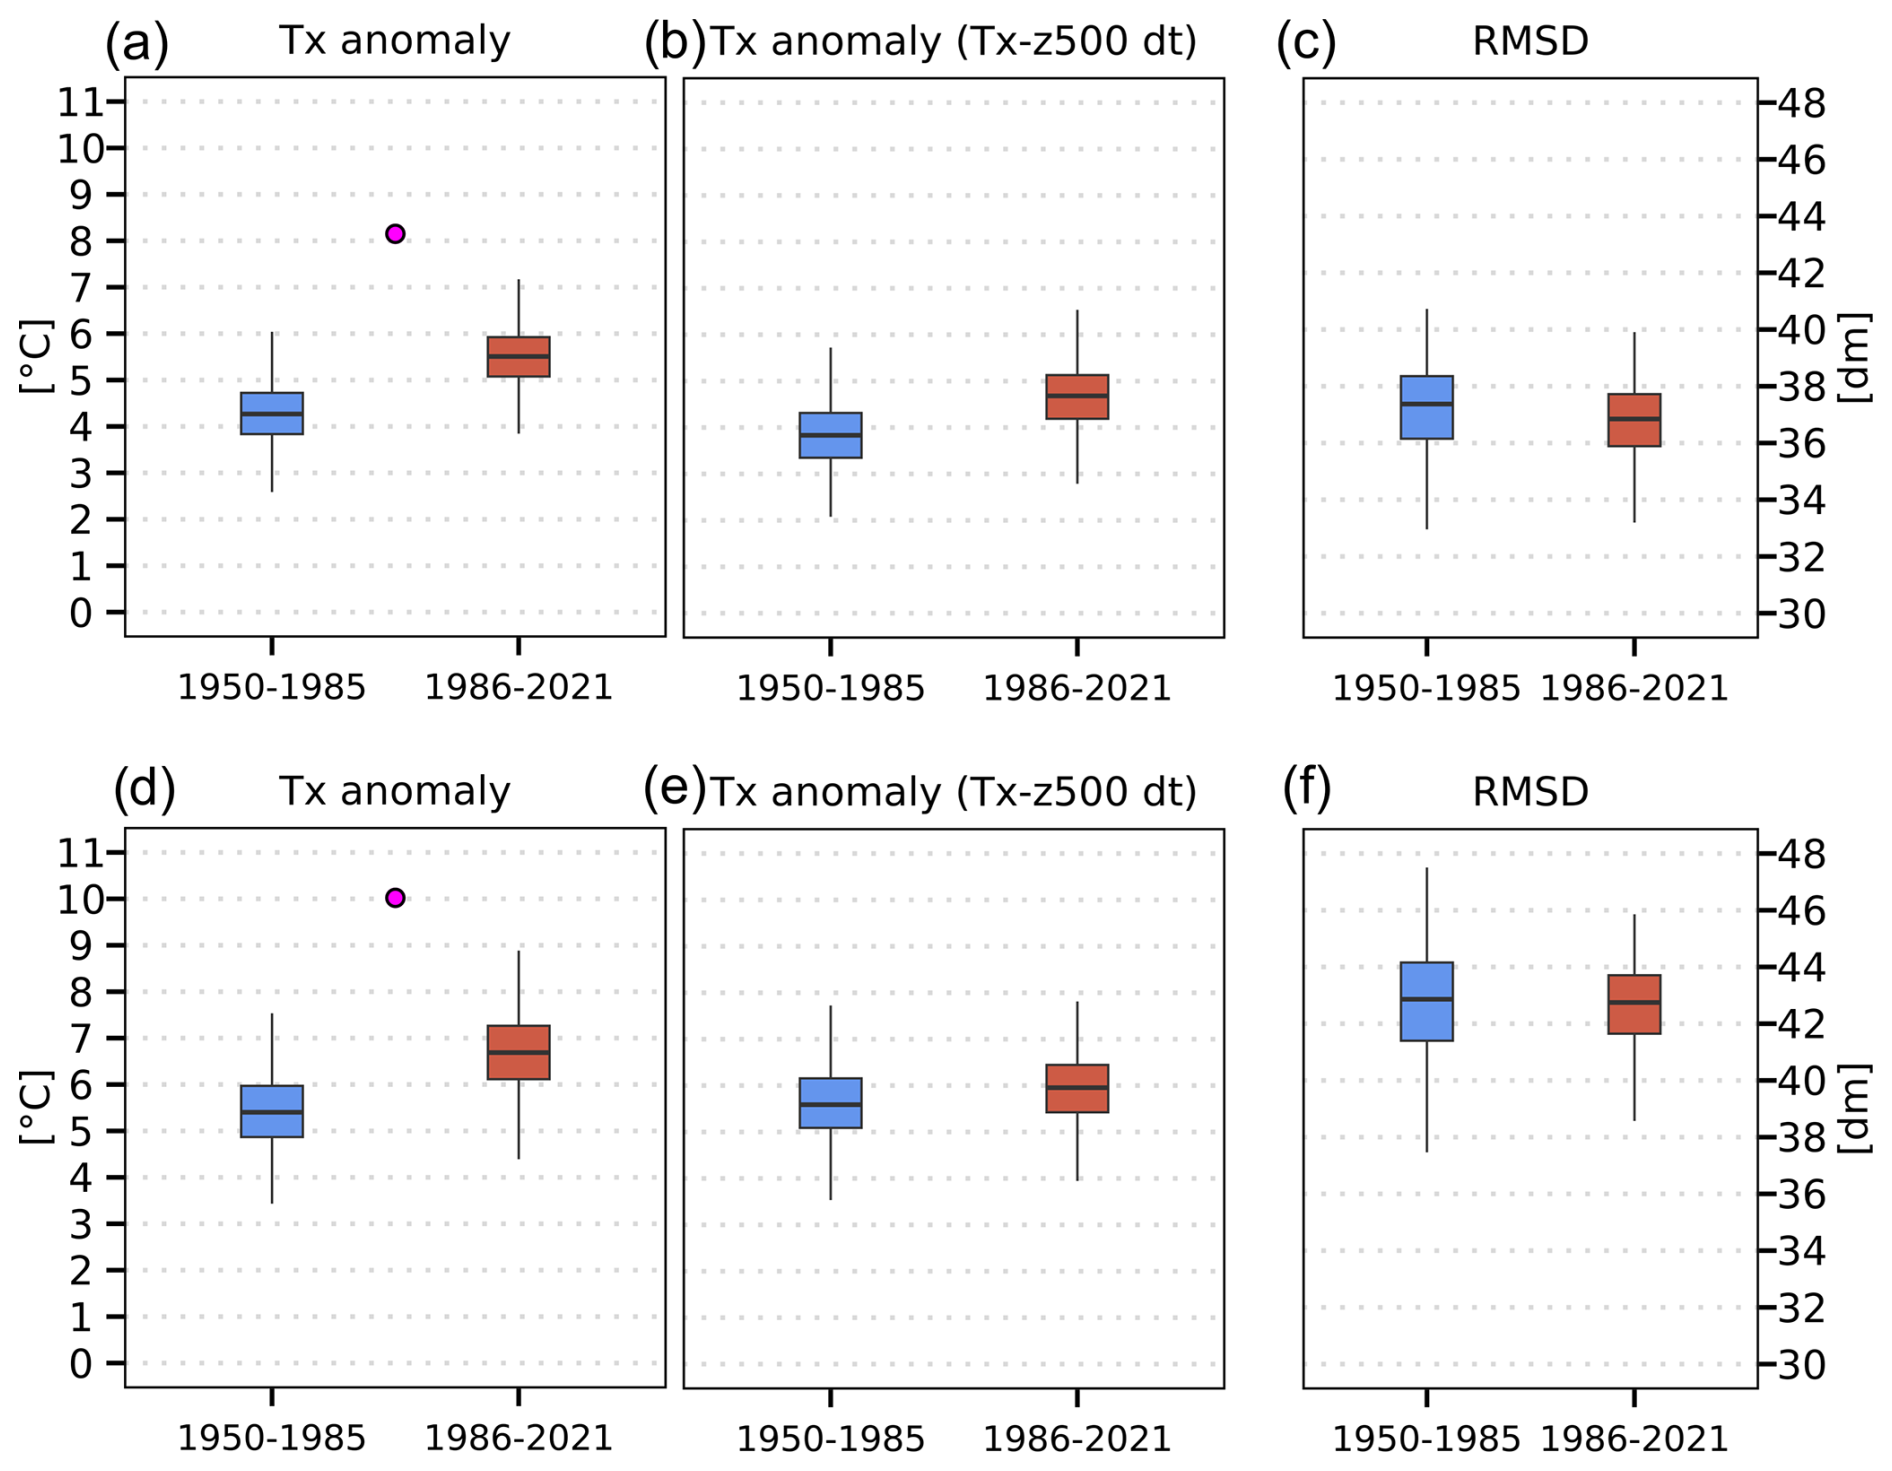
Figure 5Flow-conditioned distributions of Tx daily mean anomaly reconstruction for each heatwave event (June: a–c; July: e–f) and for the Pyrenean domain (41.9–43° N, 1.5° W–2.9° E). Panels (a) and (d) show the distributions obtained from raw data; panels (b) and (e) show the distributions detrending z500 and Tx. The magenta dot in panels (a) and (d) denotes the mean value of observed Tx for each heatwave. Panels (c) and (f) present the spatial structure similarity between the reconstructed event and the original one based on z500. Boxes show the 25th–75th percentile ranges, and whiskers span the 1st–99th percentiles. Blue and red boxes are representative of the past and current periods.
An additional analysis was performed to check whether this temperature intensification could, to some extent, be caused by changes in the atmospheric circulation. In addition, to ensure that this amplification is caused by a pure thermodynamic change between periods we removed the trend in both geopotential height and Tx (Sousa et al., 2019; Barriopedro et al., 2020), obtaining smaller differences between the two periods (Fig. 5b, e) compared with the previous experiment using raw data. Nevertheless, as can be seen, a certain bias remains between periods, especially in the June heatwave. We suggest that such differences, notwithstanding the removal of the linear trend in both z500 and Tx, could be related to non-linear phenomena, such as the role of land–atmosphere interactions presented in the following section. The above shows that the temperature difference between the analogues of the two climate periods is mainly linked to a long-term trend in temperature. Assuming that this trend is largely due to global warming, this would indicate that the two heatwaves of 2022 were exacerbated by the observed anthropogenic warming, although some other non-linear processes could also have been involved.
Finally, it is important to point out that the spatial structure of our synoptic situations analogous to the June and July heatwaves remained similar in both periods (Fig. 5c, f) – which is consistent with other heatwave attribution studies in the western Mediterranean (Faranda et al., 2022) – and that their occurrence remained stationary, since we did not find a statistically significant trend in the number of analogues of both events in the period 1950–2021 (Fig. S2). However, an important distinction emerges when considering the degree of similarity between the analogues and the observed situations (Fig. 5c, f). The July heatwave analogues are not as similar to the actual event (higher RMSD, Fig. 5f) as those for June (lower RMSD, Fig. 5c). This suggests that the July heatwave was a more anomalous event within the historical synoptic context, whereas the June heatwave had more dynamical precedents in past circulation states, as indicated by the closer match between the analogues and the observed conditions.
These differences or mismatches between the analogues and the observed events are also evident in their spatial structure. Specifically, we found that the retained analogues do not accurately capture the observed low-pressure system in the western Atlantic (Fig. S3). Nevertheless, the subtropical ridge, which is the main driver of the event in the Pyrenees, is well represented in these analogues, ensuring that the results presented remain valid for the region of study.
3.3.2 Contribution of soil-moisture temperature feedbacks
In the first section, we pointed out that precipitation occurred south of the Pyrenees between the two heatwaves, increasing soil moisture. This could have contributed to lower temperatures in that area during the July heatwave through land–atmosphere feedback. This process, together with the orographic uplift already discussed, could explain the high spatial heterogeneity in the temperature anomalies of both heatwaves and the thermal differences between the two events. Here we delve further into this issue using the analogue method introduced in the previous section. At this point it is important to emphasise that, although we are considering analogues of the 2022 heatwaves in this section, we are not really analysing the land–atmosphere feedback process for these specific cases but we are investigating how this process works on average for many events analogous to the selected ones and how it is related to global warming.
First, we separated the analogues of both heatwaves into two periods (1950–1985 vs. 1986–2021) and analysed their Tx anomalies and the associated SM anomalies of the 15 d prior to the analogue event (Figs. 6 and 7; see Sect. 2.2 for further details). The results show that the maximum level of Tx intensification in both heatwaves takes place on the southern slope of the Pyrenees (Spain) and in the Aquitaine basin (France) when comparing the analogues of the current period with those of the past period (Figs. 6c and 7c). However, in the innermost area of the Pyrenees (1000 m a.s.l. blue masked area), this enhancement reaches much lower values. We find that this pronounced pattern in the temperatures of analogues, which is corroborated by in situ observations (Figs. S4 and S5), is highly correlated with the associated SM variability (Figs. 6f and 7f). For instance, the area of greatest temperature intensification south of the Pyrenees is also the region where moisture is most reduced in the present relative to the past. Likewise, the inner Pyrenees, where the temperature increase is lower, is one of the areas with the least variation in soil moisture.
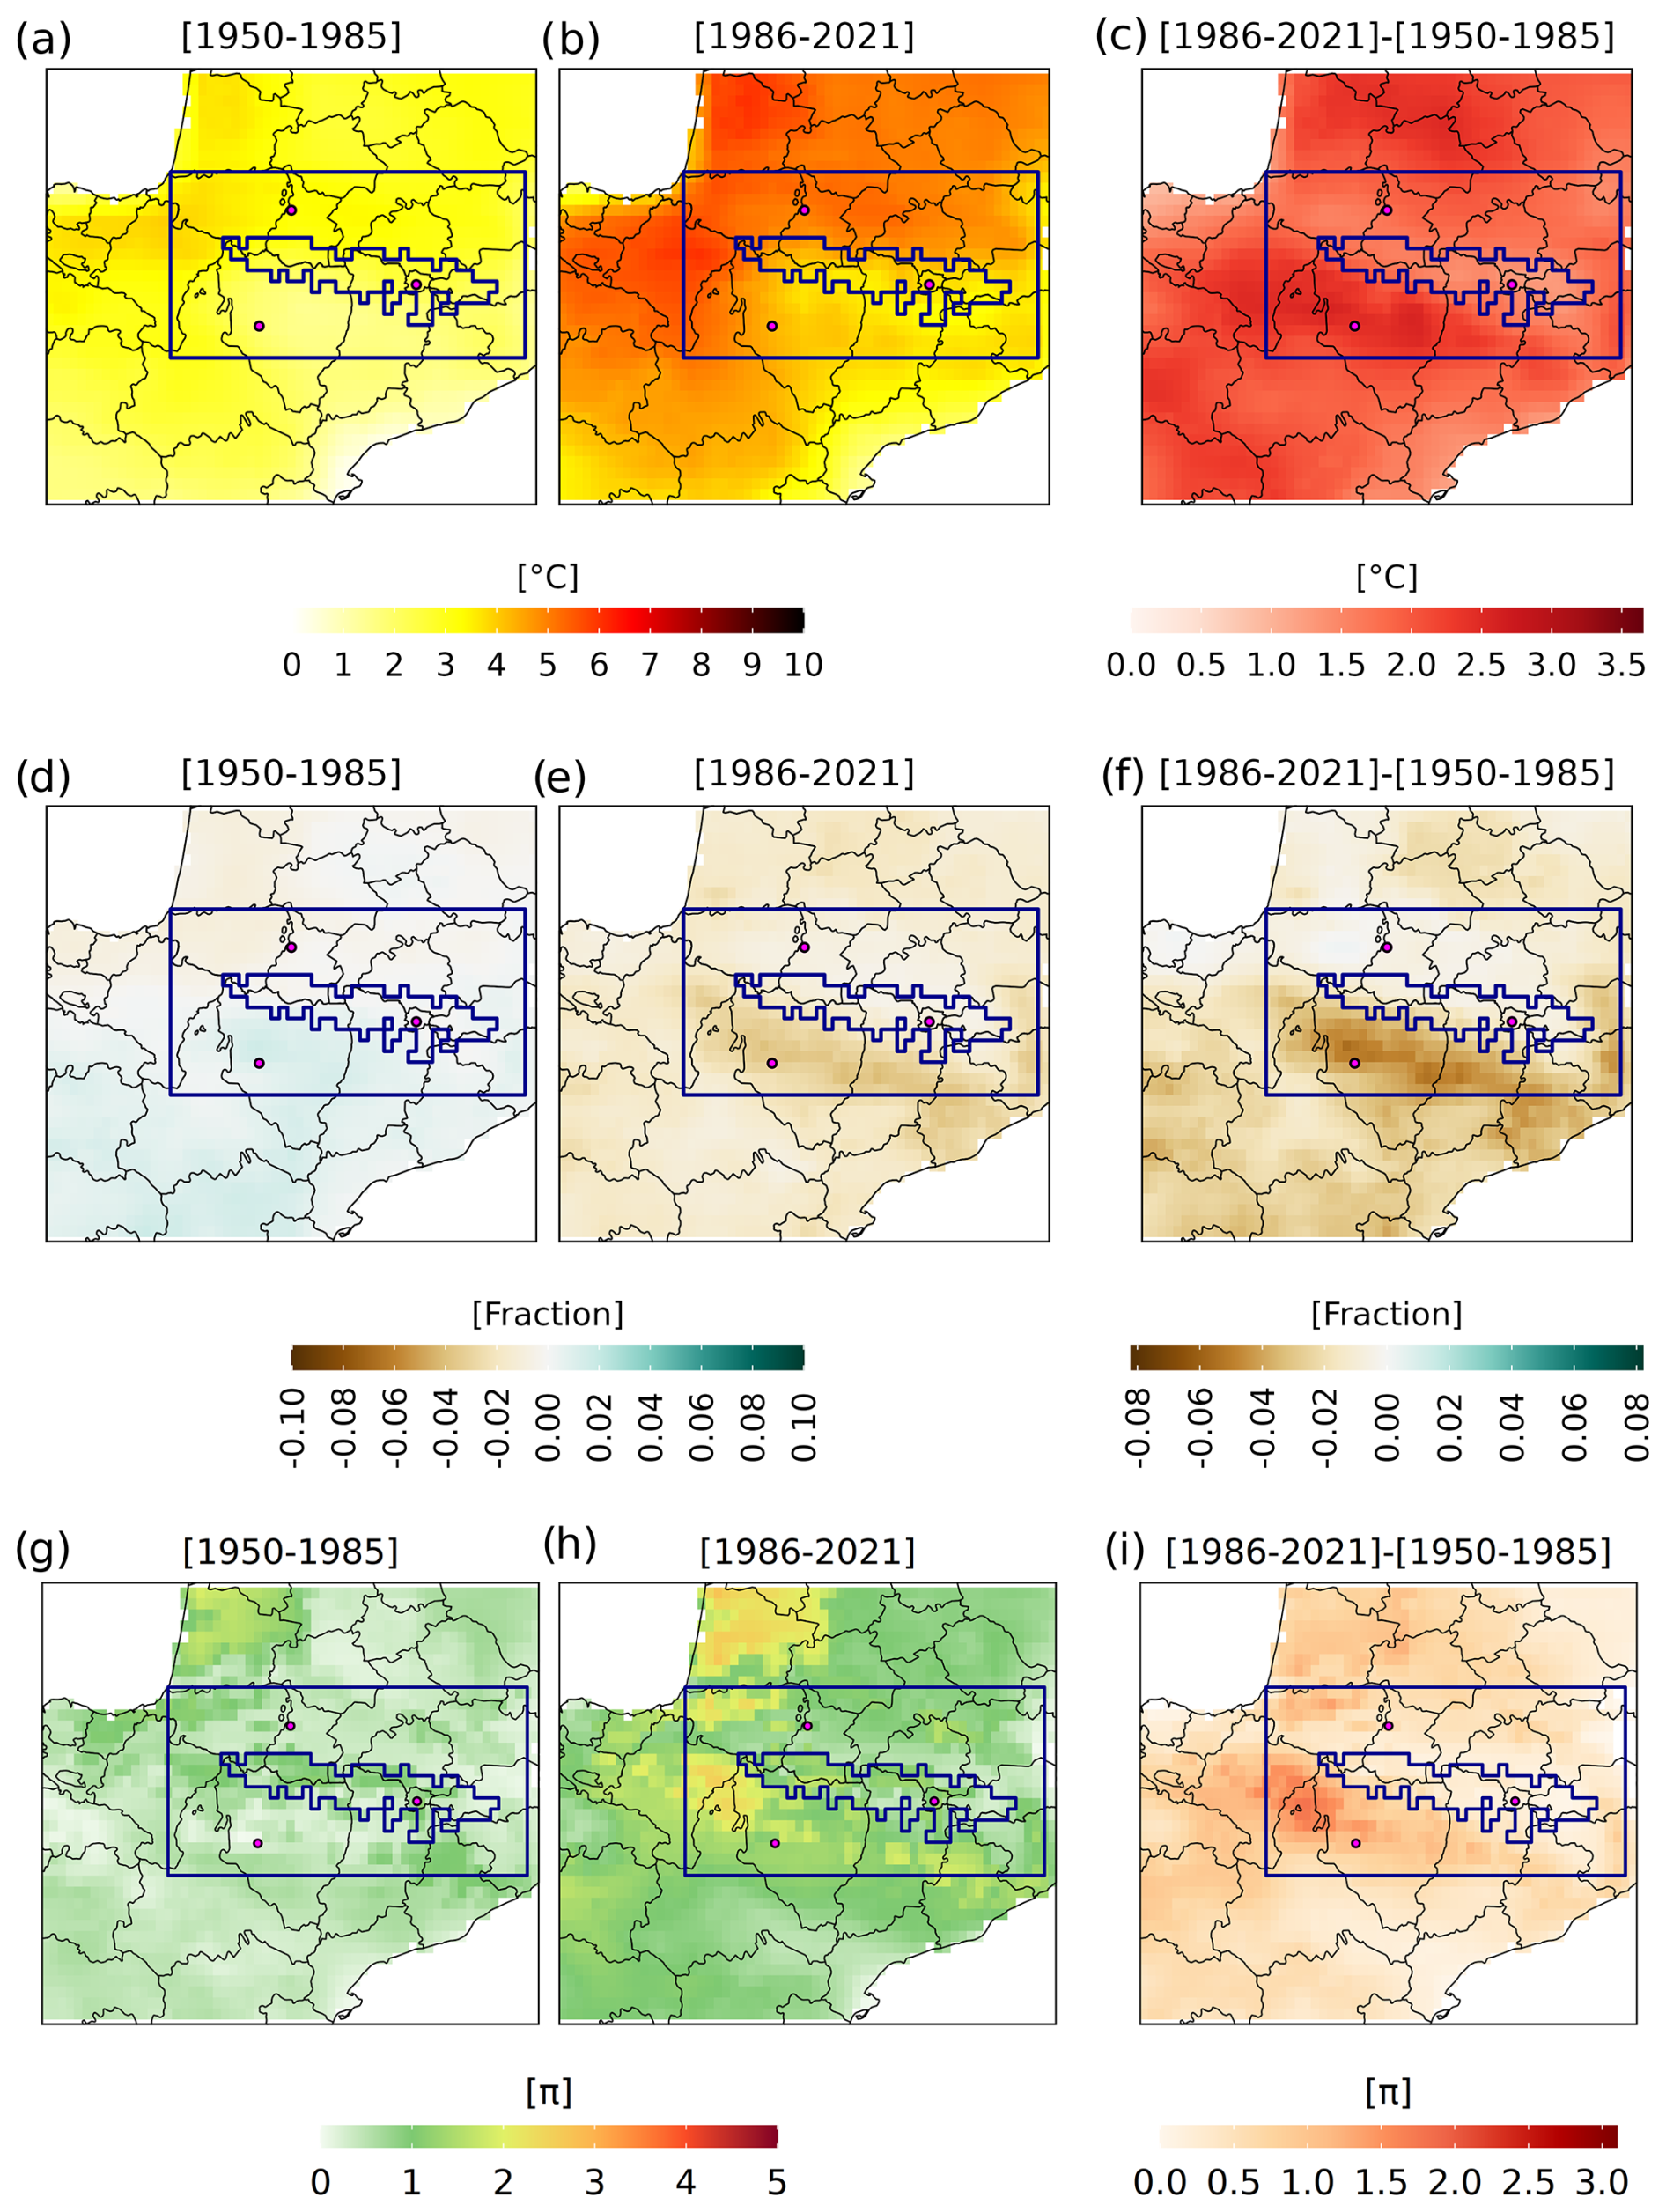
Figure 6June heatwave reconstruction by using past and present analogues. Daily mean maximum 2 m temperature (Tx) anomalies (a), daily mean anomalies of soil moisture in the first soil layer (0–7 cm) (SM) (d), and soil moisture–temperature coupling metric π daily mean (g) on the heatwave reconstruction in the past period (1950–1986). Panels (b), (e), and (h) as in panels (a), (d), and (g), respectively, but for the recent period (1986–2021). Panels (c), (f), and (i) show the difference between current and past periods for each respective variable. The anomalies in panels (a), (b), (d), and (e) were computed with respect to the period 1950–2021 (data source: ERA5-Land).
In addition, we studied the relationship between soil moisture change and temperature intensification in the most recent period using a land–atmosphere coupling metric (hereafter referred to as π; see Sect. 2.2). Our calculations confirm the innermost Pyrenees as the area with the lowest coupling strengthening of the study region, especially during the July heatwave (Fig. 7g–h). But more importantly, the increase in Tx in the most recent period analogues has a high spatial coincidence with the increase in π (Figs. 6i and 7i), especially for the July case. This shows that the pattern of the temperature increase caused by the observed regional warming in the studied heatwaves is significantly modulated by soil–atmosphere feedback.
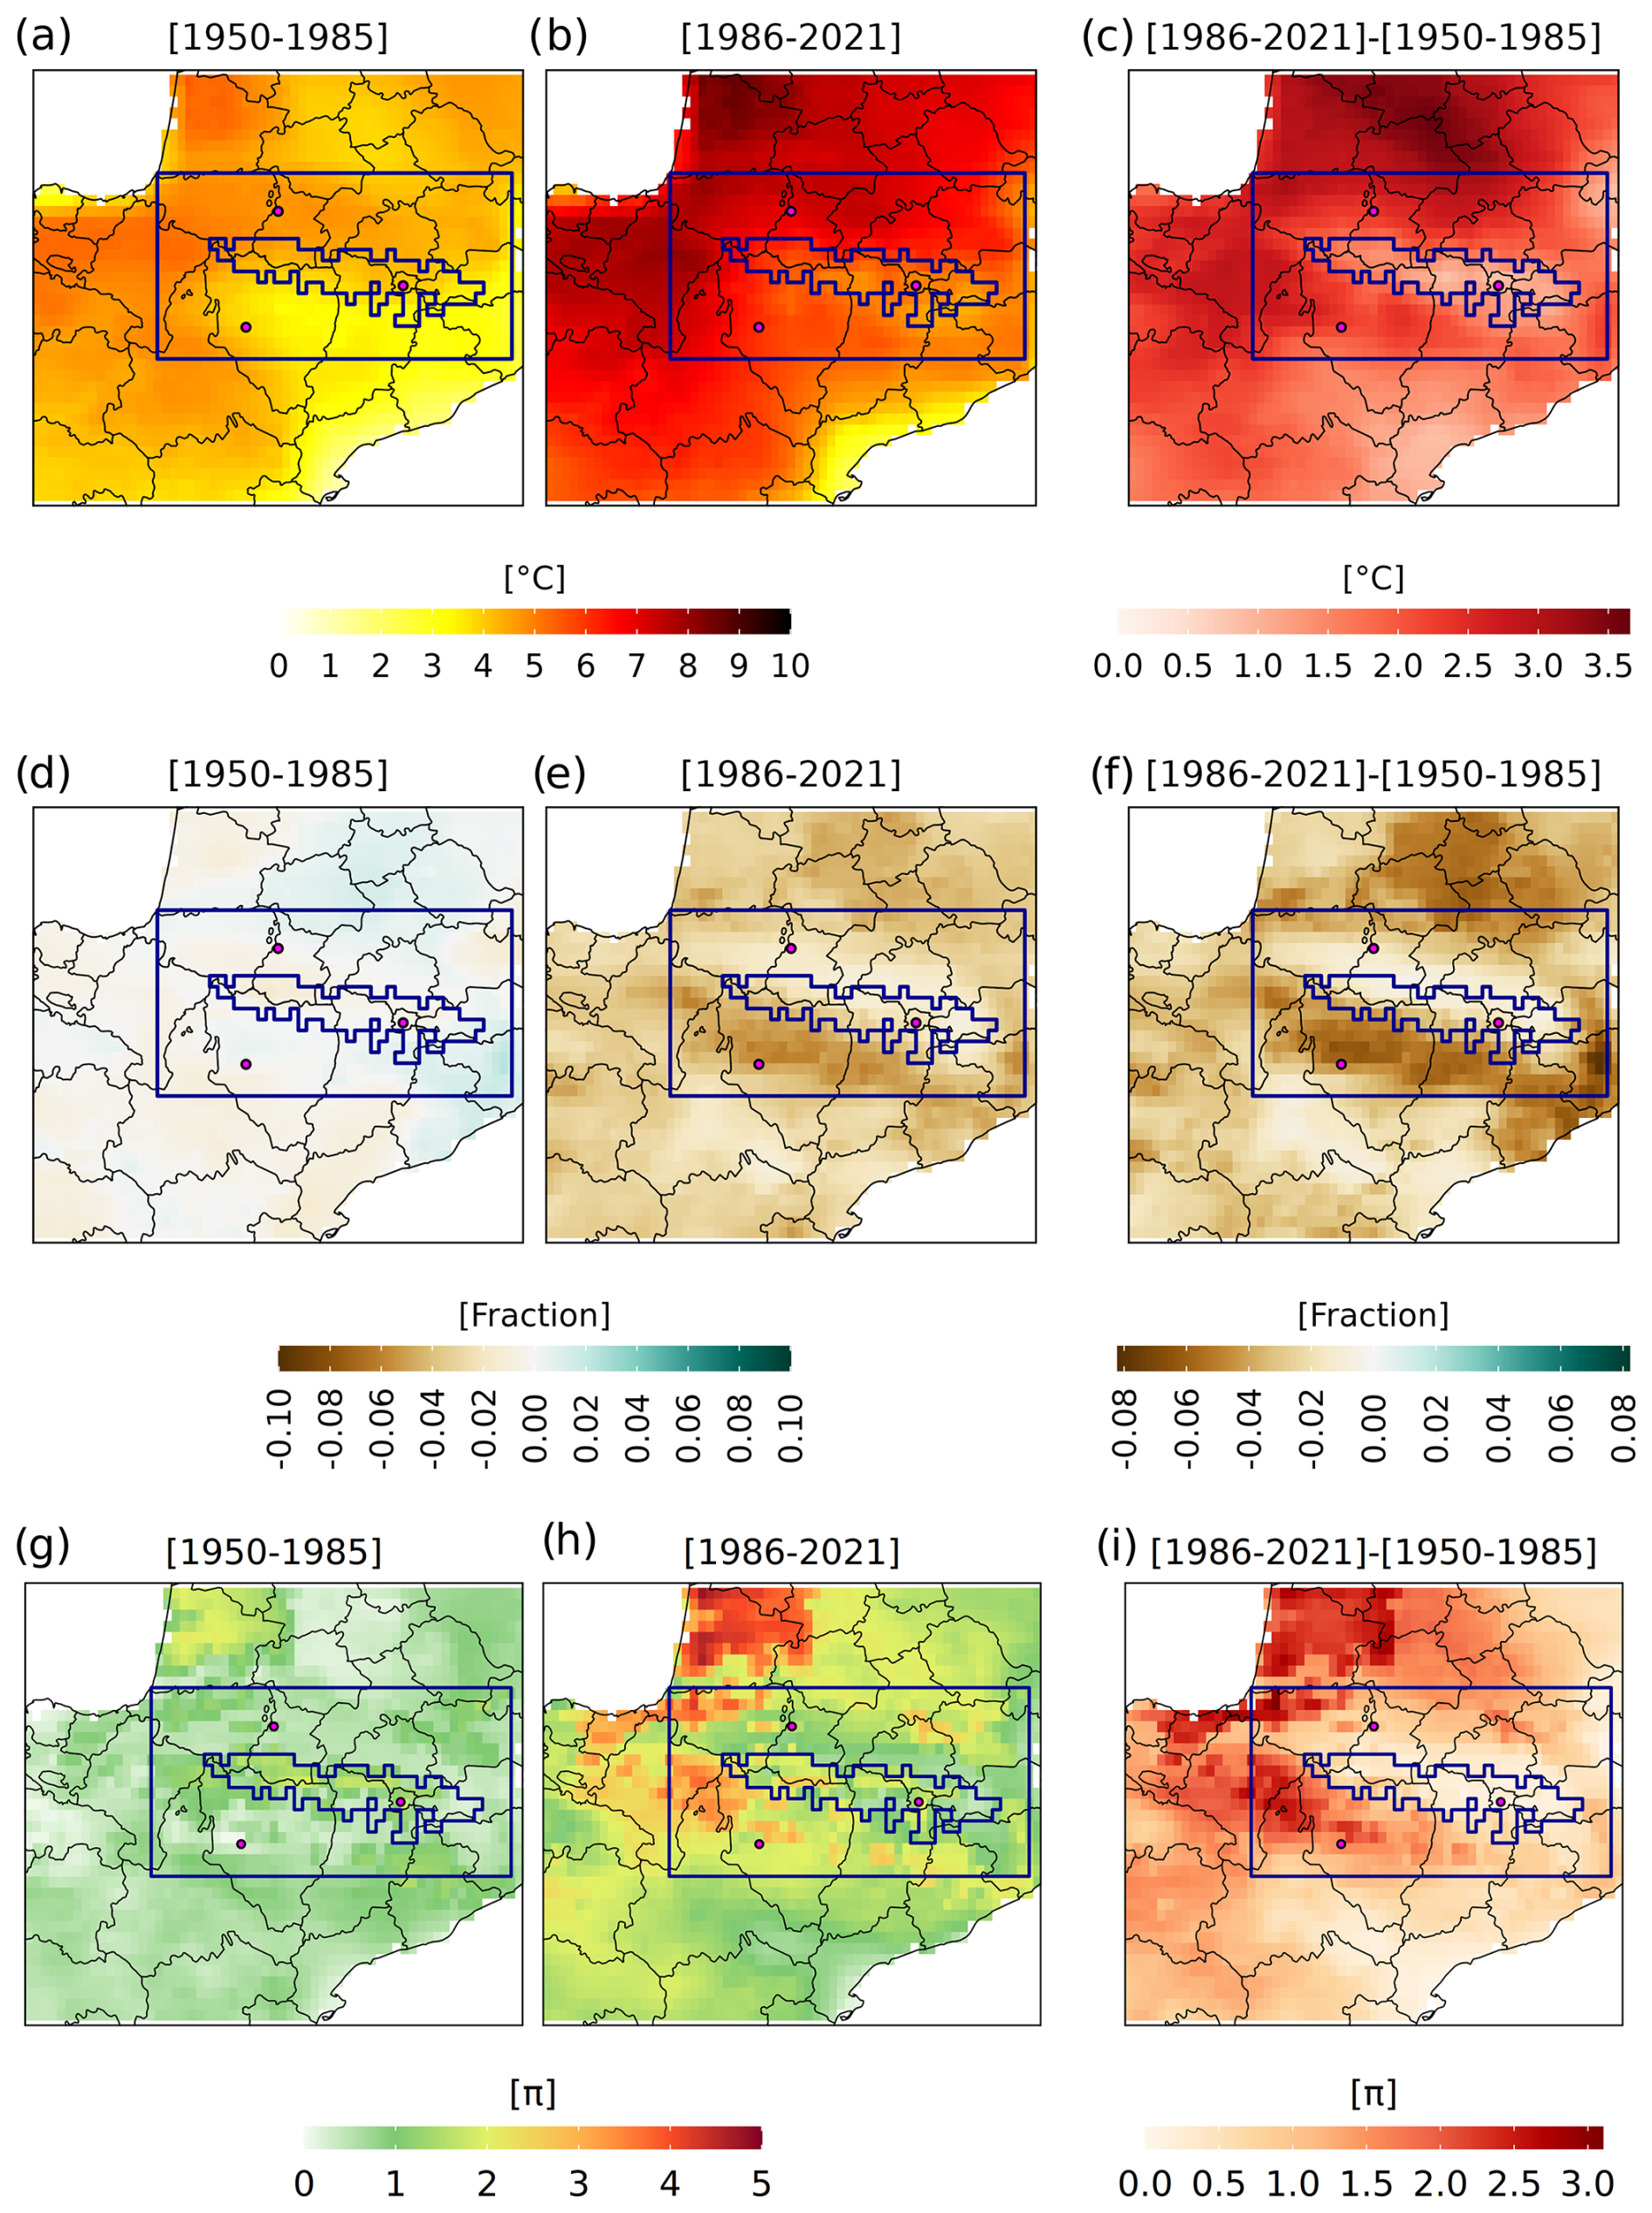
Figure 7July heatwave reconstruction by using past and present analogues (same as Fig. 6, but for the July heatwave).
To corroborate the role of the soil moisture deficit in amplifying the intensity of the June and July heatwaves, we split the analogue days into those preceded by dry conditions and those preceded by wet conditions over the Pyrenees domain, inferred from regional average anomalies of soil moisture over the previous 15 d (see Sect. 2.2). For this experiment, we identified atmospheric circulation analogues for each day of each heatwave and reconstructed the Tx anomalies by removing the long-term trend from our data. The results indicate that 2022-like events preceded by dry conditions typically lead to warmer conditions (Fig. 8), higher than 2 °C in terms of the difference between the median of both groups of analogues (Fig. 8a, e). The field of Tx increase for both events (Fig. 8d, h) is again characterised by the highest values south of the Pyrenees and lower values in the interior of the mountain range. However, since we are working with detrended temperature and soil moisture data in this case, this cannot be attributed to a long-term variation in soil moisture caused by the observed anthropogenic warming. Thus, the wettest sector of the study area, corresponding to the highest altitudes and the northern slope of the mountain range (Fig. S6), also shows the lowest coupling (Fig. 8i), implying that varying the preconditions of soil moisture prior to a heatwave produces similarly high temperatures, in contrast to what is observed in the surrounding areas, which are affected by a much higher coupling (Fig. 8i). The aforementioned low thermal variation in the wettest part of the mountain range is also obtained when repeating the same experiment with a high-resolution gridded dataset specific to the Pyrenees for the period 1981–2015 (Fig. S7; see Sect. 2.2). The Ebro Valley (most of which is outside the Pyrenean domain) also presents a low degree of coupling, as the temperature during the heatwave is weakly dependent on the prior soil moisture conditions, similar to what is found in the wettest area of the Pyrenees. However, in this case, it is because of its extremely low soil moisture values during the warm season (Fig. S6), when the margin for soil dryness to cause temperature anomalies is limited, as dry soils are the norm there in summer.
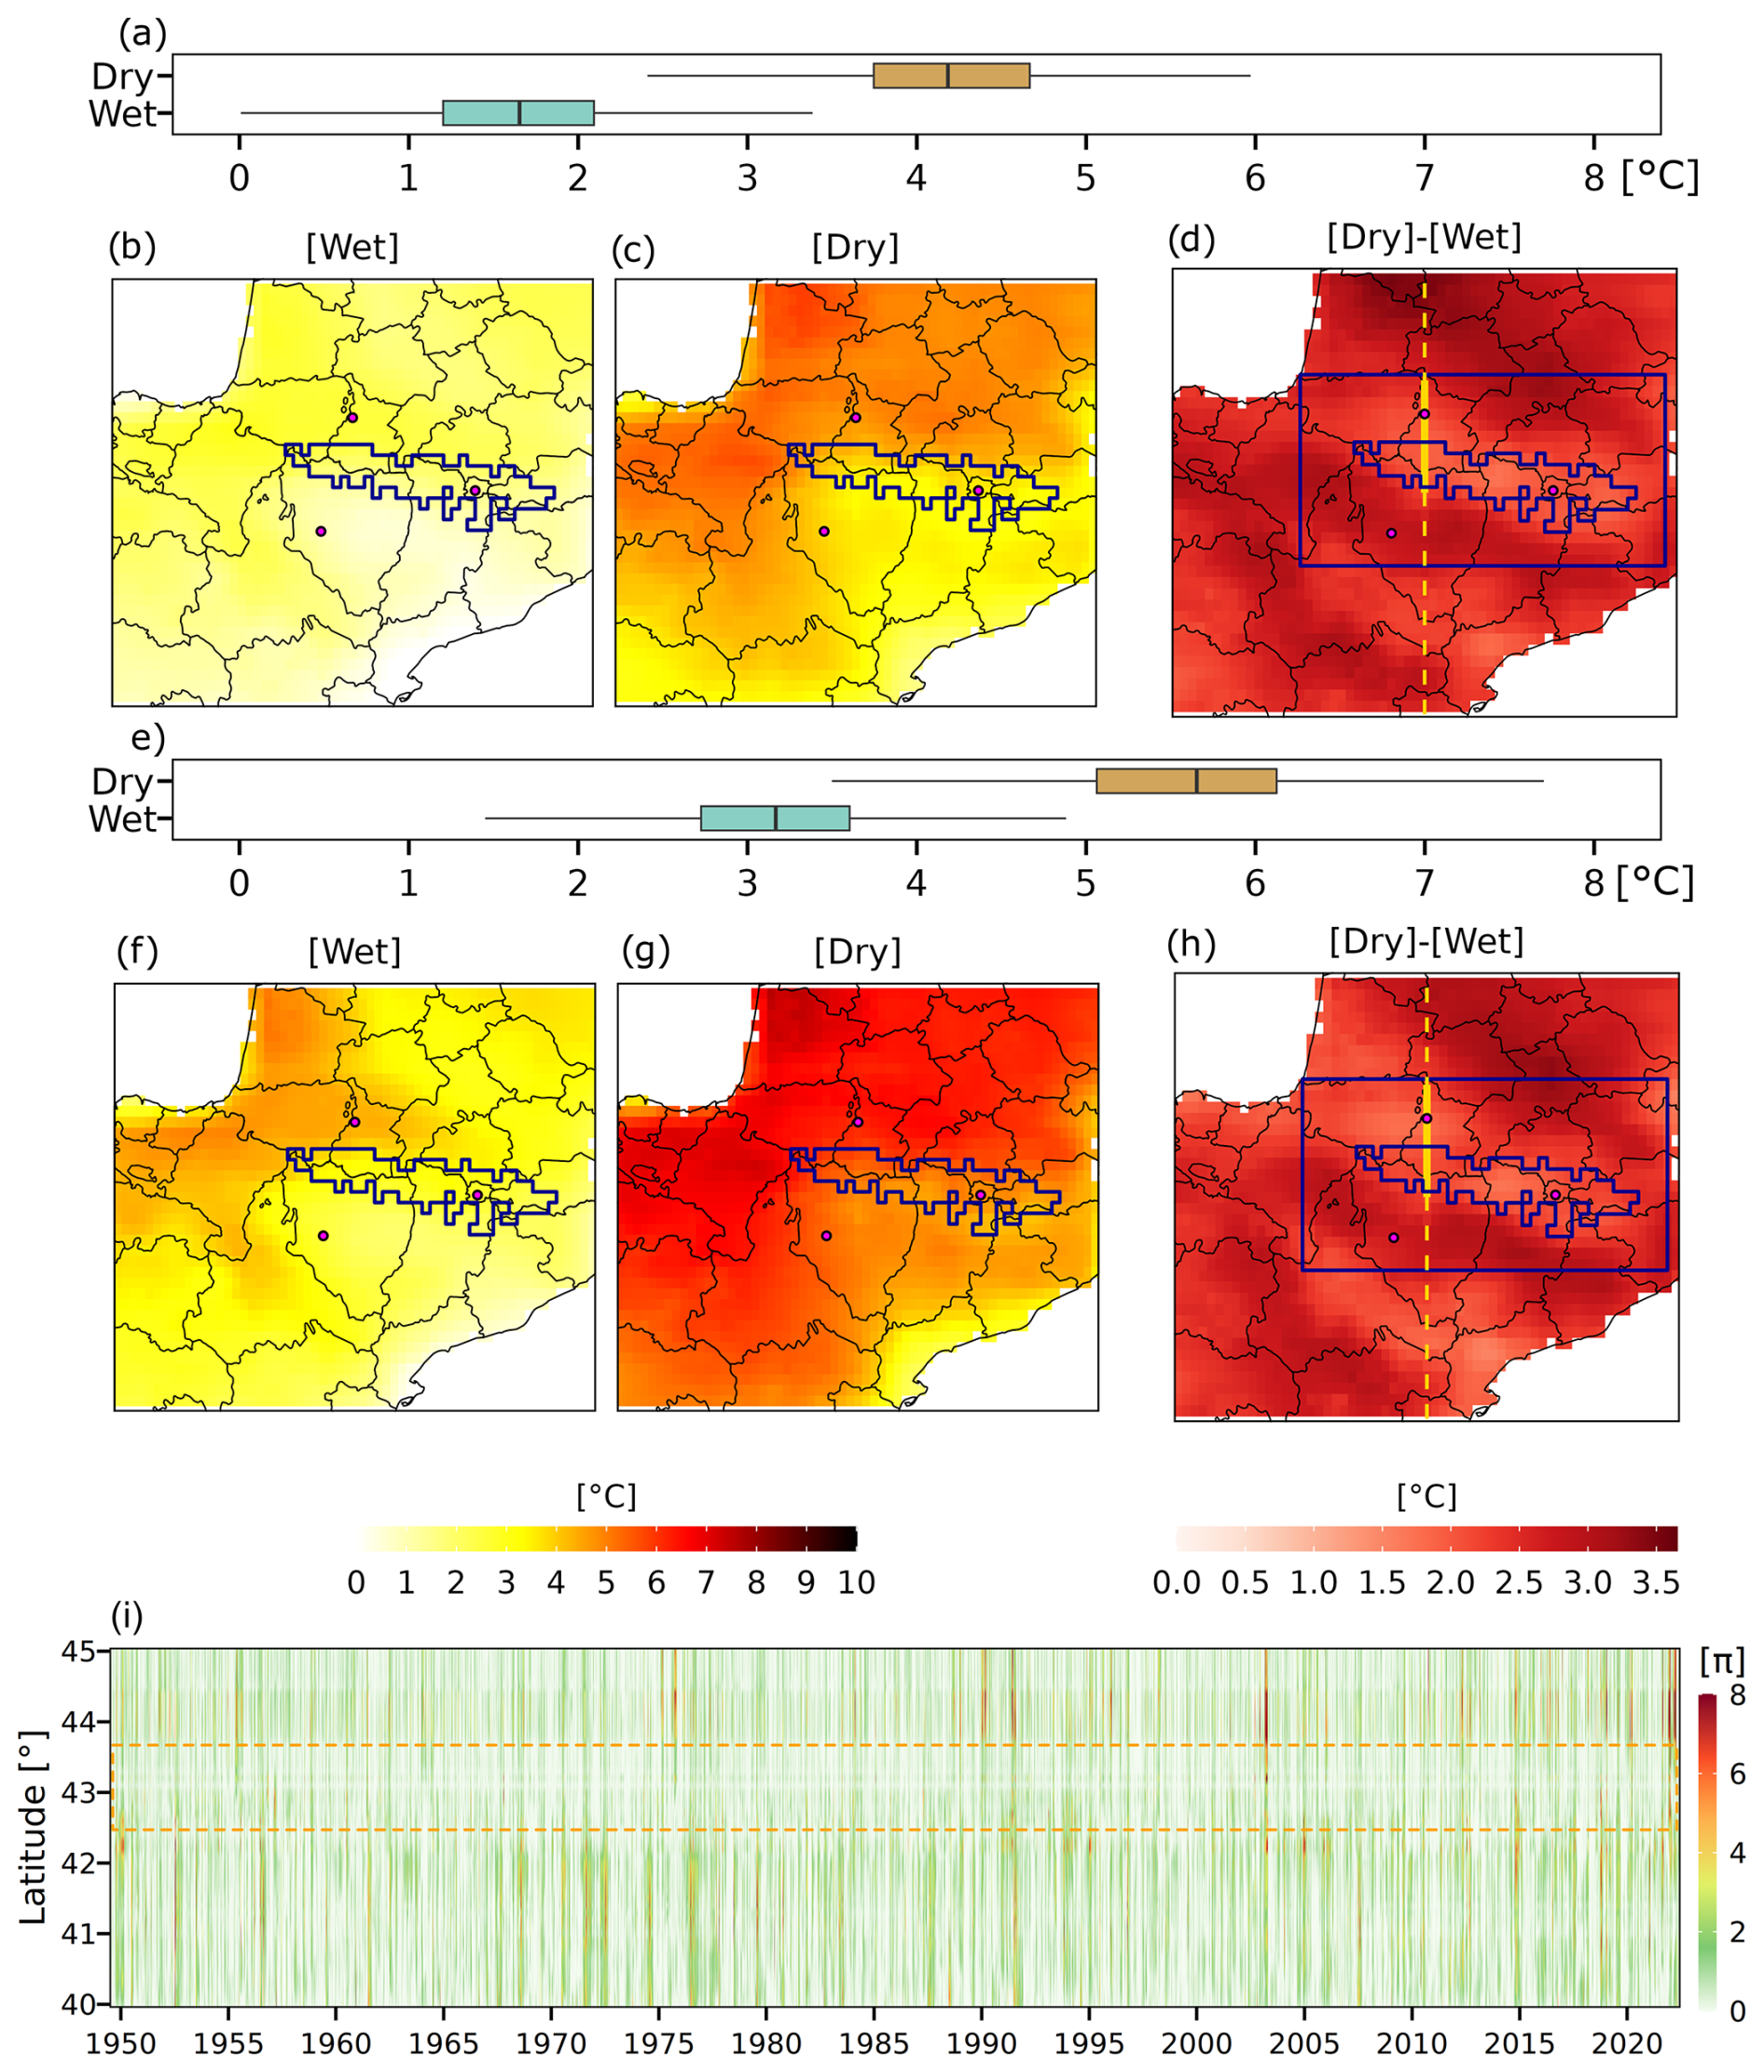
Figure 8Wet and dry circulation analogues of the June and July heatwaves. (a) Tx anomalies (with respect to 1950–2021) reconstructed for June (a–d) and July (e–h) heatwaves (12–19 June and 15–19 July 2022, respectively) from daily flow analogues of z500 over SW Europe preceded by (b, f) wet (above 66th percentile) and (c, g) dry (below 33rd percentile) soil moisture conditions at 0–7 cm in the Pyrenees domain (rectangular blue box in panels d and h) during the previous 15 d. (d, h) Difference between panels (c) and (g) and panels (b) and (f), respectively. (i) Mean daily π coupling metric time series for a cross-section at longitude 0° (dashed yellow line in panels d and h) for the summer seasons from 1950 to 2021. The inner dashed orange box refers to the region of lower coupling within the region marked by the thick yellow line in panels (d) and (h).
The summer of 2022 was extremely hot across the Pyrenees, both in terms of the duration of heatwaves and, more importantly, in terms of their intensity. We used the Heat Wave Magnitude Index daily (HWMId) indicator to detect the two most severe heatwaves that occurred in June and July, lasting 8 and 5 d, respectively, which broke some previous temperature records of the last 72 years, both at the surface (Tx) and at 850 hPa. Indeed, the HWMId values revealed the unprecedented nature of such heatwaves. In this study, we (i) presented the patterns of maximum temperature at 2 m (Tx) and soil moisture in the first soil layer (SM) during both events, (ii) identified the synoptic patterns and the physical processes associated with the heatwaves, (iii) quantified the role of the observed regional warming trend associated with the thermodynamic changes in June and July heatwave analogues, and finally (iv) showed how the precedent soil moisture conditions – through land–atmosphere interactions – can exacerbate the intensity of a June or July heatwave-like event.
Different physical mechanisms were identified for the two heatwaves. Although adiabatic warming and diabatic warming are the most relevant physical processes determining heatwaves in southern Europe (Zschenderlein et al., 2019; Röthlisberger and Papritz, 2023), the June heatwave was more advective in nature. This heatwave was driven by lower geopotential heights and stronger winds, which shaped the spatial distribution of the temperature anomalies. Higher horizontal wind speeds aloft generated mountain circulations with updrafts on the windward (south) side and downdrafts on the lee side (north) of the Pyrenees. This led to an increase in the temperature anomaly north of the Pyrenees, while reducing it at the mountain tops due to the cooling effect of the windward updrafts. Conversely, the July heatwave had larger geopotential height anomalies, decreased atmospheric flow, and more subsidence, making it more conducive to adiabatic processes. Weaker mid- and low-level winds led to fewer mountain-induced circulations and thus to a more uniform temperature distribution across the Pyrenees. These processes explained most of the differences observed between the two heatwaves and illustrate how mountain-induced circulations can regionally amplify or moderate heatwaves in their surroundings. The remaining differences can be attributed to land–atmosphere interactions, as discussed below.
Our findings also revealed a significant increase in the intensity of June or July heatwave-like events in the most recent period (1986–2021) compared with the past (1950–1985), with the thermodynamic component linked to human-induced global warming being the most relevant driver of this intensification. Thus, our results are in line with those presented for other recent heat events in Europe – also employing the flow analogue approach, such as the Mediterranean heatwave of 2021 (Faranda et al., 2022), the central European heatwave of 2019 (Sousa et al., 2019), or the Iberian Peninsula heatwave of 2018 (Barriopedro et al., 2020), among others, although the latter studies focused on larger geographical areas and did not investigate the specific behaviour of heatwaves in mountain regions.
Our detailed attribution analysis over the Pyrenees showed that most areas in the domain are becoming drier prior to a heatwave occurrence in the most recent period. In fact, this moisture reduction was significantly correlated with a greater Tx increase in the most recent period (RjuneHW = −0.30; RjulyHW = −0.71; p value < 0.01; Fig. 9). Soil moisture anomalies reconstructed from circulation analogues coincide with the negative observed trends of summer precipitation in the southern area of the Pyrenees (Pérez-Zanón et al., 2017; Moreno et al., 2018) and annually for the same area (Lemus-Canovas et al., 2019). Similarly, other studies detected negative precipitation trends in the SW of France (Vidal et al., 2010; Philandras et al., 2011), generally without statistical significance. Such negative anomalies could also be aggravated by the more robust increase in temperature (Samaniego et al., 2018), which also leads to a further increase in potential evapotranspiration (Mastrotheodoros et al., 2020).
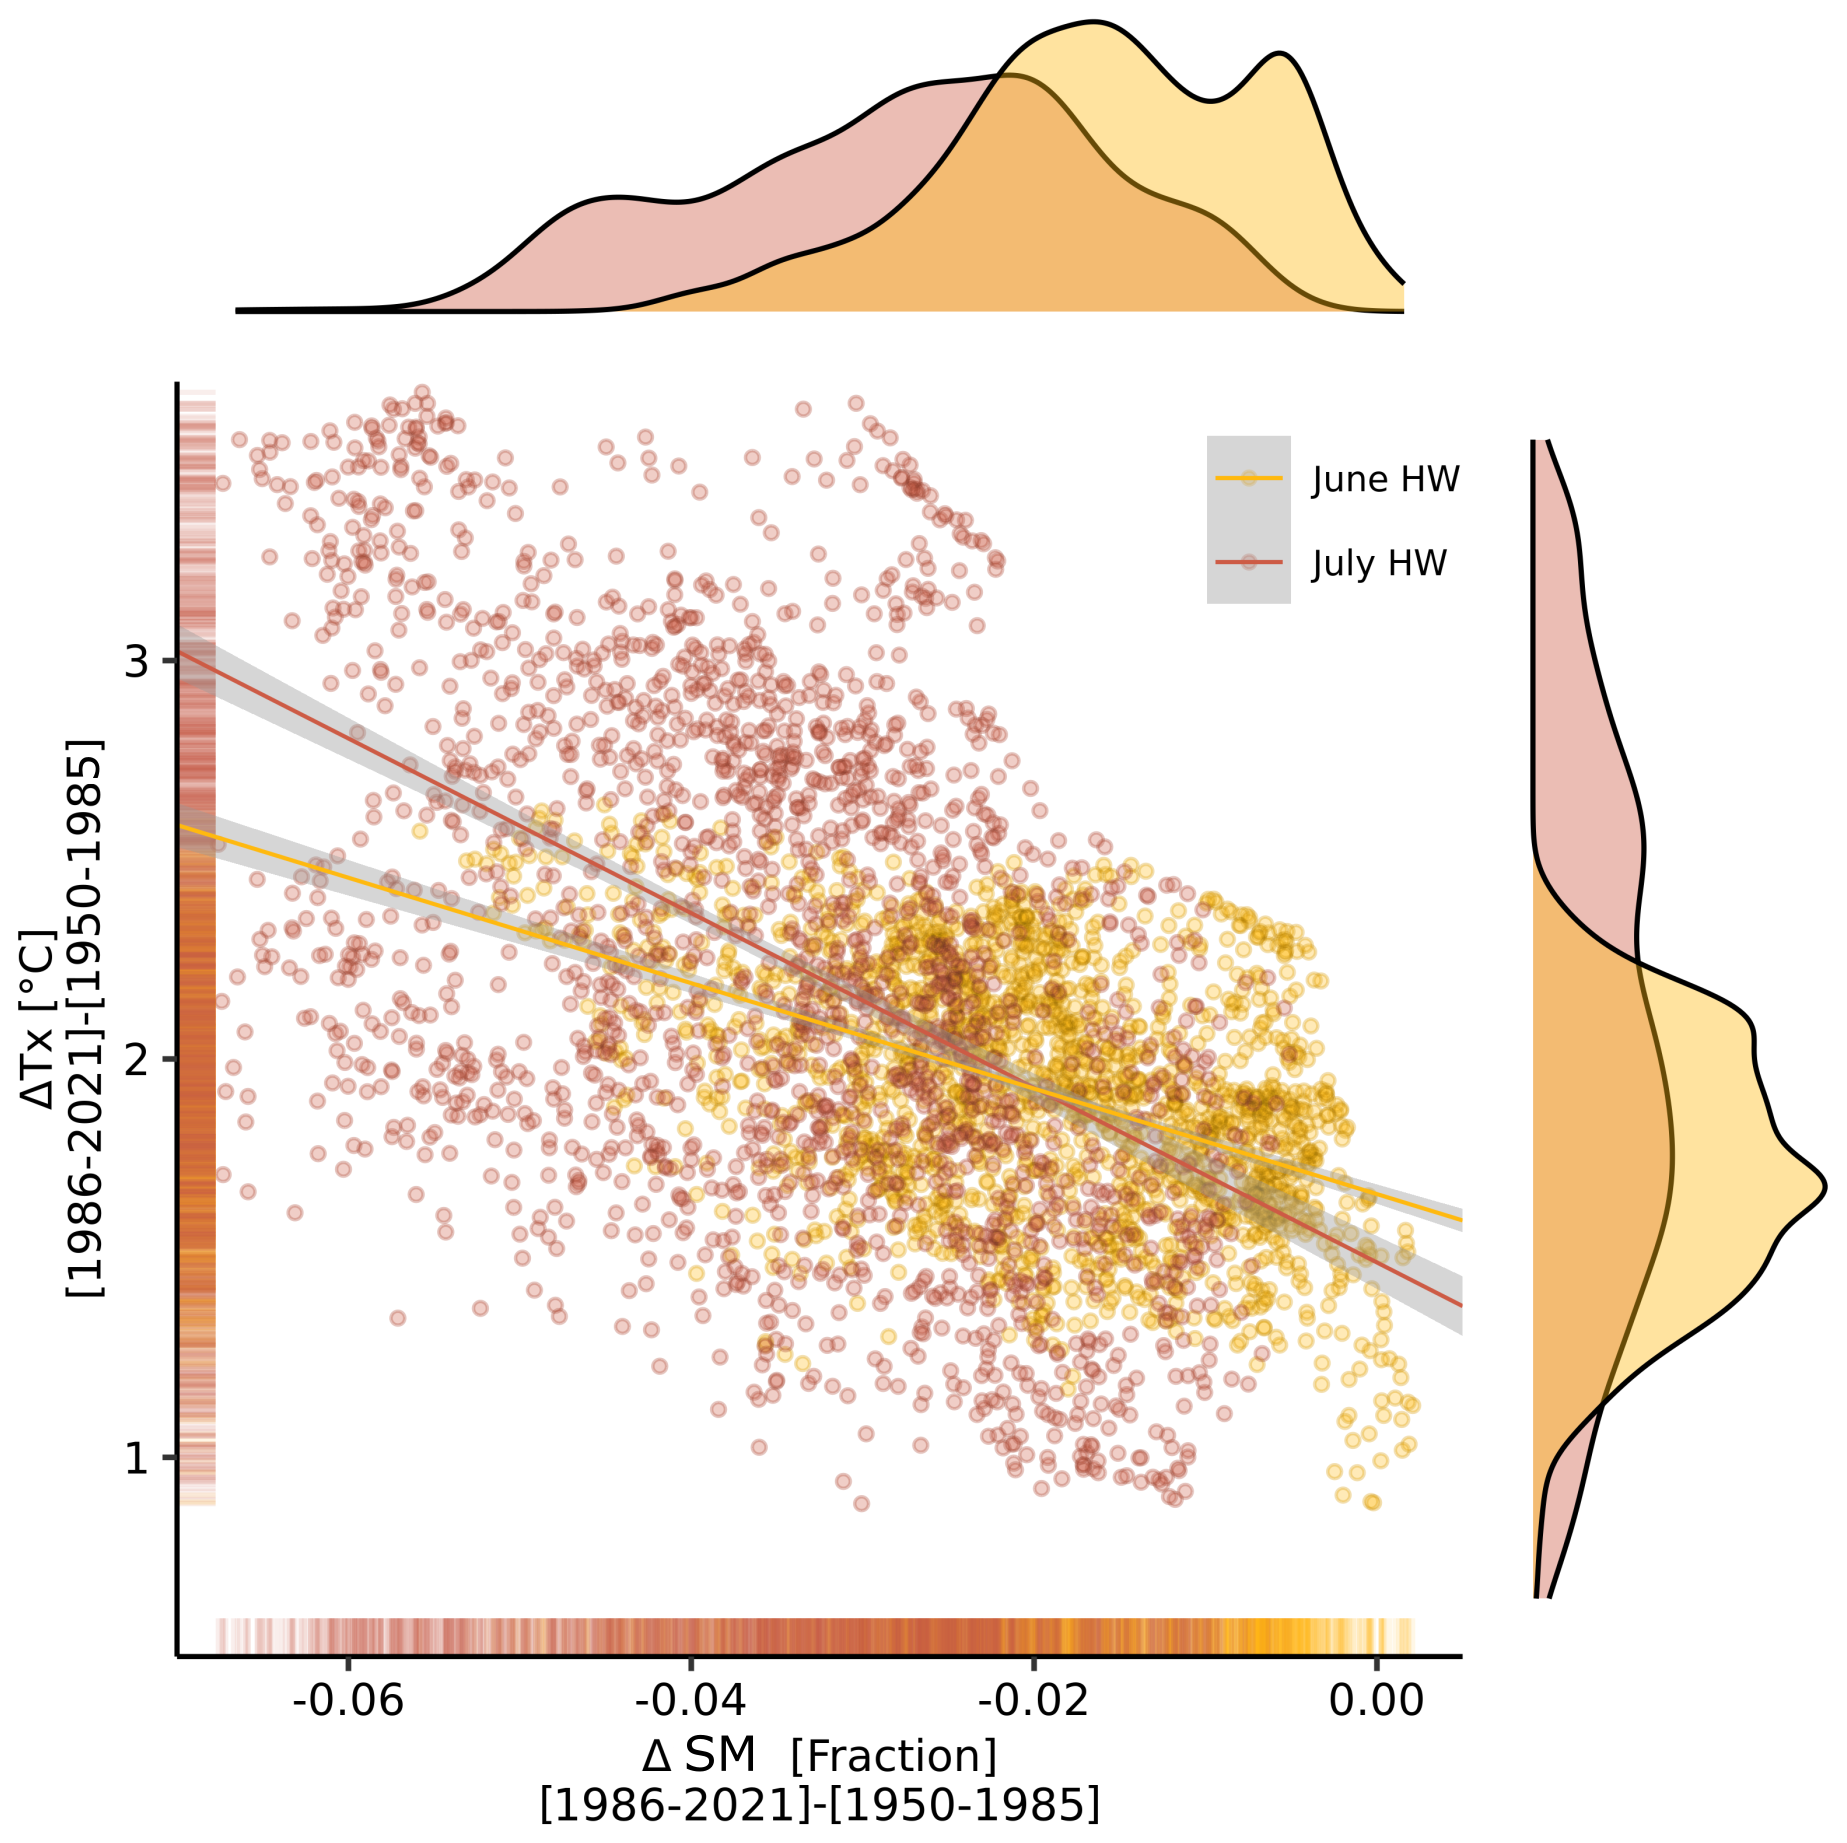
Figure 9Spatial relationship between changes in soil moisture and maximum temperatures for the June and July heatwave reconstructions. Each dot in the scatter plot represents a grid point difference between 1986–2021 and 1950–1985 periods for both maximum daily temperature (Tx) and volumetric soil moisture fraction (SM) 15 d prior to a heatwave (HW) event, based on event-averaged reconstructions of the June (yellow) and July (red) heatwaves provided in Fig. 6c and f, respectively. Marginal distributions are also shown for each heatwave reconstruction and variable, with density colour coding at the base of the axes, highlighting the concentration of data points. Linear regression lines reveal a positive correlation, suggesting that decreased soil moisture is associated with increased heatwave temperatures in both months, with a steeper gradient observed for July.
This observed drier trend in soil moisture was clearly greater in the southern part of the Pyrenean domain, which in turn was the area where a larger increase in Tx anomalies was observed in the analogue heatwave events belonging to the most recent period. Precisely, land–atmosphere coupling is widely recognised as a high-temperature enhancer during heatwave episodes, both in this area of Europe (Felsche et al., 2023; Whan et al., 2015; Stefanon et al., 2012; Della-Marta et al., 2007) and in other parts of the globe (Bartusek et al., 2022; Thompson et al., 2022; Rasmijn et al., 2018; Hirschi et al., 2011). This study has also demonstrated that during heatwaves, land–atmosphere coupling strongly influences the spatial pattern of temperatures outside of the mountain areas. Notwithstanding the above, we reported several different temperature patterns across the Pyrenees that were less connected to soil moisture–temperature interactions. In fact, the inner and northern parts of the Pyrenees, which are the wettest sectors of the ridge, presented a low degree of coupling, thus being less sensitive to changes in soil moisture variations. These areas still present high soil moisture values regardless of whether they are drier than normal, which does not promote a substantial increase in sensible heat fluxes. In this regard, Stéfanon et al. (2014) also detected a low soil moisture–temperature coupling both in the French Alps and in the Pyrenees during heatwave days of the period 1989–2008. They found lower temperature anomalies in the Alps compared with their surroundings in a dry soil scenario for the 2003 summer heatwave, suggesting that the combination of extreme heat and dry soils can lead to increased convection and cloud formation due to both anabatic winds (Jiménez et al., 2011) and a “dry advantage” regime (Ek and Holtslag, 2004; Gentine et al., 2012). Despite the reduced evaporation, the mixing of cold air from the lower to mid-troposphere with the warmer air near the surface can increase relative humidity and facilitate the formation of clouds, especially shallow ones (Stéfanon et al., 2014). Then, the lower amplification of Tx detected in the 2022 summer heatwave analogues in the most recent period, especially in the higher areas of the Pyrenees, due to the weaker land–atmosphere coupling, could also be favoured by the above-mentioned process of orographic cloud formation, being an additional factor limiting the temperature increase in this area in a warmer and drier Pyrenean scenario.
In conclusion, the observed regional warming tends to amplify events like the June and July heatwaves throughout the Pyrenees, but mountain-induced circulations in advective heatwaves can modify the temperature anomaly distribution in mountain areas. Advective-type heatwaves, on the other hand, might present a more homogeneous warming across the region. In this case, regional soil desiccation may amplify the magnitude of these type of events by creating certain sub-regional hotspots (e.g. the southern Pyrenees). At the same time, wet areas show less land–atmosphere interaction and are therefore less affected by the cascading events connecting drought with high temperatures. Although the study of the role of land–atmosphere interactions in exacerbating heatwave intensity is not new, the current study allowed us to derive a more detailed relationship between soil desiccation and the observed increase in heatwave temperature in an area of complex topography where the coupling effects vary greatly. Further research is needed to extend our understanding of the underlying physical mechanisms at the mesoscale to other temperate mountain regions, towards a comprehensive view of the changing dynamics of weather extremes in a warming world.
The flow analogue approach can be implemented using the climattR R package, developed by the first author (Lemus-Canovas, 2025) at https://doi.org/10.5281/zenodo.15772290. The π metric can be computed using the R package coupling (Lemus-Canovas, 2024), available at https://doi.org/10.5281/zenodo.11047472.
All data used in this study are accessible online via the following links. ERA5 dataset: https://doi.org/10.24381/cds.adbb2d47 (Hersbach et al., 2023). ERA5-Land dataset: https://doi.org/10.24381/cds.e2161bac (Muñoz Sabater, 2019). CLIMPY dataset: https://doi.org/10.5281/zenodo.10972236 (Cuadrat et al., 2024). Huesca and Tarbes in situ weather stations: https://www.ecad.eu/ (ECA&D, 2024). Encamp time series: https://www.meteo.ad/ (Andorran Meteorological Service, 2024).
The supplement related to this article is available online at https://doi.org/10.5194/nhess-25-2503-2025-supplement.
MLC designed the experiments, conducted the data analysis, and wrote the first draft of the paper. SGH led the analysis of the physical processes contributing to the heatwave events and prepared Fig. 3. All authors contributed to writing the article, provided ideas, helped interpret the results, and participated in revising the paper.
The contact author has declared that none of the authors has any competing interests.
Publisher's note: Copernicus Publications remains neutral with regard to jurisdictional claims made in the text, published maps, institutional affiliations, or any other geographical representation in this paper. While Copernicus Publications makes every effort to include appropriate place names, the final responsibility lies with the authors.
Marc Lemus-Canovas is supported by a postdoctoral contract from the programme named “Programa de axudas de apoio á etapa inicial de formación posdoutoral (2022)” funded by Xunta de Galicia (Government of Galicia, Spain). Reference number: ED481B-2022-055. Marc Lemus-Canovas has also been supported by a postdoctoral contract from Andorra Research + Innovation (2021). Sergi Gonzalez-Herrero was supported by the research group ANTALP (Antarctic, Arctic, Alpine Environments; 2021 SGR 00269) funded by the Agència de Gestió d'Ajuts Universitaris i de Recerca of the Government of Catalonia. Damian Insua-Costa is supported by the European Space Agency (ESA) grant no. 4000136272/21/I-EF (CCN. N.1), 4D-MED Hydrology. Martin Senande-Rivera is funded by the Spanish Ministry of Science and Innovation through the RIESPIRO research project (PID2021-128510OB-I00).
This research has been supported by the “Programa de axudas de apoio á etapa inicial de formación posdoutoral (2022)” funded by Xunta de Galicia (Government of Galicia, Spain) and for Andorra Research + Innovation (Andorra) (ED481B-2022-055).
This paper was edited by Dan Li and reviewed by two anonymous referees.
Andorran Meteorological Service: Encamp meteorological time series, https://www.meteo.ad/, last access: 20 December 2024.
Barriopedro, D., Sousa, P. M., Trigo, R. M., García-Herrera, R., and Ramos, A. M.: The Exceptional Iberian Heatwave of Summer 2018, B. Am. Meteorol. Soc., 101, S29–S34, https://doi.org/10.1175/BAMS-D-19-0159.1, 2020.
Bartusek, S., Kornhuber, K., and Ting, M.: 2021 North American heatwave amplified by climate change-driven nonlinear interactions, Nat. Clim. Change, 12, 1143–1150, https://doi.org/10.1038/s41558-022-01520-4, 2022.
Camarero, J. J.: The Multiple Factors Explaining Decline in Mountain Forests: Historical Logging and Warming-Related Drought Stress is Causing Silver-Fir Dieback in the Aragón Pyrenees, in: High Mountain Conservation in a Changing World, edited by: Catalan, J., Ninot, J. M., and Aniz, M. M., Springer Int. Publ., Cham, 131–154, https://doi.org/10.1007/978-3-319-55982-7_6, 2017.
Cremona, A., Huss, M., Landmann, J. M., Borner, J., and Farinotti, D.: European heat waves 2022: contribution to extreme glacier melt in Switzerland inferred from automated ablation readings, The Cryosphere, 17, 1895–1912, https://doi.org/10.5194/tc-17-1895-2023, 2023.
Cuadrat, J. M., Serrano-Notivoli, R., Prohom, M., Cunillera, J., Tejedor, E., Saz, M. Á., de Luis, M., Llabrés, A., and Soubeyroux, J.-M.: Climate of the Pyrenees, Version v3, Zenodo [data set], https://doi.org/10.5281/zenodo.10972236, 2024.
Della-Marta, P. M., Haylock, M. R., Luterbacher, J., and Wanner, H.: Doubled length of western European summer heat waves since 1880, J. Geophys. Res., 112, D15103, https://doi.org/10.1029/2007JD008510, 2007.
ECA&D (European Climate Assessment & Dataset): Huesca and Tarbes meteorological time series, https://www.ecad.eu/, last access: 20 December 2024.
Ek, M. B. and Holtslag, A. A. M.: Influence of Soil Moisture on Boundary Layer Cloud Development, J. Hydrometeorol., 5, 86–99, https://doi.org/10.1175/1525-7541(2004)005<0086:IOSMOB>2.0.CO;2, 2004.
Faranda, D., Bourdin, S., Ginesta, M., Krouma, M., Noyelle, R., Pons, F., Yiou, P., and Messori, G.: A climate-change attribution retrospective of some impactful weather extremes of 2021, Weather Clim. Dynam., 3, 1311–1340, https://doi.org/10.5194/wcd-3-1311-2022, 2022.
Felsche, E., Böhnisch, A., and Ludwig, R.: Inter-seasonal connection of typical European heatwave patterns to soil moisture, npj Clim. Atmos. Sci., 6, 1–11, https://doi.org/10.1038/s41612-023-00330-5, 2023.
Fischer, E. M., Seneviratne, S. I., Lüthi, D., and Schär, C.: Contribution of land-atmosphere coupling to recent European summer heat waves, Geophys. Res. Lett., 34, 2006GL029068, https://doi.org/10.1029/2006GL029068, 2007.
García-Herrera, R., Díaz, J., Trigo, R. M., and Hernández, E.: Extreme summer temperatures in Iberia: health impacts and associated synoptic conditions, Ann. Geophys., 23, 239–251, https://doi.org/10.5194/angeo-23-239-2005, 2005.
Gazol, A., Sangüesa-Barreda, G., and Camarero, J. J.: Forecasting Forest Vulnerability to Drought in Pyrenean Silver Fir Forests Showing Dieback, Front. For. Glob. Change, 3, 36, https://doi.org/10.3389/ffgc.2020.00036, 2020.
Gentine, P., D'Odorico, P., Lintner, B. R., Sivandran, G., and Salvucci, G.: Interdependence of climate, soil, and vegetation as constrained by the Budyko curve, Geophys. Res. Lett., 39, 2012GL053492, https://doi.org/10.1029/2012GL053492, 2012.
González-Herrero, S., Barriopedro, D., Trigo, R. M., López-Bustins, J. A., and Oliva, M.: Climate warming amplified the 2020 record-breaking heatwave in the Antarctic Peninsula, Communications Earth & Environment, 3, 122, https://doi.org/10.1038/s43247-022-00450-5, 2022.
Hersbach, H., Bell, B., Berrisford, P., Hirahara, S., Horányi, A., Muñoz-Sabater, J., Nicolas, J., Peubey, C., Radu, R., Schepers, D., Simmons, A., Soci, C., Abdalla, S., Abellan, X., Balsamo, G., Bechtold, P., Biavati, G., Bidlot, J., Bonavita, M., De Chiara, G., Dahlgren, P., Dee, D., Diamantakis, M., Dragani, R., Flemming, J., Forbes, R., Fuentes, M., Geer, A., Haimberger, L., Healy, S., Hogan, R. J., Hólm, E., Janisková, M., Keeley, S., Laloyaux, P., Lopez, P., Lupu, C., Radnoti, G., De Rosnay, P., Rozum, I., Vamborg, F., Villaume, S., and Thépaut, J.: The ERA5 global reanalysis, Q. J. Roy. Meteor. Soc., 146, 1999–2049, https://doi.org/10.1002/qj.3803, 2020.
Hersbach, H., Bell, B., Berrisford, P., Biavati, G., Horányi, A., Muñoz Sabater, J., Nicolas, J., Peubey, C., Radu, R., Rozum, I., Schepers, D., Simmons, A., Soci, C., Dee, D., and Thépaut, J.-N.: ERA5 hourly data on single levels from 1940 to present, Copernicus Climate Change Service (C3S) Climate Data Store (CDS) [data set], https://doi.org/10.24381/cds.adbb2d47, 2023.
Hirschi, M., Seneviratne, S. I., Alexandrov, V., Boberg, F., Boroneant, C., Christensen, O. B., Formayer, H., Orlowsky, B., and Stepanek, P.: Observational evidence for soil-moisture impact on hot extremes in southeastern Europe, Nature, 4, 17–21, https://doi.org/10.1038/ngeo1032, 2011.
Jézéquel, A., Yiou, P., and Radanovics, S.: Role of circulation in European heatwaves using flow analogues, Clim. Dynam., 50, 1145–1159, https://doi.org/10.1007/s00382-017-3667-0, 2018.
Jiménez, P. A., de Arellano, J. V.-G., González-Rouco, J. F., Navarro, J., Montávez, J. P., García-Bustamante, E., and Dudhia, J.: The Effect of Heat Waves and Drought on Surface Wind Circulations in the Northeast of the Iberian Peninsula during the Summer of 2003, J. Climate, 24, 5416–5422, https://doi.org/10.1175/2011JCLI4061.1, 2011.
Lemus-Canovas, M. and Lopez-Bustins, J. A.: Assessing internal changes in the future structure of dry–hot compound events: the case of the Pyrenees, Nat. Hazards Earth Syst. Sci., 21, 1721–1738, https://doi.org/10.5194/nhess-21-1721-2021, 2021.
Lemus-Canovas, M., Lopez-Bustins, J. A., Trapero, L., and Martin-Vide, J.: Combining circulation weather types and daily precipitation modelling to derive climatic precipitation regions in the Pyrenees, Atmos. Res., 220, 181–193, https://doi.org/10.1016/j.atmosres.2019.01.018, 2019.
Lemus-Canovas, M.: coupling, Version 0.1.0, Zenodo [code], https://doi.org/10.5281/zenodo.11047472, 2024.
Lemus-Canovas, M.: lemuscanovas/climattR: 0.1.1, https://doi.org/10.5281/zenodo.15772290, Zenodo [code], 2025.
López-Moreno, J. I., Revuelto, J., Rico, I., Chueca-Cía, J., Julián, A., Serreta, A., Serrano, E., Vicente-Serrano, S. M., Azorin-Molina, C., Alonso-González, E., and García-Ruiz, J. M.: Thinning of the Monte Perdido Glacier in the Spanish Pyrenees since 1981, The Cryosphere, 10, 681–694, https://doi.org/10.5194/tc-10-681-2016, 2016.
López-Moreno, J. I., Soubeyroux, J. M., Gascoin, S., Alonso-Gonzalez, E., Durán-Gómez, N., Lafaysse, M., Vernay, M., Carmagnola, C., and Morin, S.: Long-term trends (1958–2017) in snow cover duration and depth in the Pyrenees, Int. J. Climatol., 40, 6122–6136, https://doi.org/10.1002/joc.6571, 2020.
Mastrotheodoros, T., Pappas, C., Molnar, P., Burlando, P., Manoli, G., Parajka, J., Rigon, R., Szeles, B., Bottazzi, M., Hadjidoukas, P., and Fatichi, S.: More green and less blue water in the Alps during warmer summers, Nat. Clim. Change, 10, 155–161, https://doi.org/10.1038/s41558-019-0676-5, 2020.
Miralles, D. G., Teuling, A. J., van Heerwaarden, C. C., and Vilà-Guerau de Arellano, J.: Mega-heatwave temperatures due to combined soil desiccation and atmospheric heat accumulation, Nature, 7, 345–349, https://doi.org/10.1038/ngeo2141, 2014.
Miralles, D. G., van den Berg, M. J., Teuling, A. J., and de Jeu, R. A. M.: Soil moisture-temperature coupling: A multiscale observational analysis, Geophys. Res. Lett., 39, L21707, https://doi.org/10.1029/2012GL053703, 2012.
Moreno, A., Valero-Garcés, B. L., Verfaillie, D., Galop, D., Rodríguez Camino, E., Tejedor, E., Barreiro Lostres, F., Soubeyroux, J.-M., Cunillera, J., Cuadrat, J. M., García Ruiz, J. M., López Moreno, J. I., Trapero, L., Pons, M., Prohom Duran, M., Saz Sánchez, M.Á., González Sampériz, P., Ramos Calzado, P., Amblar, M. P., Copons, R., Serrano Notivoli, R., Gascoin, S., and Luna Rico, Y.: Clima y variabilidad climática en los Pirineos, OPCC-CTP, ISBN: 978-84-09-06268-3, 2018.
Muñoz Sabater, J.: ERA5-Land hourly data from 1950 to present, Copernicus Climate Change Service (C3S) Climate Data Store (CDS) [data set], https://doi.org/10.24381/cds.e2161bac, 2019.
Muñoz-Sabater, J., Dutra, E., Agustí-Panareda, A., Albergel, C., Arduini, G., Balsamo, G., Boussetta, S., Choulga, M., Harrigan, S., Hersbach, H., Martens, B., Miralles, D. G., Piles, M., Rodríguez-Fernández, N. J., Zsoter, E., Buontempo, C., and Thépaut, J.-N.: ERA5-Land: a state-of-the-art global reanalysis dataset for land applications, Earth Syst. Sci. Data, 13, 4349–4383, https://doi.org/10.5194/essd-13-4349-2021, 2021.
Pérez-Zanón, N., Sigró, J., and Ashcroft, L.: Temperature and precipitation regional climate series over the central Pyrenees during 1910–2013, Int. J. Climatol., 37, 1922–1937, https://doi.org/10.1002/joc.4823, 2017.
Pérez-Zanón, N., Sigró, J., and Ashcroft, L.: Temperature and precipitation regional climate series over the central Pyrenees during 1910–2013, Int. J. Climatol., 37, 1922–1937, https://doi.org/10.1002/joc.4823, 2017.
Philandras, C. M., Nastos, P. T., Kapsomenakis, J., Douvis, K. C., Tselioudis, G., and Zerefos, C. S.: Long term precipitation trends and variability within the Mediterranean region, Nat. Hazards Earth Syst. Sci., 11, 3235–3250, https://doi.org/10.5194/nhess-11-3235-2011, 2011.
Priestley, C. H. B. and Taylor, R. J.: On the Assessment of Surface Heat Flux and Evaporation Using Large-Scale Parameters, Mon. Weather Rev., 100, 81–92, https://doi.org/10.1175/1520-0493(1972)100<0081:OTAOSH>2.3.CO;2, 1972.
Rasmijn, L. M., van der Schrier, G., Bintanja, R., Barkmeijer, J., Sterl, A., and Hazeleger, W.: Future equivalent of 2010 Russian heatwave intensified by weakening soil moisture constraints, Nature, 8, 381–385, https://doi.org/10.1038/s41558-018-0114-0, 2018.
Rodrigues, M., Cunill Camprubí, À., Balaguer-Romano, R., Coco Megía, C. J., Castañares, F., Ruffault, J., Fernandes, P. M., and Resco de Dios, V.: Drivers and implications of the extreme 2022 wildfire season in Southwest Europe, Sci. Total Environ., 859, 160320, https://doi.org/10.1016/j.scitotenv.2022.160320, 2023.
Röthlisberger, M. and Papritz, L.: Quantifying the physical processes leading to atmospheric hot extremes at a global scale, Nat. Geosci., 16, 210–216, https://doi.org/10.1038/s41561-023-01126-1, 2023.
Russo, S., Dosio, A., Graversen, R. G., Sillmann, J., Carrao, H., Dunbar, M. B., Singleton, A., Montagna, P., Barbola, P., and Vogt, J. V.: Magnitude of extreme heat waves in present climate and their projection in a warming world, J. Geophys. Res.-Atmos., 119, 12500–12512, https://doi.org/10.1002/2014JD022098, 2014.
Samaniego, L., Thober, S., Kumar, R., Wanders, N., Rakovec, O., Pan, M., Zink, M., Sheffield, J., Wood, E. F., and Marx, A.: Anthropogenic warming exacerbates European soil moisture droughts, Nat. Clim. Change, 8, 421–426, https://doi.org/10.1038/s41558-018-0138-5, 2018.
Schumacher, D. L., Keune, J., van Heerwaarden, C. C., Vilà-Guerau de Arellano, J., Teuling, A. J., and Miralles, D. G.: Amplification of mega-heatwaves through heat torrents fuelled by upwind drought, Nat. Geosci., 12, 712–717, https://doi.org/10.1038/s41561-019-0431-6, 2019.
Seneviratne, S. I., Corti, T., Davin, E. L., Hirschi, M., Jaeger, E. B., Lehner, I., Orlowsky, B., and Teuling, A. J.: Investigating soil moisture–climate interactions in a changing climate: A review, Earth-Sci. Rev., 99, 125–161, https://doi.org/10.1016/j.earscirev.2010.02.004, 2010.
Serrano-Notivoli, R., Beguería, S., Saz, M. Á., Longares, L. A., and de Luis, M.: SPREAD: a high-resolution daily gridded precipitation dataset for Spain – an extreme events frequency and intensity overview, Earth Syst. Sci. Data, 9, 721–738, https://doi.org/10.5194/essd-9-721-2017, 2017.
Serrano-Notivoli, R., Beguería, S., and de Luis, M.: STEAD: a high-resolution daily gridded temperature dataset for Spain, Earth Syst. Sci. Data, 11, 1171–1188, https://doi.org/10.5194/essd-11-1171-2019, 2019.
Serrano-Notivoli, R., Tejedor, E., Sarricolea, P., Meseguer-Ruiz, O., de Luis, M., Saz, M. Á., Longares, L. A., and Olcina, J.: Unprecedented warmth: A look at Spain's exceptional summer of 2022, Atmos. Res., 293, 106931, https://doi.org/10.1016/j.atmosres.2023.106931, 2023.
Sousa, P. M., Trigo, R. M., Barriopedro, D., Soares, P. M. M., and Santos, J. A.: European temperature responses to blocking and ridge regional patterns, Clim. Dynam., 50, 457–477, https://doi.org/10.1007/s00382-017-3620-2, 2018.
Sousa, P. M., Barriopedro, D., Ramos, A. M., García-Herrera, R., Espírito-Santo, F., and Trigo, R. M.: Saharan air intrusions as a relevant mechanism for Iberian heatwaves: The record breaking events of August 2018 and June 2019, Weather and Climate Extremes, 26, 100224, https://doi.org/10.1016/j.wace.2019.100224, 2019.
Sousa, P. M., Barriopedro, D., García-Herrera, R., Ordóñez, C., Soares, P. M. M., and Trigo, R. M.: Distinct influences of large-scale circulation and regional feedbacks in two exceptional 2019 European Communications Earth & Environment, 1, 1–13, https://doi.org/10.1038/s43247-020-00048-9, 2020.
Stefanon, M., D'Andrea, F., and Drobinski, P.: Heatwave classification over Europe and the Mediterranean region, Environ. Res. Lett., 7, 014023, https://doi.org/10.1088/1748-9326/7/1/014023, 2012.
Stéfanon, M., Drobinski, P., D'Andrea, F., Lebeaupin-Brossier, C., and Bastin, S.: Soil moisture-temperature feedbacks at meso-scale during summer heat waves over Western Europe, Clim. Dynam., 42, 1309–1324, https://doi.org/10.1007/s00382-013-1794-9, 2014.
Thompson, V., Kennedy-Asser, A. T., Vosper, E., Lo, Y. T. E., Huntingford, C., Andrews, O., Collins, M., Hegerl, G. C., and Mitchell, D.: The 2021 western North America heat wave among the most extreme events ever recorded globally, Sci. Adv., 8, eabm6860, https://doi.org/10.1126/sciadv.abm6860, 2022.
Vidal, J., Martin, E., Franchistéguy, L., Baillon, M., and Soubeyroux, J.: A 50-year high-resolution atmospheric reanalysis over France with the Safran system, Int. J. Climatol., 30, 1627–1644, https://doi.org/10.1002/joc.2003, 2010.
Vidaller, I., Revuelto, J., Izagirre, E., Rojas-Heredia, F., Alonso-González, E., Gascoin, S., René, P., Berthier, E., Rico, I., Moreno, A., Serrano, E., Serreta, A., and López-Moreno, J. I.: Toward an Ice-Free Mountain Range: Demise of Pyrenean Glaciers During 2011–2020, Geophys. Res. Lett., 48, e2021GL094339, https://doi.org/10.1029/2021GL094339, 2021.
Whan, K., Zscheischler, J., Orth, R., Shongwe, M., Rahimi, M., Asare, E. O., and Seneviratne, S. I.: Impact of soil moisture on extreme maximum temperatures in Europe, Weather and Climate Extremes 9, 57–67, https://doi.org/10.1016/j.wace.2015.05.001, 2015.
White, R. H., Anderson, S., Booth, J. F., Braich, G., Draeger, C., Fei, C., Harley, C. D. G., Henderson, S. B., Jakob, M., Lau, C.-A., Mareshet Admasu, L., Narinesingh, V., Rodell, C., Roocroft, E., Weinberger, K. R., and West, G.: The unprecedented Pacific Northwest heatwave of June 2021, Nat. Commun., 14, 727, https://doi.org/10.1038/s41467-023-36289-3, 2023.
Witze, A.: Extreme heatwaves: surprising lessons from the record warmth, Nature, 608, 464–465, https://doi.org/10.1038/d41586-022-02114-y, 2022.
Xu, P., Wang, L., Huang, P., and Chen, W.: Disentangling dynamical and thermodynamical contributions to the record-breaking heatwave over Central Europe in June 2019, Atmos. Res., 252, 105446, https://doi.org/10.1016/j.atmosres.2020.105446, 2021.
Yiou, P. and Jézéquel, A.: Simulation of extreme heat waves with empirical importance sampling, Geosci. Model Dev., 13, 763–781, https://doi.org/10.5194/gmd-13-763-2020, 2020.
Yule, E. L., Hegerl, G., Schurer, A., and Hawkins, E.: Using early extremes to place the 2022 UK heat waves into historical context, Atmos. Sci. Lett., 24, e1159, https://doi.org/10.1002/asl.1159, 2023.
Zschenderlein, P., Fink, A. H., Pfahl, S., and Wernli, H.: Processes determining heat waves across different European climates, Q. J. Roy. Meteor. Soc., 145, 2973–2989, https://doi.org/10.1002/qj.3599, 2019.