the Creative Commons Attribution 4.0 License.
the Creative Commons Attribution 4.0 License.
 | 01 Jul 2025
Measuring extremes-driven direct biophysical impacts in agricultural drought damages
Mansi Nagpal
Jasmin Heilemann
Luis Samaniego
Bernd Klauer
Erik Gawel
Christian Klassert
Assessing the economic implications of droughts has become increasingly important due to their substantial impacts on agriculture. Existing empirical analyses for drought damages are often conducted on a national scale without spatially distributed data, which might bias estimates. Furthermore, the cumulative effects of multiple weather extremes, such as heat or preceded frost co-occurring with drought, are often overlooked. Measuring the direct biophysical impacts of such extremes on agriculture is essential for more precise risk assessment. This study presents a comprehensive approach to measure the cumulative economic damages of droughts and other hydrometeorological extremes on agriculture, focusing on eight major field crops in Germany. By utilizing a statistical yield model, we isolate the effects of multiple extremes on crop yields from other influencing factors (such as pests and diseases or farm management) and analyse their contribution to revenue losses during droughts at the district level from 2016–2022. Our findings indicate that the average annual direct biophysical damage caused by extremes under drought conditions during this period amounts to EUR 781 million (sensitivity range: EUR 766 million–EUR 812 million) across Germany. The study also reveals that biophysical impacts of extremes alone account for 60 % of reported revenue damages during widespread drought years. For maize, direct biophysical damage explains up to 97 % (2018) of revenue losses. Additionally, comparison of national level damage estimates using aggregated and spatially disaggregated data shows that the aggregated data matches overall results, but diverges for maize and wheat, highlighting the importance of spatially distributed damage assessment. In this paper, we provide detailed estimates of extremes-driven direct biophysical damages at the district level, offering a high-resolution understanding of the spatial and temporal variability of these impacts. Assessing the extent of revenue losses resulting from these extremes alone can provide valuable insights for the development of effective drought mitigation programmes and guide policy planning at local and national levels to enhance the resilience of the agricultural sector against future climate extremes. Future integration of routine drought damage estimation into operational monitoring and forecasting systems would enhance early warning capabilities, improve economic preparedness against increasing weather extremes, and support more proactive adaptation strategies.
- Article
(5464 KB) - Full-text XML
-
Supplement
(1931 KB) - BibTeX
- EndNote


Recent decades have seen a significant change in global temperature and precipitation patterns (Daramola and Xu, 2022). As climate change progresses, extreme events such as droughts and heat waves are expected to increase (Samaniego et al., 2018). The impacts of such hydrometeorological extreme events on water resources and agriculture, which are strongly linked to global food security, are already being felt (Shukla et al., 2019). Quantifying the costs of these impacts and understanding their drivers is a prerequisite for assessing vulnerabilities and designing adaptation measures to increase the resilience of the agricultural sector (Rose, 2004).
A variety of factors including war (Appau et al., 2021), disease and pests (Savary et al., 2019), and extreme weather (Lesk et al., 2016) affect crop yields. Of these factors, climate variability has particularly pronounced impacts on yield variations. In major agricultural production regions globally, over 60 % of yield variability can be explained by climate variability (Ray et al., 2015). Drought, in particular, is one of the most severe climate-related hazards, significantly reducing crop yields and incurring high crop production losses. For instance, it is estimated that the average crop production impact of droughts (and heatwaves) has tripled from 1964 to 2015 across the European Union (Brás et al., 2021). Given the profound impact of droughts on agriculture, it is crucial to understand the economic consequences and the extent of damage caused by such extremes. However, the complexity of drought occurrences – characterized by their slow development, spatial and temporal accumulation, and significant variability in severity and intensity – makes research on their economic impacts challenging (Eckhardt et al., 2019).
Droughts are periods of significantly reduced moisture levels in the Earth system (Wilhite and Glantz, 1985), leading to restrictions in water availability and causing detrimental impacts on various environmental systems and economic sectors. Generally, there are four types of droughts: meteorological droughts (precipitation deficit), agricultural droughts (soil moisture deficit), hydrological droughts (abnormal streamflow, groundwater, reservoir, or lake deficits), and socioeconomic droughts (abnormal deficit due to imbalance between supply and demand) (Wilhite and Glantz, 1985).
The impacts of droughts extend to agriculture, livestock, forestry, energy, and industries, and even threaten human safety (de Brito et al., 2020). Due to its sensitivity to weather variability and soil moisture, the agricultural sector is often the first sector to be affected by drought (Ding et al., 2011; Wilhite, 2000). Agricultural droughts are soil moisture droughts that occur when crop water requirements are not met during the growing season due to a reduced water supply in the soil, mainly caused by decreased precipitation or/and increased temperatures (Liu et al., 2016; Rakovec et al., 2022). This lack of moisture affects crop growth and yields, posing a significant threat to harvests. These impacts can lead to a substantial decline in crop revenue and/or an increase in production costs, ultimately reducing farm profits, affecting farmers' livelihoods and economic stability within the sector, and threatening food security (FAO, 2023; Ziolkowska, 2016).
The impact of drought on agricultural production is not solely determined by the severity of the drought itself, but also by exposure to different weather extremes throughout the growing season (Haqiqi et al., 2021; Peichl et al., 2018; Schmitt et al., 2022). For example, extreme heat during summer droughts can intensify damage to crops such as maize, further reducing yields (AghaKouchak et al., 2014). Similarly, winter crops like wheat can suffer significant losses from drought followed by periods of excessive rainfall, negatively affecting yields and harvest quality (Ding et al., 2018; Zampieri et al., 2017). Most research on measuring the economic impacts of extreme events like droughts has been confined to assessing the impacts of specific weather extremes, despite growing evidence that such events are frequently driven by multiple interrelated climate drivers that can occur concurrently or successively within the same geographic area (AghaKouchak et al., 2014; Deng et al., 2024; Rakovec et al., 2022; Zscheischler et al., 2018, 2020). Failing to account for such concurrently or successively occurring extremes is likely to oversimplify the process leading to damages, underestimate the cumulative effects of weather extremes on crops, and may result in an incomplete risk perception and inaccurate damage estimates (Meyer et al., 2013).
In this study, we address this bias by assessing the economic damage of drought in combination with concurrent or successive weather extremes in rainfed agriculture. The aim of this study is to measure the direct biophysical damage of extreme hydrometeorological drivers during droughts (hereafter called direct biophysically induced damages) and assess the contribution of these biophysically induced damages to the total reported agricultural revenue losses. These damages refer to the loss in revenue caused by the effects of extreme hydrometeorological drivers on crop yields without accounting for other economic impacts such as changes in costs. They include the effects of droughts themselves, as well as additional damage from concurrent or successive weather extremes that exacerbate drought-related effects in regions experiencing drought conditions. To isolate the biophysical impacts of these extremes on crop yields from other influencing factors, we employ crop-specific statistical yield models. To evaluate the contribution of these extremes in shaping observed economic outcomes, we compare the direct biophysically induced damages estimated from these models with reported revenue losses. This allows us to identify the relative contribution of these extremes across different regions and crops, which can guide more targeted drought adaptation and enable better decision-making.
The empirical analysis of direct biophysically induced damages during droughts was done at the district (regional) level for rainfed agriculture for eight major field crops in Germany from 2016–2022. These estimates were derived from the methodology used to measure the damages of the 2018 and 2019 droughts in Germany (Trenczek et al., 2022). We have enhanced this methodology for our current assessment.
Additionally, we demonstrate the utility of high-resolution damage assessment by comparing damages at the national level derived using both national level and regional level data. Existing research on measuring the damages of droughts on agriculture often focuses on national level damage assessments without considering spatially distributed data and typically examines-specific drought events (COPA-COGECA, 2003; Trenczek et al., 2022). Alternatively, there are several empirical studies analysing drought damages at the farm level that often incorporate adaptation strategies (van Duinen et al., 2015; Wens et al., 2021), input changes (Prasanna, 2018), and factors affecting localized responses to droughts (Ahmad et al., 2022; Garbero and Muttarak, 2013; Gray et al., 2009). Their findings are tailored to specific context and may not be readily scalable to broader regions. Conversely, national level assessments, though comprehensive, fail to capture the spatial variability of drought impacts. As droughts can vary greatly across different locations and times (Jaeger et al., 2013; Samaniego et al., 2013), there is a need for consistent, spatially explicit damage assessments (Meyer et al., 2013) bridging the gap between farm level detail and national level scope. Our analysis reveals that high-resolution damage assessment using regional level data provide a more accurate quantification of crop-specific damages, which might not be captured by assessments using national level data.
This study offers detailed, high-resolution estimates of extremes-driven direct biophysically induced damages at the district level, offering insights into the spatial and temporal variability of these impacts. By accounting for concurrent or successive weather extremes alongside droughts, our research provides a more accurate assessment of revenue losses during droughts. These findings can inform the development of effective drought mitigation programmes and guide policy planning at local and national levels to enhance the resilience of the agricultural sector against future climate extremes.
2.1 Overview of analytical approach
This study focuses on isolating the direct biophysically induced damages of weather extremes during droughts on agriculture from other influencing factors and assessing their contribution to revenue losses. Figure 1 outlines our approach to quantifying these damages in rainfed agriculture by illustrating both the causal pathways by which droughts and related extreme events lead to revenue losses during the year the drought occurs and the empirical methods and data used to measure them. In our analysis, we quantify the direct biophysical impacts of concurrently or successively occurring weather-extremes (rather than changes in mean temperature, precipitation, etc. as done in context of climate change) on crop yields and the resulting damages.
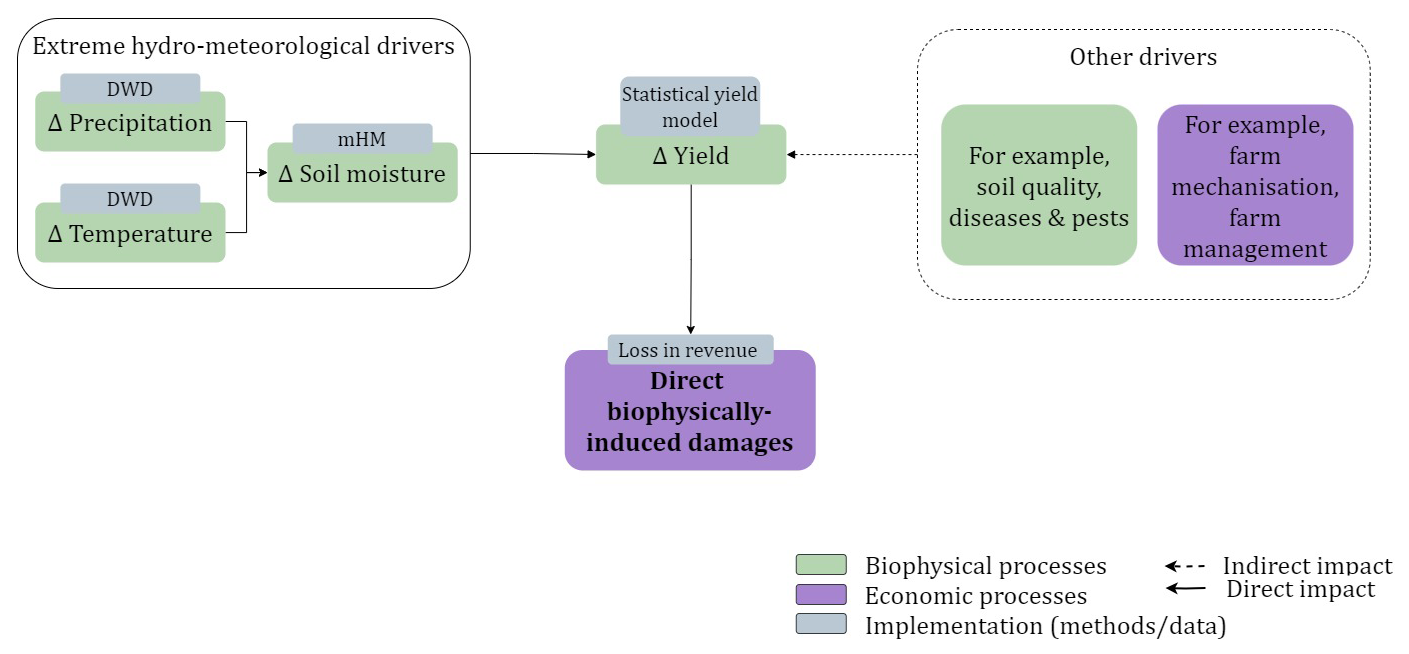
Figure 1Schematic illustration of the approach for quantifying the direct biophysically induced damages, measured as the farmers' revenue losses due to hydrometeorological extremes during droughts. Temperature and precipitation data from the German Weather Service (DWD) and soil moisture estimates from the mesoscale Hydrological Model (mHM) serve as key hydrometeorological inputs in a statistical yield model to estimate the direct impact of drought and related extremes on crop yields. These effects are isolated from other influencing factors, such as soil quality and farm management, to focus on the direct biophysical drivers of yield losses.
Agricultural droughts occur when soil moisture levels are insufficient to meet crop water requirements during the growing season, making soil moisture (anomalies) a more accurate predictor of biophysical impacts than precipitation or temperature alone (Bachmair et al., 2016). The importance of soil moisture in informing agricultural damage assessment is increasingly recognized (Haqiqi et al., 2021; Peichl et al., 2018). Declining soil moisture due to drought directly impedes crop growth and reduces crop yields, which are referred to as the direct impacts of droughts on agriculture (Meyer et al., 2013). These biophysical impacts can be exacerbated by the occurrence of other weather extremes. For example, heat, can exacerbate damage to summer-grown crops like maize during droughts (AghaKouchak et al., 2014; Haqiqi et al., 2021), while excessive wet conditions during the growing season in addition to drought can lead to substantial damage to winter-grown crops like wheat (Ben-Ari et al., 2018; Zampieri et al., 2017). Thus, under evolving climate conditions, it is crucial to assess the direct biophysical impacts of droughts in conjunction with various hydrometeorological extremes, as these factors collectively have been shown to explain a significant proportion of crop yield variability (Schmitt et al., 2022; Vogel et al., 2019; Webber et al., 2020). In our analysis, the direct biophysical effect of extreme hydrometeorological drivers on crop yield is estimated using crop-specific statistical yield models using temperature, precipitation and soil moisture as key input variables (detailed in Sect. 2.3). As shown in Fig. 1, the soil moisture data, which are central for defining drought conditions, is derived using the mesoscale Hydrological Model (mHM) (Samaniego et al., 2010). Additionally, the sources of temperature and precipitation data (German Weather Service, DWD) are also indicated for consistency.
The impact of declining soil moisture because of drought is more pronounced in rainfed agriculture, where crop yields can be significantly affected in the short term (Kurukulasuriya et al., 2006). Conversely, irrigation helps buffer the impact of low soil moisture on crop yields. However, if the drought persists and leads to acute water shortage and competition for water use by other users, it can still cause considerable damage to irrigated agriculture during droughts (Smith and Edwards, 2021).
While the analysis presented in this paper focuses on measuring direct biophysically induced damages in rainfed agriculture, it is important to note that the impacts of droughts extend beyond these direct effects. For completeness, Fig. S1 in the Supplement presents the broader economic impacts of drought and related weather extremes within a drought year, incorporating both rainfed and irrigated agriculture. These economic impacts arise because the direct damage to crop yields by drought and other weather extremes sets in motion a series of economic processes (Diaz and Moore, 2017). The biophysical impact on crop yields results in a decrease in harvest that leads to negative supply shocks which can raise the prices of agricultural products. These price increases are known as indirect impacts of droughts and must be considered in economic impact assessments (Ding et al., 2011; Rose, 2004). Beyond these indirect impacts, farmers may implement various short-term risk mitigation strategies, such as adjusting their inputs or employing supplemental irrigation, to lessen the impact of the drought. These strategies, however, come with associated costs that need to be considered when estimating drought damages and are referred to as adaptation costs. The total economic impact of droughts and related extreme events (referred to as extremes-driven impacts) thus encompass indirect impacts on prices, changes in inputs and costs, in addition to the direct damages. In some cases, farmers may benefit from higher prices if the percentage increase in price exceeds the decrease in supply. This is particularly profitable for farmers operating outside the drought-affected area or farmers using irrigation. However, such impacts are difficult to measure using only national data and may require more detailed spatial assessments at the subnational level. Moreover, given that droughts are unevenly distributed over space, it is important to incorporate sufficiently detailed spatial disaggregation to assess the economic impacts on a national scale.
It is important to note that typically, all these impacts have an effect in a single production cycle. However, long-term impacts may also occur, including adjustments like behavioural changes in farmers that result in land use change (Biazin and Sterk, 2013; Henchiri et al., 2020). These long-term adjustments, while significant, are not measured or accounted for in this analysis.
Measurement of damages requires comparing actual conditions (hazard impact) as described above with counterfactual conditions (i.e. what would have happened in the absence of hazard). However, assessing the true counterfactual conditions is often challenging. A common practice in drought impact assessments in agriculture to compare agricultural production in drought years with that of recent non-drought years, which serve as a proxy for the counterfactual conditions. There is, however, a lack of consensus on the length of non-drought years, with some analyses using single-year (COPA-COGECA, 2003), 3-year (Musolino et al., 2018), 5-year (Trenczek et al., 2022), or 6-year (Conradt et al., 2023) periods. Determining the optimal length of non-drought years to use as counterfactual conditions requires further research and is not addressed in this paper. Here, we use the 5-year length to estimate counterfactual conditions following the approach of Trenczek et al. (2022) as detailed in Sect. 2.2.
Another critical factor in defining counterfactual conditions is determining which years qualifies as a drought year. This becomes even more complicated due to the numerous factors influencing crop yields, such as soil quality, input materials, mechanization, and farm management practices, which can mask biophysical drought effects. Establishing indicators for drought declaration in the agricultural sector could prove useful in this regard. This would help consistently categorize a year and a region (treated in our analysis as a district) as drought or non-drought, ensuring accurate assessment of damages, even for small-scale drought events, and avoiding focusing solely on widespread droughts. We use an indicator based on the soil moisture, described in Sect. 2.4.
The empirical analysis was conducted in Germany, where the agricultural sector plays a significant role with half of its land area dedicated to agricultural use (BMEL, 2022). The analysis was performed at the district level in Germany from 2016–2022, focusing on eight key field crops: winter wheat, winter barley, rapeseed, maize, spring barley, spring oats, sugar beets, and potatoes. Together, these crops account for 75 % of Germany's agricultural area (Statistisches Bundesamt (Destatis), 2022a). Given that German agriculture is predominantly rainfed, with less than 10 % of the area equipped with irrigation (McNamara et al., 2024), our assessment primarily reflects damages on rainfed agriculture. The empirical analysis that follows focuses on the direct biophysical impacts of these extremes and their role in revenue losses, excluding any indirect impacts beyond the immediate consequences of biophysically induced yield losses or the adaptation costs incurred by the farmers during droughts. Additionally, we assess the utility of high-resolution damage assessment, given that numerous studies suggest the need for such detailed assessment.
2.2 Damage measurement
The damage D in agricultural revenues during a drought year t is quantified as the sum of difference between the expected revenue under counterfactual conditions and the actual revenue for each crop c across eight crops. This can be expressed as
where is the expected revenue for crop c and is the actual revenue for crop c during the year t.
The counterfactual conditions aim to represent the average non-drought conditions specific to each region. In the context of ongoing climate variability, it is critical that the counterfactual conditions represent the evolving regional climatology (Suarez-Gutierrez et al., 2023) rather than relying on an idealized “normal” year in the traditional sense, which may no longer occur in practice. In this analysis, we define the counterfactual conditions as the average conditions in the preceding 5 non-drought years. We selected a 5-year window following Trenczek et al. (2022), who used it to estimate damages for 2018 and 2019 droughts in Germany. The reason for this number of years is a trade-off: using more years could in theory further enhance the statistical representativeness regarding local climatic conditions, but it risks introducing bias by masking changing market and production conditions, as well as the overall trend in climate change, which also influence local yields and revenues (Lobell et al., 2011).
We determine drought (and non-drought) years based on the soil moisture. In order to do so, we use the soil moisture index (SMI) metric, as explained in Sect. 2.4, and exclude any drought years in the average estimation, an improvement over existing approaches in the literature. This approach allows us to calculate revenue deviations using only normal (non-drought) years yield data without bias from multiple recent drought occurrences.
While the counterfactual is designed to exclude drought years, it is possible that some exposure to other extremes could still be reflected in the yields of non-drought years. Any potential yield anomalies in non-drought years, which could lead to over- or under-estimating drought damages, are addressed through the approach of estimating expected revenue based on the 5-year average. The helps smooth out any random yield fluctuations and minimize the influence of non-drought related anomalies. Specifically, the expected revenue is estimated using the average yield over the preceding 5 non-drought years i and the price in the drought year t and actual revenue Ractual,c is the revenue in the drought year. Therefore, for the present analysis, Eq. (1) can be rewritten as
where Yi,c denotes the average crop yield for crop c over the preceding 5 non-drought years i (i.e., from year t−1 to t−5). Yt,c is the crop yield for crop c in the drought year t and Pt,c is the price of crop c in the drought year t. The use of drought-year prices to estimate expected revenues reflects contemporaneous market conditions during the drought year and maintains consistency with previous studies. While using in-year prices for estimating expected revenues might capture the indirect effects of droughts on prices (Badolo and Somlanare, 2012; Berhanu and Wolde, 2019; Foreign Policy Research Institute, 2024), it would also incorporate other agricultural market developments unrelated to local droughts or extremes, complicating the attribution of damages to regional extreme hydrometeorological drivers. Holding prices constant ensures that the damage estimates focus solely on the yield changes induced by extreme hydrometeorological drivers, providing a precise estimation of biophysically induced direct damages in monetary terms.
To isolate the direct biophysical impacts of extreme hydrometeorological drivers on crop yields from other influencing factors, we define the crop yield Yc for crop c as a function of crop-specific extreme weather events (EWE), derived from data on precipitation (PR), temperature (T) and SMI:
These crop yields are simulated using a statistical crop yield model, which is described in the next section. We use simulated crop yields to estimate actual revenue for drought years and expected revenue under counterfactual conditions for non-drought years, in order to calculate damages in Eq. (1). This ensures that the damage estimates are explicitly based on yield variability driven by EWE as described in Eq. (3), while excluding other factors unrelated to extreme hydrometeorological drivers. Along with the assumption of constant prices, this methodology ensures that the revenue deviation between expected and actual revenues is attributed solely to the direct biophysically induced yield impacts during droughts.
2.3 Statistical crop yield model
We apply a statistical crop yield model to isolate the impact of hydrometeorological extremes including droughts on crop yields developed by Heilemann et al. (2024). The model predicts changes in crop yields based on different hydrometeorological extremes, including drought. The statistical model is based on the least absolute shrinkage and selection operator (LASSO) approach. It is a method for selecting relevant features via penalized multiple linear regression to avoid multicollinearity and obtain a higher predictive performance (Tibshirani, 1996). The statistical relationship between district level crop yields and hydrometeorological extreme variables was formulated using the following equation:
where Y is the yield anomaly of a crop, Xij represents the vector of different crop-specific extreme weather events during sensitive growth phases in different months/seasons (explained below) and represent the model coefficients to be estimated. Each field crop used for the analysis is modelled separately.
By including the penalty parameter λ, the LASSO coefficients minimize the residual sum of squares of the regression models (James et al., 2013):
The model employs a 10 fold cross-validation to determine two key values of λ: λmin, which minimizes the mean squared error (MSE) of the model, and λ1SE, which is defined as λmin plus the standard error of λ that results in the minimum loss. Following the approach outlined by Vogel et al. (2021), the stronger penalty term λ1SE is selected as a target, leading to the elimination of a greater number of variables compared to λmin.
Table 1Thresholds for extreme weather events from Heilemann et al. (2024).
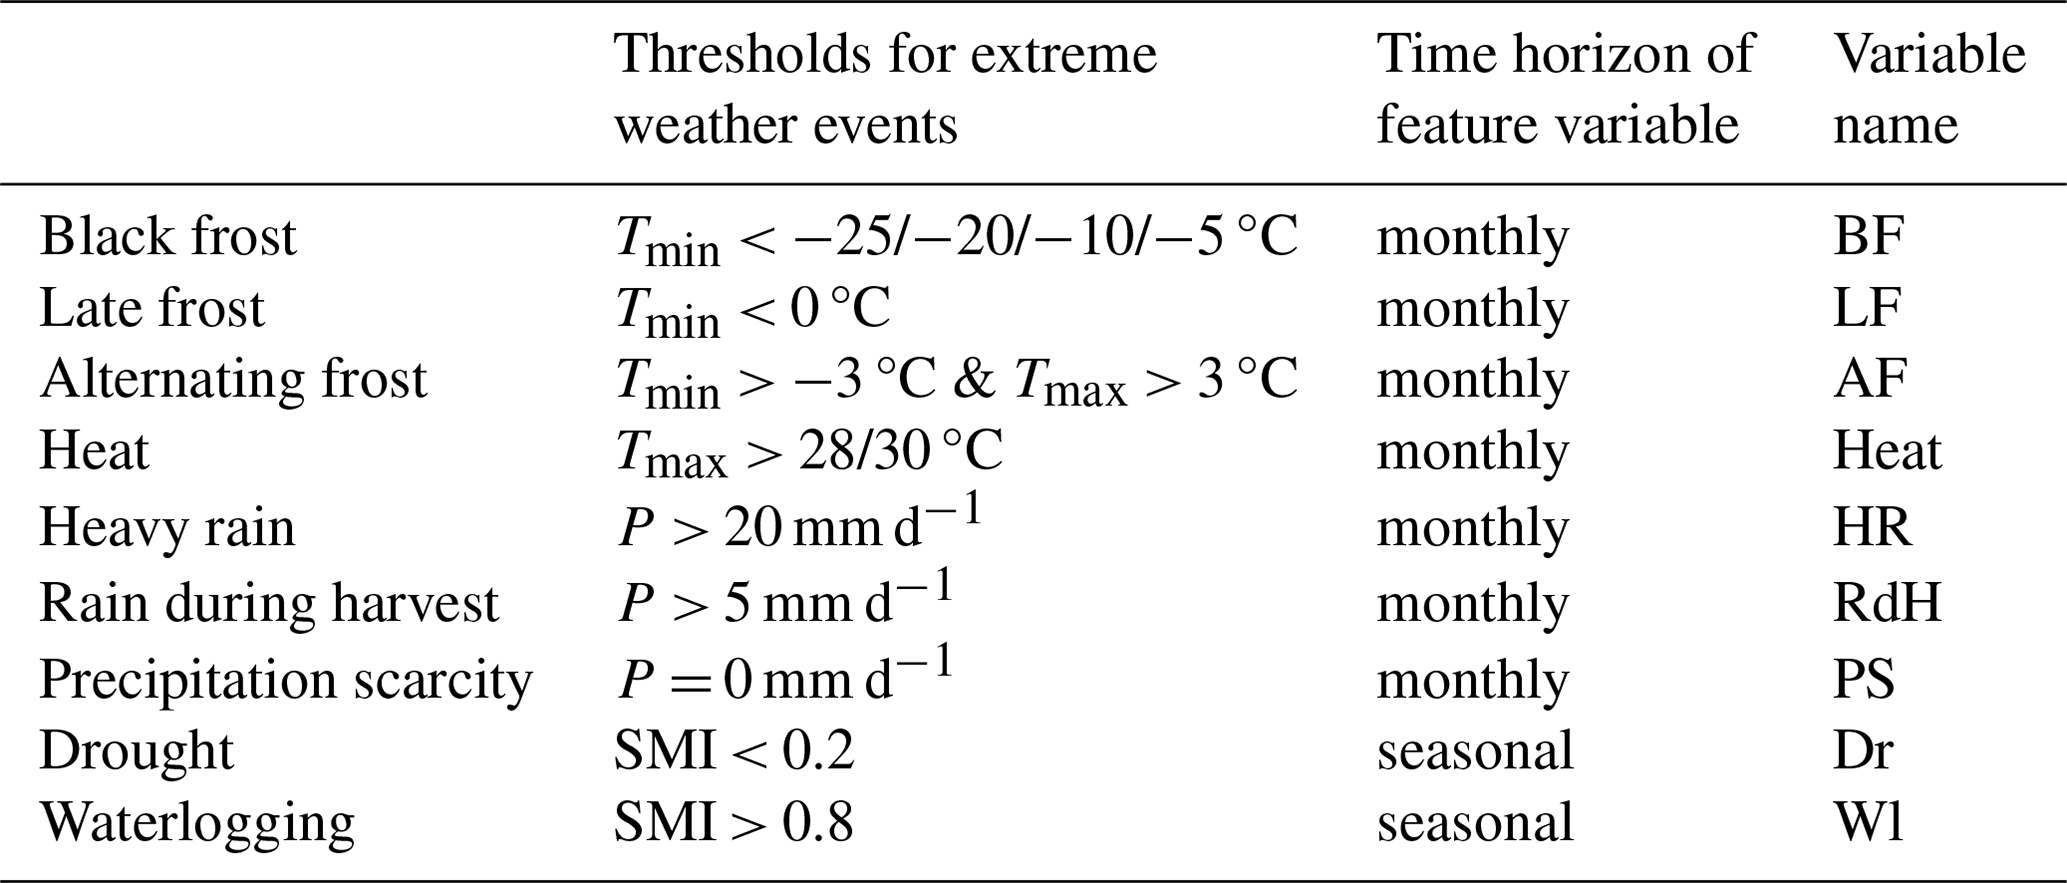
While we want to assess the damage of droughts on agriculture, other extreme weather events can co-occur and interact with drought. The statistical crop yield model employed accounts for this by taking nine different extreme weather events into consideration which pose significant threats to crops in Germany (Table 1), such as frost, heat, heavy rain, rain during harvest, precipitation scarcity, drought, and waterlogging. By focusing on extreme events rather than mean temperature changes, the statistical yield model can more accurately capture the effects of extreme weather events (Webber et al., 2020), making it better suited for assessing the impact of such events (Newman and Noy, 2023). In Sect. 2.4, we describe how we delineate a drought occurrence and then estimate the compound effect of multiple weather extremes during the drought.
The timing of these events is crucial in determining crop damage. Therefore, the indicators for frost, heat, heavy rain, rain during harvest, and precipitation scarcity are included in the model as monthly features assessed during the relevant months of the growing season using crop-specific thresholds (Gömann et al., 2015). These indicators are calculated by counting the days in a month that exceed or fall below the defined thresholds. The indicators of drought and waterlogging are determined using the seasonal SMI value calculated from the monthly SMI value for the topsoil (25 cm soil depth), tailored to the growing period of each crop. To this end, the monthly drought and waterlogging intensity as the difference between a SMI below 0.2 for drought, or above 0.8 for waterlogging is calculated. The model uses the seasonal drought and waterlogging intensity as the average of the monthly intensities. All features are used as continuous variables to account for stronger effects on crop yields through more intense extremes.
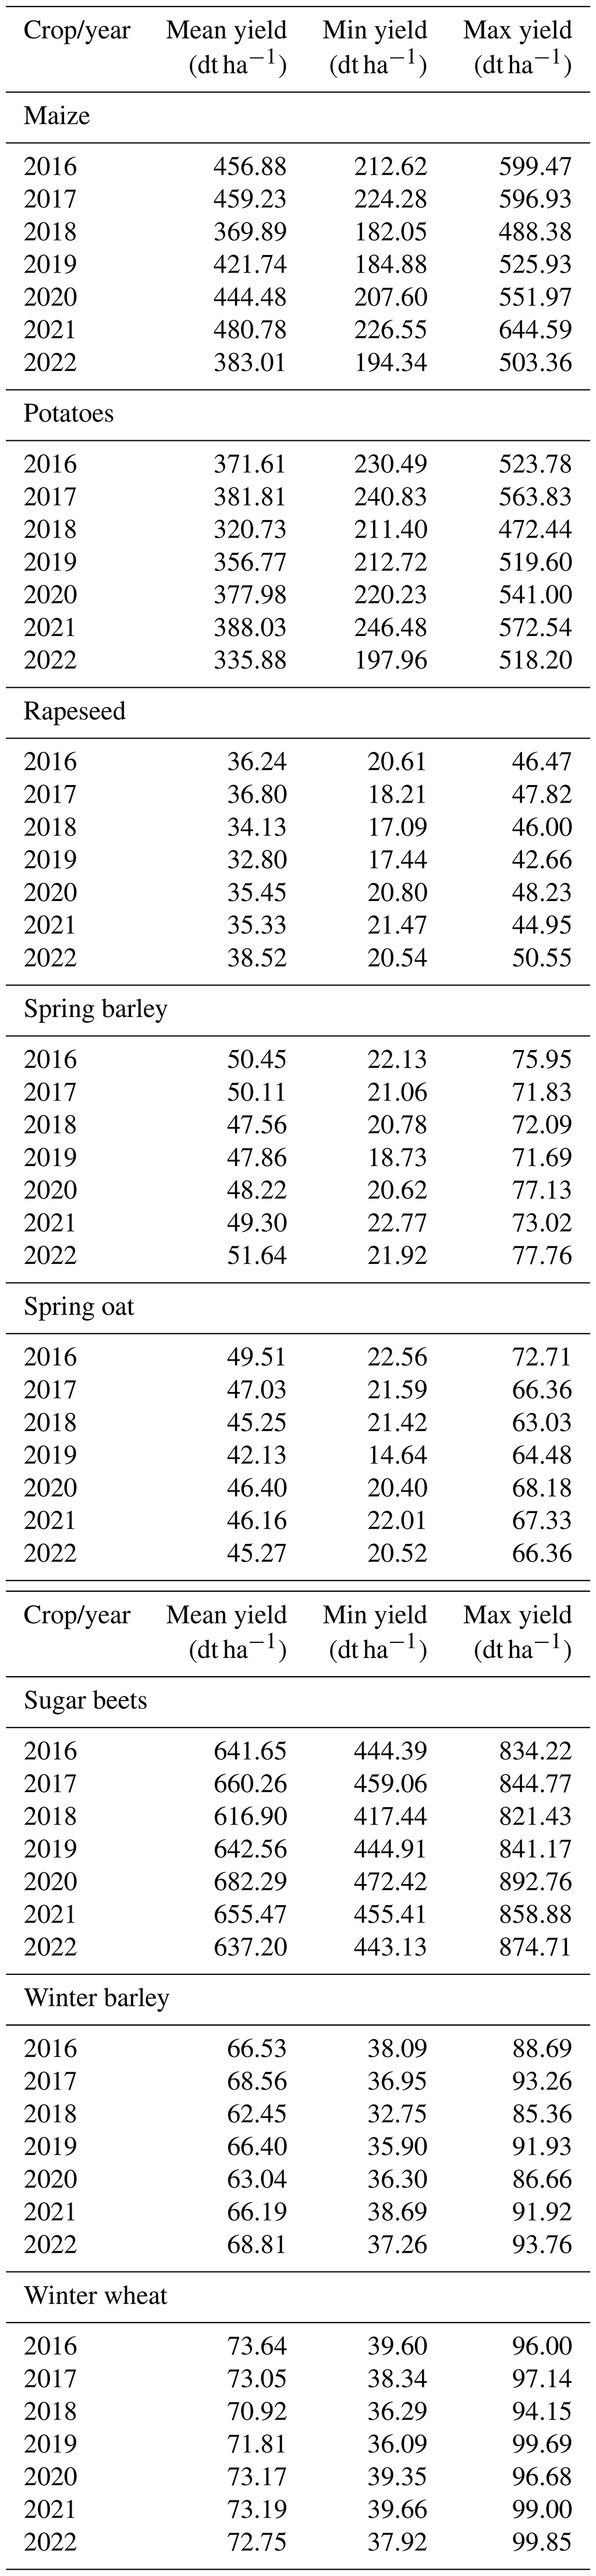
Based on the extreme event features, the LASSO models predict the annual yield anomaly (in %) as the dependent variable, representing the deviation of yields from the district level mean yield for 1999–2022. Details on the standardized coefficients of the crop-specific LASSO models can be found in Table S2 of Heilemann et al. (2024). To illustrate the adequacy of the 1999–2022 period in identifying extremes, temporal histograms of all extreme weather events for the maize crop, used as a representative crop, are provided in the Supplement (Figs. S2–S3). These histograms demonstrate that the selected period captures a substantial number of extreme events, notably the exceptional droughts of 2003, 2018–2020, and 2022, waterlogging in 2001, 2007, 2010, and 2013 as well as severe frost and heat events. To simulate crop yields (in decitonnes per hectare – dt ha−1), we multiply the predicted yield anomaly by the district level mean yield. This approach allows us to isolate crop yields attributable to hydrometeorological extremes defined in Table 1, including droughts. These simulated yields are then used for damage assessment in drought-affected districts categorized using the SMI (as described in next section), aligning with the objective of quantifying the economic damages during droughts driven by the biophysical impacts of droughts and their interaction with other extremes. Descriptive statistics for the simulated yields, including their annual mean, minimum, and maximum values, are provided in Appendix A.
2.4 Drought categorization
To identify districts experiencing agricultural drought, we categorize the occurrence of drought in each district and year using the SMI (Samaniego et al., 2013) estimated from monthly soil moisture derived from the mHM. The SMIk represents the monthly soil water quantile at a grid cell at time k relative to the range of historical observations. A given cell is considered to be experiencing a soil moisture drought when SMIk<τ. The threshold τ denotes that the cell is experiencing a soil moisture deficit occurring less than τ×100 % of the time. For our analysis, τ was set as 0.2 indicating moderate drought conditions that may pose potential harm to crops and pastures (Zink et al., 2016). To consider the seasonal variations in water supply related impacts, we focus on the SMI during the active vegetative period from April to October. While recent studies have shown varying relationships between monthly SMI and crop yields (Peichl et al., 2021), we chose to utilize the average SMI during the active vegetative period to establish a neutral classification of drought impacting different crops.
Using monthly SMI data, at a resolution of 4 km × 4 km and covering the Germany entirely, the monthly average area under drought conditions was estimated (Nagpal et al., 2024) for each district. The drought categorization based on the SMI reflects regional differences in climatic conditions as the SMI is calculated relative to the local historical soil moisture distribution in each district. To classify the occurrence of drought at a district level, it was considered that at least 20 % area of each district must have an SMI < 0.2 per month, and this condition should persist for at least three months during the active vegetative period, i.e. the months of April to October in a given year (Belleza et al., 2023). This approach accounts for the slow development and spatial and temporal accumulation characteristics of droughts. By using a threshold of SMI < 0.2, we comprehensively capture all districts affected by droughts, including those experiencing varying intensities from severe (SMI < 0.1) to exceptional conditions (SMI < 0.02). This method enables the identification of non-drought years of a district, necessary for estimating expected revenues under counterfactual conditions. To evaluate the effect of this drought classification approach on damage estimates, we conducted sensitivity analyses by varying the threshold for the proportion of affected area (±5 %), to confirm the robustness of damage estimates under alternative drought classification criteria.
2.5 Data
2.5.1 Yield model inputs
Here, we provide a concise overview of the data used in the yield model used to analyse the direct biophysically induced damage during drought on agriculture. Crop yields are simulated at the district level in Germany for eight field crops: winter wheat, winter barley, rapeseed, maize, spring barley, spring oats, sugar beets, and potatoes, using the LASSO model. Detailed information on the input data used for yield estimation can be found in Heilemann et al. (2024).
The annual yield data, used to simulate the yields, is sourced from the Federal Statistical Office of Germany available for the district level from 1999–2022 (Statistisches Bundesamt (Destatis), 2022b). Meteorological data encompassing minimum and maximum daily temperature and daily precipitation is obtained from the German Weather Service (DWD) through a network of stations (Deutscher Wetterdienst, 2024). Additionally, the monthly SMI for Germany is derived from the mHM model (Samaniego et al., 2010, 2013).
2.5.2 Damage assessment
For the assessment of biophysically induced damages of extremes under droughts, we use data on crop acreage at the district level for the years 2016–2022. The data for cultivation on the arable land by crop (in ha) at the district level are collected periodically by the statistical office in Germany and are not available for all years. Consequently, we use official statistical data for the years 2016 and 2020 (Statistisches Bundesamt (Destatis), 2020). For the remaining years, we rely on spatially explicit, remote-sensing-based crop maps with 10 m resolution for Germany (Blickensdörfer et al., 2022). The area under the eight crops analysed in this study was extracted from the high-resolution crop map data at the district level using QGIS and R.
Yearly producer prices (EUR dt−1) for crops in Germany are accessible from the European Statistical Office, except for sugar beets and maize (EUROSTAT, 2022). To achieve spatially differentiated prices at a higher resolution, we scale this data using prices provided by the Kuratorium für Technik und Bauwesen in der Landwirtschaft (KTBL) calculator on the standard gross margin (KTBL, 2023). For further details, please refer to Nagpal et al. (2024). For sugar beets, prices from KTBL at the country level are used, which were homogeneous until 2017 due to production limits imposed by the European Union and price guarantees provided to producers (Wimmer and Sauer, 2020). Since silage maize in Germany is not directly marketed but is used for fodder or biogas production (FNR, 2023), prices for silage maize are estimated by accounting for both these uses separately as described in Nagpal et al. (2024).
3.1 Relevance of spatially disaggregated damage assessment
To show the utility of spatially disaggregated damage assessment and to understand the potential biases in using national level data, we apply the methodology outlined in (Trenczek et al., 2022) using both national level and district (regional) level reported crop yields, prices and land use data for Germany. The referenced report calculated damage estimates for 2018 and 2019 based on national level reported data by determining the difference between expected and actual revenue. Expected revenue was derived from the average crop yields of the 5-year period of 2013–2017, combined with the prices and cultivated area from the assessment year.
While the report provided crop-wise damages specifically for winter wheat and silage maize and aggregate the damages for all other crops into a single category, our analysis extends this methodology to estimate damages for six additional crops: winter barley, rapeseed, spring barley, spring oats, sugar beets, and potatoes. In our analysis, crop-specific damages are calculated both at the national level, using aggregated national data, and at the regional level, using reported yields from each district. Regional level damages are then summed to obtain national totals for comparison with aggregated national level results. This approach allows us to compare the extent of differences in damage estimates between national level and regional level data sources while retaining a crop-specific focus in both cases, providing insights into the potential biases that may arise from relying solely on national level data.
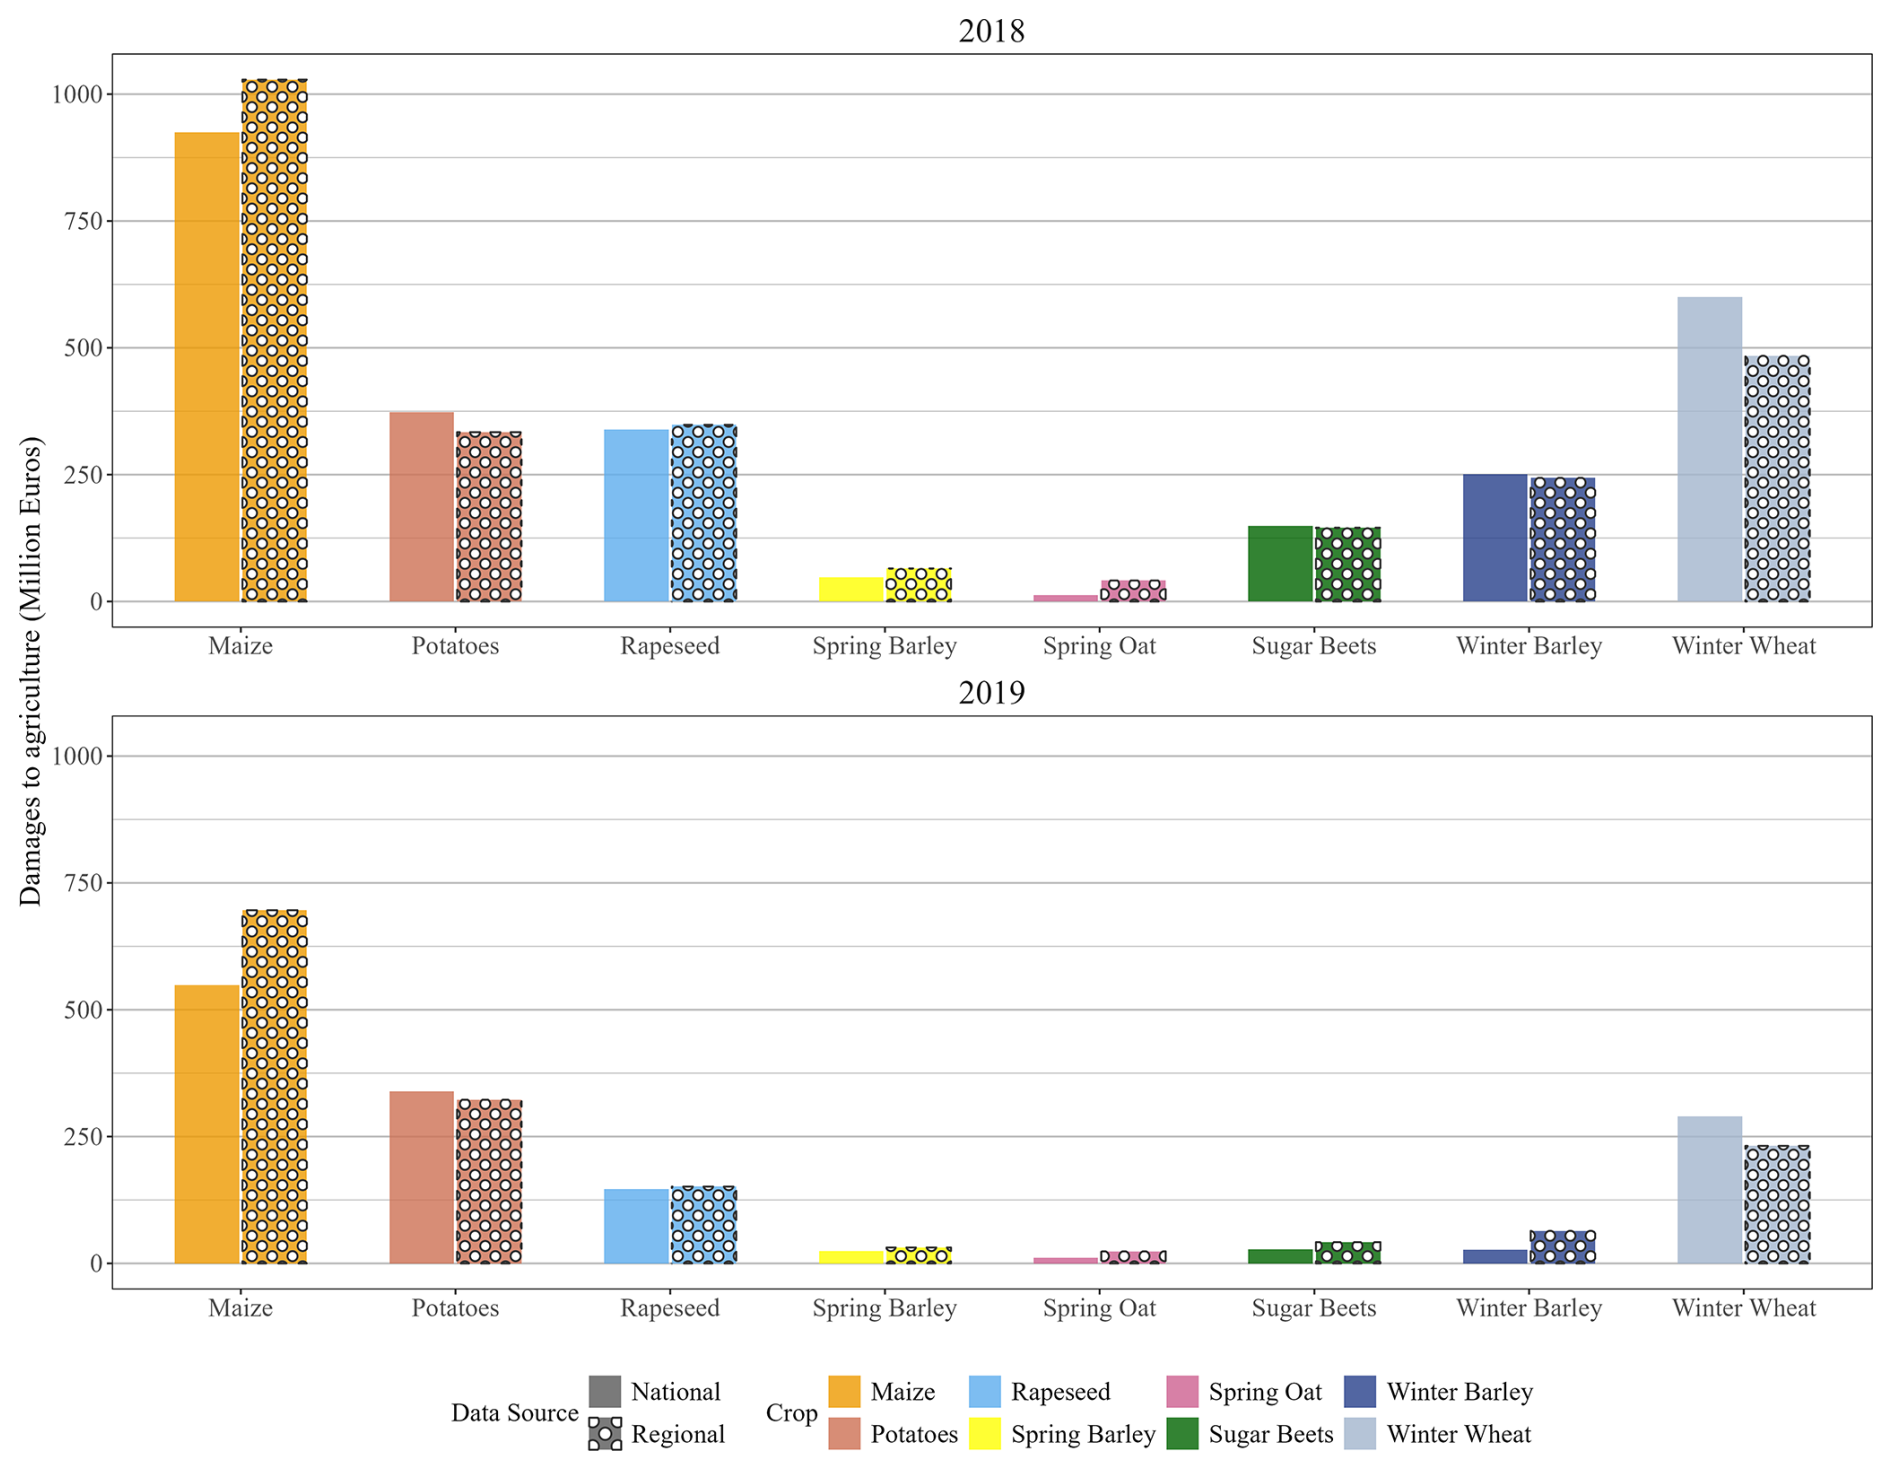
Figure 2Authors' crop-wise damage assessment based on the methodology outlined in (Trenczek et al., 2022) for the years 2018 and 2019 with both national level and regional level reported yield data for Germany.
In our analysis, we found moderate difference between the total damages derived from national level data and regional level data. For 2018, the aggregated damages across all crops based on both national level data and regional level data are estimated at approximately EUR 2.6 billion. For 2019, the aggregated damages across all crops based on national level data (EUR 1.4 billion) are slightly lower than those based on regional level data (1.6 billion). However, there are notable differences in the damages across two major crops grown across Germany – maize and winter wheat (Fig. 2). In both 2018 and 2019, the spatially distributed damages on winter wheat are lower than those based on aggregated national data while they are significantly higher for maize. These results demonstrate that the use of spatially disaggregated data provides a more accurate quantification of crop-wise damages, which might not be captured by national level assessments.
3.2 Spatiotemporal analysis of direct biophysical damages
Using the yields simulated by the statistical yield model (Eq. 4), we evaluated the direct biophysically induced damages during droughts at the district level in Germany from 2016 to 2022. This evaluation was done by comparing the actual revenue during a drought year with the expected revenue of non-drought years (Eq. 2) for all districts affected by drought. The revenues are estimated using simulated yields that isolate the direct biophysical impacts of extremes on crop yields from other influencing factors. The bottom row of panels in Fig. 3a, labelled as “biophysical”, shows the spatial distribution of these estimated biophysically induced damages during droughts from 2016–2022.
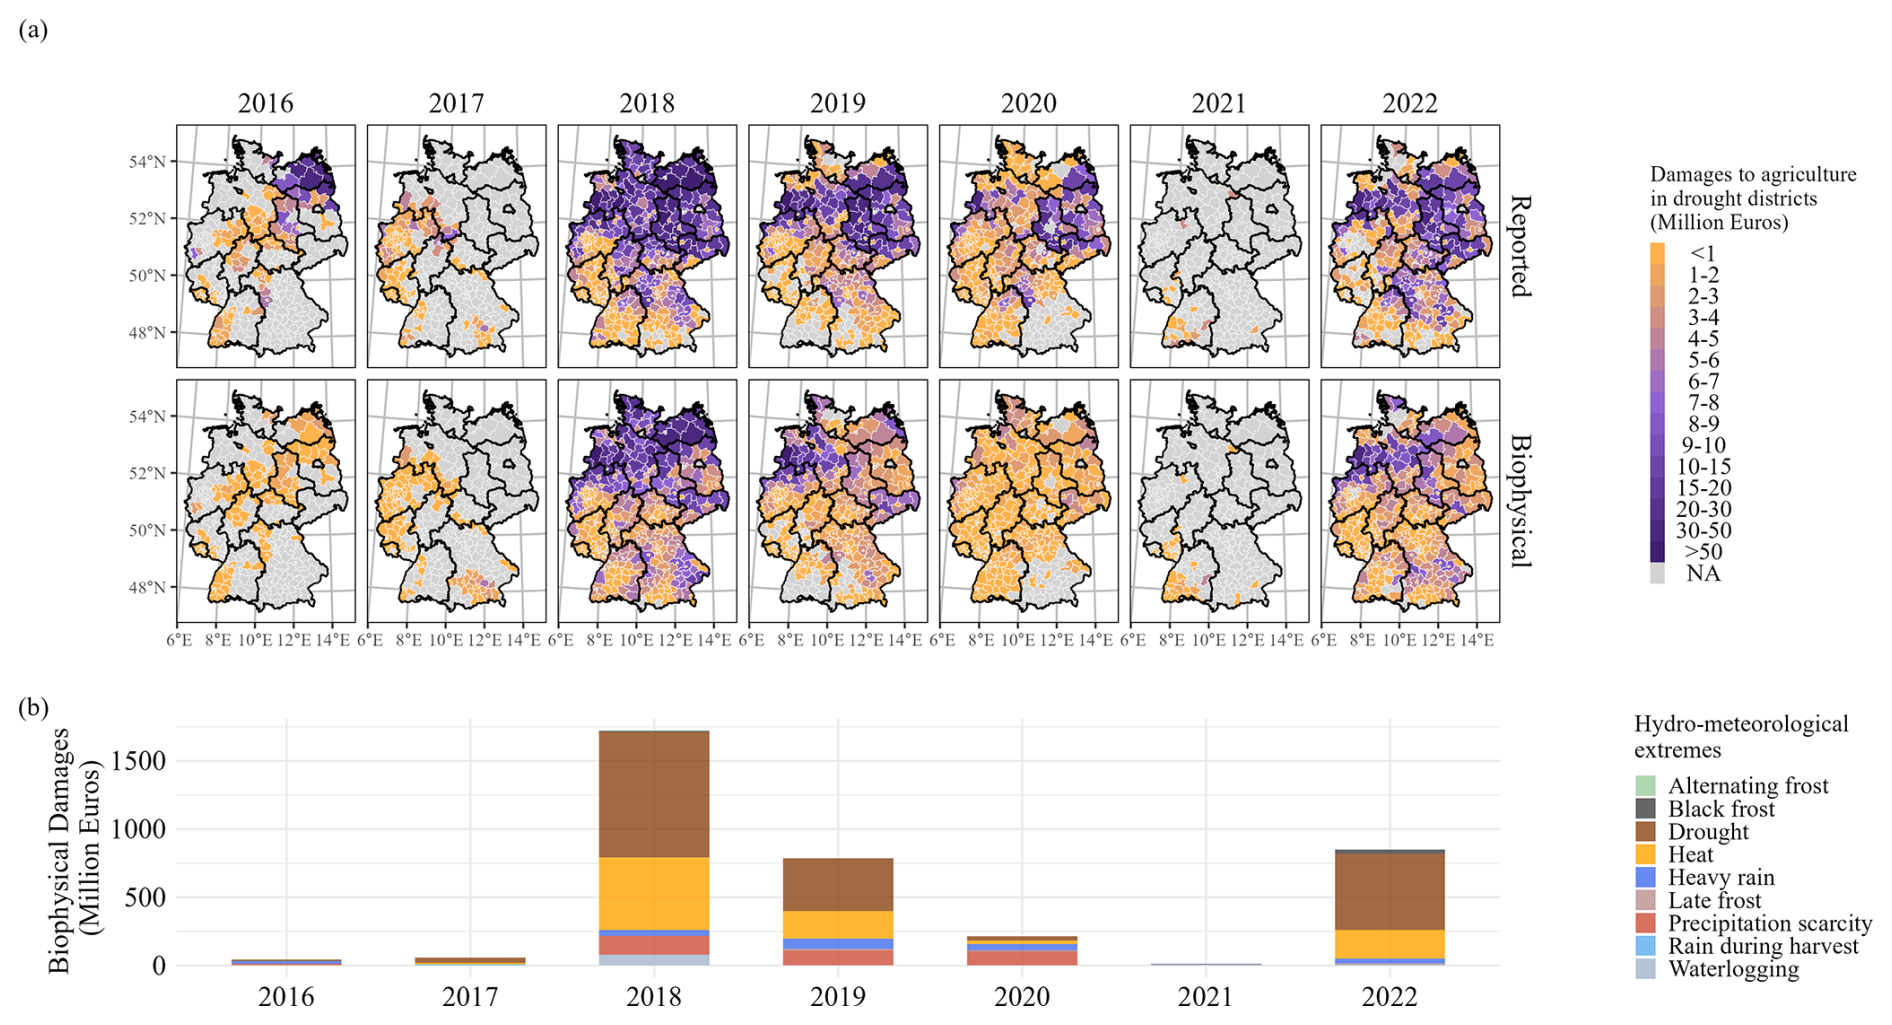
Figure 3Estimated total revenue losses in drought-affected districts of Germany from 2016–2022. (a) Spatial distribution of damages in German district level administrative units based on (bottom row) yields simulated using statistical crop yield model that isolates the effect of hydrometeorological extremes on yields and (top row) reported yields reported in official statistics. The different colours indicate the total revenue losses (million Euros) in the districts. (b) Relative contribution of individual hydrometeorological extremes to total biophysically induced damages by year.
Our analysis reveals that the average annual direct biophysically induced damage across Germany, weighted by the proportion of agricultural area affected by drought (Sect. S2 in the Supplement), is estimated to be EUR 781 million. The highest direct biophysically induced damage occurred in the years 2018 and 2022, with revenue losses estimated at EUR 1.7 billion and EUR 850 million, respectively. In northern Germany, a particularly notable decrease in revenues is observed, likely due to the substantial yield losses in these regions (Fig. S6).
These biophysically induced damages include the effects of all hydrometeorological extremes, as captured by the LASSO yield models. Because the model accounts for multiple extremes, it is not possible to isolate the effects of drought alone from these damage estimates. To address this, we estimate the relative contribution of individual hydrometeorological extreme to total damages using the average feature contributions (in percentage) to predicted yield anomalies, based on the model coefficients. These contributions are then used to add weights to the total simulated damages, allowing us to approximate the share of revenue losses linked to individual extremes such as drought (Fig. 3b).
In years with high damages – 2018, 2019, and 2022 – drought accounts for the largest share of total biophysical damages. Notably, heat and precipitation scarcity also contribute substantially during these years. This co-occurrence suggests that these extremes do not act in isolation and most likely interact with each other. For example, heat and precipitation scarcity may exacerbate the impacts of drought by adding further stress on crops or drought conditions may amplify the negative effects of high temperatures or low rainfall. This underscores the importance of including multiple hydrometeorological extremes in the assessment of damages in drought-affected regions.
However, it is important to note that our approach also leads to positive values for biophysically induced damages in districts and years that are not classified as drought (Fig. S7). This is because the yield model includes multiple extremes, which may still influence the non-drought years used to estimate expected yield and revenue in Eq. (2). While this may introduce bias, it is not large in magnitude. Our approach may therefore slightly overestimate damages in droughts, whereas excluding the effects of other extremes would likely underestimate the total impacts in drought-affected districts and years. The true damages likely fall between these two cases. By including multiple hydrometeorological extremes, our approach captures the biophysical effects related to extremes more comprehensively in drought affected regions. We further demonstrate the robustness of these estimates through sensitivity analyses that test alternative counterfactual periods and drought classification thresholds in Sect. 3.5.
To further understand the relevance of impacts of extreme weather on agriculture during droughts, we compare the estimated direct biophysically induced damages (using simulated yields) with the damages calculated from the yields reported in official statistics (hereafter called reported damages). This comparison helps understand the extent of direct damage specifically caused by extreme hydrometeorological drivers on agriculture during droughts. The reported damages are presented in the top row of panels in Fig. 3a.
According to our analysis, the direct biophysically induced damages account for an average of 45 % of reported revenue losses during droughts between 2016 and 2022. In years with widespread droughts (2018, 2019, and 2022), the direct biophysically induced damages represent an average of 60 % of reported revenue damages (64 %, 52 %, and 65 % respectively). These results demonstrate that the direct biophysically induced damages of extremes constitute a considerable contribution to the overall revenue losses experienced by farmers during the period of widespread droughts in Germany.
3.3 Crop-wise analysis of direct biophysical damages
We present the aggregated crop-wise damages during droughts for 4 years with the highest revenue losses in Germany (2018, 2019, 2020, and 2022) in Fig. 4. Our analysis reveals that silage maize suffered the most notable direct biophysically induced damage due to droughts, followed by potatoes and winter wheat. When comparing these direct biophysically induced damages with reported damages, we note a similar trend for maize and potatoes; however, reported losses for winter wheat are considerably higher than their direct biophysically induced losses. Specifically, the impacts of extreme hydrometeorological drivers on wheat crops are found to be 62 % lower than the reported drought impacts. The situation is somewhat similar for other winter crops like winter barley and rapeseed. These findings indicate that drought-prone summer-grown maize and potatoes incur greater direct biophysically induced damage compared to winter-grown wheat and barley. The direct biophysically induced damages explain up to 97 % (2018) of revenue losses for maize and up to 32 % (2019) for winter wheat. For the year 2020, the direct biophysically induced damage of drought is significantly lower in comparison to the reported damages. This could be attributed to the fact that the dry conditions in 2020 were primarily limited to the spring season (van der Wiel et al., 2023) and, therefore, had limited impact on crop yields (Fig. S5).
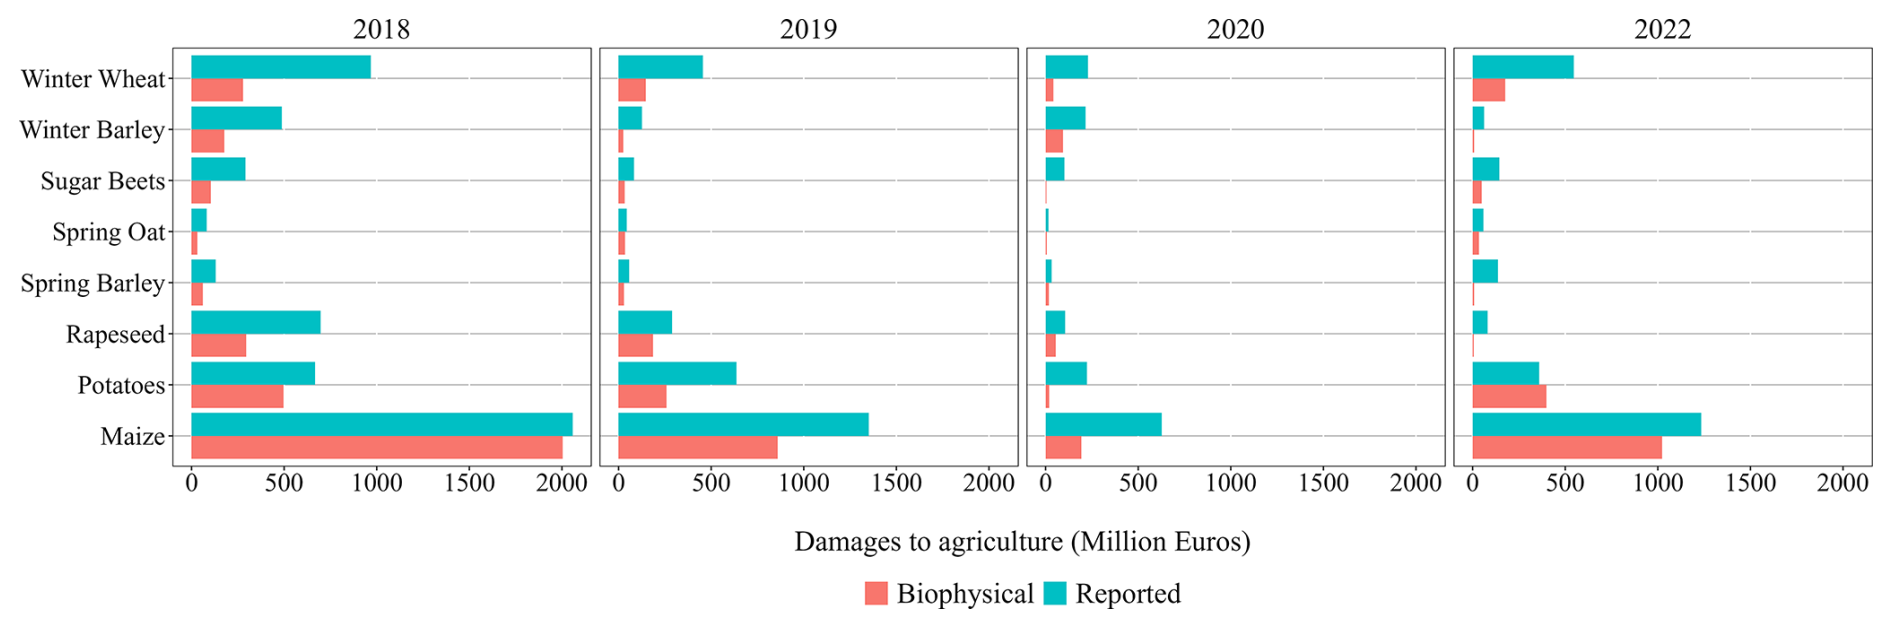
Figure 4Crop-wise estimates of revenue loss in the 4 years with the largest aggregate losses during droughts across Germany based on yields simulated using the statistical yield model that isolates the impact of hydrometeorological extremes on yields (orange bars, labelled “biophysical') and yields reported in regional statistics (blue bars, labelled “reported”).
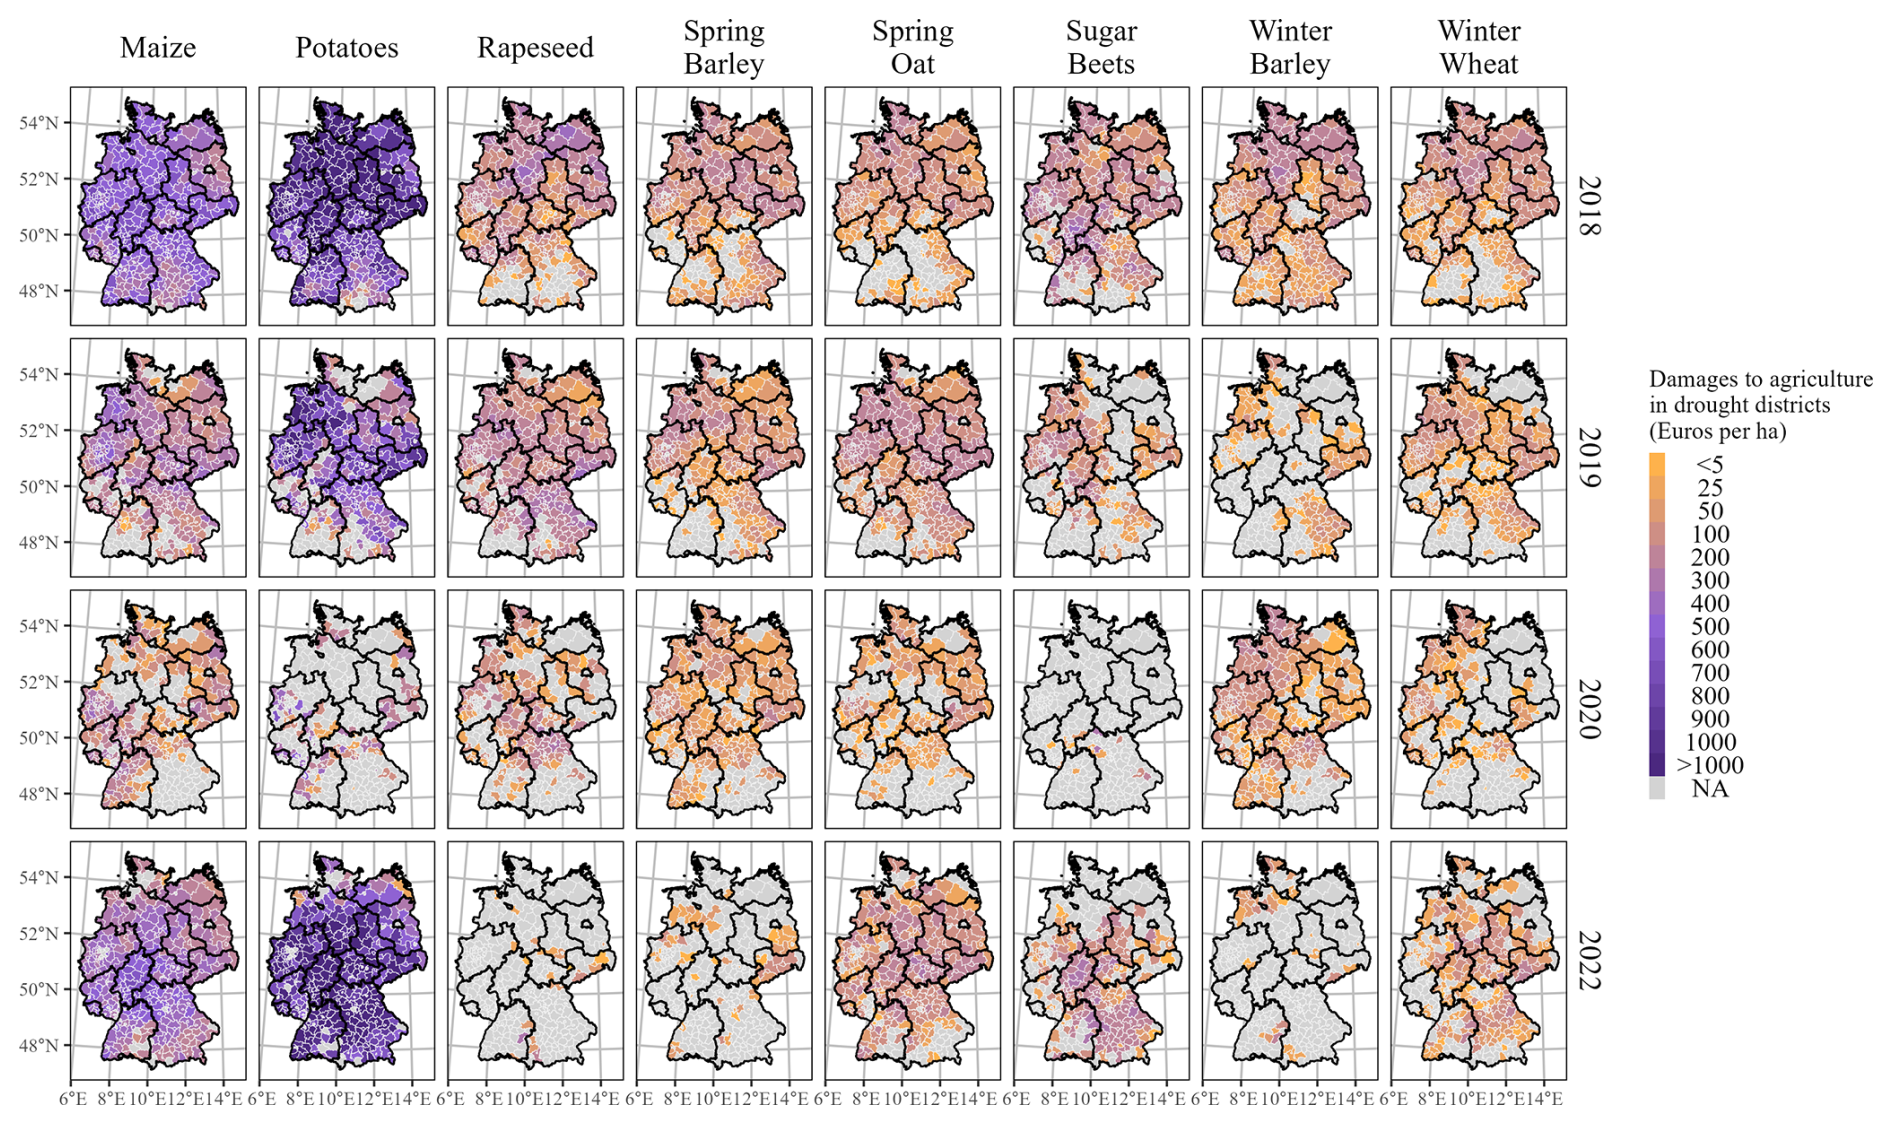
Figure 5Spatial distribution of direct biophysically induced crop-specific damages during droughts in German district level administrative units in the 4 years with the highest revenue losses. The different colours indicate different levels of revenue losses (in EUR per ha) in the districts.
The spatial distribution of direct biophysically induced damages by crop for the 4 years with the highest revenue losses is depicted in Fig. 5. The drought resulted in widespread revenue loss for almost all crops in Germany in 2018, 2019, and 2022 with some exceptions (like rapeseed in 2019 and 2022 and spring barley and spring oats in 2022). Notably, potatoes experienced the highest revenue losses per ha amongst all crops across almost all districts in Germany given their high economic value (high yields per ha and high prices per ha). Drought-prone maize suffered significantly higher losses in the major production regions of the north (Lower Saxony and the surrounding districts) compared to the south (districts in Bavaria and Baden-Württemberg). In contrast, despite being the most widely cultivated crop across Germany, winter wheat showed much lower revenue losses than maize. In 2020, spring barley incurred more widespread crop losses than any other crop. Interestingly, in 2019, 2020, and 2022, only limited losses were observed for sugar beets in Mecklenburg-Vorpommern (northeast Germany) and the bordering districts of Lower Saxony (northwest Germany) and Saxony-Anhalt (east-central Germany), despite a considerable share of area in these regions dedicated to growing this crop.
3.4 Contribution of droughts and various hydrometeorological extremes to direct biophysically induced damages
Next, we examine to which degree droughts and other hydrometeorological extreme events contributed to fluctuations in yields during 2016–2022, in order to understand the relative importance of their impacts on agriculture. This is done by calculating the feature contributions to the predicted yield change using the coefficients estimated with the LASSO models at the optimal penalty parameter λ1SE (Heilemann et al., 2024). Figure 6 displays the average contribution of various hydrometeorological extremes to yield anomalies across Germany, which vary by crop and year. Contrary to intuition, some extremes also have positive effects on yield anomalies, although this is dependent upon the season/month of occurrence, the intensity of extremes, and the specific crop affected (Heilemann et al., 2024; Schmitt et al., 2022). For example, precipitation scarcity in March was found to benefit spring barley, rapeseed, and winter barley if soils still held sufficient winter moisture (Gömann et al., 2015). Similarly, heavy rainfall in July may increase yields for summer crops such as potatoes and silage maize by mitigating drought stress in late summer when soils tend to be dryer (Samaniego et al., 2013).
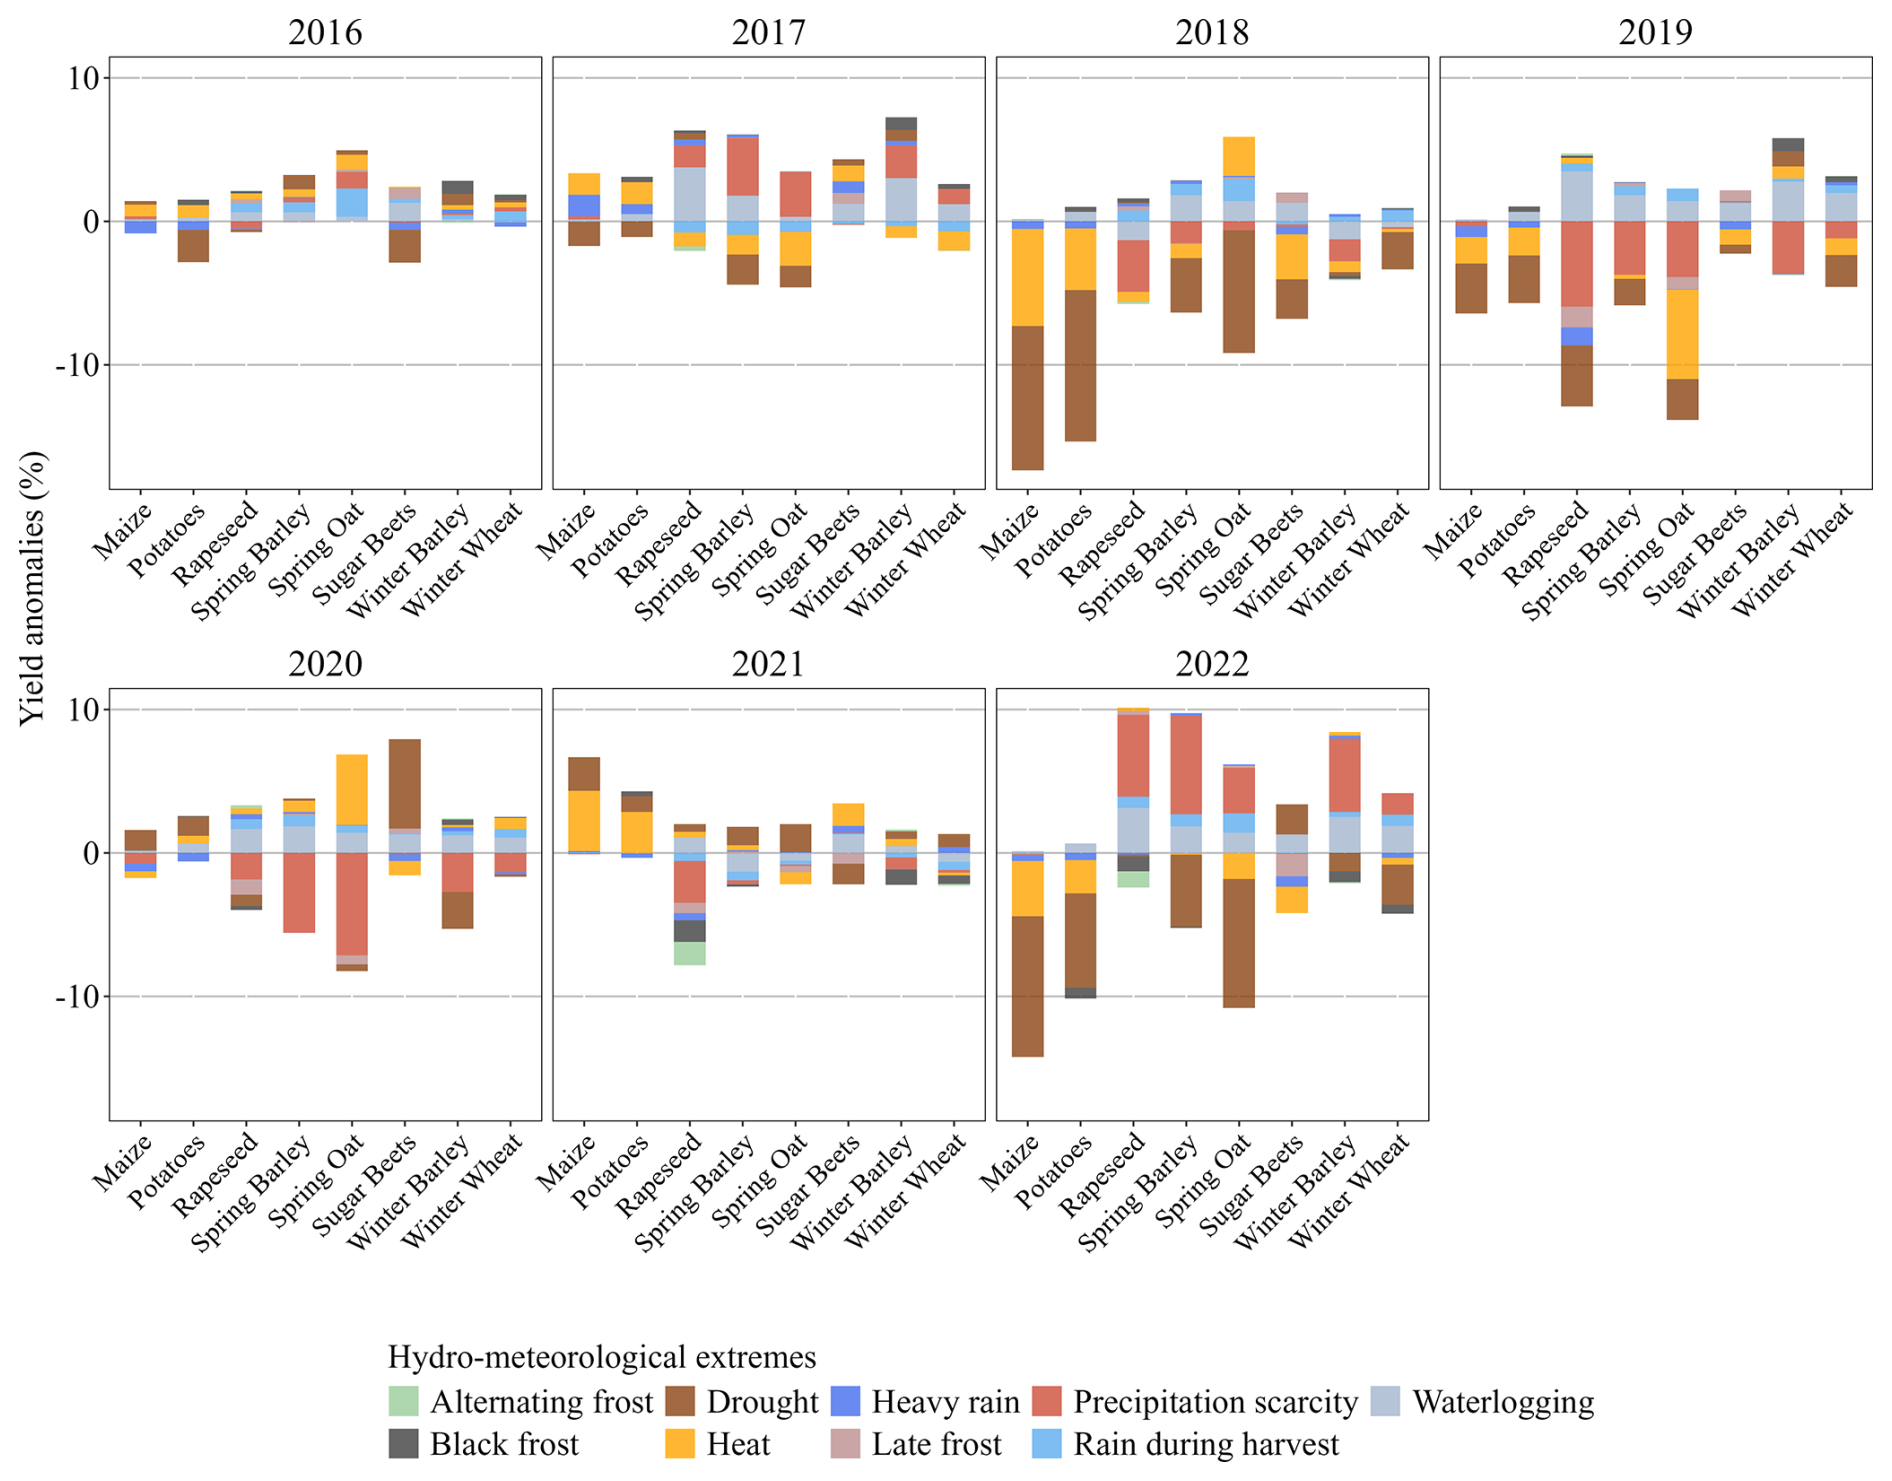
Figure 6Contribution factors of hydrometeorological extremes to yield anomalies across different crops computed from the LASSO regression model.
In 2016, 2017, and 2021, positive yield effects from weather extremes outweighed the negative impacts on crop yields. Despite limited drought-affected areas in Germany (Fig. S4), the negative impacts of droughts are evident in various crops during these years. Except 2020, the years with widespread droughts in Germany (2018, 2019, and 2022) saw droughts and heat contributing to negative yield anomalies for almost all crops. While there are some exceptions (sugar beets in 2018, and spring oats in 2019), droughts generally cause more severe impacts than heat. In 2019, the effect of drought, and heat was coupled with precipitation scarcity during spring (meteorological drought) which led to notable negative yield anomalies in spring oats and, to some extent, in spring barley and winter wheat. In contrast, negative yield anomalies in 2020 were largely driven by meteorological drought during spring instead of soil moisture drought. Meteorological droughts during spring commonly threaten agricultural productivity, as sufficient rainfall in spring is critical for distributing fertilizers throughout the soil (Gömann et al., 2015). Beyond drought and heat, Fig. 6 also highlights the influence of other extreme events on crop yield anomalies in Germany. For example, black frost had notable effects on winter crops in 2021 and 2022 and alternating frost adversely affected rapeseed during these years. In contrast, waterlogging appears to have had a beneficial effect yield anomalies for most crops. These results show the complex interplay of weather extremes and their varying combinations, which determine the extent of yield losses from compounding and overlapping events in different years, as captured by the yield model.
3.5 Sensitivity analysis of estimated direct biophysically induced damages
To evaluate the robustness of the direct biophysically induced damages, two sensitivity analyses were conducted: (1) adjusting the counterfactual period to include 4-year and 6-year averages for estimating expected revenues and (2) modifying the drought classification by testing variations in the area threshold of each district with an SMI < 0.2 per month. Specifically, we tested ±5 % changes in the original 20 % threshold for the categorization of district affected by drought.
In our analysis, we found that the average annual damage estimates ranged from EUR 766 million (under the 6-year counterfactual) to EUR 812 million (under the 4-year counterfactual). Adjusting the drought area threshold led to variations in damage estimates, ranging from EUR 767 million (under a 5 % decrease in the threshold) to EUR 798 million (under a 5 % increase in the threshold). The variation in the length of counterfactual period as well as drought area thresholds modifies the average expected revenue, which serves as the benchmark for damage calculations, thus leading to different damages estimates. Nevertheless, our main results presented in previous sections fall within the range of these variations, underscoring the robustness of the estimates while accounting for potential uncertainties in the counterfactual definition and drought classification area.
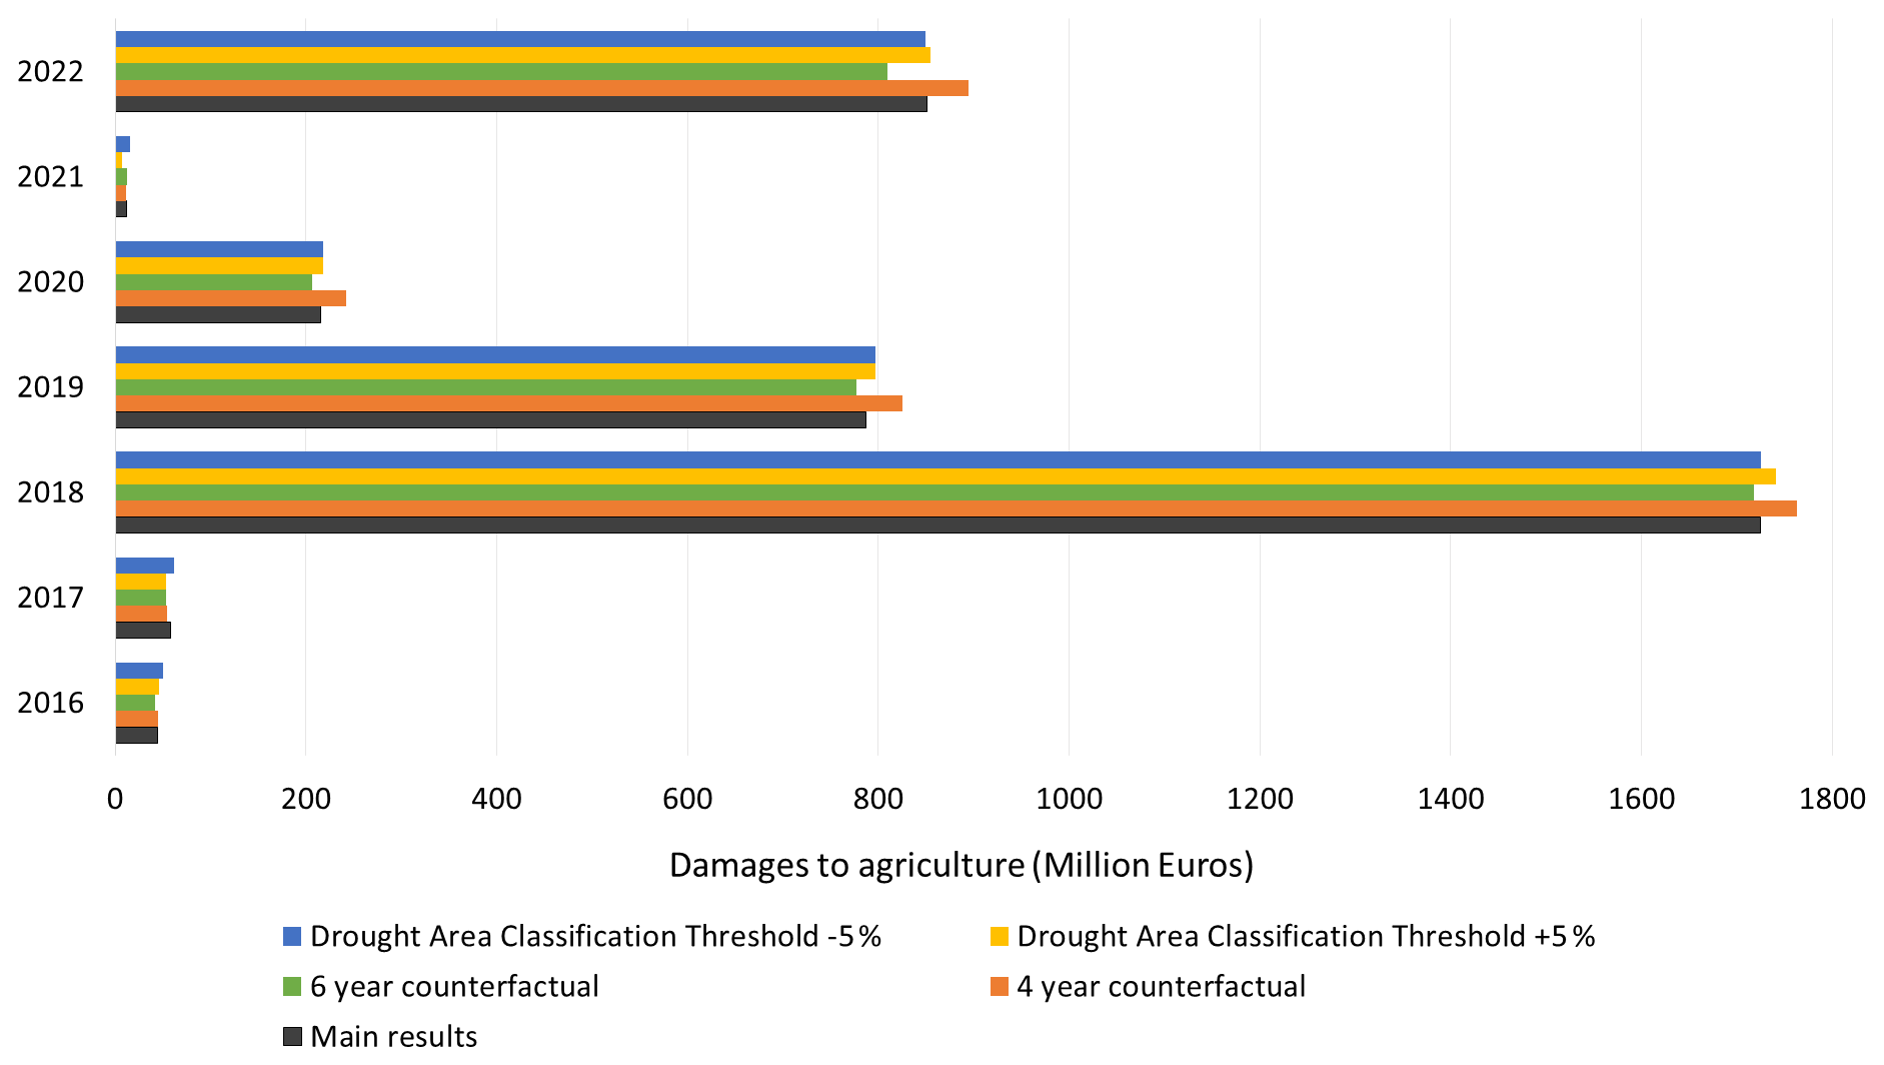
Figure 7Sensitivity analysis of direct biophysically induced damages across different assumptions. The bars represent annual estimated damages under variations in drought area classification thresholds (−5 % and +5 %) and different counterfactual lengths (4 and 6 years), compared to the main results.
Figure 7 presents the annual direct biophysically induced damages for years 2016–2022 across all sensitivity scenarios. The figure shows that the temporal patterns are consistent across scenarios. Consequently, these findings confirm that our damage estimations are robust to reasonable variations in both the baseline period and the drought classification threshold.
For our analysis of direct biophysically induced damages of extremes during droughts, we aggregate the impacts of eight field crops in Germany. The direct biophysically induced damages of droughts were estimated by comparing the revenue generated during the drought year with that of the preceding 5 non-drought years across all districts in Germany. Recent research by Di Marcoberardino and Cucculelli (2024) has highlighted the significant impact of extreme events like droughts and heatwaves on the local economies across Europe, underscoring their localized nature. Providing a spatially distributed assessment is especially important for enhancing risk management as it can help communicate risk to stakeholders and inform targeted policies and support programmes (Brás et al., 2021; Rose, 2004). Our analysis, comparing regional level and national level data for estimating drought damages, reveals that using spatially disaggregated information yields more accurate assessments of revenue losses by crop that may not be reflected in national level assessments. The spatially distributed approach used here can be adapted in other regions to provide more precise assessment of revenue losses and to inform policy planning.
Our findings reveal that the average direct biophysically induced damage driven by extremes during droughts from 2016 to 2022 was EUR 781 million per year (sensitivity range: EUR 766 million–EUR 812 million) across Germany. The years 2018 and 2022 experienced the highest losses, estimated at EUR 1.7 billion and EUR 850 million respectively. Since the yield model includes all hydrometeorological extremes, the non-drought years used to estimate expected revenue may still be influenced by these extremes. This can introduce small biases in the damage estimates. To address this, we use a 5-year average of non-drought years, which helps smooth fluctuations and reduce the influence of other anomalies. The results are robust to alternative definitions of the counterfactual baseline which supports the reliability of our approach.
The spatial distribution of the total damage we found for 2018 is consistent with previous research. The sector-wise analysis of the impacts of droughts for 2018, conducted by de Brito et al. (2020), show that agriculture in eastern Germany had the highest impacts. Conradt et al. (2023) found that the German part of the Elbe River basin in northern Germany suffered the highest yield losses in 2018. During years of widespread droughts, the revenue losses were greater in northern Germany compared to southern Germany. In southern Germany, there is some evidence that drought stress has little impact on crop yields (Lüttger and Feike, 2018). Our analysis of the spatial distribution of annual average yield loss for all crops during droughts across Germany also found similar patterns (Fig. S6). These findings underscore the need for spatially targeted polices and interventions, particularly in northern and eastern Germany, where agriculture is disproportionally affected during droughts.
The comparison of the direct biophysically induced revenue losses with reported losses shows that in years of widespread drought, biophysical factors like hydrometeorological extremes explain 60 % of the revenue losses in Germany. These losses are largely driven by varying combinations of droughts, heat, and precipitation scarcity. While drought and heat dominate the impacts, the yield model also captures the effects of other extremes – such as frost and waterlogging – whose contributions vary by crop and year. This is consistent with emerging research on the joint impacts of extreme events on crop yields, which has identified drought and heat as the most relevant concurrent extremes in Europe, both in the current and future climate (Brás et al., 2021; von Buttlar et al., 2018; Orth et al., 2022; Webber et al., 2018). The contribution of this study lies in quantifying the extent to which economic damages are directly driven by the biophysical yield impacts of these drivers. It helps disentangling the contributions of extreme hydrometeorological drivers of yields vis à vis other drivers of yields to revenue losses, underlining the importance of these factors in shaping agricultural outcomes. While several weather extremes driving damages during droughts have been assessed and included, this assessment cannot be considered comprehensive. Important factors such as the impacts of pests and diseases (Khodaverdi et al., 2016; Meisner and de Boer, 2018), soil water retention capacity (Blanchy et al., 2023), as well as farm management practices (Soares et al., 2023) are not included in these damage estimates.
The crop-wise examination of revenue losses during drought in Germany revealed that summer crops like maize suffered the highest aggregate losses, followed by potatoes. Maize is particularly vulnerable to droughts, as highlighted by previous studies (Schmitt et al., 2022; Webber et al., 2020), and this vulnerability was evident in the high revenue losses we observed in almost all years. According to our analysis, up to 97.4 % (2018) of maize's revenue loss can be explained by the direct biophysical impacts of extremes. These results are consistent with findings of Reinermann et al. (2019) who analysed drought impacts using satellite-based vegetation indices. Interestingly, potatoes, which are typically considered a high-value cash crop grown under irrigation, suffered the highest losses in Lower Saxony, a state with extensive irrigation infrastructure. This could be because the potato yield losses during droughts are mostly due to increased temperatures, rather than a reduction in precipitation which could be mitigated through irrigation only up to a certain degree (Egerer et al., 2023).
In comparison to our findings, García-León et al. (2021) estimated that agricultural losses due to droughts in Italy ranged from EUR 0.55 billion and EUR 1.75 billion per year, while Howitt et al. (2015) reported crop revenue losses in California, United States of approximately USD 902 million to USD 940 million per year. Our result that maize was the most effected crop during recent droughts in Germany is consistent with the findings of Brás et al. (2021), who found maize as experiencing the highest production losses among cereals across Europe due to droughts and heatwaves between 1964 and 2015. Maize's vulnerability to drought is not limited to Europe. In the United States, substantial yield variability in maize has been linked to drought and heat stress (Zipper et al., 2016). Similarly, in China, maize yield losses have been shown to increase with the severity of drought, contributing to significant reductions in maize production across the country (Liu et al., 2022). These comparisons highlight the dual challenge of mitigating economic losses across diverse cropping systems and addressing the specific vulnerabilities of drought-sensitive crops like maize. They underscore the importance of globally coordinated efforts to enhance agricultural resilience in the face of increasing weather extremes.
While our estimates provide robust insights into the biophysical damages of droughts and associated extremes in drought affected districts, there are some limitations to consider. First, our analysis is focused on short-term impacts damages and does not include adaptation costs or indirect impacts beyond the immediate consequences of biophysically induced yield losses. Second, the estimation of revenue losses might be underestimated due to the inherent limitations of the statistical yield model in simulating extreme crop yields. This underestimation partially arises from the use of pre-defined thresholds for extreme events. Since the study relied on an established statistical model, we did not assess the sensitivity of these thresholds, which should be explored in future research to improve robustness. Last, this yield model is based on anomalies relative to district level means which limits our ability to fully control for the biophysical impacts of weather extremes in the counterfactual. While a non-extreme weather events counterfactual could have provided valuable insights into the interplay between droughts and other extremes, this was not feasible within the current modelling framework.
This study presents an empirical illustration to facilitate the understanding and estimation of economic damages of hydrometeorological extremes associated with droughts in agriculture. We measured spatially distributed, direct biophysically induced damages on farmers' revenue at the district level in Germany during droughts. Our estimates bridge gaps related to consistent economic damage assessment that can be used for the assessment of the costs of climate change (Frame et al., 2020). Farmers' decision-making in the context of drought would also benefit from such analysis, especially if these assessments are extended and linked with drought monitoring and early warning systems (Muller et al., 2024). Additionally, we show the utility of spatially distributed data for accurate crop-specific damage assessments.
Our analysis revealed an average annual revenue loss due to biophysical impacts of extremes of EUR 781 million across Germany during drought, accounting for 45 % of reported revenue losses. In years with widespread droughts (2018, 2019, and 2022), the direct biophysically induced damages represent an average of 60 % of reported revenue loss, highlighting the dominant role of hydrometeorological extremes in driving the revenue losses experienced by farmers. By isolating the impacts of hydrometeorlogical extremes from other drivers of revenue losses in droughts, the findings emphasize the critical need to adapt to such extremes not only in the present-day climate but also in the future, where such extremes are expected to become more frequent and intense.
Our results underscore the role of hydrometeorlogical extremes in revenue losses during droughts in Germany. Specifically, for drought-prone, summer-grown crops like maize, the hydrometeorological extremes, such as reduced soil moisture, can explain up to 97 % of the reported losses in 2018. In contrast, for the winter-grown crops like wheat, the contribution of hydrometeorological extremes is less pronounced, explaining up to 32 % of the reported losses in 2019. These results can guide more targeted adaptation during droughts, focusing on specific crop types. For example, insuring summer-grown crops against simultaneous or successive extremes, such as drought and heat, or enhancing breeding effectiveness.
While this study provides detailed understanding of biophysical damages during droughts, future research could expand the analysis to include adaptation costs, indirect impacts, and a more refined counterfactual approach to better capture the interplay between weather extremes and droughts. Nonetheless, our analysis provides valuable insights into the far-reaching economic consequences of droughts in the agricultural sector. These insights should be of significant interest to decision-makers, guiding the development of effective strategies for mitigating the effects of droughts and implementing measures to build resilience in affected regions. Future work should focus on routinely estimating these losses within operational drought monitoring systems such as the German Drought Monitor (Zink et al., 2016), and forecasting frameworks like Hydroclimatic Subseasonal-to-Seasonal forecasting system (Hydroclimatic Forecasting System, 2025). By linking hydrometeorological variables with projected economic damages, such integration would enhance early warning capabilities, improve economic preparedness against increasing weather extremes, and support more proactive adaptation strategies.
Table A1Descriptive statistics for simulated crop yields, including annual mean, minimum, and maximum values for each crop during 2016–2022.
The statistical yield model code is available at https://git.ufz.de/heileman/lasso-crop-yield-projection (Heilemann, 2025; Heilemann et al., 2024). Additional scripts used to process data and reproduce the results of this study are available from the corresponding author upon request. Annual district level crop yield and acreage data are provided by the Regional Database of the Federal Statistical Office of Germany: https://www.regionalstatistik.de/genesis/online?operation=table&code=41141-02-02-4#astructure (Statistisches Bundesamt (Destatis), 2020) and https://www.regionalstatistik.de/genesis//online?operation=table&code=41241-01-03-4&bypass=true&levelindex=1&levelid=1677842497003#abreadcrumb (Statistisches Bundesamt (Destatis), 2022b). Supplementary crop acreage data for other years were derived from remote-sensing-based crop maps (Blickensdörfer et al., 2022), available at https://doi.org/10.5281/zenodo.5153047 (Blickensdörfer et al., 2021). Monthly soil moisture index (SMI) data from 1951 to 2022 are available for download from UFZ: https://www.ufz.de/index.php?de=37937 (Helmholtz Centre for Environmental Research, 2025).
The supplement related to this article is available online at https://doi.org/10.5194/nhess-25-2115-2025-supplement.
MN, BK, EG, and CK conceptualized the study; MN, JH, and CK developed the methodology; MN and JH curated the data and developed the software; MN conducted the formal analysis, visualization and prepared the original draft of the manuscript. JH, LS, BK, EG, and CK reviewed and edited the manuscript. BK, EG, and CK supervised the research.
The contact author has declared that none of the authors has any competing interests.
Publisher's note: Copernicus Publications remains neutral with regard to jurisdictional claims made in the text, published maps, institutional affiliations, or any other geographical representation in this paper. While Copernicus Publications makes every effort to include appropriate place names, the final responsibility lies with the authors.
This article is part of the special issue “Drought, society, and ecosystems (NHESS/BG/GC/HESS inter-journal SI)”. It is not associated with a conference.
We would like to thank Edward Digman for proofreading this article. The authors acknowledge the assistance of ChatGPT in enhancing the language quality of an earlier draft. Following the use of this tool, the authors have carefully reviewed and edited the content as necessary, and they assume full accountability for the publication's content.
The article processing charges for this open-access publication were covered by the Helmholtz Centre for Environmental Research – UFZ.
This paper was edited by Giulia Vico and reviewed by Thomas Slijper and one anonymous referee.
AghaKouchak, A., Cheng, L., Mazdiyasni, O., and Farahmand, A.: Global warming and changes in risk of concurrent climate extremes: Insights from the 2014 California drought, Geophys. Res. Lett., 41, 8847–8852, https://doi.org/10.1002/2014GL062308, 2014.
Ahmad, M. M., Yaseen, M., and Saqib, S. E.: Climate change impacts of drought on the livelihood of dryland smallholders: Implications of adaptation challenges, Int. J. Disast. Risk Re., 80, 103210, https://doi.org/10.1016/j.ijdrr.2022.103210, 2022.
Appau, S., Awaworyi Churchill, S., Smyth, R., and Trinh, T.-A.: The long-term impact of the Vietnam War on agricultural productivity, World Dev., 146, 105613, https://doi.org/10.1016/j.worlddev.2021.105613, 2021.
Bachmair, S., Svensson, C., Hannaford, J., Barker, L. J., and Stahl, K.: A quantitative analysis to objectively appraise drought indicators and model drought impacts, Hydrol. Earth Syst. Sci., 20, 2589–2609, https://doi.org/10.5194/hess-20-2589-2016, 2016.
Badolo, F. and Somlanare, R. K.: Rainfall shocks, food prices vulnerability and food security: Evidence for Sub-Saharan African Countries, in: Proceedings of the African Economic Conference, 30 October–2 November 2012, Kigali, Rwanda, https://www.afdb.org/sites/default/files/documents/publications/aec_2012_-_rainfall_shocks_food_prices_vulnerability_and_food_security-evidence_for_sub-saharan_african_countries.pdf (lass access: 11 December 2024), 2012.
Belleza, G. A. C., Bierkens, M. F. P., and Vliet, M. T. H. van: Sectoral water use responses to droughts and heatwaves: analyses from local to global scales for 1990–2019, Environ. Res. Lett., 18, 104008, https://doi.org/10.1088/1748-9326/acf82e, 2023.
Ben-Ari, T., Boé, J., Ciais, P., Lecerf, R., Van der Velde, M., and Makowski, D.: Causes and implications of the unforeseen 2016 extreme yield loss in the breadbasket of France, Nat. Commun., 9, 1627, https://doi.org/10.1038/s41467-018-04087-x, 2018.
Berhanu, M. and Wolde, A.: Review on Climate Change Impacts and its Adaptation strategies on Food Security in Sub-Saharan Africa, Agricultural Social Economic Journal, 19, 145–154, https://doi.org/10.21776/ub.agrise.2019.019.3.3, 2019.
Biazin, B. and Sterk, G.: Drought vulnerability drives land-use and land cover changes in the Rift Valley dry lands of Ethiopia, Agr. Ecosyst. Environ., 164, 100–113, https://doi.org/10.1016/j.agee.2012.09.012, 2013.
Blanchy, G., Bragato, G., Di Bene, C., Jarvis, N., Larsbo, M., Meurer, K., and Garré, S.: Soil and crop management practices and the water regulation functions of soils: a qualitative synthesis of meta-analyses relevant to European agriculture, SOIL, 9, 1–20, https://doi.org/10.5194/soil-9-1-2023, 2023.
Blickensdörfer, L., Schwieder, M., Pflugmacher, D., Nendel, C., Erasmi, S., and Hostert, P.: National-scale crop type maps for Germany from combined time series of Sentinel-1, Sentinel-2 and Landsat 8 data (2017, 2018 and 2019), Zenodo [data set], https://doi.org/10.5281/zenodo.5153047, 2021.
Blickensdörfer, L., Schwieder, M., Pflugmacher, D., Nendel, C., Erasmi, S., and Hostert, P.: Mapping of crop types and crop sequences with combined time series of Sentinel-1, Sentinel-2 and Landsat 8 data for Germany, Remote Sens. Environ., 269, 112831, https://doi.org/10.1016/j.rse.2021.112831, 2022.
BMEL: Daten und Fakten Land-, Forst- und Ernährungswirtschaft mit Fischerei und Wein- und Gartenbau, Bundesministerium für Ernährung und Landwirtschaft (BMEL), https://www.bmel.de/SharedDocs/Downloads/DE/Broschueren/daten-fakten-2022.html (last access: 29 July 2024), 2022.
Brás, T. A., Seixas, J., Carvalhais, N., and Jägermeyr, J.: Severity of drought and heatwave crop losses tripled over the last five decades in Europe, Environ. Res. Lett., 16, 065012, https://doi.org/10.1088/1748-9326/abf004, 2021.
Conradt, T., Engelhardt, H., Menz, C., Vicente-Serrano, S. M., Farizo, B. A., Peña-Angulo, D., Domínguez-Castro, F., Eklundh, L., Jin, H., Boincean, B., Murphy, C., and López-Moreno, J. I.: Cross-sectoral impacts of the 2018–2019 Central European drought and climate resilience in the German part of the Elbe River basin, Reg. Environ. Change, 23, 32, https://doi.org/10.1007/s10113-023-02032-3, 2023.
COPA-COGECA: Assessment of the impact of the heat wave and drought of the summer 2003 on agriculture and forestry Technical Report, Committee of Agricultural Organisations in the European Union, Brussels, http://docs.gip-ecofor.org/libre/COPA_COGECA_2004.pdf (last access: 13 April 2024), 2003.
Daramola, M. T. and Xu, M.: Recent changes in global dryland temperature and precipitation, Int. J. Climatol., 42, 1267–1282, https://doi.org/10.1002/joc.7301, 2022.
de Brito, M. M., Kuhlicke, C., and Marx, A.: Near-real-time drought impact assessment: a text mining approach on the 2018/19 drought in Germany, Environ. Res. Lett., 15, 1040a9, https://doi.org/10.1088/1748-9326/aba4ca, 2020.
Deng, S., Zhao, D., Chen, Z., Liu, L., Zhu, Y., Wang, K., Gao, X., Wu, H., and Zheng, D.: Global Distribution and Projected Variations of Compound Drought-Extreme Precipitation Events, Earths Future, 12, e2024EF004809, https://doi.org/10.1029/2024EF004809, 2024.
Deutscher Wetterdienst: Climate data center, Deutscher Wetterdienst, https://www.dwd.de/EN/climate_environment/cdc/cdc_node_en.html, last access: 6 July 2024.
Diaz, D. and Moore, F.: Quantifying the economic risks of climate change, Nat. Clim. Change, 7, 774–782, https://doi.org/10.1038/nclimate3411, 2017.
Di Marcoberardino, D. and Cucculelli, M.: “Natural” disasters and regional governance: Evidence from European NUTS-3 regions, Pap. Reg. Sci., 103, 100003, https://doi.org/10.1016/j.pirs.2024.100003, 2024.
Ding, J., Huang, Z., Zhu, M., Li, C., Zhu, X., and Guo, W.: Does cyclic water stress damage wheat yield more than a single stress?, PLoS One, 13, e0195535, https://doi.org/10.1371/journal.pone.0195535, 2018.
Ding, Y., Hayes, M. J., and Widhalm, M.: Measuring economic impacts of drought: a review and discussion, Disaster Prev. Manag., 20, 434–446, https://doi.org/10.1108/09653561111161752, 2011.
Eckhardt, D., Leiras, A., and Thomé, A. M. T.: Systematic literature review of methodologies for assessing the costs of disasters, Int. J. Disast. Risk Re., 33, 398–416, https://doi.org/10.1016/j.ijdrr.2018.10.010, 2019.
Egerer, S., Puente, A. F., Peichl, M., Rakovec, O., Samaniego, L., and Schneider, U. A.: Limited potential of irrigation to prevent potato yield losses in Germany under climate change, Agr. Syst., 207, 103633, https://doi.org/10.1016/j.agsy.2023.103633, 2023.
EUROSTAT: Agriculture-Database. Selling prices of crop products (absolute prices) – annual price (from 2000 onwards), EUROSTAT, https://ec.europa.eu/eurostat/databrowser/view/apri_ap_crpouta/default/table?lang=en (last access: 3 July 2023), 2022.
FAO: The impact of disasters on agriculture and food security 2023, FAO, Rome, https://doi.org/10.4060/cc7900en, 2023.
FNR: https://pflanzen.fnr.de/energiepflanzen/pflanzen/mais, last access: 7 March 2023.
Foreign Policy Research Institute: The Impact of Climate Change on Africa's Economies, Foreign Policy Research Institute, https://www.fpri.org/article/2021/10/the-impact-of-climate-change-on-africas-economies/, last access: 11 December 2024.
Frame, D. J., Rosier, S. M., Noy, I., Harrington, L. J., Carey-Smith, T., Sparrow, S. N., Stone, D. A., and Dean, S. M.: Climate change attribution and the economic costs of extreme weather events: a study on damages from extreme rainfall and drought, Climatic Change, 162, 781–797, https://doi.org/10.1007/s10584-020-02729-y, 2020.
Garbero, A. and Muttarak, R.: Impacts of the 2010 Droughts and Floods on Community Welfare in Rural Thailand: Differential Effects of Village Educational Attainment, Ecol. Soc., 18, 27, https://doi.org/10.5751/ES-05871-180427, 2013.
García-León, D., Standardi, G., and Staccione, A.: An integrated approach for the estimation of agricultural drought costs, Land Use Policy, 100, 104923, https://doi.org/10.1016/j.landusepol.2020.104923, 2021.
Gömann, H., Bender, A., Bolte, A., Dirksmeyer, W., Englert, H., Feil, J.-H., Frühauf, C., Hauschild, M., Krengel, S., Lilienthal, H., Löpmeier, F.-J., Müller, J., Mußhof, O., Natkhin, M., Offermann, F., Seidel, P., Schmidt, M., Seintsch, B., Steidl, J., Strohm, K., and Zimmer, Y.: Agrarrelevante Extremwetterlagen und Möglichkeiten von Risikomanagementsystemen: Studie im Auftrag des Bundesministeriums für Ernährung und Landwirtschaft (BMEL), Johann Heinrich von Thünen-Institut, DE, https://doi.org/10.22004/ag.econ.206716, 2015.
Gray, M., Hunter, B., and Edwards, B.: A Sunburnt Country: The Economic and Financial Impact of Drought on Rural and Regional Families in Australia in an Era of Climate Change, Australian Journal of Labour Economics, 12, 108–131, 2009.
Haqiqi, I., Grogan, D. S., Hertel, T. W., and Schlenker, W.: Quantifying the impacts of compound extremes on agriculture, Hydrol. Earth Syst. Sci., 25, 551–564, https://doi.org/10.5194/hess-25-551-2021, 2021.
Heilemann, J.: LASSO-crop-yield-projection, GitLab [code], https://git.ufz.de/heileman/lasso-crop-yield-projection, last access: 27 June 2025.
Heilemann, J., Klassert, C., Samaniego, L., Thober, S., Marx, A., Boeing, F., Klauer, B., and Gawel, E.: Projecting Impacts of Extreme Weather Events on Crop Yields Using Lasso Regression, Weather and Climate Extremes, 46, 100738, https://doi.org/10.1016/j.wace.2024.100738, 2024.
Helmholtz Centre for Environmental Research: Dürremonitor Deutschland, Helmholtz-Zentrum für Umweltforschung (UFZ) [data set], https://www.ufz.de/index.php?de=37937, last access: 26 February 2025.
Henchiri, M., Liu, Q., Essifi, B., Javed, T., Zhang, S., Bai, Y., and Zhang, J.: Spatio-Temporal Patterns of Drought and Impact on Vegetation in North and West Africa Based on Multi-Satellite Data, Remote Sens., 12, 3869, https://doi.org/10.3390/rs12233869, 2020.
Howitt, R., MacEwan, D., Medellín-Azuara, J., Lund, J., and Sumner, D.: Economic Analysis of the 2015 Drought For California Agriculture, Center for Watershed Sciences, University of California – Davis, Davis, CA, https://watershed.ucdavis.edu/sites/g/files/dgvnsk8531/files/products/2021-05/Economic_Analysis_2015_California_Drought__Main_Report.pdf (last access: 3 November 2024), 2015.
Hydroclimatic Forecasting System: https://www.ufz.de/index.php?en=47304, last access: 26 February 2025.
Jaeger, W. K., Plantinga, A. J., Chang, H., Dello, K., Grant, G., Hulse, D., McDonnell, J. J., Lancaster, S., Moradkhani, H., Morzillo, A. T., Mote, P., Nolin, A., Santelmann, M., and Wu, J.: Toward a formal definition of water scarcity in natural-human systems, Water Resour. Res., 49, 4506–4517, https://doi.org/10.1002/wrcr.20249, 2013.
James, G., Witten, D., Hastie, T., and Tibshirani, R.: An Introduction to Statistical Learning: with Applications in R, Springer US, New York, NY, https://doi.org/10.1007/978-1-0716-1418-1, 2013.
Khodaverdi, H., Fowles, T., Bick, E., and Nansen, C.: Does Drought Increase the Risk of Insects Developing Behavioral Resistance to Systemic Insecticides?, J. Econ. Entomol., 109, 2027–2031, https://doi.org/10.1093/jee/tow188, 2016.
Kuratorium für Technik und Bauwesen in der Landwirtschaft (KTBL): SDB – Standarddeckungsbeiträge, Kuratorium für Technik und Bauwesen in der Landwirtschaft (KTBL), https://daten.ktbl.de/sdb/welcome.do (last access: 6 March 2023), 2023.
Kurukulasuriya, P., Mendelsohn, R., Hassan, R., Benhin, J., Deressa, T., Diop, M., Eid, H. M., Fosu, K. Y., Gbetibouo, G., Jain, S., Mahamadou, A., Mano, R., Kabubo-Mariara, J., El-Marsafawy, S., Molua, E., Ouda, S., Ouedraogo, M., Séne, I., Maddison, D., Seo, S. N., and Dinar, A.: Will African Agriculture Survive Climate Change?, World Bank Econ. Rev., 20, 367–388, https://doi.org/10.1093/wber/lhl004, 2006.
Lesk, C., Rowhani, P., and Ramankutty, N.: Influence of extreme weather disasters on global crop production, Nature, 529, 84–87, https://doi.org/10.1038/nature16467, 2016.
Liu, S., Xiao, L., Sun, J., Yang, P., Yang, X., and Wu, W.: Probability of maize yield failure increases with drought occurrence but partially depends on local conditions in China, Eur. J. Agron., 139, 126552, https://doi.org/10.1016/j.eja.2022.126552, 2022.
Liu, X., Zhu, X., Pan, Y., Li, S., Liu, Y., and Ma, Y.: Agricultural drought monitoring: Progress, challenges, and prospects, J. Geogr. Sci., 26, 750–767, https://doi.org/10.1007/s11442-016-1297-9, 2016.
Lobell, D. B., Schlenker, W., and Costa-Roberts, J.: Climate Trends and Global Crop Production Since 1980, Science, 333, 616–620, https://doi.org/10.1126/science.1204531, 2011.
Lüttger, A. B. and Feike, T.: Development of heat and drought related extreme weather events and their effect on winter wheat yields in Germany, Theor. Appl. Climatol., 132, 15–29, https://doi.org/10.1007/s00704-017-2076-y, 2018.
McNamara, I., Flörke, M., Uschan, T., Baez-Villanueva, O. M., and Herrmann, F.: Estimates of irrigation requirements throughout Germany under varying climatic conditions, Agr. Water Manage., 291, 108641, https://doi.org/10.1016/j.agwat.2023.108641, 2024.
Meisner, A. and de Boer, W.: Strategies to Maintain Natural Biocontrol of Soil-Borne Crop Diseases During Severe Drought and Rainfall Events, Front. Microbiol., 9, 2279, https://doi.org/10.3389/fmicb.2018.02279, 2018.
Meyer, V., Becker, N., Markantonis, V., Schwarze, R., van den Bergh, J. C. J. M., Bouwer, L. M., Bubeck, P., Ciavola, P., Genovese, E., Green, C., Hallegatte, S., Kreibich, H., Lequeux, Q., Logar, I., Papyrakis, E., Pfurtscheller, C., Poussin, J., Przyluski, V., Thieken, A. H., and Viavattene, C.: Review article: Assessing the costs of natural hazards – state of the art and knowledge gaps, Nat. Hazards Earth Syst. Sci., 13, 1351–1373, https://doi.org/10.5194/nhess-13-1351-2013, 2013.
Muller, L. C. F. E., Schaafsma, M., Mazzoleni, M., and Van Loon, A. F.: Responding to climate services in the context of drought: A systematic review, Climate Services, 35, 100493, https://doi.org/10.1016/j.cliser.2024.100493, 2024.
Musolino, D. A., Massarutto, A., and de Carli, A.: Does drought always cause economic losses in agriculture? An empirical investigation on the distributive effects of drought events in some areas of Southern Europe, Sci. Total Environ., 633, 1560–1570, https://doi.org/10.1016/j.scitotenv.2018.02.308, 2018.
Nagpal, M., Klassert, C., Heilemann, J., Klauer, B., and Gawel, E.: Measuring Crop Acreage Adaptation to Changing Yields and Prices: An Empirical Analysis for Agriculture in Germany, SSRN (Elsevier) [preprint], https://doi.org/10.2139/ssrn.4728661, 16 February 2024.
Newman, R. and Noy, I.: The global costs of extreme weather that are attributable to climate change, Nat. Commun., 14, 6103, https://doi.org/10.1038/s41467-023-41888-1, 2023.
Orth, R., O, S., Zscheischler, J., Mahecha, M. D., and Reichstein, M.: Contrasting biophysical and societal impacts of hydro-meteorological extremes, Environ. Res. Lett., 17, 014044, https://doi.org/10.1088/1748-9326/ac4139, 2022.
Peichl, M., Thober, S., Meyer, V., and Samaniego, L.: The effect of soil moisture anomalies on maize yield in Germany, Nat. Hazards Earth Syst. Sci., 18, 889–906, https://doi.org/10.5194/nhess-18-889-2018, 2018.
Peichl, M., Thober, S., Samaniego, L., Hansjürgens, B., and Marx, A.: Machine-learning methods to assess the effects of a non-linear damage spectrum taking into account soil moisture on winter wheat yields in Germany, Hydrol. Earth Syst. Sci., 25, 6523–6545, https://doi.org/10.5194/hess-25-6523-2021, 2021.
Prasanna, R. P. I. R.: Economic costs of drought and farmers' adaptation strategies: evidence from Sri Lanka, Sri Lanka Journal of Economic Research, 5, 61–79, https://doi.org/10.4038/sljer.v5i2.49, 2018.
Rakovec, O., Samaniego, L., Hari, V., Markonis, Y., Moravec, V., Thober, S., Hanel, M., and Kumar, R.: The 2018–2020 Multi-Year Drought Sets a New Benchmark in Europe, Earths Future, 10, e2021EF002394, https://doi.org/10.1029/2021EF002394, 2022.
Ray, D. K., Gerber, J. S., MacDonald, G. K., and West, P. C.: Climate variation explains a third of global crop yield variability, Nat. Commun., 6, 5989, https://doi.org/10.1038/ncomms6989, 2015.
Reinermann, S., Gessner, U., Asam, S., Kuenzer, C., and Dech, S.: The Effect of Droughts on Vegetation Condition in Germany: An Analysis Based on Two Decades of Satellite Earth Observation Time Series and Crop Yield Statistics, Remote Sens., 11, 1783, https://doi.org/10.3390/rs11151783, 2019.
Rose, A.: Economic Principles, Issues, and Research Priorities in Hazard Loss Estimation, in: Modeling Spatial and Economic Impacts of Disasters, edited by: Okuyama, Y. and Chang, S. E., Springer Berlin Heidelberg, Berlin, Heidelberg, 13–36, https://doi.org/10.1007/978-3-540-24787-6_2, 2004.
Samaniego, L., Kumar, R., and Attinger, S.: Multiscale parameter regionalization of a grid-based hydrologic model at the mesoscale, Water Resour. Res., 46, 47–68, https://doi.org/10.1029/2008WR007327, 2010.
Samaniego, L., Kumar, R., and Zink, M.: Implications of Parameter Uncertainty on Soil Moisture Drought Analysis in Germany, J. Hydrometeorol., 14, 47–68, https://doi.org/10.1175/JHM-D-12-075.1, 2013.
Samaniego, L., Thober, S., Kumar, R., Wanders, N., Rakovec, O., Pan, M., Zink, M., Sheffield, J., Wood, E. F., and Marx, A.: Anthropogenic warming exacerbates European soil moisture droughts, Nat. Clim. Change, 8, 421–426, https://doi.org/10.1038/s41558-018-0138-5, 2018.
Savary, S., Willocquet, L., Pethybridge, S. J., Esker, P., McRoberts, N., and Nelson, A.: The global burden of pathogens and pests on major food crops, Nat. Ecol. Evol., 3, 430–439, https://doi.org/10.1038/s41559-018-0793-y, 2019.
Schmitt, J., Offermann, F., Söder, M., Frühauf, C., and Finger, R.: Extreme weather events cause significant crop yield losses at the farm level in German agriculture, Food Policy, 112, 102359, https://doi.org/10.1016/j.foodpol.2022.102359, 2022.
Shukla, P. R., Skeg, J., Buendia, E. C., Masson-Delmotte, V., Pörtner, H.-O., Roberts, D. C., Zhai, P., Slade, R., Connors, S., van Diemen, S., Ferrat, M., Haughey, S., Luz, Neogi, S., Pathak, M., Petzold, J., Portugal Pereira, J., Vyas, P., Huntley, H., Kissick, K., Belkacemi, M., and Malley, J.: Climate Change and Land: an IPCC special report on climate change, desertification, land degradation, sustainable land management, food security, and greenhouse gas fluxes in terrestrial ecosystems, IPCC, Cambridge University Press, https://doi.org/10.1017/9781009157988, 2019.
Smith, S. M. and Edwards, E. C.: Water storage and agricultural resilience to drought: historical evidence of the capacity and institutional limits in the United States, Environ. Res. Lett., 16, 124020, https://doi.org/10.1088/1748-9326/ac358a, 2021.
Soares, P. R., Harrison, M. T., Kalantari, Z., Zhao, W., and Ferreira, C. S. S.: Drought effects on soil organic carbon under different agricultural systems, Environ. Res. Commun., 5, 112001, https://doi.org/10.1088/2515-7620/ad04f5, 2023.
Statistisches Bundesamt (Destatis): Regionaldatenbank Deutschland, 41141-02-02-4: Anbau auf dem Ackerland in landwirtschaftlichen Betrieben nach Fruchtarten, 2010–2020, Statistisches Bundesamt (Destatis) [data set], https://www.regionalstatistik.de/genesis/online?operation=table&code=41141-02-02-4#astructure (last access: 3 March 2023), 2020.
Statistisches Bundesamt (Destatis): Fachserie 3, R 3.1.2, Bodennutzung der Betriebe (Landwirtschaftlich genutzte Flächen), Statistisches Bundesamt (Destatis), https://www.destatis.de/DE/Service/Bibliothek/_publikationen-fachserienliste-3.html#631572 (last access: 29 July 2024), 2022a.
Statistisches Bundesamt (Destatis): Regionaldatenbank Deutschland. 41241-01-03-4: Erträge ausgewählter Feldfrüchte – Jahressumme, Statistisches Bundesamt (Destatis) [data set], https://www.regionalstatistik.de/genesis//online?operation=table&code=41241-01-03-4&bypass=true&levelindex=1&levelid=1677842497003#abreadcrumb (last access: 3 March 2023), 1999–2022, 2022b.
Suarez-Gutierrez, L., Müller, W. A., and Marotzke, J.: Extreme heat and drought typical of an end-of-century climate could occur over Europe soon and repeatedly, Commun. Earth Environ., 4, 1–11, https://doi.org/10.1038/s43247-023-01075-y, 2023.
Tibshirani, R.: Regression Shrinkage and Selection via the Lasso, J. Roy. Stat. Soc. B, 58, 267–288, 1996.
Trenczek, J., Lühr, O., Eiserbeck, L., Sandhövel, M., and Ibens, D.: Schäden der Dürre-und Hitzeextreme 2018 und 2019-eine ex-post-Analyse, Prognos AG, Berlin, https://www.prognos.com/sites/default/files/2022-07/Prognos_KlimawandelfolgenDeutschland_Detailuntersuchung%20Hitzesommer%2018_19_AP2_3a_.pdf (last access: 3 August 2024), 2022.
van der Wiel, K., Batelaan, T. J., and Wanders, N.: Large increases of multi-year droughts in north-western Europe in a warmer climate, Clim Dyn, 60, 1781–1800, https://doi.org/10.1007/s00382-022-06373-3, 2023.
van Duinen, R., Filatova, T., Geurts, P., and van der Veen, A.: Coping with drought risk: empirical analysis of farmers' drought adaptation in the south-west Netherlands, Reg. Environ. Change, 15, 1081–1093, https://doi.org/10.1007/s10113-014-0692-y, 2015.
Vogel, E., Donat, M. G., Alexander, L. V., Meinshausen, M., Ray, D. K., Karoly, D., Meinshausen, N., and Frieler, K.: The effects of climate extremes on global agricultural yields, Environ. Res. Lett., 14, 054010, https://doi.org/10.1088/1748-9326/ab154b, 2019.
Vogel, J., Rivoire, P., Deidda, C., Rahimi, L., Sauter, C. A., Tschumi, E., van der Wiel, K., Zhang, T., and Zscheischler, J.: Identifying meteorological drivers of extreme impacts: an application to simulated crop yields, Earth Syst. Dynam., 12, 151–172, https://doi.org/10.5194/esd-12-151-2021, 2021.
von Buttlar, J., Zscheischler, J., Rammig, A., Sippel, S., Reichstein, M., Knohl, A., Jung, M., Menzer, O., Arain, M. A., Buchmann, N., Cescatti, A., Gianelle, D., Kiely, G., Law, B. E., Magliulo, V., Margolis, H., McCaughey, H., Merbold, L., Migliavacca, M., Montagnani, L., Oechel, W., Pavelka, M., Peichl, M., Rambal, S., Raschi, A., Scott, R. L., Vaccari, F. P., van Gorsel, E., Varlagin, A., Wohlfahrt, G., and Mahecha, M. D.: Impacts of droughts and extreme-temperature events on gross primary production and ecosystem respiration: a systematic assessment across ecosystems and climate zones, Biogeosciences, 15, 1293–1318, https://doi.org/10.5194/bg-15-1293-2018, 2018.
Webber, H., Ewert, F., Olesen, J. E., Müller, C., Fronzek, S., Ruane, A. C., Bourgault, M., Martre, P., Ababaei, B., Bindi, M., Ferrise, R., Finger, R., Fodor, N., Gabaldón-Leal, C., Gaiser, T., Jabloun, M., Kersebaum, K.-C., Lizaso, J. I., Lorite, I. J., Manceau, L., Moriondo, M., Nendel, C., Rodríguez, A., Ruiz-Ramos, M., Semenov, M. A., Siebert, S., Stella, T., Stratonovitch, P., Trombi, G., and Wallach, D.: Diverging importance of drought stress for maize and winter wheat in Europe, Nat. Commun., 9, 4249, https://doi.org/10.1038/s41467-018-06525-2, 2018.
Webber, H., Lischeid, G., Sommer, M., Finger, R., Nendel, C., Gaiser, T., and Ewert, F.: No perfect storm for crop yield failure in Germany, Environ. Res. Lett., 15, 104012, https://doi.org/10.1088/1748-9326/aba2a4, 2020.
Wens, M. L. K., Mwangi, M. N., van Loon, A. F., and Aerts, J. C. J. H.: Complexities of drought adaptive behaviour: Linking theory to data on smallholder farmer adaptation decisions, Int. J. Disast. Risk Re., 63, 102435, https://doi.org/10.1016/j.ijdrr.2021.102435, 2021.
Wilhite, D. A.: Drought as a Natural Hazard: Concepts and Definitions, in: Drought: A Global Assessment, 3–18, Routledge, ISBN 9780415168335, 2000.
Wilhite, D. A. and Glantz, M. H.: Understanding: the Drought Phenomenon: The Role of Definitions, Water Int., 10, 111–120, https://doi.org/10.1080/02508068508686328, 1985.
Wimmer, S. and Sauer, J.: Profitability Development and Resource Reallocation: The Case of Sugar Beet Farming in Germany, J. Agr. Econ., 71, 816–837, https://doi.org/10.1111/1477-9552.12373, 2020.
Zampieri, M., Ceglar, A., Dentener, F., and Toreti, A.: Wheat yield loss attributable to heat waves, drought and water excess at the global, national and subnational scales, Environ. Res. Lett., 12, 064008, https://doi.org/10.1088/1748-9326/aa723b, 2017.
Zink, M., Samaniego, L., Kumar, R., Thober, S., Mai, J., Schäfer, D., and Marx, A.: The German drought monitor, Environ. Res. Lett., 11, 074002, https://doi.org/10.1088/1748-9326/11/7/074002, 2016.
Ziolkowska, J. R.: Socio-Economic Implications of Drought in the Agricultural Sector and the State Economy, Economies, 4, 19, https://doi.org/10.3390/economies4030019, 2016.
Zipper, S. C., Qiu, J., and Kucharik, C. J.: Drought effects on US maize and soybean production: spatiotemporal patterns and historical changes, Environ. Res. Lett., 11, 094021, https://doi.org/10.1088/1748-9326/11/9/094021, 2016.
Zscheischler, J., Westra, S., Hurk, B. J. J. M. V. D., Seneviratne, S. I., Ward, P. J., Pitman, A., Aghakouchak, A., Bresch, D. N., Leonard, M., Wahl, T., and Zhang, X.: Future climate risk from compound events, Nat. Clim. Change, 8, 469–477, https://doi.org/10.1038/s41558-018-0156-3, 2018.
Zscheischler, J., Martius, O., Westra, S., Bevacqua, E., Raymond, C., Horton, R. M., van den Hurk, B., AghaKouchak, A., Jézéquel, A., Mahecha, M. D., Maraun, D., Ramos, A. M., Ridder, N. N., Thiery, W., and Vignotto, E.: A typology of compound weather and climate events, Nat. Rev. Earth Environ., 1, 333–347, https://doi.org/10.1038/s43017-020-0060-z, 2020.