the Creative Commons Attribution 4.0 License.
the Creative Commons Attribution 4.0 License.
 | 25 Apr 2025
Assessing the impact of early warning and evacuation on human losses during the 2021 Ahr Valley flood in Germany using agent-based modelling
André Felipe Rocha Silva
Julian Cardoso Eleutério
Heiko Apel
Between 12 and 19 July 2021, a quasi-stationary atmospheric low-pressure system named Bernd caused intense precipitation on already-saturated soil, resulting in severe flooding in Germany, Belgium, and the Netherlands. The Ahr Valley in Rhineland-Palatinate was particularly affected, with approximately 42 000 residents impacted, around 8800 buildings damaged, and 134 fatalities recorded. The flood in the Ahr Valley significantly exceeded the scenarios outlined in official hazard maps, leaving decision-makers and the public unprepared. Substantial issues occurred with the content, issuance, and dissemination of warnings, thereby reducing the effectiveness of emergency response. We evaluate how human losses in the Ahr Valley might have differed under alternative flood early warning and evacuation (FEWE) scenarios, using the agent-based model LifeSim. To run the model for the 2021 Ahr flood, we utilised a reconstructed modelled time series of water depth and flow velocities and estimated the FEWE timeline based on reports and a post-event survey of the affected population. For the reconstructed FEWE timeline, we identified the first flood warning approximately 13 h before the peak of the flood upstream of the simulated domain. Only 17.5 % of those affected received a warning with evacuation instructions, with most becoming aware of evacuation necessities only after flooding had already reached them. Consequently, only about 34 % of the population evacuated their homes or were rescued. Regarding the life loss estimation, the median of the reconstructed flood overestimates the actual life loss by 28.8 %. Simulations of alternative FEWE scenarios indicate a potential life loss reduction of up to 80 % with timely warning dissemination and increased population evacuation. However, scenarios in which the FEWE prompted the population to evacuate at the moment of the imminent hazard at their buildings result in higher human losses. In these cases, vertical evacuation within buildings is more effective. Using a life loss agent-based model, such as LifeSim, can support decisions on FEWEs and improve emergency response planning.
- Article
(5465 KB) - Full-text XML
- Companion paper
-
Supplement
(814 KB) - BibTeX
- EndNote


Floods represent the most prevalent natural disaster globally (CRED and UNISDR, 2018), and under a climate change scenario, their frequency, particularly of rare events, has increased (Wasko et al., 2021). In Germany, four flood events have been notable in terms of loss of life during the last 40 years. In August 2002, a record-breaking daily rainfall of 314 mm in 24 h caused flash floods in the Bavarian and Saxon middle hills of Germany. This extreme weather event resulted in the activation of dam spillways, as well as the overtopping and breaching of embankments in many areas, leading to the deaths of 21 people (Kienzler et al., 2015). Between 31 May and 3 June 2013, precipitation of 346 mm fell on already-saturated soil, affecting 12 of Germany's 16 federal states. Approximately 1400 km of river networks experienced 100-year flood discharges and some dike breaches, resulting in 14 fatalities (Thieken et al., 2022). From 26 May to 9 June 2016, a series of flash floods, including peaks of 100 mm in 2 h in Braunsbach, a small village in Baden-Württemberg, caused significant damage to small and steep catchments, resulting in 11 fatalities (Thieken et al., 2022). In July 2021, the most devastating flood event occurred in terms of fatalities. In total, fewer people died in the 40 years between 1980 and 2020, with 159 victims (Papagiannaki et al., 2022), than in this single 2021 flood event, with 190 victims in Germany (Thieken et al., 2023a, b).
The extraordinary severe event in July 2021 was caused by a quasi-stationary atmospheric low-pressure system named Bernd. This system brought intense precipitation on already-saturated soil, resulting in severe flooding in the western German states, mainly along the Ahr, located in the Rhineland-Palatinate state. Hydrologically, the 2021 flood was extreme in terms of the rapid onset of flooding, high flow velocities, and high water depths (Kron et al., 2022). Along the Ahr, about 42 000 inhabitants were affected by the flood, about 8800 buildings were damaged (DKKV, 2022), and 134 fatalities occurred (Szönyi et al., 2022).
The flood extent significantly exceeded what was outlined in official hazard maps, leaving decision-makers and the population unprepared. This lack of preparedness resulted in numerous issues with the warning content and its issuance and dissemination, compromising the efficiency of residents taking protective measures (Szönyi et al., 2022). A survey conducted after the event revealed that 29 % of Ahr Valley residents reported not receiving any warning, and among those who were warned, over 40 % did not know what to do to protect themselves and their houses. Consequently, 84 % of residents were surprised by the magnitude of the flood (Thieken et al., 2023b).
One of the most critical factors contributing to fatalities during floods is the effectiveness of flood early warning and evacuation (FEWE) systems (Petrucci, 2022; Yari et al., 2020). An optimal warning system should be robust, capable of early hazard identification, and equipped with efficient communication channels to promptly inform the population at risk (Kreibich et al., 2021; Kuller et al., 2021). Additionally, an investment in enhancing the population's knowledge of appropriate actions and behaviours in response to flood risks is essential (Aerts et al., 2018; Berghäuser et al., 2023). This comprehensive approach could significantly mitigate the impact of floods and reduce the likelihood of fatalities.
One method to assess the effectiveness of these FEWE systems is through life loss estimation models (Chen et al., 2023; Ge et al., 2022). In estimating fatalities from flood events, some methodologies incorporate behavioural assessments and macroeconomic indicators to evaluate the impacts of floods (Jongejan et al., 2005). However, assigning a monetary value to the loss of life is complex due to the intangible nature of this type of damage (Merz et al., 2010). Fatalities can also be indirectly related to flooding, occurring outside the inundated areas through incidents such as traffic accidents during evacuations or deaths due to post-flood stress. Despite these indirect impacts, most fatalities result from direct causes (Jonkman and Vrijling, 2008). Since predicting such behaviour is challenging, loss of life is generally classified solely as a direct type of damage. Therefore, risk assessment addresses this metric directly and quantitatively without assigning a monetary value (Jonkman et al., 2003).
Life loss estimation models can be categorised as either empirical or dynamic. The empirical approach integrates some characteristics of the flood event, such as depth, velocity, water rise rate, warning time, and other factors related to the exposure and vulnerability of the population, with a fatality rate. Various empirical models exist for different types of events, including coastal and riverine floods (Boyd et al., 2010; Brazdova and Riha, 2014; Jonkman et al., 2008, 2009; Penning-Rowsell et al., 2005; Yazdani et al., 2023; Zhai et al., 2006) and dam breaks (Brown and Graham, 1988; DeKay and McClelland, 1993; Ge et al., 2021; Graham, 1999; Jiao et al., 2022; Mahmoud et al., 2020; Peng and Zhang, 2012; USBR, 2015). Dynamic models, often called agent-based models (ABMs), use a time-varying quantification of event characteristics correlated with flood exposure criteria and thresholds. These models provide a more detailed simulation of events by modelling individual behaviour and the causes of fatalities (Anshuka et al., 2022; Zhuo and Han, 2020). This detailed simulation is beneficial for evaluating FEWE systems, offering advantages over empirical models (Di Mauro et al., 2012; Shirvani and Kesserwani, 2021).
Numerous agent-based models related to flood risk management have been developed (Anshuka et al., 2022). However, most of these models are designed for specific sites and types of floods and have been applied only in limited research contexts. As a result, only two models have been widely used in flood risk assessment (Lumbroso et al., 2023). The Life Safety Model (LSM) (Johnstone et al., 2005) was utilised to assess the impacts of FEWE in the 1953 Canvey Island flood (Lumbroso and Davison, 2018) and in the 2019 Brumadinho tailing dam break event (Lumbroso et al., 2021). The LifeSim model (Aboelata et al., 2003) was employed to create a generalised life loss estimation model for dam breaks in Switzerland (Kalinina et al., 2021), for traffic management in Morocco (El Bilali et al., 2021), and in a proposal for a probabilistic life loss estimation for densely populated areas in Morocco (El Bilali et al., 2022). Additionally, it was used to assess warning and evacuation procedures and their impacts in Brazil for the 2007 São Francisco tailing dam failure (Silva and Eleutério, 2023a) and for a hypothetical case in a high-density area (Silva and Eleutério, 2023b), as well as in order to evaluate the effects of numerous non-structural dam break floods in China (Wang et al., 2024).
The objective of this study is to assess the exceptionally high number of fatalities in the Ahr Valley during the flash flood of 2021. With the help of an ABM, in particular, the effects of FEWE are analysed. Scenarios are used to develop recommendations for improved emergency communication and response. Given the extensive variety of flood types (Needham et al., 2016) and their widespread application in diverse contexts (e.g. flash floods, dike and dam breaches), the agent-based model LifeSim was chosen for this study.
Section 2 outlines the data and methods, providing an overview of the agent-based model LifeSim and detailing its principal inputs and operational considerations. A reconstruction of the human consequences of the 2021 Ahr Valley flood is examined, including flood modelling, exposure analysis, and flood early warning and evacuation procedures. The section concludes with an exploration of alternative warning and evacuation scenarios, as well as general parameterisation and considerations regarding the use of LifeSim. Section 3 presents and analyses the results of the LifeSim model for human consequence reconstruction and evaluates the impacts of the alternative FEWE scenarios. Section 4 highlights the main limitations of the simulations. Finally, Sect. 5 summarises the key findings of this study and suggests areas for further research.
The concept of assessing the impact of flood early warning and evacuation (FEWE) on loss of life consists of two main parts (Fig. 1). First, the reconstruction of the 2021 Ahr Valley flood is undertaken to compare the life loss estimation by the agent-based model LifeSim with the actual values. This involves updating an existing hydraulic model, creating a structure inventory with information on buildings and the population, and reconstructing the warning and evacuation procedures. Second, the impact of alternative scenarios of FEWE is assessed. Once the life loss model is adjusted to the actual case, two approaches are used to assess the effectiveness of FEWE: one focuses on the efficiency of communication and response using theoretical models of warning dissemination and the mobilisation time taken for the population to begin evacuation, and the other focuses on the timing for issuing the first flood warning considering forecasting capabilities.
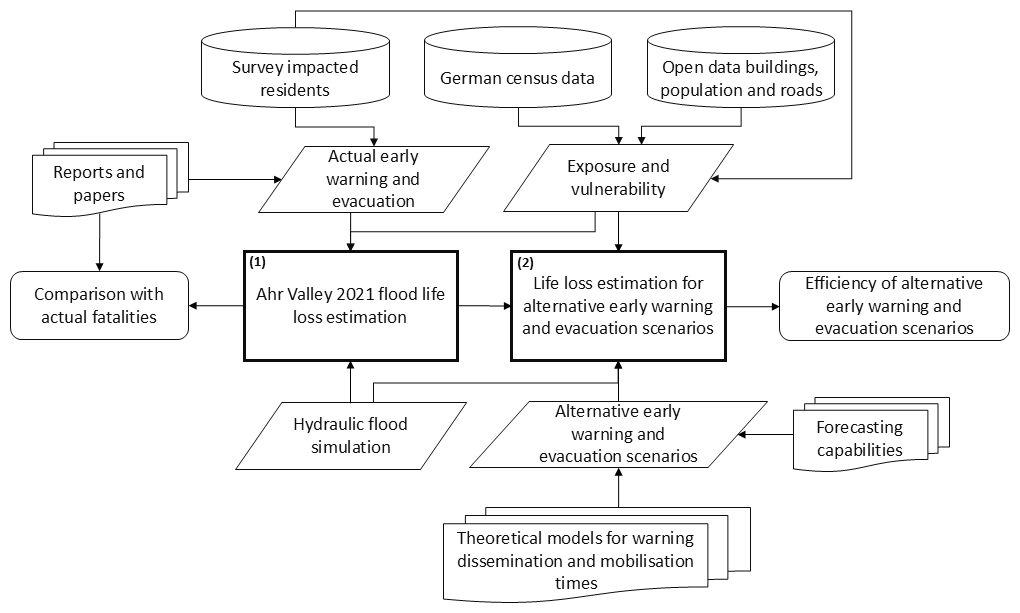
Figure 1Overview of concept showing methodological components and data relationships for assessing the impacts of early warning and evacuation procedures on life loss estimation in relation to the 2021 Ahr Valley flood.
2.1 LifeSim agent-based model used to estimate direct flood fatalities
LifeSim was initially proposed by Aboelata et al. (2003) and has since been integrated into a graphical interface by the United States Army Corps of Engineers. This model simulates various outcomes, with a focus on direct life loss resulting from exposure to flood hazards, where the magnitude of life loss is influenced by hydrodynamic parameters and the success of the population in locating adequate shelter during flood events. The model is structured with a modular system in which the agent-based approach allows for the description and simulation of individual and group behaviours. These modules integrate hydrodynamic spatial- and time-dependent data and population characteristic data based on geographic information system layers (USACE, 2020).
The LifeSim model comprises four main modules. The first is the flood routine module, which encompasses a network representation of flood characteristics across the area over time. The shelter loss module, which assesses the exposure of the population that does not evacuate structures during events, considers submersion and structural damage criteria. The warning and evacuation module models the distribution and dynamics of the at-risk population following the warning issuance. Finally, the loss of life module employs probability distributions of fatality rates derived from historical flood event data to estimate potential fatalities (USACE, 2020). A short description of each module related to life loss estimation is provided in the following paragraphs based on LifeSim version 2.0 (USACE, 2021).
The flood routine module contains hydraulic data about the flood event, encompassing temporal developments of water depth and flow velocities.
The submersion criteria of the shelter loss module are based on thresholds defined by a triangular distribution, determined by the water depth on the highest floor of a building. For the general population, these thresholds correspond to the ceiling level, while for individuals with mobility issues, they also pertain to the floor level. When access to the building's roof is feasible, the threshold is related to the roof floor. If these thresholds are exceeded, the population is designated into the high-hazard zone, where a specific fatality rate is applied according to the life loss module. Mobility in the LifeSim routine is quantified using percentages from the 2017 United States census, indicating the proportion of individuals under 65 years with mobility difficulty and those over 65 years with similar issues. The stability criteria depend on the building's construction type, with most criteria based on the consideration of Clausen and Clark (1990). If this stability threshold is reached, the building is considered to be collapsing, and all individuals inside are allocated to high-hazard zones, as in the submersion consideration.
The process of warning and evacuation involves several milestones separated by time delays, as illustrated in Fig. 2. The timeline begins with the identification of an imminent hazard. The first delay occurs between the identification of the hazard and the decision to issue an evacuation order. Following the issuance of the warning, a second delay represents the time required to disseminate this warning. Once the population receives the warning, a third delay occurs before initiating protective action. These three delays have been identified and substantiated by research, supported by various studies and equations (Sorensen and Mileti, 2015a, b, c). LifeSim incorporates standard curves with an explicit range of uncertainty for these three delays. The uncertainty is inherently present in the delay curves for warning issuance, as probability distribution functions represent them. Cumulative probability functions represent the warning diffusion and mobilisation curves, accounting for the inherent uncertainty. After the evacuation is initiated, the LifeSim routine utilises several criteria and considerations to model the evacuation process and determine whether an agent successfully reaches a safe location.
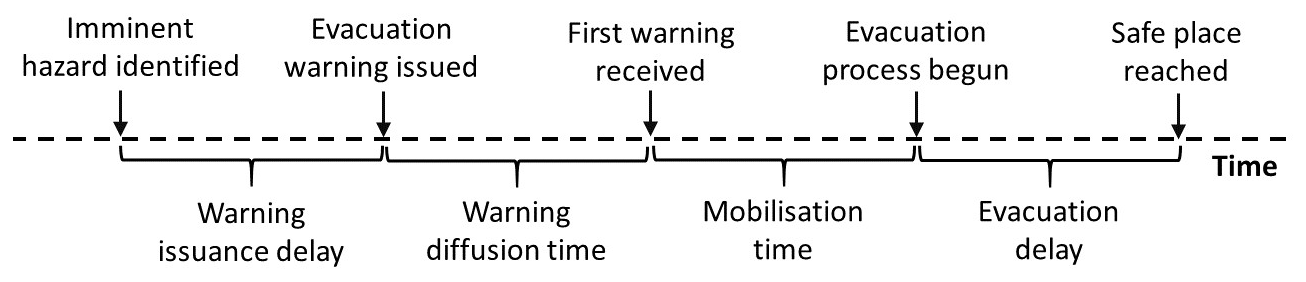
Figure 2The milestones and respective times between them that represent the warning and evacuation timeline in the LifeSim model.
The simulation of the evacuation dynamics employs Greenshield's traffic flow model (Mahmassani et al., 2009) to represent the effects of traffic density and road capacity on vehicle speed. This model has been adapted to introduce a minimum speed threshold determined by stop-and-go conditions. The Dijkstra (1959) optimisation algorithm defines the fastest path between the building and the pre-defined meeting point for route determination during evacuation. The quantity of vehicles is determined by their occupancy rate, as specified by the user. The LifeSim model incorporates certain behavioural decisions of the population, such as the non-evacuation depth, which represents the decision to leave or remain in a structure based on a specific water depth, and the willingness to enter flooded roads, indicating a driver's choice to traverse them. Pedestrian evacuation is also considered, based on a pre-defined fraction of the population evacuating by vehicle and on foot. A constant velocity is used for pedestrian evacuation and does not account for traffic density. If vehicles or individuals are overtaken by flooding during evacuation, stability criteria based on Smith et al. (2017) and Shand et al. (2011) are applied, respectively. If these criteria are exceeded, the affected population is allocated to the high-hazard flood zone, and if not, they are allocated to the low-hazard zone.
In the loss of life module, the high-hazard zone refers to situations where the likelihood of dying largely depends on chance, such as being swept downstream, trapped in a collapsing building, or submerged underwater. In contrast, the low-hazard zone denotes areas where risks exist but are minimal. Each zone is characterised by a probabilistic distribution based on historical cases. In each iteration of the probabilistic routine, a fatality rate is sampled for each specific agent from the hazard functions. Then, a random uniform number between 0 and 1 is assigned to each individual. If this uniform number exceeds the sampled fatality rate, the individual survives.
The computation of risk is performed using Monte Carlo simulations, allowing various model parameters to be introduced with uncertainty, examining random and epistemic uncertainties. Consequently, the model's output concerning the quantification of loss of life is probabilistic (USACE, 2020).
Despite the challenges in acquiring data to understand event dynamics on an agent-based scale (Needham et al., 2016), validation efforts for LifeSim have successfully modelled several significant events. These include Hurricane Katrina in New Orleans, the United States; the Kinugawa levee breach in Japan; the Malpasset Dam failure in France; the Kelly Barnes Dam failure in Georgia, the United States; and the Oroville Dam spillway failure in California, the United States (USACE, 2020).
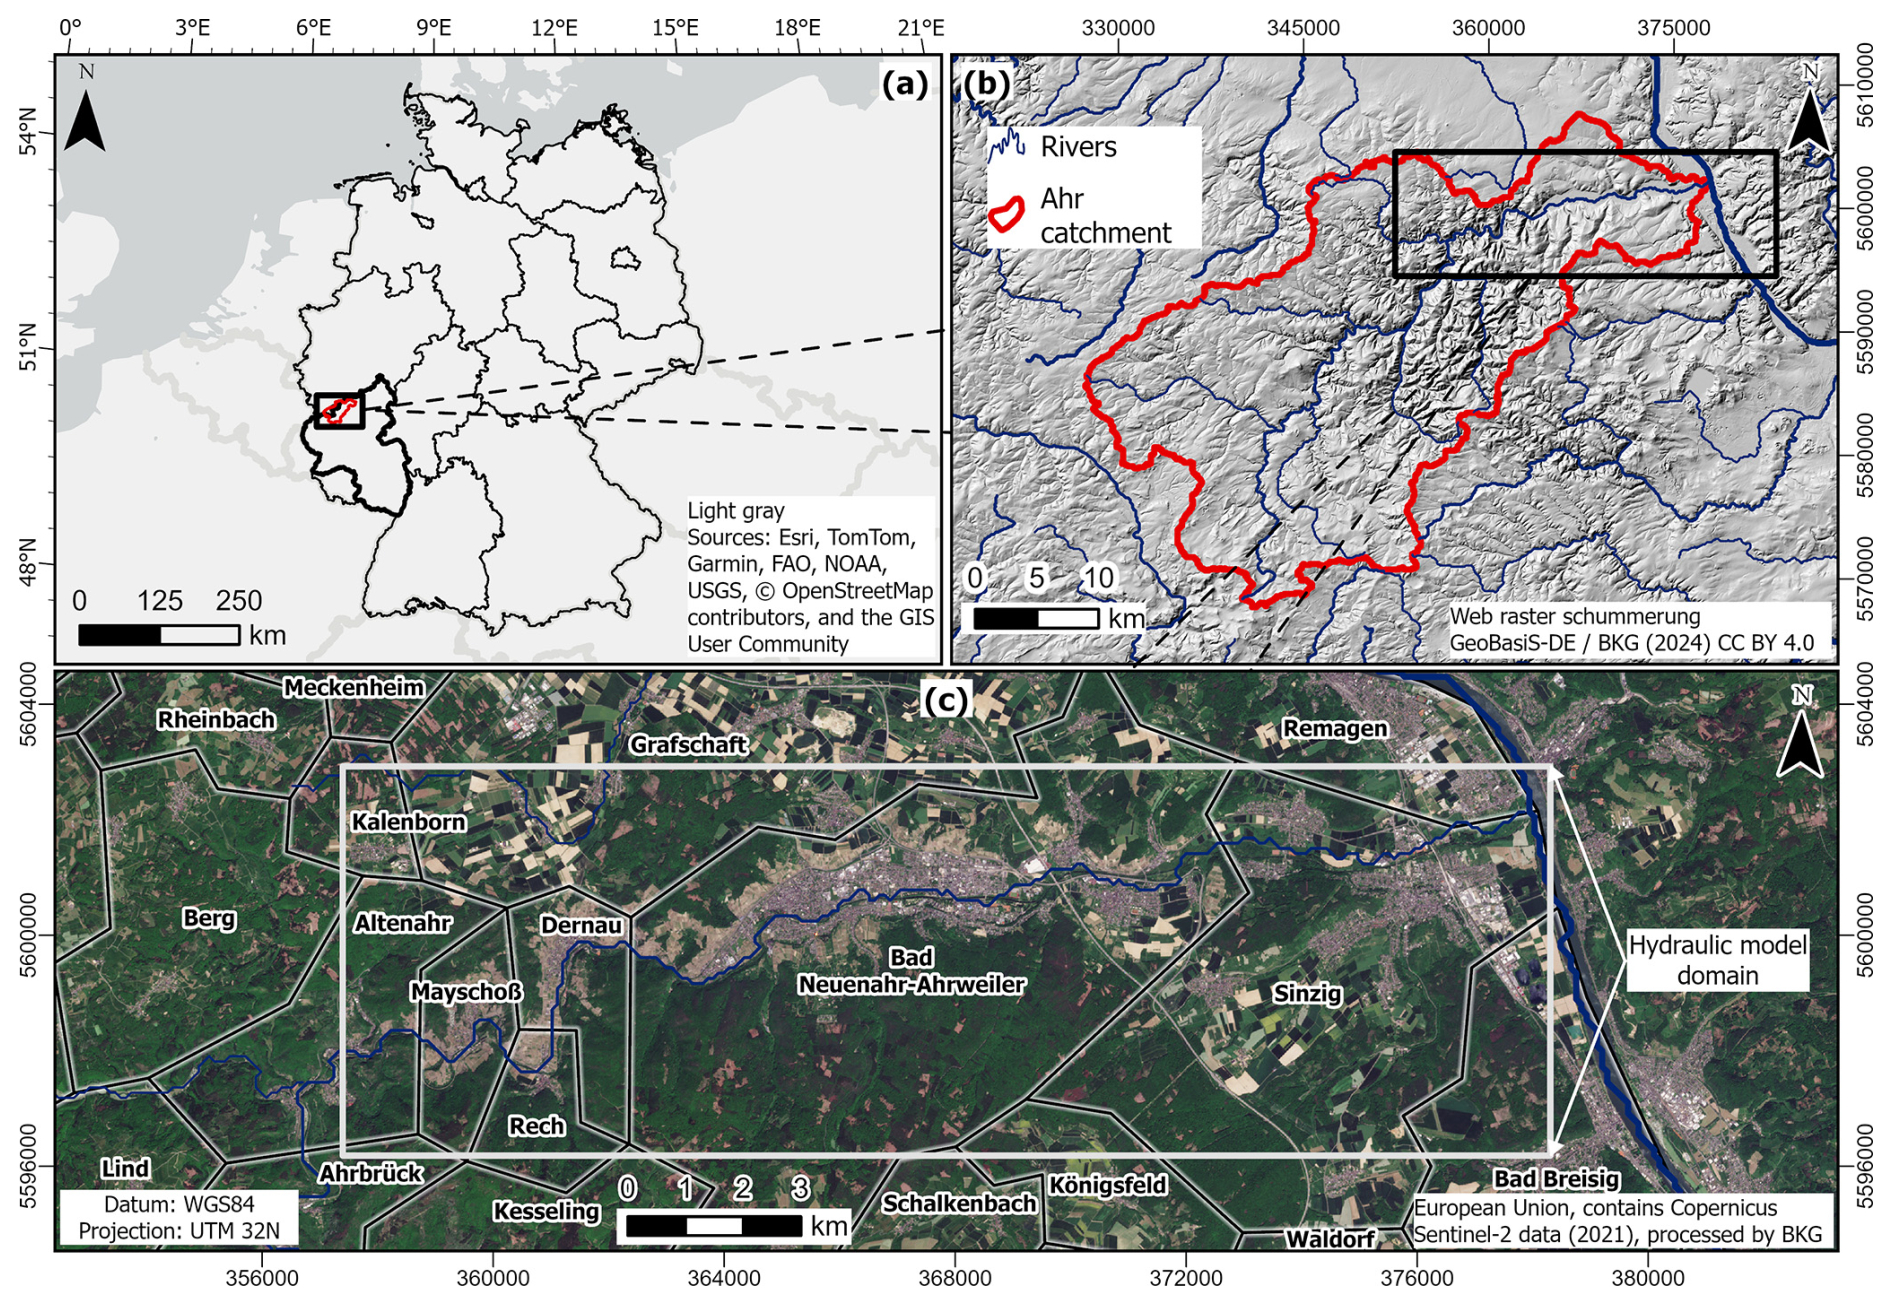
Figure 3Overview of the Ahr Valley and its most impacted area by the 2021 flood. (a) German federal states, highlighting Rhineland-Palatinate and the location of the Ahr Valley catchment. (b) Ahr Valley catchment with drainage system and hillshade base map. (c) Satellite image and local administrative units of the downstream portion and most impacted area of the Ahr Valley, between the cities of Altenahr and Sinzig, at the confluence with the Rhine. Data sources: German federal states and local administrative units – GeoBasic DE/BKG (2023), rivers and Ahr catchment – global dataset of drainage systems (He et al., 2024).
The LifeSim routine involves the initial preprocessing of hydraulic data, road networks, and buildings. Hydraulic data are processed to define the flood time series for each structure and road segment. This process uses the Ramer–Douglas–Peucker algorithm to reduce the number of data points in water depth and flow velocity hydrographs, optimising computational time and memory usage. For road networks, the fastest route between each node is pre-defined using the Dijkstra (1959) algorithm. In the event of traffic jams and flooding on roads, which could necessitate rerouting, the optimal path may change during the simulation. Hydraulic properties are determined at the midpoint of each road segment. Each building is associated with a road segment, and the initial fastest path between the building and an associated safe location is calculated.
The model then simulates each iteration, representing a complete simulation of the warning and evacuation dynamics and their consequences. Iterations are associated with a seed number to ensure reproducibility of the sampling model. For each iteration, LifeSim samples uncertainty parameters such as the warning and evacuation module input times and curves, as well as attributes of people and structures. With the sampling set, the dynamic simulation proceeds, and at the end, the exposure for each agent is determined. Individuals who were not sampled to receive a warning or take proactive action perform time-independent vertical evacuations, relocating to the highest floor, attic, or roof of their building, depending on the sampled attributes of the building. Those who evacuate by car or on foot are subject to sampled evacuation parameters, including willingness to enter the flood and stability criteria. Once exposure conditions are defined, the fatality rate association routine is applied to determine the final condition of each individual. This process is repeated for each iteration, resulting in a probabilistic life loss estimation.
2.2 Ahr Valley 2021 flood
Between 12 and 19 July, a quasi-stationary atmospheric low-pressure system named Bernd brought extreme rainfall to several regions in Europe. The most impacted areas included the federal states of Rhineland-Palatinate (RLP) (Fig. 3a) and North Rhine-Westphalia (NRW) in western Germany, as well as adjacent regions in Belgium, Luxembourg, and the Netherlands. In Germany, saturated soil due to accumulated precipitation in May and June, which exceeded the average by 10 %–40 %, coupled with an average of 127 mm of rainfall in 72 h from 12 to 14 July in some catchments, resulted in up to EUR 33 billion in damage and 191 fatalities. Specifically, the Ahr Valley (Fig. 3b) in RLP was particularly affected, with about 42 000 impacted people and 8800 damaged buildings, resulting in up to EUR 20 billion in economic losses and 134 fatalities. The steep slopes of the Ahr Valley caused torrential flows and elevated water levels, with the flow at the Altenahr gauge, upstream of the most affected area (Fig. 3c), increasing from less than 10 m3 s−1 to up to 700–1200 m3 s−1 within a few hours (DKKV, 2022; Kron et al., 2022; Szönyi et al., 2022). A reconstructed water level hydrograph showed a peak of 10.2 m, significantly higher than the forecasted 5.74 m, with the discrepancy attributed mainly to forecast uncertainties but also to the clogging of bridges downstream of the Altenahr gauge (Apel et al., 2022).
2.2.1 Flood hazard modelling
The 2D raster model RIM2D (Apel et al., 2022; Khosh Bin Ghomash et al., 2024; Vorogushyn et al., 2024) was used to simulate the 2021 flood event. This simulation updated the model set by Apel et al. (2022), refining the digital elevation model (DEM) resolution from 10 to 5 m (Khosh Bin Ghomash et al., 2024). This enhancement improves the accuracy of the results, reducing biases related to resolution impacts on flood characteristics and consequences (Brussee et al., 2021; Bryant et al., 2023). Finer resolutions (e.g. 1 and 2 m) were also tested but had a negligible impact on flood risk estimation, including the risk of loss of life (Khosh Bin Ghomash et al., 2024). Based on these findings, the 5 m resolution DEM was selected as the optimal balance between model accuracy and simulation efficiency.
The model domain encompassed the reach between the towns of Altenahr and Sinzig, about 30 km, where the Ahr flows into the Rhine (Fig. 3c). Land use classification was sourced from Mundialis 2020 (Riembauer et al., 2021), with Manning's roughness values as follows: sealed surface areas (η=0.02, for simulating flow over tarmac or concrete in built-up areas); forest (η=0.2); and other classes, including the river channel and floodplains (η=0.03). The roughness values were calibrated using the Euclidean distance objective function, considering flood extent, flood depth in floodplains, and flood dynamics within the river channel. Regions of the DEM overlaid by building footprints from the OpenStreetMap database were excluded from the hydraulic routine to represent urban flow dynamics more accurately (Apel et al., 2022).
The reconstructed water level hydrograph at the Altenahr gauge, showing a maximum water depth of 10.2 m, was used as the upstream boundary condition. A comparison between the maximum water depth layer (Fig. 4a) and 75 reported water depths revealed a bias of 0.46 m and a root mean square error of 0.97 m. To calculate this error metric, a 7.5 m buffer was applied around the reported markers to gather information from adjacent pixels. The mean depth of inundated pixels within this buffer was then considered. It is important to note that the reported water depths correspond to different vertical datums, including street level, pedestrian walkways, and doorsteps. The simulated flow velocities (Fig. 4b) are consistent with expectations for such a dynamic event, ranging from 2 to 5 m s−1 in the river course and 0.1 to 2 m s−1 in built-up areas (Apel et al., 2022). The maximum simulated water depth predominantly occurred between 12:00 and 04:00 CEST on 15 July (Fig. 4c).
The LifeSim hydrodynamic module directly accepts input data from simulations conducted using hydraulic models such as HEC-RAS and FLO-2D. For the simulations executed using RIM2D output, the insertion of water depth and flow velocity data was performed through multiple layers, each representing different time intervals and containing parameter values. A 15 min time series of water depth and flow velocity layers was used as input for the flood routine of the LifeSim model.
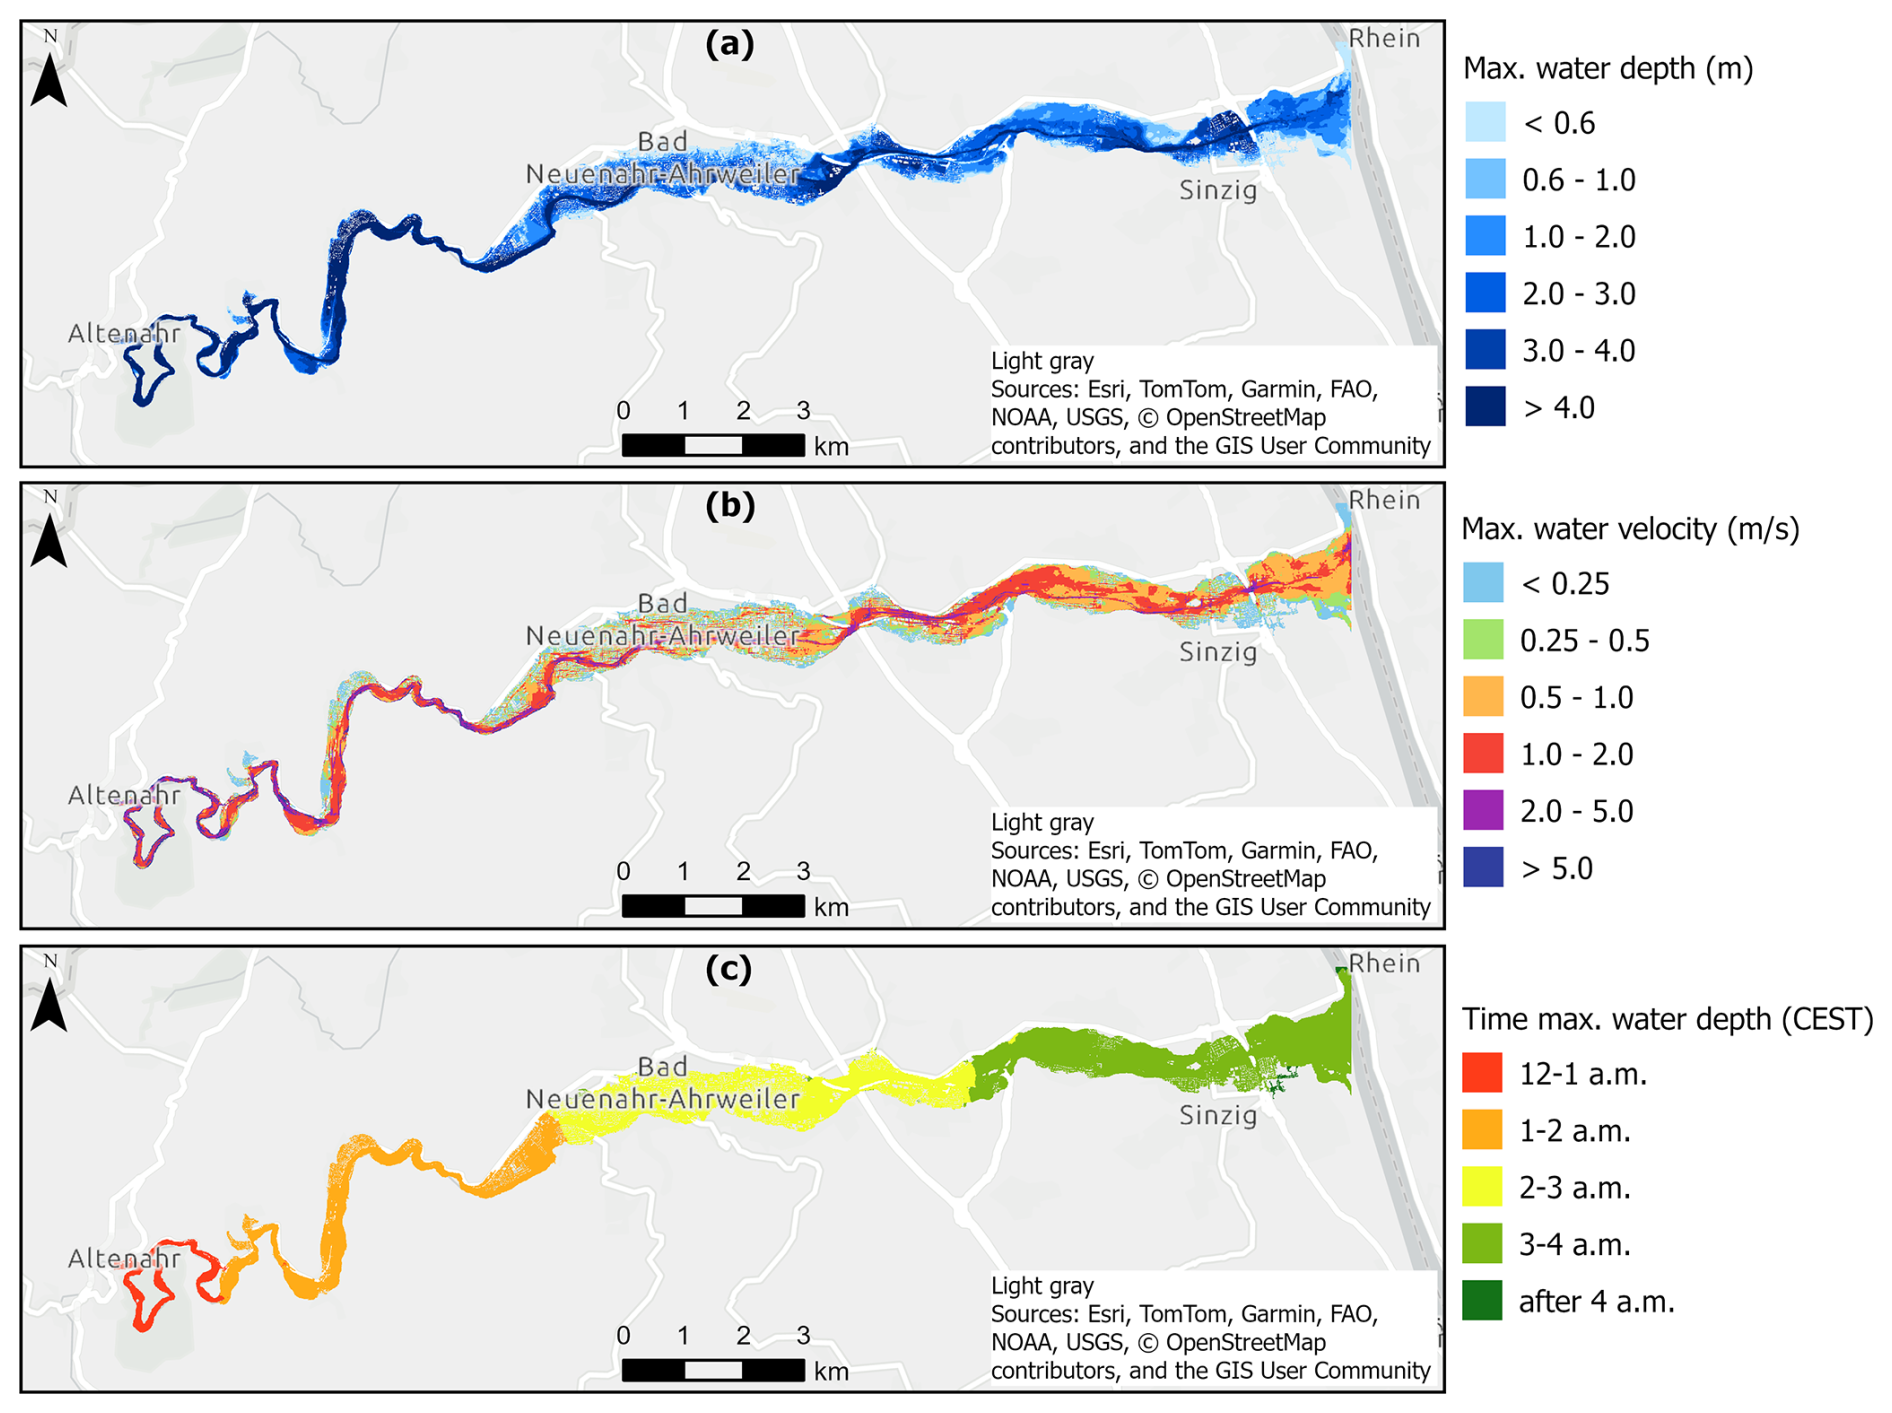
Figure 4Flood characteristics of the 2021 Ahr Valley flood simulated with RIM2D at a resolution of 5 m. (a) Maximum water depth. (b) Maximum flow velocities. (c) Time of maximum water depth on 15 July.
2.2.2 Exposure at a building scale
In order to apply the life loss model LifeSim, data for each building are required (e.g. number of floors, foundation height, and occupancy type). Similarly, data concerning the number of exposed people and their ages (e.g. more or less than 65 years old) are required. This detailed information was obtained using a combination of available data from OpenStreetMap, the Historical Analysis of Natural HaZards in Europe (HANZE) 2.0.3 database (Paprotny, 2023), the 2011 German census, and the Singh et al. (2025) survey result database consolidated after the 2021 event.
Information on the population was sourced from the 100 m resolution grids of HANZE 2.0.3 for 2020 (Paprotny, 2023). The HANZE 2.0.3 population data at this resolution were derived from a disaggregation technique applied to the 1 km resolution population data from the 2011 European GEOSTAT database. This disaggregation considered proportional distribution based on identified humanmade structures, such as buildings, impervious surfaces, roads, and streets. In order to model population growth, a rate of change was used at the Nomenclature of Territorial Units for Statistics (NUTS) 3 level (Paprotny and Mengel, 2023).
Building footprint polygons were obtained from the OpenStreetMap 2021 database, excluding buildings without human occupation potential, such as garages, parking facilities, and toilets. Since we only considered buildings to allocate the population, excluding other humanmade structures, we noticed some grids with a 100 m population resolution in HANZE 2.0.3 lacked buildings overlaying them. In order to address this issue, we first aggregated the 100 m resolution population data to a 1 km resolution. Then, we redistributed the data to the 100 m grid, weighted by the HANZE 2.0.3 population at this resolution, but only considering grids with the selected buildings. This approach ensured that there was no grid population without the selected buildings.
In order to allocate the population within the selected buildings, we performed a weighted distribution of the redistributed population from the 100 m grid, using building size as the weighting factor. After allocating the population to the buildings, the building centroids were moved to the nearest pixel of the RIM2D simulation, as the hydraulic routing cut out the building footprints (see Sect. 2.2.1).
Age can significantly impact flood fatalities, mainly due to mobility issues (Vinet et al., 2012). In the LifeSim routine, age influences the probability of mobility issues and the corresponding submergence threshold criteria. In order to incorporate this information, age demographics from the 2011 German census, provided at a 1 km grid resolution, were used to classify the population in the Ahr Valley region. On average, 24.2 % of the population within the selected grids is over 65 years old.
Some crucial building characteristics for the LifeSim model (e.g. number of floors, foundation height, and possibility of accessing the attic) were unavailable in the HANZE 2.0.3 and the 2011 German census databases. Consequently, data were supplemented by a post-event survey of flood-affected residents (Singh et al., 2025). The survey data contain 277 responses from residents of Rhineland-Palatinate. The number of floors was determined based on the proportion of survey responses, assuming that buildings with higher population densities are more likely to have more floors. For example, 0.4 % of responses indicated that a building had seven floors, the maximum reported. Therefore, the 0.4 % of buildings with the highest population density were assigned seven floors. Foundation height, defined as the elevation difference between the street and the ground floor, was estimated using responses that provided information on floodwater reaching the ground floor. By comparing estimated water levels inside and outside buildings, an average foundation height of 0.57 m was determined and applied to all buildings. Additionally, it was estimated that 36.5 % of buildings have attic access.
The building stability criterion is defined as “engineered” according to LifeSim, based on the considerations outlined by Clausen and Clark (1990). For this specific criterion, two curves are considered based on the product of water depth and flow velocity, with a uniform range of uncertainty: the lower-curve threshold is set at 7 m2 s−1, representing traditional and smaller constructions, and the upper-curve threshold at 10 m2 s−1, representing high-quality constructions. In the LifeSim routine, a building collapses if the thresholds of the sampled curve are reached and the flow velocities exceed 2 m s−1.
Road networks were imported directly from OpenStreetMap, and safe evacuation places were located outside the inundation zones to simulate the dynamics of an actual evacuation event. Figure 5 illustrates the population distribution within buildings at a 100 m resolution, along with road networks and designated safe places. Buildings within the grids that intersected the 100 m buffer zone of the inundated boundary were utilised for LifeSim simulations. A total of 10 461 buildings were included, housing 24 076 individuals under 65 years old and 9467 individuals aged 65 and over.
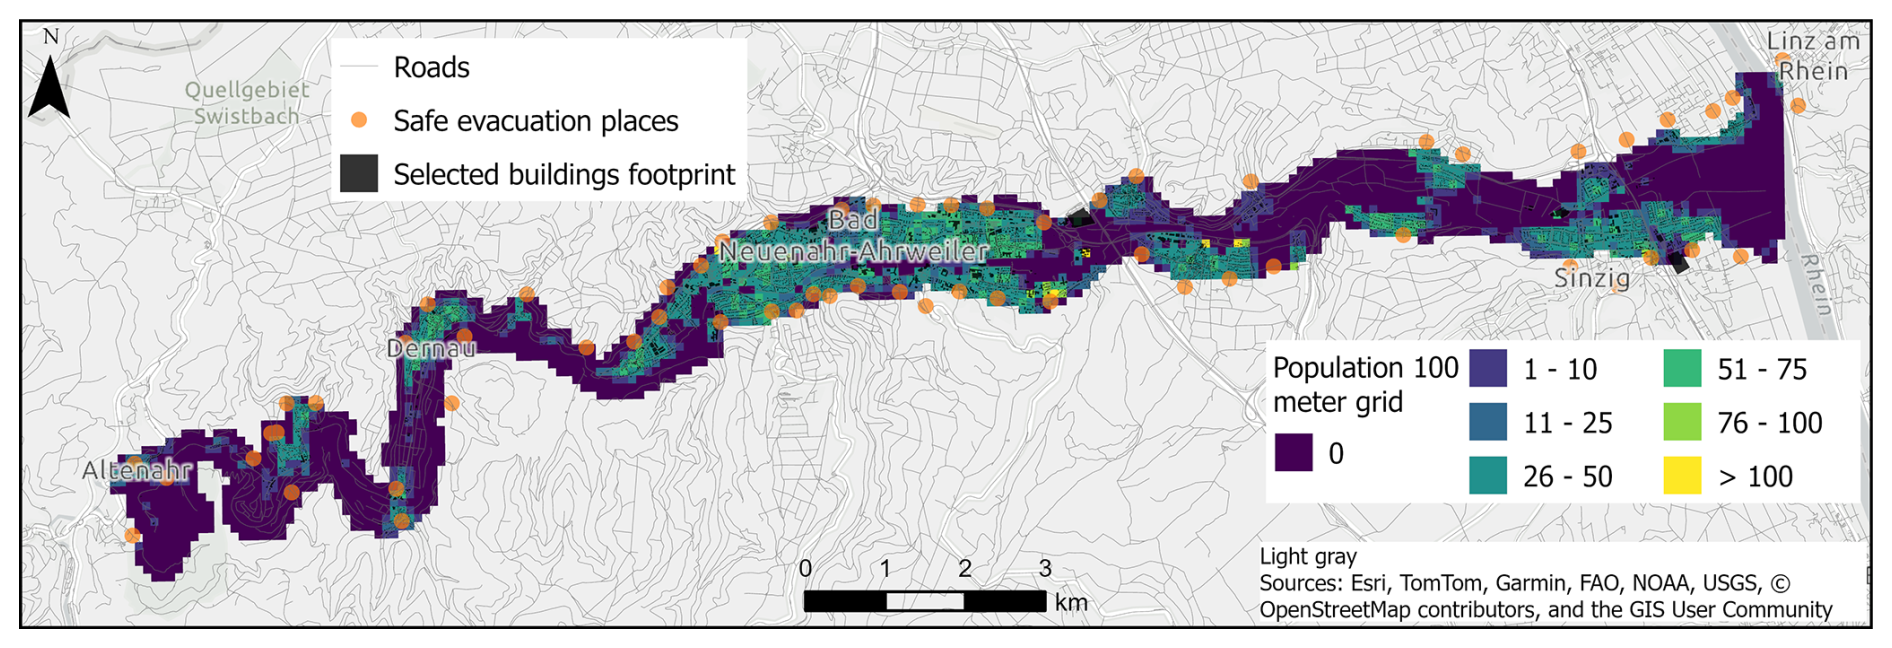
Figure 5Overview of exposure at a building scale. Population counts aggregated at a 100 m grid resolution, buildings and road network along the Ahr Valley, simulated flood extent, and safe places. Data sources: 100 m grid – HANZE 2.0.3 (Paprotny, 2023). Roads and buildings: © OpenStreetMap contributors 2021. Distributed under the Open Data Commons Open Database License (ODbL) v1.0.
2.2.3 Early warning and evacuation
In Germany, the national German Weather Service (DWD) is responsible for issuing warnings related to extreme weather events, whereas the federal states legally mandate flood warnings (Kron et al., 2022). Regarding the 2021 flood event, the DWD issued the initial weather warning on 12 July at noon CEST. The first flood warning for the Ahr and its tributaries was released on 14 July, just before noon CEST, reaching approximately 22 000 people. This warning alerted residents to a rapid water level rise and potential flooding within the next 24 h. Numerous additional weather and flood warnings were disseminated throughout 14 July. For instance, at 23:00 CEST, a warning was issued to Sinzig, Bad Neuenahr-Ahrweiler, and adjacent places with residents living within 50 m of the Ahr to evacuate their buildings. This significantly underestimated the hazard, as fatalities were later reported in buildings located up to 250 m from the river. Despite the numerous warnings, the effectiveness of the alert system was severely compromised by miscommunication along the warning chain and a general lack of confidence in the unprecedented severity of the flood (Szönyi et al., 2022).
The information provided by the survey conducted by Singh et al. (2025) about the Ahr Valley's warning and evacuation procedures was used for the description of the timeline in LifeSim (Fig. 2). As the survey had a unit geographic scale of federal state and the flood occurred at different areas and times between 12 and 19 July 2021 in the states, we applied a filter to use only responses from individuals in Rhineland-Palatinate (RLP) affected during the same time window as the high water levels in the simulated domain. Out of 277 responses from RLP, 246 were considered. These respondents reported the occurrence of hazards at their homes between 15:00 CEST on 14 July and 09:00 CEST on 15 July. The first flood warning, adopted for this study, was reported at noon CEST on 14 July, representing a notification issued 13 h before the water level peaked at the Altenahr gauge at 01:00 CEST on 15 July. As a result, the warning issuance delay in the LifeSim timeline was excluded from the analysis since it occurred before this milestone and would not affect the simulations.
To depict the diffusion of this first warning in the context of the LifeSim routine, we considered the reported lead times from individuals who noted that the warning they received was either a call for evacuation or contained information pertinent to evacuation. The reported time of hazard occurrence at the buildings was subtracted by the lead time to establish the first warning time for each individual. In instances where no lead time was reported, or the warning lacked evacuation instructions, individuals were assumed to be warned at the moment of their reported hazard occurrence at their building. Notably, 57.0 % of those affected by the main event reported receiving a warning. However, only 17.5 % received a warning that included explicit evacuation instructions. Some reported no lead time among those who received evacuation instructions, resulting in only 13.8 % of the surveyed people receiving an explicit evacuation warning before the flood reached them.
Figure 6a illustrates the warning diffusion process based on these assumptions and analyses. Given that the hazard occurrence question was framed in hourly ranges, the curves depict these ranges, which were inserted as a uniform distribution in the model. Additionally, the reported lead times were aligned with the first warning issued by the federal state at noon CEST on 14 July. Most individuals were warned or became aware from the night of 14 July and the early morning of 15 July, correlating with the most frequently surveyed times of hazard occurrence.
Regarding the mobilisation time, we considered the reported time it took individuals to take protective action after receiving the warning or becoming aware of the hazard. In the survey, the protective actions included several mitigation measures and were not solely focused on evacuation. In order to represent the evacuation dynamics of the event, we considered only responses from individuals who left their homes before or during the flood, as well as those who were rescued. Approximately 34 % of the surveyed population left their homes or were rescued, with 6.9 % taking immediate action, 5.3 % reporting a delay in mobilisation, and 22.0 % not specifying when they began protective measures. In order to account for the uncertainty among the 22.0% who did not report a response time, we applied a uniform uncertainty range (Fig. 6b). This range included an upper curve representing the fastest mobilisation, assuming immediate action for this group, and a lower curve representing the slowest mobilisation, considering 6 h (the maximum reported delay).
Regarding the evacuation dynamics, the mean family size on the NUTS 3 scale was used to estimate buildings where all residents were warned and mobilised simultaneously. Specifically, buildings housing more than three people were identified, as it was assumed that in such cases, the warning and mobilisation of the population do not occur simultaneously. This criterion was also used to define the size of the evacuating group.
The evacuation mode fraction, whether by vehicle or on foot, is a user-defined input in LifeSim. In order to determine this fraction and represent the evacuation dynamics during the 2021 flood event, we conducted multiple runs, adjusting the evacuation mode by 10 % in each run. The fraction that produced the closest match to the observed ratio of fatalities occurring indoors versus during evacuation was selected. Specifically, 68.5 % of the fatalities (or possibly more) occurred indoors, given the uncertainty regarding victims discovered outside (Rhein and Kreibich, 2025). We found that an evacuation mode fraction of 80 % by vehicle and 20 % on foot most closely matched the indoor fatality ratio, with 69.3 %. Consequently, this fraction was chosen to represent the reconstruction scenario (see Fig. S1 and Table S1 in the Supplement).
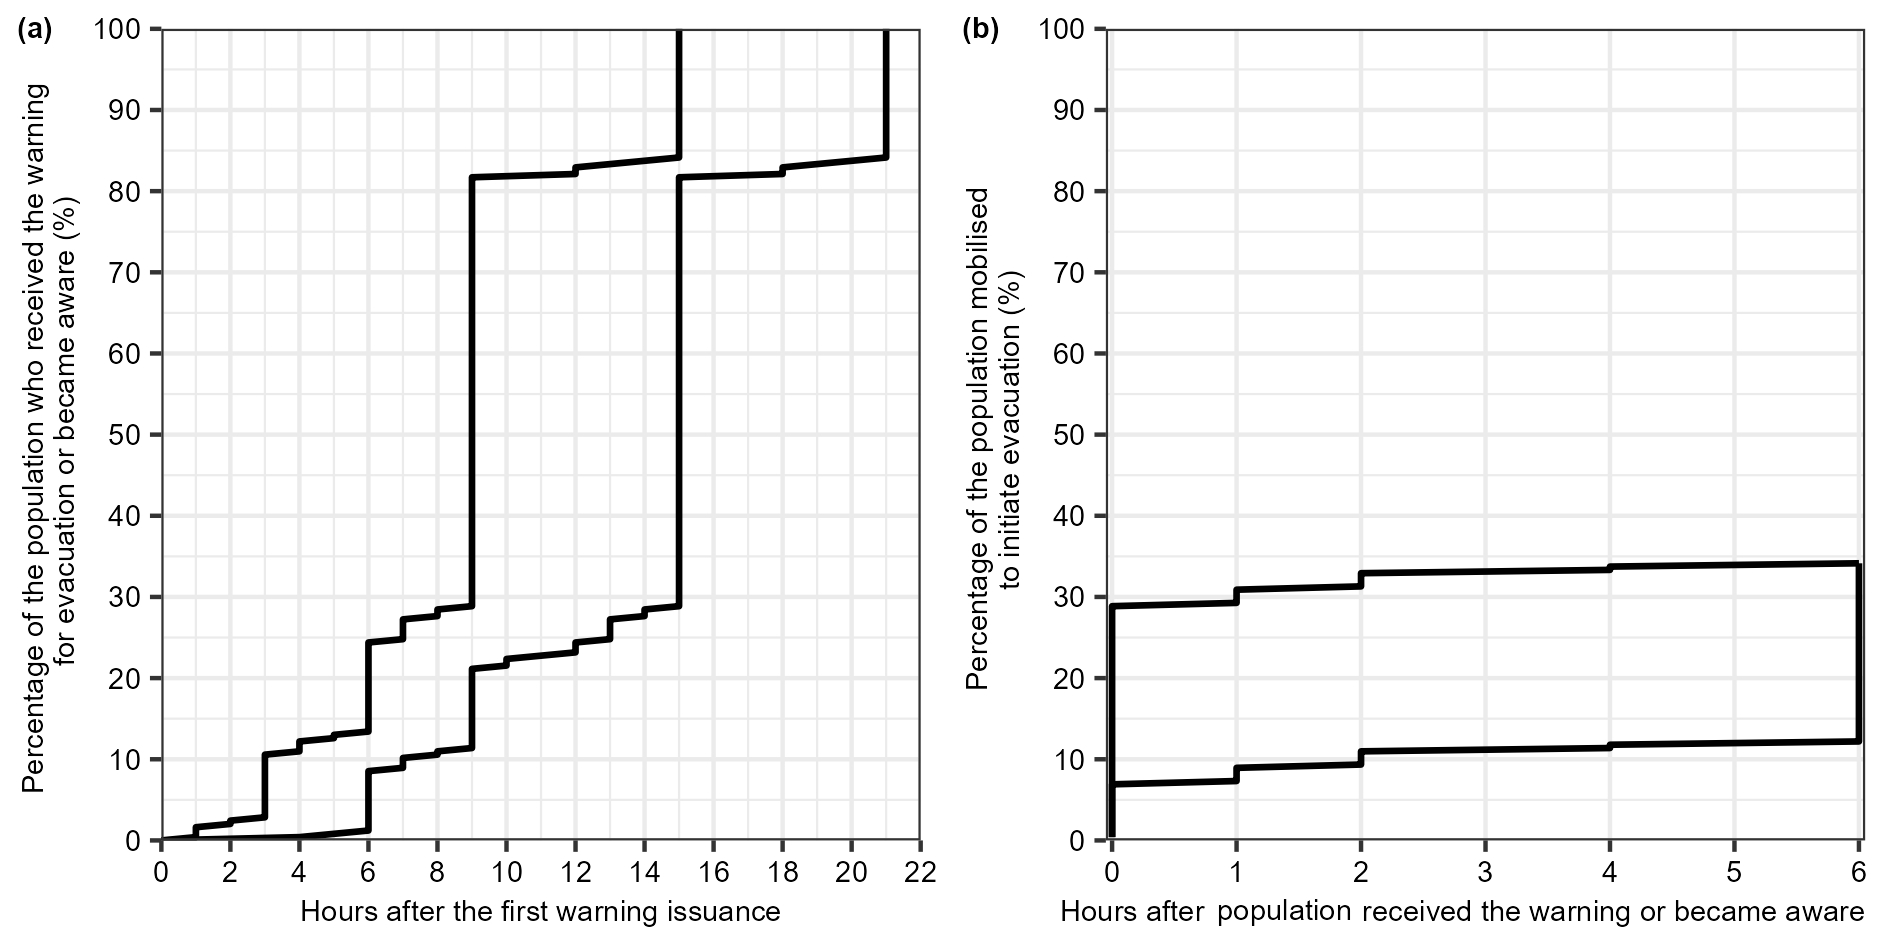
Figure 6Reconstruction of warning diffusion and mobilisation times in the Ahr Valley 2021 flood based on the post-event survey with flood-affected residents. (a) Warning diffusion curves: cumulative proportion of the population who were warned or became aware of the hazard after the first flood warning. (b) Mobilisation curves: cumulative proportion of the population who initiated an outdoor evacuation after receiving or becoming aware of the hazard.
2.2.4 Alternative scenarios of early warning and evacuation
The simulation of alternative warning and evacuation scenarios can illustrate the impact of warning procedures on loss of life (Lumbroso et al., 2021; Lumbroso and Davison, 2018; Silva and Eleutério, 2023a, b; Wang et al., 2024). For the 2021 Ahr Valley flood, we develop and assess alternative scenarios using two approaches. First, we propose scenarios that alter the warning diffusion and mobilisation curves, drawing on historical cases referenced in the LifeSim recommendations. This approach aimed to represent how different strategies of warning dissemination, as well as varying levels of public perception and preparedness, could impact the number of fatalities without changing the time of first warning issuance. Secondly, we analysed the effect of the timing of the first flooding warning, taking into account the water depth forecasting capabilities for the region.
In order to check the effects of warning diffusion and mobilisation curves, we defined three distinct scenarios, each with its own unique characteristics and implications. The optimal scenario (A1.1) represents a highly effective warning system, employing multiple channels for fast and extensive alert dissemination, with frequent repetition and a well-prepared, trained population. The intermediate scenario (A1.2) features a moderately effective warning system, with a mix of technologies and a population with some awareness of the risks. However, deficiencies in emergency planning affect the likelihood of a high mobilisation rate in a short time. The suboptimal scenario (A1.3) involves a warning system that is less effective, with limited technologies and infrequent warning issuances, hindering fast dissemination. In this scenario, most of the population is unlikely to perceive the threat, and their response is largely improvised. The curves used in these scenarios were proposed by Sorensen and Mileti (2015b, c). The supplementary material (see Sect. S2 in the Supplement) provides a detailed description of the equations and their coefficients, as proposed by these authors.
The proposed warning diffusion curves, categorised as “fast”, “moderate”, and “slow” for daytime scenarios, were utilised in this study. These curves incorporate uncertainty modelled through a triangular distribution. The range extends from the upper bound of the “fast” curve, reflecting rapid dissemination similar to that observed in the 1980 eruption-induced mudflow of the Toutle River, Washington, in the USA, to the lower bound of the “slow” curve, which aligns with the behaviour seen in the 1987 Nanticoke chemical accident, Pennsylvania, in the USA (Sorensen and Mileti, 2015b).
Additionally, the proposed mobilisation curves for “preparedness good and perception likely”, “preparedness poor and perception likely”, and “preparedness poor and perception unlikely” were employed. These curves also utilise a triangular distribution. The uncertainty bounds are derived from the fastest response case of the Confluence (USA) hazardous material flow in 1987, which defined the upper bound for “preparedness good and perception likely”, and the slowest case in the database, which corresponded to a similar event in Pittsburgh (USA) in the same year, defining the lower bound for “preparedness poor and perception unlikely”. Furthermore, Eq. (S2) is supplemented by maximum mobilisation rates over different time periods, specifically up to 8, 24, and 74 h. The two slower response curves have the same coefficients but different maximum mobilisation rates. These rates represent the maximum population likely to take protective action, with higher mobilisation rates anticipated for longer durations and more optimal scenarios of perception and preparedness (Sorensen and Mileti, 2015c).
Two additional scenarios were evaluated by integrating the theoretically proposed and empirical curves (Fig. 6) for the 2021 flood. These scenarios represent a suboptimal warning system, contextualised within empirical curves for warning diffusion (A1.4) and mobilisation (A1.5). This approach enables the analysis of the impact of each delay in the occurred warning timeline process. The suboptimal curves are employed in these scenarios to reflect the realism of the 2021 event characterised by a deficient warning system. Figure 7 illustrates the combination of the diffusion and mobilisation process curves for each scenario, including the reconstruction scenario designated as reconstructed flood early warning and evacuation (RFEWE). Table S2 presents the utilised curves, their respective coefficients, and their mobilisation rates for each scenario.
The reconstruction scenario exhibits a more significant delay and lower mobilisation rates in protective action following the first warning issuance compared to the two worst alternative scenarios, A1.4 and A1.5. Most individuals became aware of the hazard only at the time of its occurrence, despite receiving the first warning 13 h before the peak of the flood, and the low rates of mobilisation were specific characteristics of this event that were not observed in the other events used in the curves proposed in LifeSim. Hence, an even more extreme alternative scenario (A1.6), theoretically worse than the reconstruction, was assessed by simulating only vertical evacuation, excluding any outside evacuation.
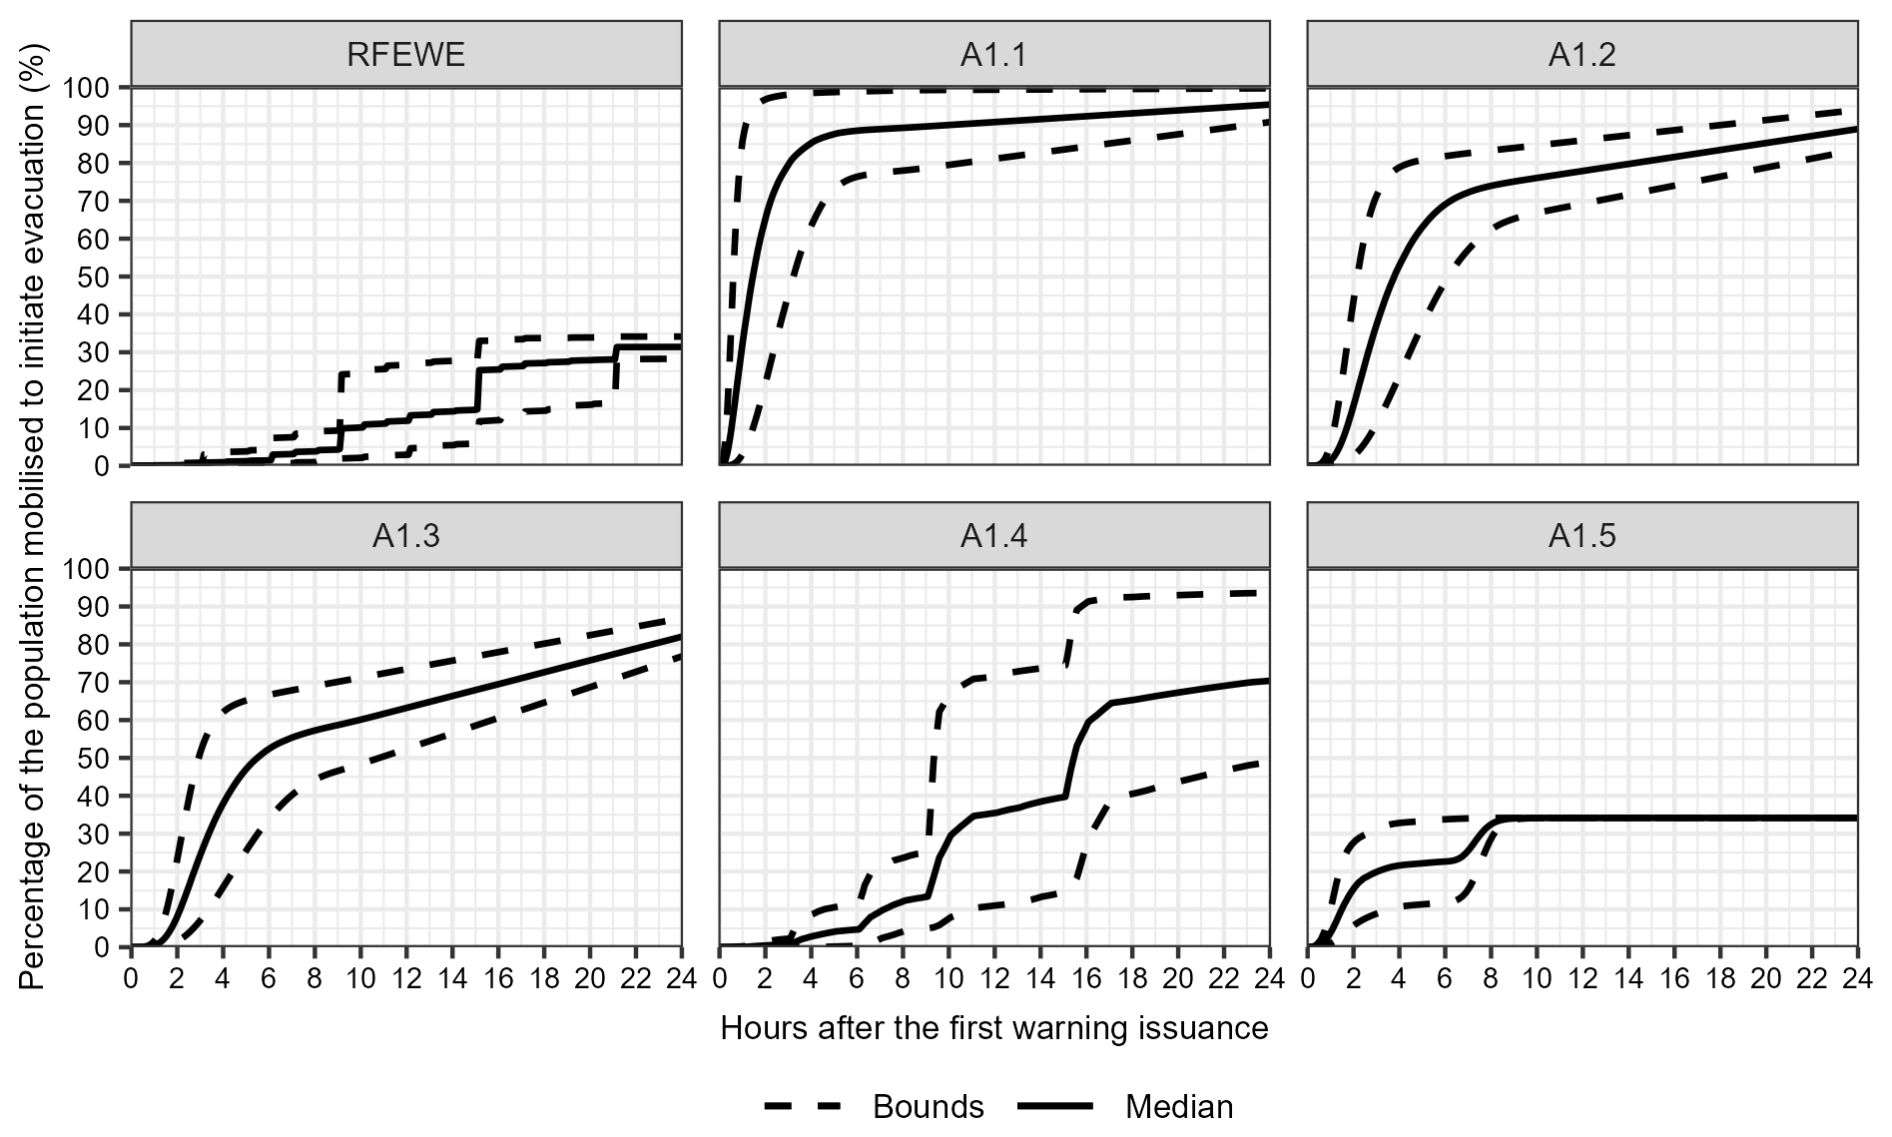
Figure 7Combination of the warning diffusion and mobilisation curves for each alternative scenario of early warning and evacuation in the first approach. RFEWE (reconstructed scenario of the 2021 flood), A1.1 (optimal scenario), A1.2 (intermediate scenario), A1.3 (suboptimal scenario), A1.4 (suboptimal scenario with an empirical warning diffusion curve), and A1.5 (suboptimal scenario with an empirical mobilisation curve).
In order to assess the timing of the first warning, we employed a uniform distribution to represent the range of possible and reliable times for the first flood warning during the 2021 event. Forecasting techniques indicate that it would be possible to anticipate, with a 75 % probability, that the water level at the Altenahr gauge would exceed the 4 m threshold, corresponding to a 100-year event, 17 h before the peak. This probability would increase to 100 % from 8 h before the peak (Najafi et al., 2024). Thus, the potential times for issuing the first warning were considered to fall within a 9 h window, between 08:00 and 17:00 CEST on 14 July. In this second approach, potential desired times for early warnings that significantly impacted the estimations could be identified (Silva and Eleutério, 2023b). Additionally, the identification of early warnings that could result in traffic jams and, consequently, more people being trapped by the flood during evacuation could be comprehensive (El Bilali et al., 2021).
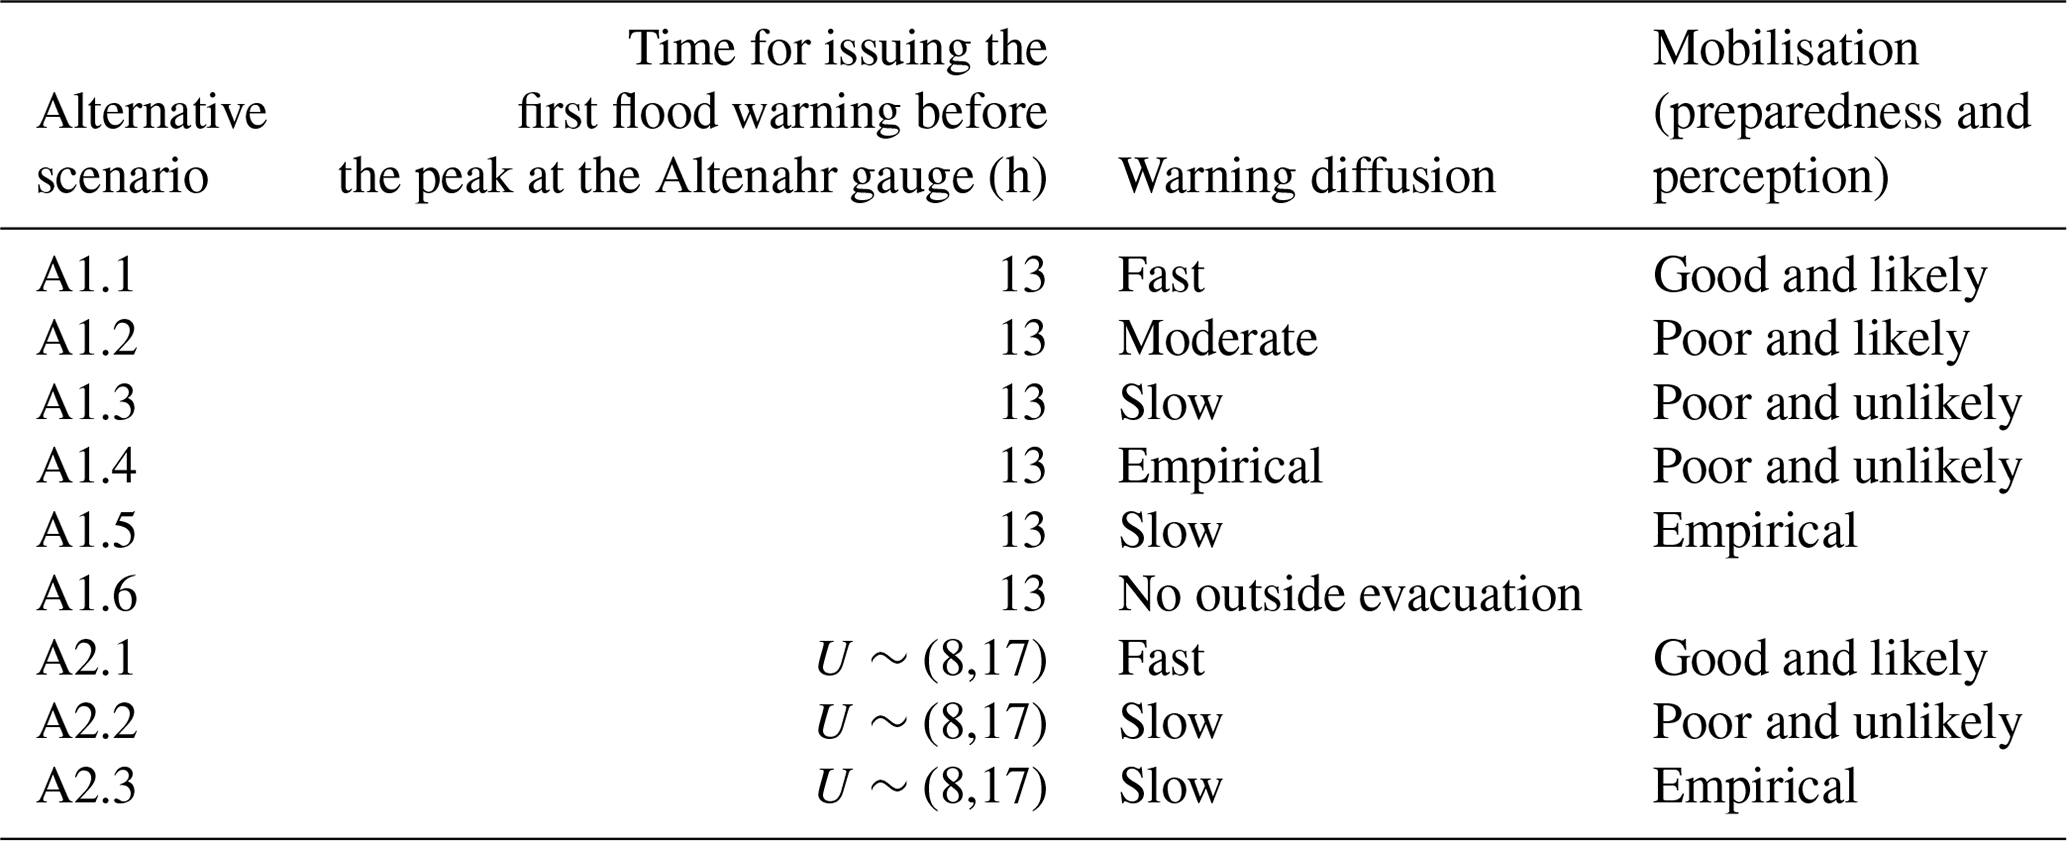
When combined with the second approach of analysing different timings for the first warning issuance, the reconstructed empirical warning dissemination (Fig. 6a) does not represent a realistic scenario. Most surveyed people did not receive an evacuation warning; hence, most of the points on the curve were based on the time of reported hazard occurrence at the surveyed buildings. Using this empirical curve for early warnings issued later than 13 h before the peak at the Altenahr gauge would suggest that most people would be warned only after the hazard had occurred. Conversely, issuing warnings earlier than 13 h before the peak does not align with the dissemination dynamics observed in 2021. Therefore, for warning diffusion and mobilisation delays in the second approach of alternative scenarios, we employed the optimal and suboptimal scenario curves proposed in the first part. This allows for examining the influence of varying warning issuance times on estimating loss of life. Additionally, we included a scenario using the slow theoretical warning dissemination and empirical mobilisation. Table 1 summarises the alternative scenarios and their respective warning and evacuation parameterisation considerations. The scenarios for the second approach are designated as A2.1 for the optimal scenario, A2.2 for the suboptimal scenario, and A2.3 for the suboptimal scenario with the empirical mobilisation curve.
Table 1Overview of all alternative scenarios for early warning and evacuation, considering the timing of the first flood warning issuance, warning diffusion, and mobilisation curves. A1: first approach, analysing warning diffusion and evacuation curves alongside the actual timing of the first flood warning. A2: second approach, focusing on the time window for the first warning issuance based on forecasting capabilities. The numbers in brackets indicate the time window for issuing the first flood warning.
2.2.5 Parameterisation and key considerations for using the LifeSim model
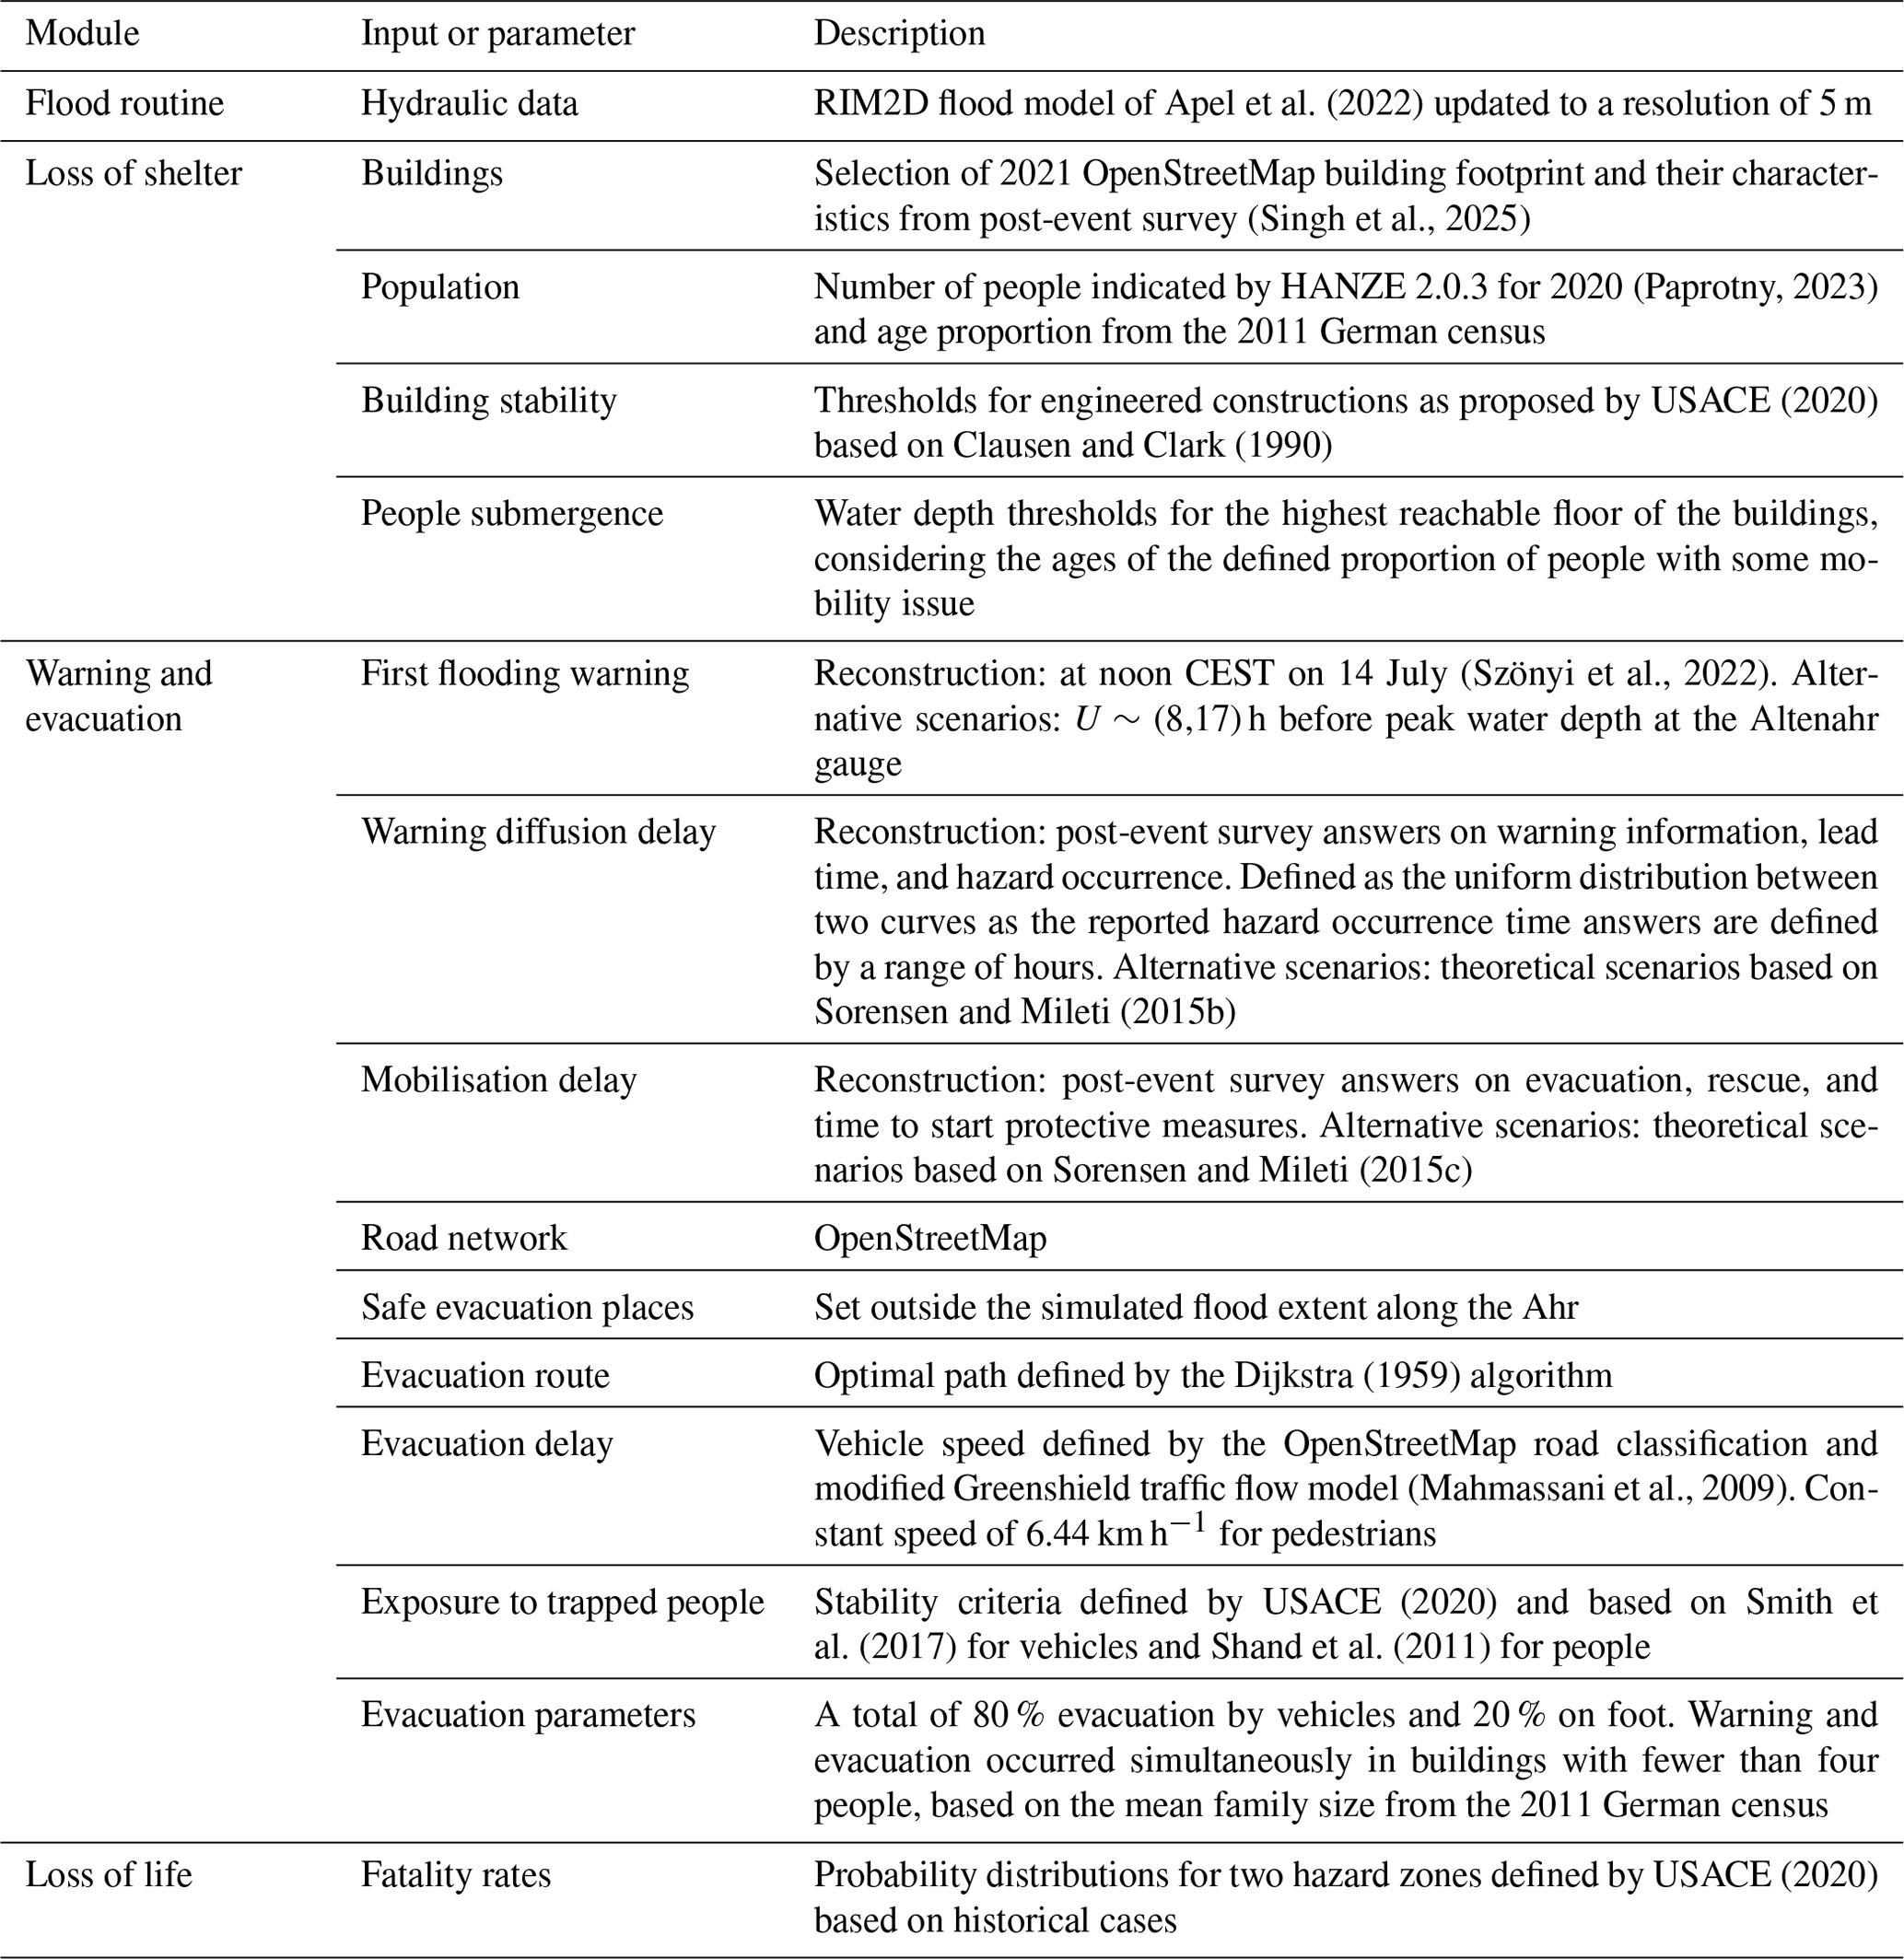
LifeSim version 2.1.3 (USACE, 2023) was employed to assess fatalities resulting from the 2021 Ahr Valley flood. A total of 2000 iterations was sufficient to achieve convergence of the quantiles, standard deviation, and skewness for the probabilistic outcomes in scenarios with a deterministic first warning issuance time (see Fig. S2 in the Supplement, Sect. S3). For scenarios with a variable time range for the first warning issuance, 18 000 iterations were conducted, representing approximately 2000 iterations for each hourly range. Statistical tests, including those developed by Dunn (1964), Kruskal and Wallis (1952), and Mann and Whitney (1947), were performed to compare the differences in estimated fatalities across various scenarios. Table 2 provides an overview of the considerations within each LifeSim module used in the analysis.
Table 2Summary of LifeSim module inputs and parameters for life loss simulations in the 2021 Ahr Valley flood.
The modelling domain excluded 15 victims from the upstream cities of Ahrbrück, Dümpelfeld, Müsch, and Dorsel. Among the reported fatalities within the domain, one was associated with a pre-impact case where an individual died of a heart attack due to exhaustion, and another was a post-impact case where an individual was trapped in a collapsing building and subsequently died in a hospital (Rhein and Kreibich, 2025).
Thus, for the comparative analysis, we excluded the 15 victims from upstream cities and the pre-impact fatalities. The remaining post-impact fatalities, which could be directly attributed to the flood, were included. This adjustment resulted in a comparison value of 118 victims for evaluating life loss estimations. The comparisons between the estimated and reported fatality locations were limited to indoor cases due to uncertainties regarding the actual accident locations of victims found outside buildings.
3.1 Life loss estimation of the Ahr Valley flood in 2021
The LifeSim median estimate for the number of fatalities is 152, which is 28.8 % higher than the actual total of 118. The simulation uncertainties span 140 to 162 fatalities, corresponding to the first and third quartiles, respectively. The extreme range, defined by the minimum and maximum estimated values, spans 99 to 202 fatalities, resulting in a range of 103 fatalities. The median of fatalities inside the buildings is 69.3 % of the total estimation, aligning with the reported 68.5 % (Rhein and Kreibich, 2025).
One reason for the variability in estimations is the sampling of the warning diffusion and mobilisation curve. Figure 8 illustrates this influence, showing points near 0.00, meaning iterations where the population is warned or starts the evacuation more slowly (similar to the right curves in Fig. 6), while points nearing 1.00 depict faster responses (similar to the left curves in Fig. 6). In general, the warning diffusion has a similar correlation with the estimated fatalities compared to the mobilisation ( and , respectively), and this can be observed by analysing the central tendency of the fatalities in different regions of the sampling curves. The same estimated fatality values for warning diffusion and mobilisation levels occur due to the influence of other probabilistic parameters in the model, such as submergence thresholds and stability criteria.
For the warning diffusion, iterations with the sampling curve in the upper quarter (0.75 to 1.00), corresponding to most of the population being warned between 9 and 10.5 h after the first warning issuance (Fig. 6a), result in a median estimate of 145 fatalities. In contrast, iterations with sampling curves in the lower quarter (0.00 to 0.25), where most of the population becomes aware between 13.5 and 15 h after the first warning issuance, result in a median estimate of 157 fatalities (Fig. 8a). Regarding mobilisation, the upper quarter, representing immediate action by 23.4 % to 28.9 % of the population (Fig. 6b), has a median of 143 fatalities. Conversely, the lower quarter, representing immediate action by 6.9 % to 12.4 % of the population, yields a median of 158 fatalities (Fig. 8b). Furthermore, a joint analysis of warning diffusion and mobilisation underscores the general influence of these input uncertainties. Iterations with sampling curves exclusively in the upper quarter yield a median of 135 fatalities, indicating an overestimation reduction to 14.4 % of the estimated fatalities compared to the actual value of 118 (Fig. 8c).
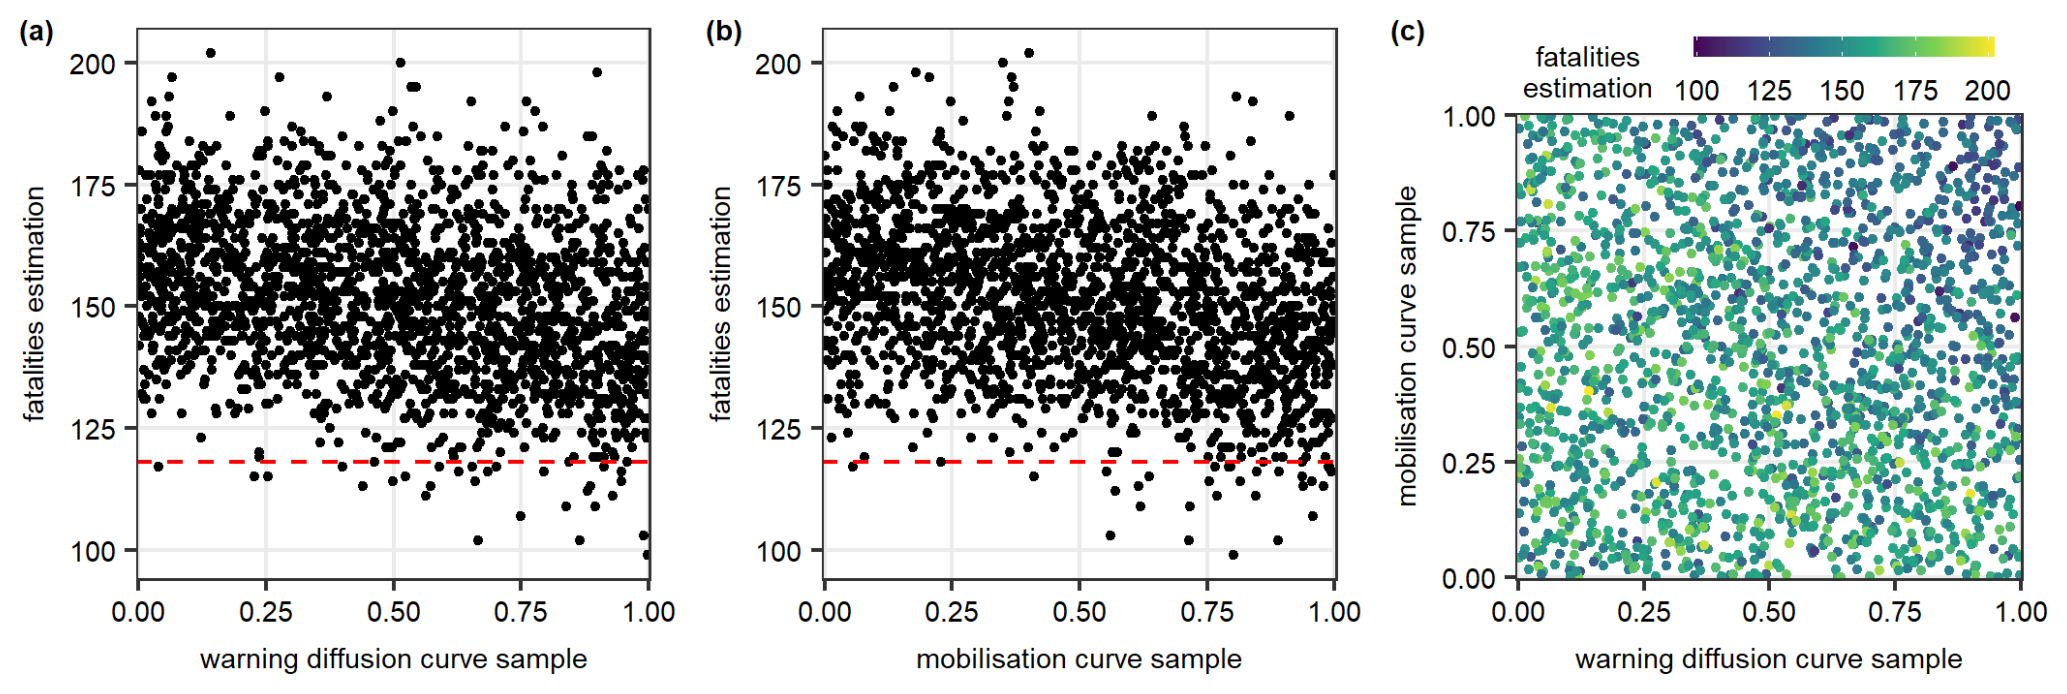
Figure 8Relation between estimated fatalities and (a) warning diffusion, (b) mobilisation, and (c) both processes' curve samples for the 2021 Ahr Valley flood. Points near 0.00 indicate slower warning dissemination and initiation of evacuation, while points near 1.00 indicate a faster response.
The reported indoor fatalities were 48 (59 %), 15 (19 %), 10 (12 %), 6 (7 %), and 2 (3 %) for the local administrative units (LAUs) of Bad Neuenahr-Ahrweiler, Sinzig, Dernau, Altenahr, and Mayschoss, respectively (Rhein and Kreibich, 2025). The mean of the simulations is 59 (57 %), 0 (0 %), 16 (15 %), 11 (11 %), and 15 (14 %) for the same places, with 3 (3 %) more fatalities in Rech. For Bad Neuenahr-Ahrweiler, the model represents the proportion of fatalities. However, it overestimates fatalities for upstream LAUs and underestimates them for Sinzig. This discrepancy may be attributed to the generalisation of the warning and evacuation procedures across the entire modelling domain. During the simulation, the cumulative sampling of the population warned and mobilised is randomly distributed among the buildings within this domain. This likely results in some people being warned later than in the actual event in upstream regions and earlier than in the actual event in downstream regions, thus failing to represent the actual spatial and temporal distribution of the population that began evacuation. Figure 9 depicts the spatial distribution of the mean estimated fatalities, aggregated at a 500 m grid resolution.
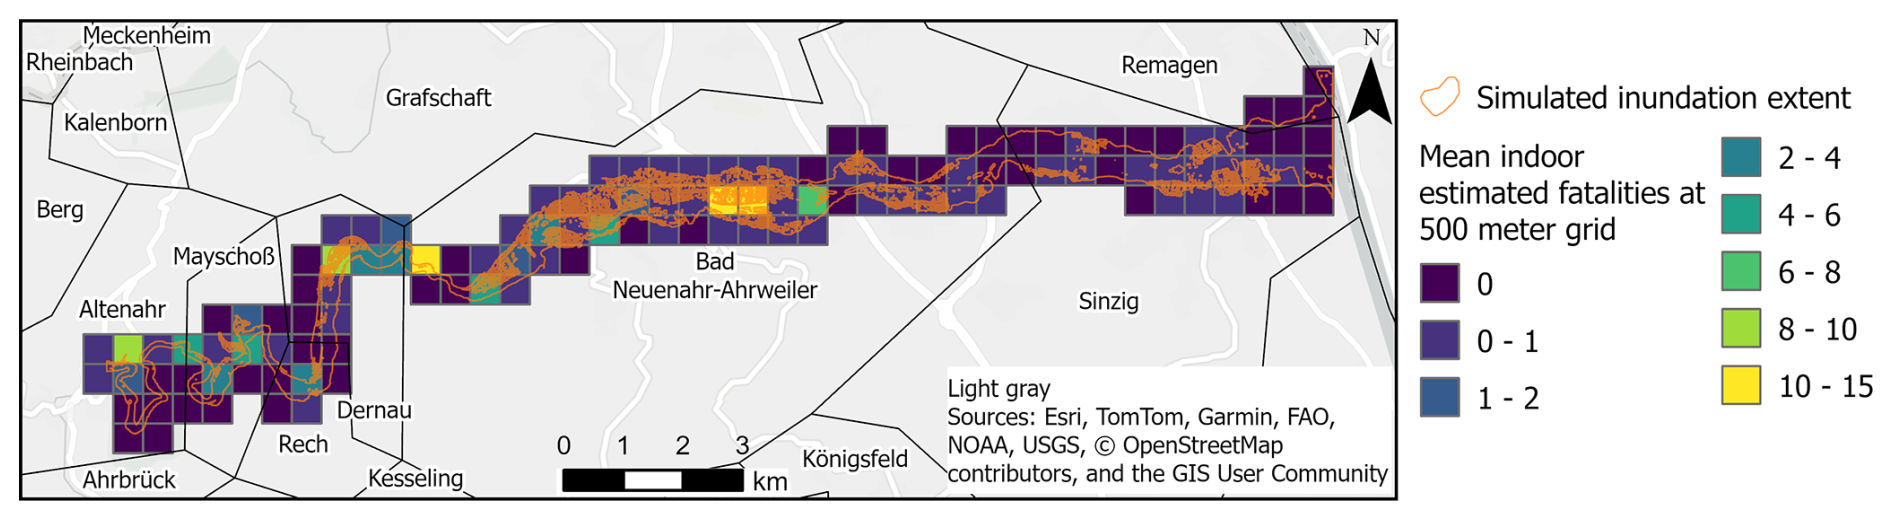
Figure 9Mean of indoor estimated fatalities for the 2021 Ahr Valley flood at a 500 m grid resolution. Data source – German local administrative units, GeoBasic DE/BKG (2023); 500 m grid resolution, GeoGitter GeoBasis-DE/BKG (2020).
3.2 Life loss estimation of alternative scenarios with improved early warning and evacuation
The reconstructed warning and mobilisation curves indicate a greater delay compared to the alternative scenarios (Fig. 7). Despite the rapid-onset nature of the flood, the reconstructed warning diffusion curve exhibits a trend similar to that of a slow-onset event. Approximately 80 % of the population is warned between 9 and 15 h after the first alert (Fig. 6a), mirroring patterns observed in slow-onset hazard events such as hurricanes Katrina (2005) and Rita (2005) and the Boston water contamination event (2010) (Lindell et al., 2021). In contrast, in the recommendation curves in LifeSim, which are based on historical cases, the warning diffusion times range from 15 min for the fastest ones to 3 h for the slower ones for the same rate (USACE, 2020). For the mobilisation time, the only comparable event in the LifeSim database is the 1987 Pittsburgh (USA) hazardous material flow event, which is the worst case of protective action times, where about 40 % of the population took protective action approximately 5 h after becoming aware of the hazard (USACE, 2020).
Figure 10 illustrates outcomes from the LifeSim model concerning the initial approach to evaluating alternative scenarios, specifically examining the impacts of warning diffusion and mobilisation curves. The optimal (A1.2), intermediate (A1.2), and suboptimal (A1.3) scenarios show significantly lower reductions in life loss (p<0.001), indicating that the actual scenario (RFEWE) fares worse than theoretical scenarios. Simulation uncertainties range from 22 to 39, 54 to 74, and 85 to 111 fatalities, representing the interquartile range across these scenarios. Among these scenarios, A1.3, with a median of 98 fatalities, is the closest to the approximate compared to RFEWE. However, the distribution of fatalities within buildings and during evacuation does not mirror the actual event, where 68.5 % of fatalities occurred indoors.
The most critical scenario in terms of estimated fatalities, A1.4, incorporates empirical warning dissemination and a poor preparedness and unlikely perception mobilisation curve. While fatalities within buildings are comparable to RFEWE (86–103 versus 98–112 for the interquartile range), fatalities during evacuation are significantly higher, ranging from 83 to 105, more than double the values of 39 to 54 for RFEWE. Since most individuals became aware shortly before the hazard occurred with empirical warning diffusion, an optimal mobilisation strategy could potentially worsen the situation by increasing the number of people outside buildings when the flood reaches them.
Scenario A1.5 employs a slower theoretical warning diffusion curve in conjunction with empirical mobilisation, highlighting the deficiencies in warning dissemination observed during the 2021 flood. The worst theoretical dissemination curve reduces the interquartile estimated fatality range of 78 to 95. This reduction is primarily due to a higher rate of the population initiating evacuation promptly after the first warning compared to scenarios RFEWE and A1.4. As shown in Fig. 7, approximately 34 % of the population mobilises within 8 h when considering all possible samplings in the warning and evacuation simulation.
Scenario A1.6 examines a strategy where the population moves to the highest building floors instead of evacuating outside. This approach has an interquartile estimated fatality range of 111 to 133 for the first and third quartiles, exclusively indoors. The findings suggest that for individuals who receive a warning or become aware of the hazard shortly before its occurrence, seeking safety within their buildings is more advantageous than attempting an outside evacuation.
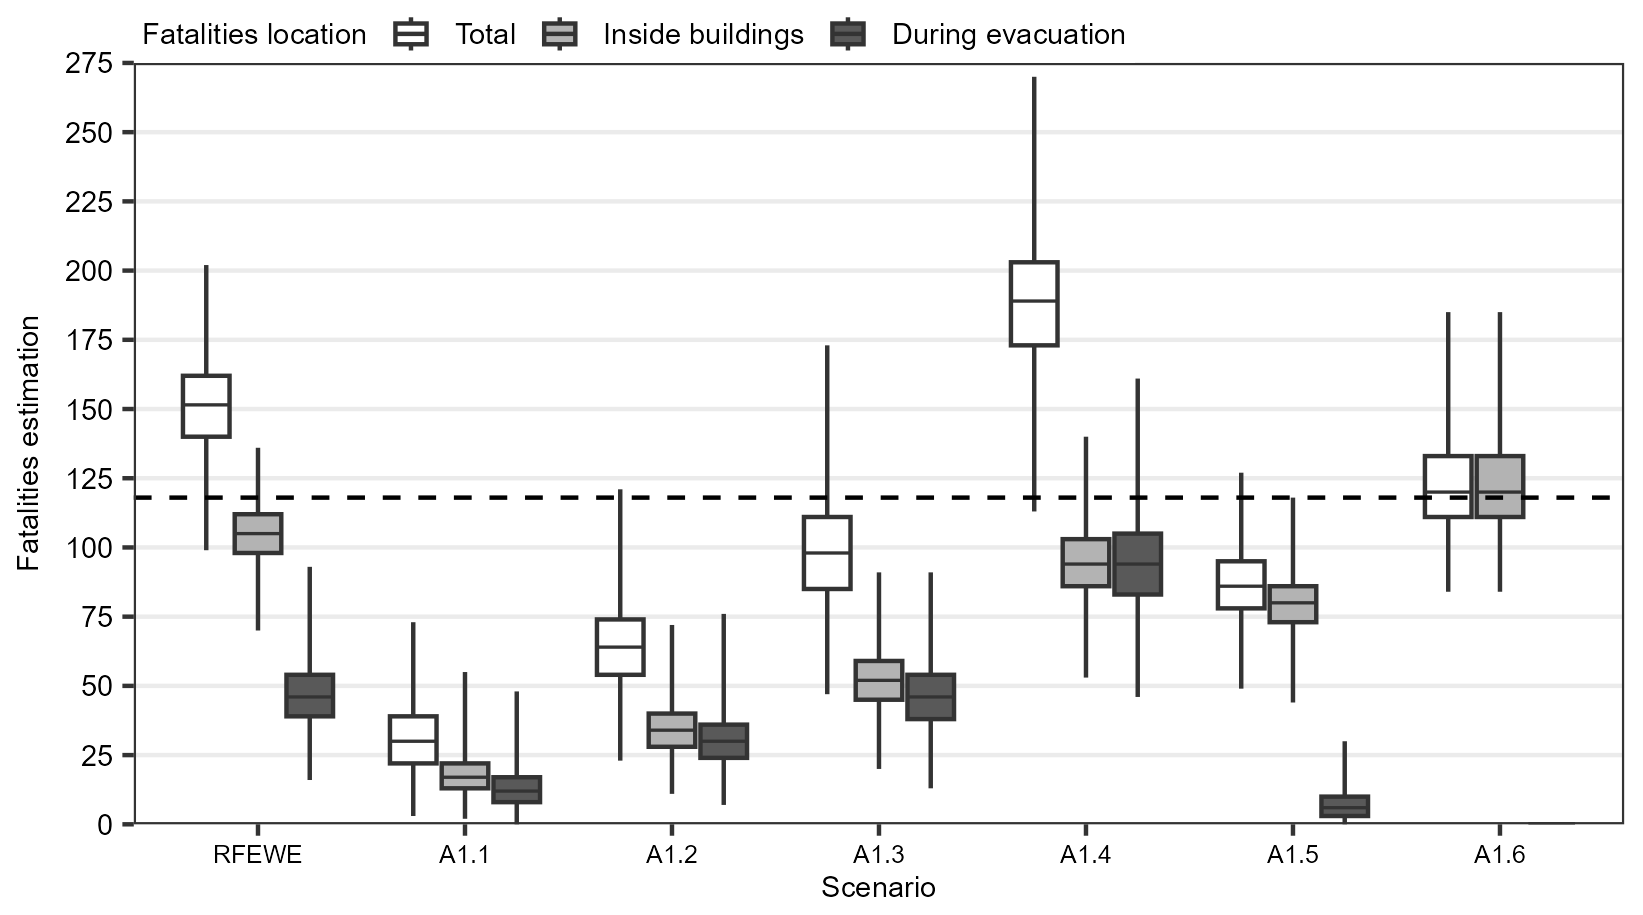
Figure 10Estimated fatalities for the alternative early warning and evacuation scenarios, with a focus on evaluating the warning diffusion and mobilisation curves. RFEWE (reconstructed scenario of the 2021 flood), A1.1 (optimal scenario), A1.2 (intermediate scenario), A1.3 (suboptimal scenario), A1.4 (suboptimal scenario with an empirical warning diffusion curve), A1.5 (suboptimal scenario with an empirical mobilisation curve), and A1.6 (scenario without outside evacuation).
Figure 11 presents estimations of potential loss of life relative to the time preceding the water level peak at the Altenahr gauge, which occurred at 01:00 CEST on 15 July, marking the issuance of the first flood warning based on forecasting capabilities. The colours indicate the statistical significance level of differences in estimated fatalities, aggregated by hour, between hourly intervals and their anticipated hour range. Concurrently, at the same warning issuance time, uncertainties within the LifeSim approach, such as the warning diffusion and mobilisation curves; probabilistic fatality rates; and structural stability criteria for buildings, vehicles, and individuals, may contribute to variations in the estimated fatality range.
In scenario A2.1, characterised by optimal warning diffusion and mobilisation, the interquartile range of fatalities decreases from 40–74 to 18–32 during the 8–9 h and 16–17 h intervals before 01:00 CEST on 15 July. The analysis identifies a slight statistically significant difference () between the 13–14 h and 14–15 h intervals, with an interquartile range of 19–35 fatalities. This is followed by two other slightly significant differences between the earlier intervals. These findings suggest that issuing a warning at least 13 h in advance is likely optimal for reducing fatalities. However, issuing warnings as early as possible appears crucial for effectiveness, as a non-significant level of statistical difference (p>0.05) is not observed in the comparisons between the hour ranges.
In scenario A2.2, characterised by suboptimal warning diffusion and mobilisation, fatalities decrease from an interquartile range of 138–174 to 66–85 across the extreme hour ranges. This scenario exhibits a similar pattern to scenario A2.1, with a further reduction in the interquartile range to 74–95 during the 13–14 h interval. These results underscore the critical importance of issuing warnings as early as possible to mitigate the potential loss of life in this scenario effectively.
In the suboptimal scenario with the empirical mobilisation curve (A2.3), estimated fatalities decrease from an interquartile range of 102–128 to 39–82 across extreme hour ranges. Fatalities increase from the first extreme hour range to the 10–11 h interval, with an interquartile range of 103–147, indicating that warnings issued within this interval result in more people being trapped during evacuation. This outcome can be attributed to the combined effect of warning diffusion and mobilisation, the same as scenario A1.5 in Fig. 7, where the higher rise in the number of people on the streets occurs approximately 3 h after the warning is issued, coinciding with the peak of the flood. Following this interval, significant reductions in fatalities (p<0.001) are observed until stabilisation begins approximately 15 h before the flood peak, suggesting that this is an optimal time for issuing the first flood warning. This scenario underscores the inadequacy of warning dissemination during the 2021 event and its impact on the estimated consequences. Even for later warning issuance times and the same mobilisation behaviour, this scenario can result in lower estimated fatalities, with a median estimate of 115 fatalities, 24.3 % lower than the RFEWE scenario, when the warning is issued between 8–9 h before the peak.
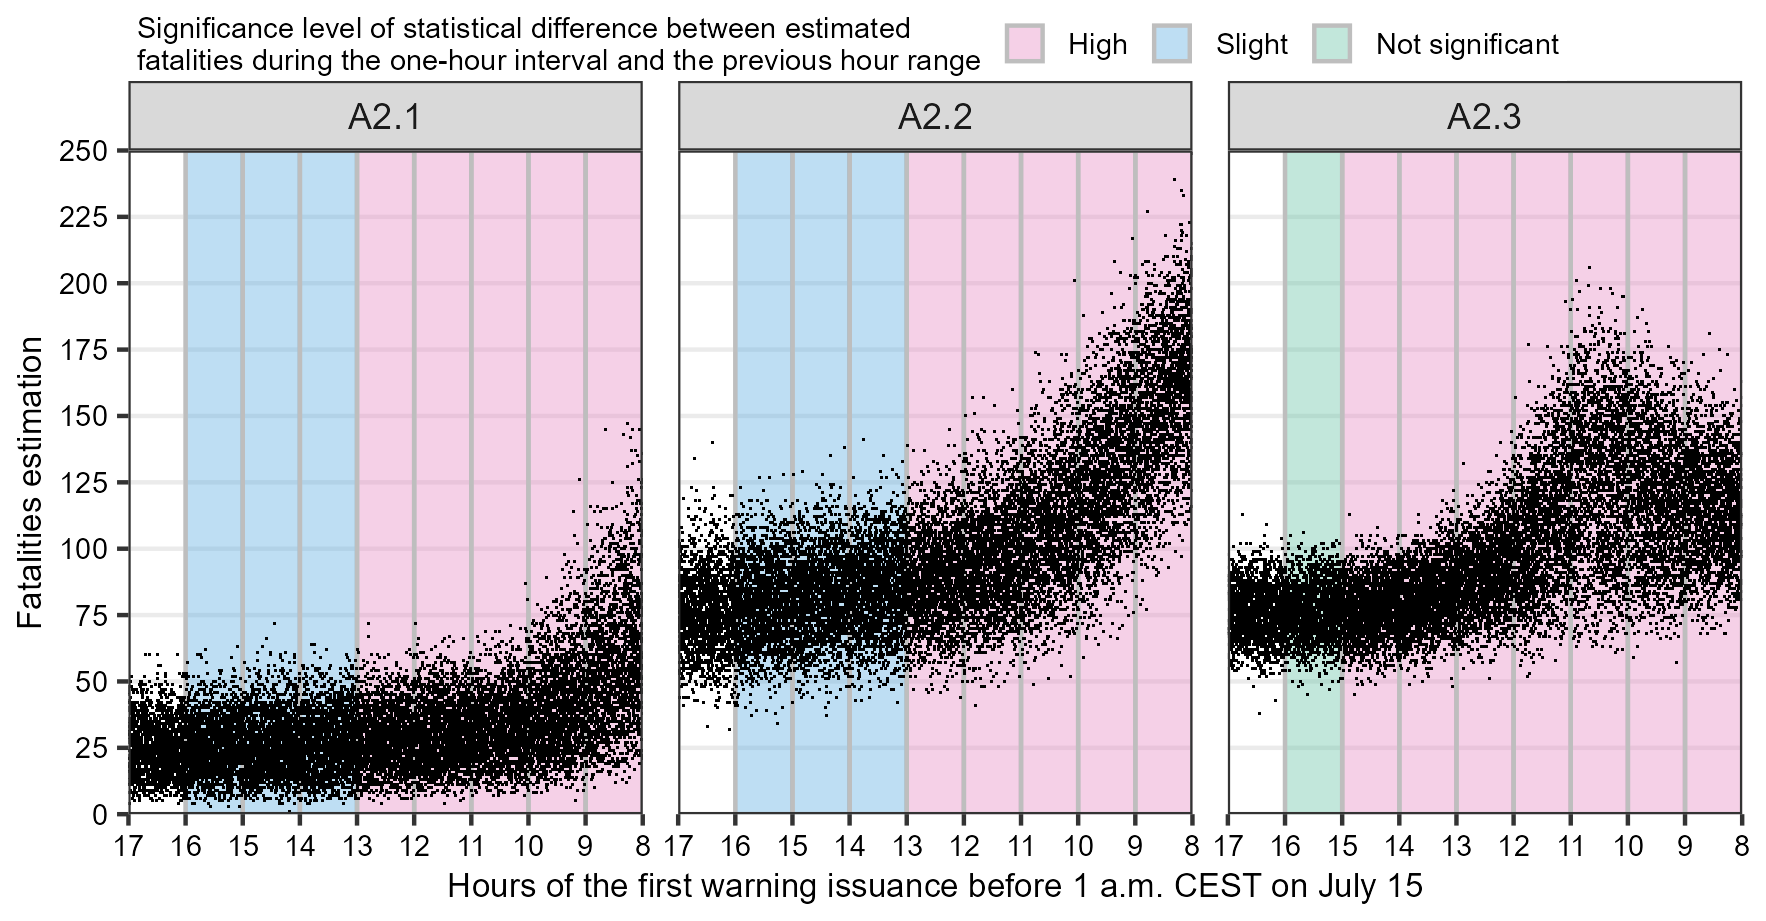
Figure 11Estimated fatalities for the alternative early warning and evacuation scenarios, with a focus on evaluating the time of the first flood warning, highlighting the significance level of the statistical difference between estimated fatalities during the 1 h interval and the previous hour range. A2.1 (optimal warning diffusion and mobilisation), A2.2 (suboptimal warning diffusion and mobilisation), and A2.3 (optimal warning diffusion and empirical mobilisation).
3.3 Discussion of limitations
The LifeSim approach utilises Monte Carlo simulation to address epistemic and aleatory uncertainties. However, when interpreting scenarios, analysing and considering other limitations and uncertainties related to specific inputs and model assumptions are essential.
Although the flood hazard simulation provided a reasonable representation of water depths, flow velocities, and maximum arrival times, even slight variations in the hydrodynamic model could lead to high sensitivity in LifeSim outcomes, depending on the case study. For instance, a test simulation adjusting the water depth time series by subtracting the bias value of 0.46 m from all pixels across all layers in the hydraulic simulation resulted in a reduced fatality estimate, with the median value decreasing to 126, i.e. 17 % lower than the reconstructed scenario. It is important to note that the reported water depths used to calculate the bias correspond to different vertical datums, including street level, pedestrian walkways, and doorsteps. Moreover, this test represents an extreme generalisation of the bias across the entire domain, preliminarily assessing the life loss model's sensitivity concerning the hydrodynamic simulation for this case study.
Furthermore, other uncertainties and factors could significantly influence life loss estimation. The hydraulic model does not account for bridges within the simulated domain, potentially altering flood characteristics due to possible clogging, particularly affecting nearby buildings, as observed during the actual flood event. Additionally, building footprints were excluded from the digital elevation model, turning it into a digital surface model to enhance urban flow simulation. For the loss of life estimation, the highest hazard of the adjacent pixels was chosen. This may introduce a bias towards higher fatalities. However, if this is the case, it has to be tested by an analysis using the lowest or mean hazard around the buildings.
The detailed information required for building elements in LifeSim results in numerous hypotheses, as obtaining such detailed data is often challenging. Upscaling 100 m resolution population data to buildings, weighted by building footprint size, can inaccurately associate a higher population with large areas that actually have a lower population capacity than smaller ones due to verticalisation. Moreover, specific occupancy patterns and individual characteristics are complex to represent using open data. For example, 12 of 15 fatalities in Sinzig were related to people in an inpatient residence, who were not able to leave the building by themselves. Additionally, some building footprints may pertain to commercial or other non-residential sectors, introducing further uncertainty since the population data used only account for residential individuals. The impact of this consideration is less significant during nighttime hazards compared to daytime scenarios when the population distribution varies based on the sectoral distribution of buildings. Furthermore, attributes such as the number of building floors are determined by the post-event survey, potentially lacking accurate representation due to non-representative sampling.
The lack of representative survey sampling can also impact the reconstruction of warning and evacuation processes. Additionally, the reconstruction of these curves for the 2021 Ahr Valley flood aimed to represent the time spent between the warning issuance and the initiation of proactive evacuation actions. Several filters were applied to the survey data to isolate responses related explicitly to evacuation, as the survey initially encompassed a broader context of mitigation measures. Notably, 83 % of respondents recognise the need for self-protection only at the moment of the hazard occurrence, which can impact comparative analysis with historical cases, given that the warning diffusion curve is not based on an official warning channel. The content of the warning and the perception of personal impacts significantly influence the mobilisation times (Lindell et al., 2020). The lack of detailed evacuation information, received by only 17.5 % of respondents, combined with 84 % being surprised by the flood, likely contributes to the low mobilisation rate. This rate might improve if the population received timely warnings and clear instructions, as 76 % of respondents stated they clearly understood what actions to take.
Even when applying a filter to the survey to account for people directly impacted by the main event in the simulated domain, generalising the warning and evacuation process in this domain can lead to overestimating fatalities in upstream regions. The generalisation is necessary due to the lack of precise building location data for survey respondents. The overestimation arises because there is a 2 to 3 h difference between the arrival time of the flood in upstream cities compared to downstream areas, and most people were warned only when the flood reached them. As a result, individuals in upstream regions may have taken earlier action than those in the model sampling.
Furthermore, alternative scenarios were developed to incorporate realistic elements into theoretical models and their parameterisation proposed by Sorensen and Mileti (2015b, c). However, most of the cases used to propose the parameterisation of these theoretical models are based on older events primarily focused on the context of the United States. Incorporating recent flood events from diverse locations could enhance the representation of realistic scenarios.
Concerning evacuation dynamics, summarising flood values using the midpoint could distort actual parameter values along roads, especially over extended road lengths. Additionally, LifeSim does not consider prior vehicle conditions on road networks, which could significantly impact the representation of traffic jams, particularly in high-density areas.
The agent-based model (ABM) LifeSim is used to evaluate the impact of warning system procedures on life loss estimates during the 2021 Ahr Valley flood. After defining the reconstruction scenario, we evaluated the impact of alternative scenarios for flood early warning and evacuation. The median of the probabilistic LifeSim model results overestimates actual fatalities by 28.8 % within the same simulated domain. Nonetheless, the output maintains a consistent proportion of indoor to outdoor fatalities. The distribution of fatalities along the Ahr Valley is overestimated in upstream regions and underestimated in downstream regions. This discrepancy is attributed mainly to generalising the early warning and evacuation processes within the simulated domain, which may lead to variations in evacuation start times across different regions compared to the actual event, particularly in these extreme domain areas.
The 2021 Ahr Valley flood warning diffusion had a significant delay and lower mobilisation rates in protective actions following the first flood warning issuance compared to the worst theoretical alternative scenarios. The median of estimated fatalities could be reduced by 80 % in an optimal theoretical scenario of warning diffusion and mobilisation (scenario A1.1 in Fig. 10). However, under the actual conditions of warning dissemination, where most of the population was either just warned or became aware when the flood reached them, higher mobilisation rates could result in increased fatalities. In such situations, seeking safe places on the upper floors of buildings is a more effective protective action, as in scenarios without outside evacuation, the median of estimated fatalities is lower than in the reconstructed scenario.
The early flood warning reported 13 h before the water level peak in the upstream domain appears to be the critical window to effectively reduce fatalities in scenarios with theoretical warning dissemination and evacuation. Thus, the existing flood warning system provides information in due time. The problem is rather the information content (spatially distributed water depth forecasts are missing), warning dissemination, and the reaction of the population to the warnings. The presented simulation of early flood warning times underscores the significant impact of the actual poor dissemination during the 2021 event. Even with later warning issuance times, if accompanied by better warning diffusion and the same mobilisation behaviour as observed in the actual event, fatalities could be reduced by 24.3 % (scenario A2.3 in Fig. 11).
Using life loss ABMs in flood risk assessments can enhance the evaluation of flood hazards and the effectiveness of warning systems. Dynamic simulations over time and space offer valuable insights into optimal intervention timings and critical regions for implementing mitigation measures. The LifeSim model can incorporate both epistemic and random uncertainties, resulting in probabilistic rather than deterministic outcomes. However, several critical aspects of uncertainty must be acknowledged. Efforts are recommended to better represent the variations in warning diffusion and evacuation responses in the specific case study, with benefits incorporating the different responses across various impacted zones. Additionally, ABMs require high-resolution data, which can be challenging to obtain accurately. Comparing these models with empirical ones could enhance the understanding of their differences, as empirical models can be deployed more swiftly, offering faster outcomes in forecasting and nowcasting scenarios.
The LifeSim model is available on the Risk Management Center website of the Institute for Water Resources, which is part of the United States Army Corps of Engineers (https://www.rmc.usace.army.mil/Software/LifeSim/, US Army Corps of Engineers, 2024). RIM2D is available for non-commercial use at https://git.gfz-potsdam.de/hydro/rfm/rim2d (Apel, 2024) under the European Union Public Licence v1.2. Permission to access the repository can be granted upon request to heiko.apel@gfz-potsdam.de.
RIM2D data, including the time series of water depth and flow velocities, are available upon reasonable request to the corresponding author. The Mundialis 2020 land cover dataset can be accessed at https://www.mundialis.de/en/germany-2020-land-cover-based-on-sentinel-2-data/ (Mundialis, 2021). The OpenStreetMap road network and building data are available from © OpenStreetMap contributors 2021, distributed under the Open Data Commons Open Database License (ODbL) v1.0. HANZE 2.0.3 data can be accessed at https://doi.org/10.5281/zenodo.7885990 (Paprotny, 2023). Results from the 2011 German census at a 1 km grid level are available at https://www.zensus2022.de/EN/What-is-the-census/grid_cells_results_2011.html (Statistische Ämter des Bundes und der Länder, 2024a), and detailed tables can be found at https://ergebnisse.zensus2022.de/datenbank/online/statistic/1000X/details (Statistische Ämter des Bundes und der Länder, 2024b). Survey data are available upon reasonable request to the Geography and Disaster Risk Research lab, University of Potsdam.
The supplement related to this article is available online at https://doi.org/10.5194/nhess-25-1501-2025-supplement.
AFRS established the Ahr Valley LifeSim model, conducted the analysis, and drafted the paper. JCE and HK supervised the research, contributed to writing, and revised the paper. HA established the Ahr Valley RIM2D model, conducted the hydraulic simulations, contributed to writing, and revised the paper.
At least one of the (co-)authors is a member of the editorial board of Natural Hazards and Earth System Sciences. The peer-review process was guided by an independent editor, and the authors also have no other competing interests to declare.
Publisher's note: Copernicus Publications remains neutral with regard to jurisdictional claims made in the text, published maps, institutional affiliations, or any other geographical representation in this paper. While Copernicus Publications makes every effort to include appropriate place names, the final responsibility lies with the authors.
The authors would like to acknowledge the United States Army Corps of Engineers for providing the reports related to the warning and evacuation parameterisation of the LifeSim model and Landesumweltamt Rhineland-Palatinate for providing the reported water depth marks. We thank the public prosecutor's office in Koblenz, Rhineland-Palatinate, Germany, for allowing us to analyse the death investigation files related to the 2021 flood in anonymised form.
This study was financed in part by the Coordenação de Aperfeiçoamento de Pessoal de Nível Superior (CAPES), Brazil, under finance code 001. The flood hazard modelling has been undertaken within the BMBF-funded KAHR project (grant no. FKZ 01LR2102F). Collection of the 2021 survey data was undertaken by the Geography and Disaster Risk Research lab, University of Potsdam, within the KAHR project, funded by the BMBF (contract no. 01LR2102I). Analyses of the flood fatality data were undertaken within the KAHR and AVOSS projects (grant no. FKZ 01LR2102F, grant no. FKZ 02WEE1629C).
OR
This research has been supported by the Coordenação de Aperfeiçoamento de Pessoal de Nível Superior (grant no. 001) and the Bundesministerium für Bildung und Forschung (grant nos. 01LR2102F, 01LR2102I, and 02WEE1629C).
The article processing charges for this open-access publication were covered by the GFZ Helmholtz Centre for Geosciences.
This paper was edited by Olga Petrucci and reviewed by two anonymous referees.
Aboelata, M., Bowles, D. S., and McClelland, D. M.: A model for estimating dam failure life loss, in: Australian Committee on Large Dams Risk Workshop, 18, https://doi.org/10.1061/40694(2003)11, 2003.
Aerts, J. C. J. H., Botzen, W. J., Clarke, K. C., Cutter, S. L., Hall, J. W., Merz, B., Michel-Kerjan, E., Mysiak, J., Surminski, S., and Kunreuther, H.: Integrating human behaviour dynamics into flood disaster risk assessment, Nat. Clim. Chang., 8, 193–199, https://doi.org/10.1038/s41558-018-0085-1, 2018.
Anshuka, A., van Ogtrop, F. F., Sanderson, D., and Leao, S. Z.: A systematic review of agent-based model for flood risk management and assessment using the ODD protocol, Nat. Hazards, 112, 2739–2771, https://doi.org/10.1007/s11069-022-05286-y, 2022.
Apel, H.: RIM2D, GitLab, https://git.gfz-potsdam.de/hydro/rfm/rim2d (last access: 26 September 2024), 2024.
Apel, H., Vorogushyn, S., and Merz, B.: Brief communication: Impact forecasting could substantially improve the emergency management of deadly floods: case study July 2021 floods in Germany, Nat. Hazards Earth Syst. Sci., 22, 3005–3014, https://doi.org/10.5194/nhess-22-3005-2022, 2022.
Berghäuser, L., Bubeck, P., Hudson, P., and Thieken, A. H.: Identifying and characterising individual flood precautionary behaviour dynamics from panel data, Int. J. Disast. Risk Re., 94, 103835, https://doi.org/10.1016/j.ijdrr.2023.103835, 2023.
Boyd, E., Levitan, M., and van Heerden, I.: Improvements in Flood Fatality Estimation Techniques Based on Flood Depths, in: Wind Storm and Storm Surge Mitigation, edited by: Uddin, N., American Society of Civil Engineers, Reston, Virginia, USA, 126–139, https://doi.org/10.1061/9780784410813.ch11, 2010.
Brazdova, M. and Riha, J.: A simple model for the estimation of the number of fatalities due to floods in central Europe, Nat. Hazards Earth Syst. Sci., 14, 1663–1676, https://doi.org/10.5194/nhess-14-1663-2014, 2014.
Brown, C. A. and Graham, W. J.: Assessing the threat to life from dam failure 1, JAWRA J. Ame. Water Resour. As., 24, 1303–1309, 1988.
Brussee, A. R., Bricker, J. D., De Bruijn, K. M., Verhoeven, G. F., Winsemius, H. C., and Jonkman, S. N.: Impact of hydraulic model resolution and loss of life model modification on flood fatality risk estimation: Case study of the Bommelerwaard, The Netherlands, J. Flood Risk Manag., 14, 1–15, https://doi.org/10.1111/jfr3.12713, 2021.
Bryant, S., Kreibich, H., and Merz, B.: Bias in Flood Hazard Grid Aggregation, Water Resour. Res., 59, e2023WR03510, https://doi.org/10.1029/2023WR035100, 2023.
Chen, C., Koll, C., Wang, H., and Lindell, M. K.: An interdisciplinary agent-based evacuation model: integrating the natural environment, built environment, and social system for community preparedness and resilience, Nat. Hazards Earth Syst. Sci., 23, 733–749, https://doi.org/10.5194/nhess-23-733-2023, 2023.
Clausen, L. and Clark, P. B.: The development of criteria for predicting dambreak flood damages using modelling of historical dam failures, in: International conference on river flood hydraulics, 369–380, https://openlibrary.org/books/OL1859534M/International_Conference_on_River_Flood_Hydraulics (last access: 26 September 2024), 1990.
CRED and UNISDR: Economic Losses, Poverty and Disasters 1998–2017, 33 pp., https://doi.org/10.13140/RG.2.2.35610.08643, 2018.
DeKay, M. L. and McClelland, G. H.: Predicting Loss of Life in Cases of Dam Failure and Flash Flood, Risk Anal., 13, 193–205, https://doi.org/10.1111/j.1539-6924.1993.tb01069.x, 1993.
Dijkstra, E. W.: A Note on Two Problems in Connexion with Graphs, Numer. Math., 1, 269–271, https://doi.org/10.1007/BF01386390, 1959.
Di Mauro, M., De Bruijn, K. M., and Meloni, M.: Quantitative methods for estimating flood fatalities: towards the introduction of loss-of-life estimation in the assessment of flood risk, Nat. Hazards, 63, 1083–1113, https://doi.org/10.1007/s11069-012-0207-4, 2012.
DKKV: Opfer- und Schadensdaten der Flut 2021 in Rheinland-Pfalz, Bonn, Germany, 4 pp., https://dkkv.org/wp-content/uploads/2023/02/Anfrage_Opfer-_und_Schadensdaten_der_Flut_2021.pdf (last access: 26 September 2024), 2022.
Dunn, O. J.: Multiple comparisons using rank sums, Technometrics, 6, 241–252, https://doi.org/10.1080/00401706.1964.10490181, 1964.
El Bilali, A., Taleb, A., and Boutahri, I.: Application of HEC-RAS and HEC-LifeSim models for flood risk assessment, J. Appl. Water Eng. Res., 9, 336–351, https://doi.org/10.1080/23249676.2021.1908183, 2021.
El Bilali, A., Taleb, I., Nafii, A., and Taleb, A.: A practical probabilistic approach for simulating life loss in an urban area associated with a dam-break flood, Int. J. Disast. Risk Re., 76, 103011, https://doi.org/10.1016/j.ijdrr.2022.103011, 2022.
Ge, W., Wang, X., Li, Z., Zhang, H., Guo, X., Wang, T., Gao, W., Lin, C., and van Gelder, P.: Interval Analysis of the Loss of Life Caused by Dam Failure, J. Water Resour. Plan Manag., 147, 04020098, https://doi.org/10.1061/(asce)wr.1943-5452.0001311, 2021.
Ge, W., Jiao, Y., Wu, M., Li, Z., Wang, T., Li, W., Zhang, Y., Gao, W., and van Gelder, P.: Estimating loss of life caused by dam breaches based on the simulation of floods routing and evacuation potential of population at risk, J. Hydrol. (Amst), 612, 128059, https://doi.org/10.1016/j.jhydrol.2022.128059, 2022.
Khosh Bin Ghomash, S., Apel, H., and Caviedes-Voullième, D.: Are 2D shallow-water solvers fast enough for early flood warning? A comparative assessment on the 2021 Ahr valley flood event, Nat. Hazards Earth Syst. Sci., 24, 2857–2874, https://doi.org/10.5194/nhess-24-2857-2024, 2024.
Graham, W.: A Procedure for Estimating Loss of Life Caused by Dam Failure. DSO-99-06, Sedimentation & River Hydraulics, Denver, Colorado, 1–43 pp., https://www.usbr.gov/ssle/damsafety/TechDev/DSOTechDev/DSO-99-06.pdf (last access: 26 September 2024), 1999.
He, C., Yang, C.-J., Turowski, J. M., Ott, R. F., Braun, J., Tang, H., Ghantous, S., Yuan, X., and Stucky de Quay, G.: A global dataset of the shape of drainage systems, Earth Syst. Sci. Data, 16, 1151–1166, https://doi.org/10.5194/essd-16-1151-2024, 2024.
Jiao, H., Li, W., and Ma, D.: Assessment of life loss due to dam breach using improved variable fuzzy method, Sci. Rep., 12, 1–7, https://doi.org/10.1038/s41598-022-07136-0, 2022.
Johnstone, W. M., Sakamoto, D., Assaf, H., and Bourban, S.: Architecture, modelling framework and validation of BC hydro's virtual reality life safety model, in: International Symposium on Stochastic Hydraulics, 87–89 pp., https://edepot.wur.nl/95173#page=87 (last access: 26 September 2024), 2005.
Jongejan, R. B., Jonkman, S. N., and Vrijling, J. K.: Methods for the economic valuation of loss of life, in: Conference on International Law and Management of Large-Scale Risks, 1–8, 2005.
Jonkman, S. N. and Vrijling, J. K.: Loss of life due to floods, J. Flood Risk Manag., 1, 43–56, https://doi.org/10.1111/j.1753-318x.2008.00006.x, 2008.
Jonkman, S. N., Van Gelder, P. H. A. J. M., and Vrijling, J. K.: An overview of quantitative risk measures for loss of life and economic damage, J. Hazard Mater., 99, 1–30, https://doi.org/10.1016/S0304-3894(02)00283-2, 2003.
Jonkman, S. N., Vrijling, J. K., and Vrouwenvelder, A. C. W. M.: Methods for the estimation of loss of life due to floods: a literature review and a proposal for a new method, Nat. Hazards, 46, 353–389, https://doi.org/10.1007/s11069-008-9227-5, 2008.
Jonkman, S. N., Maaskant, B., Boyd, E., and Levitan, M. L.: Loss of life caused by the flooding of New Orleans after hurricane Katrina: Analysis of the relationship between flood characteristics and mortality, Risk Anal., 29, 676–698, https://doi.org/10.1111/j.1539-6924.2008.01190.x, 2009.
Kalinina, A., Spada, M., and Burgherr, P.: Quantitative Assessment of Uncertainties and Sensitivities in the Estimation of Life Loss Due to the Instantaneous Break of a Hypothetical Dam in Switzerland, Water (Basel), 13, 22, https://doi.org/10.3390/w13233414, 2021.
Kienzler, S., Pech, I., Kreibich, H., Müller, M., and Thieken, A. H.: After the extreme flood in 2002: changes in preparedness, response and recovery of flood-affected residents in Germany between 2005 and 2011, Nat. Hazards Earth Syst. Sci., 15, 505–526, https://doi.org/10.5194/nhess-15-505-2015, 2015.
Kreibich, H., Hudson, P., and Merz, B.: Knowing what to do substantially improves the effectiveness of flood early warning, B. Am. Meteorol. Soc., 102, E1450–E1463, https://doi.org/10.1175/BAMS-D-20-0262.1, 2021.
Kron, W., Bell, R., Thiebes, B., and Thieken, A. H.: The July 2021 flood disaster in Germany, in: HELP Global Report on Water and Disasters 2022, Secretariat of the High-level Experts and Leaders Panel on Water and Disasters (HELP), 12–44 pp., https://www.wateranddisaster.org/cms310261/wp-content/uploads/2022/11/HELP-Global-Report-2022.pdf (last access: 26 September 2024), 2022.
Kruskal, W. H. and Wallis, W. A.: Use of ranks in one-criterion variance analysis, J. Am. Stat. Assoc., 47, 583–621, https://doi.org/10.1080/01621459.1952.10483441, 1952.
Kuller, M., Schoenholzer, K., and Lienert, J.: Creating effective flood warnings: A framework from a critical review, J. Hydrol. (Amst), 602, 126708, https://doi.org/10.1016/j.jhydrol.2021.126708, 2021.
Lindell, M. K., Sorensen, J. H., Baker, E. J., and Lehman, W. P.: Community response to hurricane threat: Estimates of household evacuation preparation time distributions, Transp. Res. D Transp. Environ., 85, https://doi.org/10.1016/j.trd.2020.102457, 2020.
Lindell, M. K., Sorensen, J. H., Earl, J. B., and Lehman, W. P.: Community Response to Hurricane Threat: Estimates of Warning Diffusion Time Distributions, Nat. Hazards Rev., 22, 0402100, https://doi.org/10.1061/(ASCE)NH.1527, 2021.
Lumbroso, D. and Davison, M.: Use of an agent-based model and Monte Carlo analysis to estimate the effectiveness of emergency management interventions to reduce loss of life during extreme floods, J. Flood Risk Manag., 11, S419–S433, https://doi.org/10.1111/jfr3.12230, 2018.
Lumbroso, D., Davison, M., Body, R., and Petkovšek, G.: Modelling the Brumadinho tailings dam failure, the subsequent loss of life and how it could have been reduced, Nat. Hazards Earth Syst. Sci., 21, 21–37, https://doi.org/10.5194/nhess-21-21-2021, 2021.
Lumbroso, D., Davison, M., and Wetton, M.: Development of an agent-based model to improve emergency planning for floods and dam failures, J. Hydroinfo., 25, 1610–1628, https://doi.org/10.2166/hydro.2023.194, 2023.
Mahmassani, H. S., Dong, J., Kim, J., Chen, R. B., and Park, B.: Incorporating weather impacts in traffic estimation and prediction systems, FHWA-JPO-09-065, EDL 14497, Washington, DC 20590, 108 pp., https://transportation.northwestern.edu/docs/research/core-topics/transportation-operations/Mahmassani_IncorporatingWeather.pdf (last access: 26 September 2024), 2009.
Mahmoud, A. A., Wang, J. T., and Jin, F.: An improved method for estimating life losses from dam failure in China, Stoch. Env. Res. Risk A., 34, 1263–1279, https://doi.org/10.1007/s00477-020-01820-1, 2020.
Mann, H. B. and Whitney, D. R.: On a test of whether one of two random variables is stochastically larger than the other, The Ann. Mathe. Stat., 18, 50–60, https://doi.org/10.1214/aoms/117773049, 1947.
Merz, B., Kreibich, H., Schwarze, R., and Thieken, A.: Review article ”Assessment of economic flood damage”, Nat. Hazards Earth Syst. Sci., 10, 1697–1724, https://doi.org/10.5194/nhess-10-1697-2010, 2010.
Mundialis: Germany 2020 – Land cover based on Sentinel-2 data, mundialis [data set], https://www.mundialis.de/en/germany-2020-land-cover-based-on-sentinel-2-data/ (last access: 26 September 2024), 2021.
Najafi, H., Shrestha, P. K., Rakovec, O., Apel, H., Vorogushyn, S., Kumar, R., Thober, S., Merz, B., and Samaniego, L.: High-resolution impact-based early warning system for riverine flooding, Nat. Commun., 15, 3726, https://doi.org/10.1038/s41467-024-48065-y, 2024.
Needham, J., Fields, W., and Lehman, W.: The US Army Corps of Engineers Scalable Approach to Estimating Loss of Life from Flooding, in: III European Conference on Flood Risk Management, 6, https://doi.org/10.1051/e3sconf/20160706003, 2016.
Papagiannaki, K., Petrucci, O., Diakakis, M., Kotroni, V., Aceto, L., Bianchi, C., Brázdil, R., Gelabert, M. G., Inbar, M., Kahraman, A., Kılıç, Ö., Krahn, A., Kreibich, H., Llasat, M. C., Llasat-Botija, M., Macdonald, N., de Brito, M. M., Mercuri, M., Pereira, S., Řehoř, J., Geli, J. R., Salvati, P., Vinet, F., and Zêzere, J. L.: Developing a large-scale dataset of flood fatalities for territories in the Euro-Mediterranean region, FFEM-DB, Sci. Data, 9, 166, https://doi.org/10.1038/s41597-022-01273-x, 2022.
Paprotny, D.: Pan-European exposure maps and uncertainty estimates from HANZE v2.0 model, 1870–2020, Zenodo [data set], https://doi.org/10.5281/zenodo.7885990, May 2023.
Paprotny, D. and Mengel, M.: Population, land use and economic exposure estimates for Europe at 100 m resolution from 1870 to 2020, Sci. Data, 10, 372, https://doi.org/10.1038/s41597-023-02282-0, 2023.
Peng, M. and Zhang, L. M.: Analysis of human risks due to dam-break floods – part 1: a new model based on Bayesian networks, Nat. Hazards, 64, 903–933, https://doi.org/10.1007/s11069-012-0275-5, 2012.
Penning-Rowsell, E., Floyd, P., Ramsbottom, D., and Surendran, S.: Estimating Injury and Loss of Life in Floods: A Deterministic Framework, Nat. Hazards, 36, 43–64, https://doi.org/10.1007/s11069-004-4538-7, 2005.
Petrucci, O.: Review article: Factors leading to the occurrence of flood fatalities: a systematic review of research papers published between 2010 and 2020, Nat. Hazards Earth Syst. Sci., 22, 71–83, https://doi.org/10.5194/nhess-22-71-2022, 2022.
Rhein, B. and Kreibich, H.: Causes of the exceptionally high number of fatalities in the Ahr valley, Germany, during the 2021 flood, Nat. Hazards Earth Syst. Sci., 25, 581–589, https://doi.org/10.5194/nhess-25-581-2025, 2025.
Riembauer, G., Weinmann, A., Xu, S., Eichfuss, S., Eberz, C., and Neteler, M.: Germany-wide Sentinel-2 based land cover classification and change detection for settlement and infrastructure monitoring, in: Conference on Big Data from Space, 53–56, https://doi.org/10.2760/125905, 2021.
Shand, T. D., Smith, G. P., Cox, R. J., and Blacka, M.: Development of appropriate criteria for the safety and stability of persons and vehicles in floods, in: 34th IAHR Congress 2011 - Balance and Uncertainty: Water in a Changing World, Incorporating the 33rd Hydrology and Water Resources Symposium and the 10th Conference on Hydraulics in Water Engineering, 404–412, https://www.iahr.org/library/infor?pid=25124 (last access: 26 September 2024), 2011.
Shirvani, M. and Kesserwani, G.: Flood–pedestrian simulator for modelling human response dynamics during flood-induced evacuation: Hillsborough stadium case study, Nat. Hazards Earth Syst. Sci., 21, 3175–3198, https://doi.org/10.5194/nhess-21-3175-2021, 2021.
Silva, A. F. R. and Eleutério, J. C.: Analysis of flood warning and evacuation efficiency by comparing damage and life-loss estimates with real consequences related to the São Francisco tailings dam failure in Brazil, Nat. Hazards Earth Syst. Sci., 23, 3095–3110, https://doi.org/10.5194/nhess-23-3095-2023, 2023a.
Silva, A. F. R. and Eleutério, J. C.: Effectiveness of a Dam-Breach Flood Alert in Mitigating Life Losses: A Spatiotemporal Sectorisation Analysis in a High-Density Urban Area in Brazil, Water (Basel), 15, 3433, https://doi.org/10.3390/w15193433, 2023b.
Singh, A., Guntu, R. K., Sairam, N., Shahi, K. R., Buch, A., Fischer, M., Dhanya, C. T., and Kreibich, H.: FLEMOflash – Flood Loss Estimation MOdels for companies and households affected by flash floods, EGUsphere [preprint], https://doi.org/10.5194/egusphere-2025-1512, 2025.
Smith, G., Modra, B., Tucker, T., Cox, R., and Felder, S.: Vehicle stability testing for flood flows, Report No. WRL TR2017/07, Sydney, 53 pp., https://doi.org/10.26190/unsworks/27416, 2017.
Sorensen, J. H. and Mileti, D. S.: First Alert and/or Warning Issuance Time Estimation for Dam Breaches, Controlled Dam Releases, and Levee Breaches or Overtopping, Lakewood, Colorado, 1–48 pp., 2015a.
Sorensen, J. H. and Mileti, D. S.: First Alert or Warning Diffusion Time Estimation for Dam Breaches, Controlled Dam Releases and Levee Breaches or Overtopping, Lakewood, Colorado, 2015b.
Sorensen, J. H. and Mileti, D. S.: Protective Action Initiation Time Estimation for Dam Breaches, Controlled Dam Releases, and Levee Breaches or Overtopping, Lakewood, Colorado, 1–51 pp., 2015c.
Statistische Ämter des Bundes und der Länder: Grid cell results of the Census, Zensus2022, https://www.zensus2022.de/EN/What-is-the-census/grid_cells_results_2011.html (last access: 26 September 2024), 2024a.
Statistische Ämter des Bundes und der Länder: Population in brief (territory on 9 May 2011), Zensus Datenbank [data set], https://ergebnisse.zensus2022.de/datenbank/online/statistic/1000X/details (last access: 26 September 2024), 2024b.
Szönyi, M., Roezer, V., Deubelli, T., Ulrich, J., MacClune, K., Laurien, F., and Norton, R.: Post Event Review Capability flood event review `Bernd,' Zurich, Switzerland. Zurich Insurance Company, 74 pp., https://zcralliance.org/resources/item/perc-flood-event-review-bernd/ (last access: 26 September 2024), 2022.
Thieken, A. H., Samprogna Mohor, G., Kreibich, H., and Müller, M.: Compound inland flood events: different pathways, different impacts and different coping options, Nat. Hazards Earth Syst. Sci., 22, 165–185, https://doi.org/10.5194/nhess-22-165-2022, 2022.
Thieken, A. H., Zenker, M., and Bubeck, P.: Flood-related fatalities in July 2021 in North Rhine-Westphalia, Germany: what can be learnt for future flood risk management?, J. Coast. River. Flood RiskFlood Risk, 2, 1–19, 2023a.
Thieken, A. H., Bubeck, P., Heidenreich, A., von Keyserlingk, J., Dillenardt, L., and Otto, A.: Performance of the flood warning system in Germany in July 2021 – insights from affected residents, Nat. Hazards Earth Syst. Sci., 23, 973–990, https://doi.org/10.5194/nhess-23-973-2023, 2023b.
USACE: HEC-LifeSim. Life Loss Estimation. Version 2.0. Technical Reference Manual. CPD-97a, Davis, California, https://iwrlibrary.sec.usace.army.mil/resource?title=LifeSim 2.0 Technical Reference Manual&documentId=c1dae7c1-c83f-4e9d-82e9-f311fa67f2ef (last access: 26 September 2024), 2020.
USACE: LifeSim. Life Loss Estimation. User's Manual. Version 2.0, Davis, California, 1–134 pp., https://iwrlibrary.sec.usace.army.mil/resource?title=LifeSim 2.0 User Manual&documentId=06bd49f2-cdd5-4e50-b58b-96c804c18886 (last access: 26 September 2024), 2021.
USACE: LifeSim, Version 2.1.3, https://www.rmc.usace.army.mil/Software/LifeSim/ (last access: 26 September 2024), 2023.
US Army Corps of Engineers: Institute for Water Resources, Risk Management Center Website, LifeSim [software], https://www.rmc.usace.army.mil/Software/LifeSim/ (last access: 26 September 2024), 2024.
USBR: RCEM – Reclamation Consequence Estimating Methodology – Guidelines for Estimating Life Loss for Dam Safety Risk Analysis, Washington, DC, 1–55 pp., https://www.usbr.gov/ssle/damsafety/documents/RCEM-Methodology2015.pdf (last access: 26 September 2024), 2015.
Vinet, F., Lumbroso, D., Defossez, S., and Boissier, L.: A comparative analysis of the loss of life during two recent floods in France: The sea surge caused by the storm Xynthia and the flash flood in Var, Nat. Hazards, 61, 1179–1201, https://doi.org/10.1007/s11069-011-9975-5, 2012.
Vorogushyn, S., Han, L., Apel, H., Nguyen, V. D., Guse, B., Guan, X., Rakovec, O., Najafi, H., Samaniego, L., and Merz, B.: It could have been much worse: spatial counterfactuals of the July 2021 flood in the Ahr valley, Germany, Nat. Hazards Earth Syst. Sci. Discuss. [preprint], https://doi.org/10.5194/nhess-2024-97, in review, 2024.
Wang, Y., Fu, Z., Cheng, Z., Xiang, Y., Chen, J., Zhang, P., and Yang, X.: Uncertainty analysis of dam-break flood risk consequences under the influence of non-structural measures, Int. J. Disaster Risk Re., 102, 104265, https://doi.org/10.1016/j.ijdrr.2024.104265, 2024.
Wasko, C., Nathan, R., Stein, L., and O'Shea, D.: Evidence of shorter more extreme rainfalls and increased flood variability under climate change, J. Hydrol. (Amst), 603, 126994, https://doi.org/10.1016/j.jhydrol.2021.126994, 2021.
Yari, A., Ostadtaghizadeh, A., Ardalan, A., Zarezadeh, Y., Rahimiforoushani, A., and Bidarpoor, F.: Risk factors of death from flood: Findings of a systematic review, J. Environ. Health Sci. Eng., 18, 1643–1653, https://doi.org/10.1007/s40201-020-00511-x, 2020.
Yazdani, M., Gencarelli, C. N., Salvati, P., and Molinari, D.: An empirical flood fatality model for Italy using random forest algorithm, Int. J. Disaster Risk Re., 98, https://doi.org/10.1016/j.ijdrr.2023.104110, 2023.
Zhai, G., Fukuzono, T., and Ikeda, S.: An empirical model of fatalities and injuries due to floods in Japan, J. Am. Water Resour. Assoc., 42, 863–875, https://doi.org/10.1111/j.1752-1688.2006.tb04500.x, 2006.
Zhuo, L. and Han, D.: Agent-based modelling and flood risk management: A compendious literature review, J. Hydrol. (Amst), 591, 125600, https://doi.org/10.1016/j.jhydrol.2020.125600, 2020.