the Creative Commons Attribution 4.0 License.
the Creative Commons Attribution 4.0 License.
 | 25 Sep 2023
Analysis of flood warning and evacuation efficiency by comparing damage and life-loss estimates with real consequences related to the São Francisco tailings dam failure in Brazil
André Felipe Rocha Silva
Julian Cardoso Eleutério
Economic damage and life-loss estimates provide important insights for the elaboration of more robust alerts and effective emergency planning. On the one hand, accurate damage analysis supports decision-making processes. On the other hand, the comparison of different flood alert scenarios through modeling techniques is crucial for improving the efficiency of alert and evacuation systems design. This work evaluates the use of flood damage and life-loss models in floods caused by tailings dams through the application of these models in the real case of the São Francisco dam failure, which occurred in January 2007 in the city of Miraí in Brazil. The model results showed great agreement with observed damage and loss of life. Furthermore, different simulations were done in order to measure the impact of increasing and decreasing alert system efficiency on life-loss reduction. The simulated scenarios exploring the inefficiency of flood alert and evacuation revealed that life loss could have reached the maximum rate of 8.7 % of the directly exposed population when considering the more pessimistic and uncertain scenario instead of the actual null life loss achieved. The results of this work indicate that the models could represent both the observed accident and different alert and evacuation efficiency impacts. It highlights the importance of developing and implementing robust alert and evacuation systems and regulations in order to reduce flood impacts.
- Article
(12322 KB) - Full-text XML
- Companion paper
- BibTeX
- EndNote


The benefits provided to society by the construction of dams of different types and purposes are undeniable. However, the failure of these structures may represent high damage potential to downstream valleys (Proske, 2018). From 1915 to 2022, 257 tailings dams worldwide suffered accidents, accounting for 2650 fatalities (Piciullo et al., 2022). The rate of tailings dam failures (1.2 %) is 2 orders of magnitude higher than the value of 0.01 % reported for conventional dams (ICOLD, 2001; Azam and Li, 2010). In addition to the fact that tailings dams are historically more vulnerable than conventional dams (Rico et al., 2008a), these dams generally present a much more significant risk to the environment due to the physicochemical characteristics of materials that may be stored in their reservoirs (Kossoff et al., 2014; Fernandes et al., 2016; Rotta et al., 2020; Guimarães et al., 2022).
North America and Europe are the continents with higher records of accidents involving these structures (Rico et al., 2008b; Azam and Li, 2010). However, from 2000 to 2023, Brazil alone accounted for 11 tailings dam accidents, with consequences of different orders (economic, socio-environmental and cultural). Three of these accidents took place in 2019, including the Brumadinho dam failure, where 270 victims, including dead and missing persons, were reported (Project Chronology of Major Tailings Dam Failures, 2023).
Potential flood impact assessment is an extremely effective tool for supporting emergency planning and decision-making processes (Apel et al., 2004; Merz et al., 2010). Specifically in flood events, the main socially relevant impacts are loss of life and economic damage, which are both objectively quantifiable and more relevant in the public perception of disasters (Jonkman et al., 2003). Several methods are available for evaluating the loss of life and economic damage related to floods. Comprehensive literature reviews were realized by Merz et al. (2010) for flood economic damage evaluation and by Jonkman et al. (2016) for flood loss of life evaluation. Since then, other relevant studies and models were achieved for economic damage (Gerl et al., 2016; Bombelli et al., 2021) and loss of life evaluations (Huang et al., 2017; Li et al., 2019; Mahmoud et al., 2020; Ge et al., 2021, 2022; Jiao et al., 2022; Alabbad et al., 2023). In addition, recent computational advances and software developments allow for the performance of more robust impact simulations (e.g., LifeSim and the Life Safety Model). However, international studies that focused on tailings dam impact assessments are rare. Lumbroso et al. (2021) performed life-loss simulations related to the Brumadinho (Brazil) tailings dam failure. No studies focused, jointly, on both tailings dam failure economic and loss of life assessments were identified. This is one of the main topics explored in this paper.
We analyzed the São Francisco mining tailings dam rupture in Miraí city, Minas Gerais state (Brazil). This accident took place in 2007. It caused several damages in the downstream valley, including the flooding of around 300 to 500 dwellings, generating economic and environmental losses. Although a high risk was observed, the identification of the hazard and evacuation procedures adopted during the event led to the absence of fatalities. This accident represents an opportunity for research purposes once it presents a particular case of efficiency of evacuation, and it was the object of some important data gathering in national studies (Pimenta de Ávila, 2007; Rocha, 2015; Veizaga et al., 2017) and media coverage, which provides relatively detailed data concerning the real flood extent and its consequences.
Even when considering natural floods, few studies compare damage estimates with actual surveys (Molinari et al., 2019). The application of predictive models for estimating impacts under these conditions is of great scientific interest. It allows for validating the use of models against observed data and estimating potential impacts in more or less favorable conditions with the success of the observed evacuation through the simulation of hypothetical scenarios.
In this context, this paper evaluates how accurate life-loss and damage models may be for estimating tailings dam failure flood impacts and alert and evacuation efficiency for loss of life alleviation. Furthermore, it performs the application of models to estimate economic damage and loss of life together. In addition to the objective of representing the real accident, we simulated different scenarios for warning and evacuation, validating and comparing the results with actual observed data and revealing the benefits of using models to guide flood warning and evacuation system implementation.
The São Francisco dam was a structure for storing tailings from the effluent generated in the bauxite washing process of Mineração Rio Pomba Cataguases Ltda. The dam was located 8 km from the urban center of Miraí, a city located in the Zona da Mata of Minas Gerais state (Fig. 1). The breach wave directly impacted this city. The São Francisco tailings dam reservoir was 34 m high, with a length of 90 m, a width of 9 m, and a capacity of approximately 3.8 million cubic meters.
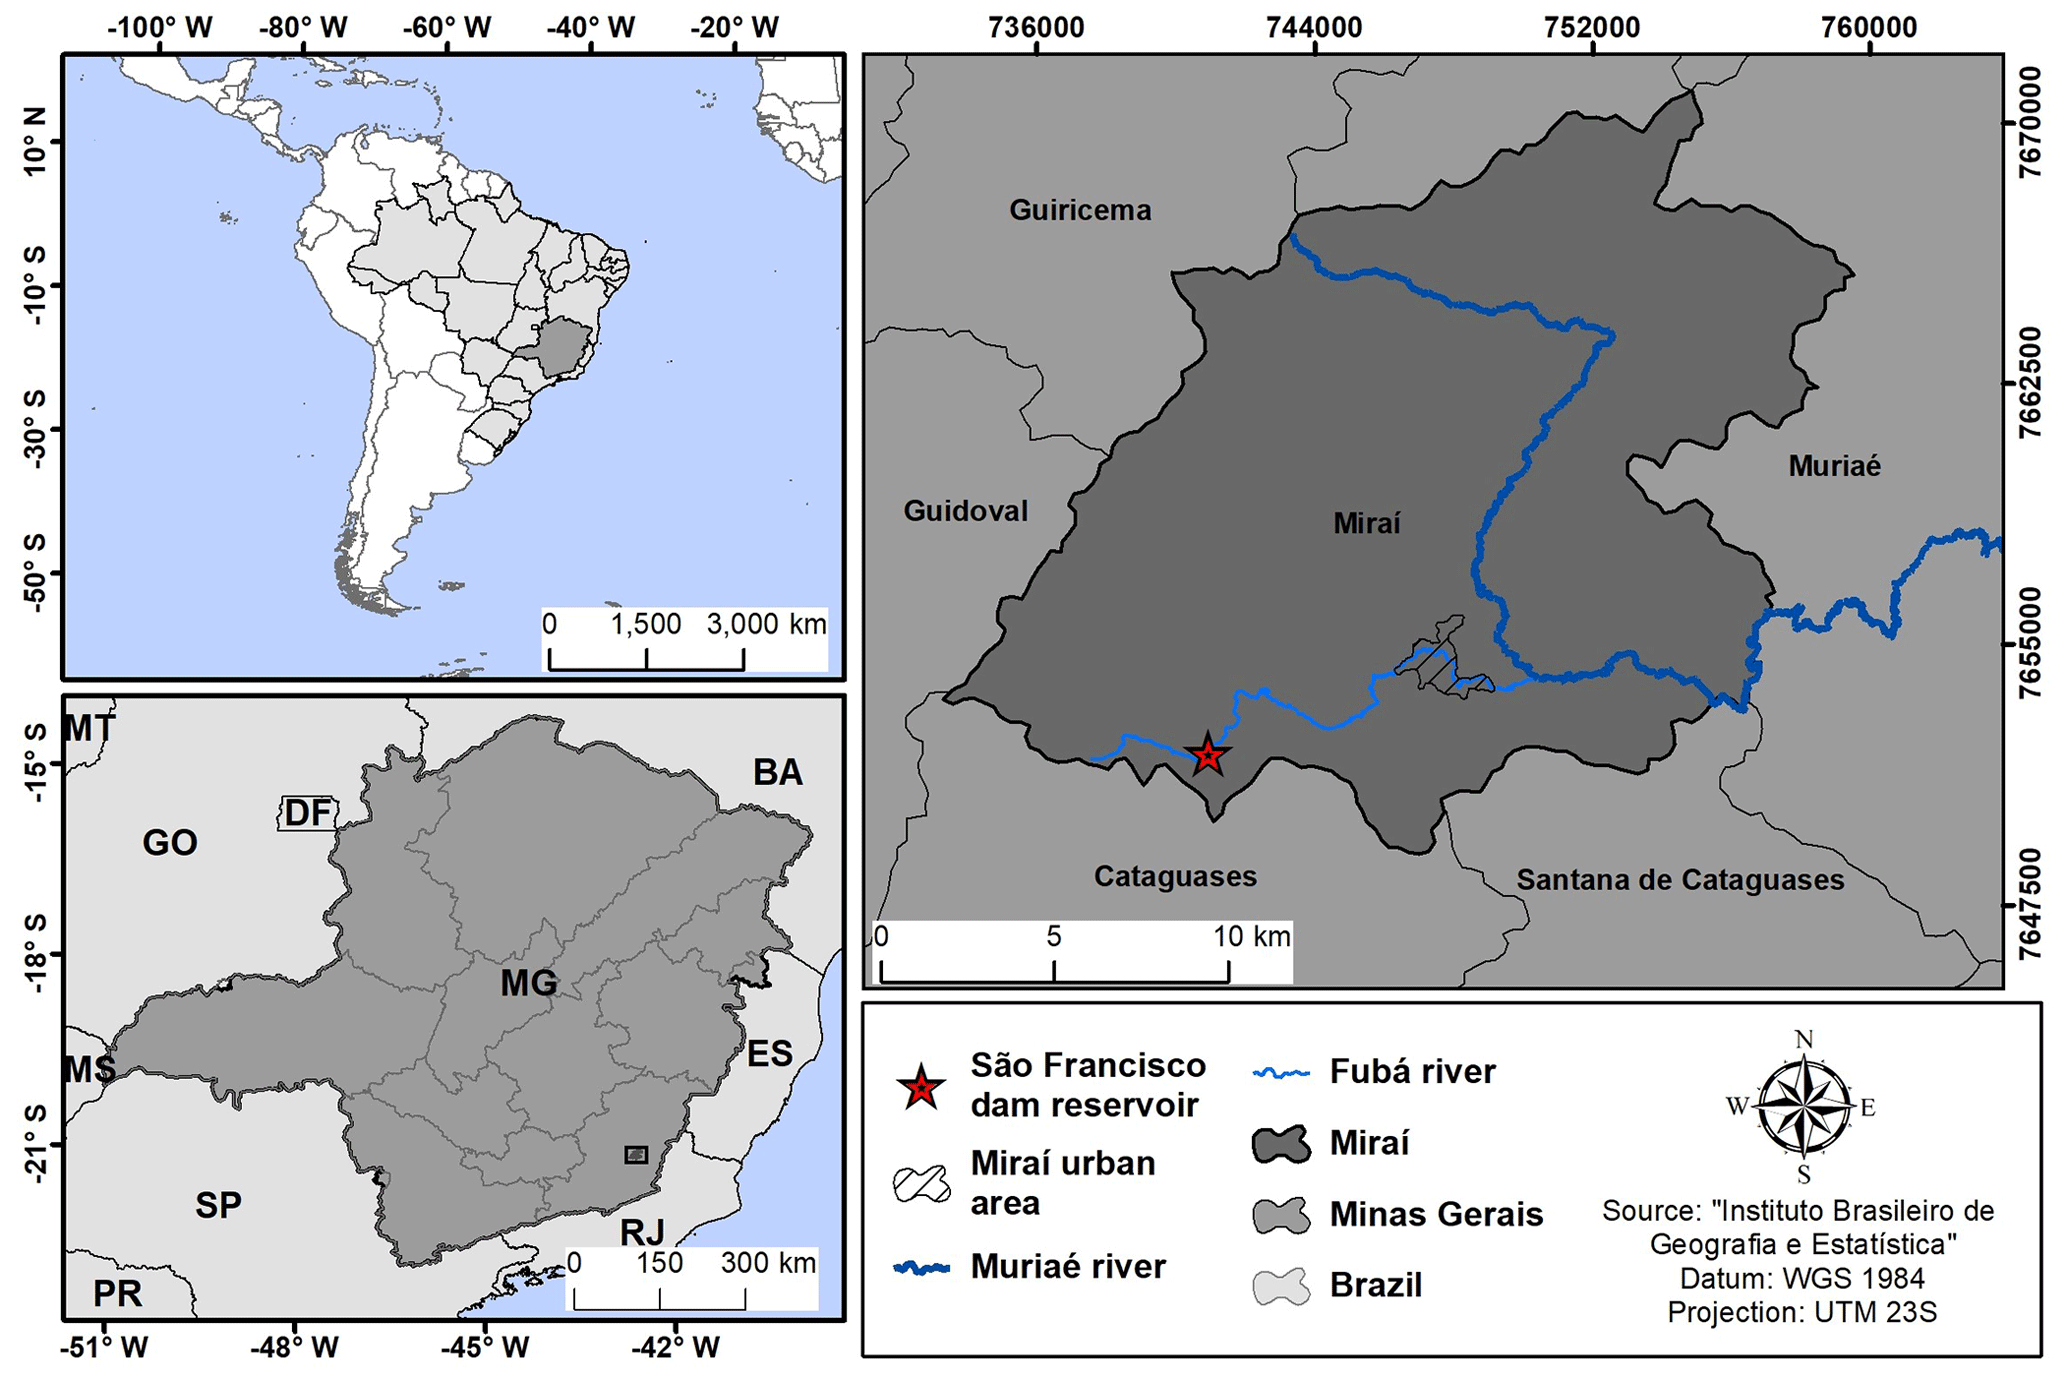
Figure 1Location map of the São Francisco dam in Miraí city (MG) – Brazil.
The Miraí accident occurred on 10 January 2007, and its description, with all available details concerning flood wave propagation, reservoir characteristics, and impacts, was obtained from Rocha (2015). At around 03:00 LT, the water level in the reservoir rose rapidly due to an intense rainfall of 121.3 mm, which lasted 4 h. The water overtopped the dam's crest, starting to overflow through the surface spillway and through the contact of the massif with one of the dam abutments, causing the dam to collapse due to the rapid erosion caused by the volume and speed of the water. According to local estimates, the collapse began around 03:30 LT, with a sharp increase in the breach until 05:30 LT that day. About 82 % of the volume of mud stored in the reservoir spread through the Fubá River (which crosses the urban area of Miraí city) and continued beyond the confluence with the Muriaé River. Figure 2 shows the Miraí accident and the extent of the observed inundation area, outlined using satellite images and aerial photographs.
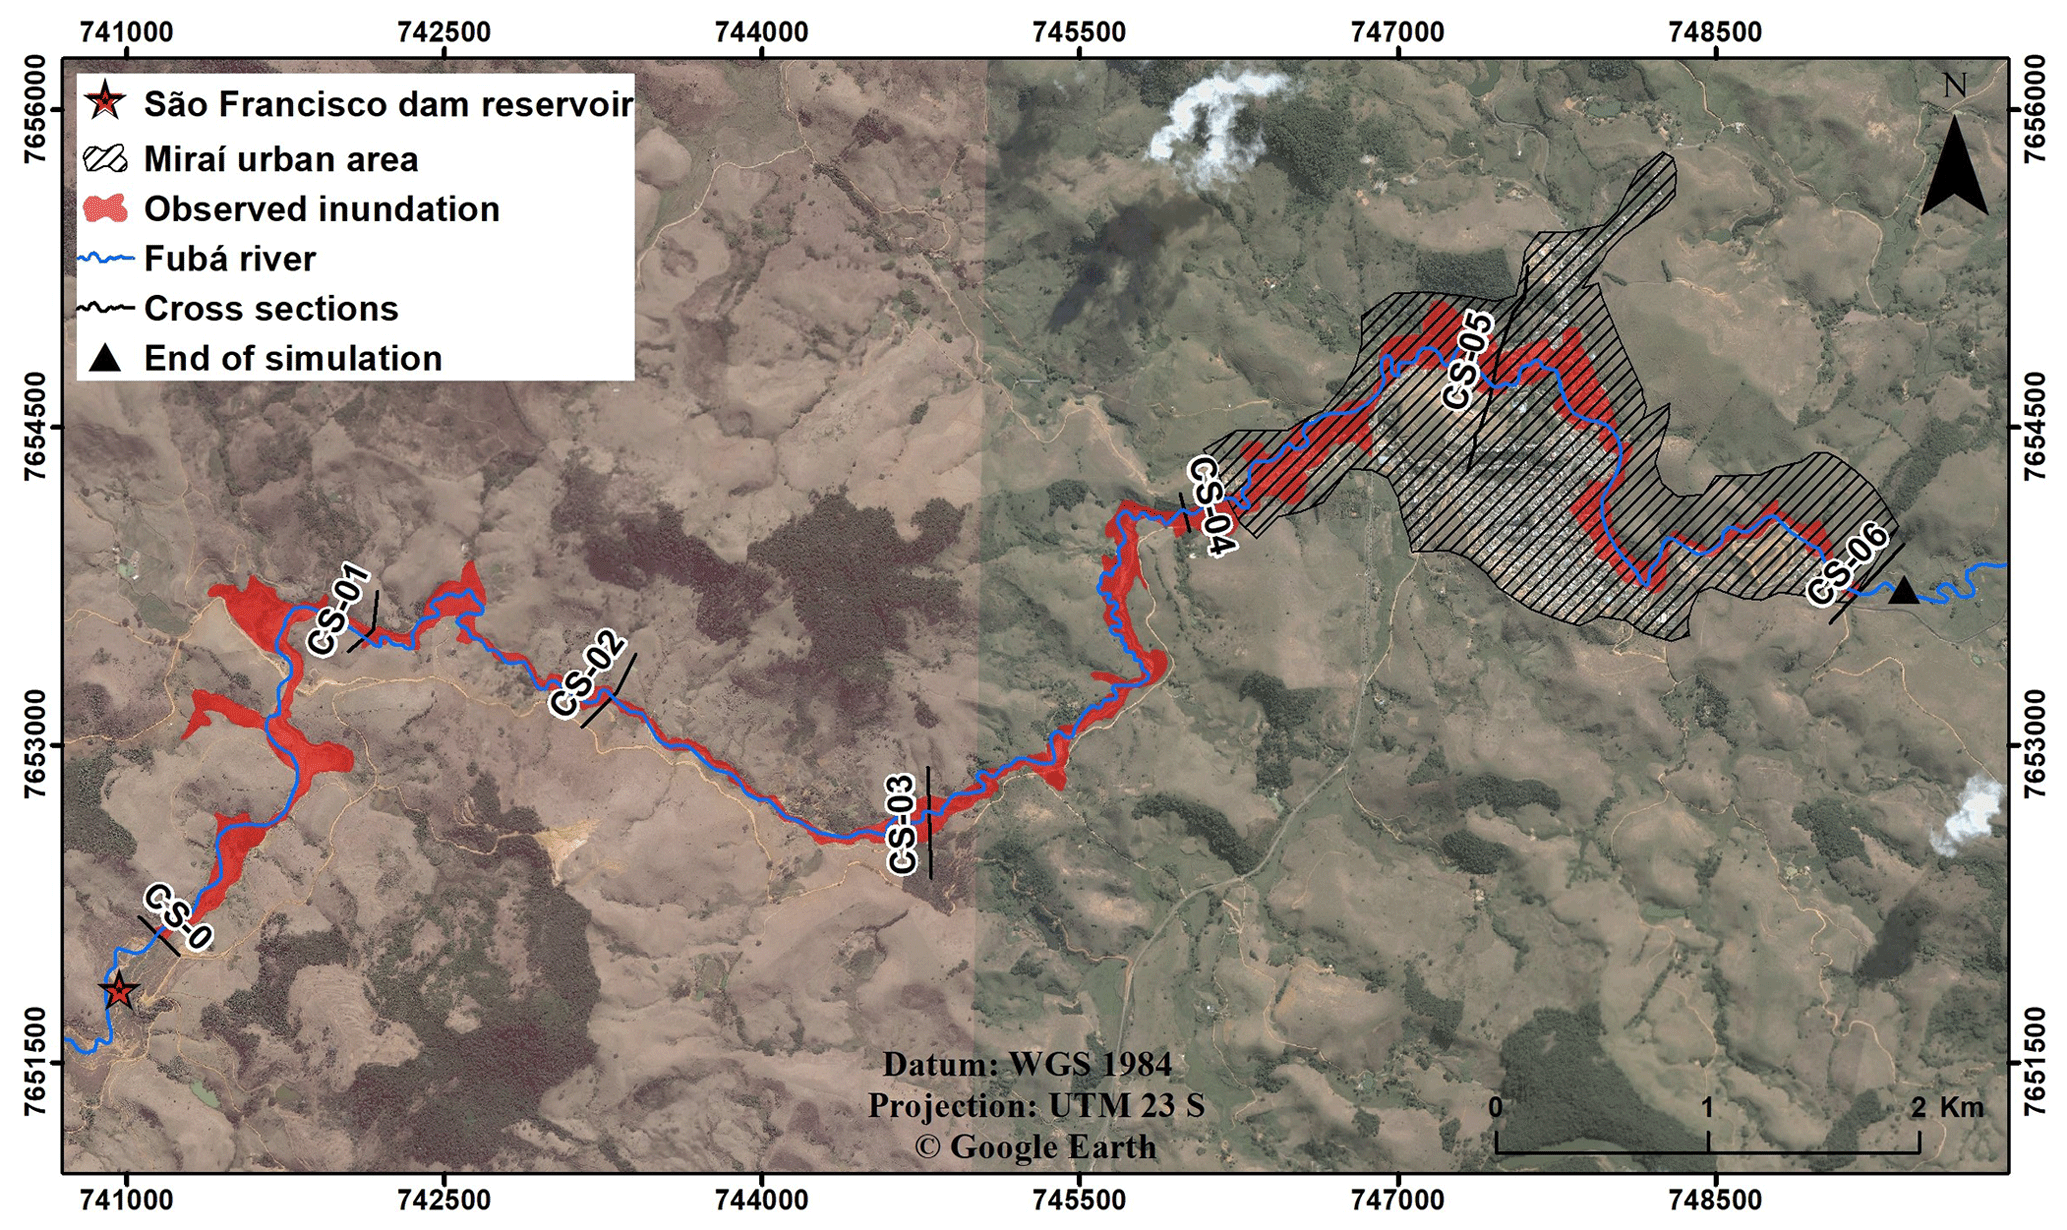
Figure 2Observed inundation area after the São Francisco dam breach, Miraí (MG).
According to local studies, during the rainfall event period, the dam watchman noticed the rapid rise in the water level in the structure and notified the military police about the imminent danger of rupture when the water level of the reservoir was about 30 cm from the crest of the dam. After receiving the warning, approximately at the same time as the beginning of the dam collapse, the local military police went through the streets of Miraí city, helping to evacuate the whole population during the night successfully. Regarding the economic damage to the infrastructure of the city, the municipal government estimated a value of approximately BRL 74 million (USD 14.149 million, using the average exchange rate for the first half of 2022 with a value of 5.23), which is around 9 times the city's annual budget. This estimate did not include the damage to residents due to the loss of personal objects, furniture, and household structure. Other consequences of the event were the death of fish and the interruption of water supply in several cities downstream.
Several methods exist for analyzing and quantifying economic damage (Merz et al., 2010). Nevertheless, due to the difficulty in specifying indirect and intangible damage, the methods usually focus on direct tangible damage. For estimating this type of damage, Merz et al. (2010) consider the following aspects: characterization and classification of assets at risk, quantification of impacts on flood-exposed assets at risk, and association of the potential damage to assets through the use of damage models which relates assets typology and flood characteristics to damage economic potential.
The methods for assessing loss of life rely on behavioral assessment and macroeconomic indicators (Jongejan et al., 2005). However, the monetary specification of loss of life is complex due to the intangible characteristic of this type of damage. Risk assessments usually address fatalities directly and quantitatively, without monetary attribution (Jonkman et al., 2003). Potential quantification of direct loss of life comprises three main factors: first, the number of people potentially at risk; then, the effectiveness of evacuation and shelter strategies, thus determining the number of people who may be exposed to the event; and, finally, the fatality rate estimate, which is the ratio between the number of fatalities and the number of flood-exposed people (Jonkman et al., 2008). Depending on the model, these main factors are represented by many other specific factors (e.g., flood and people characteristics and when the flood occurred).
There are several available life-loss models in the literature, as presented by Jonkman et al. (2016). Among these models, we highlight LifeSim (Aboelata and Bowles, 2005), an agent-based model used in this research. LifeSim simulates the outcomes of event exposure, and its methodology links the loss of life to the evacuation of people or their success in finding a safe shelter. Besides, the model allows the estimation of economic damages. The full version of the model is integrated into HEC-LifeSim v.1.0.1 (USACE, 2019). This version, which was developed by the U.S. Army Corps of Engineers (USACE), is the most used in North American consultancy and insurance companies (Needham et al., 2016), and it is also being widely used worldwide (Risher et al., 2017; Hill et al., 2018; Kalinina et al., 2018; Leong-Cuzack et al., 2019; Wang, 2019; Tomura et al., 2020; El Bilali et al., 2021; Kalinina et al., 2021; Silva et al., 2021; El Bilali et al., 2022). A more recent version, LifeSim v.2.0, has been implemented (USACE, 2021). However, some issues in this version, reported to the Risk Management Center (RMC) of the USACE, prompted our decision to utilize the HEC-LifeSim v.1.0.1.
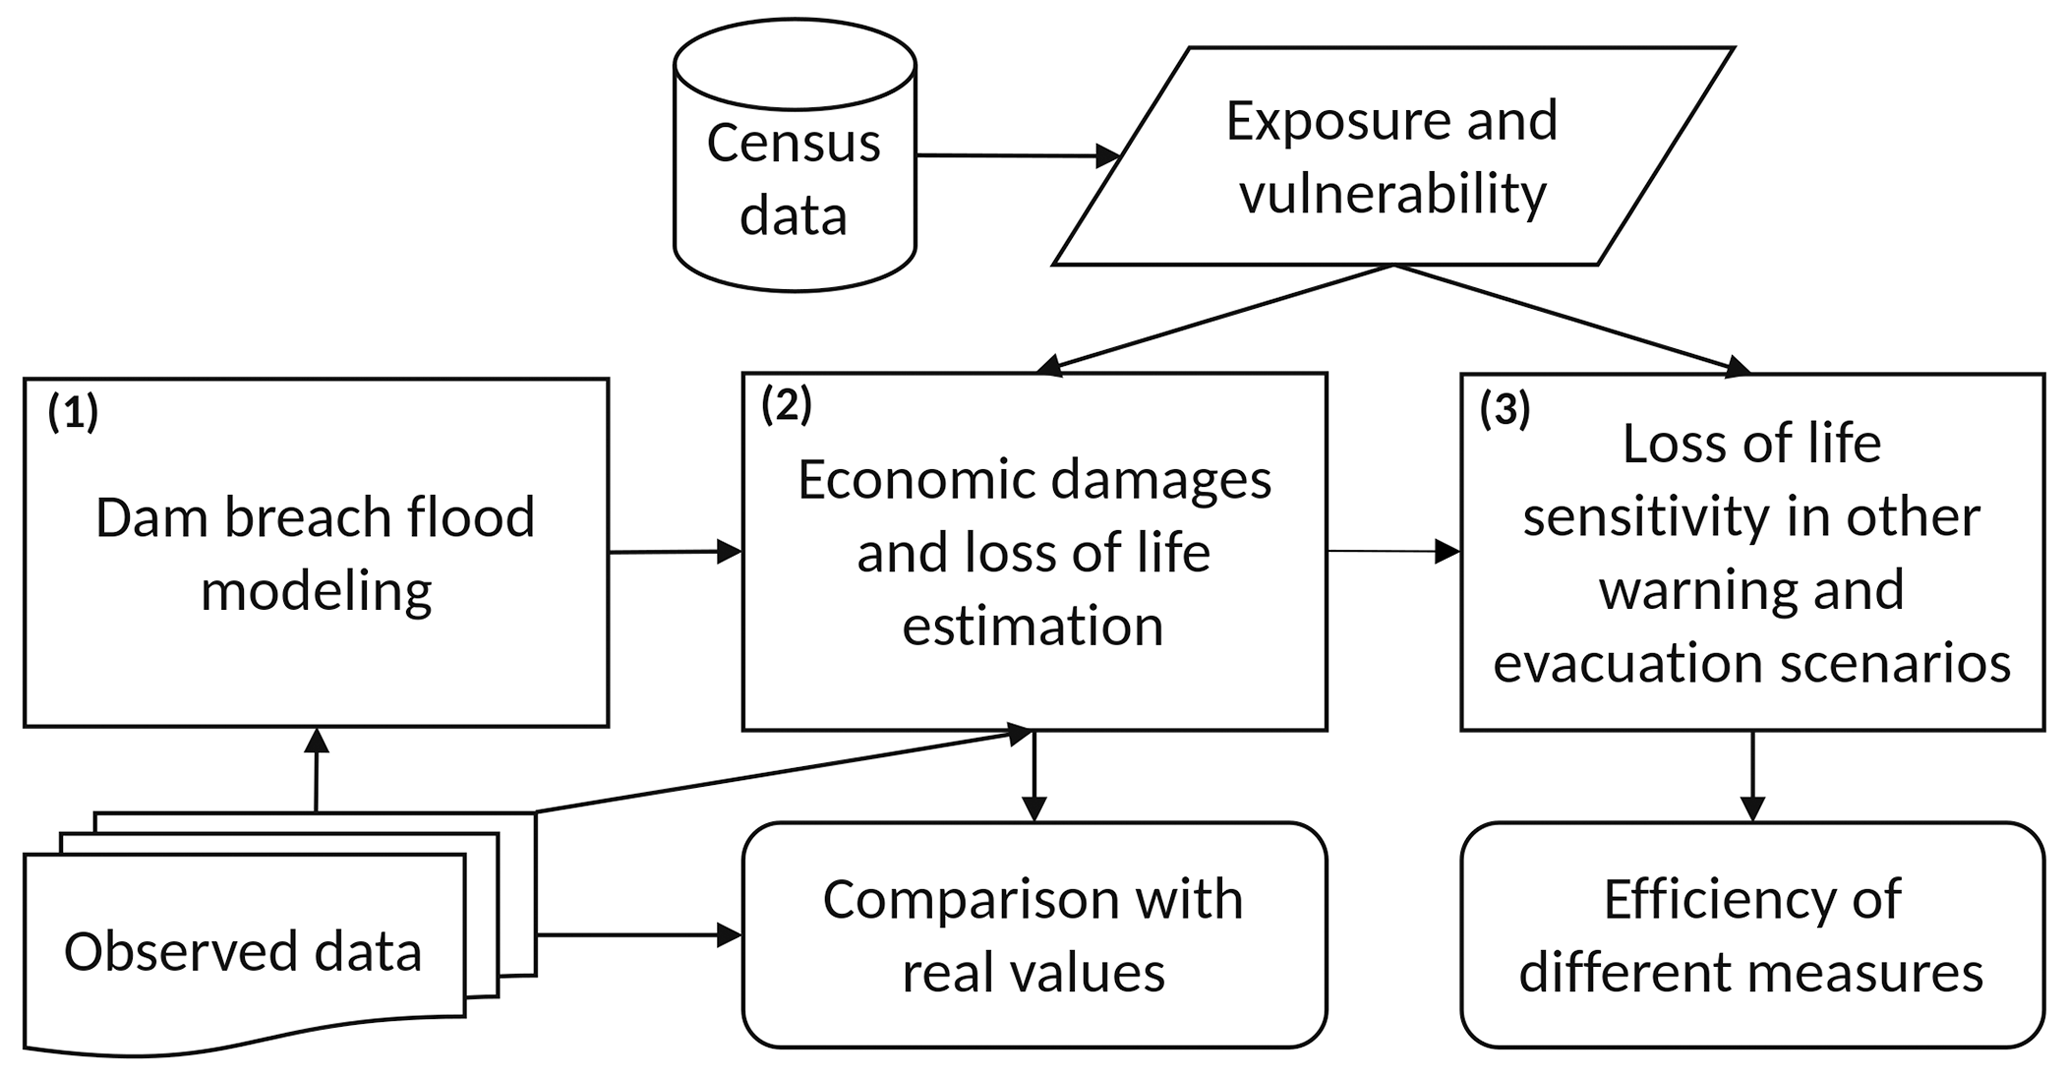
Based on these principles, the impact assessment methodology presented in this article consists of three parts (Fig. 3): (1) using accident data to model the amplitude of the tailings flood wave, to map the flood extent, and to delimit the affected region; (2) estimating damage and loss of life based on the analysis of exposure and vulnerability of the urban area of Miraí city and the observed evacuation process; and (3) developing scenarios for warning and evacuation to estimate the efficiency of different measures that were or could be achieved during the flood event.
3.1 Dam breach modeling and flood wave mapping
In the HEC-RAS (Hydrologic Engineering Center – River Analysis System) model, the propagation of the flood wave is given by solving the shallow-water equations (Brunner, 2020). In two-dimensional modeling using the HEC-RAS version 6.3, the channel and the floodplain were subdivided into nonoverlapping cells to form a grid for solving the equations. The digital elevation model (DEM) used to generate the numerical grid was obtained by the Shuttle Radar Topography Mission (SRTM), with 1 arc-second spatial resolution (30 m). The Fubá River channel was inserted using the AGREE method (Hellweger and Maidment, 1997), with later correction of the river profile and insertion of topobathymetric points. This correction reduced the average error from 3.6 m (DEM) to 1.2 m (topobathymetric survey).
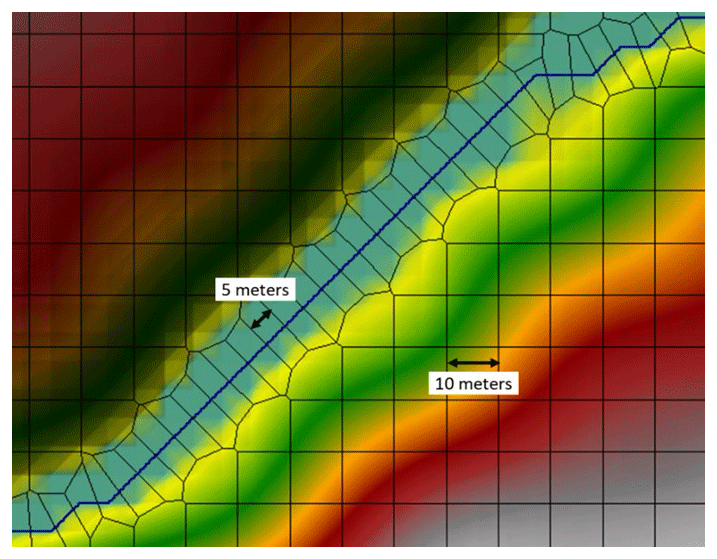
This grid can be structured by cells of any shape, with a maximum of eight faces. These cells can be orthogonal or not; however, if there is orthogonality in all or part of the grid, the solution of the applied numerical method has an advantage in computational speed. A hybrid discretization scheme that combines finite differences and finite volumes is used to solve the shallow-water equations. Furthermore, the shallow-water equations can be simplified, resulting in the diffusive wave model. However, simplification is not recommended for the present study since it addresses a dam failure, which denotes highly dynamic flood waves (Brunner, 2020). The variation in speed in these situations can be highly drastic in space and time, and diffusion wave simplification does not include the terms of local acceleration (change of speed over time) and convective acceleration (change of speed over space). The grid in this study was structured with 10 m cells, being refined to 5 m in the region of the Fubá River channel (Fig. 4). The Eulerian–Lagrangian method was used to solve the shallow-water equations on flood propagation. The databases used for constructing the model and the maps were obtained by Rocha (2015) in a detailed local analysis of the accident.
Through several experiments performed on mud flow samples, O'Brien and Julien (1985) defined classes of flow type by volumetric solid concentration. The authors noticed that the volumetric solid concentration in the waste stream is usually higher than 20 %. In these cases, there is a variation in fluid viscosity, the flow being considered non-Newtonian (Gildeh et al., 2021). Some studies present techniques to model the flow resistance of non-Newtonian fluids (Jeyapalan et al., 1983; Jin and Fread, 1999; Rico et al., 2008a; Bernedo et al., 2011; Gildeh et al., 2021; Larrauri Concha and Lall, 2018; Piciullo et al., 2022). Studies on the applicability of some of these techniques (Travis et al., 2012; Melo, 2013; Martin et al., 2015; Rocha, 2015; Machado, 2017) demonstrate the capacity and limitations of tailings flood wave modeling adopting a Newtonian fluid.
For the case under study, analyses from a minor incident in 2006 during dam raising showed that the reservoir sludge had a volumetric solid concentration of 12 %, which consequently allows for the representation of the flow as aqueous according to the definition proposed by O'Brien and Julien (1985). Therefore, no technique was used to represent tailings flow resistance without prejudice to the simulation.
As done for traditional flood modeling, different Manning coefficients were determined for each class of land use and occupation determined by the maximum likelihood method, using the Landsat 5 image (orbit 217 and point 75) of 15 October 2005, supplied by the U.S. Geological Survey (USGS, 2005). The classes considered were (Fig. 5) dense vegetation, sparse vegetation, exposed soil, urbanized area, and water body, with respective coefficients of 0.160, 0.035, 0.025, 0.100, and 0.040, as proposed by the Natural Resources Conservation Service (NRCS, 2016).
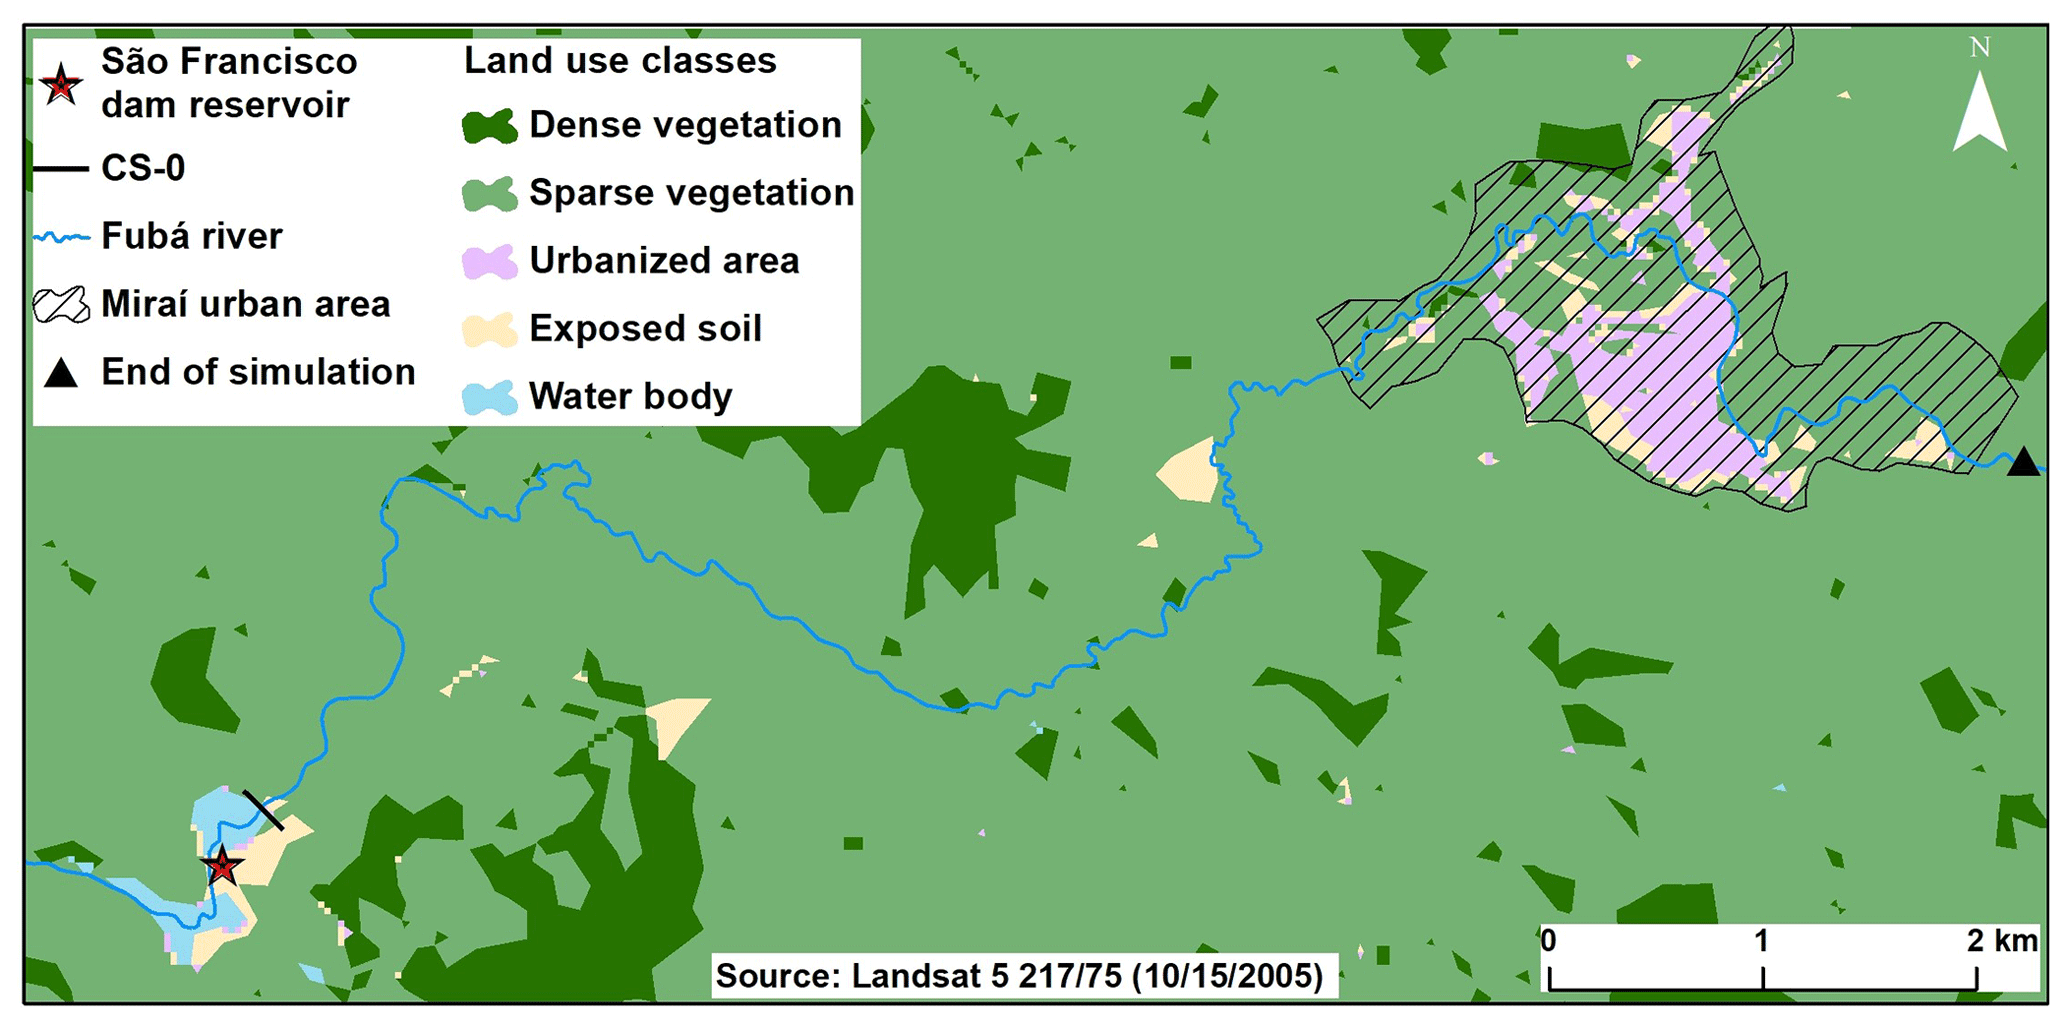
Figure 5Map of land use and occupation – Manning coefficients.
The affluent hydrograph to the São Francisco dam reservoir was developed considering the rainfall accumulation of 121.3 mm in 4 h, the estimate of effective rainfall by the curve number (CN) method (NRCS, 1997), and the transformation of this effective rainfall into a runoff by the synthetic unit hydrograph method. The reconstruction of the accident (Rocha, 2015) led to the conclusion that the gap was 34 m high, 70 m wide at the top, and 4 m wide at the bottom, and it developed in 4.5 h. Considering the affluent hydrograph calculated with a peak of 72 m3 s−1, the quota-volume curve with 18 % of the material retained in the reservoir, and the quota-discharge curves of the spillway, the breach hydrograph was developed by the author starting at 3 h 30 min, with a peak flow of 422 m3 s−1 and peak and base times of 1 h and 57 min and 3 h and 54 min, respectively. This breach hydrograph was used as the upstream boundary condition of the model. As the downstream boundary condition, normal depth was adopted in a section approximately 220 m away from the urban area under analysis (the most fitted flow condition), not influencing the study area.
Regarding the spread of the tailings flood wave, the simulated inundation boundary comprised 1.171 km2, equivalent to 89.4 % of the total observed (1.310 km2). Figure 6 shows the envelope of the simulated inundation area, highlighting the urban region of Miraí.
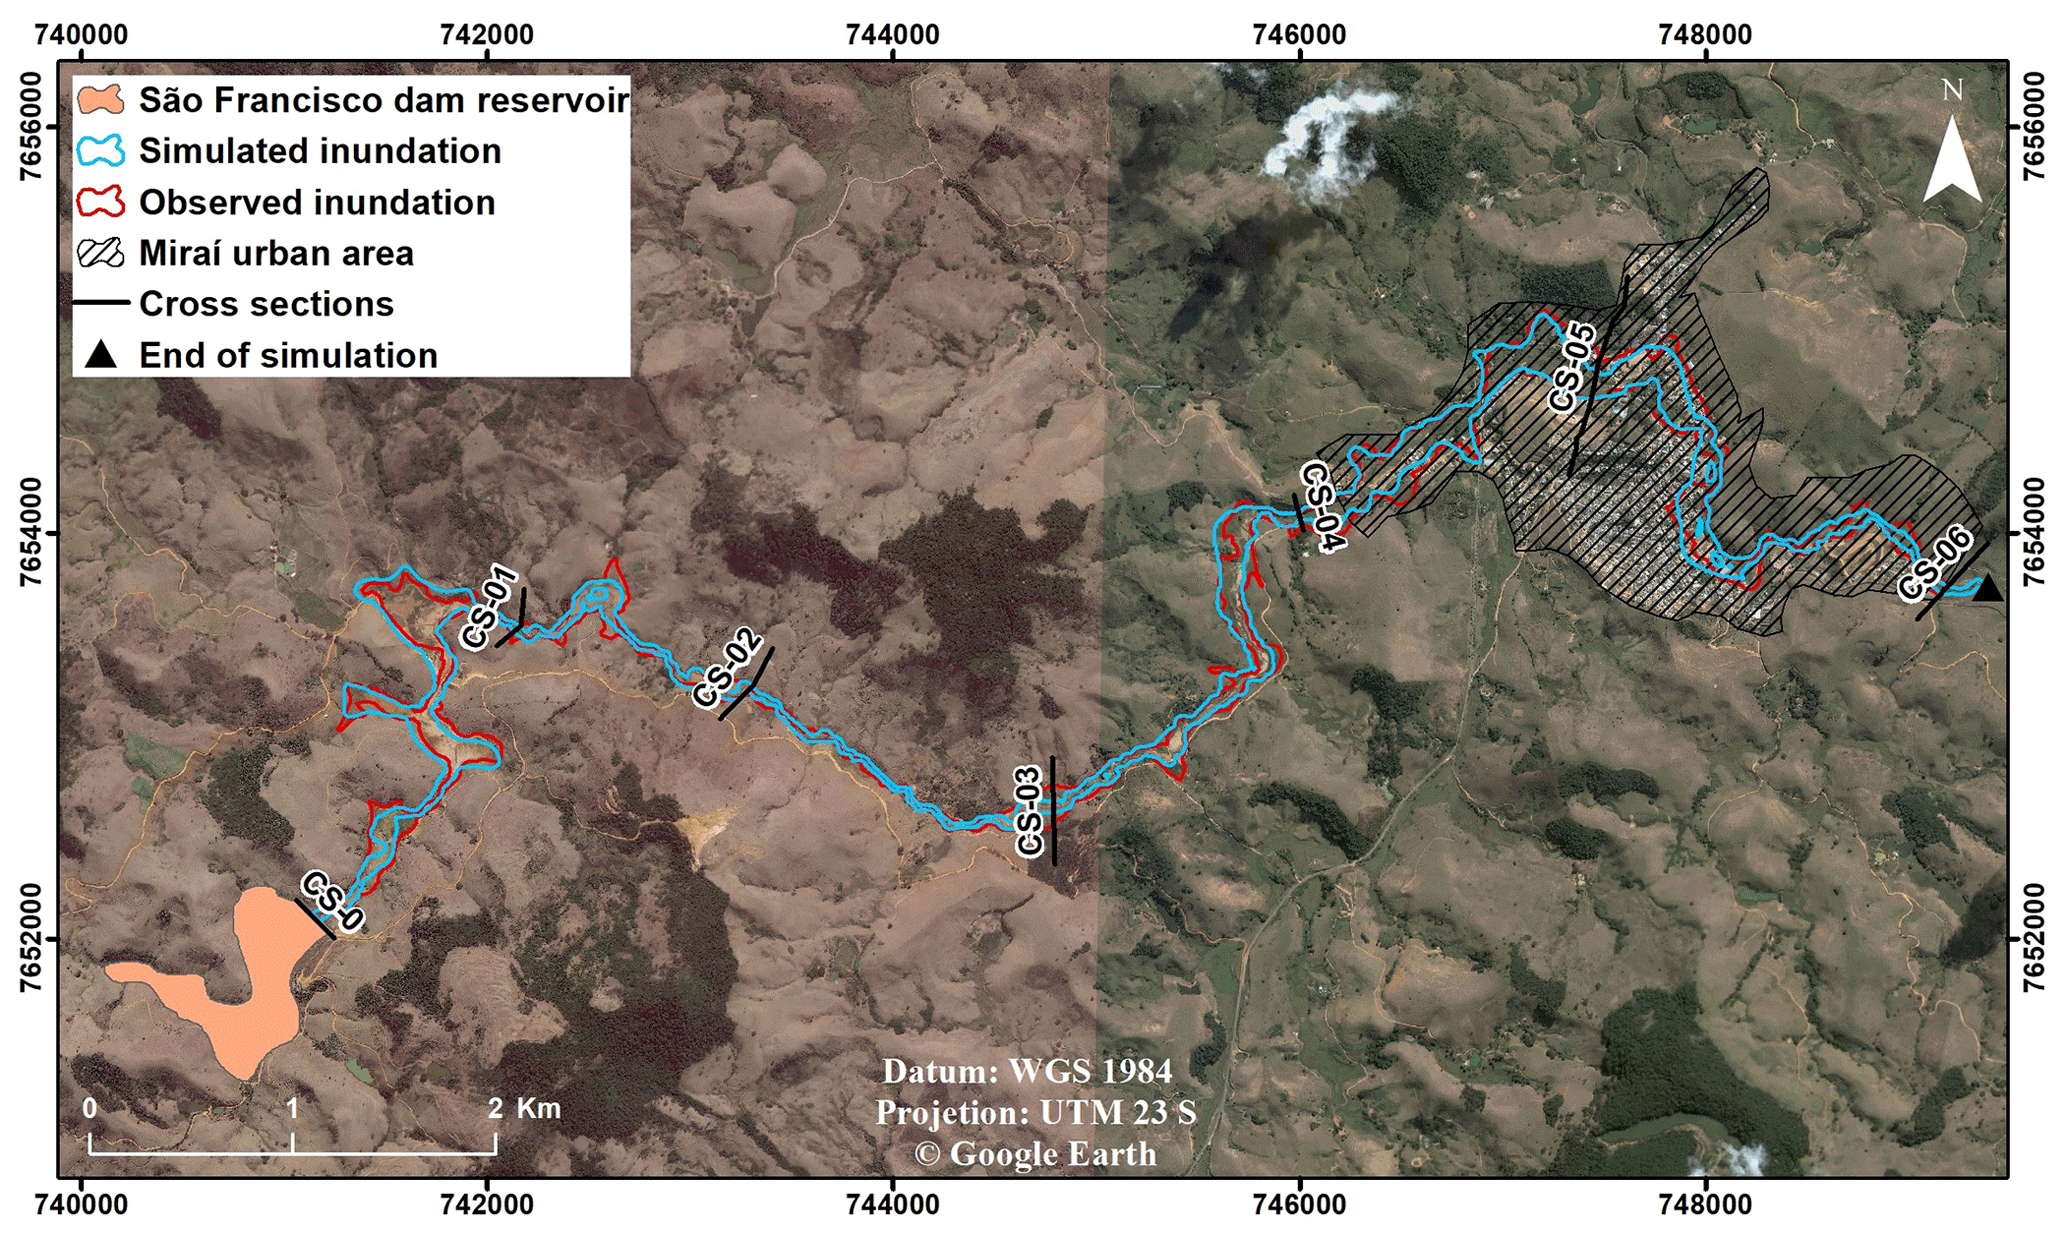
Figure 6Inundation boundary simulated with HEC-RAS and observed from the São Francisco dam breach.
Despite having similar percentages, the inundation boundary shows noticeable differences. The simulation area an overestimation and underestimation of 16.0 % and 26.3 %, respectively, when compared to the observed flood map. These discrepancies are a consequence of inaccuracies related to the DEM used, which tends to overestimate altimetry in areas with buildings and more robust vegetation, consequently reducing flood depths in these areas. Meanwhile, due to the low resolution of the model, the lack of details on altimetric obstacles that could obstruct wave propagation may lead to the overestimation of hydraulic parameters in flat areas (Paiva et al., 2011; Yamazaki et al., 2012; Saksena and Merwade, 2015; Jarihani et al., 2015).
Analyzing the flood hydrograph propagation through the sections indicated in Fig. 6, one can perceive greater damping of the peak flow in flatter regions. These regions provide an increase in flood wave spread compared to regions of high slopes with embedded valleys, which, in turn, provide higher propagation speeds (Fig. 7). The reach between CS-0 and CS-01 comprises two large areas of flatland floodplain and an extensive floodplain. Such topographic characteristics are also observed to a lesser extent in the stretch between CS-03 and CS-05. In turn, the reach between CS-01 and CS-03 comprises a high-slope region. In the urban region, between CS-05 and CS-06, there was no significant damping of the peak flow, only a delay in peak time. This is probably because the flood wave already reached the urban area of Miraí city damped with low flow speeds. Table 1 presents the synthesis of the results for each cross-section analyzed.
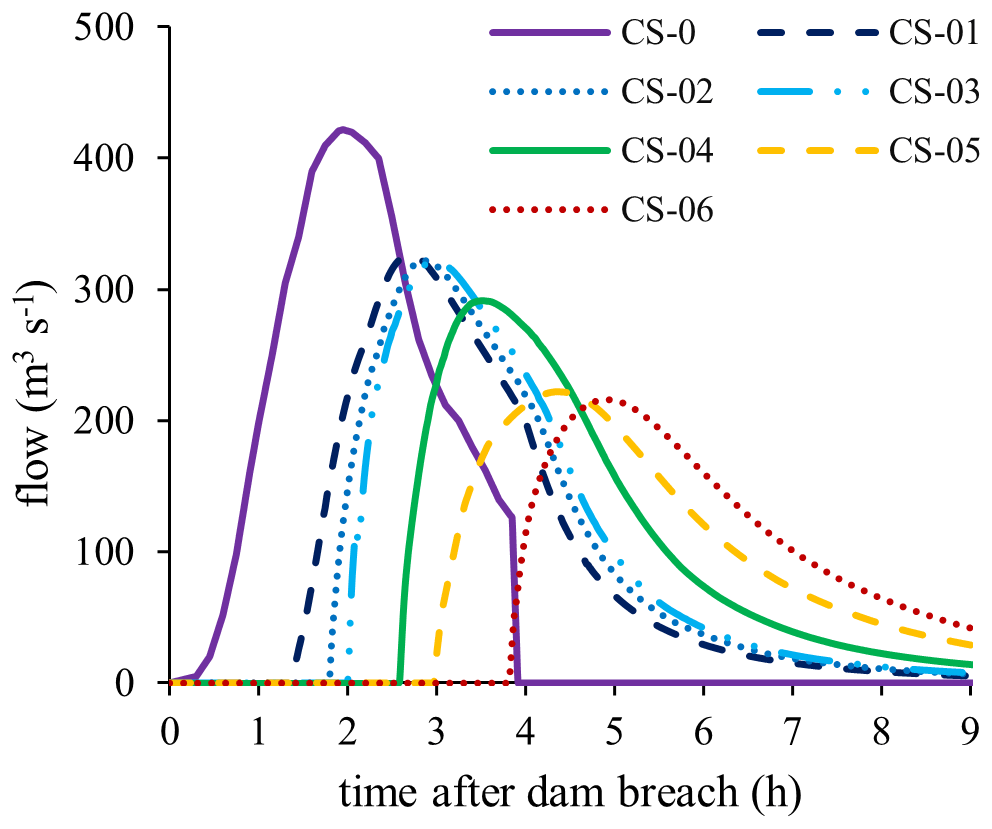
Table 1Synthesis of the results of the tailings wave propagation.
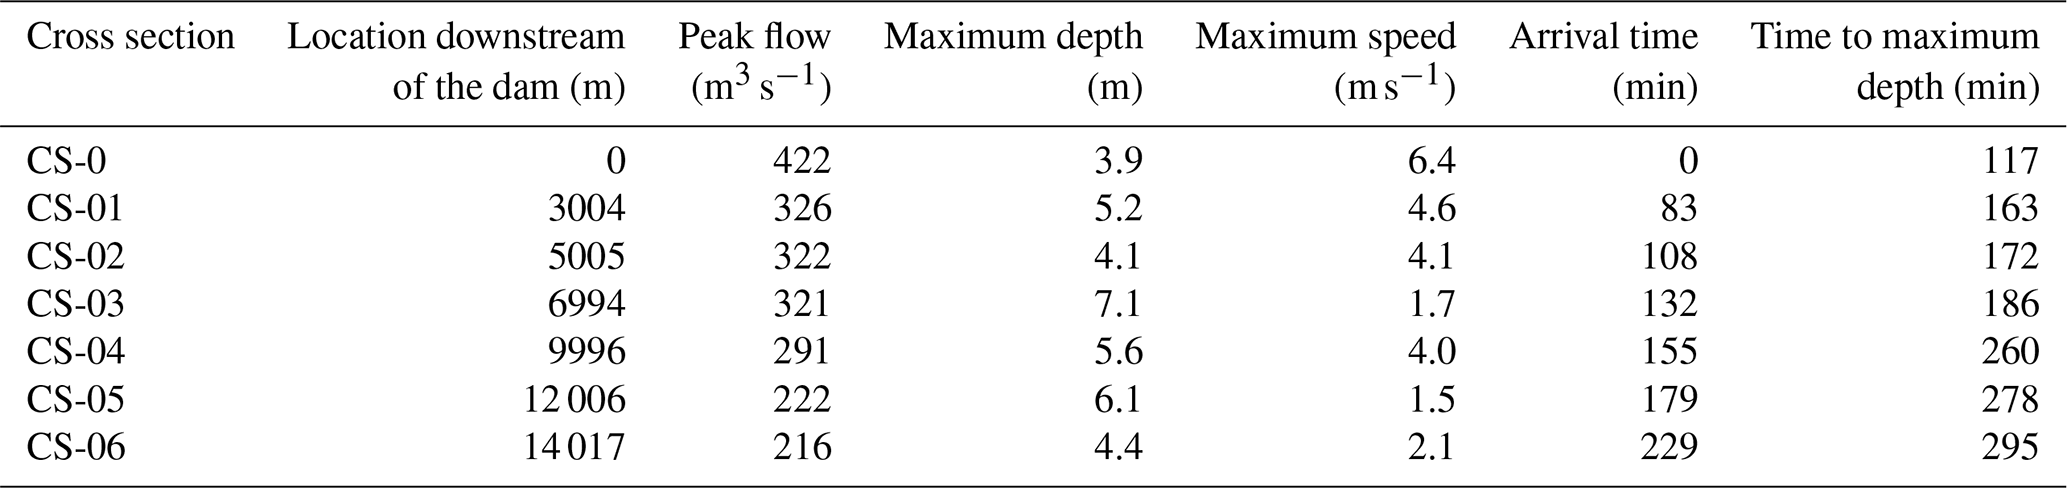
Even though some differences between simulation and observation were highlighted, the spread of the flood wave was consistent with the actual event that occurred in 2007. Witnesses reported that the evacuation in the first neighborhood of the urban region took place at dawn. Table 1 shows that the arrival time in the section closest to the start of the urban area (CS-04) occurs around hour 2.5 of the simulation, equivalent to 06:00 LT on the event day.
For the urban area of Miraí city, the object of the analysis of subsequent consequences, there were also discrepancies between the simulated and actual boundary (Fig. 8). As for the entire study region, the simulated and the observed area differed noticeably, totaling 0.488 and 0.579 km2, respectively. Area overestimation and underestimation in the simulation corresponded to 10.8 % and 26.5 %, respectively, again evidencing the consequences of inaccuracies related to the DEM used.
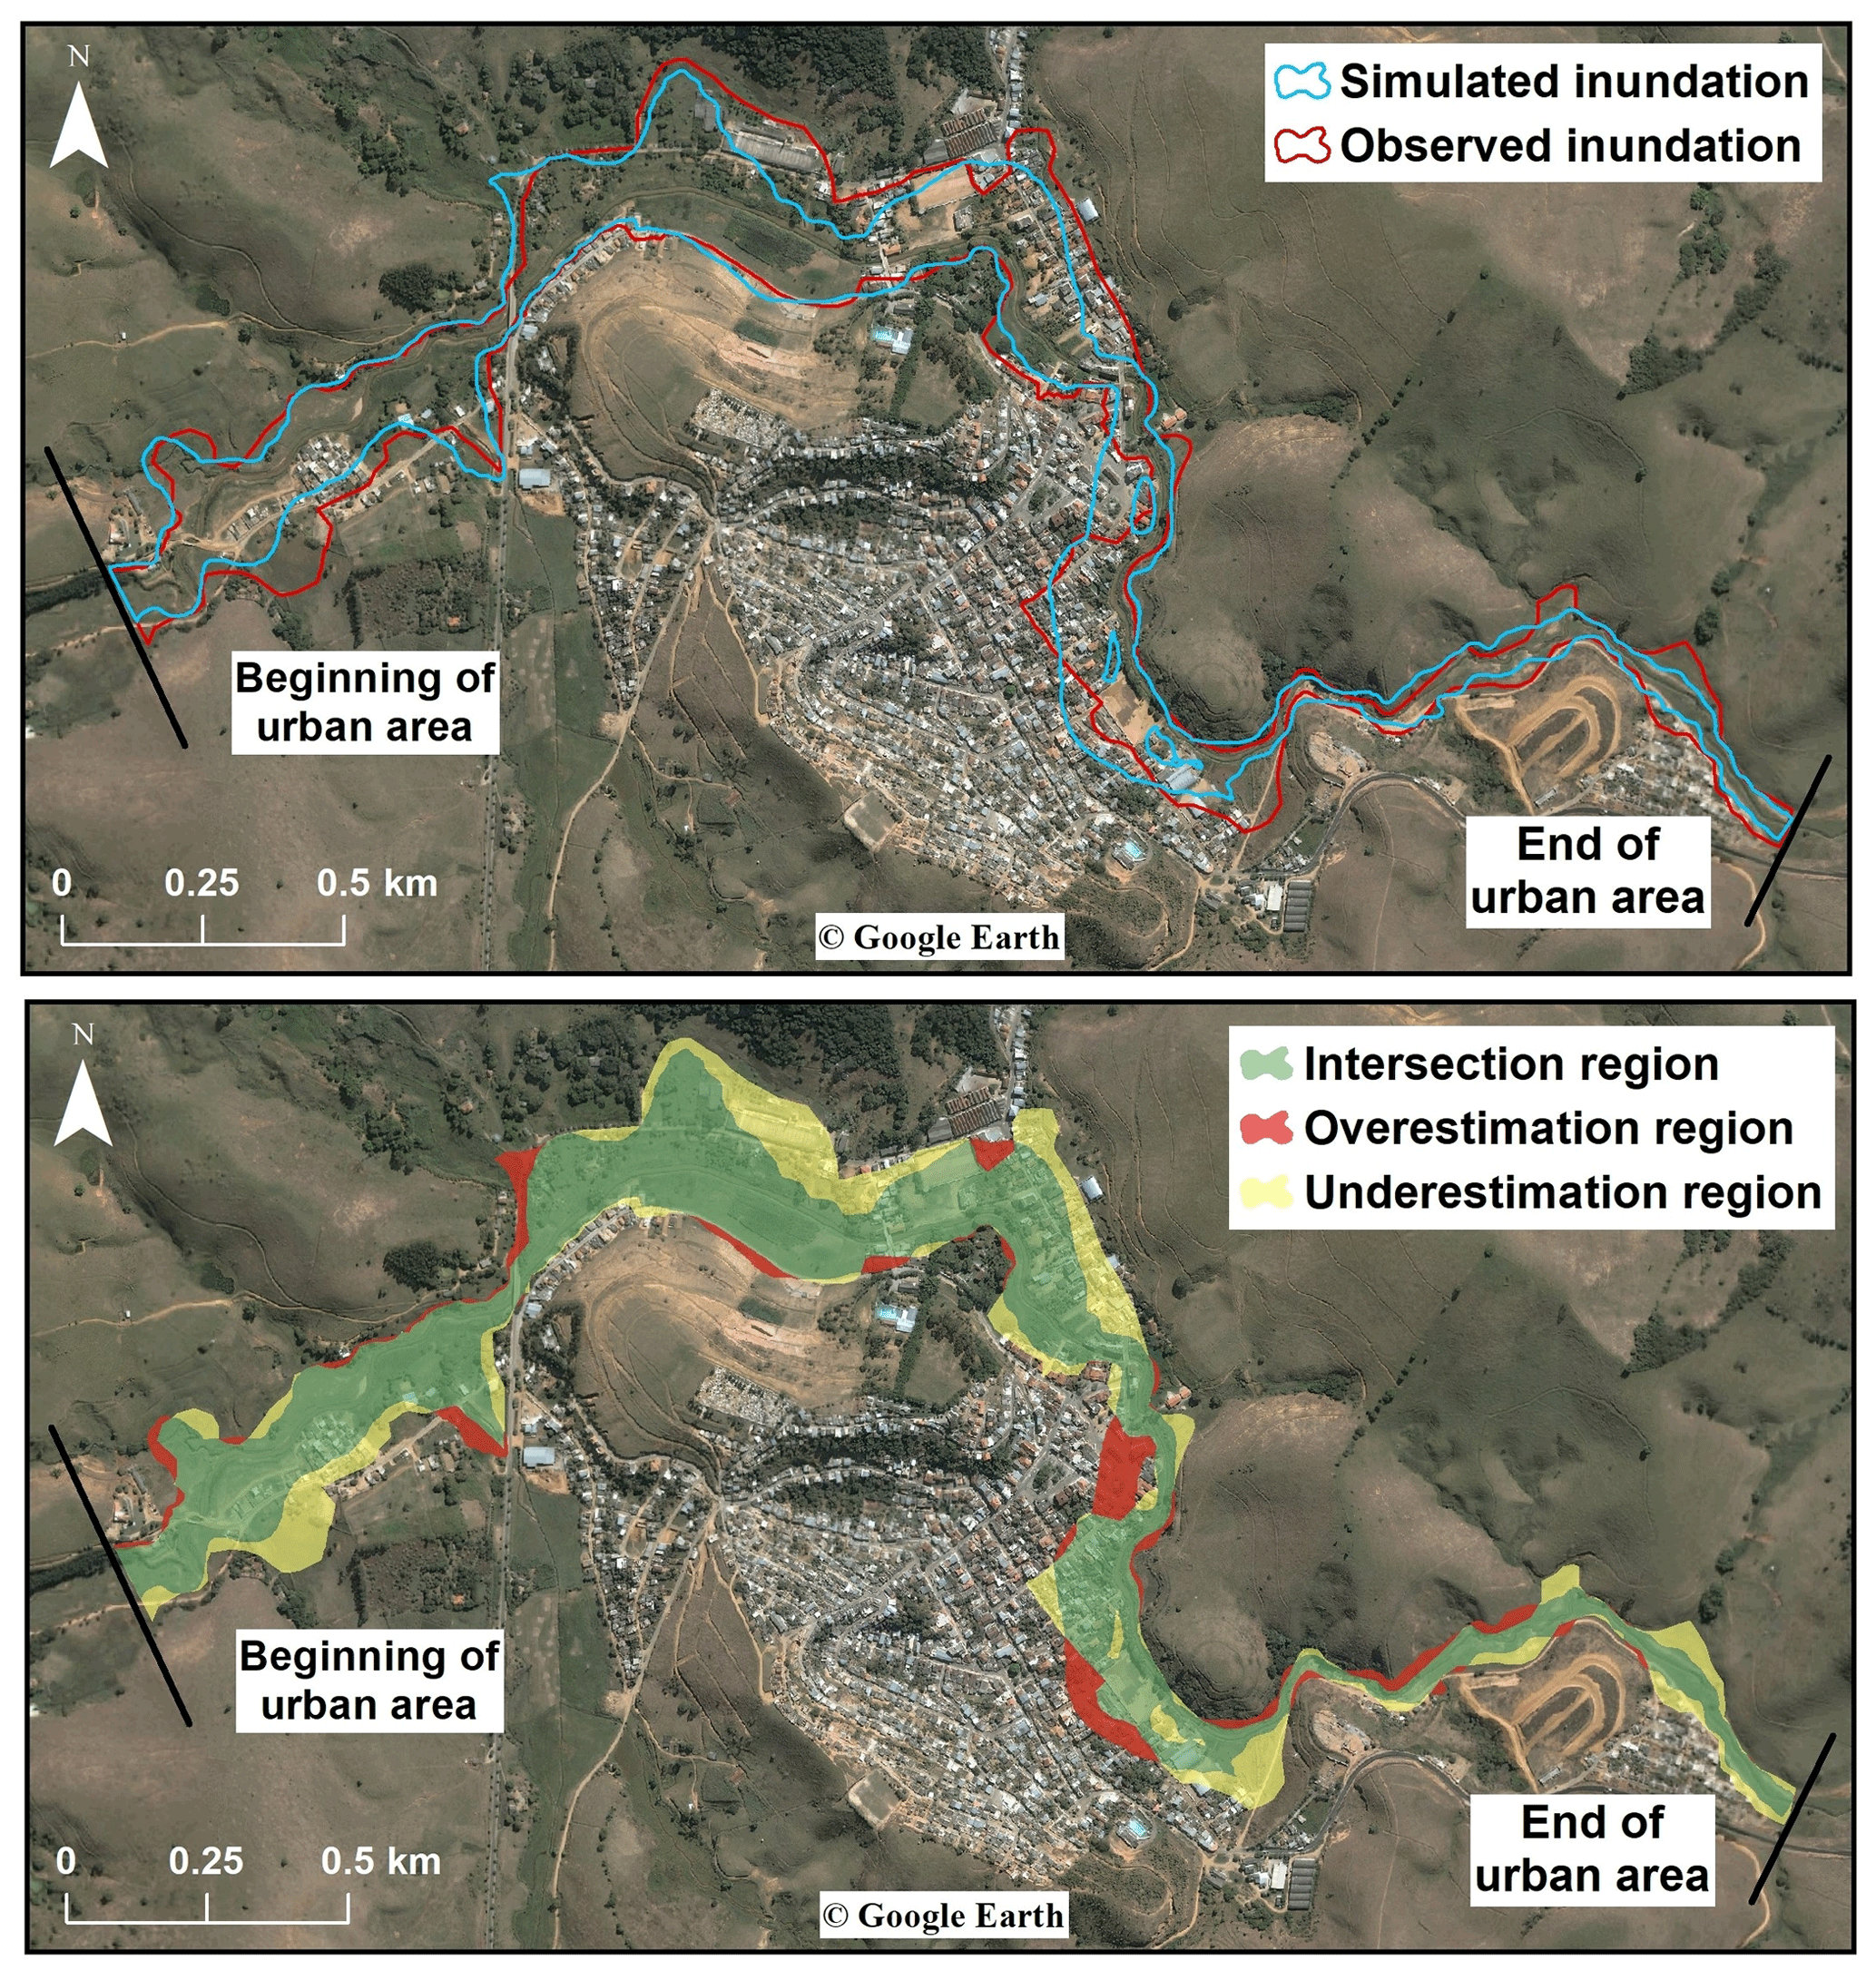
Figure 8Cutout of the envelope of the inundation boundary simulated and observed from the São Francisco dam breach in Miraí city.
3.2 Potential damage and expected loss of life modeling
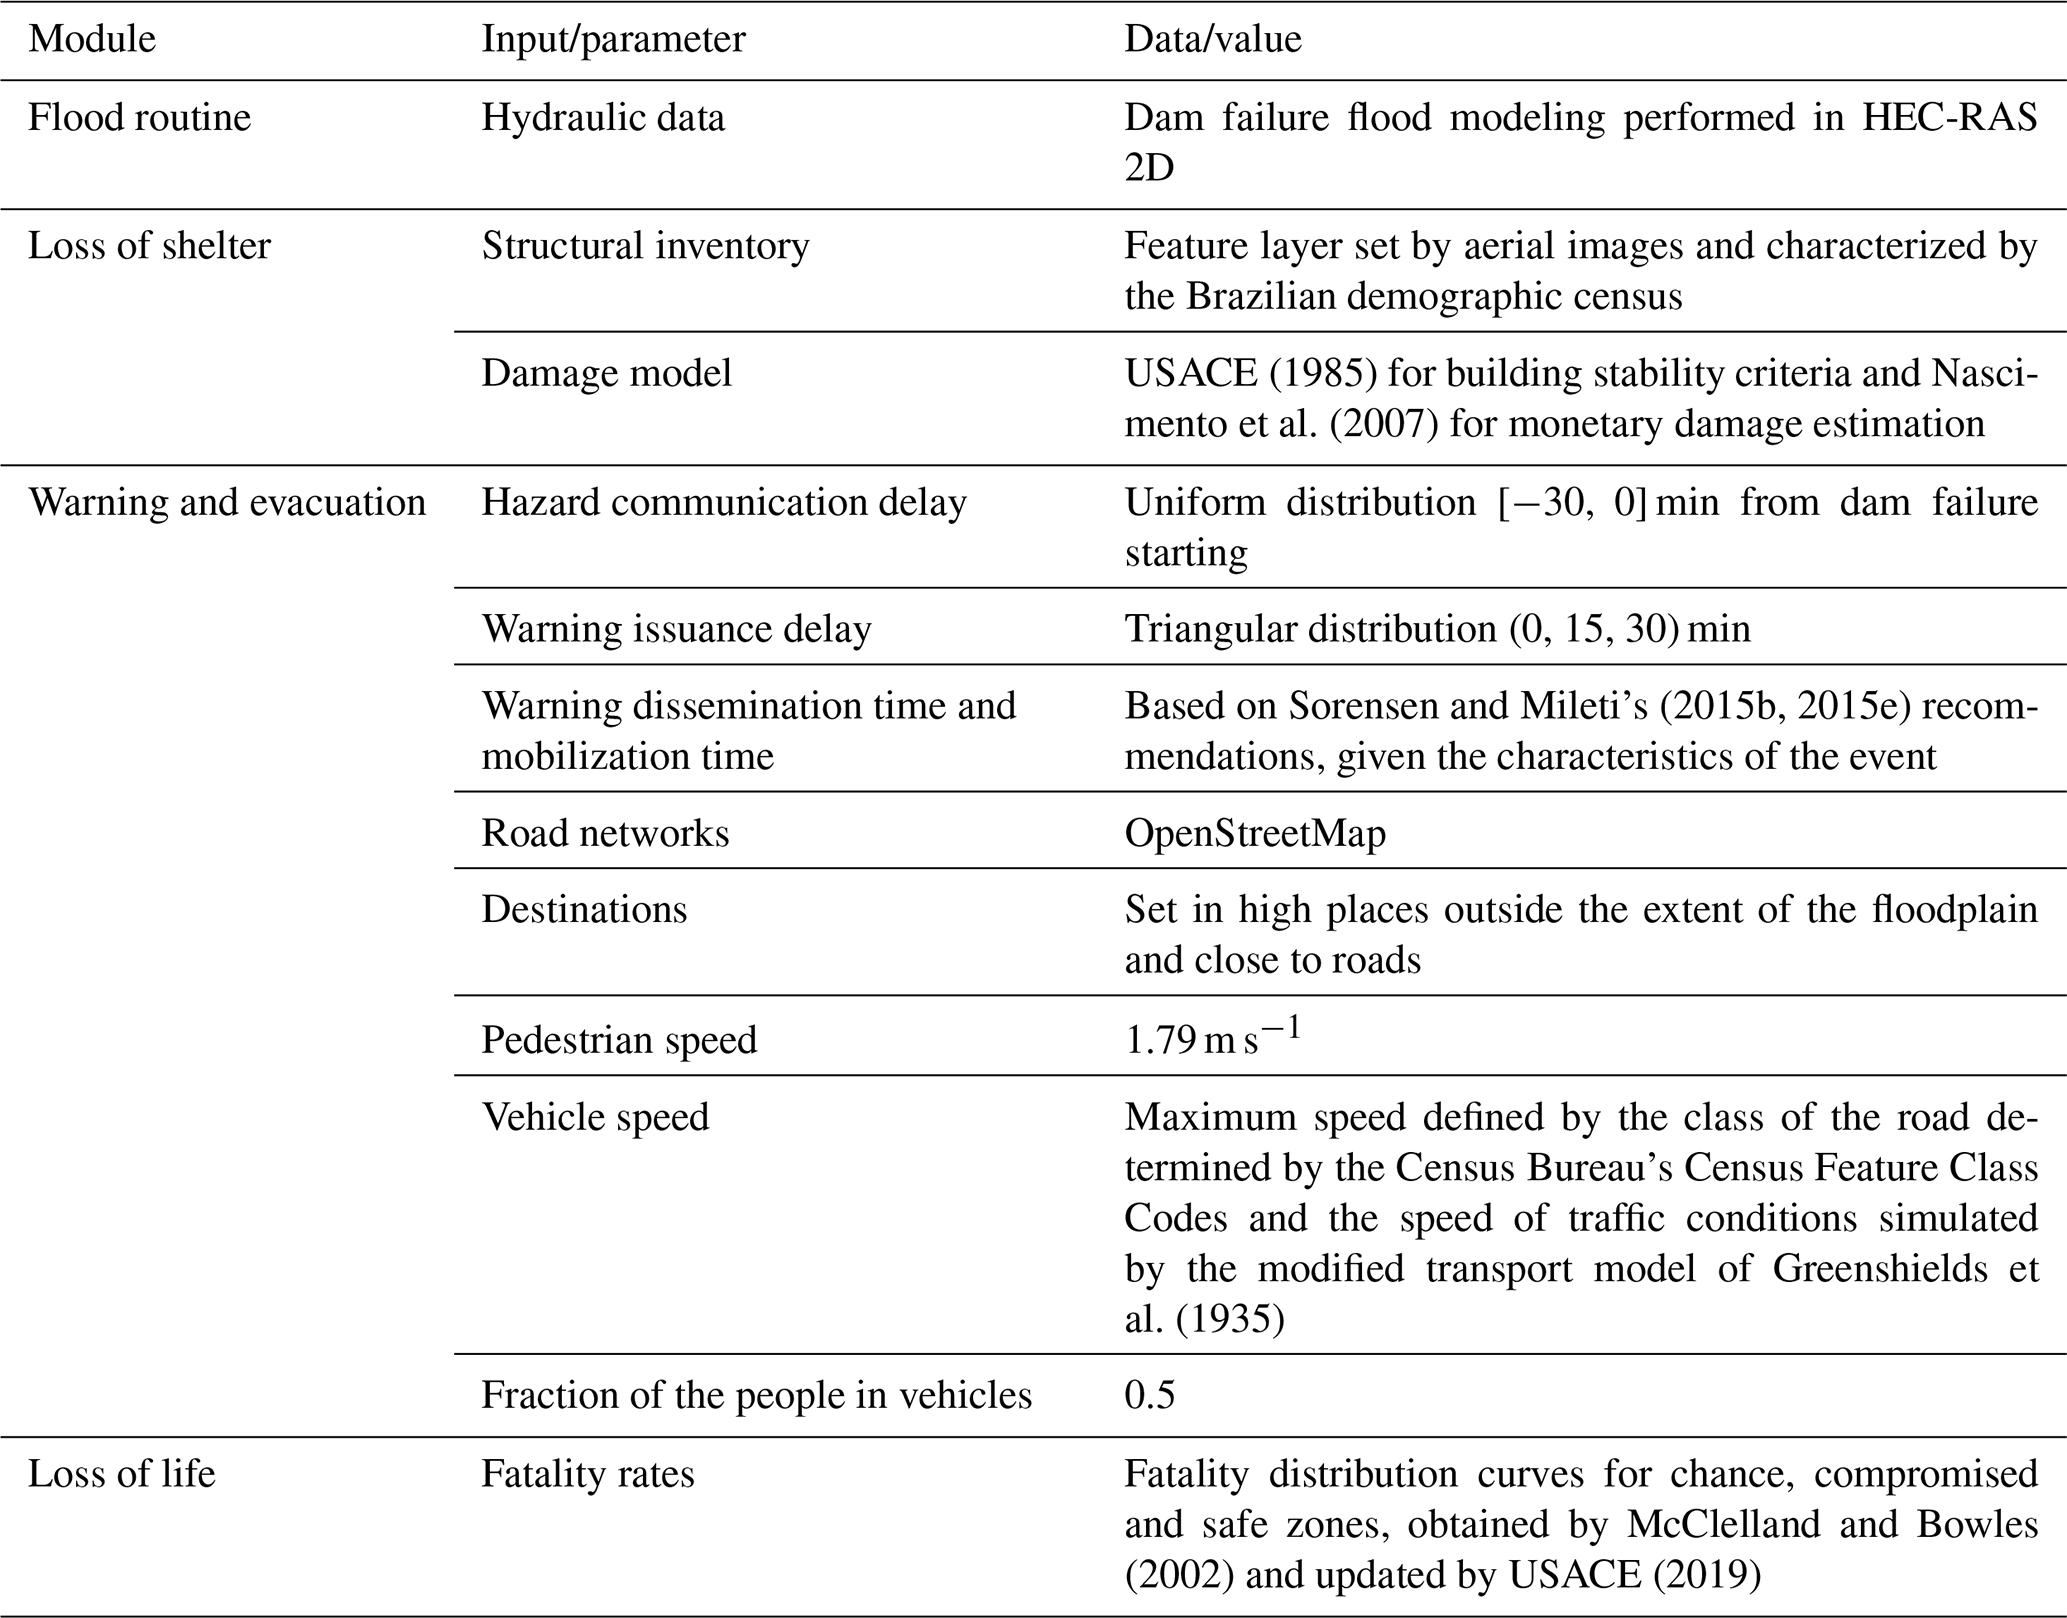
The agent-based life-loss estimation model used (HEC-LifeSim v.1.0.1) is structured using a modular modeling system (Zhuo and Han, 2020). Each module exchanges information with other modules through a database that includes multiple layers and tables of the geographic information system (GIS) in this system. The model also presents the uncertainty module, which allows for the insertion of uncertainty boundaries in several input parameters. Propagation of these uncertainties occurs with Monte Carlo simulations. The four modules present in the methodology are “flood routine”, which contains a set of networks representing flood characteristics throughout the inundated area and period; “shelter loss”, which simulates the exposure of people and buildings during each event as a result of building submergence and potential structural damage; “warning and evacuation”, which simulates the distribution of the population at risk after the warning issuance; and “loss of life”, which estimates fatalities through probability distributions (USACE, 2019). The inputs in the four modules are summarized in Table 2 and are further elaborated on below.
Exposure and vulnerability analyses were carried out to prepare an inventory of buildings presenting and characterizing the structures and populations at risk in the flood-affected region. The following information was consolidated for buildings and population in the shelter loss module: dwellings location, occupation type, construction material, number of floors, and population under and over 65 years of age (mobility criterion).
The affected population and number of households were determined by a set of regular statistical grids integrating data from different sources and aggregated in incompatible geographic units (IBGE, 2016). For each grid in the flood-affected region (Fig. 9), households were geographically allocated with the aid of satellite images, and the population per household was considered homogeneously across the entire grid. Once residential buildings majorly occupy the impacted area and because the breach occurred during the night, outside business hours, other types of construction were not considered in the study.
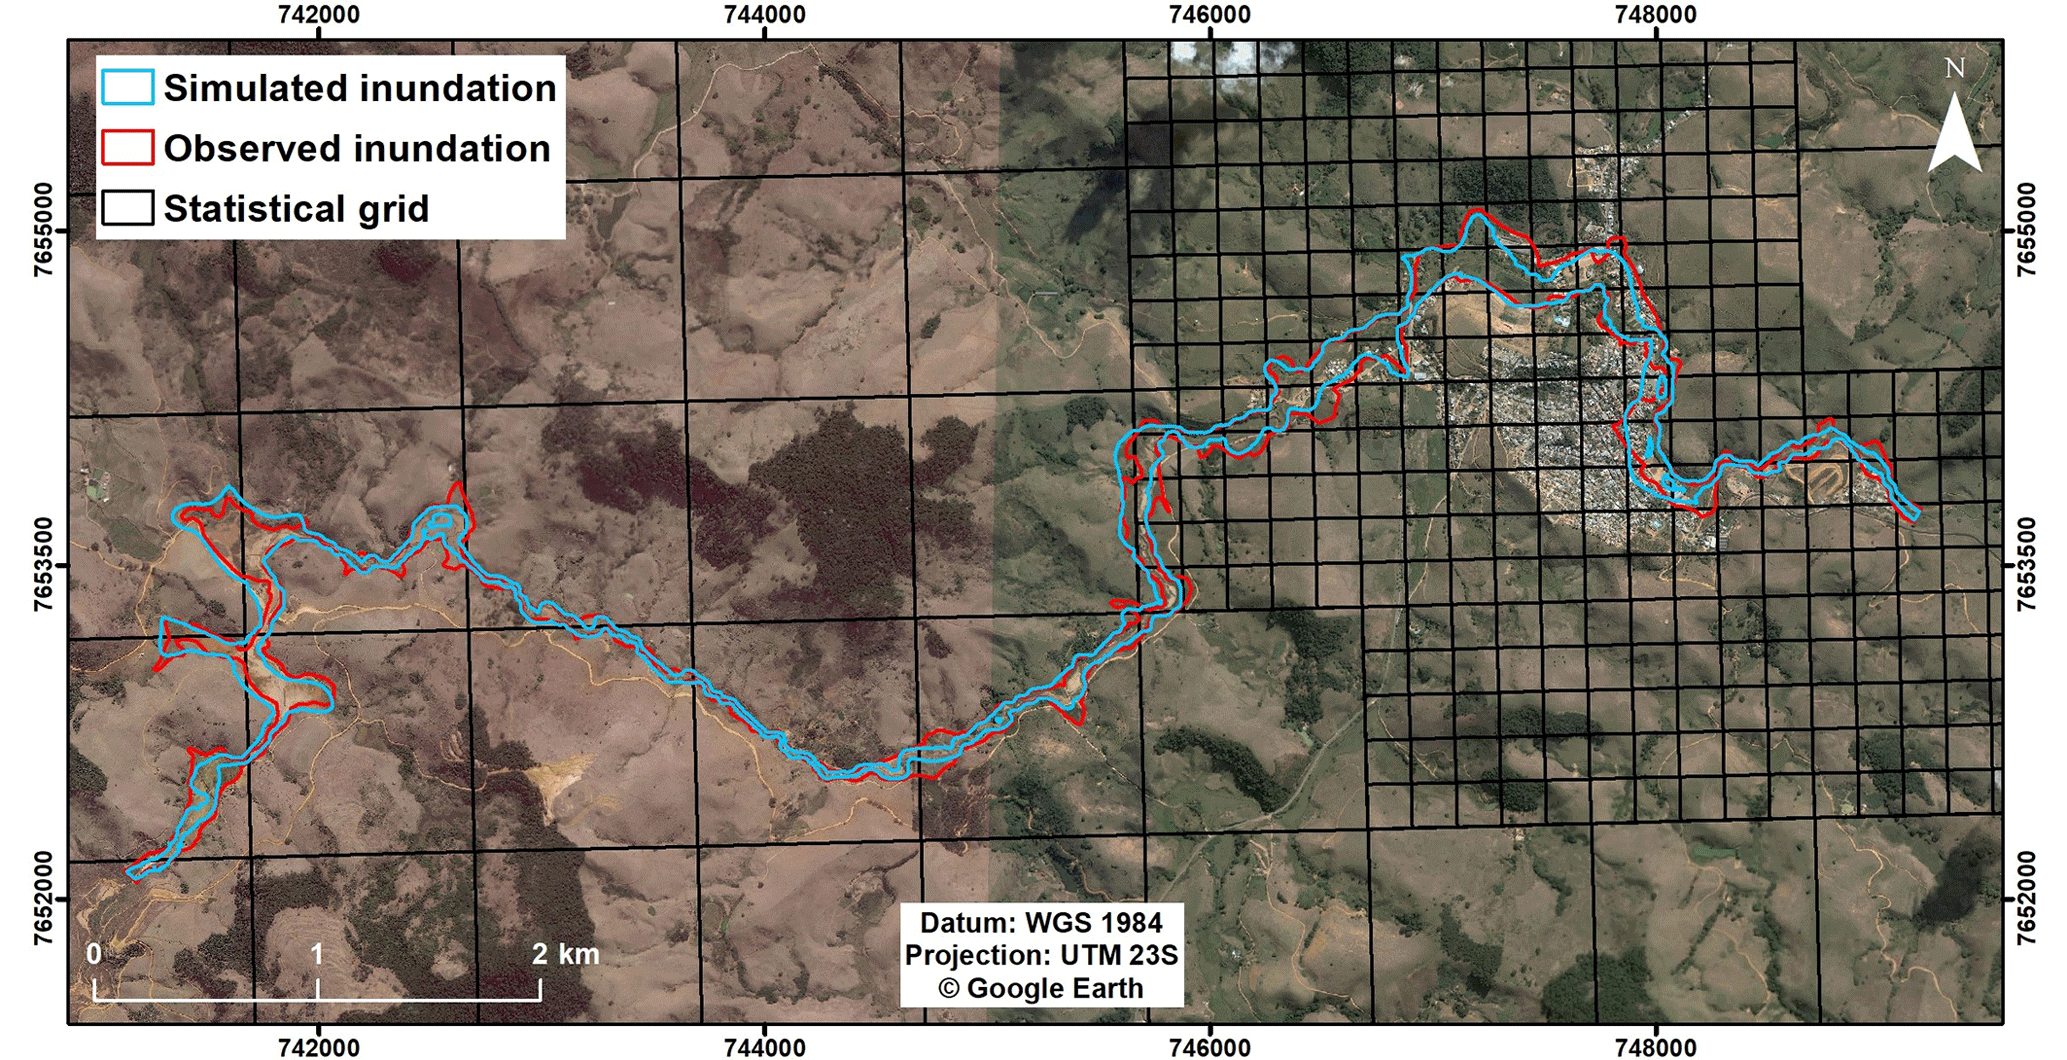
Figure 9Statistical grid in the flood-affected region.
The exact number of buildings directly impacted by the flood wave in 2007 was not recorded. In local studies, it is possible to estimate that the number of buildings directly affected is between 300 and 500. The observed estimated flood boundary indicates that 358 households may have been directly affected (354 in the urban area and 4 in the rural area). The simulated flood boundary indicates 311 buildings (308 in the urban area and 3 in the rural area) (Fig. 10).
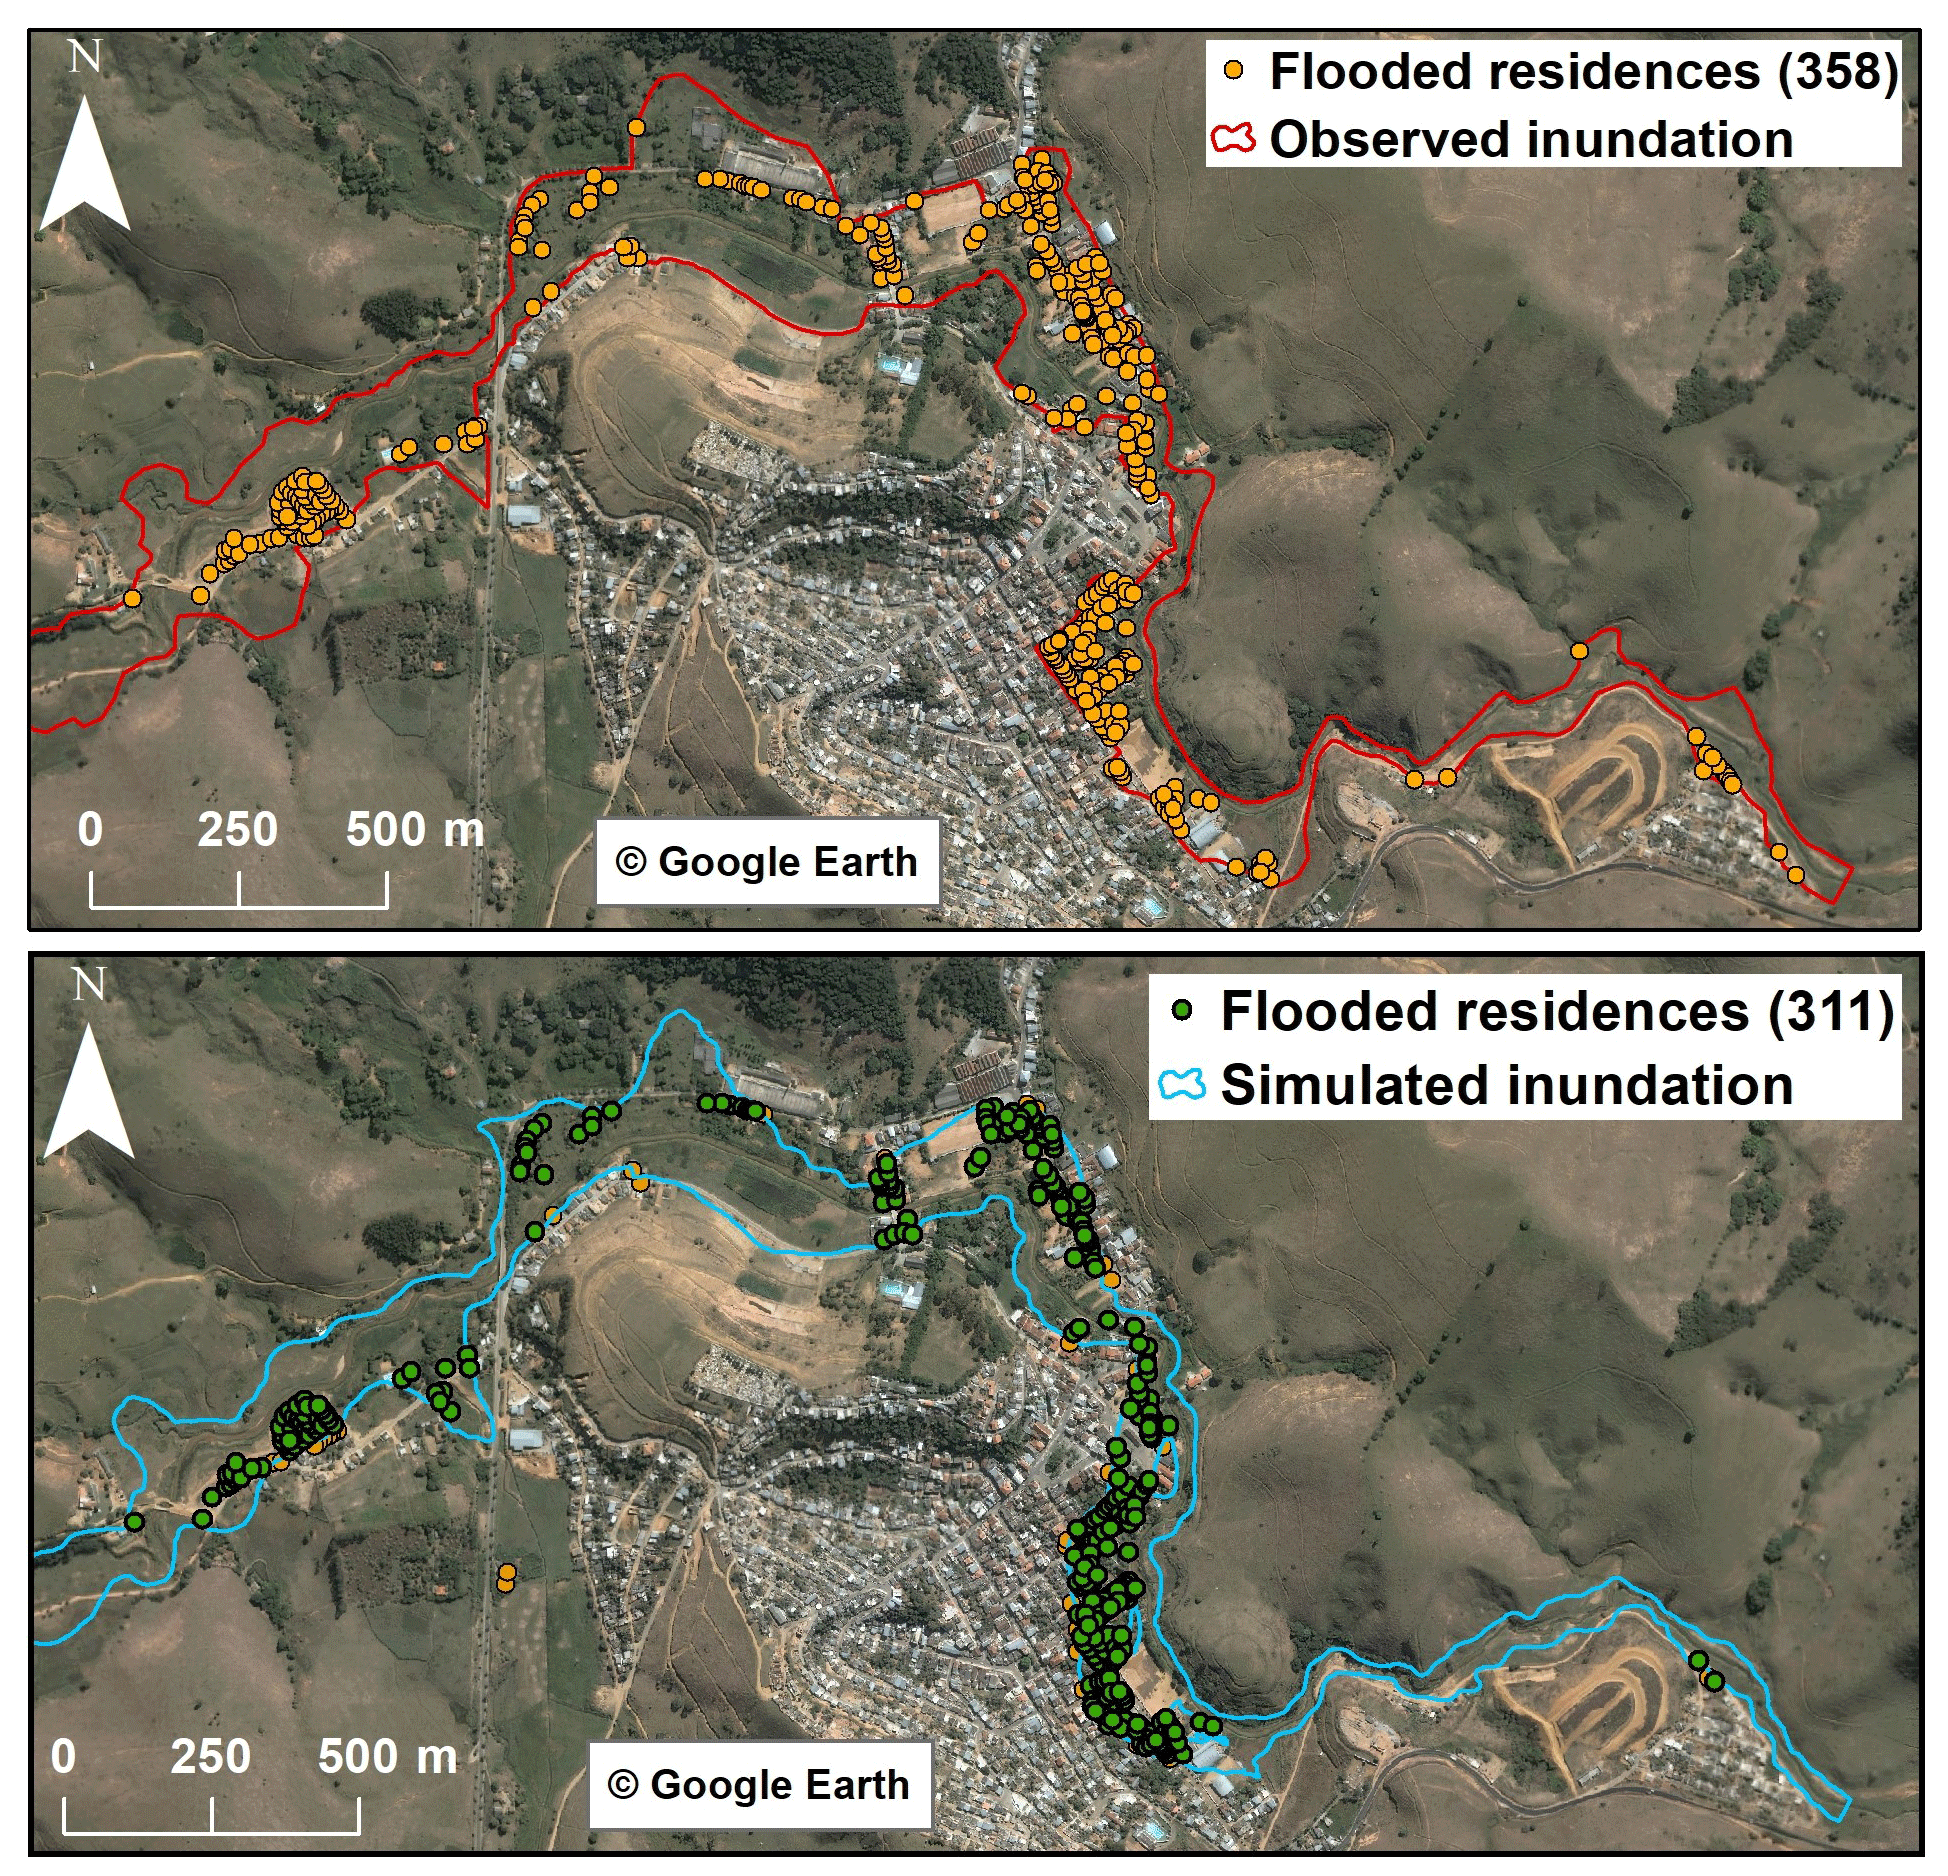
Figure 10Zoom-in of the urban area of Miraí city indicating the households potentially affected by the observed and simulated inundation boundary.
In order to characterize households and the population obtained by the statistical grid, samples of households and people existing in the 2010 Brazilian Demographic Census microdata were used, which are the main reference for characterizing the population in Brazilian urban areas. For the confidentiality of research informants, the smallest geographic unit for identifying microdata is the weighting area, which is formed by grouping census sectors (IBGE, 2011). Therefore, the results obtained considering the weighting areas of interest were arranged proportionally and distributed evenly in the affected region. Each sample element was multiplied by its sample weight to represent the population.
The sample of households also enabled the determination of construction material, occupation type, and social class, which is essential for damage evaluation purposes. The construction materials considered were masonry and wood. Occupation types were adopted considering the building codes presented by Gutenson et al. (2018): single-family home (RES1), temporary accommodation (RES 4), institutional dormitory (RES 5), and asylum or orphanage (RES 6). The social class was defined using the average monthly family income defined for each class as proposed in the Brazil Economic Classification Criterion 2010 from the Brazilian Association of Research Companies (ABEP, 2012). The sample of people enabled the determination of the population under and over 65 years of age that were present at home at night using the variable “return home”.
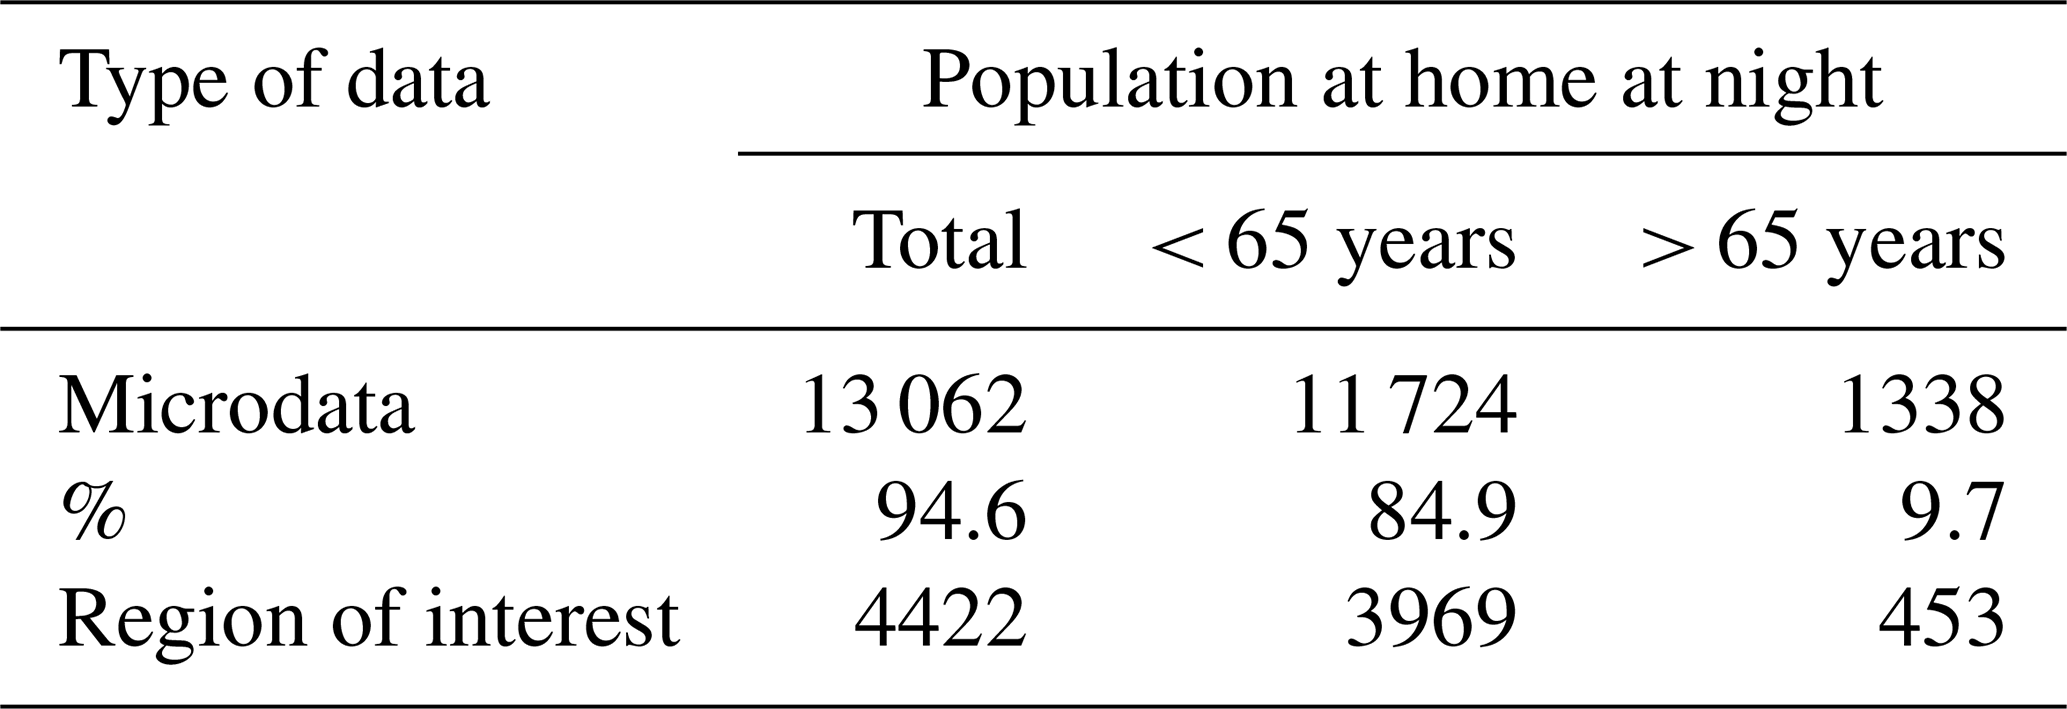
Statistical grids showed that 1537 households were affected by the flood, corresponding to a population of 4675 people. The microdata analysis considered the only weighting area existing for Miraí city. A total of 4209 households were obtained in the considered weighting area, in which there is a predominance of single-family residential typology, masonry construction material, and social classes C and D (Table 3). The total population in the weighting area was 13 808, with 94.6 % being at home at night (Table 4).
Table 3Data obtained from the 2010 Brazilian Demographic Census microdata on households in the affected region of Miraí city.
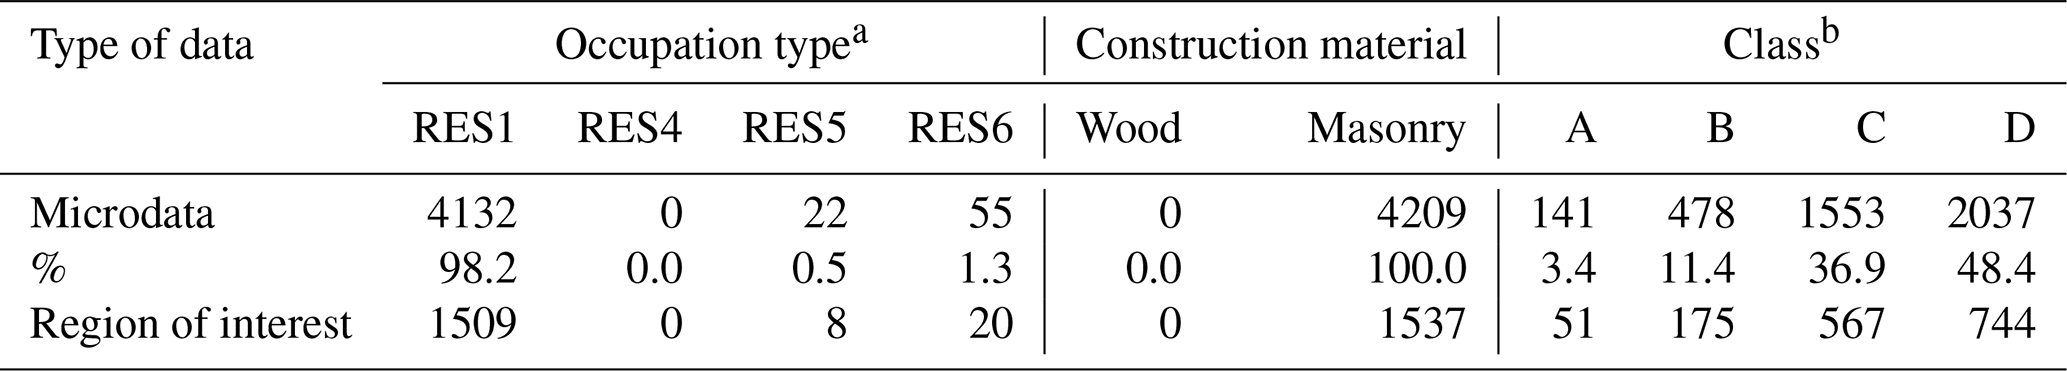
a RES1: single-family home, RES 4: temporary accommodation, RES 5: institutional dormitory and RES 6: asylum or orphanage, defined according to Gutenson et al. (2018). b Socio-economic classes A, B, C and D, with A being the highest and D the lowest, according to criteria established by ABEP (2012).
Table 4Data obtained from the 2010 Brazilian Demographic Census microdata on the population in the affected region of Miraí city.
By the analysis performed, the directly affected population at night was 1033 and 868 for the extent of observed and simulated flooding, respectively. In order to minimize the possible effects of overestimating and underestimating the extent of the flood on the number of buildings and people directly affected, we constructed an alternative scenario of exposure and vulnerability analysis. In this scenario, the number of people allocated to the residences within the simulated inundation boundary was increased to equal the number of people affected according to what was found in the observed area. This excess number of 165 people was randomly allocated to the affected households according to the extent of the simulated flood, keeping the percentages in Table 4.
For building submergence in HEC-LifeSim, three flood head limits physically defined by the interaction between existing shelter and depths thresholds are proposed: “chance zone”, “compromised zone”, and “safe zone”. Chance zone refers to a condition where flood victims are typically swept downstream or trapped underwater, and survival depends largely on chance. Compromised zone refers to a condition where the shelter has been severely damaged, increasing the exposure of flood victims to violent floodwaters. On the other hand, the safe zone is typically dry, and the life-loss probability is virtually zero. Stability is defined by the speed and depth criteria for structural damage in buildings, considering occupation type, construction material, and the number of floors. HEC-LifeSim allows the use of several stability criteria, among these the criteria of USACE (1985) and RESCDAM (2000).
The warning and evacuation module represents the distribution and behavior of the population during the flood event, including each emergency planning zone (EPZ) in the affected area. This process has several milestones that are separated by time lag intervals, as shown in the timeline in Fig. 11.
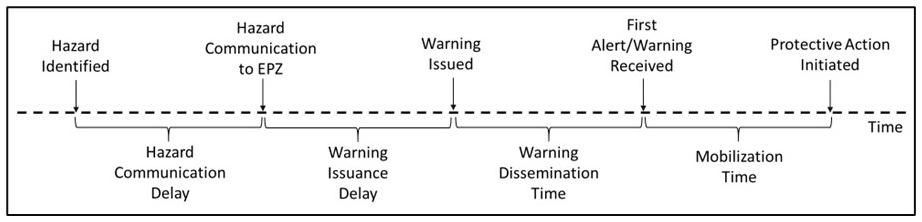
Figure 11Warning and evacuation timeline. Source: USACE (2019).
The timeline starts from the identification of the imminent threat and presents the first delay in communicating the threat to managers. In both situations, no studies assist in determining these values; therefore, the user must determine the time considering the characteristics of the case under study. In contrast, the choice of time in the other three subsequent delays is supported by the studies and equations of Sorensen and Mileti (2015a–e). These authors analyzed many disaster cases with data available for evacuation, not only about floods but also about chemical and fire accidents, adjusting models through the historical cases and defining coefficients to represent a certain type of existing warning system and population characteristics. Besides, in the identification of the threat and all delays, it is possible to insert uncertainty in the input data.
For the dynamics of evacuation, the modified transport model of Greenshields et al. (1935) is used to represent the effects of traffic density and road capacity on vehicle speed, and the short path algorithm of Dijkstra (1959) is used to determine the path with the shortest travel time to the destination. The user can insert the road network or import directly by OpenStreetMap. If the flood reaches the vehicle or people during the evacuation, the stability criteria defined by Aboelata and Bowles (2005) are used. If these criteria are exceeded, the affected population is allocated to the chance zone; if it is not exceeded, the population is allocated to the safe zone. Other evacuation parameters, such as the fraction of the population in vehicles vs. on foot, are presented in Table 2.
For the representation of the warning and evacuation timeline, the delays for each step in Fig. 11 were determined. Based on the information regarding the watchman's perception of the imminent danger before the breach, the period between the hazard identification time and the communication to the emergency planning zone was determined as a uniform distribution from 0 to 30 min before the dam breach. This interval corresponds to the period between the perception of the watchman and the start of the dam's collapse. For warning issuance delay, a triangular probability distribution was adopted with the minimum, most likely, and maximum values of 0, 15, and 30 min, respectively. The other two stages, with their respective uncertainties, were defined through the relationship between the characteristics of the warning that occurred at the event and the recommendations of Sorensen and Mileti (2015b, e). Figure 12 shows the 90 % confidence interval for the percentage of the population mobilized after the alert was issued (which is the sum of these last two delays). By the median, the entire population starts evacuating 150 min after the alert is issued.
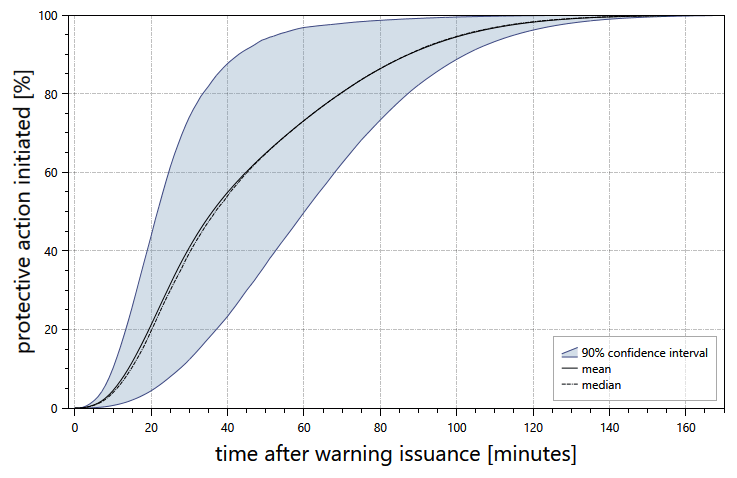
Figure 12Combined dissemination and mobilization time for the evacuation scenario in the Miraí accident.
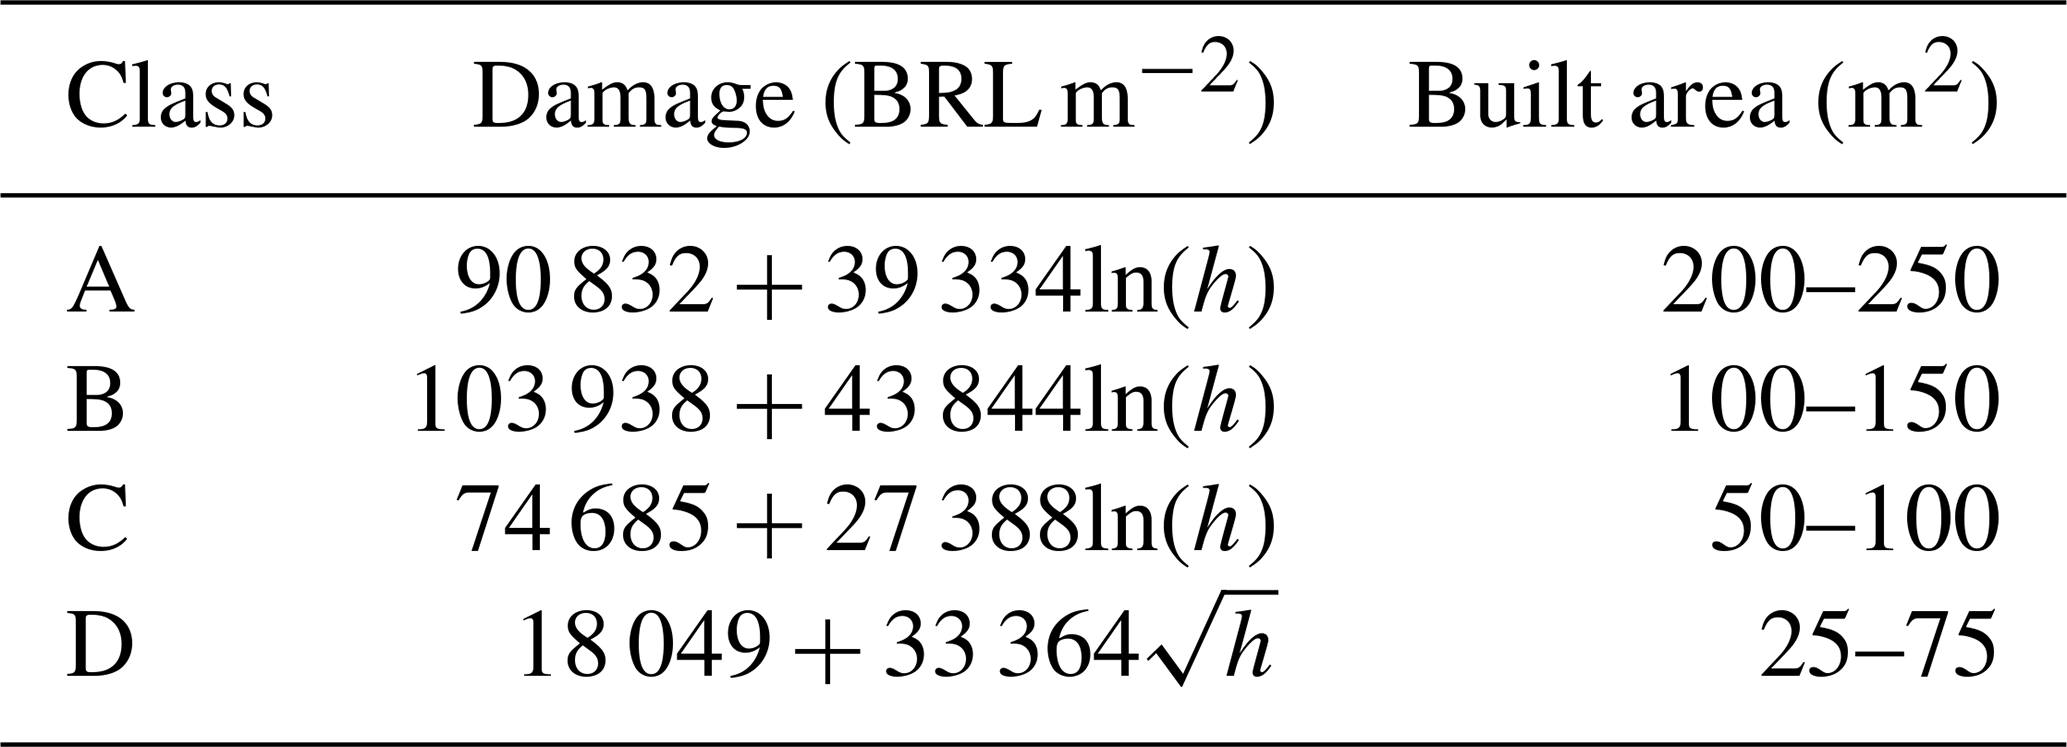
The fatality distribution curves, obtained by McClelland and Bowles (2002) and updated by USACE (2019) through the analysis of historical cases of mainly dam breach floods, were applied in the loss of life module. In order to determine the economic damage, the empiric national equations of Nascimento et al. (2007) were inserted into HEC-LifeSim for each social class affected by the flood. The curves relate the depth (h) in meters to the damage in BRL m−2 (reals per square meter of built projected area) to the property structure and its contents. The built area of the affected households was estimated in the function of national social classes, as defined by Nascimento et al. (2006). Table 5 presents the equations and ranges of built area for each social class. These equations were proposed in 2007, and for their use it needs a correction of the values by some inflation index.
Table 5Model for economic damage and the most frequent range of built area as obtained by Nascimento et al. (2007) for each social class.
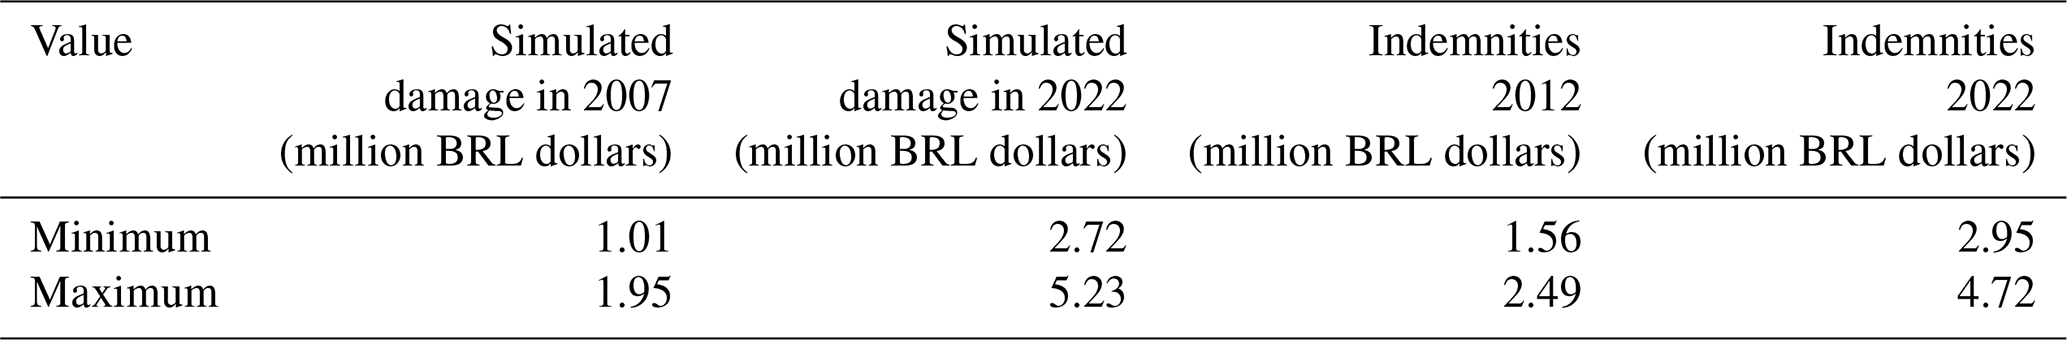
After 1000 interactions (value used in studies applying HEC-LifeSim), the economic damage was estimated at BRL 1.01 million to BRL 1.95 million for the 311 households affected directly by the simulated flood. Corrected by a factor of 169.12 % (based on the Broad National Consumer Price Index – IPCA in June 2022), this value corresponds with BRL 2.72 million to BRL 5.23 million in 2022 (USD 521 thousand to USD 1.00 million).
According to the public registry, 500 lawsuits related to property material damage were filed by residents against the mining company following the accident. Several of these lawsuits, judged between 2012 and 2013, resulted in indemnities ranging between USD 956 and USD 1530 (STJ, 2014). Assuming that this indemnity range was allocated to each household and applying it to all 311 affected households, a range between BRL 1.56 million and BRL 2.49 million is obtained in 2012. By using the IPCA-based correction factor of 89.67 %, this value corresponds with BRL 2.95 million to BRL 4.72 million in 2022 (USD 564 thousand to USD 902 thousand). Thus, on average, this range of indemnity values was close to the simulated economic damages for households (between BRL 4.64 thousand and BRL 8.92 thousand per household impacted according to the corrected value for the year 2012) (USD 888 thousand to USD 1.71 thousand). Table 6 summarizes the results of flood economic damage estimation.
Table 6Summary of economic damage using the Broad National Consumer Price Index – IPCA to update the value to 2022.
Regarding the estimated loss of life, the values obtained following the actual event have a median of zero fatalities. On average, 99.97 % of the population escaped the flood. Fatalities were estimated in only 67 of the 1000 interactions, the frequency of occurrence of which was one fatality in 65 interactions, two fatalities in one interaction, and three fatalities in one interaction.
For the alternative scenario of exposure and vulnerability, fatalities were estimated in 65 interactions, the frequency of occurrence of which was one fatality in six interactions, two fatalities in 58 interactions, and three fatalities in one interaction. This result indicates that the model fitted the real event, and the difference in the population directly affected by the extent of observed and simulated flooding did not influence the estimated loss of life.
Furthermore, in all 66 interactions in the base scenario that resulted in one or two fatalities, the loss of life concerned the population over 65 years of age, who were not mobilized for evacuation and, therefore, were allocated to some of the flood risk areas. The same result was noticed in 62 of 64 iterations in the alternative scenario. This behavior indicates the impact on the divergent submergence thresholds defined by Aboelata and Bowles (2005) to represent the mobility criterion. For the chance zone, the threshold is 4.58 and 1.82 m for people under and over 65 years of age, respectively. As expected, the simulated flood extent uncertainty highlighted before did not influence the life-loss estimates.
3.3 Analysis of warning and evacuation efficiency
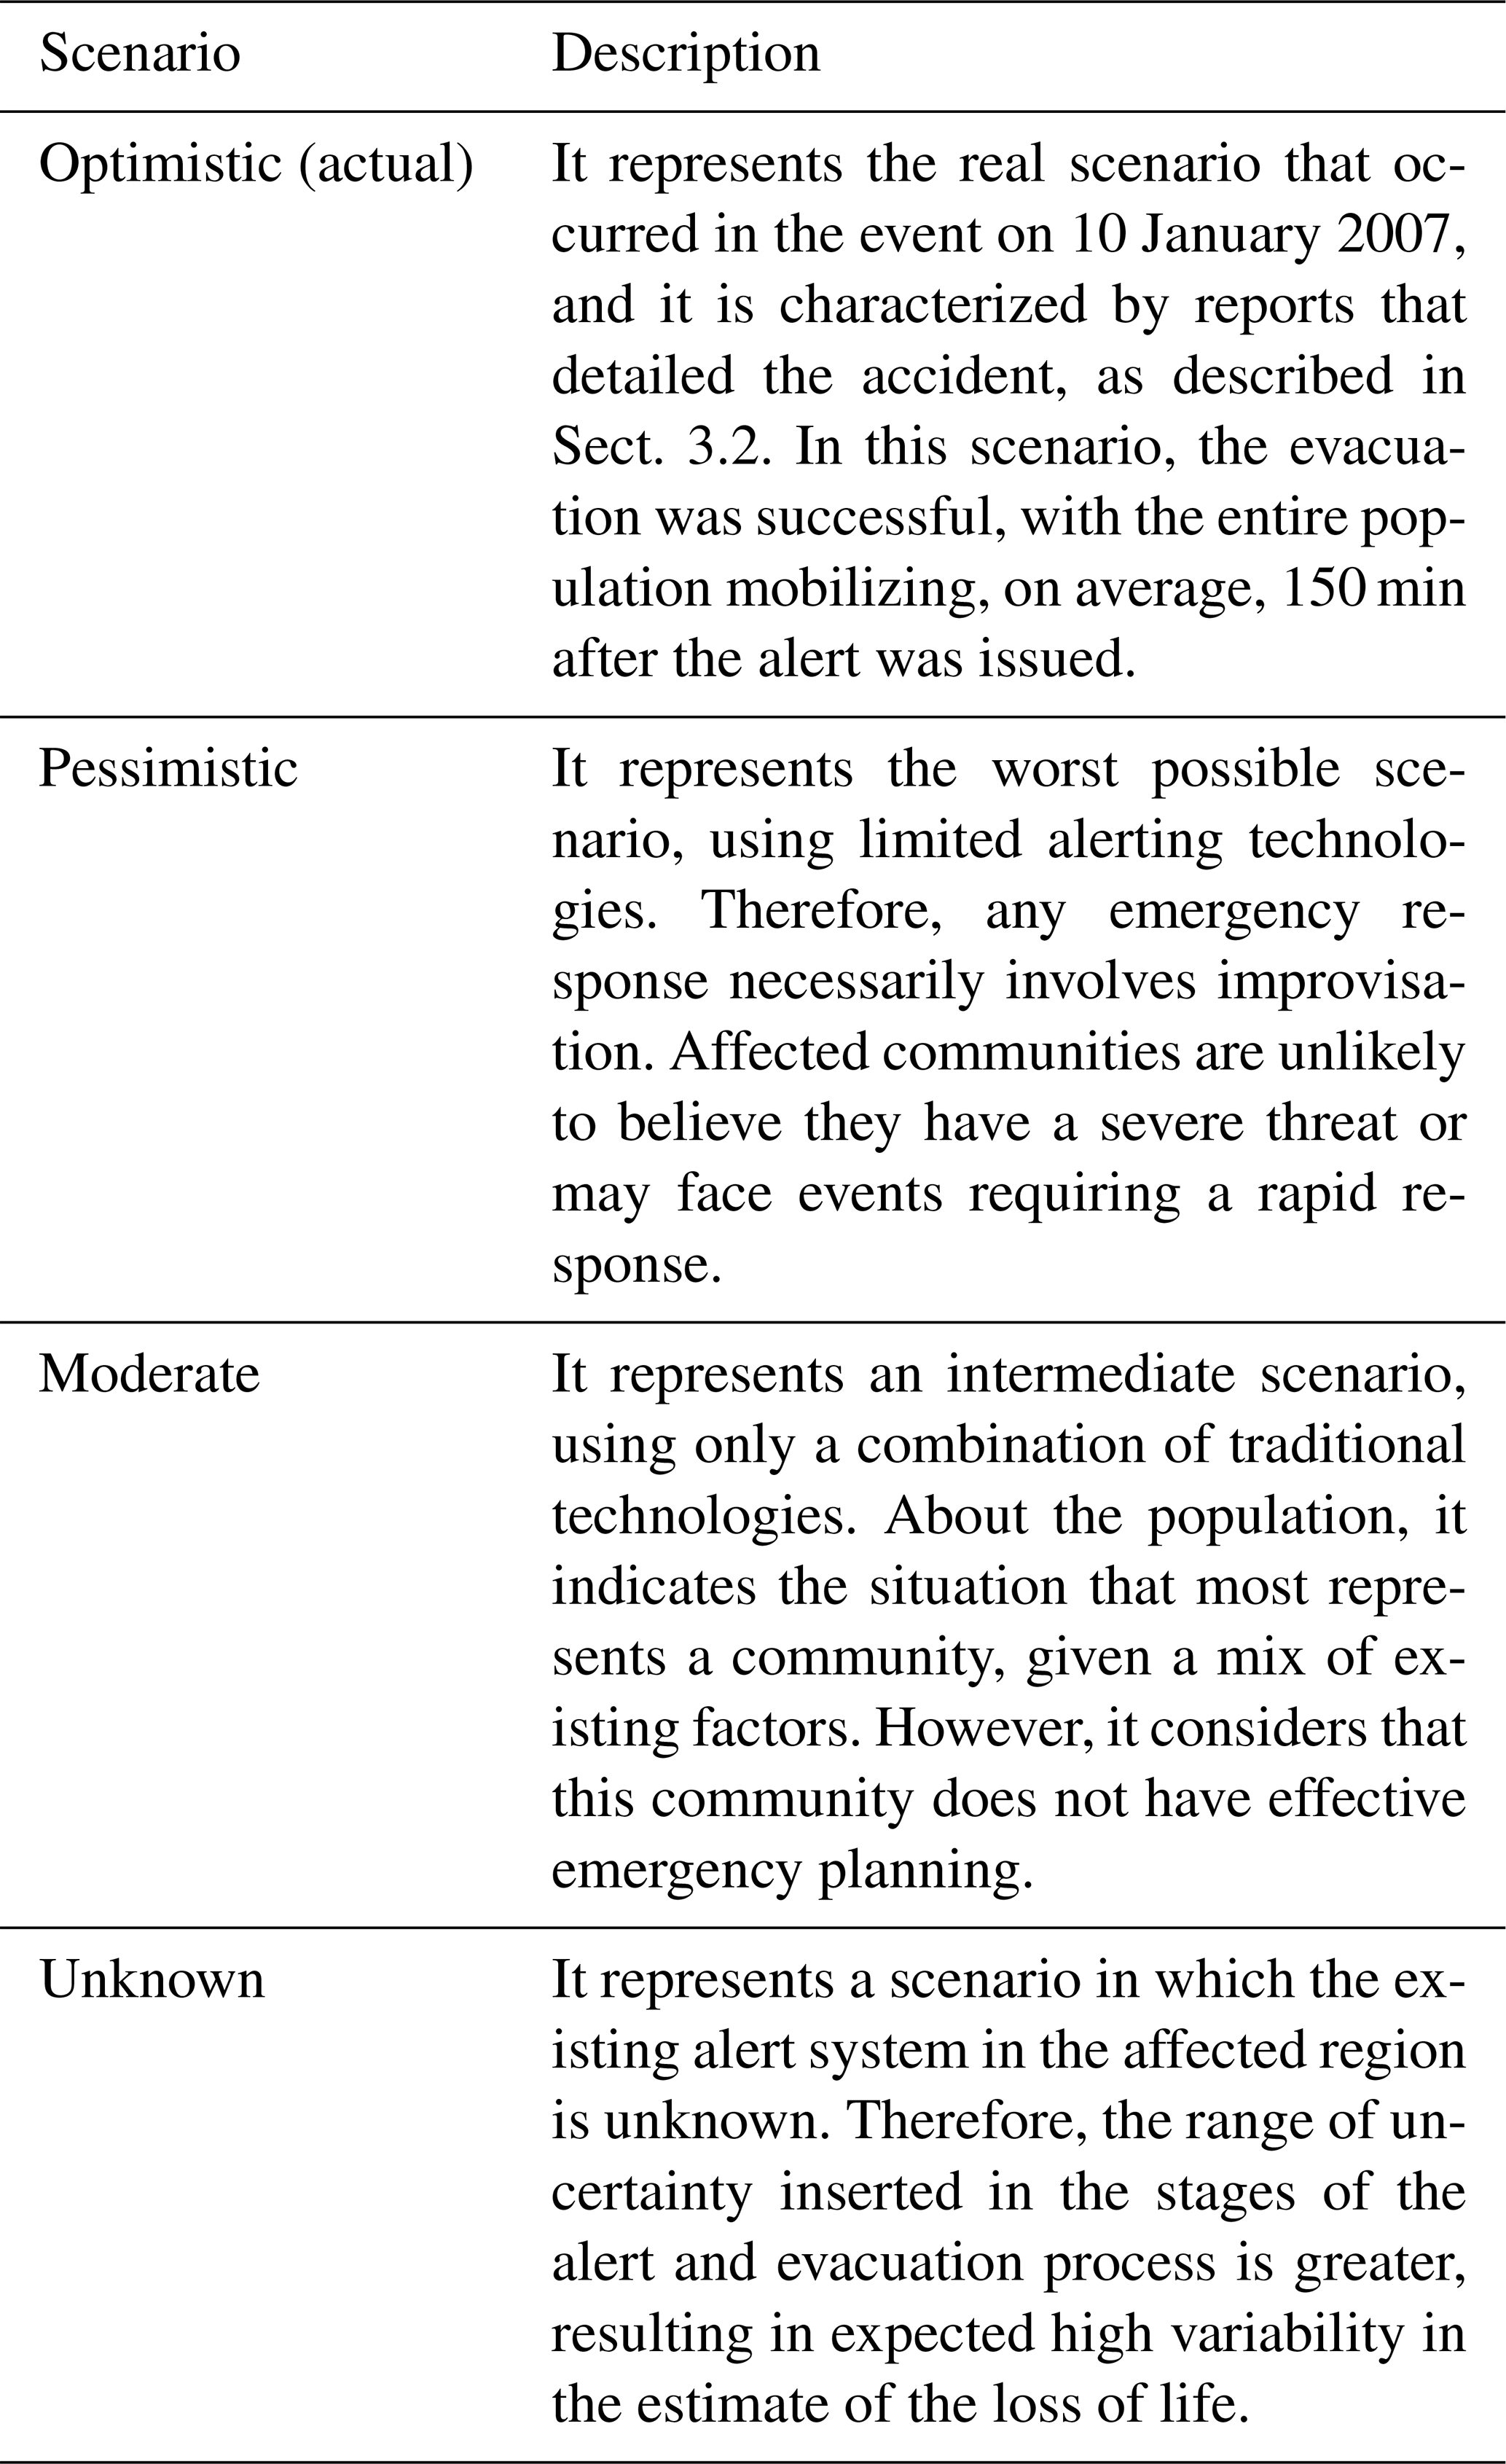
An effective warning system depends on several factors and is essential for selecting appropriate emergency management (Rogers and Sorensen, 1989; Lumbroso and Davison, 2018; Tonn and Guikema, 2018; Kolen et al., 2020). To assess the success of the warning and evacuation with a view to a good representation of the simulations in comparison with the observed data, we developed, beyond the actual “optimistic” scenario that occurred, three more scenarios: “pessimistic”, “moderate”, and “unknown” (Table 7). The simulations were executed for both base and alternative scenarios of exposure and vulnerability. The period between the time of identification of the hazard and the communication to the emergency planning zone was considered null. The three remaining steps, warning issuance delay, warning dissemination, and mobilization time (Fig. 11), were defined through the recommendations of Sorensen and Mileti (2015a, b, e) for issuance and dissemination of the warning and mobilization of the population.
Table 7Description of each modeled scenario of warning and evacuation efficiency.
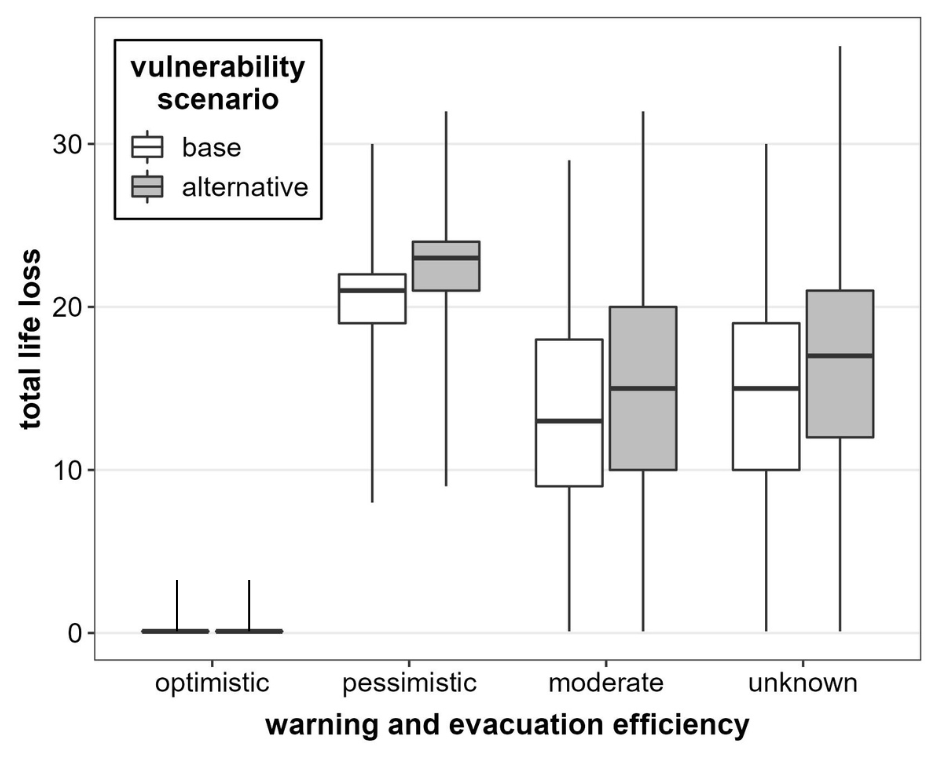
When simulating these three additional alert and evacuation scenarios, differences were found between the two exposure and vulnerability scenarios (Fig. 13). In all simulations, the median of the alternative scenario was higher by two fatalities compared to the base scenario: respectively, for the base and alternative scenarios, it was computed to be 21 and 23 losses for the pessimist alert and evacuation scenario, 13 and 15 losses for the moderate, and 15 and 17 losses for the unknown. In addition to verifying the high impact of the level of efficiency of the alert and evacuation system, the observed and adopted optimistic scenario in the evacuation process was confirmed in the real representation of the event that occurred in 2007. In all the standard curves of Sorensen and Mileti (2015a, b, e) used to represent the delay in the issuance of the alert, the dissemination of the alert, and the mobilization, the estimates of the loss of life were higher than those obtained throughout these scenarios.
For a priori analyses of dam failure consequences, considering several uncertainties in flood modeling is ideal for better representing the event in flood risk assessment. Despite specific disparities between simulation and observation, the flood wave propagation exhibited congruence with the factual occurrence in 2007. Although there is a difference, it is essential to note that most of the differences observed in terms of area are not highly relevant for the study's purposes. These differences are mainly observed in areas without buildings or population, except in a central area where adaptations were made to improve the representation of the observed risk by addressing vulnerability and exposure.
Even though the flood extent uncertainty was not the main focus of the study, considering its relevance to the whole evaluation process, this uncertainty was partially incorporated into the evaluation by contemplating different scenarios. We evaluated the impacts of the flood model uncertainties on the impacted population estimates using two different vulnerability scenarios designed according to the observed and simulated extent of the flood. It consisted of compensating the differences between simulated and real event flood extent regarding the number of people exposed. We spatially increased and reduced the amount of the population exposed in the buildings nearby areas where differences were observed between simulations and the real event. Considering these two scenarios, we noticed that these uncertainties did not significantly impact the life-loss estimates.
The comparative analysis between actual accident records and simulation results yielded favorable outcomes in the examined case study, providing evidence of the successful implementation of alert and evacuation measures. Notably, the evacuation process proved effective, with an average of 99.97 % of the population successfully escaping the flood. This success can be attributed to the relationship between the flood timeline and the warning and evacuation.
The analysis of the tailings flood wave's spread revealed that it reached the urban area's initial (CS-04) and final (CS-06) points in approximately 2.5 and 4 h, respectively. This ample timeframe allowed for adequate mobilization of the population. Even when considering the most pessimistic scenario involving the longest warning and evacuation periods, the entire population could be fully mobilized within approximately 3 h.
Despite the inherent uncertainties associated with the tested models, the calibrated models exhibited precise evaluation capabilities in terms of economic damage and loss of life. These findings underscore the significant potential of these tools in facilitating proactive and strategic development for prevention and planning purposes.
Furthermore, the hypothetical scenarios of alert and evacuation allowed us to demonstrate that, as performed by Lumbroso et al. (2021), flood consequences may significantly increase or decrease depending on the system's efficiency. For the specific case study, loss of life could have been much more catastrophic. The simulated scenarios, exploring the inefficiency of flood alert and evacuation under poor conditions, revealed that life loss could have reached the maximum rate of 3.5 % of the exposed population (pessimistic scenario) instead of the null actual life loss recorded. Taking into account other uncertainty, we identified that life loss could have reached the maximum rate of 8.7 %, considering the unknown scenario. The fragile circumstances that led to the successful evacuation in this case study, which relied on the actions of just one professional (the watchman), could have turned into a much more catastrophic accident, highlighting the great importance of developing and implementing robust and secure alert systems for this kind of structure.
Risk assessment is an effective tool to assist in the emergency planning requested for tailings storage structures under Brazilian law. This work aimed to verify the application of consequence models by comparing their real and estimated outcomes using the dam failure event that occurred in São Francisco dam in Mirai, Brazil, in 2007. It was possible to collect the real event data mainly based on local technical reports and information collected from local authorities and post-event local studies. The breach characteristics, arrival time at the city, and flood extension are examples of this data.
The hydrodynamic modeling showed satisfactory results mainly due to the similarity in the time the flood wave arrives, which is one of the main parameters in loss of life modeling since it correlates with the time available for evacuation of the population at risk. The modeling of the economic damage was similar to the indemnity values per household. The model was also capable of representing the loss of life estimates and the success of evacuation in the event that occurred. However, in this specific case, the low concentration of solids in the flow may have been one of the factors that contributed to the success of the results obtained. We emphasize the need to carry out studies of this type for other real accidents with greater solid loads so as to expand the possibilities raised in this study.
The estimates acquired throughout the development of this case study were adherent to observed data, which sustained the great potential of the use of these modeling techniques for planning purposes. Besides, one of the great advantages of HEC-LifeSim is the possibility of dynamically simulating the evacuation of the population. The best suitability of this model in tailings dam failure events can be achieved by changing the model standards. Several criteria are editable, and changes in these criteria could assist in representing the physicochemical characteristics of the tailings. It is possible to adapt the representation of alert and evacuation to incorporate specific characteristics for a specific case (as we did in this work). Furthermore, life loss rates can be modified to account for the impact of debris and other characteristics in potential interactions between tailings and humans.
In addition to HEC-LifeSim showing the ability to simulate the non-occurrence of fatalities like the one that occurred in the event, the model also made it possible to speculate on scenarios that take into account lower alert and evacuation efficiencies, which resulted in much more catastrophic scenarios in terms of loss of life.
Finally, this study explored models to estimate economic damage and loss of life in floods at the same event of tailings dam failure. In this sense, it shows the potential efficiency of the widely used models for flood simulation. A greater understanding of the application of these models in tailings flow can subsidize Brazilian and international legislation on dam safety by considering these consequences in risk assessments.
The code and data will be made available on request.
AFRS developed the case study, performed the analysis, and wrote the paper. JCE supervised the work and wrote and revised the paper.
The contact author has declared that neither of the authors has any competing interests.
Publisher’s note: Copernicus Publications remains neutral with regard to jurisdictional claims in published maps and institutional affiliations.
This article is part of the special issue “Hydro-meteorological extremes and hazards: vulnerability, risk, impacts, and mitigation”. It is a result of the European Geosciences Union General Assembly 2022, Vienna, Austria, 23–27 May 2022.
The authors acknowledge the kind support provided by the Coordination for the Improvement of Higher Education Personnel (CAPES), the support by the National Council for Scientific and Technological Development (CNPq), and the Foundation for Research Support of the State of Minas Gerais (FAPEMIG) for the financial resources.
This paper was edited by Francesco Marra and reviewed by Darren Lumbroso, Lukas Riedel, and one anonymous referee.
ABEP: Critério de Classificação Econômica do Brasil. Dados com base no Levantamento Sócio Econômico 2010, São Paulo, Brazil, https://www.abep.org/criterio-brasil (last access: 3 July 2023), 2012.
Aboelata, M. and Bowles, D. S.: LIFESim: A Model for Estimating Dam Failure Life Loss, 274 pp., 2005.
Alabbad, Y., Yildirim, E., and Demir, I.: A web-based analytical urban flood damage and loss estimation framework, Environ. Model. Softw., 163, 105670, https://doi.org/10.1016/j.envsoft.2023.105670, 2023.
Apel, H., Thieken, A. H., Merz, B., and Blöschl, G.: Flood risk assessment and associated uncertainty, Nat. Hazards Earth Syst. Sci., 4, 295–308, https://doi.org/10.5194/nhess-4-295-2004, 2004.
Azam, S. and Li, Q.: Tailings dam failures: A review of the last one hundred years, Geotechnical News, 28, 50–53, https://doi.org/10.1373/clinchem.2008.105395, 2010.
Bernedo, C. E., Julien, P., and Leon, A.: Dam Breach Analysis in Tailings Storage Facilities (TSF), in: World Environmental and Water Resources Congress, 2216–2224, https://doi.org/10.1061/41173(414)231, 2011.
Bombelli, I., Molinari, D., Asaridis, P., and Ballio, F.: The “Flood Damage Models” repository, in: IV European Conference on Flood Risk Management model, 6, https://doi.org/10.3311/floodrisk2020.11.3, 2021.
Brunner, G. W.: HEC-RAS. River Analysis System. Hydraulic Reference Manual – Version 6.0, U.S. Army Corps of Engineers, Davis, California, United States, 520 pp., 2020.
Dijkstra, E. W.: A Note on Two Problems in Connexion with Graphs, Numer. Math., 1, 269–271, 1959.
Davis, S. A.: Business Depth Damage Analysis Procedure, Research Report 85-R-5, Virginia, United States, 1985.
El Bilali, A., Taleb, A., and Boutahri, I.: Application of HEC RAS and HEC LifeSim models for flood risk assessment, J. Appl. Water Eng. Res., 9, 336–351, https://doi.org/10.1080/23249676.2021.1908183, 2021.
El Bilali, A., Taleb, I., Nafii, A., and Taleb, A.: A practical probabilistic approach for simulating life loss in an urban area associated with a dam break flood, Int. J. Disast. Risk Re, 76, 103011, https://doi.org/10.1016/j.ijdrr.2022.103011, 2022.
Fernandes, G. W., Goulart, F. F., Ranieri, B. D., Coelho, M. S., Dales, K., Boesche, N., Bustamante, M., Carvalho, F. A., Carvalho, D. C., Dirzo, R., Fernandes, S., Galetti, P. M., Millan, V. E. G., Mielke, C., Ramirez, J. L., Neves, A., Rogass, C., Ribeiro, S. P., Scariot, A., and Soares-Filho, B.: Deep into the mud: ecological and socio-economic impacts of the dam breach in Mariana, Brazil, Natureza e Conservação, 14, 35–45, https://doi.org/10.1016/j.ncon.2016.10.003, 2016.
Ge, W., Wang, X., Li, Z., Zhang, H., Guo, X., Wang, T., Gao, W., Lin, C., and van Gelder, P.: Interval Analysis of the Loss of Life Caused by Dam Failure, J. Water Res. Plan. Man., 147, 04020098, https://doi.org/10.1061/(asce)wr.1943-5452.0001311, 2021.
Ge, W., Jiao, Y., Wu, M., Li, Z., Wang, T., Li, W., Zhang, Y., Gao, W., and van Gelder, P.: Estimating loss of life caused by dam breaches based on the simulation of floods routing and evacuation potential of population at risk, J. Hydrol. (Amst.), 612, 128059, https://doi.org/10.1016/j.jhydrol.2022.128059, 2022.
Gerl, T., Kreibich, H., Franco, G., Marechal, D., and Schröter, K.: A review of flood loss models as basis for harmonization and benchmarking, PLoS One, 11, 1–22, https://doi.org/10.1371/journal.pone.0159791, 2016.
Gildeh, H. K., Halliday, A., Arenas, A., and Zhang, H.: Tailings Dam Breach Analysis: A Review of Methods, Practices, and Uncertainties, Mine Water Environ., 40, 128–150, https://doi.org/10.1007/s10230-020-00718-2, 2021.
Greenshields, B. D., Channing, W., and Miller, H.: A study of traffic capacity, in: XIV Annual Meeting of the Highway Research Board Held at Washington, 448–477, https://trid.trb.org/view/120649 (last access: 30 June 2023), 1935.
Guimarães, R. N., Moreira, V. R., Cruz, J. R. A., Saliba, A. P. M., and Amaral, M. C. S.: History of tailings dam failure: Impacts on access to safe water and influence on the legislative framework, Sci. Total Environ., 852, 158536, https://doi.org/10.1016/j.scitotenv.2022.158536, 2022.
Gutenson, J. L., Ernest, A. N. S., Oubeidillah, A. A., Zhu, L., Zhang, X., and Sadeghi, S. T.: Rapid flood damage prediction and forecasting using public domain cadastral and address point data with fuzzy logic algorithms, J. Am. Water Resour. As., 54, 104–123, https://doi.org/10.1111/1752-1688.12556, 2018.
Hellweger, F. and Maidment, D. R.: AGREE-DEM surface reconditioning system, Texas A&M University, Austin, Texas, United States, http://www.ce.utexas.edu/prof/maidment.GISHYDRO/ferdi/research/agree/agree.html (last access: 2 July 2023), 1997.
Hill, P., Kavanagh, C., and Lang, S.: Applications of Simulation Model to Estimate Potential Loss of Life, in: XXVI International Congress on Large Dams, ISBN 9780429465086, 2018.
Huang, D., Yu, Z., and Li, Y.: Calculation method and application of loss of life caused by dam break in China, Nat. Hazards, 85, 39–57, https://doi.org/10.1007/s11069-016-2557-9, 2017.
IBGE: Descrição das variáveis da amostra do Censo Demográfico 2010, Rio de Janeiro, Brazil, 1–62, 2011.
IBGE: Grade Estatística, Rio de Janeiro, Brazil, 31 pp., 2016.
ICOLD: Risk of Dangerous Occurrences, Lessons Learnt from Practical Experiences, Bulletin 121, Paris, France, 146 pp., 2001.
Jarihani, A. A., Callow, J. N., McVicar, T. R., Van Niel, T. G., and Larsen, J. R.: Satellite-derived Digital Elevation Model (DEM) selection, preparation and correction for hydrodynamic modelling in large, low-gradient and data-sparse catchments, J. Hydrol. (Amst.), 524, 489–506, https://doi.org/10.1016/j.jhydrol.2015.02.049, 2015.
Jeyapalan, B. J. K., Duncan, M., and Seed, B.: Investigation of flow failures of tailings dams, J. Geotech. Geoenviron., 109, 172–189, https://doi.org/10.1061/(ASCE)0733-9410(1983)109:2(172), 1983.
Jiao, H., Li, W., and Ma, D.: Assessment of life loss due to dam breach using improved variable fuzzy method, Sci. Rep., 12, 1–7, https://doi.org/10.1038/s41598-022-07136-0, 2022.
Jin, M. and Fread, D. L.: 1D Modeling of Mud/Debris Unsteady Flows, J. Hydraul. Eng., 125, 827–834, https://doi.org/10.1061/(ASCE)0733-9429(1999)125:8(827), 1999.
Jongejan, R. B., Jonkman, S. N., and Vrijling, J. K.: Methods for the economic valuation of loss of life, in: Conference on International Law and Management of Large-Scale Risks, 8, https://citeseerx.ist.psu.edu/document?repid=rep1&type=pdf&doi=119db2c9d5385bd8a92f43c7c4f73f083286f2f8 (last access: 3 July 2023), 2005.
Jonkman, S. N., Van Gelder, P. H. A. J. M., and Vrijling, J. K.: An overview of quantitative risk measures for loss of life and economic damage, J. Hazard. Mater., 99, 1–30, https://doi.org/10.1016/S0304-3894(02)00283-2, 2003.
Jonkman, S. N., Vrijling, J. K., and Vrouwender, A. C. W. M.: Methods for the estimation of loss of life due to floods: a literature review and a proposal for a new method, Nat. Hazards, 46, 353–389, https://doi.org/10.1007/s11069-008-9227-5, 2008.
Jonkman, S. N., Maaskant, B. B., Kolen, B. B., and Needham, J. T. J.: Loss of life estimation – Review, developments and challenges, in: III European Conference on Flood Risk Management, https://doi.org/10.1051/e3sconf/20160706004, 2016.
Kalinina, A., Spada, M., and Burgherr, P.: Alternative life-loss rates for failures of large concrete and masonry dams in mountain regions of OECD countries, in: XXVIII International European Safety and Reliability Conference, ESREL 2018, 9, https://doi.org/10.1201/9781351174664-213, 2018.
Kalinina, A., Spada, M., and Burgherr, P.: Quantitative Assessment of Uncertainties and Sensitivities in the Estimation of Life Loss Due to the Instantaneous Break of a Hypothetical Dam in Switzerland, Water (Basel), 13, 22, https://doi.org/10.3390/w13233414, 2021.
Kolen, B., Dannenberg, P., and Gelder, P. van: Quantitative assessment of evacuation measures in flood-prone areas, in: IV European Conference on Flood Risk Management, 5, https://doi.org/10.3311/floodrisk2020.19.6, 2020.
Kossoff, D., Dubbin, W. E., Alfredsson, M., Edwards, S. J., Macklin, M. G., and Hudson-edwards, K. A.: Mine tailings dams: Characteristics, failure, environmental impacts, and remediation, Appl. Geochem., 51, 229–245, https://doi.org/10.1016/j.apgeochem.2014.09.010, 2014.
Larrauri Concha, P. and Lall, U.: Tailings Dams Failures: Updated Statistical Model for Discharge Volume and Runout, Environments, 5, 10, https://doi.org/10.3390/environments5020028, 2018.
Leong-Cuzack, T., Nielsen, C., Kavanagh, C., and Watt, S.: Quantitative Assessment of Dam Safety Emergency Management Using HEC-LifeSim: Is it feasible?, in: ANCOLD Conference, 11, 2019.
Li, W., Li, Z., Ge, W., and Wu, S.: Risk Evaluation Model of Life Loss Caused by Dam-Break Flood and Its Application, Water (Basel), 11, 1–12, https://doi.org/10.3390/w11071359, 2019.
Lumbroso, D. and Davison, M.: Use of an agent-based model and Monte Carlo analysis to estimate the effectiveness of emergency management interventions to reduce loss of life during extreme floods, J. Flood Risk Manag., 11, S419–S433, https://doi.org/10.1111/jfr3.12230, 2018.
Lumbroso, D., Davison, M., Body, R., and Petkovšek, G.: Modelling the Brumadinho tailings dam failure, the subsequent loss of life and how it could have been reduced, Natural Hazards and Earth System Sciences, 21, 21–37, https://doi.org/10.5194/nhess-21-21-2021, 2021.
Machado, N. C.: Retroanálise da propagação decorrente da ruptura da barragem do fundão com diferentes modelos numéricos e hipóteses de simulação, Dissertation, Federal University of Minas Gerais, Belo Horizonte, Minas Gerais, Brazil, 159 pp., 2017.
Mahmoud, A. A., Wang, J. T., and Jin, F.: An improved method for estimating life losses from dam failure in China, Stoch. Env. Res. Risk A., 34, 1263–1279, https://doi.org/10.1007/s00477-020-01820-1, 2020.
Martin, V., Fontaine, D., and Cathcart, J. G.: Challenges with conducting tailings dam breach studies, in: Tailings and Mine Waste 2015, 15, https://doi.org/10.14288/1.0320883, 2015.
McClelland, D. M. and Bowles, D. S.: Estimating life loss for dam safety risk assessment – A review and new approach, Institute for Water Resources U.S. Army Corps of Engineers, 420 pp., 2002.
Melo, L. P. R. de: Análise comparativa de metodologias de previsão de inundação decorrente da ruptura de barragens de rejeitos: caso hipotético da barragem Tico-Tico, Dissertation, Federal University of Minas Gerais, Belo Horizonte, Minas Gerais, Brazil, 183 pp., 2013.
Merz, B., Kreibich, H., Schwarze, R., and Thieken, A.: Review article “Assessment of economic flood damage”, Nat. Hazards Earth Syst. Sci., 10, 1697–1724, https://doi.org/10.5194/nhess-10-1697-2010, 2010.
Molinari, D., De Bruijn, K. M., Castillo-Rodríguez, J. T., Aronica, G. T., and Bouwer, L. M.: Validation of flood risk models: Current practice and possible improvements, Int. J. Disast. Risk Re., 33, 441–448, https://doi.org/10.1016/j.ijdrr.2018.10.022, 2019.
Nascimento, N., Machado, L. M., Silva, A., Baptista, M., Lima, J. L., Gonçalves, M., Silva, A., Dias, R., and Machado, É.: Flood-damage curves: Methodological development for the Brazilian context, Water Pract. Technol., 1, 1–9, https://doi.org/10.2166/wpt.2006022, 2006.
Nascimento, N., Machado, L. M., Baptista, M., and De Paula, A.: The assessment of damage caused by floods in the Brazilian context, Urban Water J., 4, 195–210, https://doi.org/10.1080/15730620701466591, 2007.
Needham, J., Fields, W., and Lehman, W.: The US Army Corps of Engineers Scalable Approach to Estimating Loss of Life from Flooding, in: III European Conference on Flood Risk Management, 6, https://doi.org/10.1051/e3sconf/20160706003, 2016.
NRCS: National Engineering Handbook: Part 360, Hydrology, Washington DC, United States, https://www.hydrocad.net/neh/630contents.htm (last access: 1 July 2023), 1997.
NRCS: Manning's n Values for Various Land Covers to Use for Dam Breach Analyses by NRCS in Kansas, https://rashms.com/wp-content/uploads/2021/01/Mannings-n-values-NLCD-NRCS.pdf (last access: 3 July 2023), 2016.
O'Brien, J. S. and Julien, P. Y.: Physical properties and mechanics hyperconcentrated sediment flows, in: Specialty Conference – Delineation of Landslide, Flash Flood and Debris Flow Hazards in Utah, https://www.engr.colostate.edu/~pierre/ce_old/Projects/Paperspdf/O27Brien-Julien20UtahPDF.pdf (last access: 3 July 2023), 1985.
Paiva, R. C. D., Collischonn, W., and Tucci, C. E. M.: Large scale hydrologic and hydrodynamic modeling using limited data and a GIS based approach, J. Hydrol. (Amst.), 406, 170–181, https://doi.org/10.1016/j.jhydrol.2011.06.007, 2011.
Piciullo, L., Storrøsten, E. B., Zhongqiang, L., Farrokh, N., and Lacasse, S.: A new look at the statistics of tailings dam failures, Eng. Geol., 303, 106657, https://doi.org/10.1016/j.enggeo.2022.106657, 2022.
Pimenta de Ávila: Relatório sobre a ruptura da barragem de São Francisco, da mineração Rio Pomba Cataguases, situada em Miraí, MG. FE-100-RL-111318-00, 2007.
Proske, D.: Comparison of dam failure frequencies and failure probabilities, Beton- Stahlbetonbau, 113, 2–6, https://doi.org/10.1002/best.201800047, 2018.
Rico, M., Benito, G., and Díez-Herrero, A.: Floods from tailings dam failures, J. Hazard Mater., 154, 79–87, https://doi.org/10.1016/j.jhazmat.2007.09.110, 2008a.
Rico, M., Benito, G., Salgueiro, A. R., Díez-Herrero, A., and Pereira, H. G.: Reported tailings dam failures. A review of the European incidents in the worldwide context, J. Hazard Mater., 152, 846–852, https://doi.org/10.1016/j.jhazmat.2007.07.050, 2008b.
Risher, P., Ackerman, C., Morrill-Winter, J., Fields, W., and Needham, J.: Levee Breach Consequence Model Validated by Case Study in Joso, Japan, in: X Association of State Dam Safety Conference, 13, ISBN 9781510851177, 2017.
Rocha, F. F.: Retroanálise da ruptura da barragem São Francisco – Miraí, Minas Gerais, Brasil, Dissertation, Federal University of Minas Gerais, Dissertation. Engineering School, Federal University of Minas Gerais, Belo Horizonte, Minas Gerais, Brazil, 184 pp., 2015.
Rogers, G. O. and Sorensen, J.: Warning and response in two hazardous materials transportation accidents in the U.S., J. Hazard Mater., 22, 57–74, https://doi.org/10.1016/0304-3894(89)85028-9, 1989.
Rotta, L. H. S., Alcântara, E., Park, E., Negri, R. G., Lin, Y. N., Bernardo, N., Mendes, T. S. G., and Souza Filho, C. R.: The 2019 Brumadinho tailings dam collapse: Possible cause and impacts of the worst human and environmental disaster in Brazil, Int. J. Applied Earth Obs., 90, 102–119, https://doi.org/10.1016/j.jag.2020.102119, 2020.
Saksena, S. and Merwade, V.: Incorporating the effect of DEM resolution and accuracy for improved flood inundation mapping, J. Hydrol. (Amst.), 530, 180–194, https://doi.org/10.1016/j.jhydrol.2015.09.069, 2015.
Silva, A. F. R. da, Eleutério, J. C., and Nascimento, N. D. O.: Alerta e Redução de Perdas de Vidas Associadas à Ruptura Hipotética da Barragem da Pampulha – MG, in: XXIV Brazilian Water Resources Symposium, 10, ISSN 2318 0358, 2021.
Sorensen, J. and Mileti, D.: First Alert and/or Warning Issuance Time Estimation for Dam Breaches, Controlled Dam Releases, and Levee Breaches or Overtopping, 48 pp., 2015a.
Sorensen, J. and Mileti, D.: First Alert or Warning Diffusion Time Estimation for Dam Breaches, Controlled Dam Releases and Levee Breaches or Overtopping, 56 pp., 2015b.
Sorensen, J. and Mileti, D.: Influence Weights and Measures for the Factors Shaping First Alert/Warning Delay, Diffusion and Protective Action Initiation Curves for Dam Breaches, Controlled Dam Releases, and Levee Breaches or Overtopping, 9 pp., 2015c.
Sorensen, J. and Mileti, D.: INTERVIEW SCHEDULE. Community Warning Issuance, Diffusion, and Protective Action Initiation Estimation, 12 pp., 2015d.
Sorensen, J. and Mileti, D.: Protective Action Initiation Time Estimation for Dam Breaches, Controlled Dam Releases, and Levee Breaches or Overtopping, 51 pp., 2015e.
STJ: Recurso Especial no 1.374.284 – MG (2012/0108265-7), Relator Ministro Luis Felipe Salomão, Brasilia, Brazil, https://www.jusbrasil.com.br/jurisprudencia/stj/864823848/inteiroteor864823858 (last access: 30 June 2023), 2014.
Tomura, S., Chiba, M., Yamamoto, T., Uemura, F., Masuya, S., Omura, N., Yoshida, T., Takeda, A., Hoshino, T., Yamada, T., and Nakatsugawa, M.: Fatality estimation by life loss evaluation model for the large-scale floods under future climate, 22nd Congress of the International Association for Hydro-Environment Engineering and Research-Asia Pacific Division, IAHR-APD 2020: “Creating Resilience to Water-Related Challenges”, 1–8, 2020.
Tonn, G. L. and Guikema, S. D.: An Agent-Based Model of Evolving Community Flood Risk, Risk Anal., 38, 1258–1278, https://doi.org/10.1111/risa.12939, 2018.
Travis, B., Teal, M., and Gusman, J.: Best methods and inherent limitations of bulked flow modeling with HEC-RAS, in: World Environmental and Water Resources Congress, 1995–1202, https://doi.org/10.1061/9780784412312.121, 2012.
USACE: HEC LifeSim. Version 1.0 1 United States Army Corps of Engineer s Hydrologic Engineering Center, Davis, California, United States, 218 pp. 2019.
USACE: LifeSim. Version 2.0. Hydrologic Engineering Center. Davis, California, United States, https://www.rmc.usace.army.mil/Software/LifeSim/ (last acess: 3 July 2023), 2021.
USGS: Landsat 5 TM 2005-15-10, https://earthexplorer.usgs.gov (last access: 30 July 2023), 2005.
Veizaga, F. M., De Paes, R. P., Eleutério, J., Rocha, F. F., and Palmier, L. R.: Modelagem hidráulica de inundação e estimativa de danos diretos causados por rompimento real da barragem São Francisco, Miraí, Minas Gerais, in: XXII Brazilian Water Resources Symposium, 8, https://doi.org/10.13140/RG.2.2.33170.35527, 2017.
Wang, H.: Lessons Learnt From Evacuation Modelling for Dam Failure Consequence Assessments, in: ANCOLD Conference, 9, ISBN 9780648543923, 2019.
Project Chronology of Major Tailings Dam Failures: http://www.wise-uranium.org/mdaf.html, last access: 25 March 2023.
Yamazaki, D., Baugh, C. A., Bates, P. D., Kanae, S., Alsdorf, D. E., and Oki, T.: Adjustment of a spaceborne DEM for use in floodplain hydrodynamic modeling, J. Hydrol. (Amst.), 436–437, 81–91, https://doi.org/10.1016/j.jhydrol.2012.02.045, 2012.
Zhuo, L. and Han, D.: Agent based modelling and flood risk management: A compendious literature review, J. Hydrol., 591, 125600, https://doi.org/10.1016/j.jhydrol.2020.125600, 2020.
- Abstract
- Introduction
- Case study – the Miraí accident in 2007
- Method for achieving the potential evaluation of flood impacts
- Results discussion
- Conclusions
- Code and data availability
- Author contributions
- Competing interests
- Disclaimer
- Special issue statement
- Acknowledgements
- Review statement
- References