the Creative Commons Attribution 4.0 License.
the Creative Commons Attribution 4.0 License.
 | 06 Feb 2024
Climate change impacts on regional fire weather in heterogeneous landscapes of central Europe
Andrea Böhnisch
Ralf Ludwig
Manuela I. Brunner
Wildfires have reached an unprecedented scale in the Northern Hemisphere. The summers of 2022 and 2023 demonstrated the destructive power of wildfires, especially in North America and southern Europe. Global warming leads to changes in fire danger. Specifically, fire seasons are assumed to become more extreme and will extend to more temperate regions in northern latitudes in the future. However, the extent to which the seasonality and severity of fire danger in regions of central Europe will change in the future remains to be investigated. Multiple studies claim that natural variability and model uncertainty hide the trend of increasing fire danger in multi-model climate simulations for future potentially fire-prone areas. Such a trend might be isolated with single-model initial-condition large ensembles (SMILEs), which help scientists to distinguish the forced response from natural variability. So far, the SMILE framework has only been applied for fire danger estimation on a global scale. To date, only a few dynamically downscaled regional SMILEs exist, although they enhance the spatial representation of climatic patterns on a regional or local scale.
In this study, we use a regional SMILE of the Canadian Regional Climate Model version 5 Large Ensemble (CRCM5-LE) over a region in central Europe under the RCP8.5 (Representative Concentration Pathway) scenario from 1980 to 2099 to analyze changes in fire danger in an area that is currently not fire prone. We use the Canadian Forest Fire Weather Index (FWI) as a fire danger indicator. The study area covers four heterogeneous landscapes, namely the Alps, the Alpine Foreland, the lowlands of the South German Escarpment, and the Eastern Mountain Ranges of the Bavarian Forest. We demonstrate that the CRCM5-LE is a dataset suitable for disentangling climate trends from natural variability in a multi-variate fire danger metric. Our results show the strongest increases in the median (50th) and extreme (90th) quantiles of the FWI in the northern parts (South German Escarpment and Eastern Mountain Ranges) of the study area in the summer months of July and August. There, high fire danger becomes the median condition by the end of the century, and levels of high fire danger occur earlier in the fire season. The southern parts (Alps and Alpine Foreland) are less strongly affected by changes in fire danger than the northern parts. However, these regions reach their time of emergence (TOE) in the early 2040s because of very low current fire danger. In the northern parts, the climate change trend exceeds natural variability only in the late 2040s. We find that today's 100-year FWI event will occur every 30 years by 2050 and every 10 years by the end of the century. Our results highlight the potential for severe future fire events in central Europe, which is currently not very fire prone, and demonstrate the need for fire management even in regions with a temperate climate.
- Article
(9094 KB) - Full-text XML
- BibTeX
- EndNote


The fire seasons of 2021, 2022, and 2023 affected the Northern Hemisphere at an unprecedented scale. In particular southern Europe and British Columbia (Canada) experienced multiple extreme fire events in terms of intensity, severity, and damage (i.e., Giannaros et al., 2022; Gillett et al., 2022). In Greece, five wildfires at the beginning of August 2021 burned an area of 94 000 ha, which corresponds to 3 times its average annual burned area over the period 2008–2019 (Giannaros et al., 2022). A total of 90 % of the village of Lytton in British Columbia (Canada) was destroyed by fires in the summer of 2021 (Hoffman et al., 2022). In both cases, these fire events occurred under fire-favoring conditions of hot, dry, and windy weather during the summer months. Summer heat waves and drought events decrease soil moisture and increase the flammability of the vegetation prior to the fire event (e.g., Ruffault et al., 2020). Blocking synoptic conditions trap hot air over distinct areas and lead to extreme temperatures, which contribute to very high fire danger (e.g., Hoffman et al., 2022). While the Mediterranean region and western Canada have been historically fire prone and well studied on a larger regional scale (e.g., Abatzoglou et al., 2021; Barbero et al., 2020; Ruffault et al., 2020; Barbero et al., 2015), fire occurrence in the temperate climate regions of Europe has received less attention and is studied on a national rather than on a regional level (e.g., Bakke et al., 2023; Arnell et al., 2021; Fargeon et al., 2020).
Due to climate change, fire weather and hence the likelihood of fire events are projected to increase in several regions of the world – including historically less fire-prone areas – in the future (IPCC, 2021). From a meteorological perspective, the risk of igniting a fire increases with higher temperatures and wind speed and with lower relative humidity. Alterations in these variables are projected to more than double the frequency of occurrence of extreme fire weather until the end of the 21st century (Touma et al., 2021) and increase the duration, severity, and spatial extent of fires (Bowman et al., 2020; Fargeon et al., 2020; Ruffault et al., 2020; De Rigo et al., 2017).
Climate projections of fire danger often rely on fire indices, such as the Canadian Forest Fire Weather Index (FWI) (van Wagner, 1987), the National Fire Danger Rating System (NFDRS) of the US Forest Service (Bradshaw et al., 1984), or the Australian McArthur rating system (Mark 5; McArthur, 1967). These indices are statistical models that were built on the correlation between fire events and meteorological conditions. They have been proven to produce reliable ratings of fire danger in short- and long-term weather predictions on a global scale (Di Giuseppe et al., 2016). The FWI is the most commonly used index for assessing long-term fire danger with climate projections because it solely relies on meteorological inputs and does not propagate ambiguity from land use change (Touma et al., 2021). While this index describes the probability of a fire occurrence, it does not imply an actual fire ignition (e.g., Di Giuseppe et al., 2016).
Robust increases in future fire danger were simulated for southern Europe and the Mediterranean region (IPCC, 2021). For example, Ruffault et al. (2020) have shown that under the RCP8.5 (Representative Concentration Pathway) emission scenario, the frequency of heat-induced wildfires will increase by 30 % in the Mediterranean region and Fargeon et al. (2020) have found that under RCP8.5, today's 10-year FWI maxima in France are reached every second year by the end of the century. In contrast to the Mediterranean, temperate climate regions, such as central and western Europe, show uncertain trends in fire danger because these trends are not clearly distinguishable from internal variability when multi-model climate ensembles are used (Arnell et al., 2021; Fargeon et al., 2020). This uncertainty originates from the confusion of internal variability with structural uncertainty related to the different climate models in the ensemble (Arnell et al., 2021; Fargeon et al., 2020). Separating the forced signal in FWI changes from internal variability using only multi-model ensembles is challenging, in particular in temperate climate regions with a low signal-to-noise ratio (Arnell et al., 2021; Fargeon et al., 2020; De Rigo et al., 2017).
This challenge can be addressed by evaluating climate model simulations derived from a single-model initial-condition large ensemble (SMILE) which enables a clear isolation of the forced climate change signal from internal variability (Deser et al., 2012). SMILEs represent an ensemble of simulations derived using one single climate model started at different initial conditions. The ensemble spread between the different SMILE members provides a robust estimate of the internal variability, from which the forced response of the climate change scenario can be estimated by averaging over the SMILE members for a specific variable, e.g., temperature (Deser et al., 2020). While single SMILEs allow for the quantification of internal variability, they do not enable a quantification of model uncertainty (Deser et al., 2020). Most of the available SMILEs rely on global circulation or earth system models with a coarse spatial resolution and are unsuitable to assess changes in fire weather over regions with complex terrain such as central Europe including the Alps.
In this study, we therefore use the Canadian Regional Climate Model version 5 Large Ensemble (CRCM5-LE), a dynamically downscaled, regional, high-resolution SMILE (0.11∘ grid cell size) nested into the Canadian Earth System Model version 2 Large Ensemble (CanESM2-LE) (Fyfe et al., 2017) to disentangle climate-change-induced fire danger trends from internal variability over heterogeneous landscapes in central Europe. Benefits of using a regional instead of a global SMILE include but are not limited to spatial representations of climatic patterns in high geographical detail, such as pressure patterns leading to extreme precipitation (Mittermeier et al., 2019) or heat waves (Böhnisch et al., 2023) and the seasonality of these extremes (Felsche et al., 2023; Böhnisch et al., 2021; Wood and Ludwig, 2020).
We first assess the suitability of the CRCM5-LE, consisting of 50 climate model members, to reproduce typical FWI characteristics over central Europe. To do so, we compare FWI results computed from the CRCM5-LE to an ERA5-based FWI benchmark (Vitolo et al., 2019) for the present time period (1980–2009). Second, we use the unique setup of the CRCM5-LE to evaluate how fire danger changes in the future under the RCP8.5 greenhouse gas emissions scenario. Specifically, we address three research questions (RQs):
-
How does the FWI in central Europe change between 1980 and 2099 in four hydro-climatologically diverse subregions?
-
When does the FWI reach its time of emergence (TOE)?
-
How often does today's 100-year FWI occur by the end of the century?
2.1 CRCM5 large ensemble
To quantify changes and internal variability in fire danger for central Europe, we use the Canadian Regional Climate Model version 5 Large Ensemble (CRCM5-LE; Leduc et al., 2019). The CRCM5-LE was obtained by nesting the regional climate model CRCM5 (Separović et al., 2013; Martynov et al., 2013) into the CanESM2-LE (Fyfe et al., 2017) over two domains (i.e., Europe and eastern North America). Thereby, the CanESM2 was dynamically downscaled from an original resolution of 2.88 to 0.11∘ over these regions. The dynamical downscaling of a regional single-model initial-condition large ensemble (SMILE) was carried out within the ClimEx project (https://www.climex-project.org, last access: 1 February 2024) to assess the hydrological impacts of climate change in Bavaria and Quebec. The dataset includes continuous simulations of climate variables from 1950 to 2099 under the RCP8.5 emission scenario (Leduc et al., 2019).
The driving CanESM2-LE consists of 50 simulations (Fyfe et al., 2017), which were started by adding random perturbations to the initial atmospheric state of 1 January 1950. These random perturbations were introduced by parameterizing a single aspect of the model's cloud properties using a different pre-set seed for each of the 50 simulations. This ensured that the climate change realizations were different from each other without changing the model dynamics, physics, or structure (Fyfe et al., 2017). After a 5-year spin-up phase, the modeled climate of the initialized 50 members in the CRCM5-LE was considered independent (Leduc et al., 2019) because the chaotic climate properties caused diverging climate trajectories solely based on the macro- and micro-initialization of the CanESM2-LE (Wood, 2023). Therefore, the differences among the 50 CRCM5-LE members can be interpreted as natural variability (Böhnisch et al., 2021; Wood, 2023; Mittermeier et al., 2019; Leduc et al., 2019) and are referred to as internal variability throughout this paper (Hawkins and Sutton, 2009). For more details on the ensemble setup, the reader is referred to Leduc et al. (2019) (CRCM5-LE) and Fyfe et al. (2017) (CanESM2-LE).
A comparison between the CRCM5-LE and a multi-model ensemble (i.e., EURO-CORDEX) was conducted by von Trentini et al. (2019). Their results have shown that the CRCM5-LE shows a smaller member spread for temperature and equal member spread for precipitation compared to EURO-CORDEX. Further, the CRCM5-LE was bias-corrected using the univariate quantile mapping approach of Mpelasoka and Chiew (2009) (Poschlod et al., 2020) for all the FWI input variables. Bias-corrected data have been commonly used for projections of fire weather indicators such as the FWI (e.g., Yang et al., 2015; Cannon, 2018; Kirchmeier-Young et al., 2017; Ruffault et al., 2017; Fargeon et al., 2020), as they have been shown to reflect fire danger more accurately than raw climate data when compared to observational data (Yang et al., 2015). For the bias correction, the meteorological Sub-Daily Climatological REFerence dataset (SDCLIREF), which combines hourly and disaggregated daily station data (Brunner et al., 2021), served as an observation reference. Correction factors were determined for each quantile bin of each month and subdaily time step by pooling data across all members. The correction factors were applied separately to each member of the CRCM5-LE (Brunner et al., 2021).
2.2 Study area
Our study assessed changes in fire danger over a hydro-climatically diverse region in central Europe with temperate climate (Fig. 1). The boundaries of the study area were set by the river catchments of the Danube, Main, and Elbe, which intersect with the German federal state of Bavaria. As the study area exceeds the boundaries of political Bavaria in terms of these catchments, it is referred to as “hydrological Bavaria” (HydBav). HydBav has an overall size of approximately 103 km2. We divided HydBav into four subregions according to their geography and climatology: (1) the Alps in the south, (2) the Alpine Foreland north of the Alps bounded by the course of the Danube, (3) the South German Escarpment north of the course of the Danube, and (4) the Eastern Mountain Ranges of the Bavarian Forest in the east of the study area (see Fig. 1). This subdivision into complex landscapes was adopted from the study of Willkofer et al. (2020) and derived from the Bavarian State Office for the Environment (Landesamt für Umwelt, 2023). Since fire is closely related to the availability, or rather the absence, of water (in terms of precipitation or soil moisture deficit), we assumed that the water availability, climatology, and landscape characteristics of the four different complex landscapes resulted in subregion-specific fire regimes.
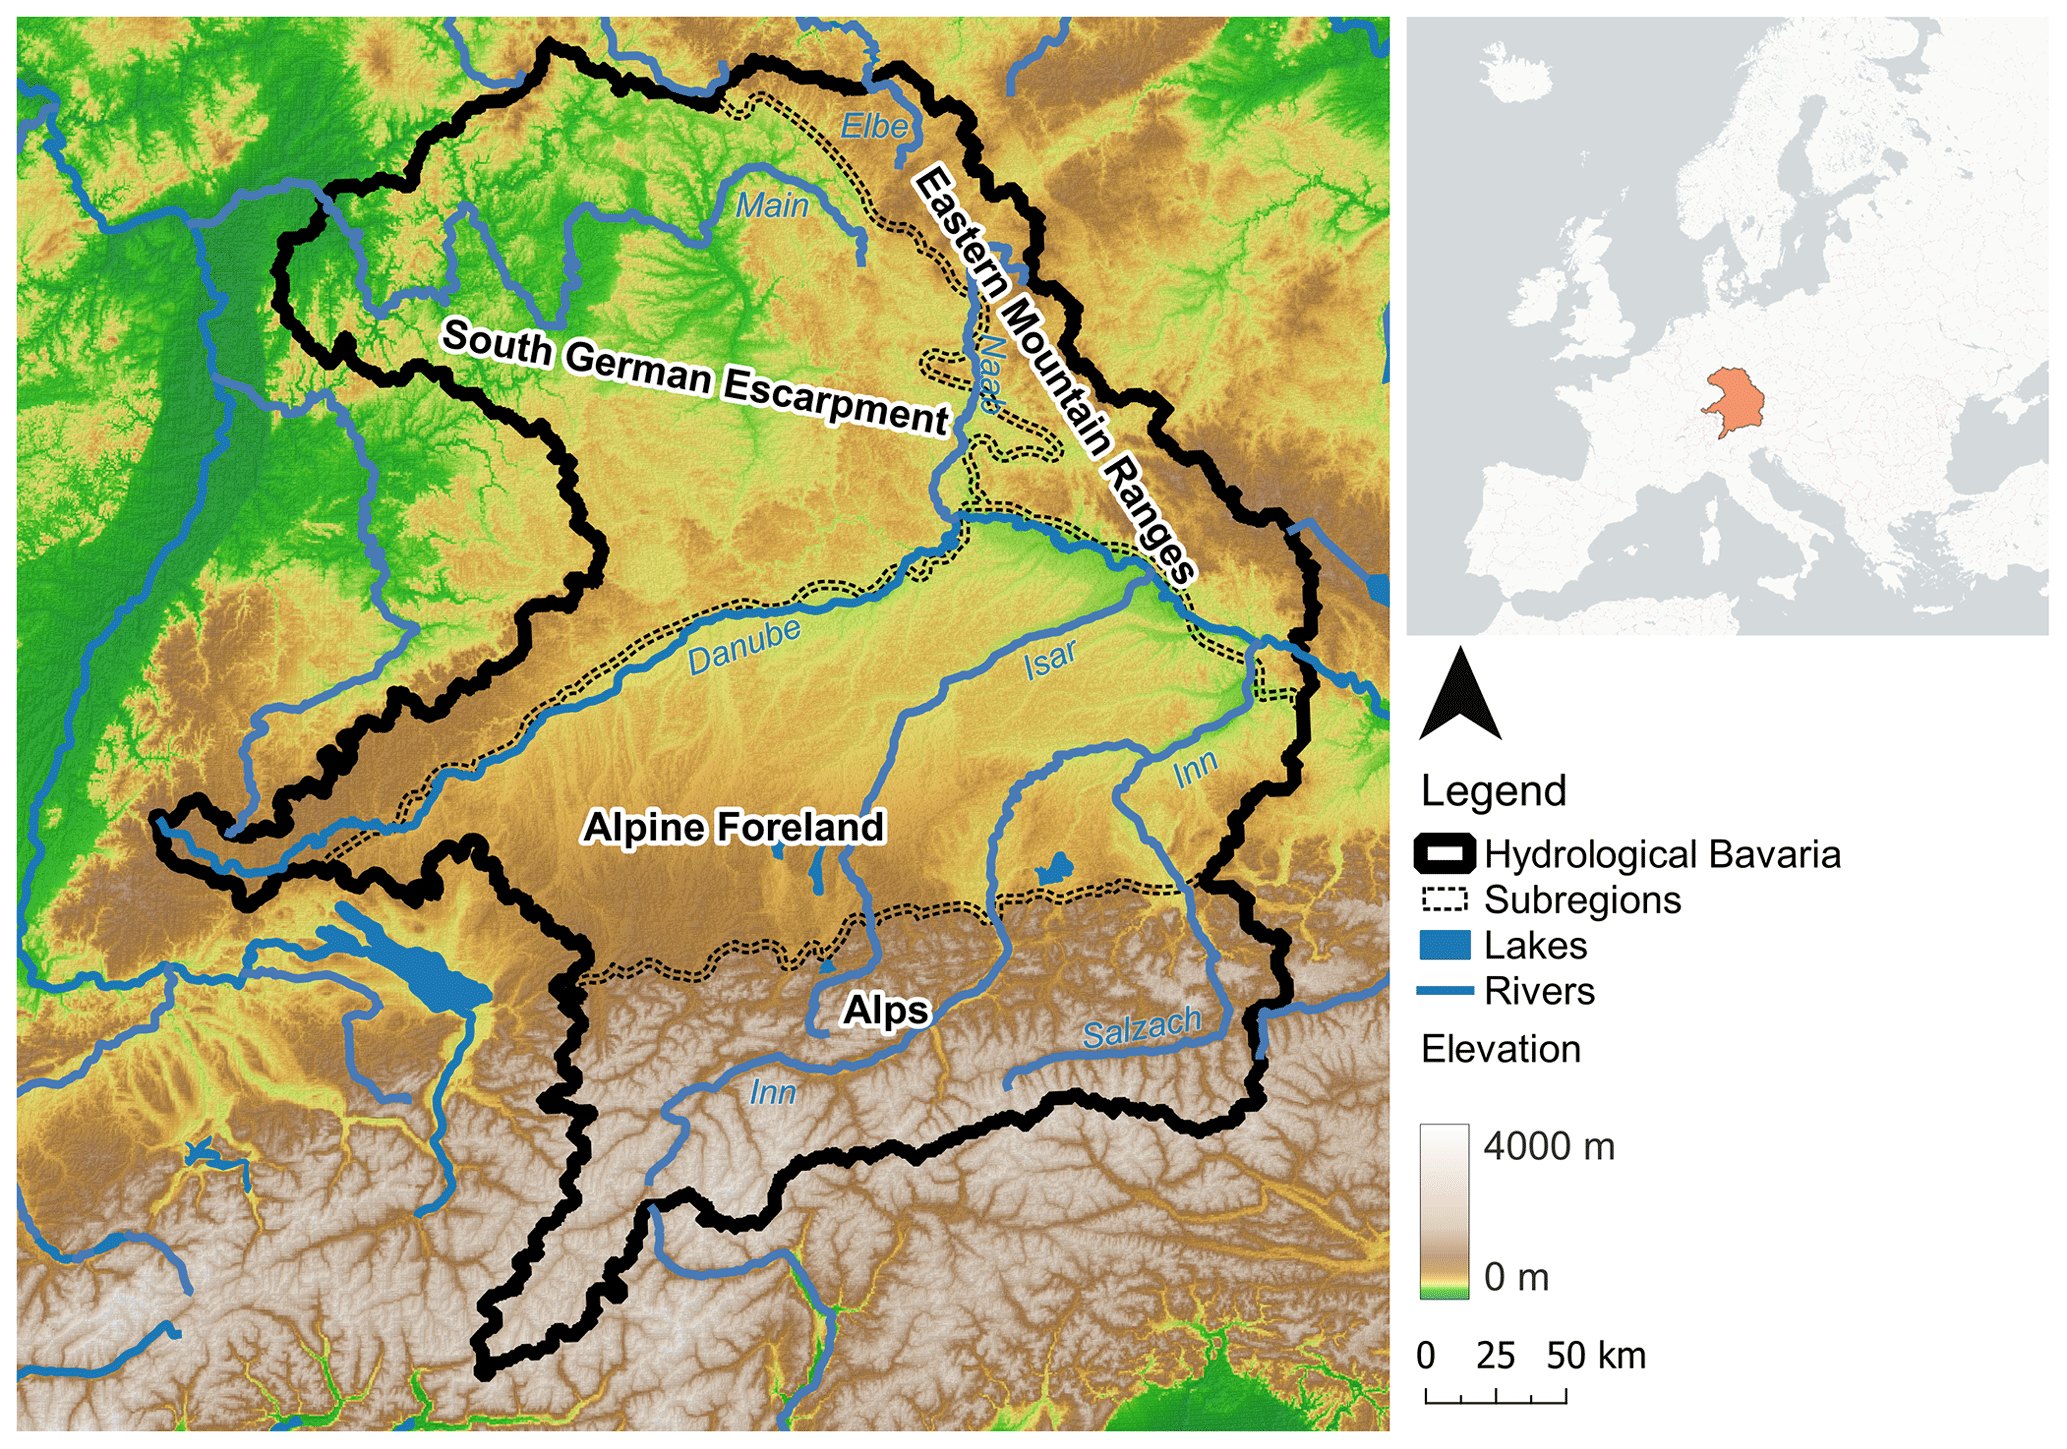
Figure 1Complex landscapes (subregions) of hydrological Bavaria (Landesamt für Umwelt, 2023) by elevation (European Environment Agency, 2016).
Mean precipitation over the study area increases from north to south, with annual precipitation sums ranging from 500 to 1100 mm in the South German Escarpment, around 1000 mm in the Eastern Mountain Ranges, between 1500 and 2500 mm in the Alpine Foreland, and between 1000 and 2000 mm in the Alps according to the SDCLIREF observation dataset for the present climate period between 1980 and 2009. The annual mean temperatures are higher in the north than in the south. The annual mean temperature in the Main catchment, covering the majority of the South German Escarpment subregion, is around 10 ∘C, whereas in the Alps, the annual mean temperature is around 5 ∘C. For the regions of the Alpine Foreland and Eastern Mountain Ranges, temperatures vary between 6 and 9 ∘C, depending on the elevation (Willkofer et al., 2020). The climatology in the study area is influenced by orography (Poschlod et al., 2020), which could be relevant for wildfire propagation. For example, steep slopes favor fire spread due to local thermal winds and southern facing slopes show hotter and drier conditions, which increases the risk of fire ignition and propagation (San-Miguel-Ayanz et al., 2018).
2.3 The Canadian Forest Fire Weather Index
In this study, we used the Canadian Forest Fire Weather Index (FWI) of van Wagner (1987) to assess fire danger because fire occurrences are strongly related to the FWI (e.g., Barbero et al., 2015) and its global applicability has been demonstrated by several studies (Di Giuseppe et al., 2016; Touma et al., 2021). The Canadian Forest Fire Weather Index System (CFFWIS) is composed of five subindices, which together build the sixth index, i.e., the final FWI (see Fig. 2). The CFFWIS uses meteorological conditions of the atmosphere on the day of interest (temperature, relative humidity, wind speed – all at noon – and 24 h accumulated precipitation) and antecedent weather conditions represented by fuel moisture codes to estimate fire behavior and fuel moisture (van Wagner, 1987).
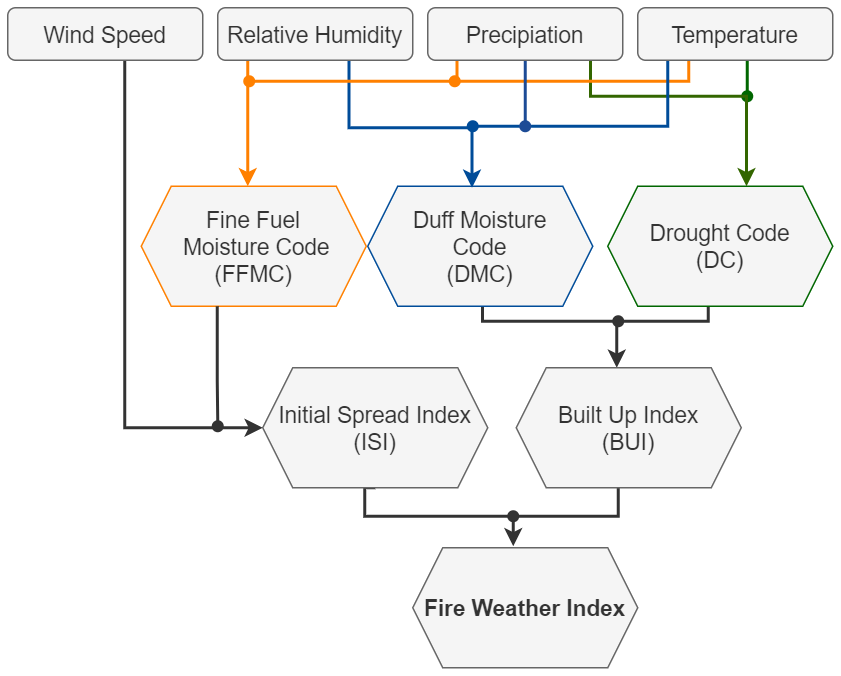
Figure 2The Canadian Forest Fire Weather Index System, its input variables, and its intermediate indices. Fuel moisture codes (FFMC, DMC, and DC) capture the antecedent moisture conditions of the organic matter. Fire behavior codes (ISI, BUI, and FWI) describe the potential spread and intensity of the fire (modified from van Wagner, 1987).
The first three subindices represent the fuel moisture codes and contain information about antecedent conditions; i.e., they represent increased moisture after rain and reduce moisture for each day of drying. The Fine Fuel Moisture Code (FFMC), Duff Moisture Code (DMC), and Drought Code (DC) model daily changes in the moisture content of three different fuel layers with respect to different time lags (De Rigo et al., 2017): the FFMC describes the moisture content of the surface litter (up to 1.2 cm); the DMC accounts for moisture of loosely compacted organic matter in up to 7 cm depth; and the DC estimates the moisture content of compact, organic layers up to 15 cm of ground depth. The response to immediate atmospheric effects decreases with an increasing layer depth of the specific fuel moisture codes (De Rigo et al., 2017). The fuel moisture codes are considered to dry exponentially over time so that their immediate drying rate is proportional to the free moisture content. The time lag accounts for the drying speed. The DMC and DC respond to changing day length as the season progresses, since less time is available for drying when day length decreases (van Wagner, 1987).
The other two subindices, i.e., the Built-Up Index (BUI) and Initial Spread Index (ISI), together with the resulting FWI, describe the fire behavior in the case of an ignition. They are stateless and only indirectly linked to past conditions. The ISI combines wind speed and the FFMC to represent the rate of spread. The BUI combines the DMC and DC to represent the available fuel of the spreading fire. Finally, a combination of ISI and BUI leads to a representation of the potential intensity of the spreading fire in terms of the energy output rate per unit length of fire front, known as the FWI (De Rigo et al., 2017).
Originally, the FWI was calibrated for pine forests. Pine forests are widespread in Canada, where the index was developed. However, the main goal of the CFFWIS was to create a fire danger rating system solely based on weather and to provide uniform results throughout Canada. Therefore, the calibration to a specific fuel type can be neglected (van Wagner, 1987). Its applicability to other fuel types in different regions of the world has been demonstrated by various studies (e.g., Di Giuseppe et al., 2016; Barbero et al., 2020; De Rigo et al., 2017; Touma et al., 2021). The full formulas of the CFFWIS and a detailed description of all subindices is provided by van Wagner (1987).
2.4 Estimating fire danger using the CRCM5-LE
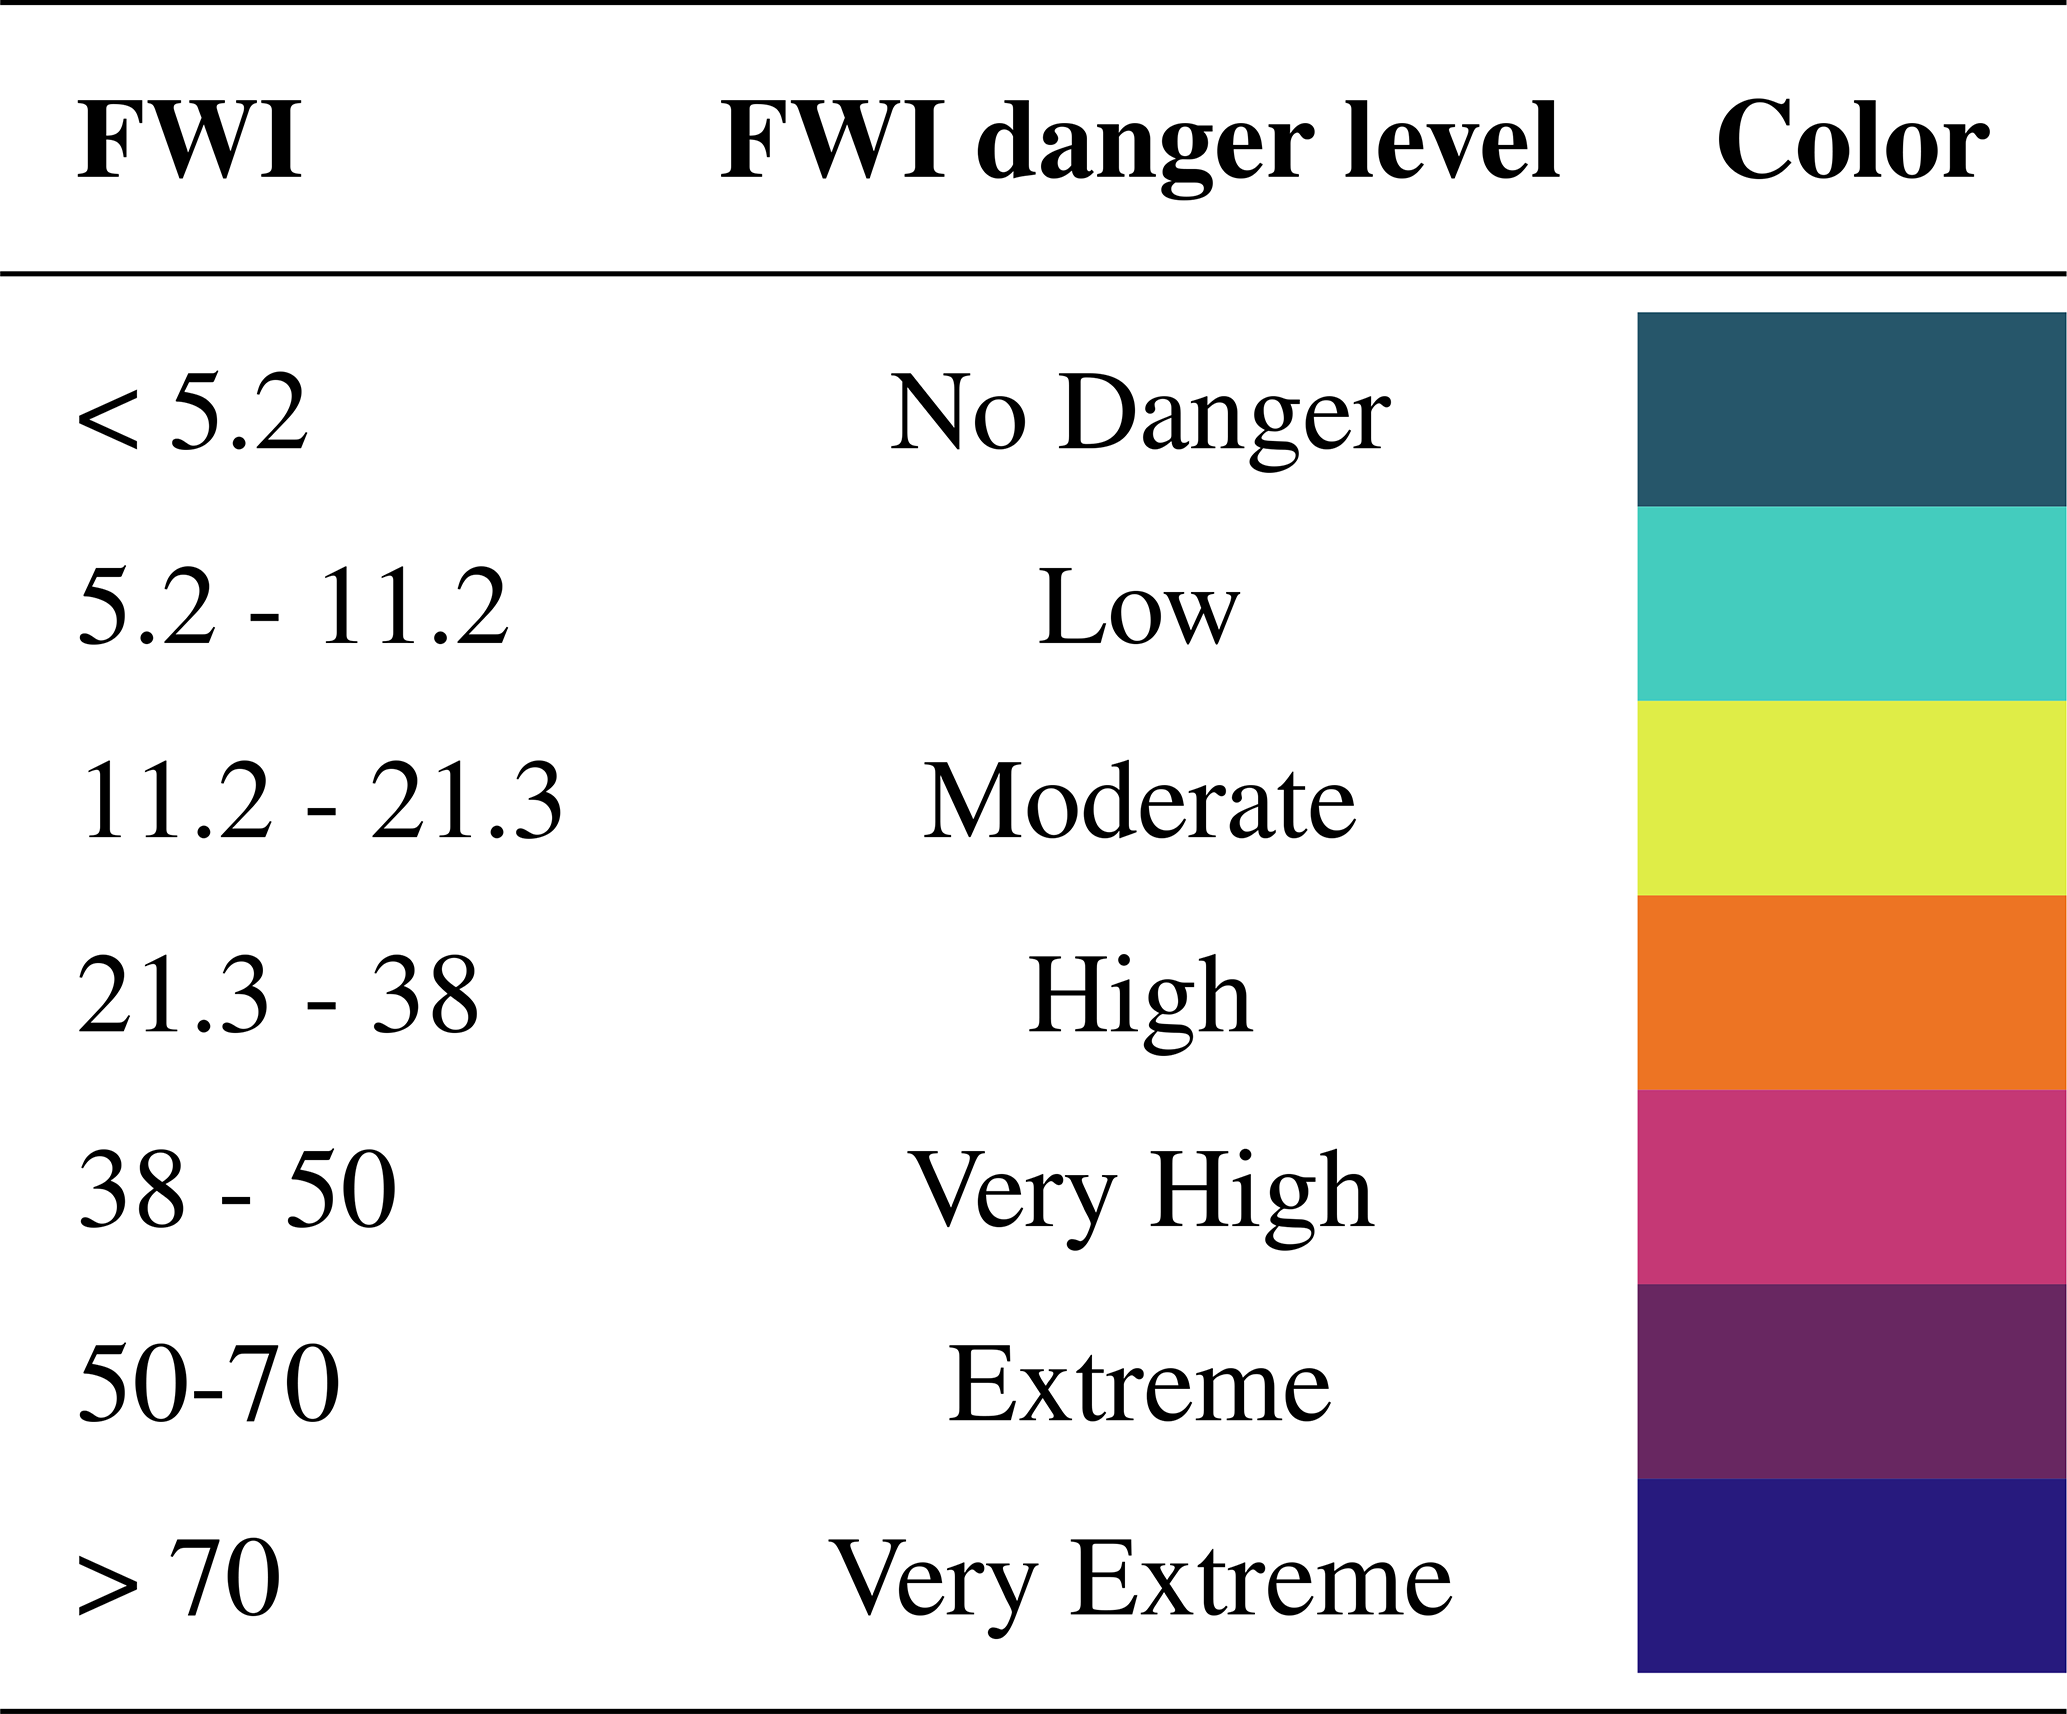
We calculated the FWI results on a daily basis for each full year (1 January to 31 December) and climate model ensemble member between 1980 and 2099 using the cffdrs R package (Wang et al., 2017). The generated dataset was later cropped to the dry season (1 April to 30 September) of the Northern Hemisphere, which was used as the fire season in our study as suggested by Vitolo et al. (2019). The results shown refer to this fire season. To facilitate the interpretation of the FWI, we used the seven fire danger classes proposed by the European Forest Fire Information System (EFFIS; EFFIS, 2021) and assigned the FWI to particular fire danger levels. These FWI danger levels and their corresponding color scheme are shown in Table 1.
To ensure that the CRCM5-LE sampled the FWI in a meaningful way, we compared the CRCM5-LE FWI median for the current period (1980–2009) with the median of the ERA5-based FWI dataset from Vitolo et al. (2020), hereafter referred to as the “reference dataset” (REF) over the study domain. A majority of the reference data points are located within 1 standard deviation of the CRCM5-LE (see Fig. 3). The remaining data points are located between the 25th and 75th quantile of the ensemble (blue lines). Overall, the ensemble slightly overestimates the reference FWI dataset with an average deviation of +0.76.
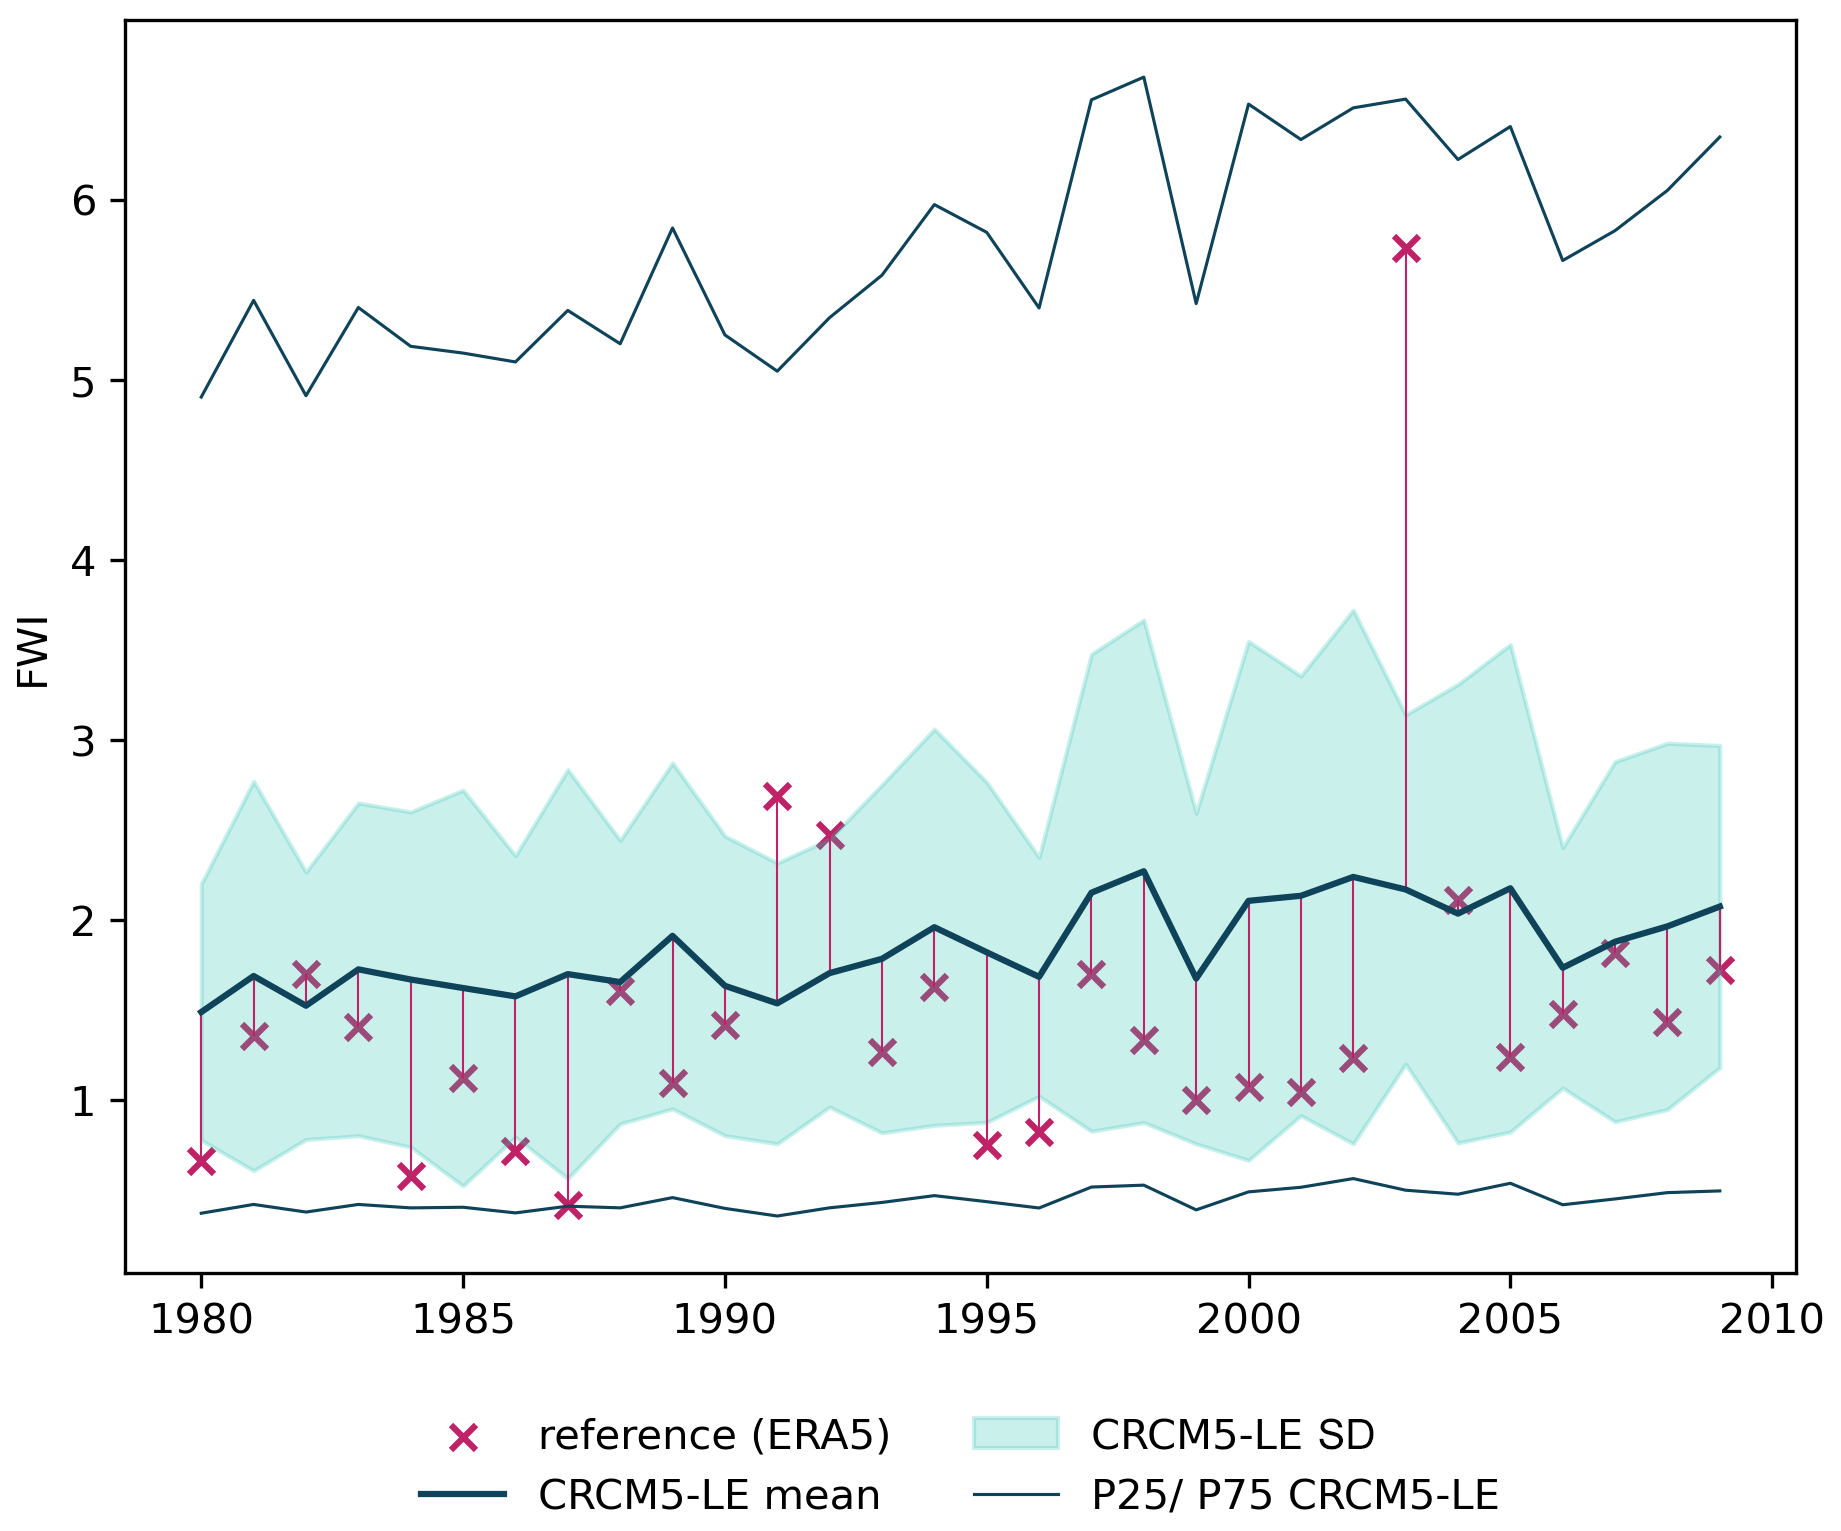
Figure 3Median FWI (thick blue line) and standard deviation (light-blue shading) for the CRCM5-LE mean in comparison to the reference dataset of Vitolo et al. (2020) marked in pink (× for values, lines for deviation from the CRCM5-LE mean) over the study area. The top and bottom blue lines represent the 25th and 75th quantiles of the CRCM5-LE, respectively.
The spatial differences between the ensemble and reference datasets are fairly small for the Alps and Alpine Foreland in the south (see Fig. 4). In the northern and especially northwestern parts (i.e., South German Escarpment) of the study area, the CRCM5-LE overestimates FWI values in comparison to the reference dataset by an order of 2 to 4. However, the overestimation in specific regions does not affect our analysis, which assesses changes in the FWI by comparing the FWI derived from the CRCM5-LE for a future and a reference period.
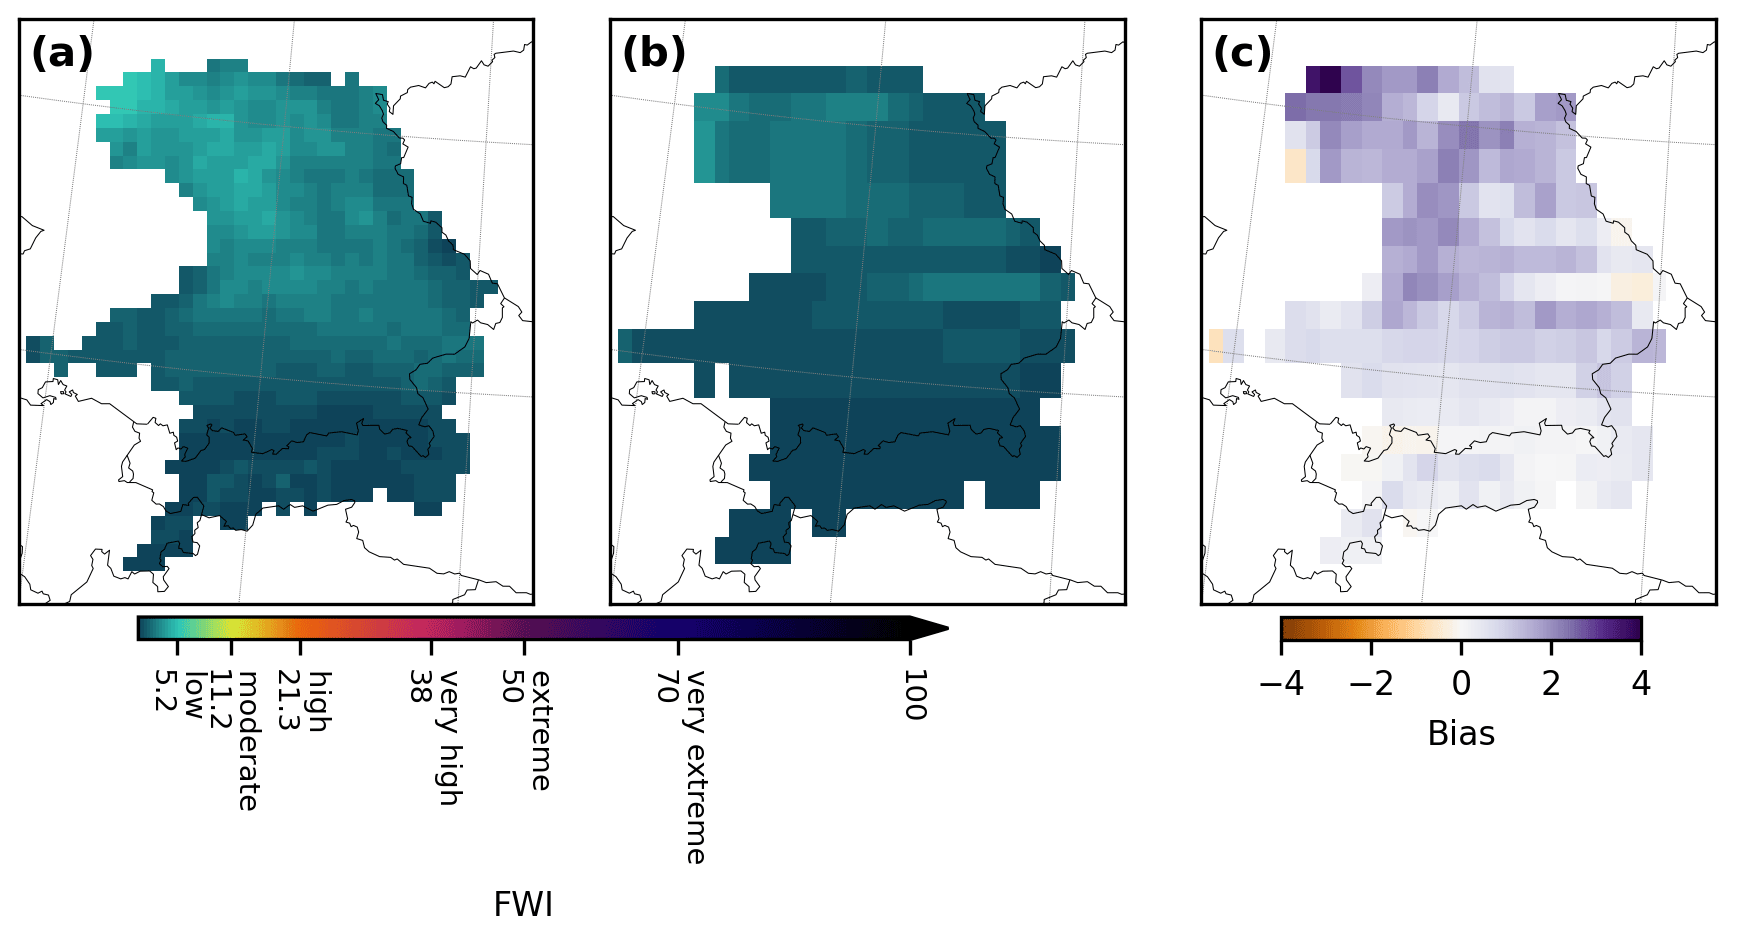
Figure 4Median FWI of the (a) CRCM5-LE, (b) reference dataset of Vitolo et al. (2020), and (c) difference (CRCM5-LE − reference dataset) for the present time period (1980–2009). The dataset difference was calculated by resampling the CRCM5-LE (a) to the spatial resolution of the reference dataset (b) using the nearest-neighbor approach.
2.5 Changes in fire danger
We evaluated changes in fire danger derived from the CRCM5-LE over the time period 1980 to 2099 in the study area with statistical metrics: median and extreme conditions were examined using the 50th and 90th quantiles of the FWI, respectively. The quantiles were calculated for different aggregation levels, either temporally on a monthly scale or spatially for the previously defined subregions. We derived the median and extreme for each ensemble member separately. Changes in fire danger were either compared between two climate periods or analyzed continuously from 1980 to 2099. For the climate period comparison, the dataset was split into two 30-year periods, 1980–2009 and 2070–2099, representing current and future climate conditions, respectively. For both periods, we derived the median and extreme quantiles for each fire season month for each of the 50 members of the CRCM5-LE.
2.5.1 Assessing spatiotemporal changes
We used signal maps, which consider the robustness and magnitude of changes in the FWI, to highlight areas with particularly robust and strong changes in the FWI between climate periods (Böhnisch et al., 2021). The change signal of a grid cell was assumed to be robust if a grid cell's median or extreme fire danger level in the future period was higher in comparison to its fire danger level (see Table 1) in the present period for more than 90 % of the climate model ensemble members (45 out of 50).
For the continuous temporal analysis, we provided fire rings in the style of the warming stripes of Hawkins (2018) to show how the FWI changes over the years on a monthly and subregional scale. The fire rings were derived for each year and all months of the fire season, based on the ensemble mean of the member-specific median or extreme quantile of the FWI for the defined subregions.
2.5.2 Time of emergence
The second part of the climate change impacts analysis focused on the time of emergence (TOE), which was calculated following the approach of Fargeon et al. (2020): the TOE is reached when a projected metric (e.g., the median of the FWI) crosses the upper bound of its confidence interval. The confidence interval was here defined as 1 standard deviation of the distribution of the climate model ensemble members of the present climate period for the mean and extreme quantiles, respectively. The TOE was defined as the time when the 30-year running mean trend of the ensemble mean exceeds the confidence interval. To account for the heterogeneous climate conditions in the study area, the TOE was calculated for each subregion separately. We used the median and extreme FWI quantiles of each fire season and ensemble member between 1980 and 2099 for each subregion as the basis for calculating the time of emergence.
2.5.3 Frequency changes
We assessed fire danger frequency changes in two ways: first, we compared frequency changes in daily fire danger levels of a fire season between the present and future climate period for each subregion. Second, we calculated changes in return periods of different FWI quantiles corresponding to return periods of 10, 20, 50, and 100 years under current climate conditions.
For the first analysis, we classified daily FWI values during the fire season for each member of the CRCM5-LE according to the EFFIS classification (Table 1). We show the relative frequency of each fire danger level across the ensemble members for the present and future climate period to highlight fire danger level changes in the four subregions.
For the second analysis, we calculated changes in the return periods of FWI quantiles that correspond to return periods of 10, 20, 50, and 100 years under current climate conditions (period 1980–2009) for the four subregions. To do so, we pooled daily FWI values over the entire 50-member ensemble (183 d per fire season × 30-year climate period × 50 members). Using this data pool, we determined the non-exceedance probability p of each FWI value in the present climate period using its rank r and the total sample size n following . We derived FWI quantiles in the current climate period for non-exceedance probabilities of and the corresponding FWI return periods T of 10, 20, 50, and 100 years using , where μ is the inter-arrival time ( d in a fire season) (Coles, 2001). To analyze changes in return periods over time (from 1980 to 2099), we created centered, rolling 30-year windows for each ensemble member (183 d per fire season × 30-year climate period) and derived the cumulative distribution of the time window using the rv_histogram.cdf function of the SciPy package in Python (Virtanen et al., 2020). We mapped the FWI quantiles representing the 10-, 20-, 50-, and 100-year return periods of the current period (1980–2009) to future return periods by deriving their non-exceedance probability p in the cumulative distribution of the rolling-window climate period (future). Next, we placed their future probability p into (Coles, 2001) to determine the return period T of the present FWI quantile under future climate conditions. This approach allows us to show how the return period of, e.g., the current 100-year FWI will change over time with climate change. Due to the centered-window approach, the first full 30-year window is 1995 and the last full 30-year window is 2084. Therefore, we show results between 1995 and 2084.
3.1 Increasing fire danger
Under the RCP8.5 emission scenario, fire danger in central Europe will increase (see Fig. 5). The FWI median (50th quantile) will correspond to moderate and high fire danger levels in some regions, and FWI extremes (90th quantile) will even reach extreme danger levels by the end of the century (2070–2099). Significant increases of at least one fire danger level (thin dots in Fig. 5) first occur in June and remain present throughout the study area until September for both the median and extreme FWI. Highlighting grid cells, which experience a rise of at least two levels (thick dots in Fig. 5), helps us to identify regional hotspots of future increases in fire danger. We find increases in fire danger of at least two levels for the South German Escarpment in July and August for the median FWI and in August for the extreme FWI. The other subregions (Alps, Alpine Foreland, Eastern Mountain Ranges) experience an increase of at least two fire danger levels only in the extreme FWI in August. Additionally, the western parts of the South German Escarpment and parts of the Eastern Mountain Ranges are affected by a fire danger level increase of at least two levels in September for the extreme FWI (see Fig. 5).
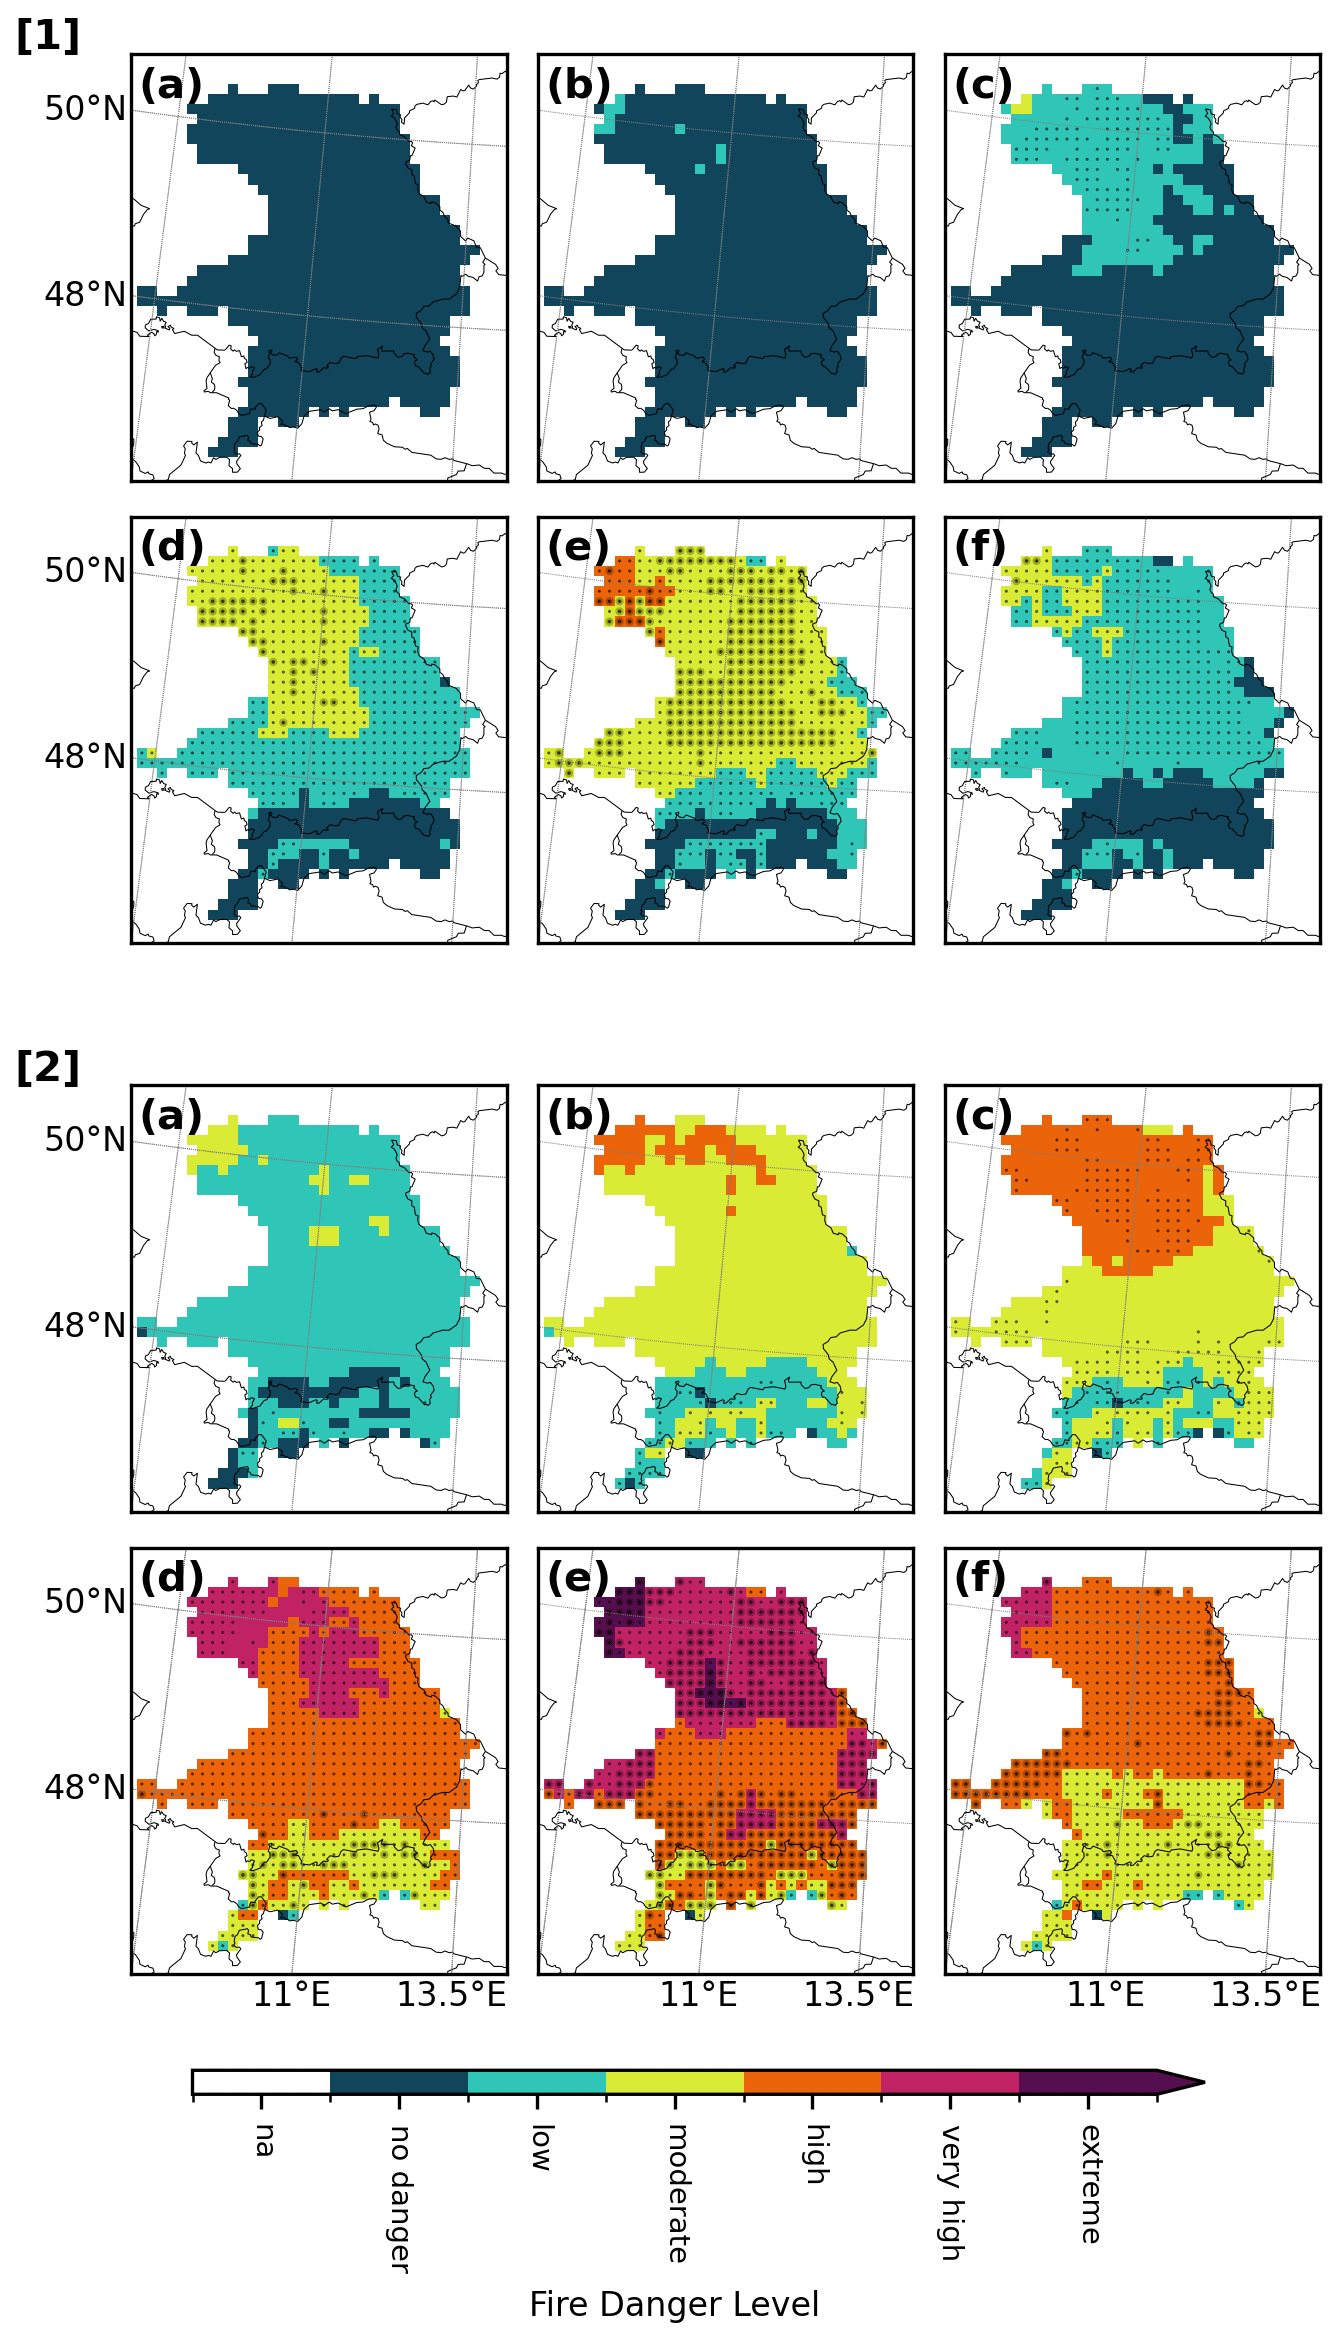
Figure 5Ensemble mean of the median ([1], 50th quantile) and extreme FWI ([2], 90th quantile) by fire season month ((a)–(f) for April–September) for the future time period 2070–2099. Dots indicate that 90 % of the CRCM5-LE members agree on a fire danger level increase of at least one level (thin black dots) or at least two levels (thick black dots) compared to the present period (1980–2009).
Increases in fire danger are visible throughout May to September and particularly pronounced from July to September (see Fig. 6). The median FWI points out that high fire danger becomes the average condition in the Alpine Foreland by 2080, in the South German Escarpment by 2060, and in the Eastern Mountain Ranges by 2070 (see Fig. 6, [1]). The Alps are exposed to high fire danger only when looking at the extreme FWI from 2070 onwards (see Fig. 6, [2]). The other subregions are more strongly affected by changes in the extreme FWI than the Alps: very high and high fire danger occur frequently in July and August in the second half of the 21st century in the Alpine Foreland and Eastern Mountain Ranges for the extreme FWI. In the South German Escarpment, this is the case in June and September. For July and August, very high and almost extreme fire danger levels occur frequently from 2030 onwards in the extreme FWI in the South German Escarpment (see Fig. 6). High fire danger becomes the median condition in the summer months towards the end of the century for large parts of the study region (see Figs. 5 and 6).
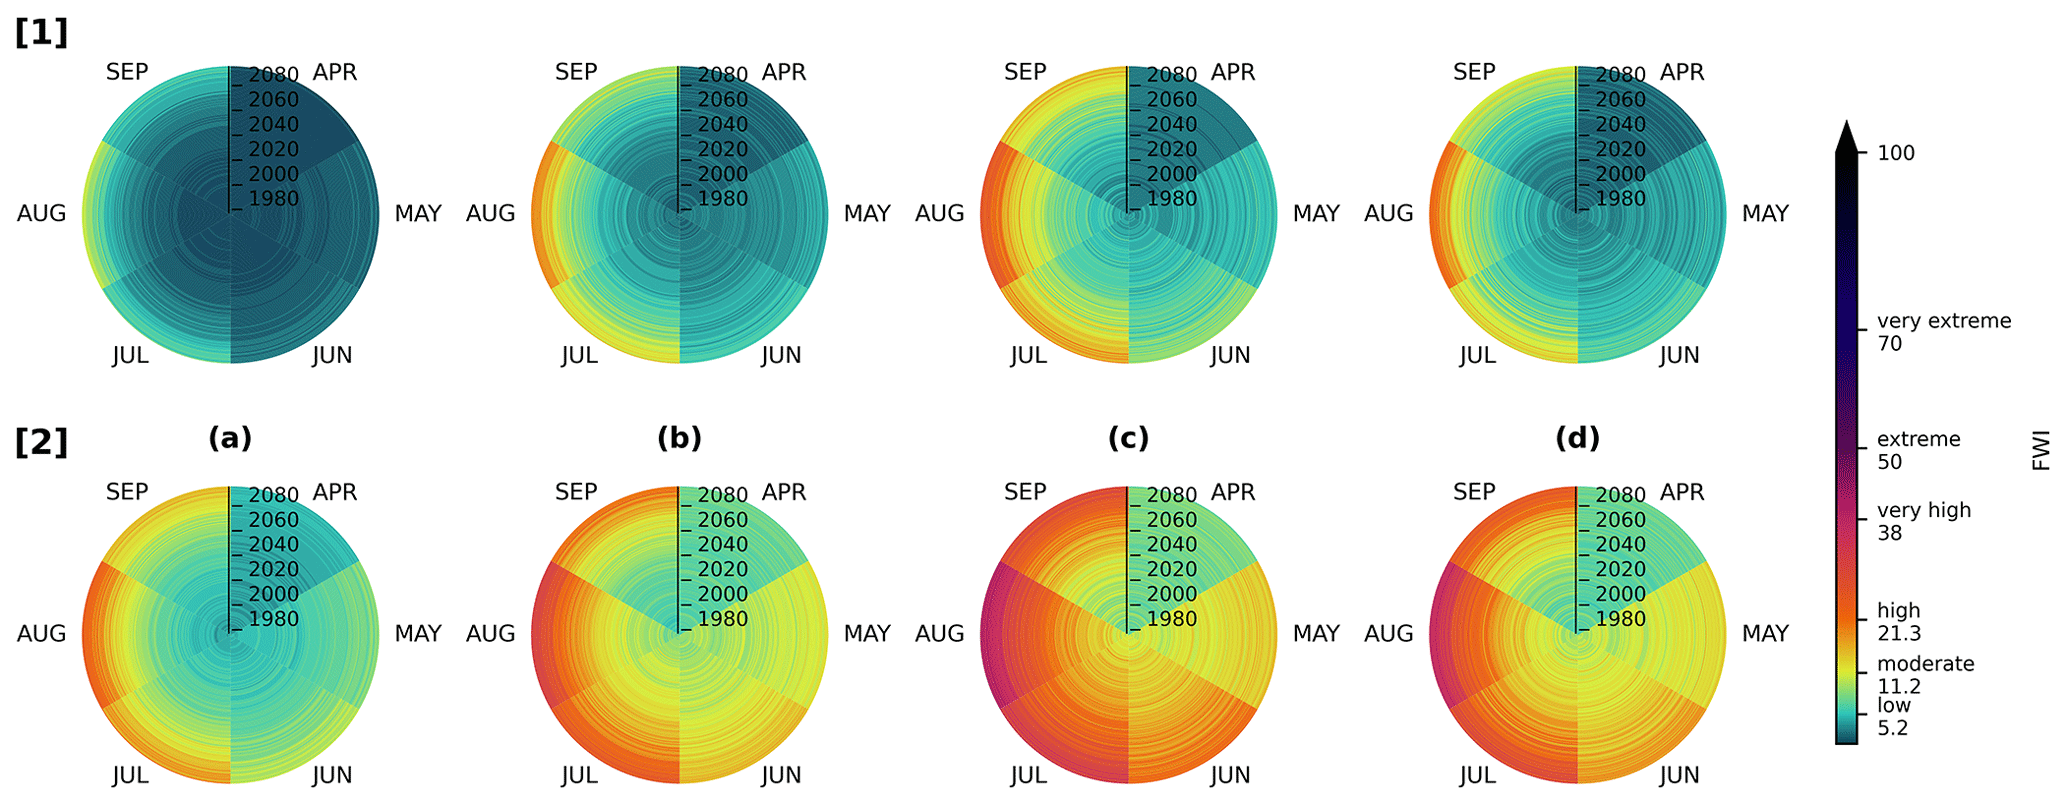
Figure 6Fire rings show the FWI of the ensemble mean of the monthly median ([1], 50th quantile) and extreme ([2], 90th quantile) of each subregion (a–d for Alps, Alpine Foreland, South German Escarpment, and Eastern Mountain Ranges) during the fire season (April–September) between 1980 and 2099.
3.2 Time of emergence
The climate change signal exceeds internal variability in all subregions by the mid-21st century in all subregions for both the median and extreme FWI (see Fig. 7). For all subregions, except the Alpine Foreland, the TOE is reached in the same year for both the median and the extreme FWI. The earliest TOE is reached in the Alps in 2032 (median and extreme), followed by the Alpine Foreland in 2039 for the median and in 2041 for the extreme FWI. In the South German Escarpment, the TOE is reached in 2044, and in the Eastern Mountain Ranges it is reached in 2047 for both the median and the extreme FWI. The FWI increases in the Alps are weaker than in the other subregions. Still, the TOE is reached quite early in this region because the FWI and its variability are very low in the present climate period. Throughout the 21st century, the median and extreme FWI will increase continuously in the Alps. While the extreme FWI is projected to shift from low to moderate fire danger in this subregion, the median FWI shows hardly any changes and remains at the level of no danger even at the end of the century (see Fig. 7). For the other subregions, the median of the fire season is currently low but increases towards a moderate danger level in the future. For the extreme FWI, the ensemble mean fire danger is moderate (11.2 < moderate < 21.3; see Table 1) in the present but increases until the end of the century up to a high level (21.3 < high < 38; see Table 1) with values greater than 30 for the South German Escarpment, slightly less than 30 for the Eastern Mountain Ranges, and approximately 25 in the Alpine Foreland (see Fig. 7). In general, increases in fire danger in the extreme FWI are of such a magnitude that the lower bounds of the ensemble standard deviation exceed the upper bounds of the standard deviation of the present climate period for all subregions by the end of the 21st century.
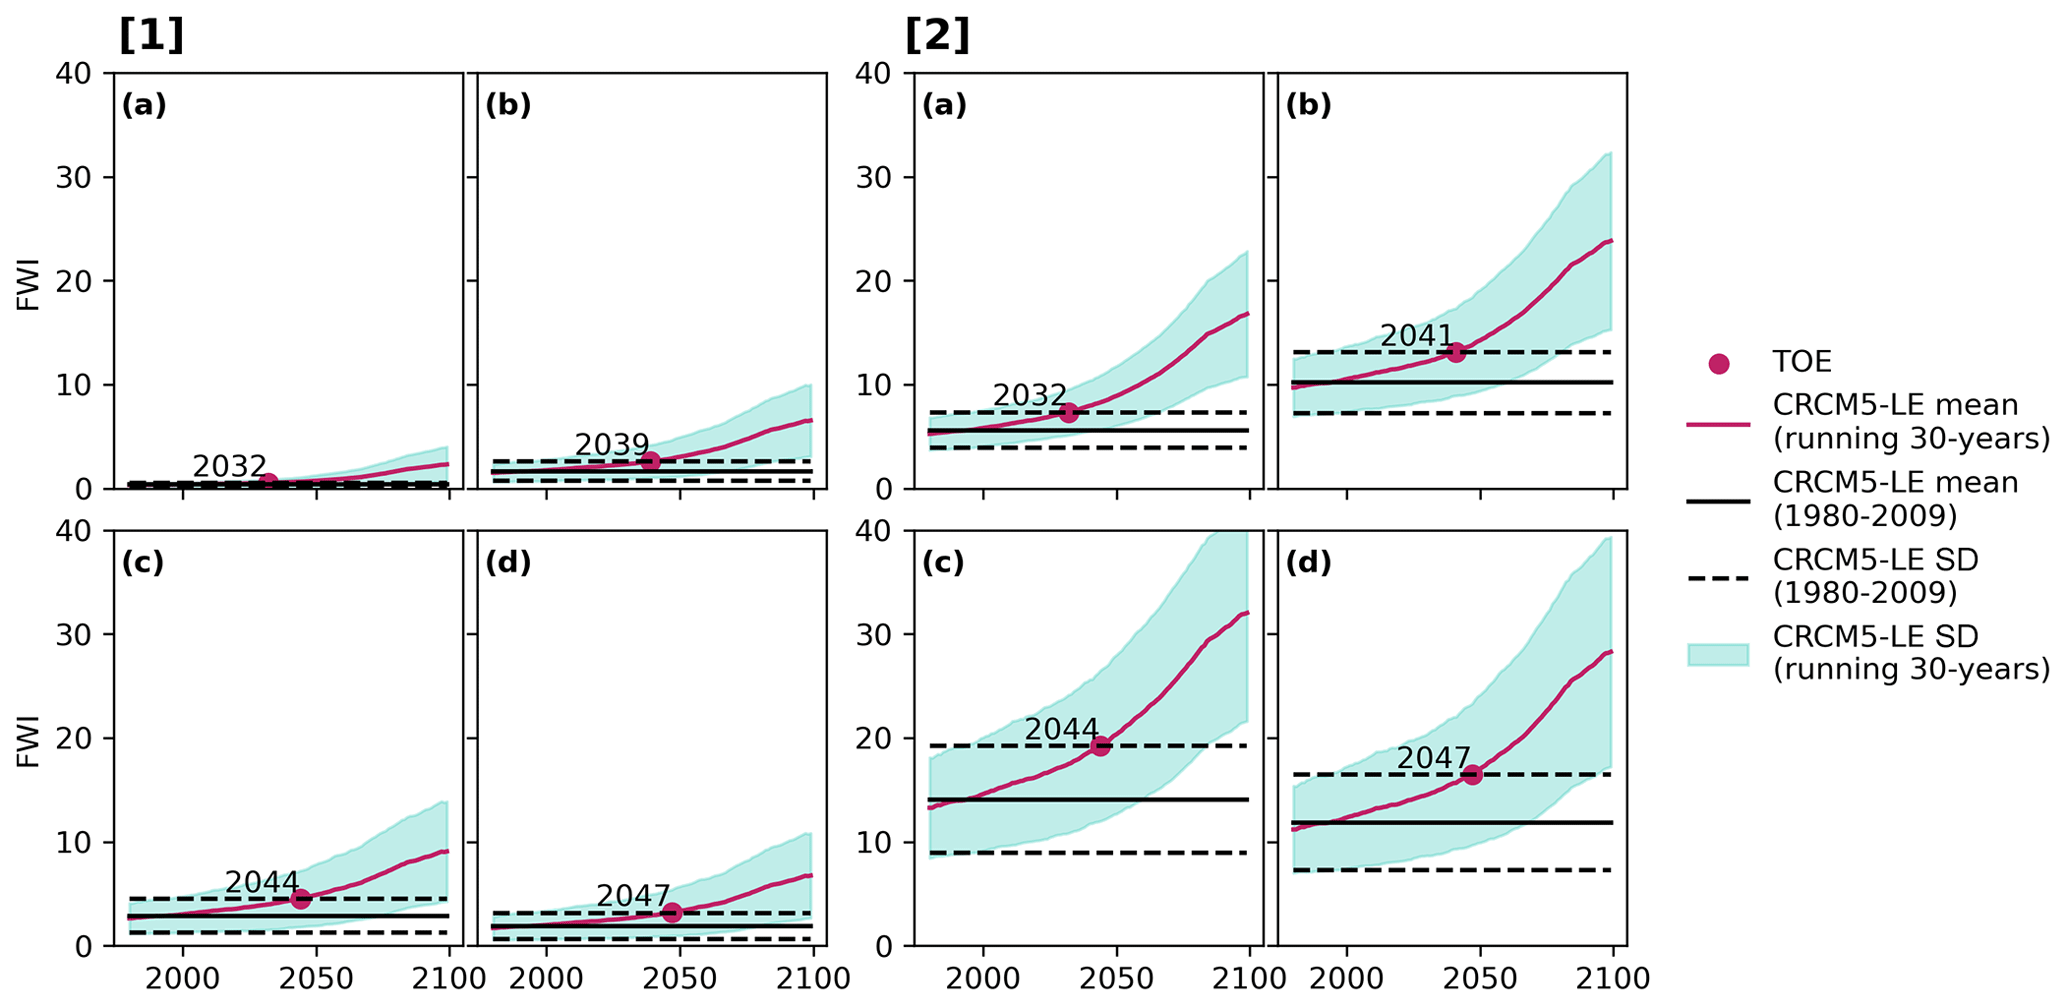
Figure 7Increases in the median ([1], 50th quantile) and extreme ([2], 90th quantile) FWI between 1980 and 2099 differentiated by subregion: (a) Alps, (b) Alpine Foreland, (c) South German Escarpment, and (d) Eastern Mountain Ranges. The ensemble mean increase is derived on a fire season basis and represented by solid pink lines smoothed over a 30-year window. The ensemble's standard deviation is represented by shaded blue areas. Solid and dashed black lines represent the ensemble mean and spread of the present climate period (1980–2009). The TOE, marked with a pink dot and year annotation, is reached when the ensemble mean (pink line) crosses the upper boundary of the ensemble standard deviation in the present climate period (dashed black line).
3.3 Increasing frequency of extreme events
In the future (2070–2099), the percentage of days with fire danger (greater than or equal to low) shifts from 10 % to 33 % in the Alps, from 25 % to 50 % in the Alpine Foreland and South German Escarpment, and from 33 % to 60 % in the Eastern Mountain Ranges (see Fig. 8). In the Alps, days of no and low fire danger currently account for 182 out of 183 d (99 %) of the fire season. In the future, the number of such days will decrease to approximately 160 out of 183 d (87 %). In the Alpine Foreland and South German Escarpment, the number of days with moderate, high, and very high fire danger increases by 15 % from the present to the future. The classes of high and very high danger are not observed in the present climate period but emerge in the future in the Alpine Foreland and the South German Escarpment. The difference between these two regions lies in the proportions of days of very high and extreme fire danger, which are more likely to occur in the South German Escarpment (4 %) than in the Alpine Foreland (1 %) in the future. In the Eastern Mountain Ranges, the frequency of days of low (20 %) and moderate (15 %) fire danger in the future is similar to that of the South German Escarpment and the Alpine Foreland. Our results show differences in the frequencies of days of high, very high, and extreme fire danger between the Eastern Mountain Ranges and the other subregions. In the Eastern Mountain Ranges, the level of very high fire danger is most common among all regions in the future and days with high fire danger increase from 4 % in the present to 15 % in the future. As in the other subregions, days of very high and extreme fire danger do not occur in the present but are observed during 5 % of the days in the future.
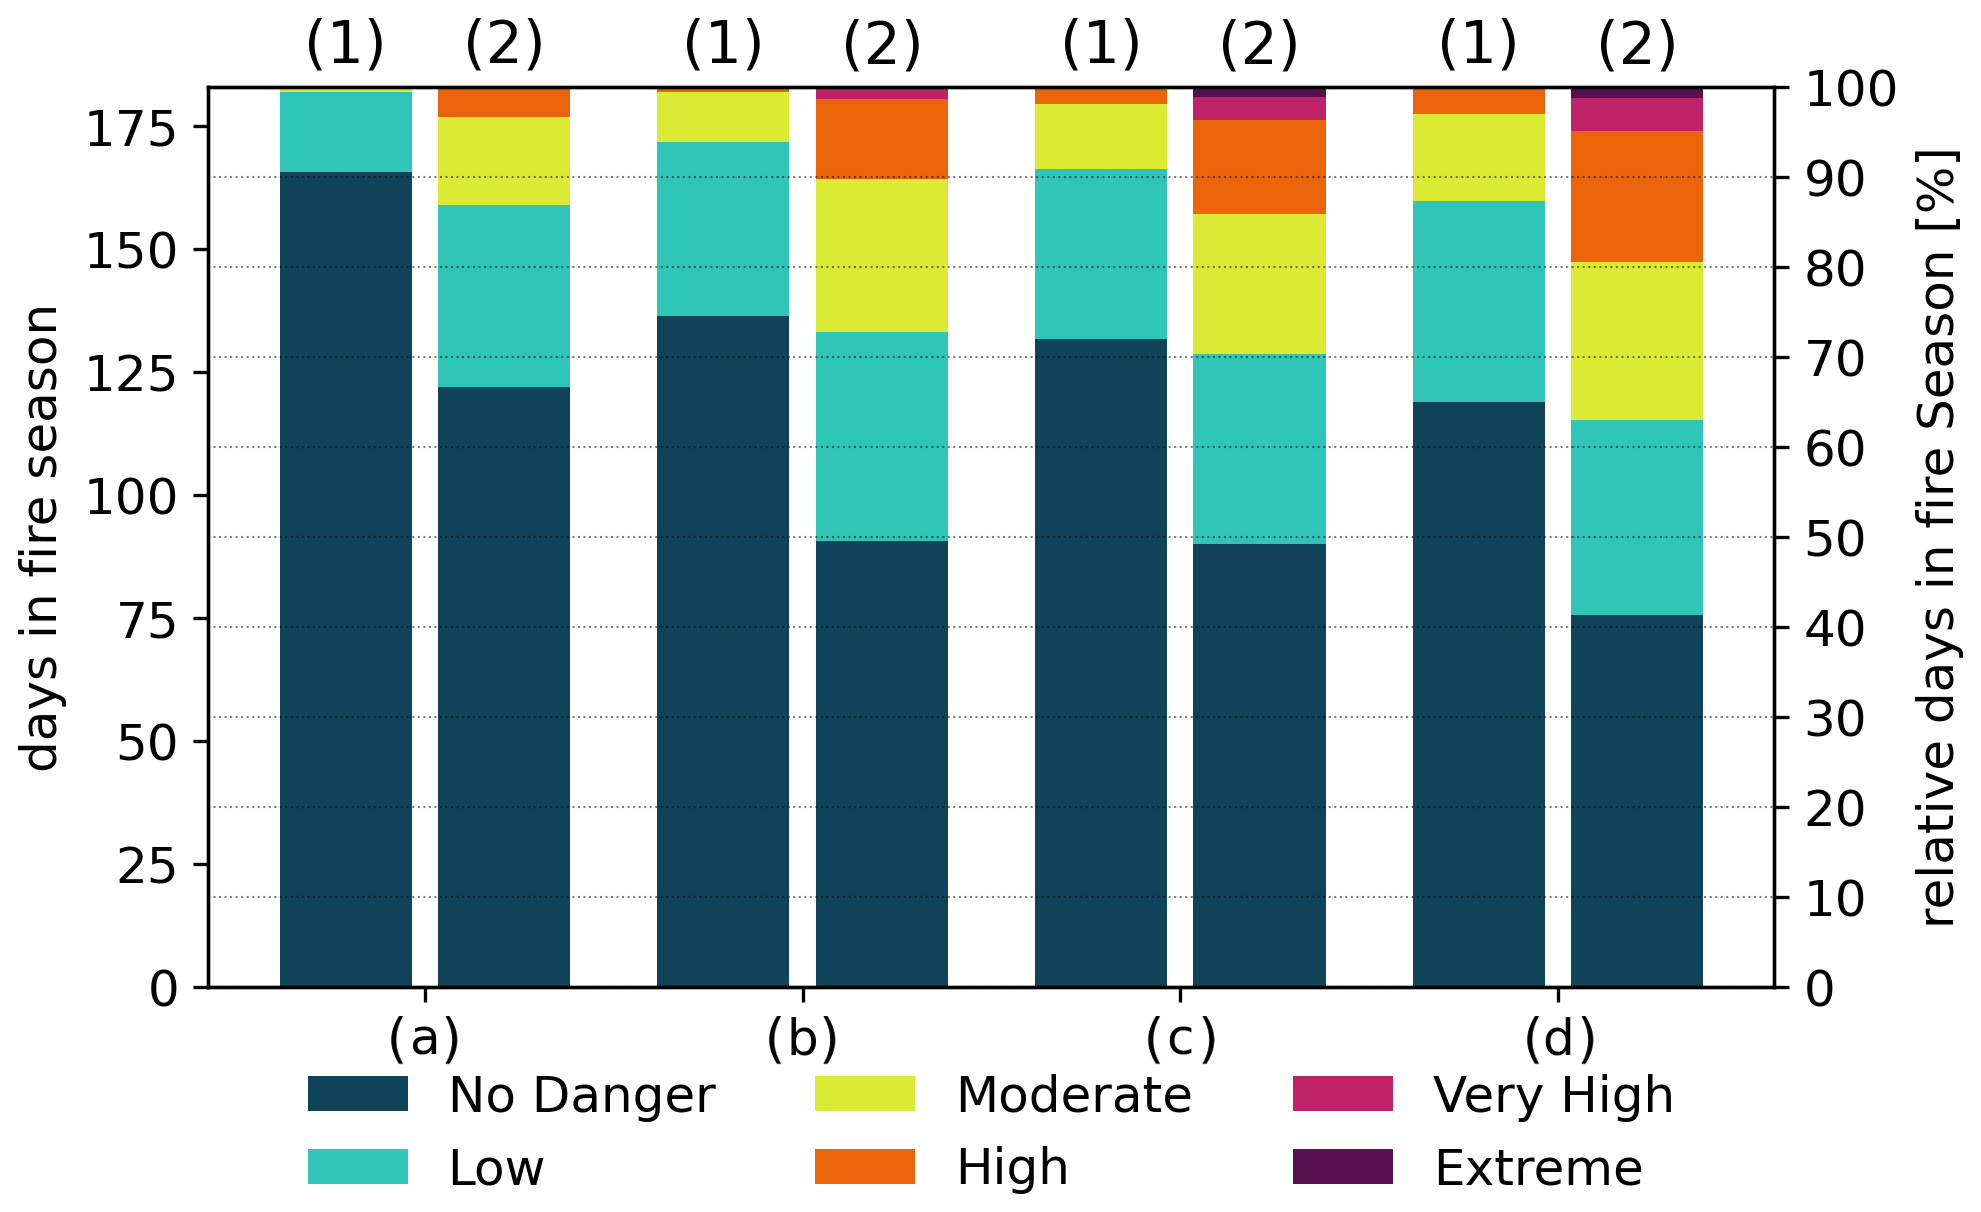
Figure 8Number of days experiencing specific fire danger levels during the fire season (April–September, 183 d) for the present ((1), 1980–2009) and future ((2), 2070–2099) climate period. FWI danger classes were derived for the subregions (a) Alps, (b) Alpine Foreland, (c) South German Escarpment, and (d) Eastern Mountain Ranges.
The return periods of current-climate 100-, 50-, 20-, and 10-yearly FWI extremes will at least halve by the end of the 21st century in all subregions (see Fig. 9). Generally, the results for the four subregions are quite similar and vary only slightly in detail. In all subregions, the present 100-year event will become the 50-year event in the early 2030s, the 20-year event in the 2060s, and the 10-year event by 2090. The 10-year events of the present will occur every 5 years by 2060 and every 3 years by 2090. The spread of the return periods decreases in the future, indicating a stronger increase in the frequency of very extreme events (i.e., 100- and 50-year events) than for mid-range extreme events (i.e., 20- and 10-year events) (see Fig. 9).
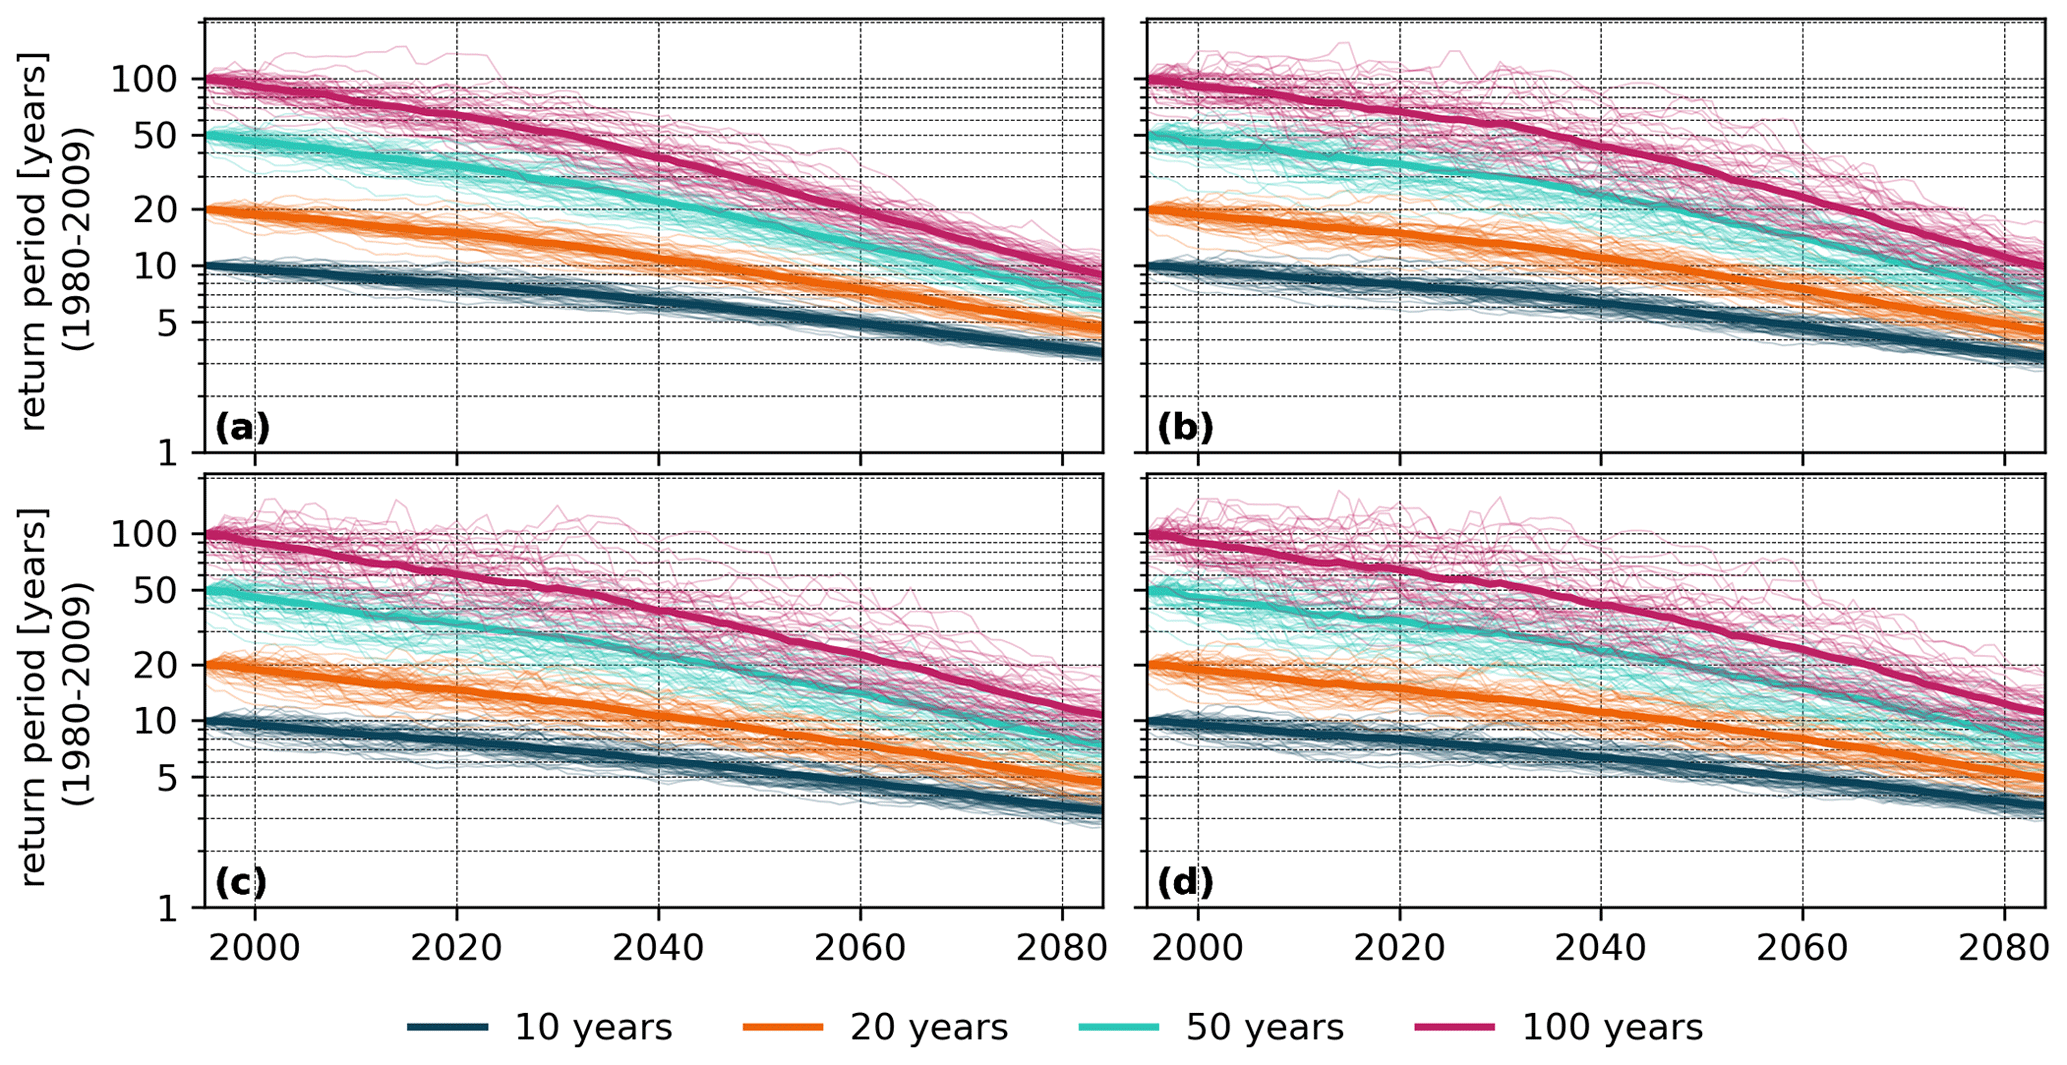
Figure 9Future changes (1995–2084) in the return periods of FWI quantiles corresponding to return periods of 10, 20, 50, and 100 years under current climate conditions (1980–2009) for the four subregions: (a) Alps, (b) Alpine Foreland, (c) South German Escarpment, and (d) Eastern Mountain Ranges. The thick solid line represents the CRCM5-LE mean, while thin lines represent the 50 ensemble members.
4.1 Spatiotemporal trends and variability
Our results demonstrate that fire danger in central Europe increases strongly until the end of the 21st century if the RCP8.5 scenario is assumed. The future increase in the number of days with conditions favoring high or higher levels of fire danger emerges for all metrics assessed in this study, i.e., different quantiles and aggregation levels of the ensemble and in space and time. Within the ensemble spread, increases in fire danger extremes (90th quantile) are more pronounced than increases in median (50th quantile) conditions according to all assessed metrics (see Figs. 5, 6 and 8). In space, we find that the variability in the FWI increases more strongly in mountain regions than in non-mountain regions, which is demonstrated by smaller changes in the median FWI than in the extreme FWI in the Alps and smaller differences in the increases in median and extreme fire danger for less complex terrain (Alpine Foreland and South German Escarpment) (see Fig. 5). This corroborates findings by Wastl et al. (2012), who explained the higher fire danger variability in mountain regions by the higher terrain variability, i.e., rain-shadow effects and katabatic dry winds (Foehn). In time, extreme fire weather (90th quantile) is more likely to occur in the second half than in the first half of the fire season because the differences between the median and extreme FWI quantiles are smaller in April, May, and June than in July, August, and September (see Fig. 6).
Our results for the TOE and the projected FWI in all subregions except the Alps are similar to the findings of Fargeon et al. (2020) for France, where the TOE is reached for both quantiles (50th and 90th) around 2060 (Fargeon et al., 2020), i.e., about 20 years later than in HydBav (see Fig. 7). Reasons for this delay in the TOE in France could be because of the later and shorter reference period (1995–2015) used by Fargeon et al. (2020), the larger uncertainty range originating from natural variability and model uncertainty in the multi-model ensemble as compared to the SMILE (Deser et al., 2012), the warmer and drier climate change signal of the CRCM5-LE (von Trentini et al., 2019), or differences in the climate of the study regions. While Fargeon et al. (2020) point out that fire danger increases are hard to distinguish from internal variability in northern France when using a multi-model ensemble, we demonstrate that increases in fire danger can robustly be quantified for central Europe when using a regional SMILE.
4.2 Dataset-specific uncertainties
Though SMILEs can account for internal variability, they are not designed to evaluate the structural uncertainty in the climate models (Deser et al., 2020). Structural or model uncertainty can only be assessed in multi-model studies (i.e., Fargeon et al., 2020). In order to quantify both internal variability and structural uncertainty it would be necessary to use multiple SMILEs as provided by the Multi-Model Large Ensemble Archive (MMLEA; Deser et al., 2020). However, all SMILEs in the MMLEA are based on global climate models (GCMs) with a spatial resolution ranging between 2.8 and 0.9∘ (Deser et al., 2020). On a regional and local scale, a higher spatial resolution is needed to quantify climate change impacts on forest fires. For Europe, only two other dynamically downscaled SMILEs from regional climate models (RCMs) exist besides the CRCM5-LE: the 16-member EC-Earth–RACMO ensemble with a grid cell size of 0.11∘ (Aalbers et al., 2018) and the 21-member CESM–CCLM ensemble with a grid cell size of 0.44∘ (Brönnimann et al., 2018; Fischer et al., 2013). The models differ in their study domain (EC-Earth–RACMO) and spatial resolution (CESM–CCLM) compared to the CRCM5-LE used here (Wood, 2023; von Trentini et al., 2020).
The CRCM5 represents the FWI at a much finer spatial resolution than the CanESM2 and therefore adds robust high-resolution features (Böhnisch et al., 2020). However, we find tiling patterns on the border between the South German Escarpment and the Alpine Foreland (see Fig. 5), which correspond to the geophysical baseline parameterization of the CanESM2 (see Fig. A4). In comparison to the CORDEX multi-model ensemble, the CRCM5-LE shows drier and warmer climate change signals for temperature and precipitation (von Trentini et al., 2019). These characteristics of the CRCM5-LE are in line with the results from the validation (see Fig. 3) and suggest that our results represent an upper limit of the expected changes in future fire danger.
Correcting the bias between climate model data and observation data is often an inevitable step in climate impact studies (Piani et al., 2010). The CRCM5-LE was bias-adjusted using univariate quantile mapping (Poschlod et al., 2020; Mpelasoka and Chiew, 2009). Such univariate methods can change the co-variation between multiple variables (Zscheischler et al., 2019) with potential impacts on the analysis of complex indices like the FWI. Therefore, there have been calls for the use of multi-variate bias correction methods (Cannon, 2018). However, Yang et al. (2015) showed that univariate bias correction was sufficient to study fire weather changes in Sweden. Furthermore, multi-variate bias correction is a non-trivial task and fixing co-variation issues between variables might lead to other problems, e.g., with the representation of temporal or spatial dependencies (Vrac, 2018). In this regard, we assume that the univariate bias correction applied on the CRCM5-LE is appropriate for our analysis.
4.3 Limitations of fire danger metrics
Our validation setup demonstrates that the algorithm used to compute the FWI generates results comparable to the reference dataset (see Fig. 3), even though our analysis used the cffdrs R package to calculate the FWI (Wang et al., 2017), whereas the reference dataset was generated with the Global ECMWF Fire Forecast (GEFF) model (Di Giuseppe et al., 2016). These models differ slightly in their results because the GEFF model applies the original FWI formulas from van Wagner (1987) and the cffdrs R package uses adjusted formulas for the DC and DMC (Wang et al., 2017).
The FWI used in this study cannot be analyzed in terms of events (Wotton, 2009), similar to other indices like the Percent of Normal Index for drought events (Böhnisch et al., 2021). Fires start only in the case of an ignition, and the FWI as a danger rating index quantifies the ease of ignition, rate of spread, and difficulty of controlling a potential fire (De Rigo et al., 2017). Therefore, the FWI describes fire weather development rather than actual event occurrence and is suitable to assess future changes in fire danger (Di Giuseppe et al., 2016).
While the FWI does address fire danger in a meteorological context, it does not account for the flammability of the surface. Land use in our study area is complex, but contiguous forests are present in all four subregions, especially the Eastern Mountain Ranges and the Alps. Persistent snow cover in winter prevents fire occurrences in spring in the Alps (Conedera et al., 2018) and other regions of high elevation, even though fire weather conditions might be met. Large parts of the South German Escarpment and Alpine Foreland are used for agricultural purposes, where fires can spread fast under dry conditions (see Fig. A1). However, these regions are more densely populated than the other two regions (Eastern Mountain Ranges and the Alps), enabling a faster suppression of fire incidents. For large-scale FWI analyses, non-burnable areas such as deserts and bare soil are masked out (Touma et al., 2021; Vitolo et al., 2020). In the context of the study area of HydBav and the 11 km resolution of the CRCM5-LE, land use was highly variable on a subpixel scale and non-burnable areas (e.g., lakes, snow- and ice-covered areas, and urban areas) are therefore not masked out (see Fig. A1).
4.4 Increasing fire danger and implications
We identified the South German Escarpment as a hotspot for dangerous FWI conditions within hydrological Bavaria (see Figs. 5 and 6). However, the other subregions are subject to substantial changes in fire danger as well, especially in August and July. On average, the median fire danger will be high in the Alpine Foreland, South German Escarpment, and Eastern Mountain Ranges and moderate in the Alps by the end of the century. In the Alps, the median FWI does not reach fire danger levels as high as in the other subregions because of their elevation-dependent colder climate. Nevertheless, this region is very sensitive to climate-change-induced fire weather changes as demonstrated by its early TOE (see Fig. 7) and its significant danger level changes in the months of July and August (see Fig. 5).
Over the course of the 21st century, the fire season will be prolonged, as fire danger levels are still elevated in September from 2030 onwards (see Fig. 6). This suggests that the fire season might extend to at least October towards the end of the century. For the southern Alps, Wastl et al. (2012) identified the main fire season between December and April because of low precipitation and decreased fuel moisture outside of the vegetation period (Conedera et al., 2018). Future studies assessing changes in fire danger and fire events in temperate climate regions should therefore consider the whole year instead of the vegetation season only.
Our results highlight the increasing frequency of currently anomalously extreme fire weather that will affect the fire regime of the study region (see Fig. 6). Prolonged droughts and exacerbating heat events might limit fuel availability and therefore fire activity in more arid regions, such as the Mediterranean, in the future (Bowman et al., 2020; Pausas and Paula, 2012). For wetter, more productive regions, like our study area, aridity does not limit fuel availability. Bowman et al. (2020) suggested that a declining snow cover in spring and drier fuels in summer will increase burned area in mountain forests, as present in the Alps and Eastern Mountain Ranges. This implies a higher sensitivity to flammable conditions (e.g., after hot and dry seasons) and an extension of fire events to more northern latitudes and higher elevations.
Expected changes in fire weather in the Mediterranean are of such a magnitude that current fire suppression measures might not be sufficient anymore (Turco et al., 2018). Studies for other regions, e.g., the UK (Arnell et al., 2021) and France (Fargeon et al., 2020), suggested that increases in fire danger should be considered in emergency land use and management planning to mitigate future fire danger. Our findings indicate that forest fire mitigation measures must be adapted for central Europe and its mountain regions as well.
This study presents the first regional single-model initial-condition large ensemble (SMILE) assessment of fire danger changes for central Europe, more specifically, the study area of hydrological Bavaria (HydBav). To date, the study area has been irregularly affected by wildfires and high fire danger occurs only under very rare conditions (90th FWI quantile). However, high fire danger will become more frequent in the future when assuming an RCP8.5 emission scenario. Our results demonstrate that fire danger increases substantially throughout the study area during this century. We find the strongest changes and highest fire danger levels north of the river Danube in the summer months of July and August for the subregions of the South German Escarpment and Eastern Mountain Ranges. Our results also show that the time of emergence (TOE) is reached in all subregions before 2050. Moreover, they show that not only the mean but also the lowest range of the running mean, indicated by the CRCM5-LE standard deviation, exceeds the upper limits of the current climate standard deviation (1980–2009) in all subregions before 2099 for the 90th FWI quantile. Last, our findings demonstrate that the return periods of present-climate 100-year FWI events shift towards 10-year events by 2090 and the return periods of present-climate 100-, 50-, and 20-year events shift to 50-, 20-, and 10-year events, respectively, before 2050 for all subregions. Our findings highlight future fire danger increases for central Europe – an example region currently with conditions of low to moderate fire danger – and stress the importance of developing fire suppression measures to adapt to these increases in regions with temperate climate.
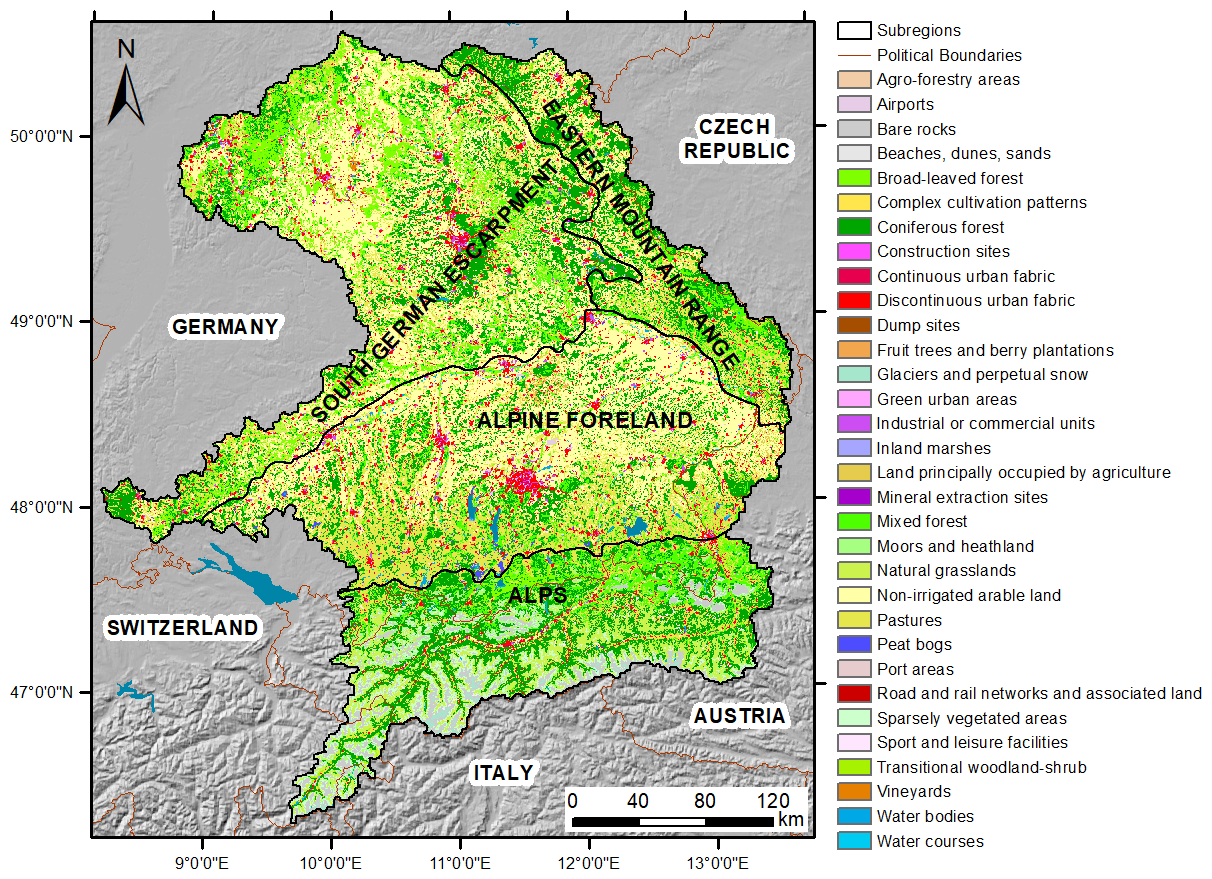
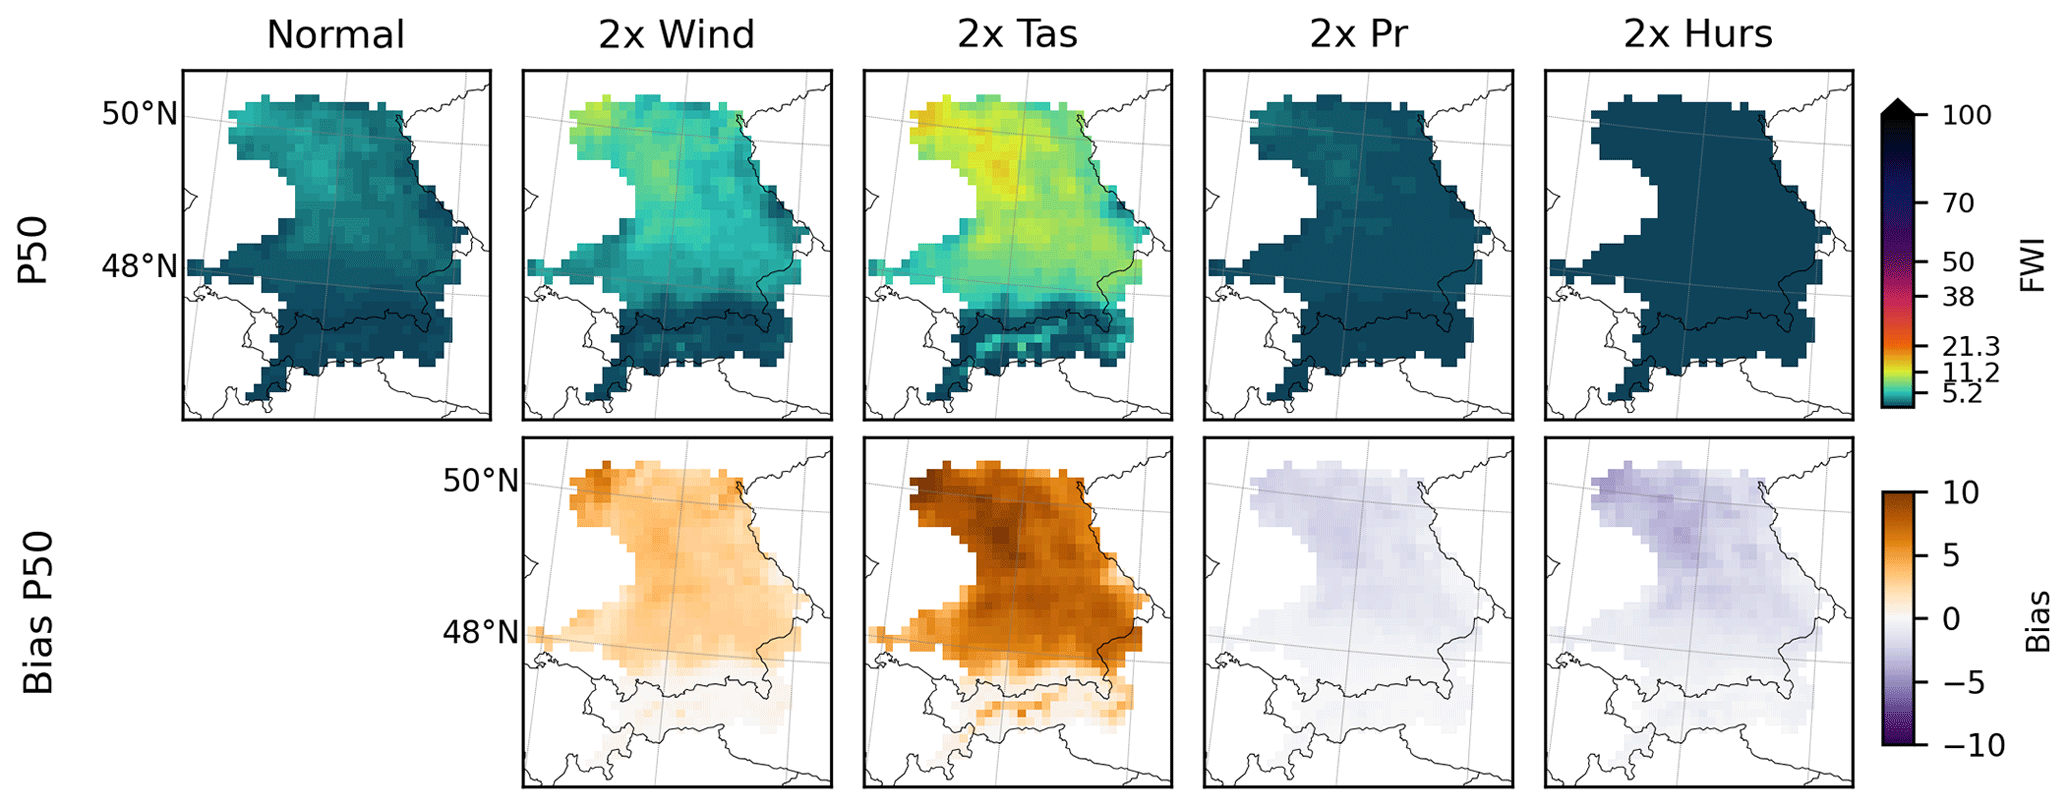
Figure A2FWI median (top, 50th quantile, P50) and bias (bottom) of sensitivity runs, where each input variable is increased by a factor of 2 (i.e. 2 × wind; 2 × temperature, tas; 2 × precipitation, pr; 2 × relative humidity, hurs), and the original FWI run (normal) in the validation period 1980 to 2009. Bias is calculated by subtracting each increased sensitivity run from the original FWI run.
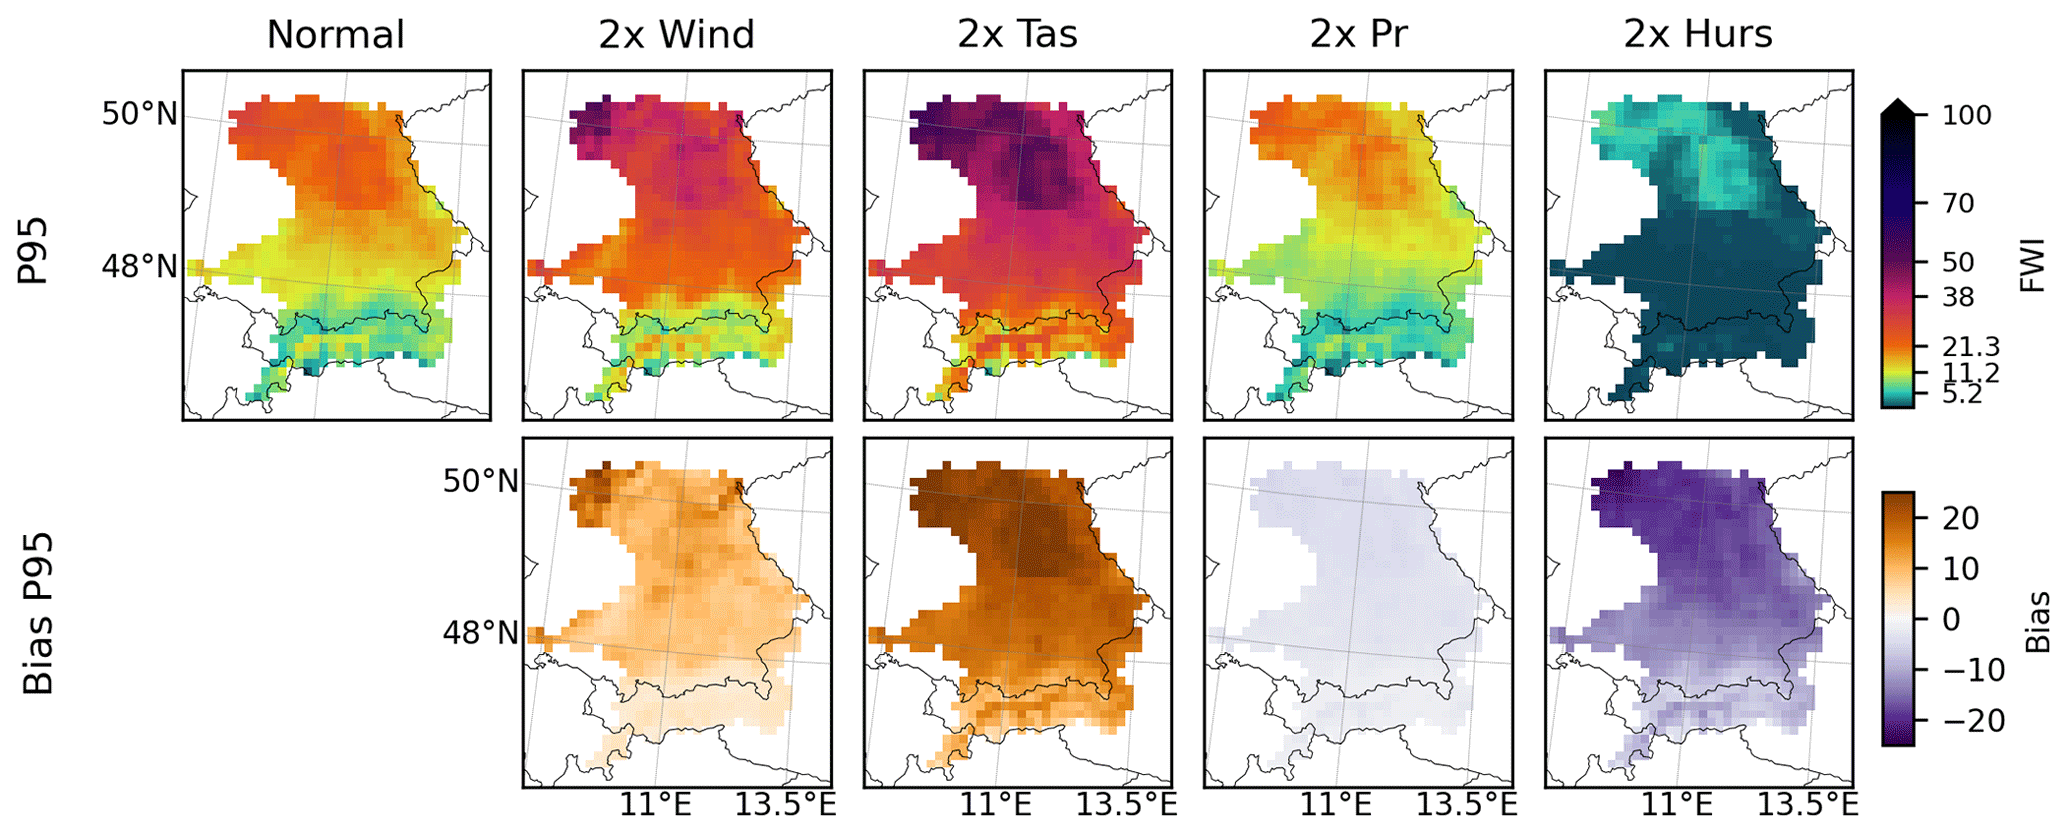
Figure A3FWI extreme (top, 95th quantile, P95) and bias (bottom) of sensitivity runs, where each input variable is increased by a factor of 2 (i.e. 2 × wind; 2 × temperature, tas; 2 × precipitation, pr; 2 × relative humidity, hurs), and the original FWI run (normal) in the validation period 1980 to 2009. Bias is calculated by subtracting each increased sensitivity run from the original FWI run.
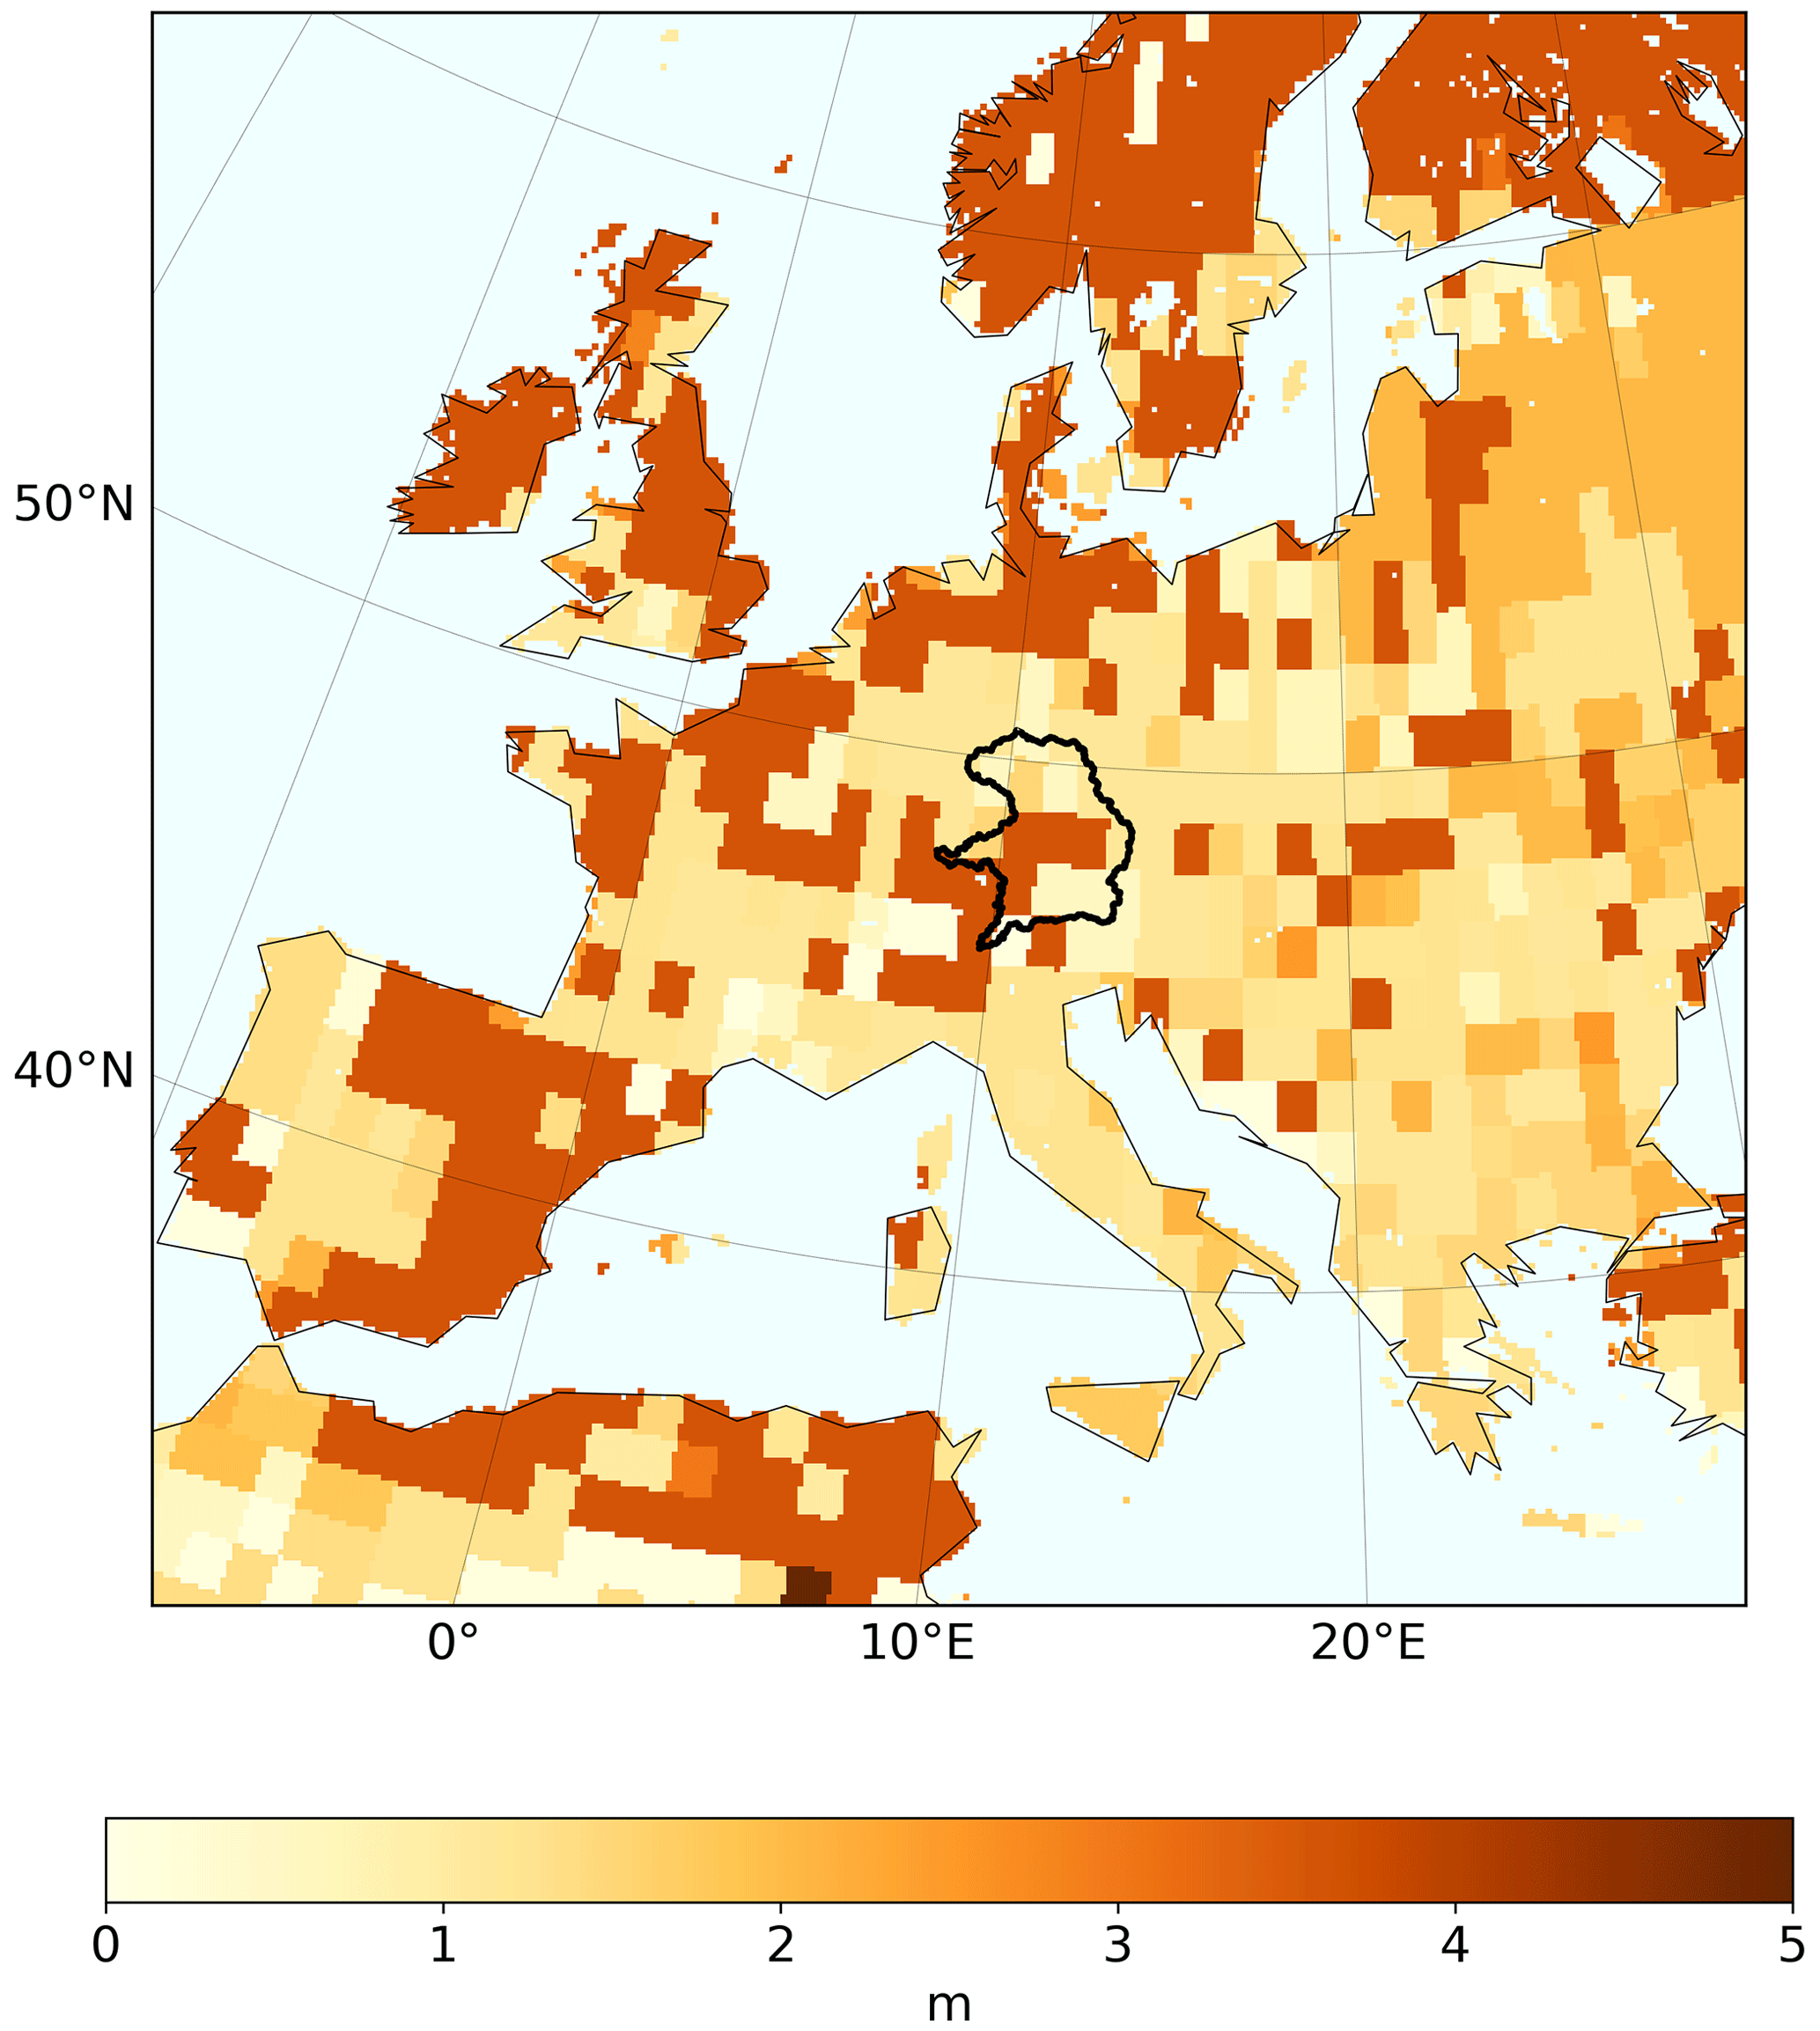
Figure A4Bedrock depth in the CanESM2 and boundaries of hydrological Bavaria (black).
The datasets used in this study can be found in the following repositories: the FWI variable derived from the CRCM5-LE at https://doi.org/10.16904/envidat.466 (Miller et al., 2023), CRCM5-LE at https://www.climex-project.org/data-access/ (ClimEx, 2024), ERA5-based FWI at https://doi.org/10.24381/cds.0e89c522 (Copernicus Climate Change Service, 2019), subregional division at https://www.lfu.bayern.de/natur/naturraeume/index.htm (Bayrisches Landesamt für Umwelt, 2024), and land cover data from the Copernicus Land Monitoring Service at https://doi.org/10.2909/71c95a07-e296-44fc-b22b-415f42acfdf0 (CLMS, 2021).
JM, AB, RL, and MIB contributed to the conception of the study. JM conducted the data collection for the FWI, performed statistical analyses, and wrote the first version of the manuscript. AB, RL, and MIB monitored and supported the research process and revised and edited the manuscript. RL is the founder and head of the ClimEx project. All authors contributed to the article and approved the submitted version.
The contact author has declared that none of the authors has any competing interests.
Publisher's note: Copernicus Publications remains neutral with regard to jurisdictional claims made in the text, published maps, institutional affiliations, or any other geographical representation in this paper. While Copernicus Publications makes every effort to include appropriate place names, the final responsibility lies with the authors.
This article is part of the special issue “Hydro-meteorological extremes and hazards: vulnerability, risk, impacts, and mitigation”. It is a result of the European Geosciences Union General Assembly 2022, Vienna, Austria, 23–27 May 2022.
This research was conducted within the ClimEx project (https://www.climex-project.org/, last access: 1 February 2024), funded by the Bavarian State Ministry of the Environment and Consumer Protection (grant no. 81-0270-024570/2015) and the FoFix project funded by ETH Zurich. The CRCM5 was developed by the Centre ESCER of the Université du Québec à Montréal (UQAM; https://escer.uqam.ca/, last access: 1 February 2024) in collaboration with Environment and Climate Change Canada. Computations with the CRCM5 for the ClimEx project were performed on the high-performance computing (HPC) system SuperMUC and the Linux Cluster of the Leibniz Supercomputing Centre (LRZ) of the Bavarian Academy of Sciences and the Humanities (BAdW), funded via the Gauss Centre for Supercomputing (GCS) by the German Federal Ministry for Education and Research (BMBF) and the Bavarian State Ministry of Education, Science and the Arts (StMWFK).
This research has been supported by the Bayerisches Staatsministerium für Umwelt und Verbraucherschutz (grant no. 81-0270-024570/2015).
This paper was edited by Nadav Peleg and reviewed by Jatan Buch and two anonymous referees.
Aalbers, E. E., Lenderink, G., van Meijgaard, E., and van den Hurk, B. J. J. M.: Local-scale changes in mean and heavy precipitation in Western Europe, climate change or internal variability?, Clim. Dynam., 50, 4745–4766, https://doi.org/10.1007/s00382-017-3901-9, 2018. a
Abatzoglou, J. T., Juang, C. S., Williams, A. P., Kolden, C. A., and Westerling, A. L.: Increasing Synchronous Fire Danger in Forests of the Western United States, Geophys. Res. Lett., 48, e2020GL091377, https://doi.org/10.1029/2020GL091377, 2021. a
Arnell, N. W., Freeman, A., and Gazzard, R.: The effect of climate change on indicators of fire danger in the UK, Environ. Res. Lett., 16, 44027, https://doi.org/10.1088/1748-9326/abd9f2, 2021. a, b, c, d, e
Bakke, S. J., Wanders, N., van der Wiel, K., and Tallaksen, L. M.: A data-driven model for Fennoscandian wildfire danger, Nat. Hazards Earth Syst. Sci., 23, 65–89, https://doi.org/10.5194/nhess-23-65-2023, 2023. a
Barbero, R., Abatzoglou, J. T., Larkin, N. K., Kolden, C. A., and Stocks, B.: Climate change presents increased potential for very large fires in the contiguous United States, Int. J. Wildland Fire, 24, 892–899, https://doi.org/10.1071/WF15083, 2015. a, b
Barbero, R., Abatzoglou, J. T., Pimont, F., Ruffault, J., and Curt, T.: Attributing Increases in Fire Weather to Anthropogenic Climate Change Over France, Front. Earth Sci., 8, 892–899, https://doi.org/10.3389/feart.2020.00104, 2020. a, b
Bayrisches Landesamt für Umwelt: Naturräumliche Gliederung Bayerns, https://www.lfu.bayern.de/natur/naturraeume/index.htm (last access: 2 February 2024), 2024. a
Bowman, D. M. J. S., Kolden, C. A., Abatzoglou, J. T., Johnston, F. H., van der Werf, G. R., and Flannigan, M.: Vegetation fires in the Anthropocene, Nature Reviews Earth and Environment, 1, 500–515, https://doi.org/10.1038/s43017-020-0085-3, 2020. a, b, c
Bradshaw, L. S., Deeming, J. E., Burgan, R. E., and Cohen, J. D.: The 1978 National Fire-Danger Rating System: technical documentation, Tech. rep., https://doi.org/10.2737/INT-GTR-169, 1984. a
Brunner, M. I., Swain, D. L., Wood, R. R., Willkofer, F., Done, J. M., Gilleland, E., and Ludwig, R.: An extremeness threshold determines the regional response of floods to changes in rainfall extremes, Commun. Earth Environ., 2, 1–11, https://doi.org/10.1038/s43247-021-00248-x, 2021. a, b
Brönnimann, S., Rajczak, J., Fischer, E. M., Raible, C. C., Rohrer, M., and Schär, C.: Changing seasonality of moderate and extreme precipitation events in the Alps, Nat. Hazards Earth Syst. Sci., 18, 2047–2056, https://doi.org/10.5194/nhess-18-2047-2018, 2018. a
Böhnisch, A., Ludwig, R., and Leduc, M.: Using a nested single-model large ensemble to assess the internal variability of the North Atlantic Oscillation and its climatic implications for central Europe, Earth Syst. Dynam., 11, 617–640, https://doi.org/10.5194/esd-11-617-2020, 2020. a
Böhnisch, A., Mittermeier, M., Leduc, M., and Ludwig, R.: Hot Spots and Climate Trends of Meteorological Droughts in Europe – Assessing the Percent of Normal Index in a Single-Model Initial-Condition Large Ensemble, Front. Water, 3, 107, https://doi.org/10.3389/frwa.2021.716621, 2021. a, b, c, d
Böhnisch, A., Felsche, E., and Ludwig, R.: European heatwave tracks: using causal discovery to detect recurring pathways in a single-regional climate model large ensemble, Environ. Res. Lett., 18, 014038, https://doi.org/10.1088/1748-9326/aca9e3, 2023. a
Cannon, A. J.: Multivariate quantile mapping bias correction: an N-dimensional probability density function transform for climate model simulations of multiple variables, Clim. Dynam., 50, 31–49, https://doi.org/10.1007/s00382-017-3580-6, 2018. a, b
ClimEx: Data Access, https://www.climex-project.org/data-access/ (last access: 5 February 2024), 2024. a
CLMS: Corine Land Cover 2018, Version 2020-20u1, Tech. rep., Corine Land Management Service (CLMS) [data set], https://doi.org/10.2909/71c95a07-e296-44fc-b22b-415f42acfdf0, 2021. a, b
Coles, S.: An Introduction to Statistical Modeling of Extreme Values, Springer Series in Statistics, Springer, London, ISBN 978-1-84996-874-4 978-1-4471-3675-0, https://doi.org/10.1007/978-1-4471-3675-0, 2001. a, b
Conedera, M., Krebs, P., Valese, E., Cocca, G., Schunk, C., Menzel, A., Vacik, H., Cane, D., Japelj, A., Muri, B., Ricotta, C., Oliveri, S., and Pezzatti, G. B.: Characterizing Alpine pyrogeography from fire statistics, Appl. Geogr., 98, 87–99, https://doi.org/10.1016/j.apgeog.2018.07.011, 2018. a, b
Copernicus Climate Change Service, Climate Data Store: Fire danger indices historical data from the Copernicus Emergency Management Service, Copernicus Climate Change Service (C3S) Climate Data Store (CDS) [data set], https://doi.org/10.24381/cds.0e89c522, 2019. a
De Rigo, D., Libertà, G., Houston Durrant, T., Artés Vivancos, T., and San-Miguel-Ayanz, J.: Forest fire danger extremes in Europe under climate change: variability and uncertainty, Tech. rep., Publications Office of the European Union, https://doi.org/10.2760/13180, 2017. a, b, c, d, e, f, g
Deser, C., Knutti, R., Solomon, S., and Phillips, A. S.: Communication of the role of natural variability in future North American climate, Nat. Clim. Change, 2, 775–779, https://doi.org/10.1038/nclimate1562, 2012. a, b
Deser, C., Lehner, F., Rodgers, K. B., Ault, T., Delworth, T. L., DiNezio, P. N., Fiore, A., Frankignoul, C., Fyfe, J. C., Horton, D. E., Kay, J. E., Knutti, R., Lovenduski, N. S., Marotzke, J., McKinnon, K. A., Minobe, S., Randerson, J., Screen, J. A., Simpson, I. R., and Ting, M.: Insights from Earth system model initial-condition large ensembles and future prospects, Nat. Clim. Change, 10, 277–286, https://doi.org/10.1038/s41558-020-0731-2, 2020. a, b, c, d, e
Di Giuseppe, F., Pappenberger, F., Wetterhall, F., Krzeminski, B., Camia, A., Libertá, G., and San Miguel, J.: The Potential Predictability of Fire Danger Provided by Numerical Weather Prediction, J. Appl. Meteorol. Clim., 55, 2469–2491, https://doi.org/10.1175/JAMC-D-15-0297.1, 2016. a, b, c, d, e, f
EFFIS: Fire Danger Forecast, Tech. rep., European Forest Fire Information System, https://effis.jrc.ec.europa.eu/about-effis/technical-background/fire-danger-forecast (last access: 21 December 2021), 2021. a, b
European Environment Agency: European Digital Elevation Model (EU-DEM), https://www.eea.europa.eu/en/datahub/datahubitem-view/d08852bc-7b5f-4835-a776-08362e2fbf4b?activeAccordion=735550 (last access: 1 February 2024), 2016. a
Fargeon, H., Pimont, F., Martin-StPaul, N., De Caceres, M., Ruffault, J., Barbero, R., and Dupuy, J.-L.: Projections of fire danger under climate change over France: where do the greatest uncertainties lie?, Clim. Change, 160, 479–493, https://doi.org/10.1007/s10584-019-02629-w, 2020. a, b, c, d, e, f, g, h, i, j, k, l, m, n
Felsche, E., Böhnisch, A., and Ludwig, R.: Inter-seasonal connection of typical European heatwave patterns to soil moisture, npj Clim.d Atmos. Sci., 6, 1–11, https://doi.org/10.1038/s41612-023-00330-5, 2023. a
Fischer, E. M., Beyerle, U., and Knutti, R.: Robust spatially aggregated projections of climate extremes, Nat. Clim. Change, 3, 1033–1038, https://doi.org/10.1038/nclimate2051, 2013. a
Fyfe, J. C., Derksen, C., Mudryk, L., Flato, G. M., Santer, B. D., Swart, N. C., Molotch, N. P., Zhang, X., Wan, H., Arora, V. K., Scinocca, J., and Jiao, Y.: Large near-term projected snowpack loss over the western United States, Nat. Commun., 8, 14996, https://doi.org/10.1038/ncomms14996, 2017. a, b, c, d, e
Giannaros, T. M., Papavasileiou, G., Lagouvardos, K., Kotroni, V., Dafis, S., Karagiannidis, A., and Dragozi, E.: Meteorological Analysis of the 2021 Extreme Wildfires in Greece: Lessons Learned and Implications for Early Warning of the Potential for Pyroconvection, Atmosphere, 13, 475, https://doi.org/10.3390/atmos13030475, 2022. a, b
Gillett, N. P., Cannon, A. J., Malinina, E., Schnorbus, M., Anslow, F., Sun, Q., Kirchmeier-Young, M., Zwiers, F., Seiler, C., Zhang, X., Flato, G., Wan, H., Li, G., and Castellan, A.: Human influence on the 2021 British Columbia floods, Weather Climate Extremes, 36, 100441, https://doi.org/10.1016/j.wace.2022.100441, 2022. a
Hawkins, E.: Warming Stripes, Tech. rep., https://www.climate-lab-book.ac.uk/2018/warming-stripes/ (last access: 1 February 2024), 2018. a
Hawkins, E. and Sutton, R.: The Potential to Narrow Uncertainty in Regional Climate Predictions, B. Am. Meteorol. Soc., 90, 1095–1108, https://doi.org/10.1175/2009BAMS2607.1, 2009. a
Hoffman, K. M., Christianson, A. C., Gray, R. W., and Daniels, L.: Western Canada's new wildfire reality needs a new approach to fire management, Environ. Res. Lett., 17, 061001, https://doi.org/10.1088/1748-9326/ac7345, 2022. a, b
IPCC: Summary for Policymakers. In: Climate Change 2021: The Physical Science Basis. Contribution of Working Group I to the Sixth Assessment Report of the Intergovernmental Panel on Climate Change, Cambridge University Press, Cambridge, United Kingdom and New York, USA, https://doi.org/doi:10.1017/9781009157896.001, 2021. a, b
Kirchmeier-Young, M. C., Zwiers, F. W., Gillett, N. P., and Cannon, A. J.: Attributing extreme fire risk in Western Canada to human emissions, Climatic Change, 144, 365–379, https://doi.org/10.1007/s10584-017-2030-0, 2017. a
Landesamt für Umwelt: Naturräumliche Gliederung Bayerns – LfU Bayern, https://www.lfu.bayern.de/natur/naturraeume/index.htm (last access: 1 February 2024), 2023. a, b
Leduc, M., Mailhot, A., Frigon, A., Martel, J.-L., Ludwig, R., Brietzke, G. B., Giguère, M., Brissette, F., Turcotte, R., Braun, M., and Scinocca, J.: The ClimEx Project: A 50-Member Ensemble of Climate Change Projections at 12-km Resolution over Europe and Northeastern North America with the Canadian Regional Climate Model (CRCM5), J. Appl. Meteorol. Clim., 58, 663–693, https://doi.org/10.1175/JAMC-D-18-0021.1, 2019. a, b, c, d, e
Martynov, A., Laprise, R., Sushama, L., Winger, K., Šeparović, L., and Dugas, B.: Reanalysis-driven climate simulation over CORDEX North America domain using the Canadian Regional Climate Model, version 5: model performance evaluation, Clim. Dynam., 41, 2973–3005, https://doi.org/10.1007/s00382-013-1778-9, 2013. a
McArthur, A. G.: Fire behaviour in eucalypt forests. Forestry and Timber Bureau Leaflet 107, https://vgls.sdp.sirsidynix.net.au/client/search/asset/1299701/0 (last access: 5 February 2024), 1967. a
Miller, J., Böhnisch, A., Brunner, M., and Ludwig, R.: Fire Weather Index for Hydrological Bavaria from 1980–2099 derived from the 50 member CRCM5-LE, EnviDat [data set], https://doi.org/10.16904/envidat.466, 2023. a
Mittermeier, M., Braun, M., Hofstätter, M., Wang, Y., and Ludwig, R.: Detecting Climate Change Effects on Vb Cyclones in a 50-Member Single-Model Ensemble Using Machine Learning, Geophys. Res. Lett.s, 46, 14653–14661, https://doi.org/10.1029/2019GL084969, 2019. a, b
Mpelasoka, F. S. and Chiew, F. H. S.: Influence of Rainfall Scenario Construction Methods on Runoff Projections, J. Hydrometeorol., 10, 1168–1183, https://doi.org/10.1175/2009JHM1045.1, 2009. a, b
Pausas, J. G. and Paula, S.: Fuel shapes the fire–climate relationship: evidence from Mediterranean ecosystems, Global Ecol. Biogeogr., 21, 1074–1082, https://doi.org/10.1111/j.1466-8238.2012.00769.x, 2012. a
Piani, C., Haerter, J. O., and Coppola, E.: Statistical bias correction for daily precipitation in regional climate models over Europe, Theor. Appl. Climatol., 99, 187–192, https://doi.org/10.1007/s00704-009-0134-9, 2010. a
Poschlod, B., Willkofer, F., and Ludwig, R.: Impact of Climate Change on the Hydrological Regimes in Bavaria, Water, 12, 1599, https://doi.org/10.3390/w12061599, 2020. a, b, c
Ruffault, J., Moron, V., Trigo, R. M., and Curt, T.: Daily synoptic conditions associated with large fire occurrence in Mediterranean France: evidence for a wind-driven fire regime, Int. J. Climatol., 37, 524–533, https://doi.org/10.1002/joc.4680, 2017. a
Ruffault, J., Curt, T., Moron, V., Trigo, R. M., Mouillot, F., Koutsias, N., Pimont, F., Martin-StPaul, N., Barbero, R., Dupuy, J.-L., Russo, A., and Belhadj-Khedher, C.: Increased likelihood of head-induced large wildfires in the Mediterrranean, Sci. Rep., 10, 13790, https://doi.org/10.1038/s41598-020-70069-z, 2020. a, b, c, d
San-Miguel-Ayanz, J., Costa, H., de Rigo, D., Libertà, G., Vivancos, T. A., Tracy Durrant, D. N., Löffler, P., and Moore, P.: Basic criteria to assess wildfire risk at the Pan-European level, Tech. rep., https://ec.europa.eu/jrc/en/publication/basic-criteria-assess-wildfire-risk-pan-european-level (last access: 12 December 2021), 2018. a
Separović, L., Alexandru, A., Laprise, R., Martynov, A., Sushama, L., Winger, K., Tete, K., and Valin, M.: Present climate and climate change over North America as simulated by the fifth-generation Canadian regional climate model, Clim. Dynam., 41, 3167–3201, https://doi.org/10.1007/s00382-013-1737-5, 2013. a
Touma, D., Stevenson, S., Lehner, F., and Coats, S.: Human-driven greenhouse gas and aerosol emissions cause distinct regional impacts on extreme fire weather, Nat. Commun., 12, 212, https://doi.org/10.1038/s41467-020-20570-w, 2021. a, b, c, d, e
Turco, M., Rosa-Cánovas, J. J., Bedia, J., Jerez, S., Montávez, J. P., Llasat, M. C., and Provenzale, A.: Exacerbated fires in Mediterranean Europe due to anthropogenic warming projected with non-stationary climate-fire models, Nat. Commun., 9, 3821, https://doi.org/10.1038/s41467-018-06358-z, 2018. a
van Wagner, C. E.: Development and structure of the Canadian Forest Fire Weather Index System, Tech. rep., https://cfs.nrcan.gc.ca/publications?id=19927 (last access: 1 February 2024), 1987. a, b, c, d, e, f, g, h
Virtanen, P., Gommers, R., Oliphant, T. E., Haberland, M., Reddy, T., Cournapeau, D., Burovski, E., Peterson, P., Weckesser, W., Bright, J., van der Walt, S. J., Brett, M., Wilson, J., Millman, K. J., Mayorov, N., Nelson, A. R. J., Jones, E., Kern, R., Larson, E., Carey, C. J., Polat, İ., Feng, Y., Moore, E. W., VanderPlas, J., Laxalde, D., Perktold, J., Cimrman, R., Henriksen, I., Quintero, E. A., Harris, C. R., Archibald, A. M., Ribeiro, A. H., Pedregosa, F., van Mulbregt, P., and SciPy 1.0 Contributors: SciPy 1.0: Fundamental Algorithms for Scientific Computing in Python, Nat. Meth., 17, 261–272, https://doi.org/10.1038/s41592-019-0686-2, 2020. a
Vitolo, C., Di Giuseppe, F., Krzeminski, B., and San-Miguel-Ayanz, J.: A 1980-2018 global fire danger re-analysis dataset for the Canadian Fire Weather Indices, Sci. Data, 6, 190032, https://doi.org/10.1038/sdata.2019.32, 2019. a, b
Vitolo, C., Di Giuseppe, F., Barnard, C., Coughlan, R., San-Miguel-Ayanz, J., Libertá, G., and Krzeminski, B.: ERA5-based global meteorological wildfire danger maps, Sci. Data, 7, 216, https://doi.org/10.1038/s41597-020-0554-z, 2020. a, b, c, d
von Trentini, F., Leduc, M., and Ludwig, R.: Assessing natural variability in RCM signals: comparison of a multi model EURO-CORDEX ensemble with a 50-member single model large ensemble, Clim. Dynam., 53, 1963–1979, https://doi.org/10.1007/s00382-019-04755-8, 2019. a, b, c
von Trentini, F., Aalbers, E. E., Fischer, E. M., and Ludwig, R.: Comparing interannual variability in three regional single-model initial-condition large ensembles (SMILEs) over Europe, Earth Syst. Dynam., 11, 1013–1031, https://doi.org/10.5194/esd-11-1013-2020, 2020. a
Vrac, M.: Multivariate bias adjustment of high-dimensional climate simulations: the Rank Resampling for Distributions and Dependences (R2D2) bias correction, Hydrol. Earth Syst. Sci., 22, 3175–3196, https://doi.org/10.5194/hess-22-3175-2018, 2018. a
Wang, X., Wotton, B. M., Cantin, A. S., Parisien, M.-A., Anderson, K., Moore, B., and Flannigan, M. D.: cffdrs: an R package for the Canadian Forest Fire Danger Rating System, Ecol. Process., 6, 5, https://doi.org/10.1186/s13717-017-0070-z, 2017. a, b, c
Wastl, C., Schunk, C., Leuchner, M., Pezzatti, G. B., and Menzel, A.: Recent climate change: Long-term trends in meteorological forest fire danger in the Alps, Agr. Forest Meteorol., 162-163, 1–13, https://doi.org/10.1016/j.agrformet.2012.04.001, 2012. a, b
Willkofer, F., Wood, R. R., von Trentini, F., Weismüller, J., Poschlod, B., and Ludwig, R.: A Holistic Modelling Approach for the Estimation of Return Levels of Peak Flows in Bavaria, Water, 12, 2349, https://doi.org/10.3390/w12092349, 2020. a, b
Wood, R. R.: Role of mean and variability change in changes in European annual and seasonal extreme precipitation events, Earth Syst. Dynam., 14, 797–816, https://doi.org/10.5194/esd-14-797-2023, 2023. a, b, c
Wood, R. R. and Ludwig, R.: Analyzing Internal Variability and Forced Response of Subdaily and Daily Extreme Precipitation Over Europe, Geophys. Res. Lett. 47, e2020GL089300, https://doi.org/10.1029/2020GL089300, 2020. a
Wotton, B. M.: Interpreting and using outputs from the Canadian Forest Fire Danger Rating System in research applications, Environ. Ecol. Stat., 16, 107–131, https://doi.org/10.1007/s10651-007-0084-2, 2009. a
Yang, W., Gardelin, M., Olsson, J., and Bosshard, T.: Multi-variable bias correction: application of forest fire risk in present and future climate in Sweden, Nat. Hazards Earth Syst. Sci., 15, 2037–2057, https://doi.org/10.5194/nhess-15-2037-2015, 2015. a, b, c
Zscheischler, J., Fischer, E. M., and Lange, S.: The effect of univariate bias adjustment on multivariate hazard estimates, Earth Syst. Dynam., 10, 31–43, https://doi.org/10.5194/esd-10-31-2019, 2019. a