the Creative Commons Attribution 4.0 License.
the Creative Commons Attribution 4.0 License.
 | 05 Feb 2024
Current and future rainfall-driven flood risk from hurricanes in Puerto Rico under 1.5 and 2 °C climate change
Leanne Archer
Jeffrey Neal
Paul Bates
Emily Vosper
Dereka Carroll
Jeison Sosa
Daniel Mitchell
Flooding associated with Hurricane Maria in 2017 had devastating consequences for lives and livelihoods in Puerto Rico. Yet, an understanding of current and future flood risk on small islands like Puerto Rico is limited. Thus, efforts to build resilience to flooding associated with hurricanes remain constrained. Here, we take an event set of hurricane rainfall estimates from a synthetic hurricane rainfall simulator as the input to an event-based rainfall-driven flood inundation model using the hydrodynamic code LISFLOOD-FP. Validation of our model against high-water-mark data for Hurricane Maria demonstrates the suitability of this model for estimating flood hazard in Puerto Rico. We produce event-based flood hazard and population exposure estimates for the present day and the future under the 1.5 and 2 ∘C Paris Agreement goals. Population exposure to flooding from hurricane rainfall in Puerto Rico for the present-day climate is approximately 8 %–10 % of the current population for a 5-year return period, with an increase in population exposure to flooding by 2 %–15 % and 1 %–20 % under 1.5 and 2 ∘C futures (5-year return period). This research demonstrates the significance of the 1.5 ∘C Paris Agreement goal for Small Island Developing States, providing the first event-based estimates of flooding from hurricane rainfall under climate change for a small island.
- Article
(6399 KB) - Full-text XML
-
Supplement
(794 KB) - BibTeX
- EndNote


Climate change is amplifying the probability of high-intensity tropical cyclone events globally (Patricola and Wehner, 2018; Kossin et al., 2020; Mei and Xie, 2016; Knutson et al., 2020), compounding the rising social and economic costs associated with disasters due to increasing population and asset exposure (Jiménez Cisneros et al., 2014). The adoption of the Paris Agreement in 2015 aimed to limit global warming to well below 2 ∘C above pre-industrial levels and if possible to 1.5 ∘C (United Nations Framework Convention on Climate Change, 2015). Following this, numerous studies have investigated how these global temperature changes could impact societies, ecosystems, and places (IPCC, 2018; Mitchell et al., 2016). Under the Paris Agreement goal of 2 ∘C, there will likely be a higher proportion of tropical cyclones that become the most intense storms (i.e. Categories 4 and 5 hurricanes), with an increase in precipitation intensity (Knutson et al., 2020). Whilst flooding accounts for the largest proportion of loss of life and economic damages from tropical cyclones (Rappaport, 2014; Czajkowski et al., 2017), there is a lack of literature exploring how flooding might be affected by changes in tropical cyclone characteristics under climate change. This is particularly pertinent for Small Island Developing States where the difference between the 1.5 and 2 ∘C temperature goals may be critically important (Hoegh-Guldberg et al., 2018).
Small Island Developing States (SIDS) are a group of small island nations and territories with an acute risk of disasters and the impacts of climate change and were an instrumental force in the implementation of the 1.5 ∘C goal in the Paris Agreement (Ourbak and Magnan, 2018). Considering risk as a function of hazard, exposure, and vulnerability (United Nations Office for Disaster Risk Reduction, 2024), high hazard frequency, high exposure in relation to size, and underlying vulnerabilities drive the risk of hydrometeorological disasters and climate change in SIDS (Nurse et al., 2014; Mycoo et al., 2022). Climate change is likely to exacerbate current flood risk in SIDS (Joyette et al., 2014; Thomas et al., 2017) based on projected changes in tropical cyclone precipitation (Vosper et al., 2020), increased coastal storm surge heights (Knutson et al., 2020; Monioudi et al., 2018), and sea level rise (Storlazzi et al., 2018; Nicholls et al., 2018; Rasmussen et al., 2018). Yet, very little island-scale quantitative assessment of flood risk has been conducted in SIDS. This is largely due to the inadequacy of existing methods as well as insufficient data resolution and quality suitable for the scale of small island modelling (typically < 10 000 km2) (Thomas et al., 2019).
Recent work by Vosper et al. (2020) demonstrates that total rainfall associated with tropical cyclones (also known as hurricanes) in the Caribbean will increase under both the 1.5 and the 2 ∘C Paris Agreement goals in comparison to the present-day climate. They also estimate that a 100-year return period event similar to Hurricane Maria in Puerto Rico would be twice as likely to occur under the 2 ∘C scenario than under the 1.5 ∘C scenario (Vosper et al., 2020). Puerto Rico is an unincorporated territory of the US, located in the Greater Antilles islands of the Caribbean (see Fig. 1). The urgent need to understand both current and future flood risk was recently reinforced following Hurricane Maria in 2017, which made landfall as a high-end Category 4 hurricane, causing catastrophic wind and flood damage (Pasch et al., 2018). Hurricane Maria was the strongest hurricane to hit Puerto Rico since Hurricane San Felipe II in 1928, resulting in at least 2975 deaths (Audi et al., 2018). The estimated economic loss of USD 90 billion made it the third costliest disaster in US history (Pasch et al., 2018). Despite the underlying structural failures and inadequate emergency response that also contributed to the scale of the disaster in Puerto Rico (Towe et al., 2020; Rivera, 2020; Caban, 2019; Willison et al., 2019), the volume and intensity of the rainfall associated with Hurricane Maria were unprecedented and exacerbated the scale of the impact on communities on the island (Keellings and Hernández Ayala, 2019; Ramos-Scharrón and Arima, 2019). Historically, hurricane rainfall has been the key cause of flooding in Puerto Rico (Hernández Ayala et al., 2017; Smith et al., 2005). Consequently, it is pertinent that estimates of current and future rainfall-driven flood risk associated with these hurricane rainfall events are developed to assist disaster risk management in Puerto Rico. Yet, there are currently no complete estimates of flooding associated with Hurricane Maria or indeed for any other events in Puerto Rico. Dated Federal Emergency Management Agency (FEMA) flood zone maps do exist for larger river systems in Puerto Rico, but these do not include pluvial flooding, which is a key focus of this paper. They are therefore likely to provide a considerable underestimate of risk (Wing et al., 2017).
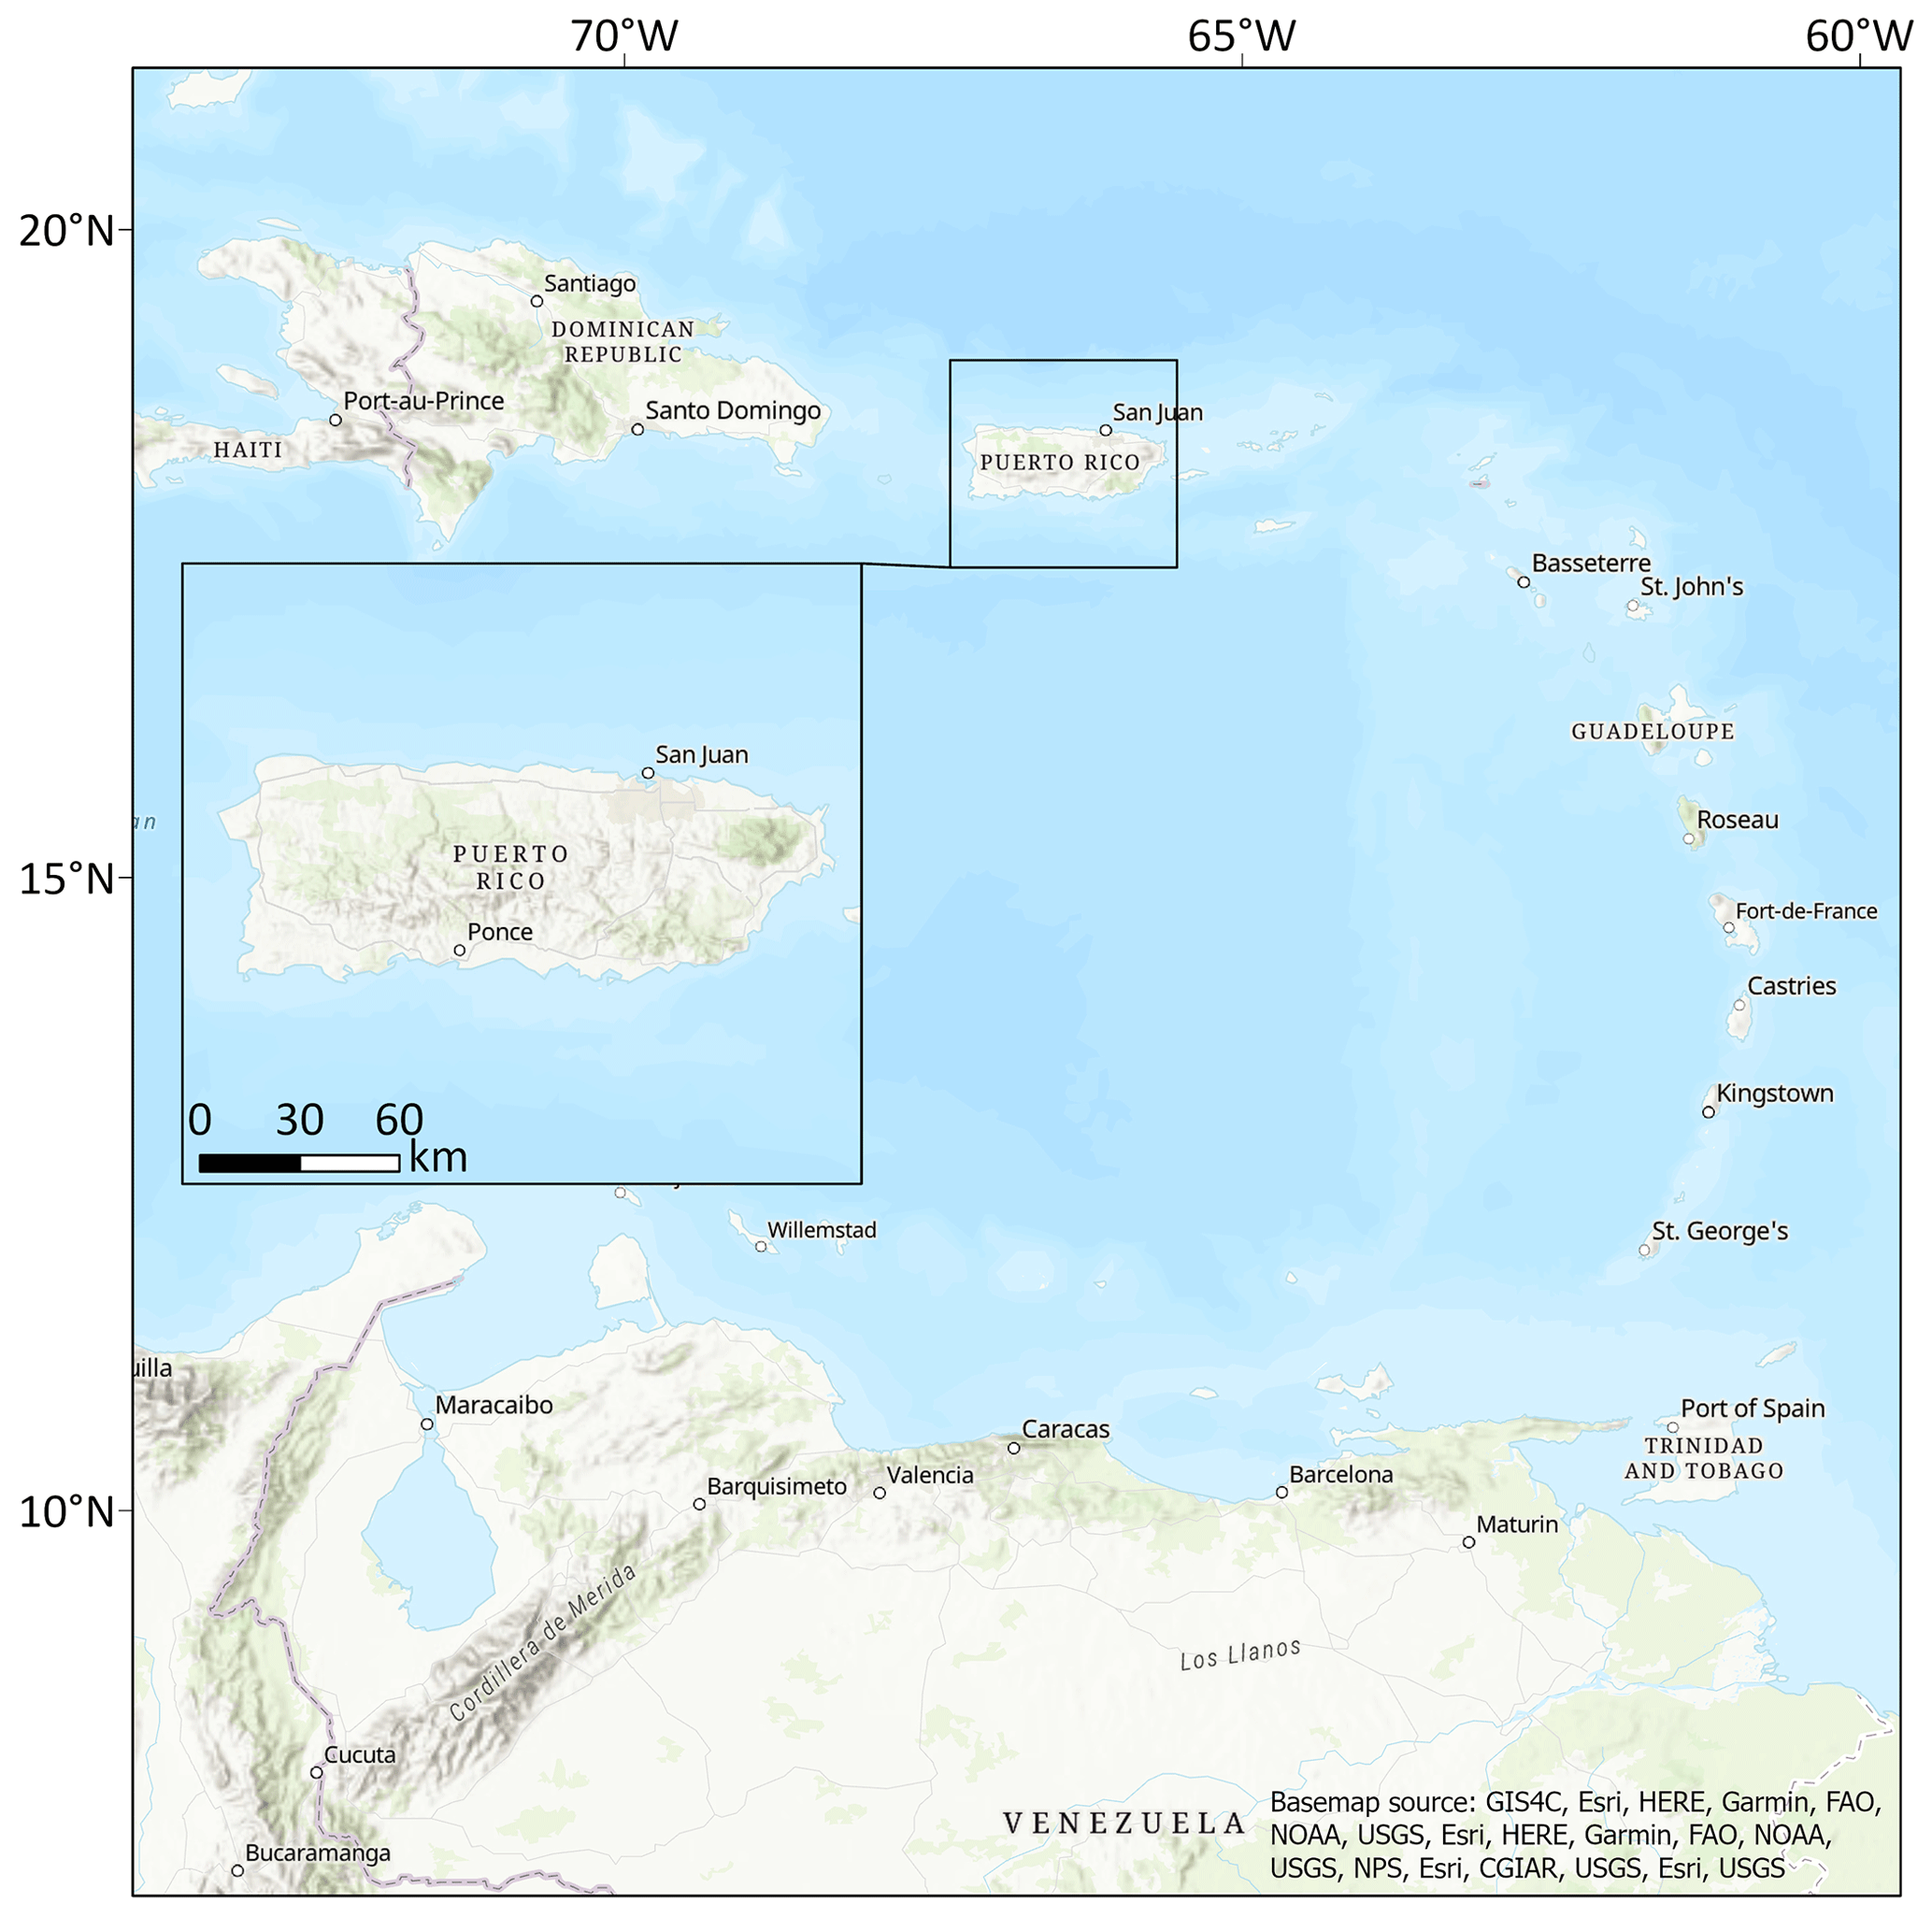
Figure 1Map showing the island of Puerto Rico within the Caribbean region.
Tropical cyclones can generate pluvial, fluvial, and coastal floods, all of which interact. Of these, pluvial flooding is a comparatively lesser modelled phenomenon (Blanc et al., 2012; Rözer et al., 2019; Tanaka et al., 2020). Pluvial flooding is defined here as “flooding resulting from rainfall-generated overland flow and ponding before the runoff enters any watercourse or drainage system, or cannot enter it because the network is full to capacity” (Falconer et al., 2009, p. 199). There has been a historical split between the modelling and assessment of pluvial and fluvial – or river – flooding. However, in reality both of these inland flood types are in a continuum, and both are driven by rainfall. Thus, the distinction between the two is unhelpful in many cases. This is particularly true for small islands where much of the inland flooding is primarily driven by heavy rainfall (Jetten, 2016; Burgess et al., 2015). Pluvial flooding is also a contested term, with some defining it as including small river channels (Wing et al., 2018) and others defining it as completely independent of rivers (Rosenzweig et al., 2018; Hankin et al., 2008). The rain-on-grid approach documented here therefore overcomes this pluvial–fluvial distinction by explicitly modelling both flood types and their interactions. Here we define the flooding modelled in this approach as “rainfall-driven flooding”.
Rainfall-driven flood events can often occur with a high frequency but low magnitude. This can lead to a significant cumulative impact on a community's resilience over time, which can undermine efforts to reach the UN's Sustainable Development Goals (Moftakhari et al., 2017; Hamdan, 2015; United Nations Office for Disaster Risk Reduction, 2019). However, most studies investigating flooding under climate change focus on changes in the 100-year flood extent because this is often used as a design standard (Hirabayashi et al., 2013; Arnell and Gosling, 2016; Lehner et al., 2006). This means a gap remains with respect to understanding how smaller, more frequent events might vary under climate change, which is crucially important for improving resilience-building and climate change adaptation needed in local communities (Moftakhari et al., 2017). This paper aims to address this gap by investigating how changing hurricane rainfall characteristics influence rainfall-driven flood risk estimates in the Small Island Developing State of Puerto Rico, with an emphasis on understanding changes in lower-magnitude, higher-frequency events (< 30-year return period).
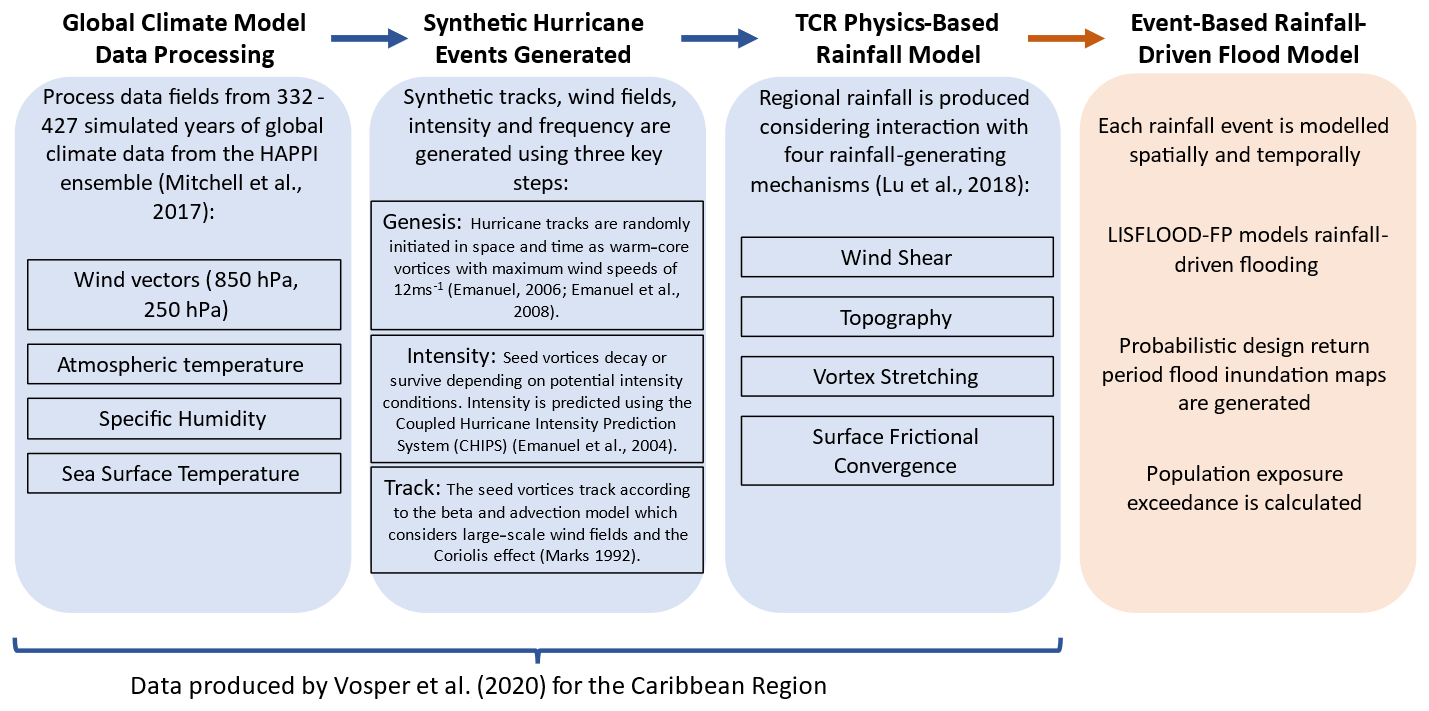
Figure 2Diagram outlining the modelling steps involved in simulating the synthetic hurricane rainfall event set and its application in the event-based rainfall-driven flood model.
Currently, the predominant method for understanding changes in flooding on small islands under climate change uses changes in precipitation as a proxy for changes in flood hazard, leading to uncertainty in flood hazard changes under climate change (Seneviratne et al., 2021; Ranasinghe et al., 2021). Examples of pluvial hydraulic flood modelling on small islands have previously relied on spatially uniform rainfall estimates derived from historical data for a set of design return period events (World Bank, 2015; Pratomo et al., 2016; Lumbroso et al., 2011). This approach takes a set of rainfall intensity estimates for a given duration and return period, often derived from an intensity–duration–frequency (IDF) curve, using historical rainfall data. Rainfall is typically applied uniformly across a model domain to produce design event flood extents (World Bank, 2015). Yet, this approach does not necessarily represent flooding at a particular return period, as a flood is a signature of the rainfall, the topography, and the topology of a catchment (Guerreiro et al., 2017; Skougaard Kaspersen et al., 2017). More recently, studies have highlighted the importance of representing rainfall spatially and temporally for a more realistic representation of flooding (Aldridge et al., 2020; Bernet et al., 2019; Guerreiro et al., 2017; Schaller et al., 2020). One way of incorporating these features is through an “event set approach”, which involves utilizing an event set of synthetic rainfall events (Nuswantoro et al., 2016; Tanaka et al., 2020). Nonetheless, data such as these are still limited or non-existent – particularly for small islands – and thus the aforementioned traditional approach has, until now, been the only way to represent flood hazards for small islands. Climate change is often assessed by applying an uplift factor to account for changes in rainfall associated with climate change projections (Sayers et al., 2020). However, this approach also fails to account for non-stationary effects of climate change on flooding, including changes to the different spatial and temporal characteristics of rainfall that are important for flood generation (Rosenzweig et al., 2018).
This paper details the first example of an event-based assessment of flood hazard on a small island under current and future climate change. We utilize a synthetic hurricane rainfall dataset (Vosper et al., 2020) as the input to an event-based rainfall-driven hydrodynamic flood model of Puerto Rico. We model rainfall-driven flood hazard and population exposure at the island scale in Puerto Rico (9100 km2), at 20 m resolution under present-day as well as 1.5 and 2 ∘C climate change. As part of this work, we also include novel methodological developments, including the representation of rainfall and river channels in the model. The model is validated against flood hazard simulations using two estimates of Hurricane Maria-observed rainfall (Integrated Multi-satellitE Retrievals for GPM (IMERG) and NCEP Stage IV) and high-water-mark data collected from the event. To our knowledge, these are the first published estimates of rainfall-driven flooding from Hurricane Maria. This work thus demonstrates a step change in the capacity to estimate flood hazard on a small island, superseding the information available using the traditional approaches. Within this, two key questions are investigated:
-
What is the current rainfall-driven flood hazard and population exposure associated with hurricanes in Puerto Rico?
-
How does population exposure to flooding change from the present day to 1.5 and 2 ∘C climate change scenarios?
To address these questions, we first describe the application of the hurricane rainfall event set in Sect. 2.1. We explain how the event-based model was set up (Sect. 2.2), including the novel methodological applications of spatially varying rainfall in the hydrodynamic model (Sect. 2.2.1) and the parameterization of river channel bathymetry using the input rainfall event set climatology (Sect. 2.2.2). In Sect. 2.3, we describe the combination of population estimates with the flood hazard data to derive population exposure estimates under present-day as well as 1.5 and 2 ∘C climate change scenarios. The method for validating the model is described in Sect. 2.4.
2.1 Hurricane rainfall data
The synthetic hurricane rainfall event set was developed to estimate hurricane rainfall in the Caribbean under present-day (2005–2016) as well as 1.5 and 2 ∘C equilibrated climate change, using a physics-based tropical cyclone rainfall model (Vosper et al., 2020) – see Fig. 2. The model produces spatial (10 km resolution) and temporal (2-hourly) rainfall estimates along a synthetic hurricane track, considering four key rainfall-generating mechanisms: wind shear, topography, vortex stretching, and surface frictional convergence. Inputs to the tropical cyclone rainfall model were atmospheric temperature, specific humidity, sea surface temperature, and wind vectors, which are typically taken from global climate models (GCMs) or reanalysis products. This model has been validated against gauge-based and radar observations in several studies in the US – including in Puerto Rico – showing good agreement (Feldmann et al., 2019; Lu et al., 2018; Zhu et al., 2013).
Table 1Table outlining the resolution of the global climate models used to drive the synthetic hurricane rainfall model from the HAPPI climate ensemble.
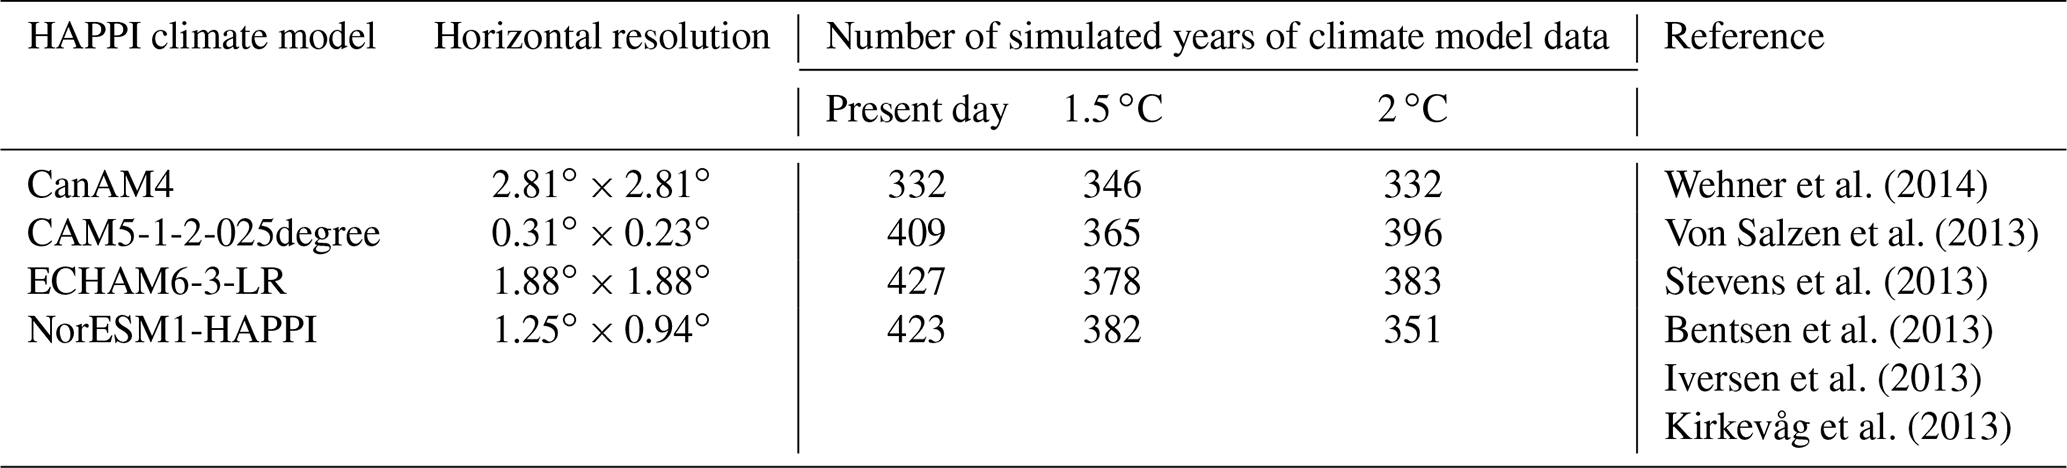
To provide driving climate model data to the synthetic hurricane rainfall events under current as well as 1.5 and 2 ∘C climate change, four climate models from the Half a degree Additional warming, Prognosis and Projected Impacts (HAPPI) ensemble were utilized (CanAM4, CAM5-1-2-025degree, NorESM1-HAPPI, ECHAM6-3-LR; Mitchell et al., 2017) – see Table 1. Representative Concentration Pathway (RCP) 2.6 was used for model boundary conditions at 1.5 ∘C, using a weighted combination of RCP2.6 and RCP4.5 at 2 ∘C. These were selected based on the availability of variables at the required atmospheric levels with at least daily temporal resolution for input into the hurricane rainfall model, which are described in Fig. 2. HAPPI was developed to document climate change impacts under 1.5 and 2 ∘C climate change above pre-industrial levels and has been a key source of climate data for such studies, including the IPCC Special Report on 1.5 ∘C (IPCC, 2018).
The hurricane rainfall event set consists of 59 000 events, with each climate model scenario equivalent to between 332–427 simulated years of data depending on the climate model (Vosper et al., 2020). A total of 59 000 events were generated, corresponding to approximately 5000 events per climate model and climate scenario. For each climate model, the number of simulated years was calculated as the sum of the number of simulated events per year divided by the simulated annual frequency of events in the climate model data (see Table 1). The simulated time period for the present day is 2005–2016, representing a global average temperature of around 0.9 ∘C higher than a pre-industrial climate. The 1.5 and 2 ∘C time periods are for 2106–2115. This future time period was selected in the HAPPI climate ensemble as the future time slice, chosen to represent a 1.5 and 2 ∘C world at around 2100 (which was the generally accepted time period for these temperature scenarios in the IPCC Special Report on 1.5 ∘C; IPCC, 2018), whilst also providing 100 years of simulated GCM data following the present-day time slice (2006–2015) (Mitchell et al., 2017). Each synthetic hurricane rainfall event was simulated at a 2 h time step and 10 km spatial resolution before being employed as the input to the event-based rainfall-driven flood model.
2.2 Event-based rainfall-driven flood model
LISFLOOD-FP is the hydraulic engine used to simulate channel and floodplain flow in two dimensions in our rainfall-driven hydrodynamic model (Bates et al., 2010; LISFLOOD-FP Developers, 2020). Rainfall is the key input to the model, and water flow is routed in one of two ways. Firstly, very shallow (< 1 cm) overland flows are routed using a constant-velocity rain-on-grid routing scheme (Sampson et al., 2013). Rain falls directly onto the cells and is routed through the model using a slope-dependent fixed-velocity algorithm. Secondly, flow above 1 cm deep (i.e. the majority) is routed hydraulically using the inertial form of the shallow-water equations (Bates et al., 2010), with river and drainage channels represented using a subgrid approach (Neal et al., 2012). Typical channel (0.035) and floodplain (0.040) Manning's coefficient friction values were applied. As Puerto Rico is an island, all downstream boundaries are the ocean. The downstream boundary conditions in the model are set to sea level, and this could be used in future work to simulate sea level rise and storm surge.
As digital elevation data are the most important input to a hydrodynamic model (Hawker et al., 2018), lidar data were used as the digital elevation model (DEM). Lidar coverage for Puerto Rico is almost complete (> 99 %) (United States Geological Survey, 2017) and was resampled from its native 1 m resolution to 20 m, reprojected to WGS84 and hydrologically conditioned using the priority-flood method (Zhou et al., 2016). The ∼ 55 km2 of Puerto Rico not covered by lidar was patched with the globally available MERIT DEM (Yamazaki et al., 2017). This area is mountainous and sparsely populated, meaning the use of MERIT here does not affect the exposure results.
Whilst high-resolution DEMs are important for simulating floods, halving the model grid resolution leads to an increase in simulation time by an order of magnitude (Savage et al., 2016). For example, run on a 2 × 2.6 GHz 8-core Intel E5-2670, one example model in this event set for the 9100 km2 domain, covering the entire island of Puerto Rico, takes 3 min to run at 90 m, 77 min at 20 m, approximately 770 min (12.8 h) at 10 m, and 7700 min (5.3 d) at 1 m resolution. As a result, and given the fact that we had thousands of events to simulate, the event set was run at 20 m. This resolution balances the need for high-resolution flood hazard outputs with the computational costs associated with employing a high-resolution event-based model at the island scale and also reflects state-of-the-art model resolutions used in other locations, such as the UK (Bates et al., 2023). Our study is the first known study to employ an event set approach at such a high hydrodynamic model resolution over such a large domain.
Infiltration was not included in this model approach for several reasons. As hurricanes take place during the hurricane season (North Atlantic: June–November), soils in Puerto Rico are often saturated, meaning infiltration is low (Smith et al., 2005). Many pluvial modelling studies do not include infiltration, as the appropriate parameter values are highly uncertain and vary widely across space and time (Bernet et al., 2018; Guerreiro et al., 2017; Hall, 2015). Although antecedent conditions are expected to vary, the infiltration is likely to be of lower importance relative to other factors, since infiltration will be minimal under extreme rainfall events – such as those associated with hurricanes (Wehner and Sampson, 2021).
To improve the representation of islands and hurricane rainfall in the model, two novel model developments were incorporated into the model set-up.
2.2.1 Spatially varying rainfall
Spatiotemporal representation of rainfall is important for accurate simulation of pluvial flood events (Blanc et al., 2012). Previous pluvial models using LISFLOOD-FP covered only small domains and relied on time-varying but spatially constant rainfall input (Sampson et al., 2013, 2015; Wing et al., 2019). This study demonstrates the first use of spatially and time-varying rainfall in a LISFLOOD-FP rainfall-driven hydrodynamic model, using a new routine to read spatiotemporal rainfall in NetCDF format. For each hurricane, a grid of rainfall at ∼ 10 km resolution across the island was input to the model domain at each time step (2-hourly), although the hydrodynamic model calculations are simulated with much shorter time steps (order of seconds). To model all 59 000 hurricane rainfall events would be computationally intractable and was not necessary considering many of the hurricane rainfall events produced no or very little rainfall. Thus, to select events to simulate in the model, all hurricane rainfall events above a threshold of 3.75 mm h−1 peak rainfall intensity were simulated – a total of 4909 events (8.3 % of the total). Within this, 1464 events were in the present day, 1801 events were at 1.5 ∘C, and 1644 events were at 2 ∘C. This threshold was selected as the minimum number of events necessary to calculate a robust estimate of the 2-year return period flood hazard, which is used as the lowest modelled return period event in the event set. Events below this threshold were not considered significant enough in terms of rainfall to run. An additional 8 h of simulation time was added to the end of each simulation based on our inspection of the time it took for the rainfall to move through the model and reach either the ocean or the lowest points of the DEM. These decisions were based on trial and error and inspection of the rainfall and resulting flood hazard events.
2.2.2 River channels
Including river channels in flood models is necessary to produce accurate estimates of flood hazard (Hall, 2015; Neal et al., 2021), but most pluvial flood models do not explicitly include river channels or drainage networks (Blanc et al., 2012). Here, a subgrid approach was used to represent river channels and drainage networks in the rainfall-driven modelling framework (Neal et al., 2012). Rivers and drainage channels were represented using the US National Hydrography Dataset v2.1 (Simley and Carswell Jr, 2010). River widths in Puerto Rico are inadequately represented in global hydrographic datasets such as MERIT Hydro (Yamazaki et al., 2019), as most channels are smaller than the resolution of the DEM data used to create such products (e.g. MERIT at 90 m in the case of MERIT Hydro). As a result, width was estimated using a power law regression with upstream-accumulated area (Leopold and Maddock, 1953). Widths used here were sampled using satellite imagery along the 13 main rivers across the island. The upstream-accumulated area was calculated using the lidar DEM at 20 m resolution by first generating a flow direction map and then using the RichDEM algorithm outlined in Barnes (2017).
River depth estimates are also unavailable for Puerto Rico, as is typical for most locations globally (Sampson et al., 2015). To parametrize the river channel depths, the present-day synthetic hurricane rainfall events for each climate model (total: 1464) were first simulated through a model with arbitrarily deep river channels (−10 m) to get estimates of the channel water depth for each event. Using these, the water depth at a given return period was calculated empirically. Information on flood defences was also not available, so in this study we parametrize bankfull river depth by calculating the bed elevation to ensure that each channel conveyed the present-day 1-in-2-year discharge (Pickup and Warner, 1976; Williams, 1978; Wolman and Miller, 1960) generated by the present-day hurricane ensemble and subtracted from the bank height derived from the DEM to get a calibrated estimate of the channel depth value. Inevitably this means that in locations where rivers do have defences, the model is likely to overpredict flood hazard. If defence standard information was to become available, it would be a simple matter to retrospectively apply these to the output flood hazard layers.
2.3 Population exposure estimates
Population exposure was calculated for each flood event as the total number of people exposed to flood depths above 10 cm. The WorldPop 90 m top-down constrained population dataset (2020) was used to estimate the number of people per 90 m grid cell (Tatem, 2017; Bondarenko et al., 2020). WorldPop was chosen because total population estimates are adjusted to 2020 UN population estimates, meaning out-migration trends following Hurricane Maria in 2017 are accounted for. The WorldPop data were downscaled from 90 m to 20 m to match the flood hazard data, using nearest-neighbour resampling and assignment to 20 m cells based on a proportional cell method, following Lloyd et al. (2017). WorldPop has been extensively validated and compared to other datasets (Reed et al., 2018; Leyk et al., 2019; Tuholske et al., 2021), including for flood exposure applications (Mazzoleni et al., 2020; Smith et al., 2019). Smith et al. (2019) found that WorldPop produces larger exposure estimates in comparison to the High Resolution Settlement Layer (HRSL) (Tiecke et al., 2017), likely due to a combination of coarser resolution and assignment of populations to buildings. Recently, Tuholske et al. (2021) identified the importance of conducting a sensitivity assessment of gridded population products to capture the inherent uncertainties in the use of gridded population estimates. However, HRSL, high-resolution population density maps (HRPDMs) (Bonafilia, 2019), and WorldPop are likely to give different estimates in our case, not least due to the different dates of the datasets before and after Hurricane Maria, where approximately 8 % (230 000) of the population is estimated to have emigrated following the event (Audi et al., 2018). Total population estimates for the main island using HRPDM and HRSL are 4.87 million and 3.66 million, which is considerably higher than the UN-adjusted WorldPop estimate of 2.70 million, resulting in higher population exposure values. The future population was not considered due to a lack of available high-resolution datasets (< 100 m grid size) estimating changes in the future population. For consistency, population exposure exceedance was calculated for each event using the same method as the hurricane rainfall as 1 divided by the annual exceedance probability (Emanuel and Jagger, 2010; Feldmann et al., 2019; Vosper et al., 2020).
2.4 Model validation
To determine the skill of our flood hazard estimation, we assessed the model performance using high-water-mark (HWM) data collected by USGS following Hurricane Maria (available at https://stn.wim.usgs.gov/FEV/{#}MariaSeptember2017, last access: 24 October 2023). For more information about the suitability assessment of the HWM data for validation, see Sect. S1 and Table S2 in the Supplement. See Fig. S1 in the Supplement for the HWM locations used in this study. Ideally it would be better to validate the event set with a lower-magnitude flood considering the focus of this work is primarily on low-magnitude, high-frequency events. However, there is no known validation data for small hurricane-rainfall-driven flood events in Puerto Rico. As a result, Hurricane Maria was chosen as the event to validate against, despite its high magnitude.
Firstly, to produce flood hazard estimates of Hurricane Maria for validating the model and event set, we ran the hydrodynamic model using two observational rainfall products (IMERG and NCEP Stage IV) that provide space- and time-varying estimates of Hurricane Maria rainfall through the flood inundation model. We use an identical hydrodynamic model set-up to the event set, only changing the input rainfall data. IMERG (NASA Global Precipitation Measurement Mission, 2023) was run at ∼ 10 km spatial resolution and in 30 min intervals, whilst NCEP Stage IV (NCEP/EMC 4KM Gridded Data (GRIB) Stage IV Data, 2023; Du, 2011) was run at ∼ 4 km spatial resolution, with an hourly temporal resolution. NCEP Stage IV was used instead of the higher-resolution Multi-Radar Multi-Sensor (MRMS) rainfall product as the landfall year of Hurricane Maria (2017) falls outside of the MRMS archive period (2020–onwards) (University of Oklahoma Cooperative Institute for Mesoscale Meteorological Studies et al., 2023).
We compare the flood hazard produced using IMERG and NCEP Stage IV to understand the uncertainty in flood hazard estimates using the different observation inputs.
IMERG has been widely compared to gauge-based rainfall data over many locations globally, demonstrating good performance in the estimation of total rainfall (Freitas et al., 2020; Pradhan et al., 2022), as well as good representation of temporal (Yu et al., 2021) and spatial event structures (Omranian et al., 2018; Rios Gaona et al., 2018; Pradhan et al., 2022). For example, Rios Gaona et al. (2017) show IMERG has a low relative bias over the Netherlands (−1.51 %), and Tan et al. (2017) report a correlation coefficient of 0.78 against radar and gauge-based observations in the US. IMERG has also been shown to perform well at capturing rainfall from tropical cyclones (Rios Gaona et al., 2018; Yu et al., 2021). For example, Omranian et al. (2018) found IMERG correctly predicted 62 % of rainfall from Hurricane Harvey. Nonetheless, some studies have identified a tendency for IMERG data to underpredict rainfall intensity during extreme rainfall events (Freitas et al., 2020; Mazza and Chen, 2023; Tian et al., 2018; Yu et al., 2021). For example, Yu et al. (2021) found that extreme precipitation rates from IMERG were 7.53 % lower than those of gauge data for Typhoon Lekima in 2019.
NCEP Stage IV is a ground-based gauge and radar observation product that is often used in multi-product comparison studies as the baseline observed dataset (Nelson et al., 2016). These studies have demonstrated that NCEP Stage IV produces good representation of overall rainfall rates across the US (Nelson et al., 2016; Prat and Nelson, 2015), as well as the spatial and temporal structures of rainfall (Habib et al., 2009), including for tropical cyclones (Gao et al., 2020; Villarini et al., 2011). Prat and Nelson (2015) compare annual rain rates for the conterminous US using NCEP Stage IV against gauge data, finding a correlation coefficient of 0.93 (R2). Gao et al. (2020) show that NCEP Stage IV only overestimated rainfall from Hurricane Harvey by 2 %. However, underestimation of extreme rainfall has been shown in some studies to be due to an increase in the number of missed events as the rain rate increases (Habib et al., 2009; Prat and Nelson, 2015). For example, Prat and Nelson (2015) report that NCEP Stage IV has a tendency to underestimate rainfall in comparison to surface observations across the conterminous US (−14 % to +1 %, depending on the location). This is likely a product of the inherent limitations of radar-based precipitation products (see Nelson et al., 2016).
The model used to produce the synthetic hurricane rainfall event set utilized in this study has previously been compared to NCEP Stage IV data over Puerto Rico, showing very good agreement (Feldmann et al., 2019). This demonstrates the suitability of the use of NCEP Stage IV as an observation dataset for comparison against in this study. Omranian et al. (2018) showed IMERG was able to represent 62 % of rainfall from Hurricane Harvey in comparison to NCEP Stage IV, thus suggesting that IMERG is also likely capable of adequately representing extreme rainfall associated with Hurricane Maria. However, the performance of IMERG and NCEP Stage IV data can be dependent on the number of gauge-based observations available (Tang et al., 2018; Tian et al., 2018). A total of 14 out of 24 USGS gauges were damaged during Hurricane Maria in Puerto Rico (Bessette-Kirton et al., 2020). As a result, this is a key limitation of using observed data products to estimate tropical cyclone rainfall that should be considered when drawing conclusions about the accuracy of flood hazard associated with these rainfall products.
Next, we compared the performance of the event set with the HWM data and the estimates from the observed rainfall products to sense check the model. Hurricane Maria-like events were identified across all model scenarios, first by the maximum total rainfall and then by the spatial characteristics of the hurricane track. Maximum total rainfall is defined as the highest total rainfall accumulation at a point on the island. This metric was used as opposed to mean total rainfall, as studies that have investigated Hurricane Maria rainfall describe the maximum total rainfall as the most significant anomaly in the historical record associated with the event (Ramos-Scharrón and Arima, 2019; Keellings and Hernández Ayala, 2019; Pokhrel et al., 2021). Maximum total rainfall is also the metric used to estimate the return period of Hurricane Maria rainfall: at least a 1-in-115-year rainfall event (Keellings and Hernández Ayala, 2019). Studies use different metrics to derive maximum total rainfall, including interpolation of rain gauge data and observation products such as NCEP Stage IV. This means that the maximum total rainfall for Hurricane Maria varies between studies, ranging between 733–1029 mm (Pasch et al., 2018; Keellings and Hernández Ayala, 2019; Ramos-Scharrón and Arima, 2019; Pokhrel et al., 2021). There is a limited number of events in our event set with a > 100-year return period magnitude maximum total rainfall (mean: 3.46 samples per climate model scenario) due to the comparatively short simulated time record of our event set (range: 332–427 years). However, Puerto Rico experiences on average one hurricane each year and has a mean annual rainfall of over 4000 mm in some locations (Hernández Ayala and Matyas, 2016). There are therefore many events in the event set with a total mean rainfall (total accumulated rainfall averaged across the island) in the range of Hurricane Maria (range: 375–380 mm; Pokhrel et al., 2021; Keellings and Hernández Ayala, 2019; Ramos-Scharrón and Arima, 2019). However, these events have widely varying spatial characteristics and associated flood hazard and are therefore not all Maria-like. Thus, it is also important to consider the spatial characteristics of the hurricane rainfall events so that events with similar rainfall and spatial characteristics to Hurricane Maria can be identified. Similarity to Hurricane Maria based on track location was assessed based on four criteria: (i) direct landfall on the main island; (ii) south-western trajectory; (iii) whether it makes landfall on the eastern portion of the main island; and (iv) a similar track trajectory across the island, whereby the event track and Hurricane Maria track intersect at at least one point on the island.
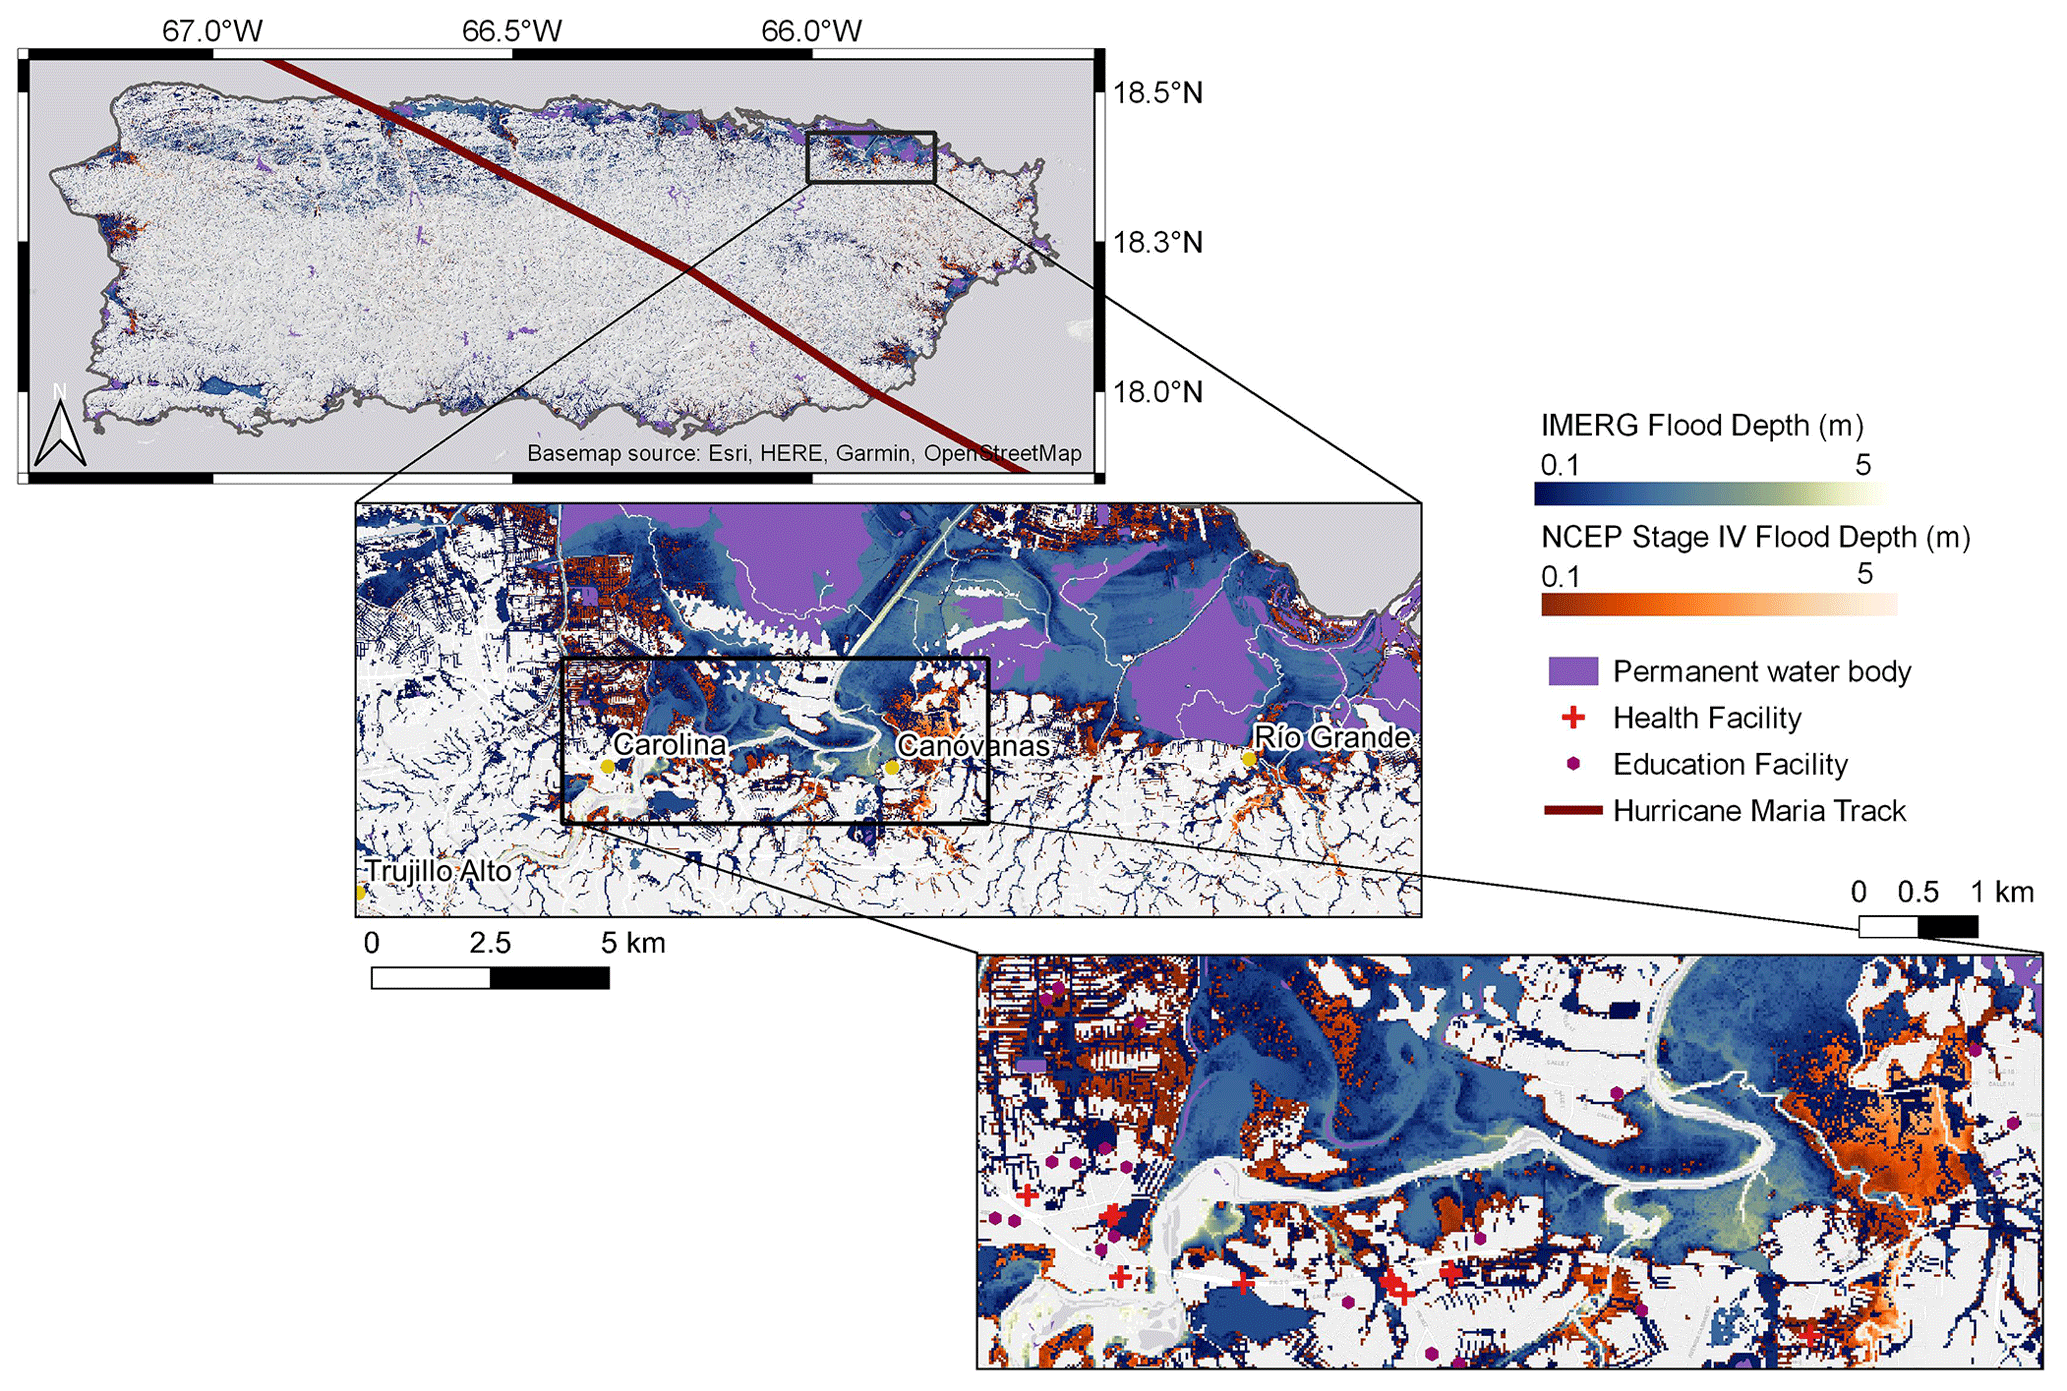
Figure 3Map showing the differences between flood hazard estimates of Hurricane Maria produced using IMERG and NCEP Stage IV precipitation data from the island to local scale.
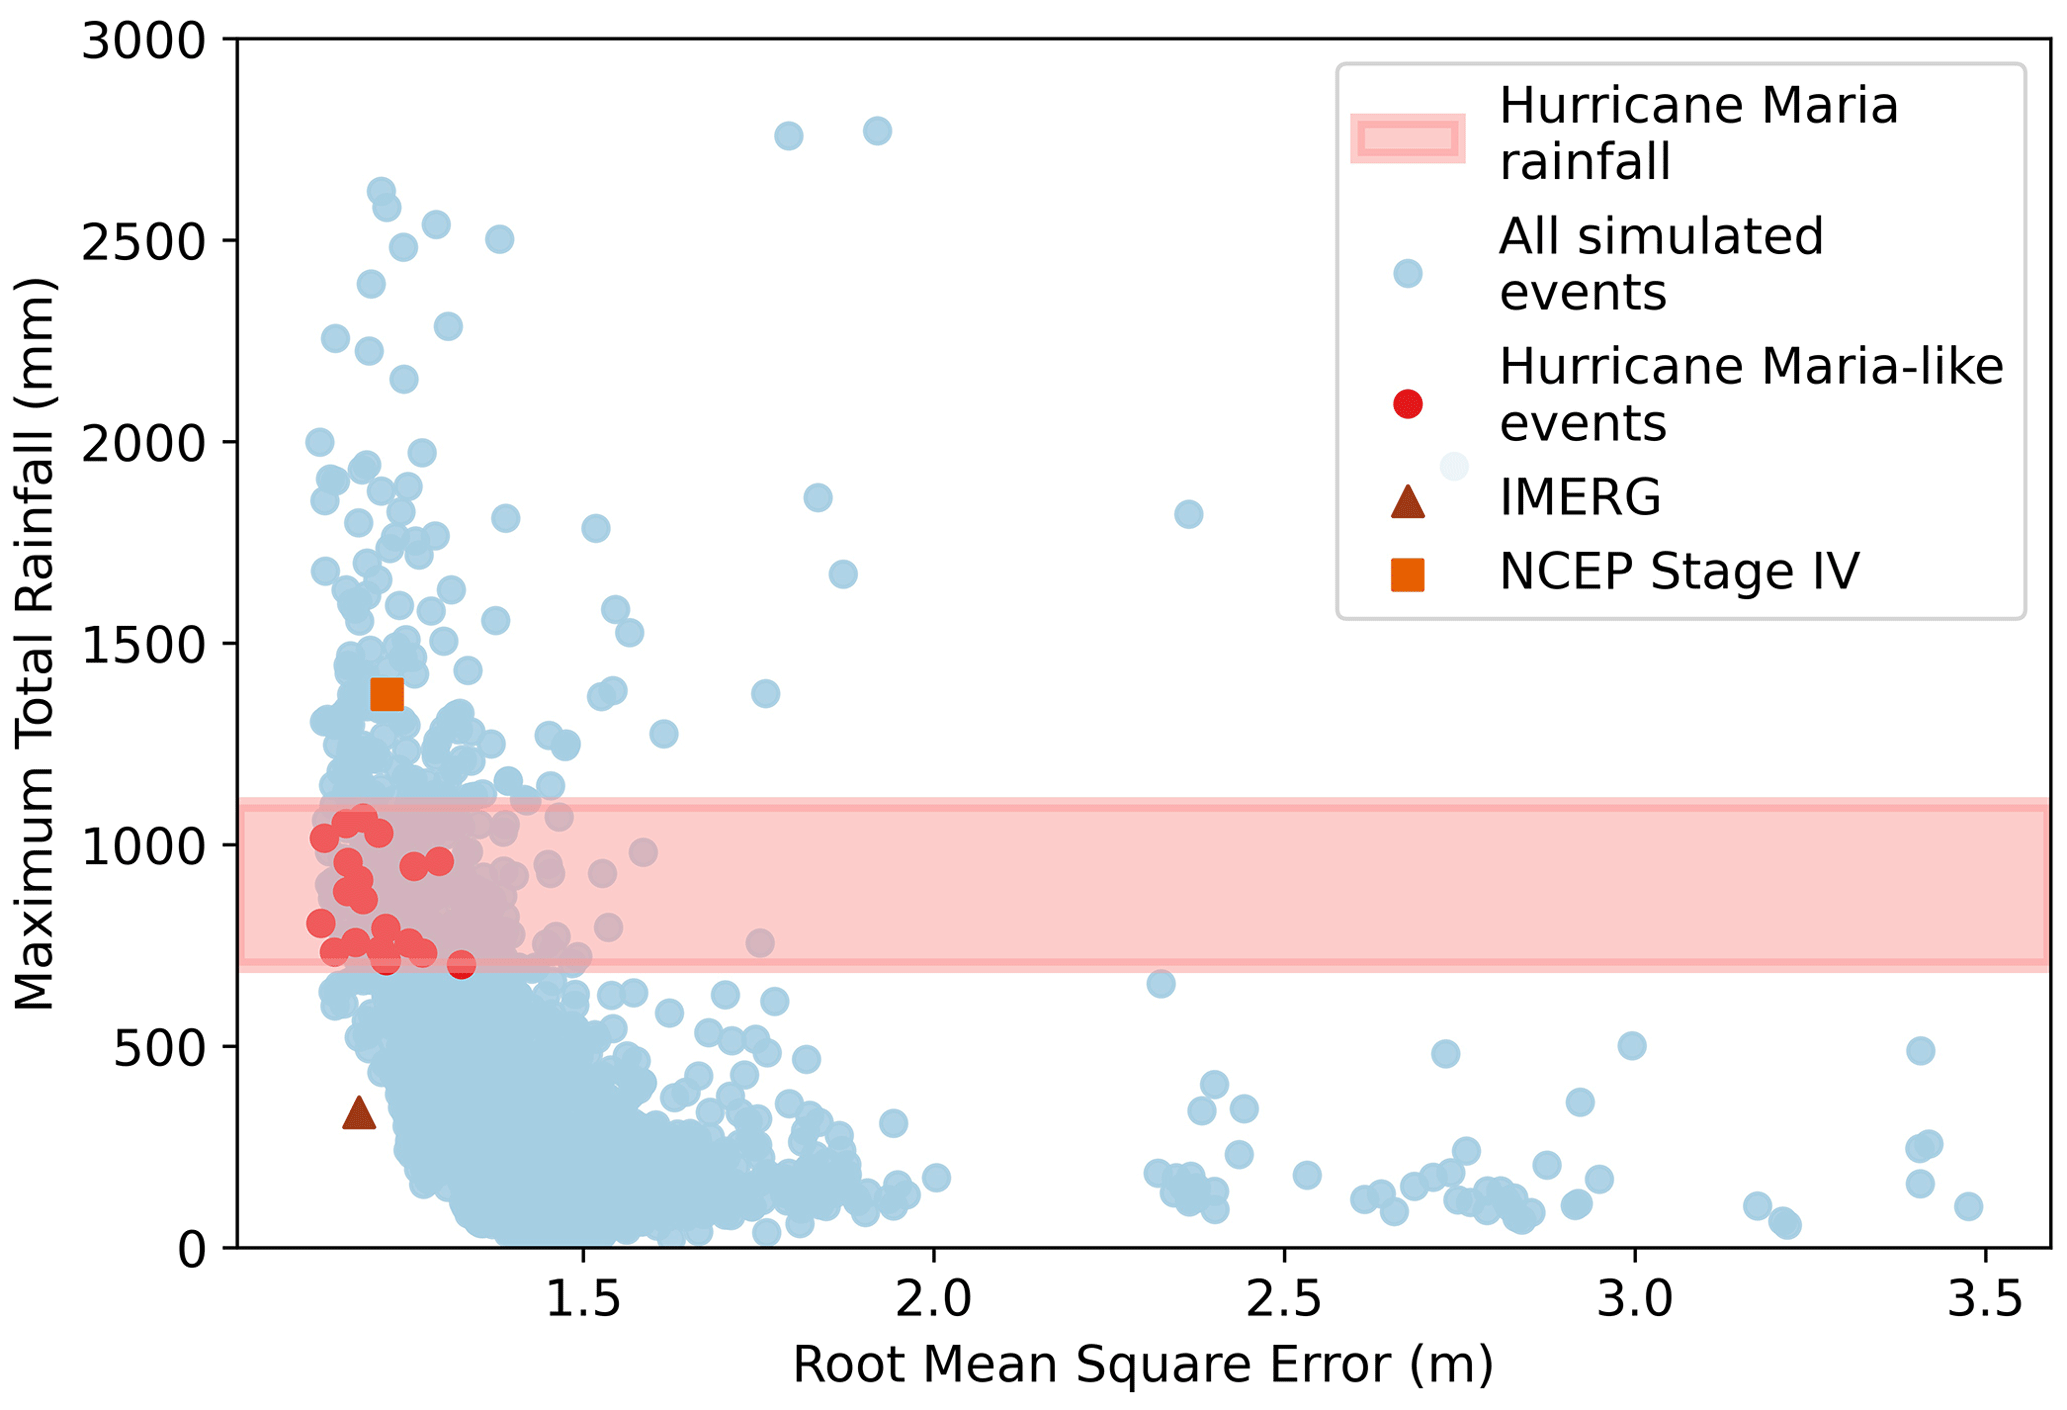
Figure 4Graph showing the relationship between the root mean square error (RMSE) and maximum total rainfall for all simulated events under all climate scenarios (4909 events in total). All simulated events are indicated in blue. Events identified with Hurricane Maria maximum rainfall totals and spatial characteristics (20 events) are shown in red. The range of reported Hurricane Maria rainfall is indicated with the red band. The orange square is the NCEP Stage IV model estimate, and the brown triangle is the IMERG model estimate.
3.1 Hurricane Maria model validation
Figure 3 shows the flood hazard estimates produced by simulating the IMERG and NCEP Stage IV rainfall products spatiotemporally through the flood inundation model from the island to local scale. The RMSE between the modelled flood hazard and the HWM is 1.18 m for IMERG and 1.22 m for NCEP Stage IV (see Fig. 4). This is comparable to post-event HWM validation done in other locations (Wing et al., 2021) (see Sect. 4.1 for a discussion of this). There is a significant difference in the flood extents produced using IMERG and NCEP Stage IV, with larger areas flooded using NCEP Stage IV than IMERG. This highlights the uncertainty in so-called “observed” flooding from Hurricane Maria.
In the event set, when the spatial characteristics of the hurricane rainfall events are considered in addition to the maximum total rainfall, events we select as Hurricane Maria-like events have some of the lowest RMSEs between the observed and modelled water surface elevations (range: 1.13–1.33 m), as demonstrated in Fig. 4. The track locations of these events are shown in Fig. S2. The relationship between maximum total rainfall and RMSE for all events is expected, whereby as the intensity of the event increases, the sensitivity to the flood depths decreases as the floodplain fills and thus becomes less responsive to additional increases in rainfall (Wing et al., 2021). However, there are events in the event set with both much higher and much lower rainfalls than Hurricane Maria that have RMSEs that are both similar to and very different from those of the Maria-like events. This demonstrates the importance of the spatial characteristics of the events beyond just the rainfall.
When comparing the flood estimates using IMERG and NCEP Stage IV against the high-water-mark data, the Maria-like events have similar RMSE scores (Fig. 4). However, both observational rainfall products have different maximum total rainfalls than those found in the literature. In particular, the IMERG maximum total rainfall is considerably lower. This is likely because satellite products such as IMERG often underestimate orographic rainfall such as that exhibited over Puerto Rico (Dinku et al., 2008).
3.2 Design return period flood hazard maps
The probability of inundation was calculated for each pixel in the model domain, calculating how many times each pixel would be inundated above a 10 cm depth in each climate model temperature scenario. The return period of inundation in each pixel was then determined by calculating how many times we expect a pixel to flood based on the number of years of data simulated (range: 332–427 years, depending on the climate model). Using this, we derived a set of return period flood hazard maps, which provide a spatially explicit representation of a given return period flood event under present-day as well as 1.5 and 2 ∘C warming. This supersedes any currently available hurricane-rainfall-driven flood risk information in Puerto Rico, both under current and future climate change. This approach also moves beyond the traditional uplift approach often used in flood risk assessment under climate change, as it provides spatially explicit flood hazard information for a given return period at the island scale and at high resolution.
Figure 5 highlights the scale and detail of flood hazard information using this approach, from the island scale (Fig. 5a) to the local scale (Fig. 5c). For example, Fig. 5c shows flooding at the street level in Levittown, Toa Baja – a town significantly impacted by flooding from Hurricane Maria in 2017 (National Weather Service, 2017).
Based on this example for a 20-year return period flood hazard event using the ECHAM6-3-LR climate model, several schools and hospitals would likely be impacted under present-day and 1.5 ∘C climate change. The estimated flooded area of the 20-year return period flood increases under 1.5 ∘C climate change in comparison to present-day climate change (2006–2015) (Fig. 5c), meaning areas currently not at risk are affected at 1.5 ∘C climate change. Changes at 2 ∘C are similar to 1.5 ∘C but are not shown in Fig. 5 for presentation purposes.
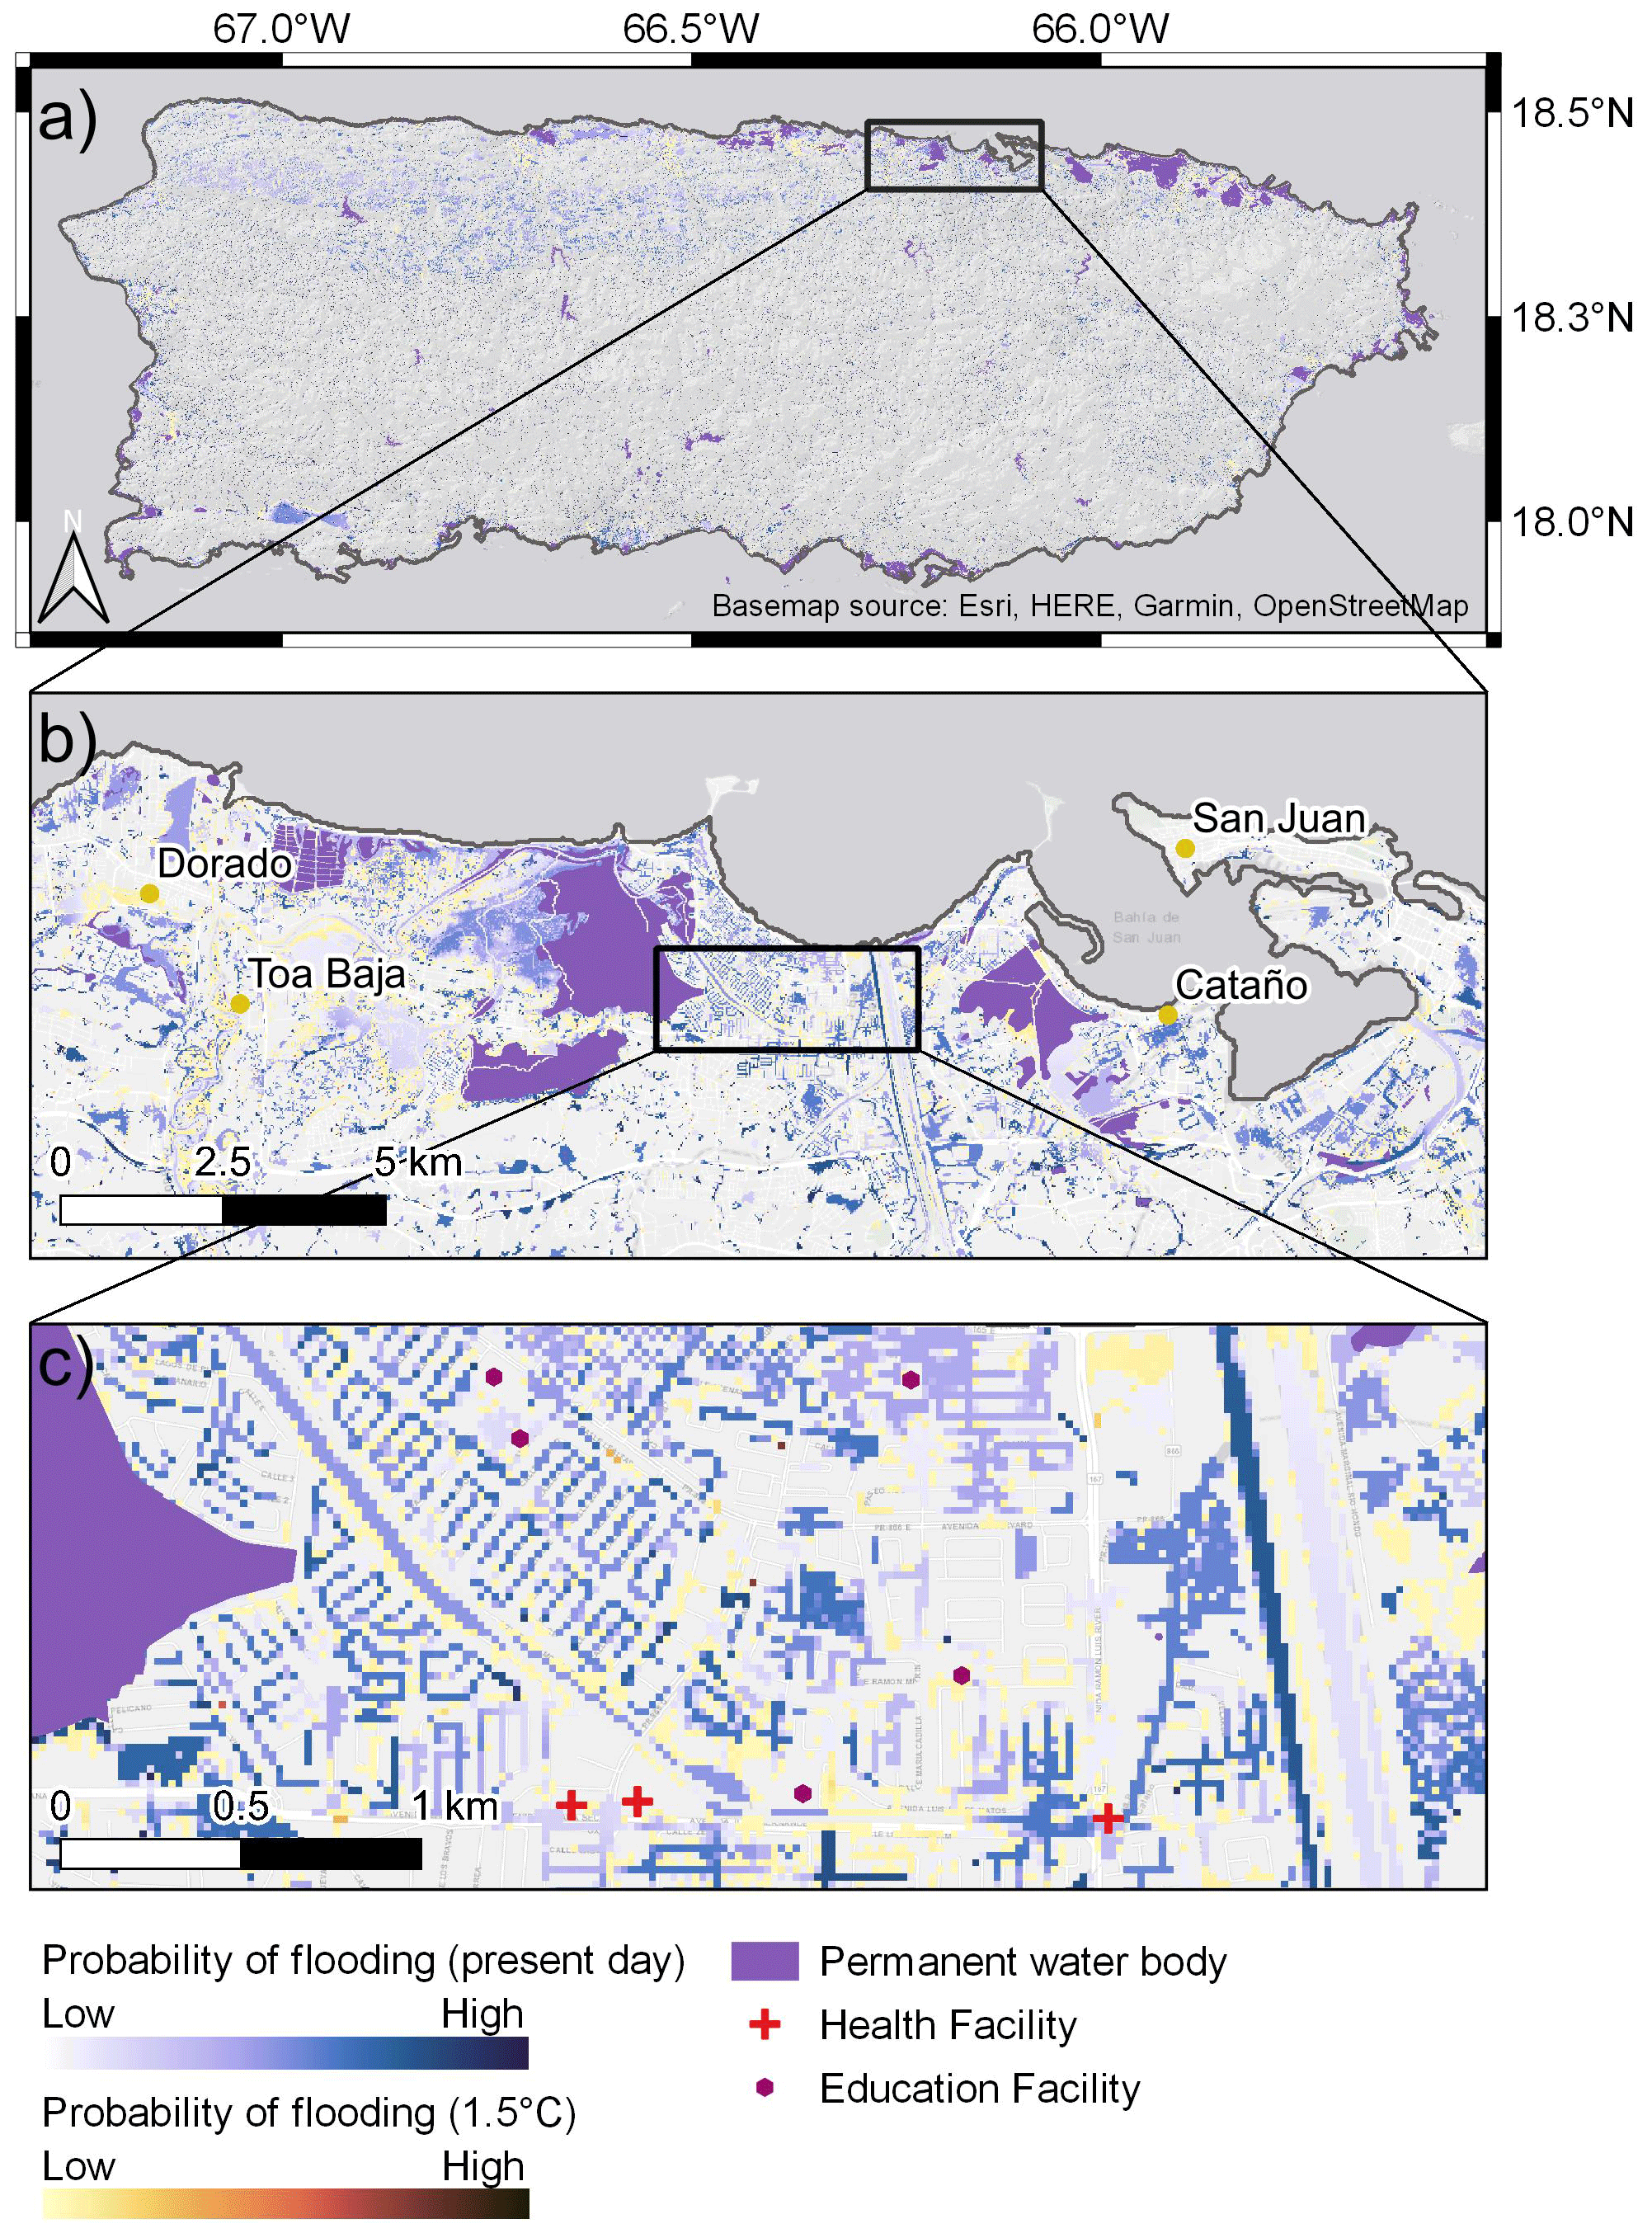
Figure 5Map showing the 20-year return period flood based on the probability of inundation under present-day and 1.5 ∘C climate change for the ECHAM6-3-LR climate model. (a) Flooding at the island scale. (b) Flooding in the Toa Baja and Cataño districts. (c) Flooding in Levittown, Toa Baja. For presentation purposes, only inundation probabilities under present-day and 1.5 ∘C climate change are shown here.
Flooding in the northwest of the island shown in Fig. 5a (latitude–longitude location: 18.3, −67.0 to 18.4, −66.5) is a feature of the topography and model structure, not data error. This area is dominated by karst hydrology (Hughes and Schulz, 2020). Therefore, these areas of pooled water would likely not feature if karst processes were explicitly represented in the model set-up. The inclusion of karst processes was beyond the scope of this study, and as this area is sparsely populated it is unlikely to impact the presented estimates of population exposure.
3.3 Characterizing changes in population exposure under present-day as well as 1.5 and 2 ∘C climate change
This research estimates changes in population exposure to hurricane-rainfall-driven flooding for the island of Puerto Rico under present-day as well as 1.5 and 2 ∘C climate change. The climate change scenarios are analysed for each individual climate model, as opposed to the aggregate results, as there are important differences between models that are obscured when using the mean. This is a way of investigating uncertainty explicitly, by understanding the differences between models. Studies such as Daron et al. (2021) have highlighted the importance of assessing individual model performance when climate models give a wide range of projections.
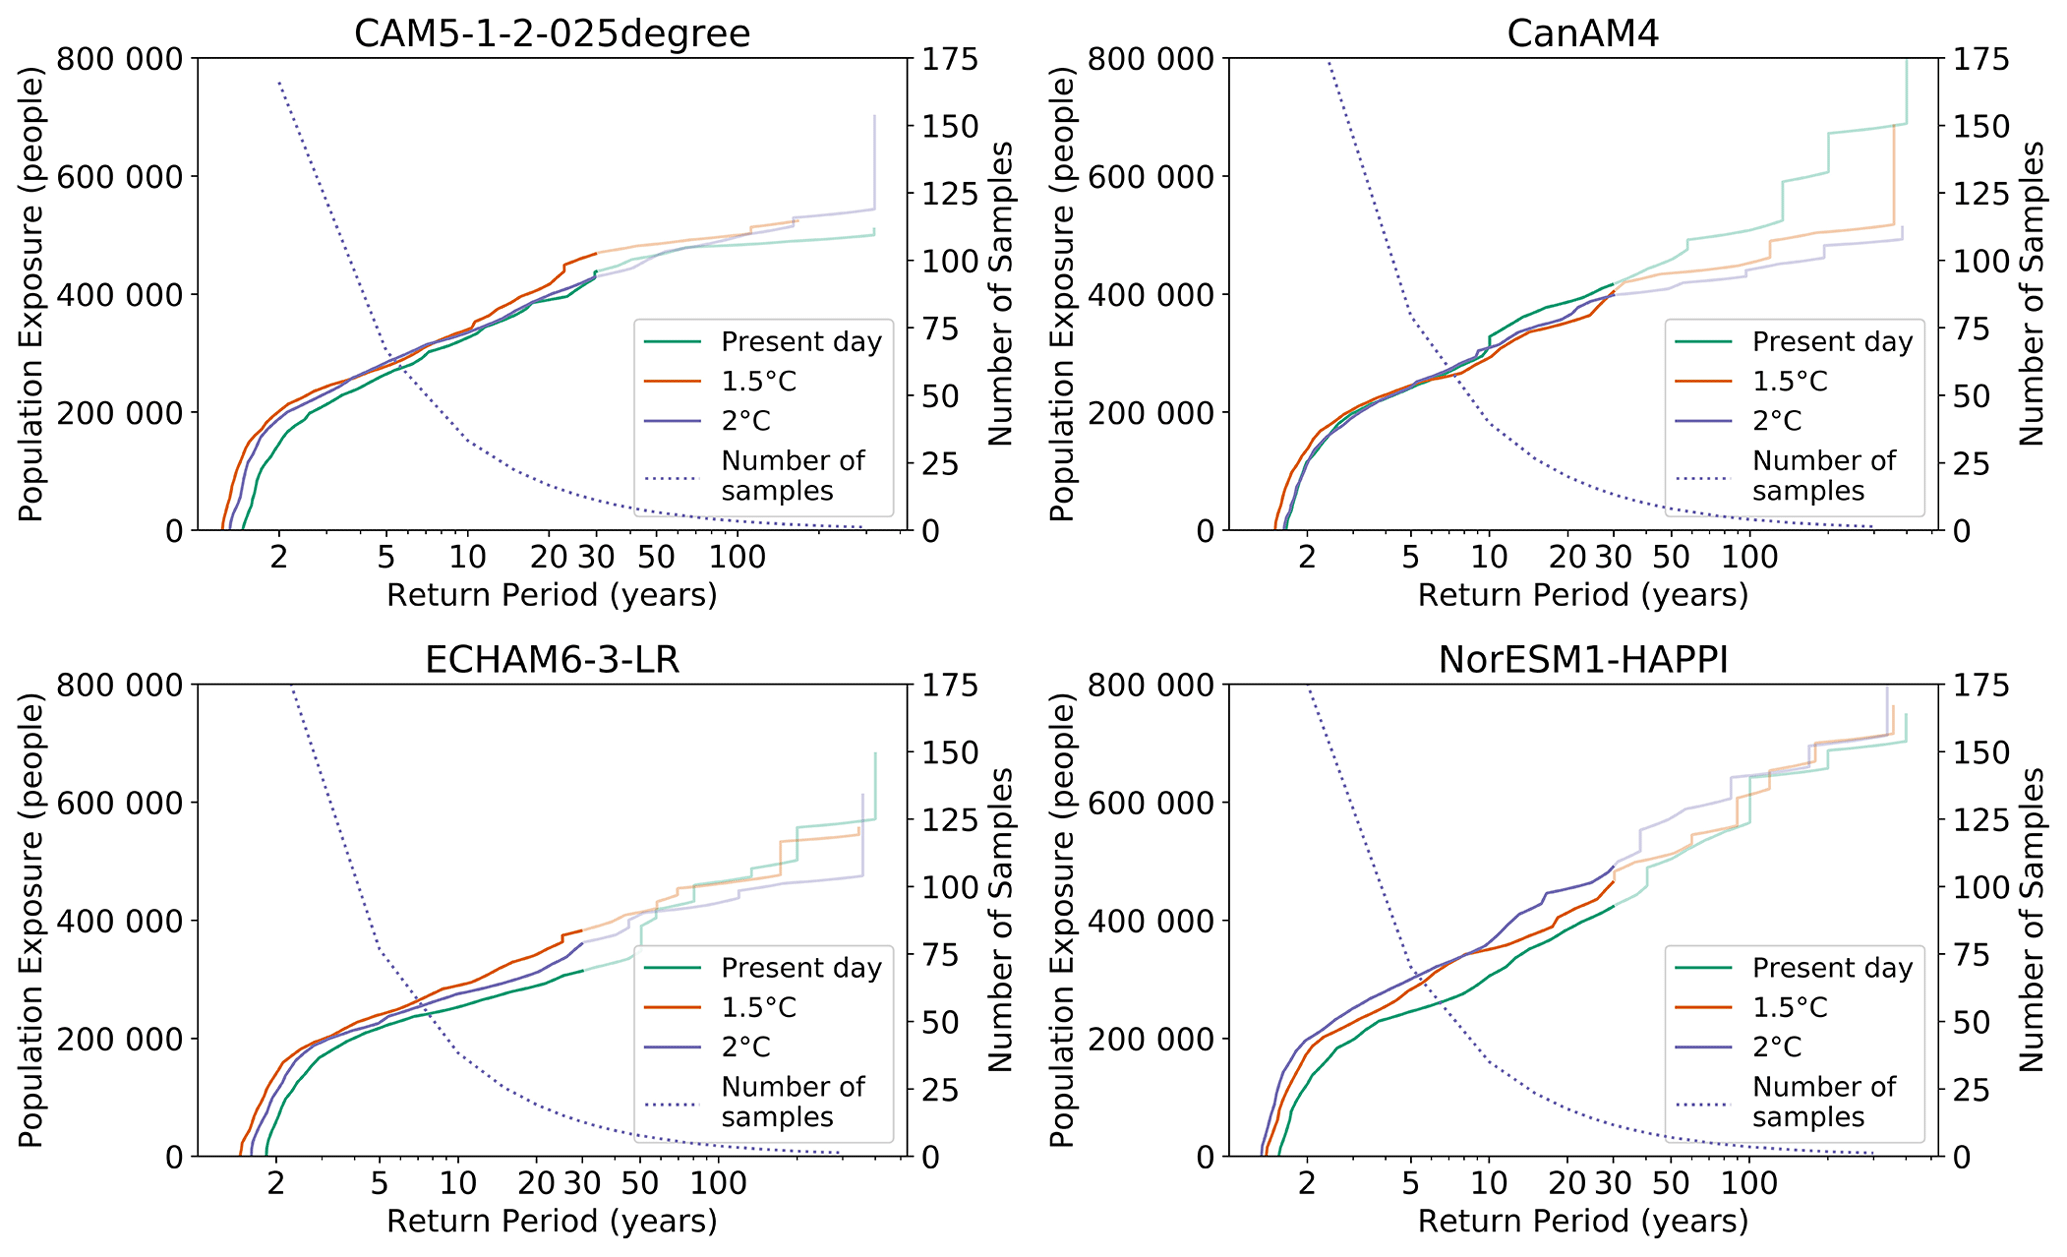
Figure 6Graph showing population exposure exceedance for present-day, 1.5 ∘C, and 2 ∘C climate change, as well as the number of samples in each climate model at a given return period (dotted line). Population exposure above the 30-year return period is faded to represent the uncertainty associated with the limited number of samples at these return periods.
Figure 6 shows the return period of a given exceedance of population exposure from hurricane-rainfall-driven flooding in Puerto Rico under present-day as well as 1.5 and 2 ∘C climate change. Return periods of population exposure exceedance above the 30-year return period are not considered and are thus faded in Fig. 6. The number of samples for each climate model scenario above the 30-year return period is too small (mean: 12.7 samples) to determine accurate estimates of population exposure above the 30-year return period (see Fig. 6). Thus, changes in population exposure above the 30-year return period in this event set are subject to significant uncertainty resulting from limited samples at these event magnitudes and are therefore not considered further in this analysis. A much longer event set would be required to simulate robust changes in population exposure at higher-magnitude return periods.
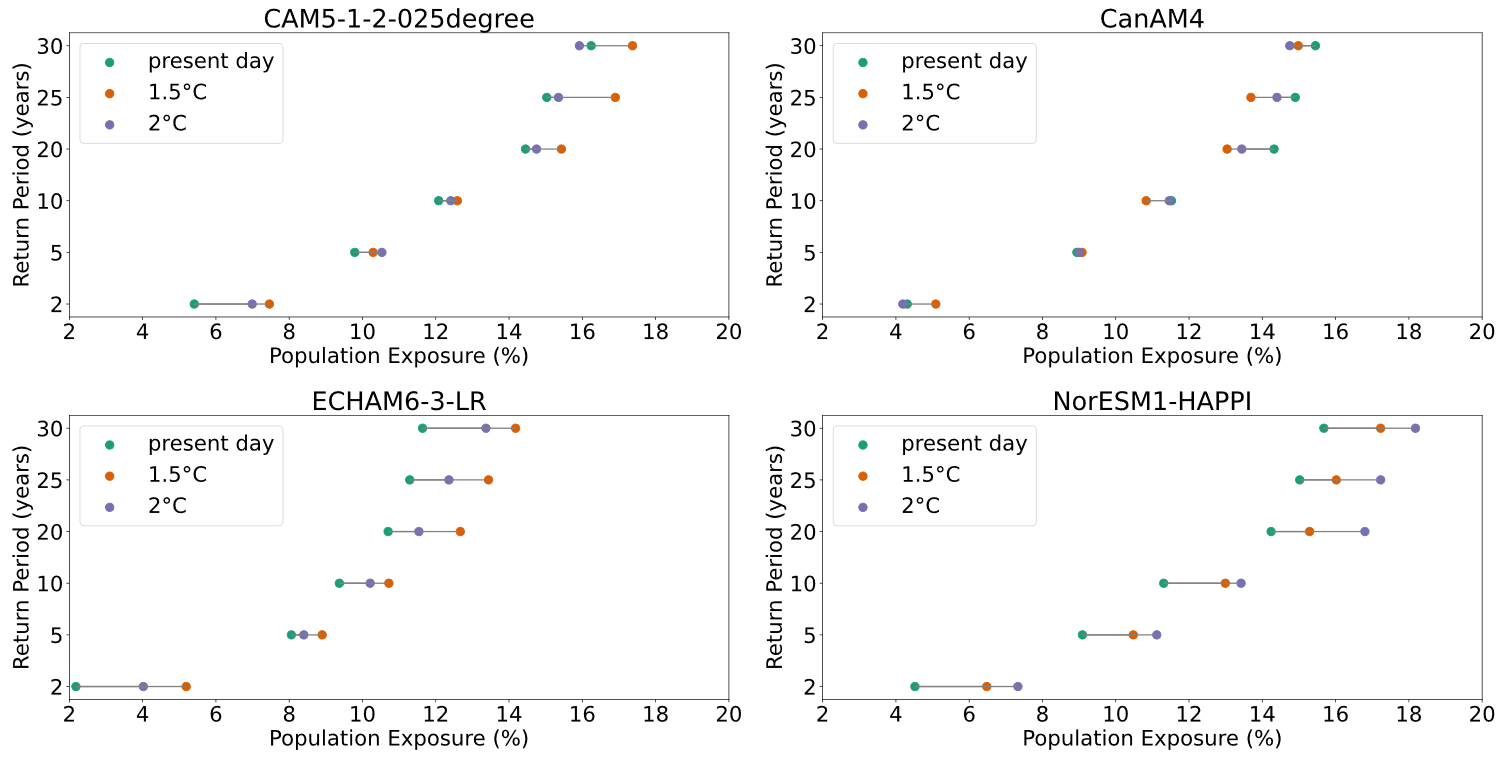
Figure 7Plot showing the percentage of the population exposed to flooding under present-day, 1.5 ∘C, and 2 ∘C climate change and the difference between the three scenarios for each HAPPI climate model. The green dot represents present-day population exposure (as a percentage of the total population), with the orange and purple dots representing the population exposure (%) at 1.5 and 2 ∘C. The difference between the population exposure between the different scenarios is represented by the line between the dots.
Three of the four climate models show agreement in the direction of change between present and future climate change, with increases in population exposure associated with a given return period at 1.5 and 2 ∘C compared to the present day. However, one climate model (CanAM4) shows the opposite trend above the 10-year return period (see Fig. 7). One key reason for this is likely to be the differences in the resolution of the underlying global climate model (GCM) data: the CanAM4 GCM has a coarser resolution (2.81∘ × 2.81∘) than the next most coarse GCM, ECHAM6-3-LR (1.88∘ × 1.88∘) (see Table 1). As a result, the underlying variables driving extreme hurricane rainfall are less likely to be well represented in CanAM4 compared to the other three climate models. It is well understood that higher-resolution GCMs are better able to simulate the underlying conditions important for the development of extreme rainfall and tropical cyclones (Knutson et al., 2020).
Present-day population exposure to flooding from hurricane rainfall in Puerto Rico is approximately 2 %–5 % at the 2-year return period, rising to 8 %–10 % at the 5-year, 9 %–12 % at the 10-year, and 11 %–14 % at the 20-year return periods (see Fig. 6). These are the first published estimates of present-day population exposure to flooding in Puerto Rico. It is difficult to corroborate the population exposure estimates with those for previous events in Puerto Rico due to a lack of data; however these estimates are plausible in light of the universal islandwide flash flood warning given to Puerto Rico during Hurricane Maria (Pasch et al., 2018).
As shown in Fig. 7, the estimated number of people exposed to flooding from hurricane rainfall on average every 2 years would increase by the largest percentage across the different return periods (20 %–140 % at 1.5 ∘C; −3 %–85 % at 2 ∘C). The lower bound here represents the results from the CanAM4 model, which has the lowest GCM resolution (see Table 1). The reason for the widest range at the 2-year return period could be because of the different bed elevation sizes at the historical 2-year return period for each climate model. For a return period population exposure of 5 years as shown in Fig. 8, the percentage increase in population exposure at 1.5 and 2 ∘C ranges from 2 %–15 % and 1 %–20 %, respectively. This is a considerably lower range than the population exposure exceedance at the 2-year return period but also shows more agreement between the climate models.
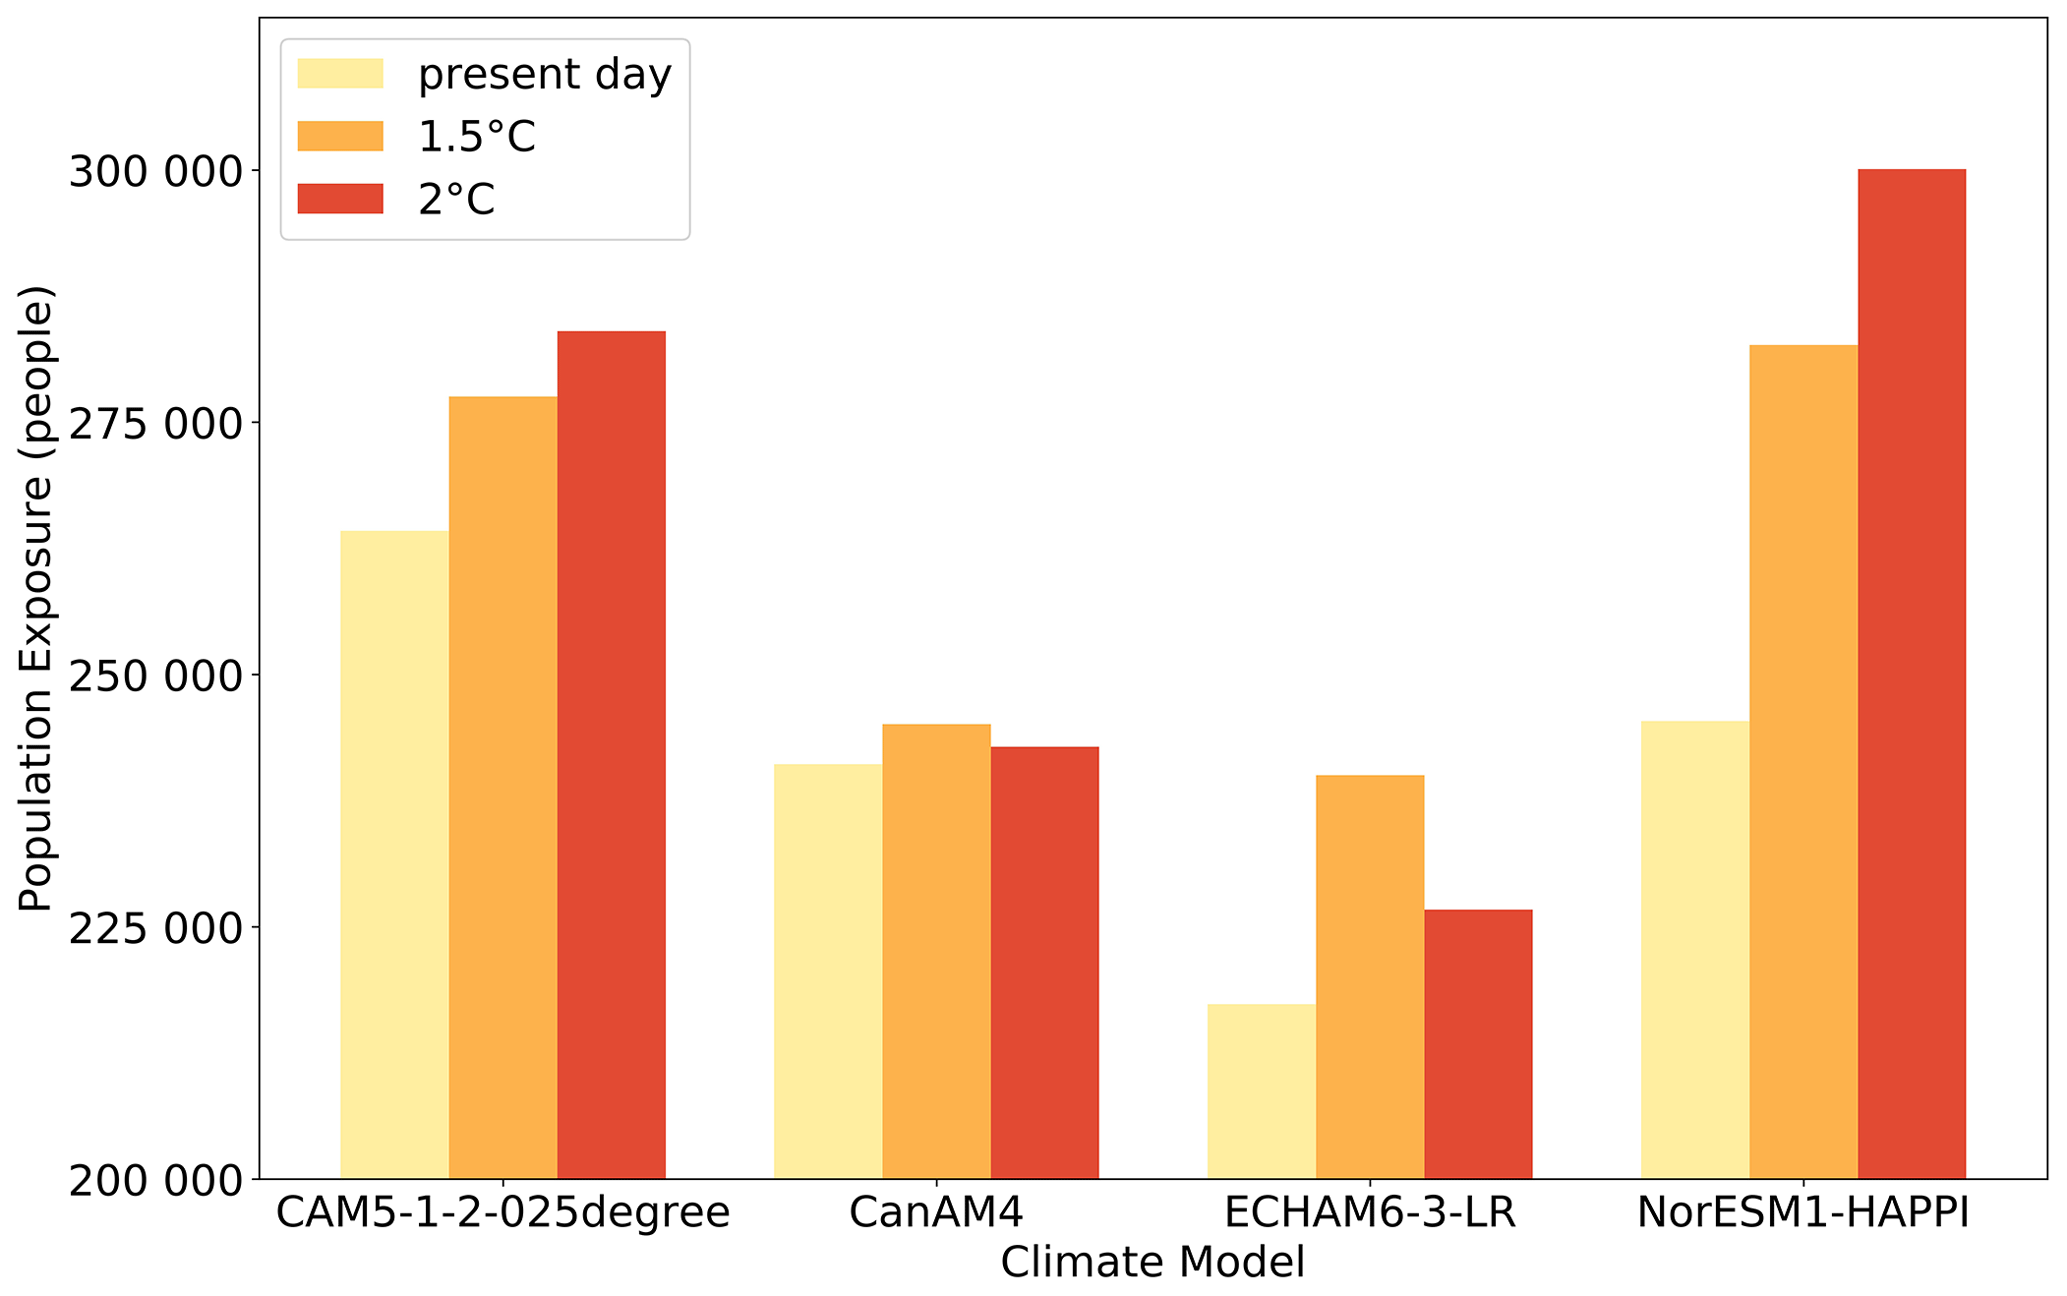
Figure 8Bar graph showing the number of people exposed to flooding under present-day as well as 1.5 and 2 ∘C climate change for the 5-year population exposure exceedance for each HAPPI climate model.
As shown in Fig. 7, there is a notable difference in population exposure exceedance between the present day and 1.5 ∘C in three of the four climate models but a less clear difference between 1.5 and 2 ∘C. In two of the four climate models (CAM5-1-2-025degree and ECHAM6-3-LR), the percentage of the population exposed at a given return period is higher at 1.5 ∘C compared to 2 ∘C and in one climate model (NorESM1-HAPPI) higher at 2 ∘C compared to 1.5 ∘C. In the CanAM4 climate model, depending on the return period, the percentage of population exposure varies between the three climate scenarios, and no consistent pattern is shown between the three across different return periods.
Figure 8 demonstrates that the range in the absolute population exposure numbers estimated for a given return period between the four climate models is the same as or greater than the percentage uplift in population exposure associated with 1.5 and 2 ∘C, highlighting the range of possible absolute population exposure estimates. For the 5-year return period, present-day absolute population exposure ranges from 217 000 (ECHAM6-3-LR) to 264 000 (CAM5-1-2-025degree). This is a 21 % difference, whereas the highest population exposure increase is 22 % between the present day and 2 ∘C for the NorESM1-HAPPI climate model. This underlines the difficulty in estimating current population exposure to flooding. This is not only the case in data-sparse areas such as Puerto Rico, but also in data-rich areas such as the conterminous US (Bates et al., 2021). However, the direction of change between present-day and future climate change (1.5 and 2 ∘C) is robust across three of the four climate models, meaning the signal in population exposure to flooding is observable when comparing present-day and future climate change, despite the uncertainty in absolute terms.
Our estimates of flood hazard and population exposure driven by hurricane rainfall under current and future climate change supersede previous efforts to estimate hurricane-rainfall-driven flood risk in Puerto Rico. Previous estimates rely on local-scale FEMA fluvial assessments or global large-scale assessments that most often neglect small islands through the choice of scale, although the FEMA models will likely be more accurate locally where they exist, depending on the local river channel and flood defence information that was available to the model developers. This study is one of the first known published studies which propagates spatially and temporally explicit hurricane rainfall data to the impact modelling of flood hazard and population exposure estimates and is the first to do so for a small island. Utilizing hydrodynamic flood models to understand changes in flooding under climate change is a critical gap in the literature, despite the widespread use of hydrodynamic models to assess current flood risk. The latest IPCC AR6 Working Group I report has demonstrated that changes in rainfall were still the dominant method used to assess changes in pluvial flooding under climate change (Seneviratne et al., 2021). However, here we find that the changes in population exposure between present-day as well as 1.5 and 2 ∘C climate change do not correspond linearly with changes in hurricane rainfall using the HAPPI climate models (Vosper et al., 2020) analysed here, and therefore this rainfall proxy method may not be appropriate when investigating changes in flooding from hurricane rainfall.
4.1 Validating an event-based model
We present the first estimates of rainfall-driven flooding from Hurricane Maria using IMERG and NCEP Stage IV precipitation data. Comparison against HWM data from Hurricane Maria showed that the RMSE of these estimates was reasonable given the typical uncertainties in data of this type (IMERG: 1.18 m, NCEP Stage IV: 1.22 m). There is uncertainty associated with the HWM vertical datum transformation using VDatum (+-0.92 m), which is likely to impact the RMSE. However, these RMSEs have a similar magnitude to studies conducted in data-rich regions with similar-quality HWM data, such as the conterminous US (∼ 1 m) (Wing et al., 2021). This shows that the model is capable of realistically simulating flood depths, demonstrating the suitability of the model for estimating flood hazard under current and future climate change. Inevitably, this finding should be considered alongside the inherent limitations when comparing flood estimates to high-water-mark data. For example, RMSEs in this study are higher than in studies such as Neal et al. (2009) (RMSE: 0.28 m). Yet, the HWM data in this study are arguably lower-quality data due to the catastrophic nature of the hurricane, which limited accessibility for post-event assessment due to widescale infrastructure failure (Main et al., 2021). HWMs in this study are concentrated in populated areas and were probably constrained to where it was safe to travel immediately post-event. The performance of the model is likely biased towards these coastal, more populated areas. However, this is also where a considerable portion of the risk is on the island, as this is where the majority of the population resides.
Moreover, there are limitations of the observation precipitation datasets used, which propagate into the flood estimates. Many studies have compared the performance of NCEP Stage IV and IMERG rainfall data (Li et al., 2022; Mazza and Chen, 2023; Omranian et al., 2018; Villarini et al., 2011). Tropical cyclone precipitation in the conterminous US between 2002–2019 was much higher in NCEP Stage IV than in satellite products such as IMERG (Mazza and Chen, 2023). Other studies support this conclusion and find that the explanation for this difference is more likely an underestimation of other products and not an overestimation bias in NCEP Stage IV itself (Villarini et al., 2011). For example, IMERG is likely to underestimate orographic rainfall, which could explain why the flood extent using IMERG is lower than that using NCEP Stage IV (see Fig. 3). This provides an incentive for the event set approach outlined in this study, as it allows for a consideration of a wider range of plausible events to get a greater understanding of uncertainty than just the observations.
Based on the events selected as Hurricane Maria-like, highlighted in Fig. 4, we find that our event set contains events like Hurricane Maria and that these events have amongst the lowest RMSEs in comparison to observed HWMs from Hurricane Maria (range: 1.13–1.33 m). It was expected that given the extreme magnitude of Hurricane Maria (∼ 115-year return period hurricane rainfall event; Keellings and Hernández Ayala, 2019), there would be a limited number of events in our event set with this magnitude due to the comparatively short simulated time record of our event set (range: 332–427 years per climate model scenario). In our event set across all climate model scenarios, we find 20 events that we classify as Hurricane Maria-like based on maximum total rainfall and spatial characteristics. This finding firstly reinforces just how extreme Hurricane Maria was, following the devastating impact on both the population and the infrastructure (Audi et al., 2018; Michaud and Kates, 2017; Main et al., 2021), as well as the literature examining the event in the context of the historical record (Keellings and Hernández Ayala, 2019; Ramos-Scharrón and Arima, 2019). This also indicates that the model has the capacity to replicate events such as Hurricane Maria when both maximum total rainfall and spatial characteristics are considered. Two key conclusions can be taken from this. Firstly, this highlights the importance of variables other than rainfall when estimating rainfall-driven flooding, such as the spatial characteristics of the hurricane, including landfall location and trajectory. Just considering the rainfall was not sufficient to identify Maria-like events. As a result, simulating the spatial and temporal distributions of the rainfall in an event set is a crucial step needed to accurately represent the relationship between hurricane rainfall and flood hazard in Puerto Rico. This finding reinforces previous research, which has identified the importance of hurricane landfall and spatial location for the generation of floods in Puerto Rico (Hernández Ayala et al., 2017; Hernández Ayala and Matyas, 2016; Smith et al., 2005). Secondly, considering that there is uncertainty in so-called observed flooding from Hurricane Maria (see Fig. 3), the event set provides the opportunity to assess many more realizations of events with similar characteristics to Hurricane Maria than those available just using observations. This may allow for a better understanding of uncertainty in rainfall-driven flooding for a given event and thus a greater understanding of risk. Future research investigating changes in flooding from hurricane rainfall should thus take an event-based approach as outlined in this study.
4.2 Current population exposure to flooding from hurricane rainfall
Our results highlight the first published estimates of population exposure to flooding in Puerto Rico under the present-day climate, with approximately 8 %–10 % of the population currently exposed to flooding from hurricane rainfall at the 5-year recurrence interval. This level of population exposure has important implications for resilience to floods. It also underlines the exposure to hydrometeorological hazards already experienced in SIDS, which is a key reason for their high risk to climate change and disasters (Thomas et al., 2020). It is also worth noting that these population exposure estimates are for the present-day (2005–2016) climate at around 0.9 ∘C of global mean warming and therefore do not represent a pre-industrial climate. This means population exposure estimates for the present day identified in this study are likely to be already influenced by climate change, given the significant impact of climate change on recent hurricane rainfall events, such as Hurricane Maria, in Puerto Rico (Keellings and Hernández Ayala, 2019; Patricola and Wehner, 2018).
4.3 Population exposure to flooding from hurricane rainfall under 1.5 and 2 ∘C climate change
The results presented in this research estimate that population exposure to flooding from hurricane rainfall will be amplified under 1.5 and 2 ∘C in all but one of the four HAPPI climate models analysed. The Paris Agreement includes the 1.5 ∘C target as the higher ambition goal and is often touted as our best chance to limit the impacts of climate change to within a “safe limit”. However, our analysis contributes to the discourse SIDS have been highlighting for some time now, which is that even a 1.5 ∘C temperature rise above pre-industrial levels leads to a serious threat to adaptive capacity (Ourbak and Magnan, 2018; Mycoo, 2018; Hoegh-Guldberg et al., 2018; Mycoo et al., 2022). Here, we find that even at 1.5 ∘C, the increase in population exposure associated with hurricane-rainfall-driven flooding in Puerto Rico is enhanced for events with a return period below 30 years. This may have wide-reaching implications for the resilience of Puerto Rico's population. Moreover, although the 1.5 ∘C goal is technically feasible (IPCC, 2018, 2021), it is not currently the most likely temperature rise based on existing policy pledges. At the time of writing, global temperature increase had already reached ∼ 1.1 ∘C above pre-industrial levels (World Meteorological Organization, 2021). Based on our analysis, it is likely that flood hazard and population exposure would increase further under higher-warming scenarios. These changes are likely to vary between GCMs.
Due to the range in both absolute population numbers and the relative changes in population exposure between present-day as well as 1.5 and 2 ∘C across the four climate models in this event set, there is uncertainty in both how many people might be exposed to a particular flood event and how much this may change in the future. Moreover, the range in present-day absolute population numbers is often larger than the climate signal, which underlines the difficulty in understanding current population exposure (Bates et al., 2021). This demonstrates the importance of assessing a range of different climate model projections to understand the range in uncertainties, which taking an event set approach enables because it allows for many more realizations of a given event magnitude than is likely to have occurred in the historical record to be considered. Overall, three of the four climate models utilized in this study show that there is a difference in the percentage of the population exposed at a given return period under 1.5 or 2 ∘C climate change in comparison to the present day. It is likely that the difference between 1.5 and 2 ∘C is too small to determine a robust directional change above variability, particularly as only 4 of the > 50 HAPPI ensemble members are utilized in this analysis. Other studies have also shown a spread around the median in precipitation, flood hazard, and population exposure estimates under future scenarios (Bates et al., 2021; Swain et al., 2020; Lopez-Cantu et al., 2020), as well as uncertain differences between 1.5 and 2 ∘C given the influence of underlying uncertainty in the GCM and precipitation data (Uhe et al., 2019).
Other reasons for uncertainty in absolute population exposures likely stems from the choice of population data and the corresponding methodology used to assign population to pixels, as well as the underlying population data used to inform the population totals. This is evidenced by the differences in total population among WorldPop, HRSL, and HRPDM, as discussed in Sect. 2.3. Moreover, flood defences are not included in the model due to a lack of available data, meaning the absolute population exposure numbers – particularly for the lower return periods where flood defences are most likely to provide protection – will probably be an overestimate in some locations. If flood defence information was available, the standards of protection could be applied to the exposure estimates provided in this dataset to estimate population exposure when flood defences are included. On the other hand, as this study does not include estimates of coastal flooding, the population exposure estimates may also be an underestimate. This means that it is important to consider that the exposure estimates outlined in this study are for inland rainfall-driven flooding only.
4.4 Limitations of event set size
Population exposure estimates above the 30-year return period are subject to significant uncertainty due to the limited number of samples (mean of < 12.7 samples across the four climate models) available in the event set with these return periods. As a result, the changes in population exposure between current as well as 1.5 and 2 ∘C above the 30-year return period were not considered in this study. This was an acceptable trade-off based on the current work, as this study was mostly focused on understanding changes in lower-magnitude, higher-frequency events. Flood events with a > 30-year return period are often valley-filling, and therefore the impact of such events is already likely to be very significant for the population, as demonstrated during Hurricane Maria (Pasch et al., 2018). Larger events also often lead to a greater domestic and international response. However, smaller, more frequent events lead to the erosion of resilience in communities over time and do not receive the same level of relief or response (Hamdan, 2015; Bull-Kamanga et al., 2003; Allen et al., 2017; United Nations Office for Disaster Risk Reduction, 2019). Research to date has also mostly focused on changes in the 100-year return period event (Arnell and Gosling, 2016; Lehner et al., 2006; Hirabayashi et al., 2013). Therefore, assessing changes in lower-magnitude, higher-frequency events was a key aim of this study. To detect changes in the 100-year return period population exposure, a much longer event set would be required to detect a significant change between 1.5 and 2 ∘C. Although we have shown that 20 events like Hurricane Maria do occur in the event set overall, preferably there would be at least 30–50 events to have confidence in relative changes, as is shown in Fig. 6. This would require at least 1000 years of synthetic data per climate model as a minimum. This should be considered in the future when producing event sets derived from GCMs with the intention to utilize these in flood impact modelling. Inevitably, running a much larger ensemble comes at the expense of computational cost; therefore a trade-off, particularly with inundation model resolution, is likely to be necessary.
We present the most detailed estimates of present-day and future (1.5 and 2 ∘C) hurricane-rainfall-driven flood hazard and population exposure estimates in Puerto Rico to date. This analysis quantifies present-day population exposure to flooding in Puerto Rico for small- to medium-sized events (< 30-year return period). Population exposure to flooding is likely to increase under both 1.5 and 2 ∘C climate change. Estimates here suggest that for the present-day, 8 %–10 % of the total population of Puerto Rico would be exposed to flooding (defined as residing at a location with inundation depth > 10 cm) from hurricane rainfall every 5 years, increasing by 2 %–15 % and 1 %–20 % at 1.5 and 2 ∘C, respectively. Increases in the number of people exposed to small- to medium-sized flood events (< 30-year return period) could have a cumulative negative impact on the long-term resilience of the Puerto Rican population without appropriate adaptation. Uncertainty in absolute population exposure estimates, as well as the range in estimated percentage increases in flooding under 1.5 and 2 ∘C, should be considered when using these estimates to inform appropriate adaptation.
Through validation of our model in comparison with observed high-water-mark data for Hurricane Maria (∼ 115-year return period rainfall event), we find that our model is able to replicate similar levels of flooding to that which occurred and that there are events like Hurricane Maria in the event set when events with both similar maximum total rainfall and similar spatial track characteristics are considered. This has important implications for future research, as an event-based approach allows for the assessment of many more plausible scenarios than is available in the observed historical record.
Puerto Rico is predicted to experience increased population exposure to flooding associated with hurricane rainfall in the future under 1.5 and 2 ∘C climate change. These findings add to the growing body of research that highlights the critical and disproportionate risk climate change poses to Small Island Developing States, amidst the uncomfortable irony that they are among the lowest contributors to greenhouse gas emissions responsible for anthropogenic climate change (Hoegh-Guldberg et al., 2018; Thomas et al., 2020). This simultaneously highlights the impact of every increment of global temperature increase on Small Island Developing States and thus the importance of high-ambition mitigation efforts, as well as the urgent need for increased climate change adaptation and disaster risk reduction in the region.
The HAPPI climate model data described in Mitchell et al. (2017), https://doi.org/10.5194/gmd-10-571-2017, can be found and downloaded under an Attribution-NonCommercial-ShareAlike 2.0 generic license at https://www.happimip.org/happi_data/ (HAPPI, 2024). The lidar data can be found on the USGS Data Access Viewer: https://coast.noaa.gov/dataviewer/#/lidar/search/where:ID=8630 (USGS, 2024). The LISFLOOD-FP 8.0 hydrodynamic model (version 8.0) (software) is available at https://doi.org/10.5281/zenodo.4073011 (LISFLOOD-FP Developers, 2020). The WorldPop population data can be found in Bondarenko et al. (2020), https://doi.org/10.5258/SOTON/WP00684, under a Creative Commons Attribution 4.0 international license. The high-water-mark data can be found on the USGS Flood Event Viewer: https://stn.wim.usgs.gov/FEV/#MariaSeptember2017 (USGS, 2024). IMERG data can be downloaded from the Global Precipitation Measurement database at https://gpm.nasa.gov/data/imerg (NASA, 2024). NCEP Stage IV data can be downloaded from Du (2011). The probability-of-inundation (event set) flood hazard maps from Archer et al. (2023) are available via data.bris at https://doi.org/10.5523/bris.2qtinf5lw52u52snyl5ruwekef under a Creative Commons CC BY-NC 4.0 license.
The supplement related to this article is available online at: https://doi.org/10.5194/nhess-24-375-2024-supplement.
LA conceptualized the idea, conducted the analysis, developed the methodology, validated the results, and wrote the paper; JN and PDB contributed to conceptualization, analysis, methodology, and validation and supervised the research; EV, DC, and JS were involved in the data curation and methodology; DM contributed to conceptualization. All authors were involved in reviewing and editing the paper.
The contact author has declared that none of the authors has any competing interests.
Publisher's note: Copernicus Publications remains neutral with regard to jurisdictional claims made in the text, published maps, institutional affiliations, or any other geographical representation in this paper. While Copernicus Publications makes every effort to include appropriate place names, the final responsibility lies with the authors.
Paul Bates is supported by the Royal Society Wolfson Research Merit Award. Emily Vosper is supported by the UKRI ERSPC Centre for Doctoral Training.
This research has been supported by the UK Research and Innovation GW4+ doctoral training partnership (grant nos. NE/S007504/1, NE/S003061/1, and NE/S006079/1).
This paper was edited by Yves Bühler and reviewed by two anonymous referees.
Aldridge, T., Gunawan, O., Moore, R. J., Cole, S. J., Boyce, G., and Cowling, R.: Developing an impact library for forecasting surface water flood risk, J. Flood Risk Manage., 13, e12641, https://doi.org/10.1111/jfr3.12641, 2020.
Allen, A., Zilbert Soto, L., Wesely, J., Belkow, T., Ferro, V., Lambert, R., Langdown, I., and Samanamú, A.: From state agencies to ordinary citizens: reframing risk-mitigation investments and their impact to disrupt urban risk traps in Lima, Peru, Environ. Urban., 29, 477–502, https://doi.org/10.1177/0956247817706061, 2017.
Archer, L., Neal, J., Bates, P., Vosper, E., Carroll, D., Sosa, J., and Mitchell, D.: Puerto Rico Probability of Flood Inundation Maps, University of Bristol Data Repository [data set], https://doi.org/10.5523/bris.2qtinf5lw52u52snyl5ruwekef, 2023.
Arnell, N. W. and Gosling, S. N.: The impacts of climate change on river flood risk at the global scale, Climatic Change, 134, 387–401, https://doi.org/10.1007/S10584-014-1084-5, 2016.
Audi, C., Segarra, L., Irwin, C., Craig, P., Skelton, C., and Bestul, N.: Ascertainment of the Estimated Excess Mortality from Hurricane María in Puerto Rico, Washington, DC, https://publichealth.gwu.edu/sites/g/files/zaxdzs4586/files/2023-06/acertainment-of-the-estimated-excess-mortality-from-hurricane (last access: 1 February 2024), 2018.
Barnes, R.: Parallel non-divergent flow accumulation for trillion cell digital elevation models on desktops or clusters, Environ. Modell. Softw., 92, 202–212, https://doi.org/10.1016/J.ENVSOFT.2017.02.022, 2017.
Bates, P. D., Horritt, M. S., and Fewtrell, T. J.: A simple inertial formulation of the shallow water equations for efficient two-dimensional flood inundation modelling, J. Hydrol., 387, 33–45, https://doi.org/10.1016/j.jhydrol.2010.03.027, 2010.
Bates, P. D., Quinn, N., Sampson, C., Smith, A., Wing, O., Sosa, J., Savage, J., Olcese, G., Neal, J., Schumann, G., Giustarini, L., Coxon, G., Porter, J. R., Amodeo, M. F., Chu, Z., Lewis-Gruss, S., Freeman, N. B., Houser, T., Delgado, M., Hamidi, A., Bolliger, I., McCusker, K., Emanuel, K., Ferreira, C. M., Khalid, A., Haigh, I. D., Couasnon, A., Kopp, R., Hsiang, S., and Krajewski, W. F.: Combined modelling of US fluvial, pluvial and coastal flood hazard under current and future climates, Water Resour. Res., 57, e2020WR028673, https://doi.org/10.1029/2020wr028673, 2021.
Bates, P. D., Savage, J., Wing, O., Quinn, N., Sampson, C., Neal, J., and Smith, A.: A climate-conditioned catastrophe risk model for UK flooding, Nat. Hazards Earth Syst. Sci., 23, 891–908, https://doi.org/10.5194/nhess-23-891-2023, 2023.
Bentsen, M., Bethke, I., Debernard, J. B., Iversen, T., Kirkevåg, A., Seland, Ø., Drange, H., Roelandt, C., Seierstad, I. A., Hoose, C., and Kristjánsson, J. E.: The Norwegian Earth System Model, NorESM1-M – Part 1: Description and basic evaluation of the physical climate, Geosci. Model Dev., 6, 687–720, https://doi.org/10.5194/gmd-6-687-2013, 2013.
Bernet, D. B., Zischg, A. P., Prasuhn, V., and Weingartner, R.: Modeling the extent of surface water floods in rural areas: Lessons learned from the application of various uncalibrated models, Environ. Modell. Softw., 109, 134–151, https://doi.org/10.1016/j.envsoft.2018.08.005, 2018.
Bernet, D. B., Trefalt, S., Martius, O., Weingartner, R., Mosimann, M., Röthlisberger, V., and Zischg, A. P.: Characterizing precipitation events leading to surface water flood damage over large regions of complex terrain, Environ. Res. Lett., 14, 064010, https://doi.org/10.1088/1748-9326/ab127c, 2019.
Bessette-Kirton, E. K., Coe, J. A., Schulz, W. H., Cerovski-Darriau, C., and Einbund, M. M.: Mobility characteristics of debris slides and flows triggered by Hurricane Maria in Puerto Rico, Landslides, 17, 2795–2809, https://doi.org/10.1007/s10346-020-01445-z, 2020.
Blanc, J., Hall, J. W., Roche, N., Dawson, R. J., Cesses, Y., Burton, A., and Kilsby, C. G.: Enhanced efficiency of pluvial flood risk estimation in urban areas using spatial-temporal rainfall simulations, J. Flood Risk Manag., 5, 143–152, https://doi.org/10.1111/j.1753-318X.2012.01135.x, 2012.
Bonafilia, D., Gill, J., Kirsanov, D., and SunDram, J.: Mapping the world to help aid workers, with weakly, semi-supervised learning, Facebook Artificial Intelligence, https://ai.meta.com/blog/mapping-the-world-to-help-aid-workers-with-weakly-semi (last access: 1 February 2024), 2019.
Bondarenko, M., Kerr, D., Sorichetta, A., and Tatem, A. J.: Census/projection-disaggregated gridded population datasets for 189 countries in 2020 using Built-Settlement Growth Model (BSGM) outputs, WorldPop, University of Southampton, Southampton, https://doi.org/10.5258/SOTON/WP00684, 2020.
Bull-Kamanga, L., Diagne, K., Lavell, A., Leon, E., Lerise, F., MacGregor, H., Maskrey, A., Meshack, M., Pelling, M., Reid, H., Satterthwaite, D., Songsore, J., Westgate, K., and Yitambe, A.: From everyday hazards to disasters: the accumulation of risk in urban areas, Environ. Urban., 15, 193–204, https://doi.org/10.1177/095624780301500109, 2003.
Burgess, C. P., Taylor, M. A., Stephenson, T., Mandal, A., and Powell, L.: A macro-scale flood risk model for Jamaica with impact of climate variability, Nat. Hazards, 78, 231–256, https://doi.org/10.1007/s11069-015-1712-z, 2015.
Caban, P.: Hurricane Maria's Aftermath: Redefining Puerto Rico' s Colonial Status, Curr. Hist., 118, 43–49, 2019.
Czajkowski, J., Villarini, G., Montgomery, M., Michel-Kerjan, E., and Goska, R.: Assessing Current and Future Freshwater Flood Risk from North Atlantic Tropical Cyclones via Insurance Claims, Sci. Rep.-UK, 7, 1–10, https://doi.org/10.1038/srep41609, 2017.
Daron, J., Lorenz, S., Taylor, A., and Dessai, S.: Communicating future climate projections of precipitation change, Climatic Change, 166, 1–20, https://doi.org/10.1007/S10584-021-03118-9, 2021.
Dinku, T., Chidzambwa, S., Ceccato, P., Connor, S. J., and Ropelewski, C. F.: Validation of high-resolution satellite rainfall products over complex terrain, Int. J. Remote Sens., 29, 4097–4110, https://doi.org/10.1080/01431160701772526, 2008.
Du, J.: NCEP/EMC 4KM 95 Gridded Data (GRIB) Stage IV Data, version 1.0, UCAR/NCAR – Earth Observing Laboratory [data set], https://doi.org/10.5065/D6PG1QDD, 2011.
Emanuel, K. and Jagger, T.: On Estimating Hurricane Return Periods, J. Appl. Meteorol. Clim., 49, 837–844, https://doi.org/10.1175/2009JAMC2236.1, 2010.
Emanuel, K., DesAutels, C., Holloway, C., and Korty, R.: Environmental Control of Tropical Cyclone Intensity, J. Atmos. Sci., 61, 843–858, https://doi.org/10.1175/1520-0469(2004)061<0843:ECOTCI>2.0.CO;2, 2004.
Emanuel, K., Sundararajan, R., and Williams, J.: Hurricanes and Global Warming: Results from Downscaling IPCC AR4 Simulations, B. Am. Meteorol. Soc., 89, 347–368, https://doi.org/10.1175/BAMS-89-3-347, 2008.
Falconer, R. H., Cobby, D., Smyth, P., Astle, G., Dent, J., and Golding, B.: Pluvial flooding: new approaches in flood warning, mapping and risk management, J. Flood Risk Manag., 2, 198–208, https://doi.org/10.1111/j.1753-318X.2009.01034.x, 2009.
Feldmann, M., Emanuel, K., Zhu, L., and Lohmann, U.: Estimation of Atlantic Tropical Cyclone Rainfall Frequency in the United States, J. Appl. Meteorol. Clim., 58, 1853–1866, https://doi.org/10.1175/JAMC-D-19-0011.1, 2019.
Freitas, E. da S., Coelho, V. H. R., Xuan, Y., de C. D. Melo, D., Gadelha, A. N., Santos, E. A., de O. Galvão, C., Ramos Filho, G. M., Barbosa, L. R., Huffman, G. J., Petersen, W. A., and das N. Almeida, C.: The performance of the IMERG satellite-based product in identifying sub-daily rainfall events and their properties, J. Hydrol., 589, 125128, https://doi.org/10.1016/J.JHYDROL.2020.125128, 2020.
Gao, S., Zhang, J., Li, D., Jiang, H., and Fang, Z. N.: Evaluation of Multiradar Multisensor and Stage IV Quantitative Precipitation Estimates during Hurricane Harvey, Nat. Hazards Rev., 22, 04020057, https://doi.org/10.1061/(ASCE)NH.1527-6996.0000435, 2020.
Guerreiro, S. B., Glenis, V., Dawson, R. J., and Kilsby, C.: Pluvial flooding in European cities-A continental approach to urban flood modelling, Water, 9, 296, https://doi.org/10.3390/w9040296, 2017.
Habib, E., Larson, B. F., and Graschel, J.: Validation of NEXRAD multisensor precipitation estimates using an experimental dense rain gauge network in south Louisiana, J. Hydrol., 373, 463–478, https://doi.org/10.1016/J.JHYDROL.2009.05.010, 2009.
Hall, J.: Direct Rainfall Flood Modelling: The Good, the Bad and the Ugly, Australasian Journal of Water Resources, 19, 74–85, https://doi.org/10.7158/13241583.2015.11465458, 2015.
Hamdan, F.: Intensive and extensive disaster risk drivers and interactions with recent trends in the global political economy, with special emphasis on rentier states, Int. J. Disast. Risk Re., 14, 273–289, https://doi.org/10.1016/j.ijdrr.2014.09.004, 2015.
Hankin, B., Waller, S., Astle, G., and Kellagher, R.: Mapping space for water: screening for urban flash flooding, J. Flood Risk Manag., 1, 13–22, https://doi.org/10.1111/j.1753-318x.2008.00003.x, 2008.
HAPPI: https://www.happimip.org/happi_data/ (last access: 1 February 2024), 2024.
Hawker, L., Bates, P., Neal, J., and Rougier, J.: Perspectives on Digital Elevation Model (DEM) Simulation for Flood Modeling in the Absence of a High-Accuracy Open Access Global DEM, Front. Earth Sci. (Lausanne), 6, 233, https://doi.org/10.3389/feart.2018.00233, 2018.
Hernández Ayala, J. J. and Matyas, C. J.: Tropical cyclone rainfall over Puerto Rico and its relations to environmental and storm-specific factors, Int. J. Climatol., 36, 2223–2237, https://doi.org/10.1002/joc.4490, 2016.
Hernández Ayala, J. J., Keellings, D., Waylen, P. R., and Matyas, C. J.: Extreme floods and their relationship with tropical cyclones in Puerto Rico, Hydrolog. Sci. J., 62, 2103–2119, https://doi.org/10.1080/02626667.2017.1368521, 2017.
Hirabayashi, Y., Mahendran, R., Koirala, S., Konoshima, L., Yamazaki, D., Watanabe, S., Kim, H., and Kanae, S.: Global flood risk under climate change, Nat. Clim. Change, 3, 816–821, https://doi.org/10.1038/nclimate1911, 2013.
Hoegh-Guldberg, O., Jacob, D., Taylor, M., Bindi, M., Brown, S., Camilloni, I., Diedhiou, A., and Djalante, R.: Chapter 3: Impacts of 1.5 ∘C global warming on natural and human systems, in: Global warming of 1.5 ∘C. An IPCC Special Report on the impacts of global warming of 1.5 ∘C above pre-industrial levels and related global greenhouse gas emission pathways, in the context of strengthening the global response to the threat of climate change, edited by: Intergovernmental Panel on Climate Change, Intergovernmental Panel on Climate Change, Geneva, 175–311, 2018.
Hughes, K. S. and Schulz, W. H.: Map Depicting Susceptibility to Landslides Triggered by Intense Rainfall, Open-File Report 2020–1022, USGS, Denver, https://doi.org/10.3133/ofr20201022, 2020.
IMERG: Integrated Multi-satellitE Retrievals for GPM – NASA Global Precipitation Measurement Mission, https://gpm.nasa.gov/data/imerg, last access: 17 May 2023.
IPCC: Summary for Policymakers, in: Global Warming of 1.5 ∘C. An IPCC Special Report on the impacts of global warming of 1.5 ∘C above pre-industrial levels and related global greenhouse gas emission pathways, in the context of strengthening the global response to the threat of climate change, edited by: Masson-Delmotte, V., Zhai, P., Pörtner, H.-O., Roberts, D., Skea, J., Shukla, P. R., Pirani, A., Moufouma-Okia, W., Péan, C., Pidcock, R., Connors, S., Matthews, J. B. R., Chen, Y., Zhou, X., Gomis, M. I., Lonnoy, E., Maycock, T., Tignor, M., and Waterfield, T., Cambridge University Press, Cambridge, 1–24, 2018.
IPCC: Summary for Policymakers, in: Climate Change 2021: The Physical Science Basis. Contribution of Working Group I to the Sixth Assessment Report of the Intergovernmental Panel on Climate Change, edited by: Masson-Delmotte, V., Zhai, P., Pirani, A., Connors, S. L., Péan, C., Berger, S., Caud, N., Chen, Y., Goldfarb, L., Gomis, M. I., Huang, M., Leitzell, K., Lonnoy, E., Matthews, J. B. R., Maycock, T. K., Waterfield, T., Yelekçi, O., Yu, R., and Zhou, B., Cambridge University Press, Cambridge, 2021.
Iversen, T., Bentsen, M., Bethke, I., Debernard, J. B., Kirkevåg, A., Seland, Ø., Drange, H., Kristjansson, J. E., Medhaug, I., Sand, M., and Seierstad, I. A.: The Norwegian Earth System Model, NorESM1-M – Part 2: Climate response and scenario projections, Geosci. Model Dev., 6, 389–415, https://doi.org/10.5194/gmd-6-389-2013, 2013.
Jetten, V.: CHaRIM Project St Vincent National Flood Hazard Map Methodology and Validation Report, Enschede, the Netherlands, https://www.cdema.org/virtuallibrary/images/SVGFLoodReport.pdf (last access: 1 February 2024), 2016.
Jiménez Cisneros, B. E., Oki, T., Arnell, N. W., Benito, G., Cogley, J. G., Döll, P., Jiang, T., and Mwakalila, S. S.: Freshwater Resources, in: Climate Change 2014: Impacts,Adaptation, and Vulnerability. Part A: Global and Sectoral Aspects. Contribution of Working Group II to the Fifth Assessment Report of the Intergovernmental Panel on Climate Change, edited by: Field, C. B., Barros, V. R., Dokken, D. J., Mach, K. J., Mastrandrea, M. D., Bilir, T. E., Chatterjee, M., Ebi, K. L., Estrada, Y. O., Genova, R. C., Girma, B., Kissel, E. S., Levy, A. N., MacCracken, S., Mastrandrea, P. R., and White, L. L., Cambridge University Press, Cambridge, 2014.
Joyette, A. R. T., Nurse, L. A., and Pulwarty, R. S.: Disaster risk insurance and catastrophe models in risk-prone small Caribbean islands, Disasters, 39, 467–492, https://doi.org/10.1111/disa.12118, 2014.
Keellings, D. and Hernández Ayala, J. J.: Extreme Rainfall Associated With Hurricane Maria Over Puerto Rico and Its Connections to Climate Variability and Change, Geophys. Res. Lett., 46, 2964–2973, https://doi.org/10.1029/2019GL082077, 2019.
Kirkevåg, A., Iversen, T., Seland, Ø., Hoose, C., Kristjánsson, J. E., Struthers, H., Ekman, A. M. L., Ghan, S., Griesfeller, J., Nilsson, E. D., and Schulz, M.: Aerosol–climate interactions in the Norwegian Earth System Model – NorESM1-M, Geosci. Model Dev., 6, 207–244, https://doi.org/10.5194/gmd-6-207-2013, 2013.
Knutson, T., Camargo, S. J., Chan, J. C. L., Emanuel, K., Ho, C.-H., Kossin, J., Mohapatra, M., Satoh, M., Sugi, M., Walsh, K., and Wu, L.: Tropical Cyclones and Climate Change Assessment: Part II. Projected Response to Anthropogenic Warming, B. Am. Meteorol. Soc., 101, E303–E322, https://doi.org/10.1175/bams-d-18-0194.1, 2020.
Kossin, J. P., Knapp, K. R., Olander, T. L., and Velden, C. S.: Global increase in major tropical cyclone exceedance probability over the past four decades, P. Natl. Acad. Sci. USA, 117, 11975–11980, https://doi.org/10.1073/PNAS.1920849117, 2020.
Lehner, B., Döll, P., Alcamo, J., Henrichs, T., and Kaspar, F.: Estimating the Impact of Global Change on Flood and Drought Risks in Europe: A Continental, Integrated Analysis, Climatic Change, 75, 273–299, https://doi.org/10.1007/S10584-006-6338-4, 2006.
Leopold, L. B. and Maddock, T.: The Hydraulic Geometry of Stream Channels and Some Physiographic Implications, Washington, DC, https://pubs.usgs.gov/pp/0252/report.pdf (last access: 1 February 2024), 1953.
Leyk, S., Gaughan, A. E., Adamo, S. B., de Sherbinin, A., Balk, D., Freire, S., Rose, A., Stevens, F. R., Blankespoor, B., Frye, C., Comenetz, J., Sorichetta, A., MacManus, K., Pistolesi, L., Levy, M., Tatem, A. J., and Pesaresi, M.: The spatial allocation of population: a review of large-scale gridded population data products and their fitness for use, Earth Syst. Sci. Data, 11, 1385–1409, https://doi.org/10.5194/essd-11-1385-2019, 2019.
Li, Z., Tang, G., Kirstetter, P., Gao, S., Li, J. L. F., Wen, Y., and Hong, Y.: Evaluation of GPM IMERG and its constellations in extreme events over the conterminous united states, J. Hydrol., 606, 127357, https://doi.org/10.1016/J.JHYDROL.2021.127357, 2022.
LISFLOOD-FP Developers: LISFLOOD-FP 8.0 hydrodynamic model (8.0), Zenodo [code], https://doi.org/10.5281/zenodo.4073011, 2020.
Lloyd, C. T., Sorichetta, A., and Tatem, A. J.: High resolution global gridded data for use in population studies, Sci. Data, 4, 1–17, https://doi.org/10.1038/sdata.2017.1, 2017.
Lopez-Cantu, T., Prein, A. F., and Samaras, C.: Uncertainties in Future U. S. Extreme Precipitation From Downscaled Climate Projections, Geophys. Res. Lett., 47, e2019GL086797, https://doi.org/10.1029/2019GL086797, 2020.
Lu, P., Lin, N., Emanuel, K., Chavas, D., and Smith, J.: Assessing Hurricane Rainfall Mechanisms Using a Physics-Based Model: Hurricanes Isabel (2003) and Irene (2011), J. Atmos. Sci., 75, 2337–2358, https://doi.org/10.1175/JAS-D-17-0264.1, 2018.
Lumbroso, D., Boyce, S., Bast, H., and Walmsley, N.: The challenges of developing rainfall intensity-duration-frequency curves and national flood hazard maps for the Caribbean, J. Flood Risk Manag., 4, 42–52, 2011.
Main, J. A., Dillard, M., Kuligowski, E. D., Davis, B., Dukes, J., Harrison, K., Helgeson, J., Johnson, K., Levitan, M., Mitrani-Reiser, J., Weaver, S., Yeo, D., Aponte-Bermúdez, L. D., Cline, J., Kirsch, T., and Ross, W. L.: Learning from Hurricane Maria's Impacts on Puerto Rico: A Progress Report, National Institute of Standards and Technology, Washington, DC, https://doi.org/10.6028/NIST.SP.1262, 2021.
Marks, D. G.: The beta and advection model for hurricane track forecasting: NOAA Tech. Memo, NWS NMC 70, Camp Springs, https://repository.library.noaa.gov/view/noaa/7184 (last access: 1 February 2024), 1992.
Mazza, E. and Chen, S. S.: Tropical Cyclone Rainfall Climatology, Extremes, and Flooding Potential from Remote Sensing and Reanalysis Datasets over the Continental United States, J. Hydrometeorol., 24, 1549–1562, https://doi.org/10.1175/JHM-D-22-0199.1, 2023.
Mazzoleni, M., Mård, J., Rusca, M., Odongo, V., Lindersson, S., and Di Baldassarre, G.: Floodplains in the Anthropocene: A global analysis of the interplay between human population, built environment and flood severity, Water Resour. Res., 57, e2020WR027744, https://doi.org/10.1029/2020WR027744, 2020.
Mei, W. and Xie, S.-P.: Intensification of landfalling typhoons over the northwest Pacific since the late 1970s, Nat. Geosci., 9, 753–757, https://doi.org/10.1038/ngeo2792, 2016.
Michaud, J. and Kates, J.: Public Health in Puerto Rico after Hurricane Maria, San Francisco, https://www.kff.org/mental-health/issue-brief/public-health-in-puerto-rico-after-hurricane-maria/ (last access: 1 February 2024), 2017.
Mitchell, D., James, R., Forster, P. M., Betts, R. A., Shiogama, H., and Allen, M.: Realizing the impacts of a 1.5 ∘C warmer world, Nat. Clim. Change, 6, 735–737, https://doi.org/10.1186/s40665-015-0010-z, 2016.
Mitchell, D., AchutaRao, K., Allen, M., Bethke, I., Beyerle, U., Ciavarella, A., Forster, P. M., Fuglestvedt, J., Gillett, N., Haustein, K., Ingram, W., Iversen, T., Kharin, V., Klingaman, N., Massey, N., Fischer, E., Schleussner, C.-F., Scinocca, J., Seland, Ø., Shiogama, H., Shuckburgh, E., Sparrow, S., Stone, D., Uhe, P., Wallom, D., Wehner, M., and Zaaboul, R.: Half a degree additional warming, prognosis and projected impacts (HAPPI): background and experimental design, Geosci. Model Dev., 10, 571–583, https://doi.org/10.5194/gmd-10-571-2017, 2017.
Moftakhari, H. R., AghaKouchak, A., Sanders, B. F., and Matthew, R. A.: Cumulative hazard: The case of nuisance flooding, Earths Future, 5, 214–223, https://doi.org/10.1002/2016EF000494, 2017.
Monioudi, I., Asariotis, R., Becker, A., Bhat, C., Dowding-Gooden, D., Esteban, M., Feyen, L., Mentaschi, L., Nikolaou, A., Nurse, L., Phillips, W., Smith, D., Satoh, M., Trotz, U. O., Velegrakis, A. F., Voukouvalas, E., Vousdoukas, M. I., and Witkop, R.: Climate change impacts on critical international transportation assets of Caribbean Small Island Developing States (SIDS): the case of Jamaica and Saint Lucia, Reg. Environ. Change, 18, 2211–2225, https://doi.org/10.1007/s10113-018-1360-4, 2018.
Mycoo, M. A.: Beyond 1.5 ∘C: vulnerabilities and adaptation strategies for Caribbean Small Island Developing States, Reg. Environ. Change, 18, 2341–2353, https://doi.org/10.1007/s10113-017-1248-8, 2018.
Mycoo, M. A., Wairiu, M., Campbell, D., Duvat, V., Golbuu, Y., Maharaj, S., Nalau, J., Nunn, P., Pinnegar, J., and Warrick, O.: Small Islands, in: Climate Change 2022: Impacts, Adaptation and Vulnerability. Contribution of Working Group II to the Sixth Assessment Report of the Intergovernmental Panel on Climate Change, Cambridge University Press, Cambridge, 2022.
NASA: IMERG: Integrated Multi-satellitE Retrievals for GPM, NASA [data set], https://gpm.nasa.gov/data/imerg (last access: 1 February 2024), 2024.
National Weather Service: Major Hurricane Maria – September 20, 2017, https://www.weather.gov/sju/maria2017&lang=en (last access: 1 February 2024), 2017.
Neal, J., Schumann, G., and Bates, P.: A subgrid channel model for simulating river hydraulics and floodplain inundation over large and data sparse areas, Water Resour. Res., 48, W11506, https://doi.org/10.1029/2012WR012514, 2012.
Neal, J., Hawker, L., Savage, J., Durand, M., Bates, P., and Sampson, C.: Estimating River Channel Bathymetry in Large Scale Flood Inundation Models, Water Resour. Res., 57, e2020WR028301, https://doi.org/10.1029/2020wr028301, 2021.
Neal, J. C., Bates, P. D., Fewtrell, T. J., Hunter, N. M., Wilson, M. D., and Horritt, M. S.: Distributed whole city water level measurements from the Carlisle 2005 urban flood event and comparison with hydraulic model simulations, J. Hydrol., 368, 42–55, https://doi.org/10.1016/j.jhydrol.2009.01.026, 2009.
Nelson, B. R., Prat, O. P., Seo, D. J., and Habib, E.: Assessment and Implications of NCEP Stage IV Quantitative Precipitation Estimates for Product Intercomparisons, Weather Forecast, 31, 371–394, https://doi.org/10.1175/WAF-D-14-00112.1, 2016.
Nicholls, R. J., Brown, S., Goodwin, P., Wahl, T., Lowe, J., Solan, M., Godbold, J. A., Haigh, I. D., Lincke, D., Hinkel, J., Wolf, C., and Merkens, J. L.: Stabilization of global temperature at 1.5 ∘C and 2.0 ∘C: Implications for coastal areas, Philos. T. R. Soc. A, 376, https://doi.org/10.1098/rsta.2016.0448, 2018.
Nurse, L. A., McLean, R. F., Agard Trinidad, J., Pascal Briguglio, L., Duvat-Magnan, V., Pelesikoti, N., Tompkins, E., and Webb, A.: Small Islands, in: Climate Change 2014: Impacts, Adaptation, and Vulnerability. Part B: Regional Aspects. Contribution of Working Group II to the Fifth Assessment Report of the Intergovernmental Panel on Climate Change, edited by: Intergovernmental Panel on Climate Change, Cambridge, 1613–1654, 2014.
Nuswantoro, R., Diermanse, F., and Molkenthin, F.: Probabilistic flood hazard maps for Jakarta derived from a stochastic rain-storm generator, J. Flood Risk Manag., 9, 105–124, https://doi.org/10.1111/jfr3.12114, 2016.
Omranian, E., Sharif, H. O., and Tavakoly, A. A.: How Well Can Global Precipitation Measurement (GPM) Capture Hurricanes? Case Study: Hurricane Harvey, Remote Sens.-Basel, 10, 1150, https://doi.org/10.3390/RS10071150, 2018.
Ourbak, T. and Magnan, A. K.: The Paris Agreement and climate change negotiations: Small Islands, big players, Reg. Environ. Change, 18, 2201–2207, https://doi.org/10.1007/s10113-017-1247-9, 2018.
Pasch, R. J., Penny, A. B., and Berg, R.: Hurricane Maria 16–30 September 2017, National Hurricane Center Tropical Cyclone Report, National Hurricane Center, Miami, 2018.
Patricola, C. M. and Wehner, M. F.: Anthropogenic influences on major tropical cyclone events, Nature, 563, 339–346, https://doi.org/10.1038/s41586-018-0673-2, 2018.
Pickup, G. and Warner, R. F.: Effects of hydrologic regime on magnitude and frequency of dominant discharge, J. Hydrol., 29, 51–75, https://doi.org/10.1016/0022-1694(76)90005-6, 1976.
Pokhrel, R., Cos, S. del, Montoya Rincon, J. P., Glenn, E., and González, J. E.: Observation and modeling of Hurricane Maria for damage assessment, Weather Clim. Extrem., 33, 100331, https://doi.org/10.1016/J.WACE.2021.100331, 2021.
Pradhan, R. K., Markonis, Y., Vargas Godoy, M. R., Villalba-Pradas, A., Andreadis, K. M., Nikolopoulos, E. I., Papalexiou, S. M., Rahim, A., Tapiador, F. J., and Hanel, M.: Review of GPM IMERG performance: A global perspective, Remote Sens. Environ., 268, 112754, https://doi.org/10.1016/J.RSE.2021.112754, 2022.
Prat, O. P. and Nelson, B. R.: Evaluation of precipitation estimates over CONUS derived from satellite, radar, and rain gauge data sets at daily to annual scales (2002–2012), Hydrol. Earth Syst. Sci., 19, 2037–2056, https://doi.org/10.5194/hess-19-2037-2015, 2015.
Pratomo, R. A., Jetten, V., and Alkema, D.: Rural Flash-flood Behavior in Gouyave Watershed, Grenada, Caribbbean Island, Geoplanning: Journal of Geomatics and Planning, 3, 161, https://doi.org/10.14710/geoplanning.3.2.161-170, 2016.
Ramos-Scharrón, C. E. and Arima, E.: Hurricane María's Precipitation Signature in Puerto Rico: A Conceivable Presage of Rains to Come, Sci. Rep.-UK, 9, 15612, https://doi.org/10.1038/s41598-019-52198-2, 2019.
Ranasinghe, R., Ruane, A. C., Vautard, R., Arnell, N., Coppola, E., Cruz, F. A., Dessai, S., Islam, A. S., Rahimi, M., Ruiz, D., Carrascal, Sillmann, J., Sylla, M. B., Tebaldi, C., Wang, W., and Zaaboul, R.: Climate Change Information for Regional Impact and for Risk Assessment, in: Climate Change 2021: The Physical Science Basis. Contribution of Working Group I to the Sixth Assessment Report of the Intergovernmental Panel on Climate Change, edited by: Masson-Delmotte, V., Zhai, P., Pirani, A., Connors, S. L., Péan, C., Berger, S., Caud, N., Chen, Y., Goldfarb, L., Gomis, M. I., Huang, M., Leitzell, K., Lonnoy, E., Matthews, J. B. R., Maycock, T. K., Waterfield, T., Yelekçi, O., Yu, R., and Zhou, B., Cambridge University Press, Cambridge, 2021.
Rappaport, E. N.: Fatalities in the United States from Atlantic Tropical Cyclones: New Data and Interpretation, B. Am. Meteorol. Soc., 95, 341–346, https://doi.org/10.1175/BAMS-D-12-00074.1, 2014.
Rasmussen, D. J., Bittermann, K., Buchanan, M. K., Kulp, S., Strauss, B. H., Kopp, R. E., and Oppenheimer, M.: Extreme sea level implications of 1.5 ∘C, 2.0 ∘C, and 2.5 ∘C temperature stabilization targets in the 21st and 22nd centuries, Environ. Res. Lett., 13, 034040, https://doi.org/10.1088/1748-9326/AAAC87, 2018.
Reed, F., Gaughan, A., Stevens, F., Yetman, G., Sorichetta, A., and Tatem, A.: Gridded Population Maps Informed by Different Built Settlement Products, Data (Basel), 3, 33, https://doi.org/10.3390/data3030033, 2018.
Rios Gaona, M. F., Overeem, A., Brasjen, A. M., Meirink, J. F., Leijnse, H., and Uijlenhoet, R.: Evaluation of Rainfall Products Derived from Satellites and Microwave Links for the Netherlands, IEEE T. Geosci. Remote, 55, 6849–6859, https://doi.org/10.1109/TGRS.2017.2735439, 2017.
Rios Gaona, M. F., Villarini, G., Zhang, W., and Vecchi, G. A.: The added value of IMERG in characterizing rainfall in tropical cyclones, Atmos. Res., 209, 95–102, https://doi.org/10.1016/J.ATMOSRES.2018.03.008, 2018.
Rivera, D. Z.: Disaster Colonialism: A Commentary on Disasters beyond Singular Events to Structural Violence, Int. J. Urban Regional, 46, 126–135, https://doi.org/10.1111/1468-2427.12950, 2020.
Rosenzweig, B. R., McPhillips, L., Chang, H., Cheng, C., Welty, C., Matsler, M., Iwaniec, D., and Davidson, C. I.: Pluvial flood risk and opportunities for resilience, WIREs Water, 5, e1302, https://doi.org/10.1002/wat2.1302, 2018.
Rözer, V., Kreibich, H., Schröter, K., Müller, M., Sairam, N., Doss-Gollin, J., Lall, U., and Merz, B.: Probabilistic Models Significantly Reduce Uncertainty in Hurricane Harvey Pluvial Flood Loss Estimates, Earths Future, 7, 384–394, https://doi.org/10.1029/2018EF001074, 2019.
Sampson, C. C., Bates, P. D., Neal, J. C., and Horritt, M. S.: An automated routing methodology to enable direct rainfall in high resolution shallow water models, Hydrol. Process., 27, 467–476, https://doi.org/10.1002/hyp.9515, 2013.
Sampson, C. C., Smith, A. M., Bates, P. B., Neal, J. C., Alfieri, L., and Freer, J. E.: A high-resolution global flood hazard model, Water Resour. Res., 51, 7358–7381, https://doi.org/10.1002/2015WR016954, 2015.
Savage, J. T. S., Bates, P., Freer, J., Neal, J., and Aronica, G.: When does spatial resolution become spurious in probabilistic flood inundation predictions?, Hydrol. Process., 30, 2014–2032, https://doi.org/10.1002/hyp.10749, 2016.
Sayers, P. B., Horritt, M. S., Carr, S., Kay, A., Mauz, J., Lamb, R., and Penning-Rowsell, E.: Third UK Climate Change Risk Assessment (CCRA3) Future flood risk Main Report Final Report prepared for the Committee on Climate Change, UK, London, https://www.ukclimaterisk.org/wp-content/uploads/2020/07/Future-Flooding-Main-Report-Sayers-1.pdf (last access: 1 February 2024), 2020.
Schaller, N., Sillmann, J., Müller, M., Haarsma, R., Hazeleger, W., Hegdahl, T. J., Kelder, T., van den Oord, G., Weerts, A., and Whan, K.: The role of spatial and temporal model resolution in a flood event storyline approach in western Norway, Weather Clim. Extrem., 29, https://doi.org/10.1016/J.WACE.2020.100259, 2020.
Seneviratne, S. I., Zhang, X., Adnan, M., Badi, W., Dereczynski, C., Luca, A. Di, Ghosh, S., Iskandar, I., Kossin, J., Lewis, S., Otto, F., Pinto, I., Satoh, M., Vicente-Serrano, S. M., Wehner, M., and Zhou, B.: Weather and Climate Extreme Events in a Changing Climate, in: Climate Change 2021: The Physical Science Basis. Contribution of Working Group I to the Sixth Assessment Report of the Intergovernmental Panel on Climate Change, edited by: Masson-Delmotte, V., Zhai, P., Pirani, A., Connors, S. L., Péan, C., Berger, S., Caud, N., Chen, Y., Goldfarb, L., Gomis, M. I., Huang, M., Leitzell, K., Lonnoy, E., Matthews, J. B. R., Maycock, T. K., T. Waterfield, Yelekçi, O., Yu, R., and Zhou, B., Cambridge University Press, Cambridge, 2021.
Simley, J. D. and Carswell Jr., W. J.: The National Map-Hydrography Using the Data: Fact Sheet 2009-3054, https://pubs.usgs.gov/fs/2009/3054/ (last access: 1 February 2024), 2010.
Skougaard Kaspersen, P., Høegh Ravn, N., Arnbjerg-Nielsen, K., Madsen, H., and Drews, M.: Comparison of the impacts of urban development and climate change on exposing European cities to pluvial flooding, Hydrol. Earth Syst. Sci., 21, 4131–4147, https://doi.org/10.5194/hess-21-4131-2017, 2017.
Smith, A., Bates, P. D., Wing, O., Sampson, C., Quinn, N., and Neal, J.: New estimates of flood exposure in developing countries using high-resolution population data, Nat. Commun., 10, 1814, https://doi.org/10.1038/s41467-019-09282-y, 2019.
Smith, J. A., Sturdevant-Rees, Paula., Baeck, M. Lynn., and Larsen, M. C.: Tropical cyclones and the flood hydrology of Puerto Rico, Water Resour. Res., 41, 1–16, https://doi.org/10.1029/2004WR003530, 2005.
Stevens, B., Giorgetta, M., Esch, M., Mauritsen, T., Crueger, T., Rast, S., Salzmann, M., Schmidt, H., Bader, J., Block, K., Brokopf, R., Fast, I., Kinne, S., Kornblueh, L., Lohmann, U., Pincus, R., Reichler, T., and Roeckner, E.: Atmospheric component of the MPI-M Earth System Model: ECHAM6, J. Adv. Model Earth. Sy., 5, 146–172, https://doi.org/10.1002/JAME.20015, 2013.
Storlazzi, C. D., Gingerich, S. B., Van Dongeren, A., Cheriton, O. M., Swarzenski, P. W., Quataert, E., Voss, C. I., Field, D. W., Annamalai, H., Piniak, G. A., and Mccall, R.: Most atolls will be uninhabitable by the mid-21st century because of sea-level rise exacerbating wave-driven flooding, Sci. Adv., 4, eaao4350, https://doi.org/10.1126/sciadv.aap97, 2018.
Swain, D. L., Wing, O. E. J., Bates, P. D., Done, J. M., Johnson, K., and Cameron, D. R.: Increased flood exposure due to climate change and population growth in the United States, Earths Future, 8, e2020EF001778, https://doi.org/10.1029/2020ef001778, 2020.
Tan, J., Petersen, W. A., Kirstetter, P. E., and Tian, Y.: Performance of IMERG as a Function of Spatiotemporal Scale, J. Hydrometeorol., 18, 307, https://doi.org/10.1175/JHM-D-16-0174.1, 2017.
Tanaka, T., Kiyohara, K., and Tachikawa, Y.: Comparison of fluvial and pluvial flood risk curves in urban cities derived from a large ensemble climate simulation dataset: A case study in Nagoya, Japan, J. Hydrol., 584, 124706, https://doi.org/10.1016/j.jhydrol.2020.124706, 2020.
Tang, G., Behrangi, A., Long, D., Li, C., and Hong, Y.: Accounting for spatiotemporal errors of gauges: A critical step to evaluate gridded precipitation products, J. Hydrol., 559, 294–306, https://doi.org/10.1016/J.JHYDROL.2018.02.057, 2018.
Tatem, A. J.: WorldPop, open data for spatial demography, Sci. Data, 4, 170004, https://doi.org/10.1038/sdata.2017.4, 2017.
Thomas, A., Pringle, P., Pfleiderer, P., and Schleussner, C.-F.: Tropical Cyclones: Impacts, the link to Climate Change and Adaptation, New York, https://ca1-clm.edcdn.com/assets/tropical_cyclones_impacts_cc_adaptation_2.pdf?v=1679477786 (last access: 1 February 2024), 2017.
Thomas, A., Shooya, O., Rokitzki, M., Bertrand, M., and Lissner, T.: Climate change adaptation planning in practice: insights from the Caribbean, Reg. Environ. Change, 19, 2013–2025, https://doi.org/10.1007/s10113-019-01540-5, 2019.
Thomas, A., Baptiste, A. K., Baptiste, A., Martyr-Koller, R., Pringle, P., and Rhiney, K.: Climate Change and Small Island Developing States, Annu. Rev. Env. Resour., 45, 1–27, https://doi.org/10.1146/annurev-environ-012320-083355, 2020.
Tian, F., Hou, S., Yang, L., Hu, H., and Hou, A.: How Does the Evaluation of the GPM IMERG Rainfall Product Depend on Gauge Density and Rainfall Intensity?, J. Hydrometeorol., 19, 339–349, https://doi.org/10.1175/JHM-D-17-0161.1, 2018.
Tiecke, T. G., Liu, X., Zhang, A., Gros, A., Li, N., Yetman, G., Kilic, T., Murray, S., Blankespoor, B., Prydz, E. B., and Dang, H.-A. H.: Mapping the world population one building at a time, Washington, DC, http://hdl.handle.net/10986/33700 (last access: 1 February 2024) 2017.
Towe, V., Petrun Sayers, E., Chan, E., Kim, A., Tom, A., Chan, W., Marquis, J., Robbins, M., Saum-Manning, L., Weden, M., and Payne, L.: Community Planning and Capacity Building in Puerto Rico After Hurricane Maria: Predisaster Conditions, Hurricane Damage, and Courses of Action, RAND Corporation, Santa Monica, https://doi.org/10.7249/RR2598, 2020.
Tuholske, C., Gaughan, A. E., Sorichetta, A., de Sherbinin, A., Bucherie, A., Hultquist, C., Stevens, F., Kruczkiewicz, A., Huyck, C., and Yetman, G.: Implications for Tracking SDG Indicator Metrics with Gridded Population Data, Sustainability, 13, 7329, https://doi.org/10.3390/su13137329, 2021.
Uhe, P. F., Mitchell, D. M., Bates, P. D., Sampson, C. C., Smith, A. M., and Islam, A. S.: Enhanced flood risk with 1.5 ∘C global warming in the Ganges–Brahmaputra–Meghna basin, Environ. Res. Lett., 14, 074031, https://doi.org/10.1088/1748-9326/ab10ee, 2019.
United Nations Framework Convention on Climate Change: Adoption of the Paris Agreement, Paris, https://unfccc.int/sites/default/files/resource/parisagreement_publication.pdf (last access: 1 February 2024), 2015.
United Nations Office for Disaster Risk Reduction: Global Assessment Report on Disaster Risk Reduction (5th edn.), Geneva, https://discovery.ucl.ac.uk/id/eprint/10087200/ (last access: 1 February 2024) 2019.
United Nations Office for Disaster Risk Reduction: Terminology, https://www.undrr.org/drr-glossary/terminology (last access: 1 February 2024), 2024.
United States Geological Survey: Commonwealth of Puerto Rico QL2 Lidar Report Produced for US Geological Survey, US Geological Survey, Tampa, 2017.
University of Oklahoma Cooperative Institute for Mesoscale Meteorological Studies, National Oceanic and Atmospheric Administration, and National Severe Storms Laboratory: MRMS Operational Product Viewer, University of Oklahoma Cooperative Institute for Mesoscale Meteorological Studies, National Oceanic and Atmospheric Administration, and National Severe Storms Laboratory [data set], https://mrms.nssl.noaa.gov/qvs/product_viewer/ (last access: 1 February 2024), 2023.
USGS: USGS Data Access Viewer, https://coast.noaa.gov/dataviewer/#/lidar/search/where:ID=8630 (last access: 29/ October 2023), 2023.
USGS: Flood Event Viewer, https://stn.wim.usgs.gov/FEV/#MariaSeptember2017 (last access: 1 February 2024), 2024.
Villarini, G., Smith, J. A., Baeck, M. L., Marchok, T., and Vecchi, G. A.: Characterization of rainfall distribution and flooding associated with U. S. landfalling tropical cyclones: Analyses of Hurricanes Frances, Ivan, and Jeanne (2004), J. Geophys. Res.-Atmos., 116, 23116, https://doi.org/10.1029/2011JD016175, 2011.
Von Salzen, K., Scinocca, J. F., McFarlane, N. A., Li, J., Cole, J. N. S., Plummer, D., Verseghy, D., Reader, M. C., Ma, X., Lazare, M., and Solheim, L.: The Canadian Fourth Generation Atmospheric Global Climate Model (CanAM4). Part I: Representation of Physical Processes, Atmosphere-Ocean, 51, 104–125, https://doi.org/10.1080/07055900.2012.755610, 2013.
Vosper, E. L., Mitchell, D., and Emanuel, K.: Extreme Hurricane Rainfall affecting the Caribbean mitigated by the Paris Agreement Goals, Environ. Res. Lett., 15, 104053, https://doi.org/10.1088/1748-9326/ab9794, 2020.
Wehner, M. and Sampson, C.: Attributable human-induced changes in the magnitude of flooding in the Houston, Texas region during Hurricane Harvey, Climatic Change, 166, 20, https://doi.org/10.1007/s10584-021-03114-z, 2021.
Wehner, M. F., Reed, K. A., Li, F., Prabhat, Bacmeister, J., Chen, C. T., Paciorek, C., Gleckler, P. J., Sperber, K. R., Collins, W. D., Gettelman, A., and Jablonowski, C.: The effect of horizontal resolution on simulation quality in the Community Atmospheric Model, CAM5.1, J. Adv. Model Earth. Sy., 6, 980–997, https://doi.org/10.1002/2013MS000276, 2014.
Williams, G. P.: Bank-full discharge of rivers, Water Resour. Res., 14, 1141–1154, https://doi.org/10.1029/WR014I006P01141, 1978.
Willison, C. E., Singer, P. M., Creary, M. S., and Greer, S. L.: Quantifying inequities in US federal response to hurricane disaster in Texas and Florida compared with Puerto Rico, BMJ Glob. Health, 4, e001191, https://doi.org/10.1136/BMJGH-2018-001191, 2019.
Wing, O. E. J., Bates, P. D., Sampson, C. C., Smith, A. M., Johnson, K. A., and Erickson, T. A.: Validation of a 30 m resolution flood hazard model of the conterminous United States, Water Resour. Res., 53, 7968–7986, https://doi.org/10.1002/2017WR020917, 2017.
Wing, O. E. J., Bates, P. D., Smith, A. M., Sampson, C. C., Johnson, K. A., Fargione, Joseph., and Morefield, Philip.: Estimates of present and future flood risk in the conterminous United States, Environ. Res. Lett., 13, 034023, https://doi.org/10.1088/1748-9326/aaac65, 2018.
Wing, O. E. J., Sampson, C. C., Bates, P. D., Quinn, N., Smith, A. M., and Neal, J. C.: A flood inundation forecast of Hurricane Harvey using a continental-scale 2D hydrodynamic model, J. Hydrol., 4, 100039, https://doi.org/10.1016/j.hydroa.2019.100039, 2019.
Wing, O. E. J., Smith, A. M., Marston, M. L., Porter, J. R., Amodeo, M. F., Sampson, C. C., and Bates, P. D.: Simulating historical flood events at the continental scale: observational validation of a large-scale hydrodynamic model, Nat. Hazards Earth Syst. Sci., 21, 559–575, https://doi.org/10.5194/nhess-21-559-2021, 2021.
Wolman, M. G. and Miller, J. P.: Magnitude and Frequency of Forces in Geomorphic Processes, J. Geol., 68, 54–74, 1960.
World Bank: Flood Hazards: Methodology Book, CHARIM: Caribbean Handbook on Disaster Risk Management, https://www.cdema.org/virtuallibrary/index.php/charim-hbook/methodology/3-flood-hazards/3-1-introduction (last access: 1 February 2024), 2015.
World Meteorological Organization: State of the Global Climate 2021: WMO Provisional Report, Geneva, https://digitallibrary.un.org/record/3949102 (last access: 1 February 2024), 2021.
Yamazaki, D., Ikeshima, D., Tawatari, R., Yamaguchi, T., O'Loughlin, F., Neal, J. C., Sampson, C. C., Kanae, S., and Bates, P. D.: A high-accuracy map of global terrain elevations, Geophys. Res. Lett., 44, 5844–5853, https://doi.org/10.1002/2017GL072874, 2017.
Yamazaki, D., Ikeshima, D., Sosa, J., Bates, P. D., Allen, G. H., and Pavelsky, T. M.: MERIT Hydro: A High-Resolution Global Hydrography Map Based on Latest Topography Dataset, Water Resour. Res., 55, 5053–5073, https://doi.org/10.1029/2019WR024873, 2019.
Yu, C., Hu, D., Di, Y., and Wang, Y.: Performance evaluation of IMERG precipitation products during typhoon Lekima (2019), J. Hydrol., 597, 126307, https://doi.org/10.1016/J.JHYDROL.2021.126307, 2021.
Zhou, G., Sun, Z., and Fu, S.: An efficient variant of the Priority-Flood algorithm for filling depressions in raster digital elevation models, Comput. Geosci., 90, 87–96, https://doi.org/10.1016/j.cageo.2016.02.021, 2016.
Zhu, L., Quiring, S. M., and Emanuel, K. A.: Estimating tropical cyclone precipitation risk in Texas, Geophys. Res. Lett., 40, 6225–6230, https://doi.org/10.1002/2013GL058284, 2013.