the Creative Commons Attribution 4.0 License.
the Creative Commons Attribution 4.0 License.
 | 17 Oct 2024
Transferability of machine-learning-based modeling frameworks across flood events for hindcasting maximum river water depths in coastal watersheds
Maryam Pakdehi
Ebrahim Ahmadisharaf
Behzad Nazari
Eunsaem Cho
Despite applications of machine learning (ML) models for predicting floods, their transferability for out-of-sample data has not been explored. This paper developed an ML-based model for hindcasting maximum river water depths during major events in coastal watersheds and evaluated its transferability across other events (out-of-sample). The model considered the spatial distribution of influential factors that explain the underlying physical processes to hindcast maximum river water depths. Our model evaluations in a six-digit hydrologic unity code (HUC6) watershed in the northeastern USA showed that the model satisfactorily hindcasted maximum water depths at 116 stream gauges during a major flood event, Hurricane Ida (R2 of 0.94). The pre-trained, validated model was successfully transferred to three other major flood events, hurricanes Isaias, Sandy, and Irene (R2>0.70). Our results showed that ML-based models can be transferable for hindcasting maximum river water depths across events when informed by the spatial distribution of pertinent features, their interactions, and underlying physical processes in coastal watersheds.
- Article
(6154 KB) - Full-text XML
-
Supplement
(420 KB) - BibTeX
- EndNote


Floods can damage civil infrastructure, business disruptions, and environmental degradation. Mitigation strategies are planned and implemented to mitigate this damage. To propose effective protection strategies, predictive models are used to evaluate watershed responses under various plausible flood scenarios (Fernández-Pato et al., 2016; Kundzewicz et al., 2019; Viglione et al., 2014). These models are essential tools to inform decision-makers about suitable risk management strategies and actions. Flood models can be broadly categorized as physically based, morphology-based, and data-driven.
Physically based models, widely used for predicting hydrologic events, are considered reliable tools for assessing different flood scenarios (Fernández-Pato et al., 2016). These models solve the shallow-water equations to derive flood characteristics. Developing physically based models requires certain meteorologic, hydrologic, and geomorphologic data. If these data are not available at the desired scale, such models cannot be developed. For instance, global inundation models are available to model flooding across the world, but they may not be efficient for small-scale applications. In such instances, data-driven models can be a flexible alternative as they can adapt to varying levels of data availability by focusing on the features with sufficient data. This flexibility remains one of the advantages of data-driven models over physically based models. Physically based models also need significant computational resources, especially in the case of high-resolution, multidimensional (2D and 3D), or stochastic models that necessitate numerous simulations. To enhance the speed of flood simulations, techniques such as parallel computing, graphics processing units (GPUs), and simplified models have been utilized (Costabile et al., 2017; Kalyanapu et al., 2011; Ming et al., 2020; Sridhar et al., 2021; Zahura et al., 2020). However, resources for utilizing these approaches are not always available (Zhang et al., 2014).
Morphology-based models, which approximate flat-water surfaces over small spatial scales, are also used for flood predictions (Bates, 2022). Bathtub (Anderson et al., 2018; Kulp and Strauss, 2019) and height above nearest drainage (HAND; Rennó et al., 2008) modeling are two widely used approaches in this modeling category. Jafarzadegan and Merwade (2019) used a probabilistic function based on HAND, computed from a digital elevation model (DEM), and optimized it for accuracy to delineate 100-year floodplains. Zheng et al. (2018) developed a synthetic rating curve using the HAND method, which represents river water depth measurements and is similar to hydraulic models or stream gauge readings. While these models are computationally efficient, they can overestimate flooded area and are limited to the number of features they use; these models rely on topographic data (Bates, 2022; Bates et al., 2005) and tend to work well only in confined valleys. The sole use of topographic data makes HAND-based models impractical for low-lying areas, especially coastal watersheds that experience a combination of hydrologic and oceanic processes (e.g., tidal influences, storm surges, and wave action); other flood-influencing factors, which represent such overlooked underlying physical processes, are also needed for predictions in such watersheds. Coastal regions also experience a combination of oceanic and hydrologic processes, which might not be fully represented by HAND. Both HAND-based and bathtub models are limited in representing such terrains as they might not fully capture the intricate interactions between oceanic and hydrologic factors in coastal areas. Consequently, in coastal watersheds, where unconfined floodplains and complex interactions are prevalent, alternative modeling approaches that consider a broader range of factors are crucial for producing reliable flood predictions. Incorporating these overlooked underlying physical processes becomes essential in providing comprehensive flood predictions in these intricate environments.
Machine learning (ML) and, in particular, deep learning (DL) models offer an alternative approach that can rapidly capture complex relationships between various influencing factors and flood characteristics. ML models have the potential to provide satisfactory flood predictions (Mishra et al., 2022). Such data-driven models have gained popularity due to their overcoming the limitations of physically based and morphology-based models in flood modeling (Khosravi et al., 2018). These models mathematically represent the nonlinearity of flood dynamics with pertinent features and observed flood data using complex nonlinear structures and algorithms. Data-driven models have been found as promising tools due to their quick development time and minimal input requirements (Guo et al., 2021; Löwe et al., 2021; Zahura et al., 2020). Example data-driven models for flood predictions include multiple linear regression, artificial neural network (ANN), random forest, support vector machine, and support vector regression models (Adamowski et al., 2011; Kim et al., 2016; Rafiei-Sardooi et al., 2021; Rahmati et al., 2016; Rezaie et al., 2022; Wang et al., 2015; Youssef et al., 2022). While there are several issues with these models, including interpretability, techniques such as SHapley Additive exPlanations (SHAP) can enhance understanding of these models' decision-making processes (Abdollahi and Pradhan, 2021; Lundberg and Lee, 2017). These models enable the identification of key features that drive flood characteristics.
Previous research has shown that various ML algorithms are effective in predicting flood extents and generating susceptibility maps, with a focus on classification ML models (Khosravi et al., 2018; Rahmati et al., 2016; Rezaie et al., 2022; Youssef et al., 2022). However, these studies have limitations in terms of their experimental design and scope. For instance, some of these studies created datasets of flooded and unflooded points using remote sensing. The datasets were often split into two subsets, and ML models were examined after being trained on a portion of the dataset (training set) and then tested for the remainder of the dataset (validation or test set). This approach helps in identifying the most effective models for flood predictions based on performance metrics, such as recall or the area under the receiver operating characteristic (ROC) curve. Another limitation of these ML studies is the reliance on a single event for training and validation. As such, it is unclear whether a trained and validated model can satisfactorily predict other flood events. These limitations call for studies that evaluate more complex methodologies and a broader range of scenarios to assess the effectiveness of ML algorithms for predicting flood characteristics.
Another application of ML models for flood inundation prediction has been coupling them with physically based models for improving their performance. Such applications are based on the hybrid use of ML and physically based modeling categories. For instance, Chang et al. (2022) suggested an approach that incorporated principal component analysis (PCA), self-organizing maps, and nonlinear autoregressive models with exogenous inputs to mine spatiotemporal data and forecast regional flood inundation. The authors recognized the value of using ML algorithms together with a 2D hydraulic model to simulate urban flood inundation considering different rainfall events. Elkhrachy (2022) developed a hybrid approach to predict flash flood depths combining 2D hydraulic modeling with ML algorithms; water depths simulated by the Hydrologic Engineering Center River Analysis System (HEC-RAS; Brunner, 2016) model served as training and test datasets for ML algorithms. Löwe et al. (2021) trained an ANN model to identify patterns in rainfall hyetographs and topographic data to enable fast predictions of flood depths for other rainfall events and locations (out-of-sample training data) complemented by 2D hydrodynamic simulations. Guo et al. (2021) used a convolutional neural network (CNN) model trained on flood simulation patch data from the CADDIES cellular-automata model to perform image-to-image translation for rapid urban flood prediction and risk assessment. To simulate maximum flood extent and depth, Hosseiny et al. (2020) created a system that combines a hydraulic model with ML algorithms. Zahura et al. (2020) used simulations from high-resolution 1D/2D physically based models as training and test data for a random forest model that included topographic and environmental characteristics to estimate hourly water depths. In these applications, flood depth, which is important for risk assessments and damage estimates (Merz et al., 2010), has been predicted by coupling physically based and ML models. These coupled modeling studies have demonstrated the complementary benefits of using physically based models along with ML algorithms in producing flood modeling outputs, but the computational expense is still an application barrier. Another significant challenge inherent in these studies lies in their dependence on hydraulic models for training purposes. Furthermore, there is a gap in demonstrating the ability of these studies to successfully predict flood characteristics beyond their training samples. For instance, no studies have explored the capability of ML models to predict events other than those utilized in their original training datasets (out-of-sample).
Despite previous efforts, the development of computationally efficient and user-friendly flood prediction models remains a challenge. ML-based models, although promising and computationally efficient, have not gained widespread acceptance among practitioners due to concerns about their reliance on predicting flood characteristics for other events (out-of-sample). Transferability is particularly crucial given the growing reliance on ML modeling methods, like ANNs, as suggested by Wenger and Olden (2012). The term “transferability” refers to the model's ability to predict different flood events beyond the scope of its training data, validating its applicability to unseen scenarios, potentially with their unique characteristics (Jiang et al., 2024; Wagenaar et al., 2018). Furthermore, there has yet to be research investigating the extent to which flood depth prediction models can be transferred and applied successfully to different events beyond the initial training settings. It, therefore, remains unclear whether an ML-based model, which is trained, validated, and tested against a historical event, performs satisfactorily in predicting flood characteristics of other events in the same watershed. Floods originate from various sources, and the flood characteristics depend on the unique characteristics of storm events. High-wind events tend to generate storm surges that move upstream, while intense rainfall over upstream watersheds leads to fluvial flooding that moves downstream towards the coast. Conversely, slow-moving storm systems can cause intense local rainfall, resulting in overland runoff entering rivers along their paths rather than a concentrated-upstream-inflow flood wave. Hence, it is crucial to avoid overfitting an ML model to a single historical flood event, as it can lead to significant underperformance in handling other events.
A further limitation of past research is the sole focus on predicting the greatest flood extents using classification-based algorithms, while the performance of regression-based ML models for predicting other important characteristics like flood depths has not been investigated. Additionally, the importance of spatial distribution of input features has been overlooked in past ML-based flood modeling. To hindcast a flood characteristic at a given location, the features have been incorporated at that location, but flooding is generated through contributions by several other factors that are relevant across the upstream contributing watershed (in inland systems) and/or the downstream coastline (in coastal systems).
This paper aims to fill the abovementioned research gaps by examining the performance and transferability of ML models in hindcasting maximum water depths across various events in a coastal watershed. Our objective is to develop a transferable, computationally efficient model to hindcast maximum water depths. We aim to evaluate the performance of ML models, which are trained and tested based on an event, and give insights into the application of the model for predicting maximum river flood depths for other events as well. Our study developed a modeling framework based on an ML algorithm, with multi-layer perceptron (MLP) architecture for our ANN model (ANN-MLP). This algorithm was coupled with feature selection methods and geospatial data. We evaluated the performance of this model against one extreme flood event, Hurricane Ida, across a coastal watershed (six-digit hydrologic unity code – HUC6) – the Lower Hudson – in the northeastern USA. Next, we assessed the transferability of our developed model across three other extreme events – hurricanes Isaias, Sandy, and Irene – in the same watershed. These events encompass various rainfall intensities, wind speeds, and storm track directions. Unlike past ML-based modeling studies, which have focused solely on predicting the flood status (flooded or unflooded), our regression-based model estimates maximum water depths. This model was also examined against multiple events, which is more than the single events that have been the focus of past research. The model also considered the spatial dimension for predicting maximum water depths at a given location, in which the features were represented either at that location or across the contributing watershed. This ML model is generic and can be applied to hindcast maximum water depths at non-gauge river sites to get a denser reconstruction of an event along the river network and hindcast water depths in watersheds with similar drainage areas (HUC6 or larger) and flood types (fluvial and coastal).
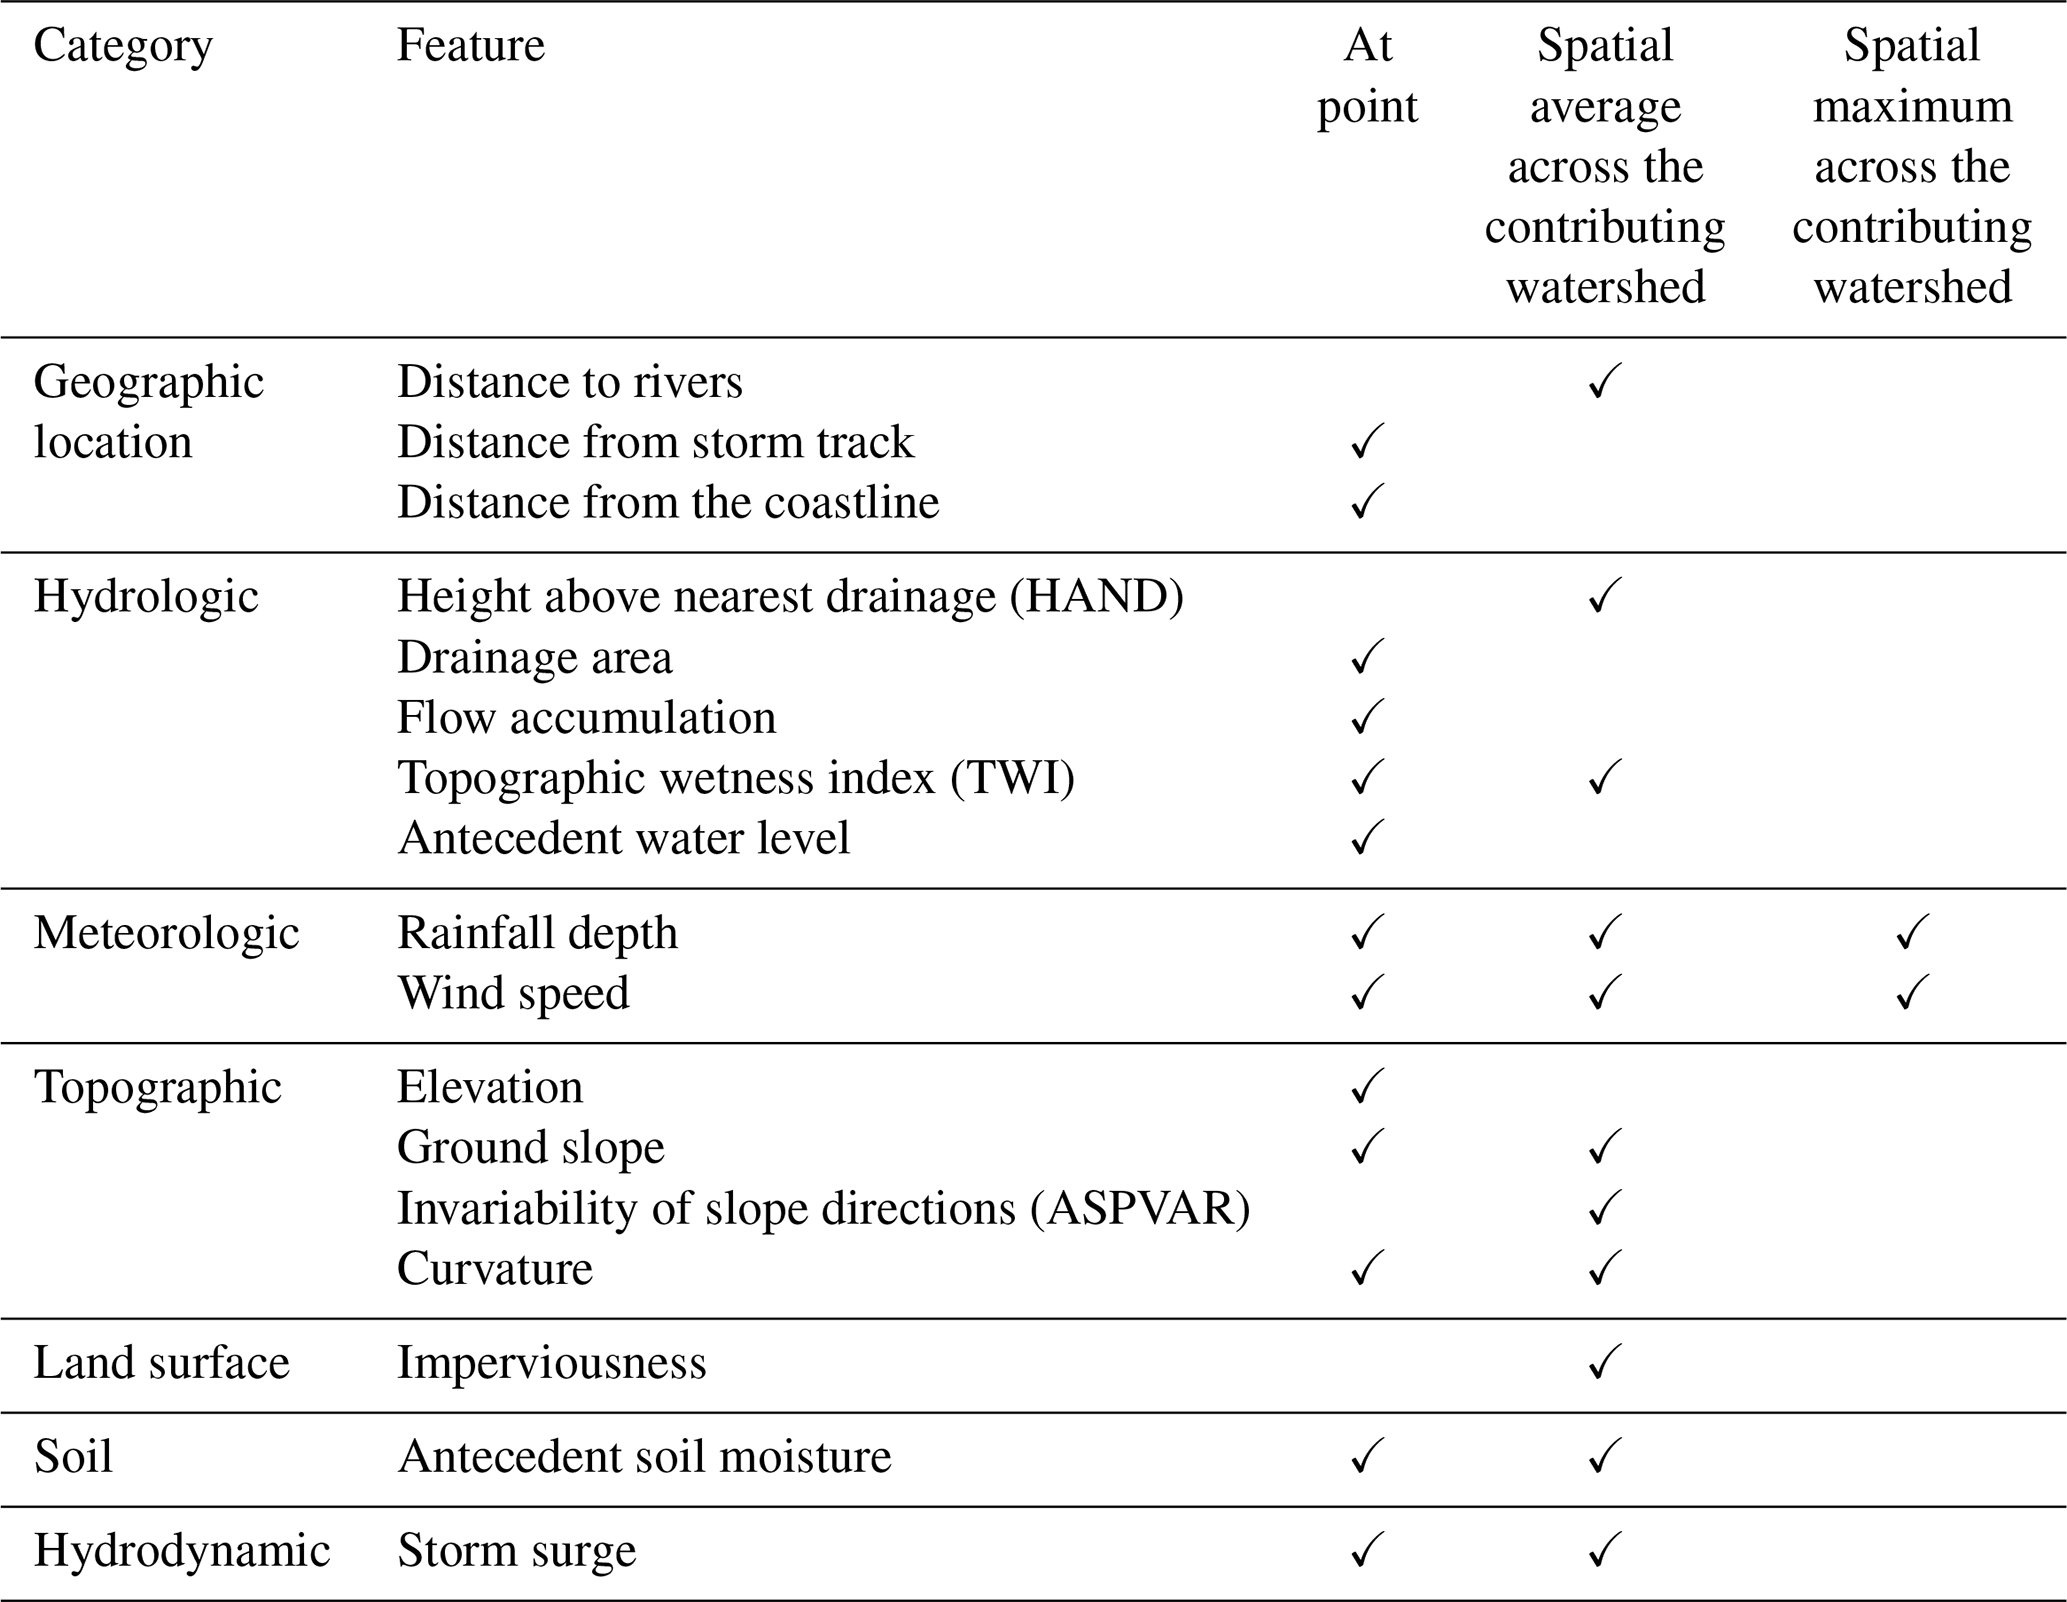
Table 1Machine learning model features and the assignment approaches for stream gauges.
We developed an ML-based model that hindcasts maximum water depths at stream gauges across a coastal watershed during a flood event (Fig. 1). A coastal watershed receives flood contributions from the inland and coastal systems (e.g., fluvial and tidal). The model uses geospatial analyses and ML algorithms to hindcast maximum water depths during an event at river cross-sections of a given watershed. This model is informed by the underlying physical flood processes represented by a wide array of features (topographic, meteorologic, hydrologic, land surface, soil, and hydrodynamic).
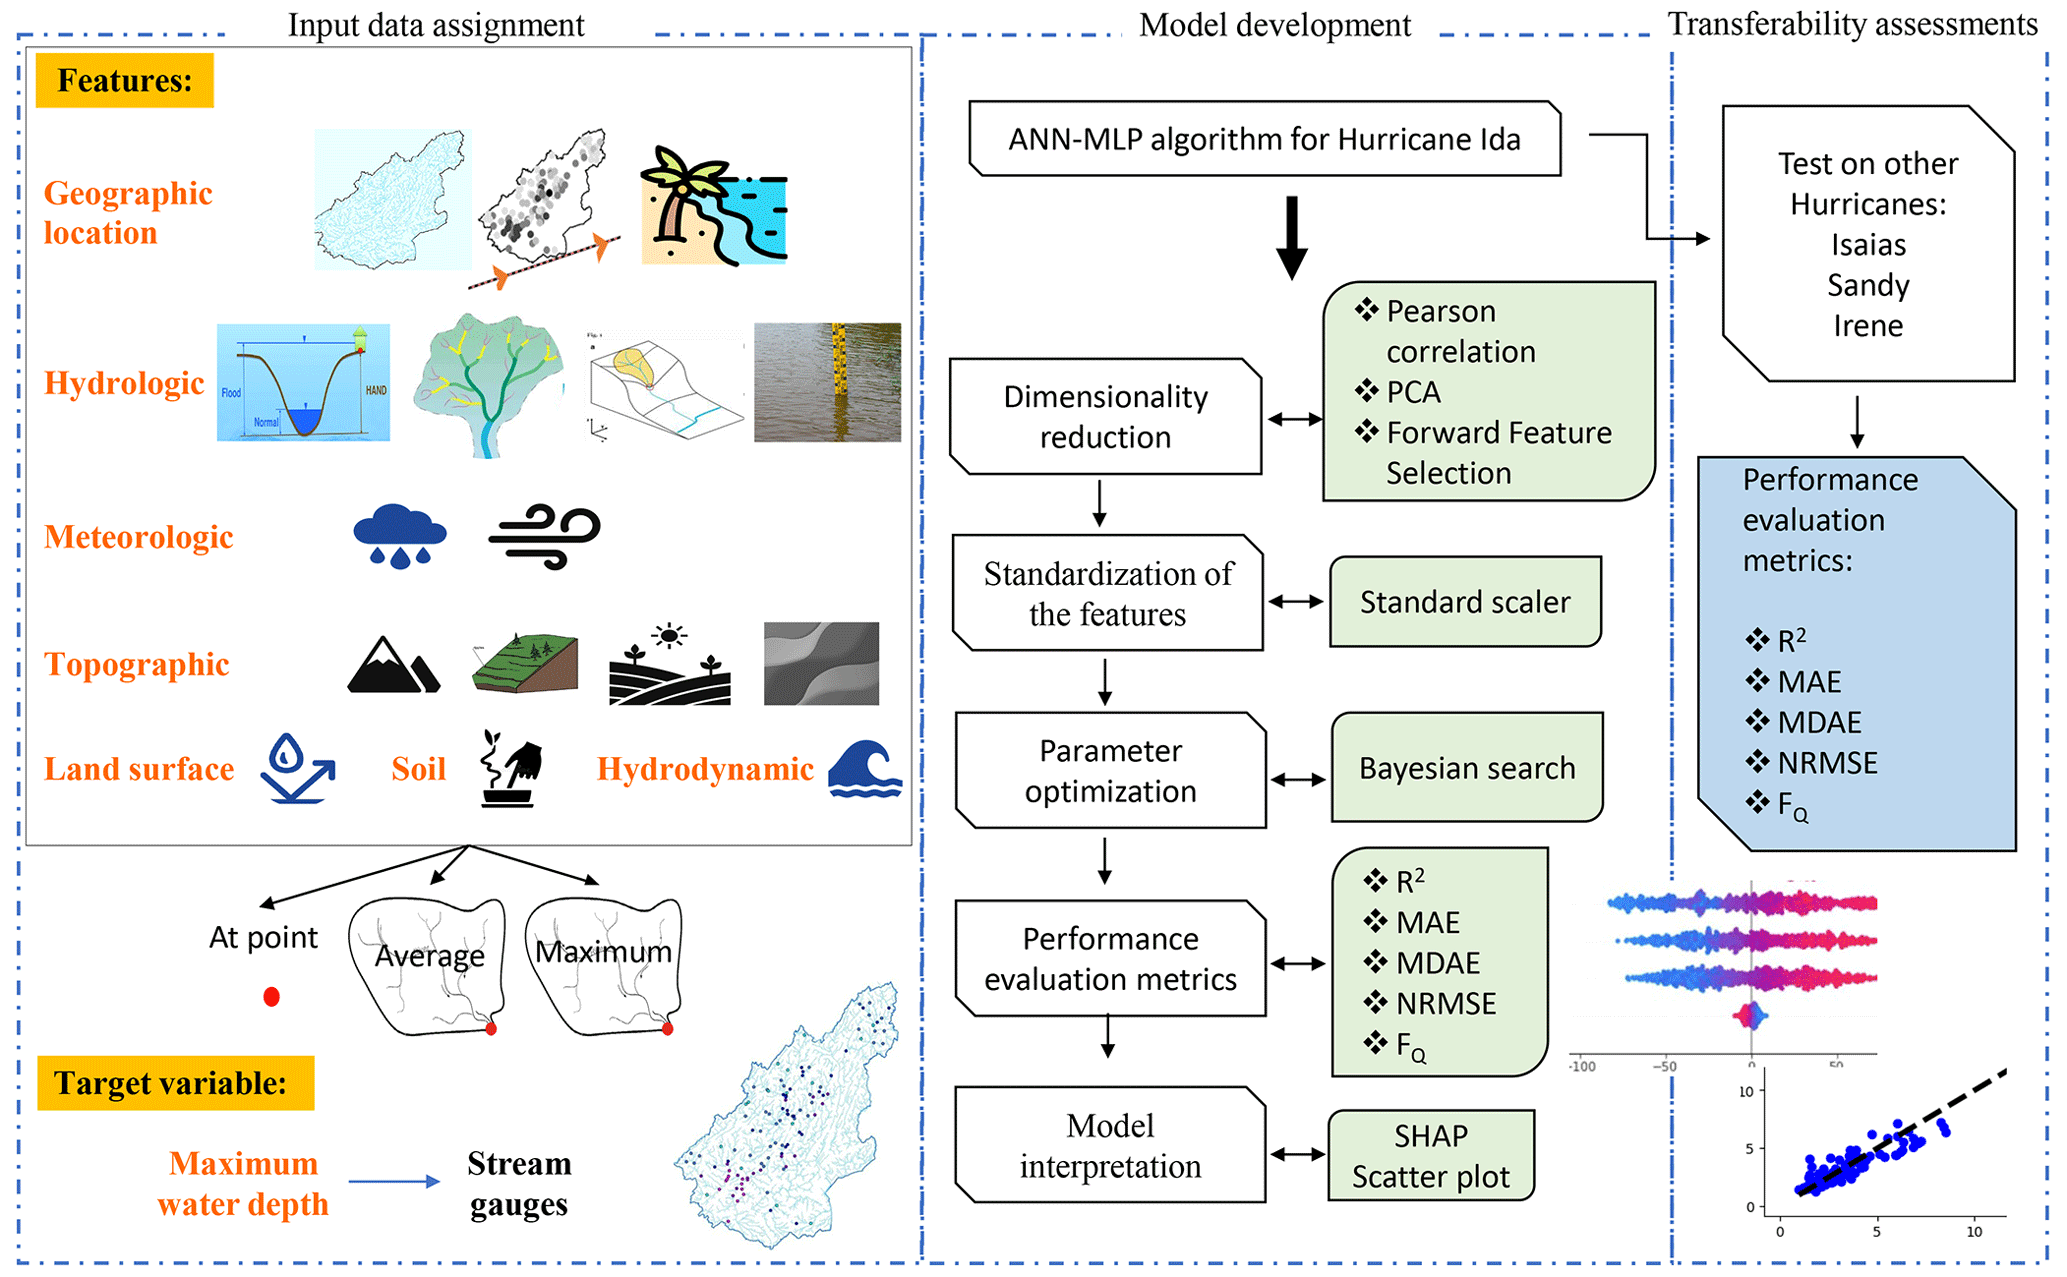
Figure 1Schematic view of the machine-learning-based (ML-based) model for hindcasting maximum water depths in coastal watersheds. PCA: principal component analysis; SHAP: SHapley Additive exPlanations; MAE: mean absolute error; MDAE: median absolute error; FQ: ratio of estimated to observed maximum flood depth.
Geospatial operations were conducted to compute the features at stream gauges and/or over their contributing watersheds (the upstream area that drains water to the gauge) considering the underlying physical processes. We used feature selection techniques to determine the most key features for our ML model. Applying observed data from stream gauges during a flood event, the model was trained, cross-validated, and tested. We then evaluated the model transferability by examining its performance in three other extreme flood events.
2.1 Selection and calculation of key features
To develop a transferable ML model for complex physical phenomena of flooding, the selection process should extend beyond merely choosing features based on their individual statistical significance. Instead, it should focus on identifying features that collectively contribute to a holistic representation of the phenomena. We selected key features for our ML-based flood model according to past research and the underlying physical processes. Our model considers these features from seven broad categories: geographic location, hydrologic, meteorologic, topographic, land surface, soil, and hydrodynamic (Table 1). Here, we provide information on how to derive the features to hindcast maximum water depths during a flood event in a coastal watershed. Aside from the soil category that represents pre-flood conditions (antecedent soil moisture), all other features represent conditions during a flood event.
By integrating all these factors into our methodology, we developed a flood hindcast model that considers key processes in coastal watersheds. We used a two-step process to assign feature values to a point located on a stream gauge. Depending on the feature, we assigned specified values to the gauge itself or its contributing watershed to consider the spatial dimension in flood generation processes. For the contributing watershed, the spatial mean and maximum across the contributing watershed of a given stream gauge were computed. This method ensures that the feature values indicate the overall pertinent physical processes occurring in the streams and upstream watersheds. Table 1 specifies how each feature was used in our model.
For features in the geographic location category, we incorporated distance to rivers – a critical factor in determining flood risks (Cao et al., 2020; Rafiei-Sardooi et al., 2021); storm track – specific to the flood event from the National Hurricane Center (2022); and distance to the nearest coastline. The proximity of a location to waterbodies, such as rivers or coastlines, directly influences its vulnerability to flooding. Coastal regions are susceptible to storm surges, which occur during tropical storms or hurricanes. Storm surges are massive walls of seawater that get pushed ashore by intense winds. Storm tracks are pathways in the atmosphere along which storms (e.g., hurricanes, tropical cyclones, or extratropical storms) tend to move. These storms often carry heavy rainfall, intense winds, and storm surges, which can lead to severe flooding in areas they pass over or affect. The distances to the storm track and coastline are both considered “point-based” as they are specific to individual locations. However, the distance to rivers is identical (zero) at these stream gauges but different in the contributing watersheds; we calculated the spatial average distance of the contributing watersheds to the rivers.
Under the hydrologic category, we employed four variables of HAND: drainage area, flow accumulation, topographic wetness index (TWI), and initial water depth. HAND represents the elevation of a location relative to the nearest stream. This feature is widely used in flood modeling due to its ability to hindcast flood-prone areas by considering topography and flow characteristics (Hu and Demir, 2021). As its value at the stream gauges is zero, its spatial average across the contributing watershed was considered. The drainage area provides information about potential runoff, while the flow accumulation feature helps predict flow paths during flood events and was previously used by Löwe et al. (2021) and Pham et al. (2021). Both drainage area and flow accumulation values at the point of stream gauges (point-based) were captured. TWI was used by Gudiyangada Nachappa et al. (2020), Löwe et al. (2021), Pham et al. (2021), Zahura et al. (2020), and Zhao et al. (2020) and was calculated using Eq. (1) (Beven and Kirkby, 1979).
where α is the slope of the contributing watershed per unit contour length (known as the specific catchment area) and β is the local slope gradient in radians. The TWI value was considered both point-based and in terms of the spatial average across the contributing watershed to represent the specific location and the overall characteristics of the contributing watershed. The last feature in this category was initial water depth, which refers to the stream gauge height 1 d before the event; this feature was considered point-based and explains initial conditions in the study rivers.
The meteorologic category features were precipitation (Rafiei-Sardooi et al., 2021) and wind speed. Rainfall is the main driving force for floods (Mishra et al., 2022). Storms can bring intense and prolonged precipitation to certain areas. If a storm passes over or near a location, it can result in excessive precipitation, overwhelming local drainage systems and causing flooding in low-lying or poorly drained areas. Wind speed is another feature that can influence the severity and extent of flooding, especially during hurricanes. Intense winds during storms and hurricanes generate large and powerful waves in the ocean. These waves can exacerbate the impact of storm surges, causing even more coastal flooding as they crash onto the shore and flood areas even farther inland. We obtained daily precipitation and wind speed data for the entire period of the flood event from weather stations of the National Oceanic and Atmospheric Administration's National Centers for Environmental Information (NOAA's NCEI, 2022). Their maximum values over a flood event were computed at each stream gauge. Using point-based precipitation and wind speed data, we then created a spatially distributed rainfall and wind speed dataset by interpolating the maximum values using the inverse distance weighting (IDW) method (Hosseini et al., 2020). Rainfall depth and wind speed are considered point-based, but they are also represented in terms of the spatial average and maximum across the contributing watershed. These values capture the intensity of the meteorologic conditions at individual points and the overall average and maximum values across the upstream watershed.
Elevation, ground slope, slope aspect, aspect invariability (ASPVAR), and curvature were features under the topographic category (Cao et al., 2020; Chen et al., 2023; Huang et al., 2022; Khosravi et al., 2018; Rafiei-Sardooi et al., 2021; Sun et al., 2020; Fereshtehpour et al., 2024). A DEM with a resolution of arcsec (∼10 m) was acquired from the United States Geological Survey (USGS, 2022) National Elevation Dataset (NED). To remove any spurious depressions, the DEM sinks were filled to account for artificial depressions that can impede the realistic simulation of water flow, ensuring that the derived water pathways and other hydrologic computations reflect true surface conditions (Khosravi et al., 2018; Zhu et al., 2013). Elevation, ground slope, slope aspect, invariability of slope directions (ASPVAR), and curvature were all derived from the DEM. Elevation allows us to identify low-lying regions prone to floods and hindcast the maximum water depths. Ground slope is a key factor in driving water movement. The ground slope plays a crucial role in determining the direction and velocity at which water flows across the landscape. On sloped terrains, water flows along the path of least resistance. The slope angle determines the speed and volume of surface runoff, influencing the potential for flooding. The slope aspect provides insights into the surface runoff distribution and flow accumulation by indicating the direction of the ground slope that affects hydrologic processes (Gudiyangada Nachappa et al., 2020; Rafiei-Sardooi et al., 2021). Similarly to Gudiyangada Nachappa et al. (2020), we divided the slope aspect into 10 categories: north (0–22.5°; 337.5–360°), northeast (22.5–67.5°), east (67.5–112.5°), southeast (112.5–157.5°), south (157.5–202.5°), southwest (202.5–247.5°), west (247.5–292.5°), northwest (292.5–337.5°), and flat (0°). ASPVAR values near zero indicate diverse watershed slope aspects, while values approaching 1.0 imply a dominant direction (Wan Jaafar and Han, 2012). This feature provided information about surface runoff distribution and flow concentration by specifying the direction that water would flow across the terrain (Dawson et al., 2006). Additionally, analyzing the curvature helped us understand how it impacts flood events (Khosravi et al., 2018). Elevation was considered point-based, while ground slope and curvature were considered both point-based and in terms of the spatial average across the contributing watershed. ASPVAR conceptually represents the spatial average across the contributing watershed.
The land surface category was represented by only one variable, imperviousness. The greater the imperviousness, the larger the volume of surface runoff. Impervious surfaces increase both the volume and the velocity of runoff due to their high surface smoothness and low friction to resist water movement. This rapid flow of water can overwhelm natural waterways, increasing the risk of flooding. We used the spatial average of imperviousness across the contributing watershed in our model.
The soil category included antecedent soil moisture, which reflects the pre-storm saturation extent, essential for runoff estimates and high moisture flux production from rain-bearing systems (Ahmadisharaf et al., 2018; Jafarzadegan et al., 2023; Karamouz et al., 2022; Mishra et al., 2022). Soil moisture was calculated 1 d before the storm and considered both point-based (local soil moisture adjacent to the stream gauge) and in terms of the spatial average across the contributing watershed. This feature explains initial conditions in the study watershed.
In the hydrodynamic category, we used the storm surge from tidal gauges on the coast (NOAA, 2023). The storm surge was estimated as the difference between the maximum water depth and the astronomical tide during a flood event. This feature is crucial in hindcasting coastal contributions to flood events. If the flood event does not receive any coastal contributions, this category can be removed from the list of model features. It is considered both point-based and in terms of the spatial average across the contributing watershed.
Feature selection method
We employed multiple feature selection methods: Pearson's correlation coefficients (Cao et al., 2020; Chen et al., 2023; Lee et al., 2020) and PCA – a widely used technique in many ML modeling studies (Abdrabo et al., 2023; Chang et al., 2022; Reckien, 2018) – and forward feature selection, which accounts for interactions among the model features. We applied a step-by-step approach to utilize these three techniques.
First, Pearson's correlation coefficients were used to assess the linear relationships among the features and target variable. The strength and direction of linear relationships were evaluated using Pearson's correlation coefficients. These analyses enabled us to narrow down the initial list of the features.
Next, PCA was applied to the features retained after Pearson's correlation analysis. In the PCA method, the contribution of each feature to the overall variance is quantified by examining the eigenvalues associated with each principal component (Abdrabo et al., 2023). Compared to Pearson's linear correlation, PCA can reveal underlying patterns or structures in the data that are not immediately apparent. PCA allows us to understand how much variance each principal component considers in the dataset, providing a clear measure of feature significance in terms of explaining the data variance. By aggregating the absolute values across all features, we obtained the importance for each feature, which enabled us to rank them in a descending order and omit the least important features.
Last, the forward selection method was applied to the features retained. This method then incrementally added variables, weighing both their individual impact and their interactions, enhancing the model predictive performance by focusing on features with substantial influence on flood depths (Horel and Giesecke, 2019; Macedo et al., 2019). This method adds variables to a model based on their predictive power. This iterative process starts with no variables and includes the most predictive one at each step, considering both its individual impact and its interactions with already-included variables. This selection continues until adding more features does not significantly enhance the model performance metric in terms of the Akaike information criterion.
2.2 Machine learning (ML) models
2.2.1 Artificial neural networks (ANNs)
To hindcast flood depth, our target variable, we employed an ANN with MLP architecture. This algorithm was trained via observed maximum water depths from stream gauges using the key features selected through our feature selection (Sect. 2.1). The choice of ANN was based on previous successful applications in flood depth modeling (e.g., Dawson et al., 2006; Abrahart et al., 2004; Bafitlhile and Li, 2019; Berkhahn et al., 2019; Rumelhart et al., 1986; Zhu et al., 2023). One of the strengths of using ANNs in modeling tasks like flood predictions is their notable flexibility and capability to approximate complex nonlinear relationships, potentially enhancing their performance for unseen data. It is essential, however, to acknowledge that the capacity to generalize depends on selecting relevant features that explain the underlying physical processes and the spatiotemporal variability, model selection, parameterization, and training the model. ANNs are designed to simulate the behavior of biological systems composed of “neurons”. These algorithms composed of nodes, or “artificial neurons”, are connected and operate in parallel. Each connection is assigned a weight that represents its relative importance. During the learning phase, the network learns by adjusting these weights based on the input data it is processing (McCulloch and Pitts, 1943). Here, the ANN was implemented using Python's Keras library with TensorFlow backend.
2.2.2 Machine learning (ML) model pre-processing and implementation
The observed water depths and features were split into training and testing sets, with 70 % to 90 % of the data used for training and 10 % to 30 % for testing as suggested by Joseph (2022) and Nguyen et al. (2021). After exploring various splits within the 70 % to 90 % range for training data, the 90 % allocation for training (104 out of 116 stream gauges) was determined to be optimal for our specific dataset and model based on preliminary testing, the model complexity, and the desire to maximize the number of data used for training while still retaining satisfactory results for the test phase (12 out of 116 stream gauges). While the train percent (90 %) seems high and suggests potential for model overfitting, this same model was the most successful in the transferability across three other flood events (out-of-sample). The allocation of 10 % of the data for testing serves to provide an unbiased appraisal of the model generalization performance after training and hyperparameter optimization. This evaluation process, complemented by methodologies such as cross-validation and hyperparameter optimization, is structured to identify a model configuration that is likely to perform well across unseen data. This approach aims to ensure that the final model, selected based on its performance on the validation set during hyperparameter optimization, is tested on entirely unseen data to confirm its generalization ability. In preparing our dataset for the neural network model, numerical features were standardized to have a mean value of zero and a standard deviation of 1. This scaling process ensured that each feature contributes proportionately to the model predictions, mitigating the potential bias towards variables with larger scales.
Hyperparameter optimization is a step in improving the performance of ML models. This process involves identifying the optimal hyperparameter values. We used Bayesian search to perform hyperparameter optimization. Cross-validation, particularly through methodologies like the prediction sum of squares criterion for predictor selection and for parameter estimation and predictive error assessment, has been foundational in improving predictive models. This approach distinguishes between model selection and assessment (Allen, 1974; Geisser, 1975; Stone, 1974). Cross-validation was performed using a 5-fold cross-validation strategy during the hyperparameter optimization process. Opting for 5-fold cross-validation over hold-out validation in our hyperparameter optimization process reflects a balance between comprehensive model evaluation and computational efficiency. The hyperparameters we optimized here included the number of layers, units, activation functions, optimizer, regularization rate, batch size, and epochs. Bayesian search offered a targeted search based on probabilistic modeling, iteratively refining the search area based on past evaluations to efficiently select the most promising hyperparameter sets. The selection of the optimal hyperparameters was guided by minimizing the cross-validation mean square error (MSE), ensuring the chosen configuration significantly improved the model predictive performance for maximum water depths. The ANN-MLP model was trained using the training data and the best hyperparameters obtained from the optimization process.
To prevent overfitting, we used early stopping and model checkpointing during the model training. Early stopping was implemented to stop training when the validation loss stopped improving, and model checkpointing was used to save the model with the lowest validation loss. The strategy involved splitting the training data into five subsets and training the model five times, each time using a different subset as the validation set. This evaluation process, complemented by methodologies such as cross-validation and hyperparameter optimization, is structured to identify a model configuration that is most likely to perform well across unseen data.
2.2.3 Model performance evaluation
The performance of the ANN-MLP model was evaluated using the coefficient of determination (R2), mean absolute error (MAE), normalized root mean square error (NRMSE), median absolute error (MDAE), and ratio of the estimated to the observed maximum flood depth (FQ; Schubert and Sanders, 2012). The R2 metric measures the proportion of variance in the dependent variable predictable from the independent variables. The MAE measures the average magnitude of the errors in a set of estimations without considering their direction (i.e., overestimation or underestimation). The NRMSE is a metric that quantifies the normalized average magnitude of the prediction error. It assesses the relative size of the root mean square error (RMSE) by considering the RMSE in relation to the average value of the observations. It is commonly used in regression analyses, and a smaller NRMSE value indicates a higher level of agreement between the estimated values and the actual observations (Ahmadisharaf et al., 2019; Stow et al., 2003). The MDAE is a metric that measures the median of the absolute differences between predicted values and actual (observed) values. Unlike the MAE, which averages these differences out, the MDAE focuses on the midpoint of these differences, making it less sensitive to the outliers. This characteristic can make the median error a more robust metric in the regional water depth estimation where the data contain significant outliers. It is a common metric used in ML models such as those used in Sheridan et al. (2019), Dixit et al. (2022), and Park et al. (2020). These metrics were calculated for both training and testing datasets to assess the model performance.
2.2.4 Model explainability
To interpret the model and explore the contribution of each feature to the estimation, we used the SHAP technique, which is a game-theoretic approach to explain the output of an ML model (Lundberg and Lee, 2017). It connects optimal credit allocation with local explanations using the classic Shapley values from game theory and their related extensions. The SHAP values interpret the impact of having a certain value for a given feature in comparison with the estimations we would make if that feature took some baseline value (Abdollahi and Pradhan, 2021). In other words, SHAP estimates how much each feature contributes to the model prediction output for a particular instance. The SHAP results regarding the feature importance and their impacts on the model prediction can be presented using a plot to visually show the distribution of impacts of each feature on the model output. A positive SHAP value indicates that the feature's presence increases the model output, while a negative SHAP value indicates that it decreases the model output. Further, we visually evaluated the performance of our model in terms of bias (overestimation and underestimation) using scatterplots.
2.3 Model transferability across flood events
The ML-based model, which was initially developed, trained, and validated based on one flood event, was subsequently examined as is (with no additional parameter tuning) against other events in terms of the performance and generalizability in hindcasting maximum water depths. By examining our model against different flood events, we aimed to evaluate its effectiveness in hindcasting maximum water depths across diverse events. This evaluation allowed us to assess the ML model ability to handle varying flood conditions and its potential for application in different events in the same watershed.
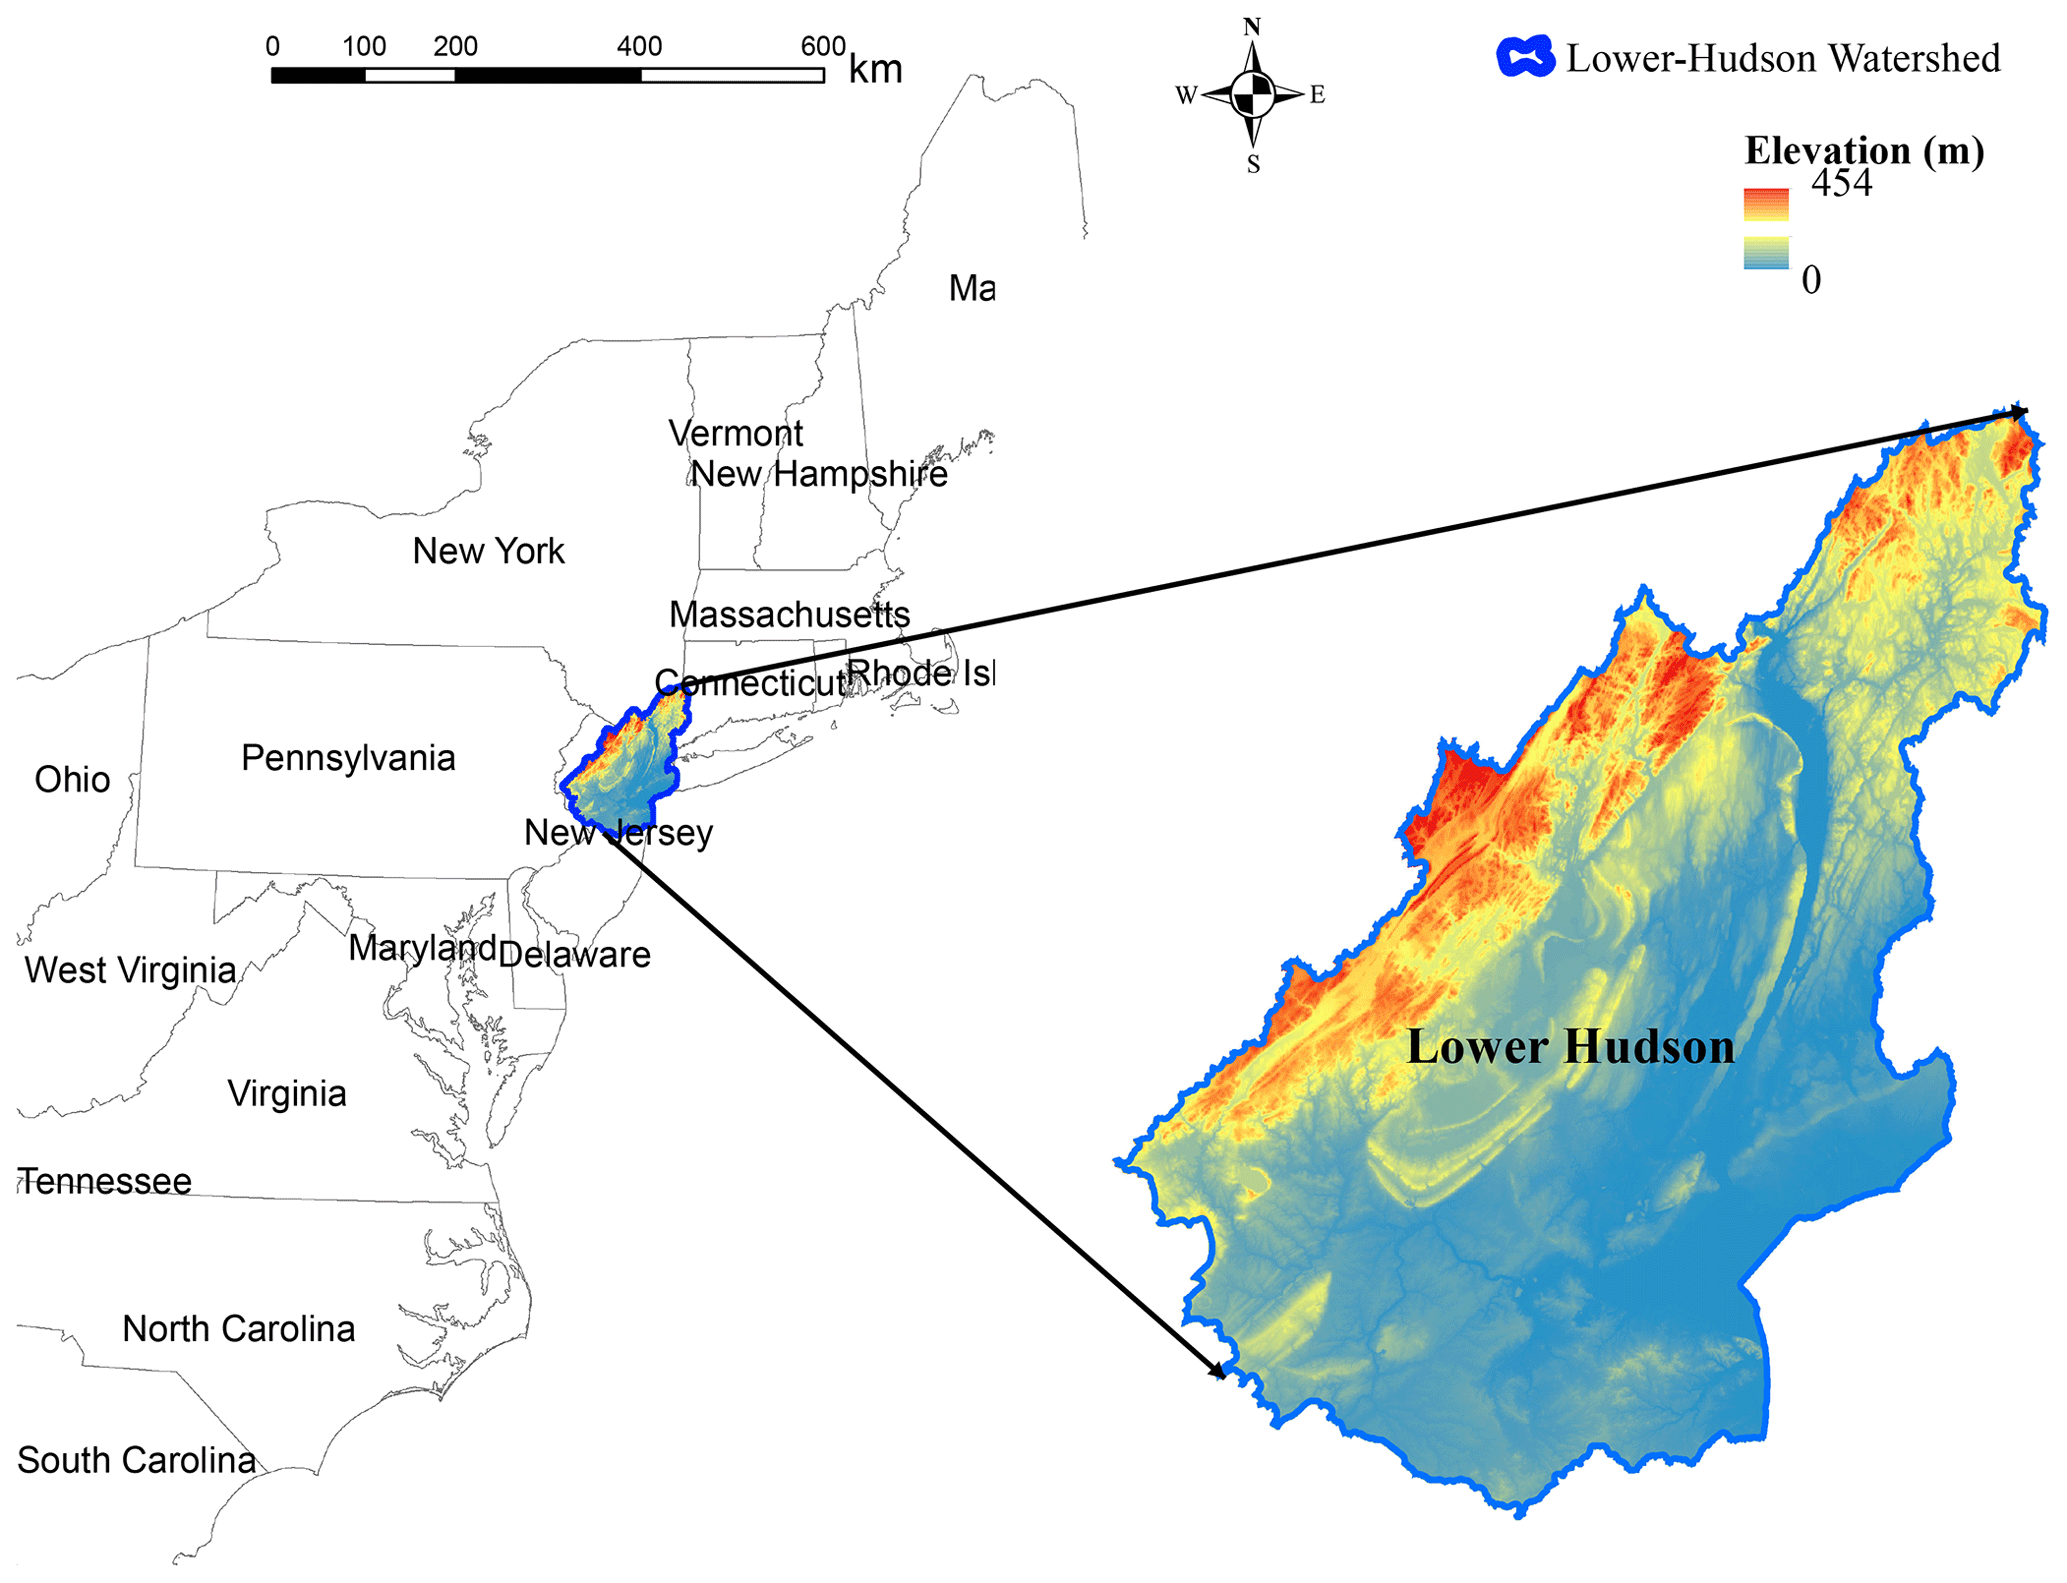
Figure 2Lower Hudson River watershed.
The study area is a HUC6 watershed, the Lower Hudson watershed (HUC 020301). The 10 068 km2 watershed is in the northeastern United States (Fig. 2), spanning parts of three states: Connecticut, New Jersey, and New York. This watershed has a humid subtropical climate with hot summers and mild winters. The highest elevation is ∼450 m a.m.s.l. (above mean sea level). Residential, agricultural, and forest are the dominant land uses in the watershed according to the 2021 National Land Cover Database (NLCD) (USGS, 2022). Large metropolitan areas like New York are in the study watershed. Several major rivers drain into the watershed, including the Hudson River, which flows for 496 km (about the length of New York State). The ground slope varies from 87.5 % in the mountainous parts to near zero in the coastal parts.
We studied four major flood events in the study area. The primary event for model development was Hurricane Ida in 2021, while three other hurricanes – Isaias (2020), Sandy (2012), and Irene (2011) – were used to assess the model transferability. Hurricane Ida, a devastating Atlantic Category 4 hurricane that made landfall in September 2021, hit Louisiana and progressed towards the northeastern United States. The hurricane caused considerable floods and significantly impacted both the West South Central region, including New Orleans, and the northeastern region, with severe damage reported in New York City and Philadelphia (Beven et al., 2022; Wang et al., 2022). The storm remnants sent record-breaking rainfall to the New York region as they headed northeast, resulting in flash flooding (Beven et al., 2022). The extensive flooding and severe property destruction caused by Hurricane Ida's record-breaking rains highlighted the importance of comprehending the hurricane effects on affected areas. Furthermore, strengthening regional resilience to catastrophic flooding episodes requires the development of effective mitigation strategies. The three other events, which were used to evaluate the model transferability, were also major recent hurricanes after 2000, with available streamflow data and differing tracks and intensities. In 2020, Hurricane Isaias, a Category 1 hurricane, made a quick trip along the East Coast, bringing with it severe rain and floods, especially in the Mid-Atlantic and northeast. The storm's rapid passage caused several deaths and extensive power losses (Latto et al., 2021). In 2012, Superstorm Sandy, commonly known as Hurricane Sandy, struck the northeast and caused severe damage. It produced significant flooding due to the intense storm surge and torrential rains, especially in New York and New Jersey, where the storm surge reached record heights (Blake et al., 2013). In 2011, a huge and catastrophic storm named Hurricane Irene affected a major portion of the Eastern Seaboard. Heavy rains from the storm caused significant flooding, especially in Vermont, where it was the worst flooding in over a century for that state (Avila and Cangialosi, 2013).
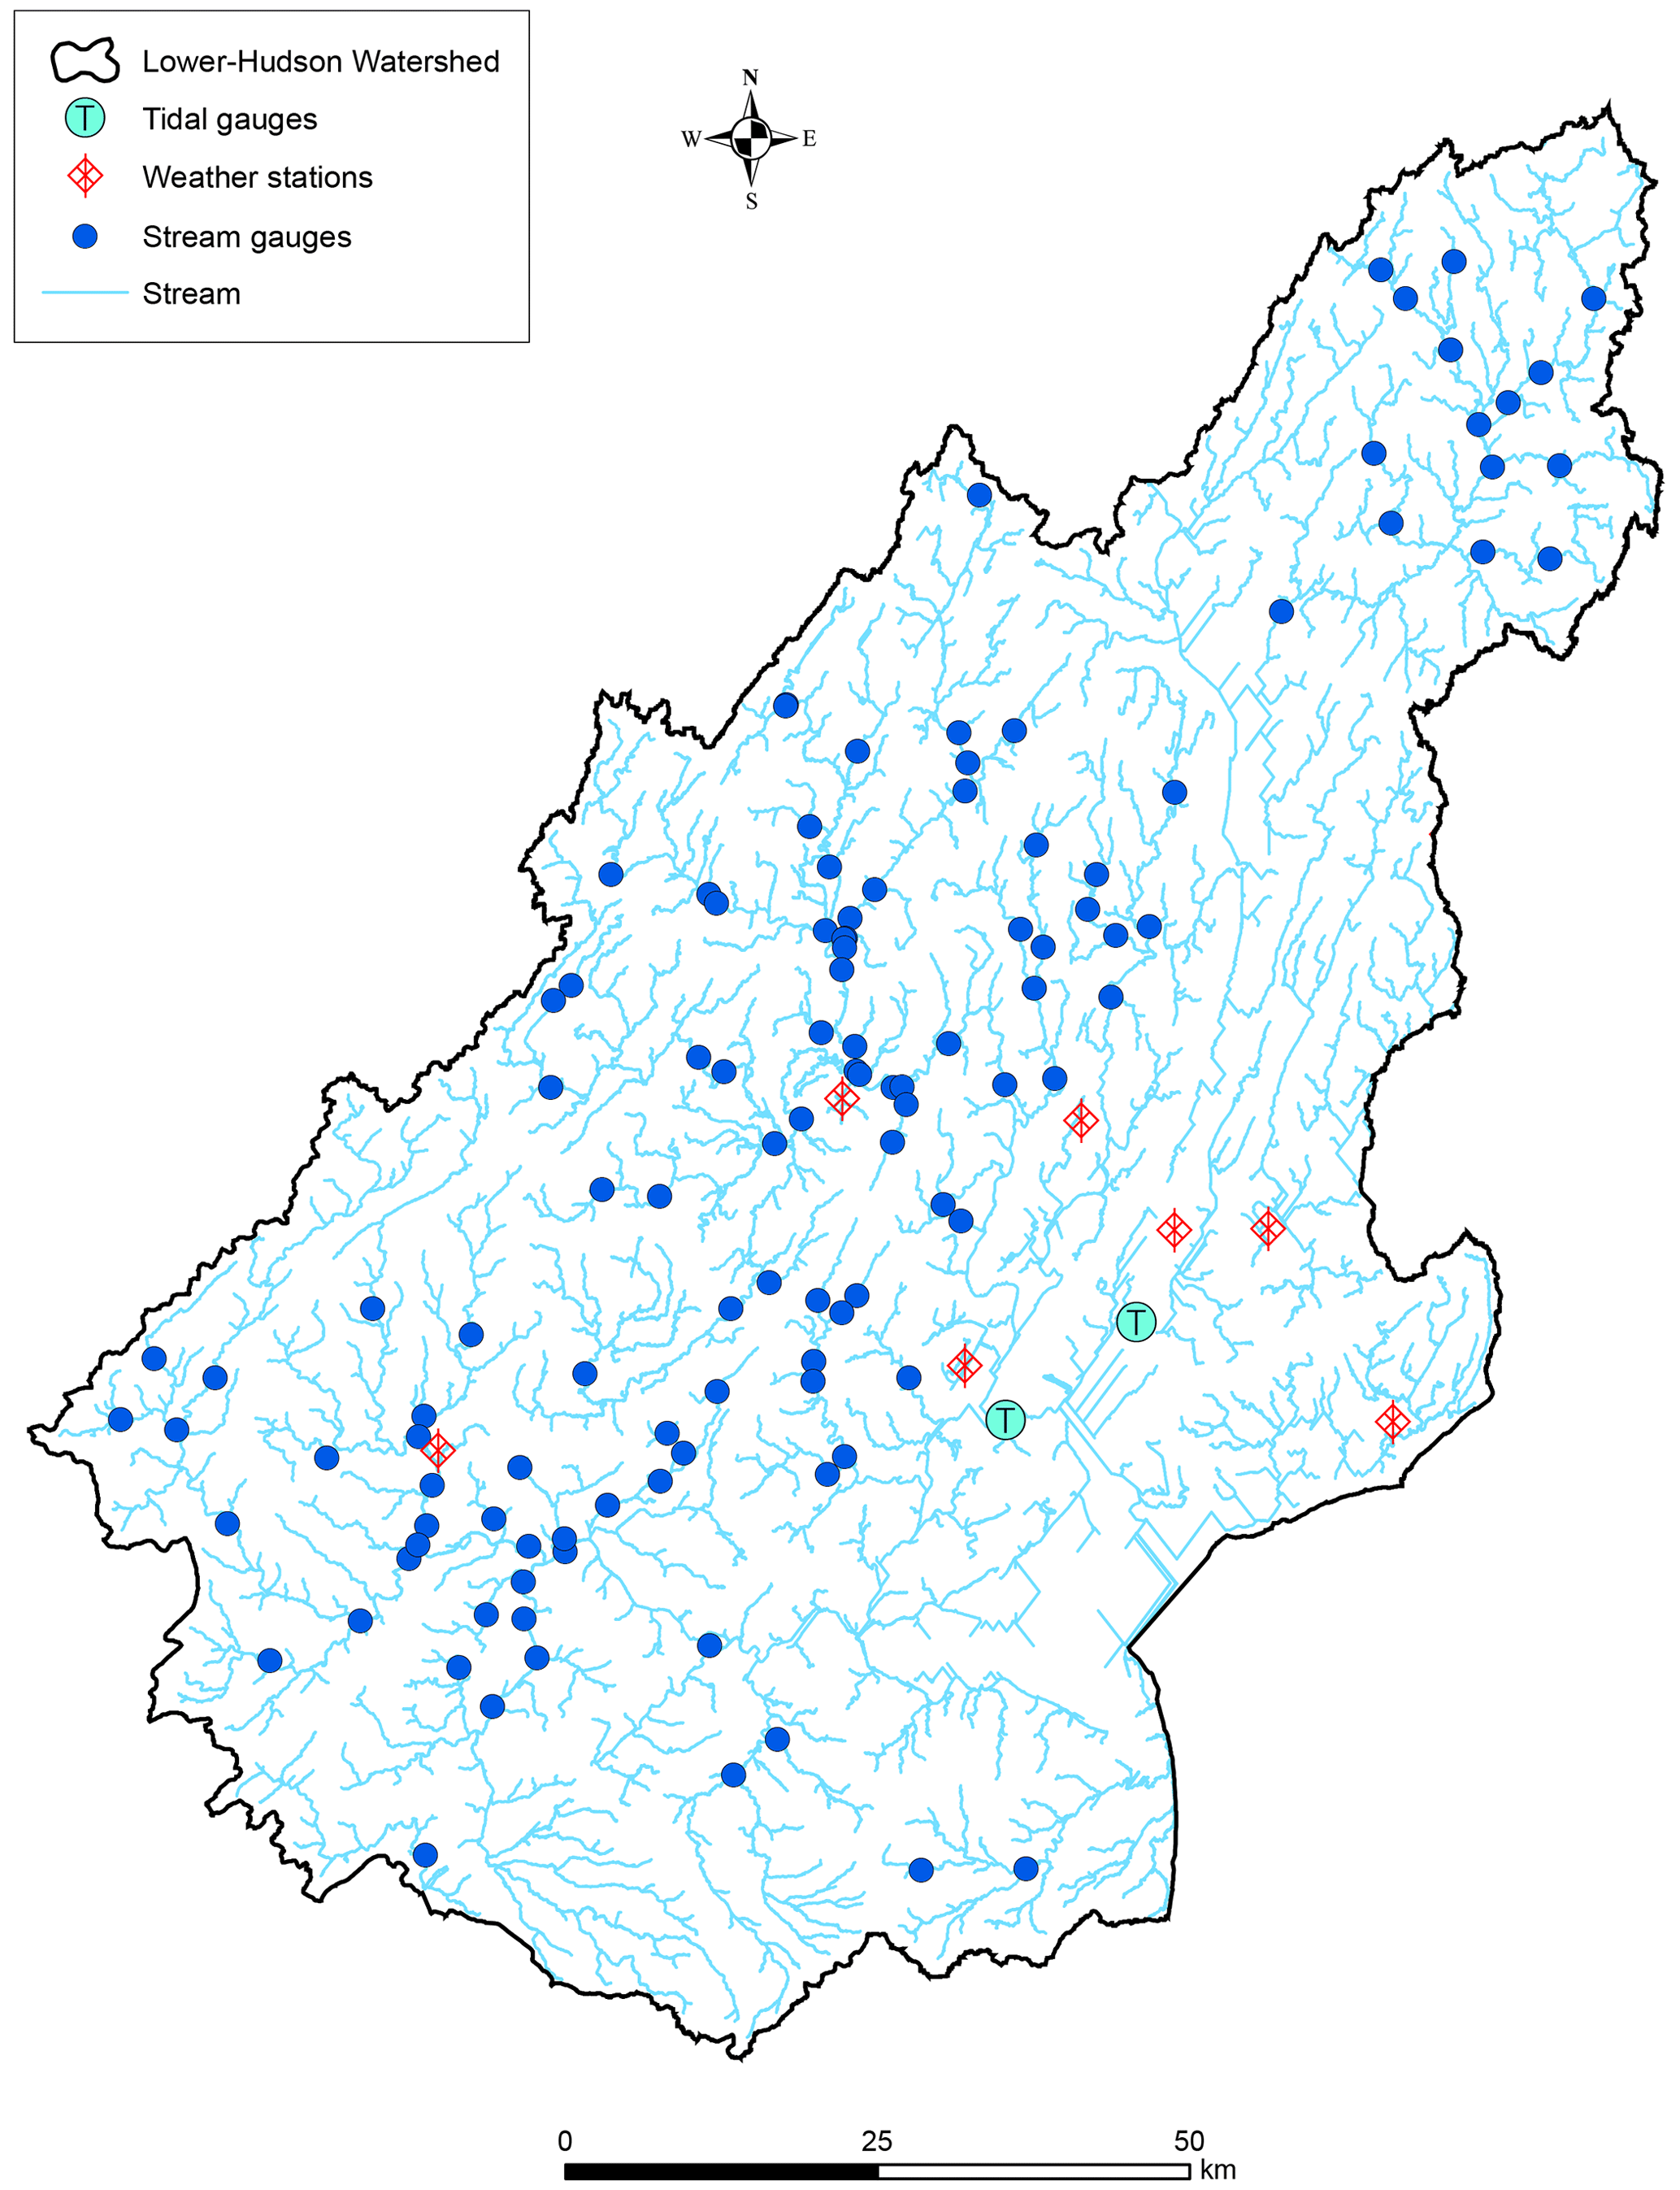
Figure 3Stream and tidal gauges and weather stations in the study watershed.
3.1 Data collection
Table 2 lists the data used for the study area alongside their sources and spatiotemporal resolutions. We acquired instantaneous stream gauge height data from USGS's National Water Information System to analyze water depths during the four flood events. While the features' data had different spatial resolutions, we did not make them consistent because only at-point (stream gauges) or aggregated spatial statistics of contributing watersheds were used in the ML model; no combinations of the features were needed.
Table 2Model features and data sources and resolutions in the study area. NHDPlus: National Hydrography Dataset Plus; NED: National Elevation Dataset; NWIS: National Water Information System.
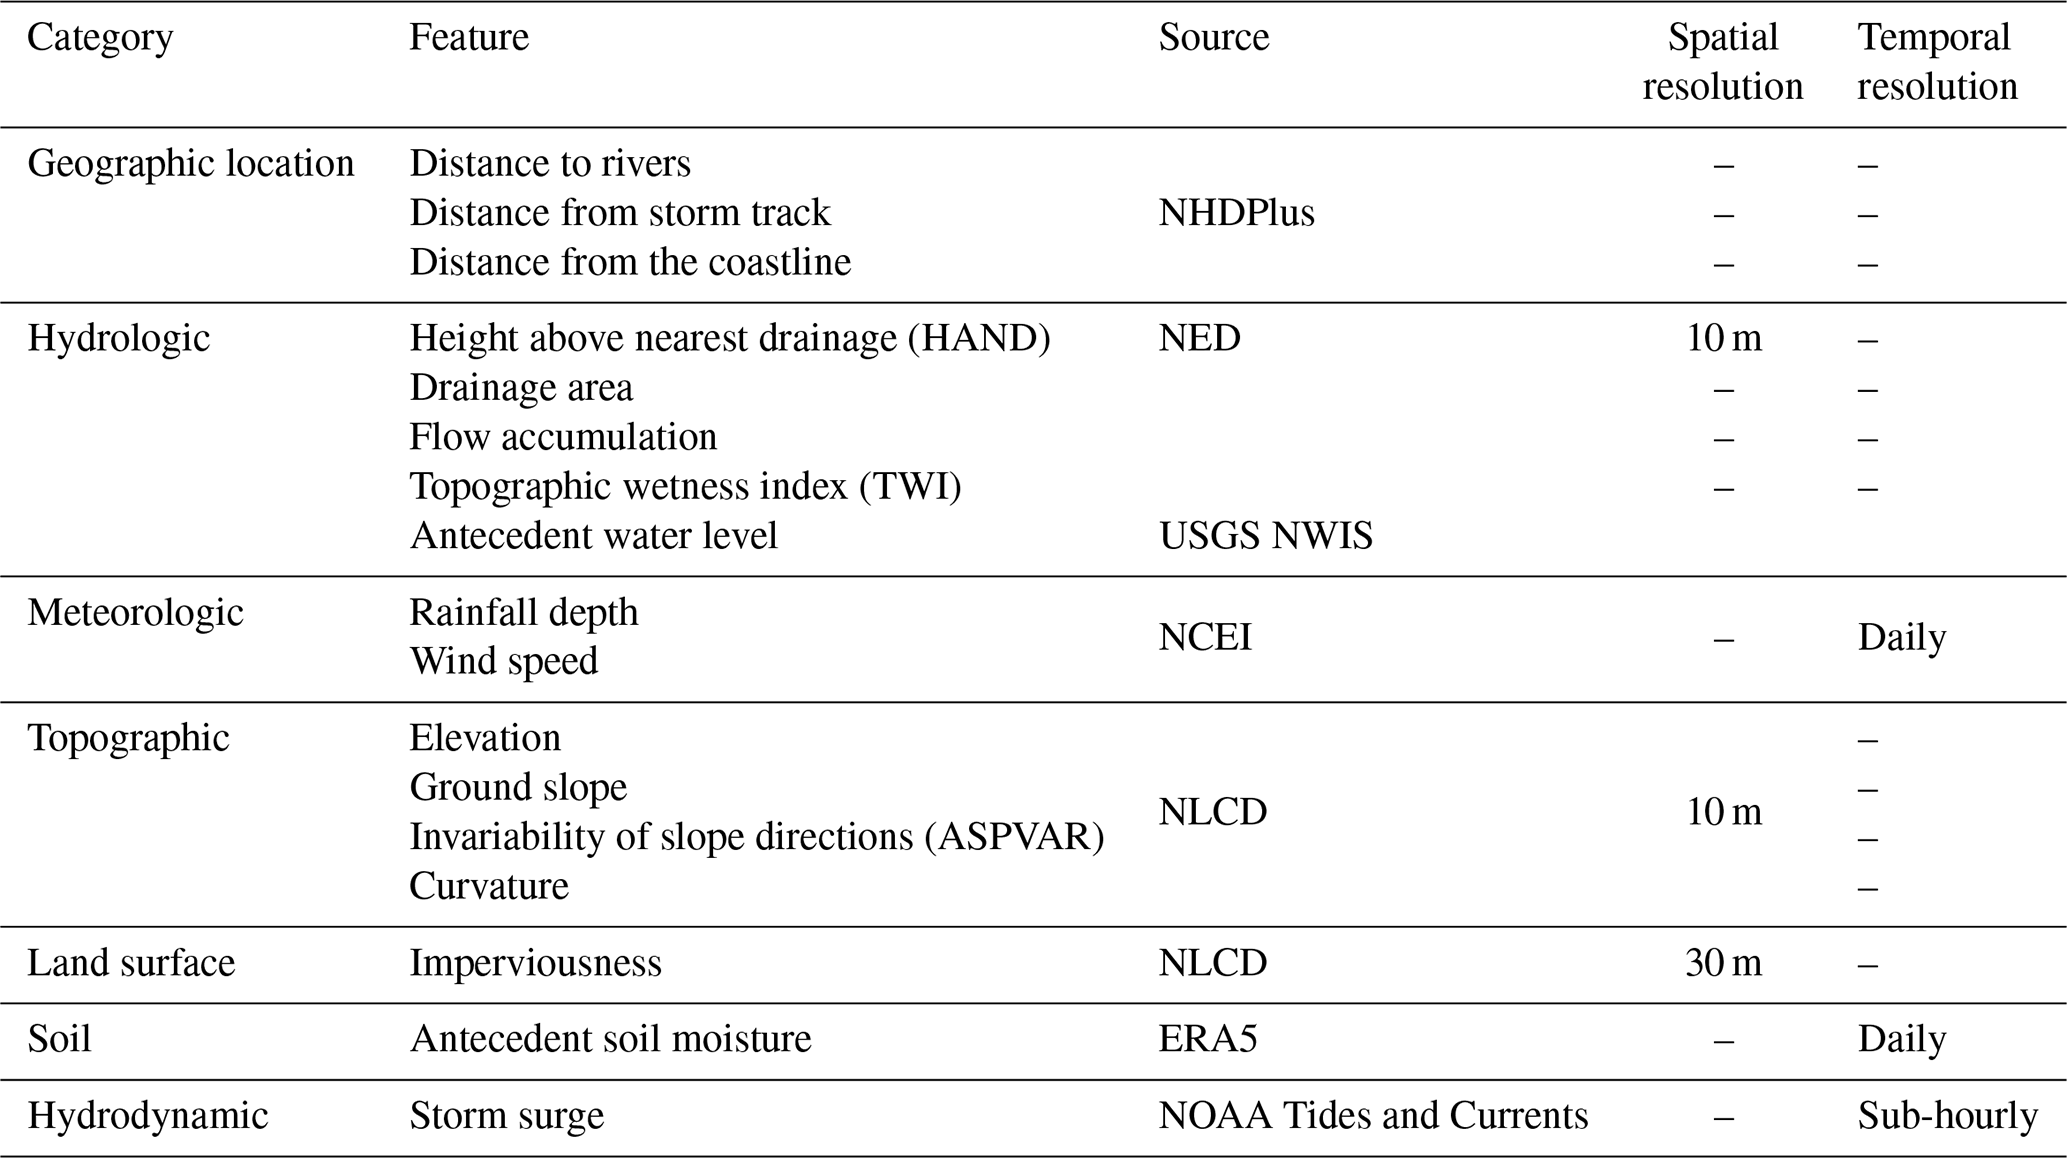
Table 3The range of river water depth, cumulative rainfall depth, and antecedent soil moisture in the flood events.
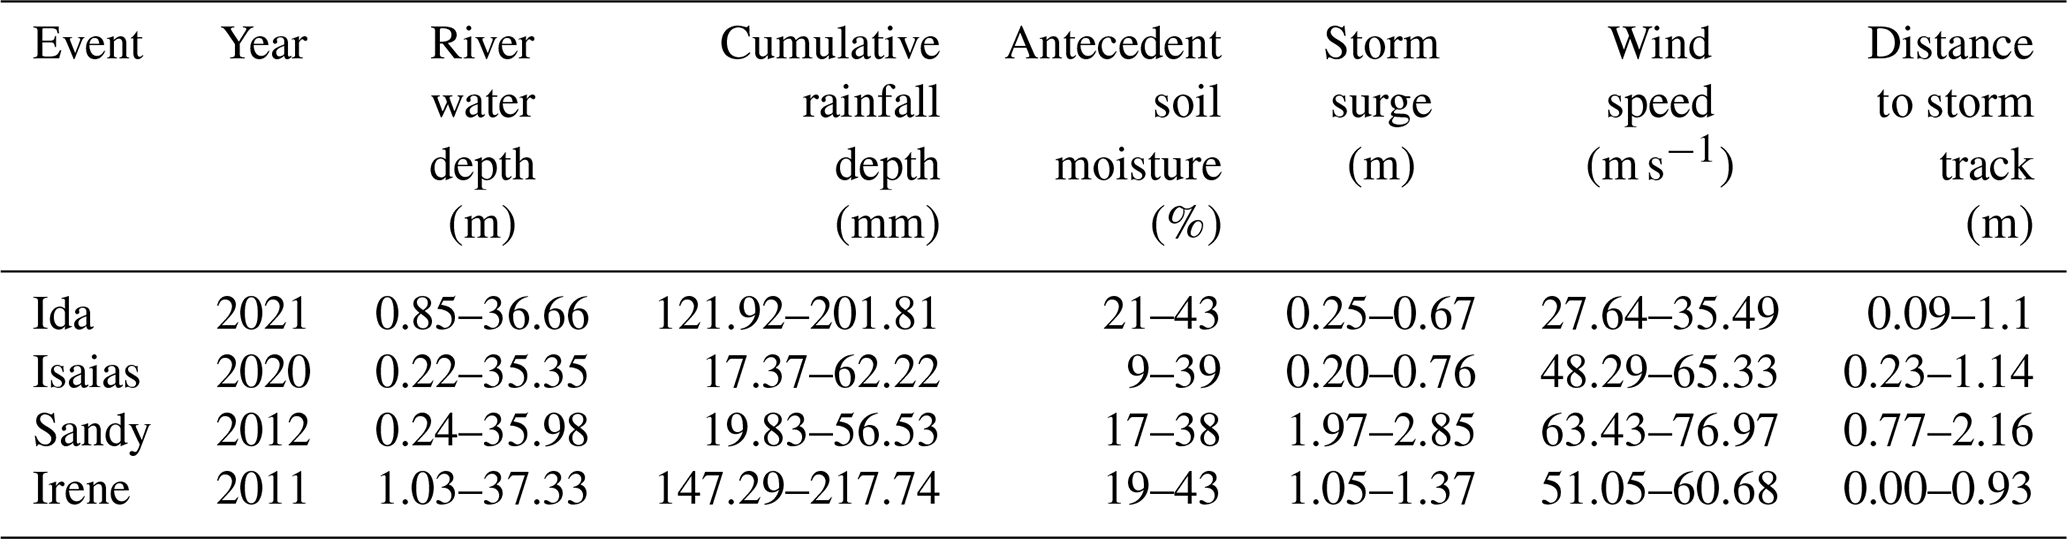
The study watershed embraces 116 stream gauges, 7 weather stations, and 2 tidal gauges (Fig. 3). These gauges and stations recorded data for all four events (hurricanes Ida, Isaias, Sandy, and Irene). The drainage area of the contributing watersheds of the stream gauges varies from 5.5 to 2104 km2. The ranges of recorded maximum water depths, rainfall, and antecedent soil moisture near the stream gauges during the four hurricanes are presented in Table 3. It shows that hurricanes Ida and Irene were associated with much higher rainfall depths. Such increased precipitation levels contribute directly to flood severity, as they can overwhelm drainage systems and lead to runoff exceeding riverbank capacities. The percent soil moisture before the storms ranged from fairly dry conditions (9 %) to nearly half saturated (43 %). Ida and Irene had similar antecedent soil moisture conditions, which influenced their respective river water depths. Hurricane Sandy had a higher antecedent soil moisture percentage range of 17 % to 38 % compared to both Ida and Isaias, indicating a potentially higher level of saturation before the storm arrival. This likely contributed to Sandy's significant storm surge, which ranged from 1.97 to 2.85 m, compared to Ida and Isaias with storm surge ranges of 0.25 to 0.67 m and 0.20 to 0.76 m, respectively. Maximum wind speeds during these events were quite high, especially for hurricanes Isaias, Sandy, and Irene. The proximity to the central path of the storm influences the intensity of the rainfall, wind speed, and storm surge experienced. Shorter distances to the storm track, particularly for Ida and Irene, correlated with more severe weather conditions and, consequently, greater flood depths.
Figure 4 displays the spatial variability in maximum water depths and storm tracks for all hurricanes. The total slope aspect was south, which resulted in shallower depths at the river upstream. As we moved southwards along the river mainstream, water depths became deeper.
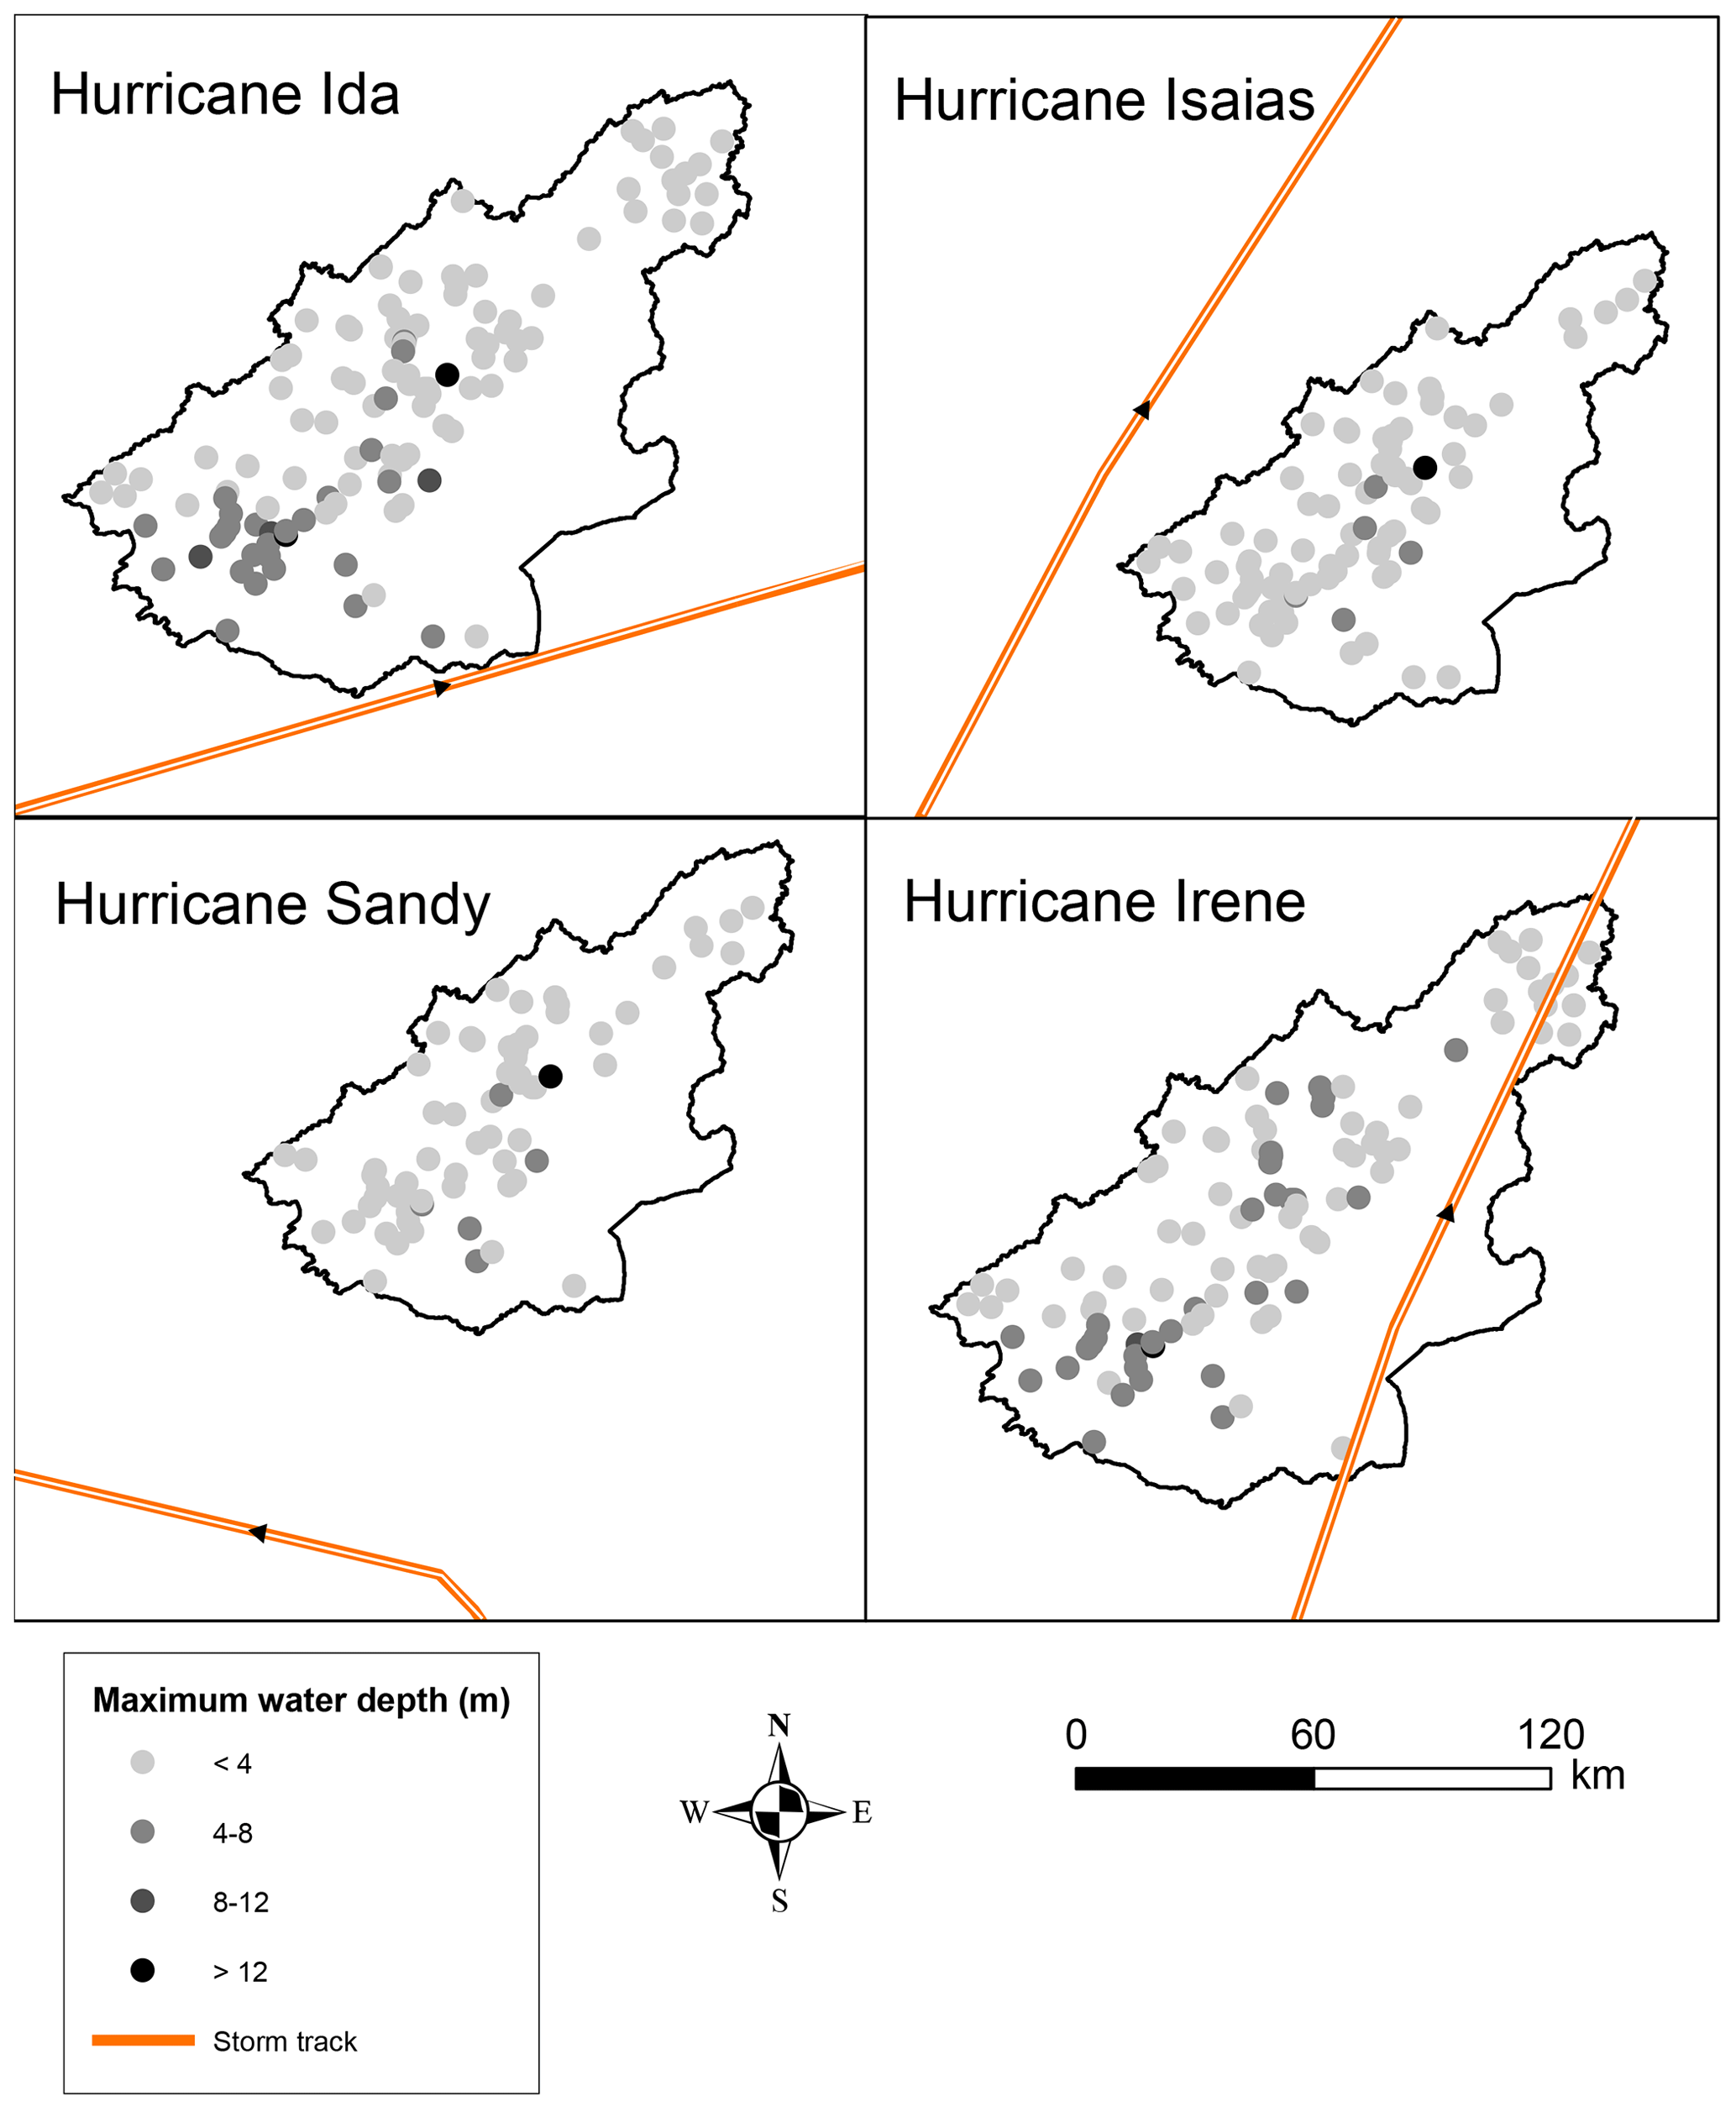
Figure 4Maximum water depths across the study area during the four study hurricanes.
4.1 Feature selection
Using Pearson's correlation analyses, we eliminated five features with absolute correlation coefficients > 0.70, the cutoff threshold suggested in previous studies (Cao et al., 2020; Chen et al., 2023; Lee et al., 2020). According to Fig. 5, the strong correlation coefficient of 0.99 between the drainage area and flow accumulation indicated that both features capture similar information about water flow and storage in the watershed. To avoid collinearity issues, flow accumulation was excluded from further analyses due to its weaker correlation with flood depth. Similarly, features that demonstrated weaker correlations with flood depth or were highly correlated with multiple features were excluded. These analyses ensured that independent variables, which are essential for modeling maximum water depths, are retained in our modeling.
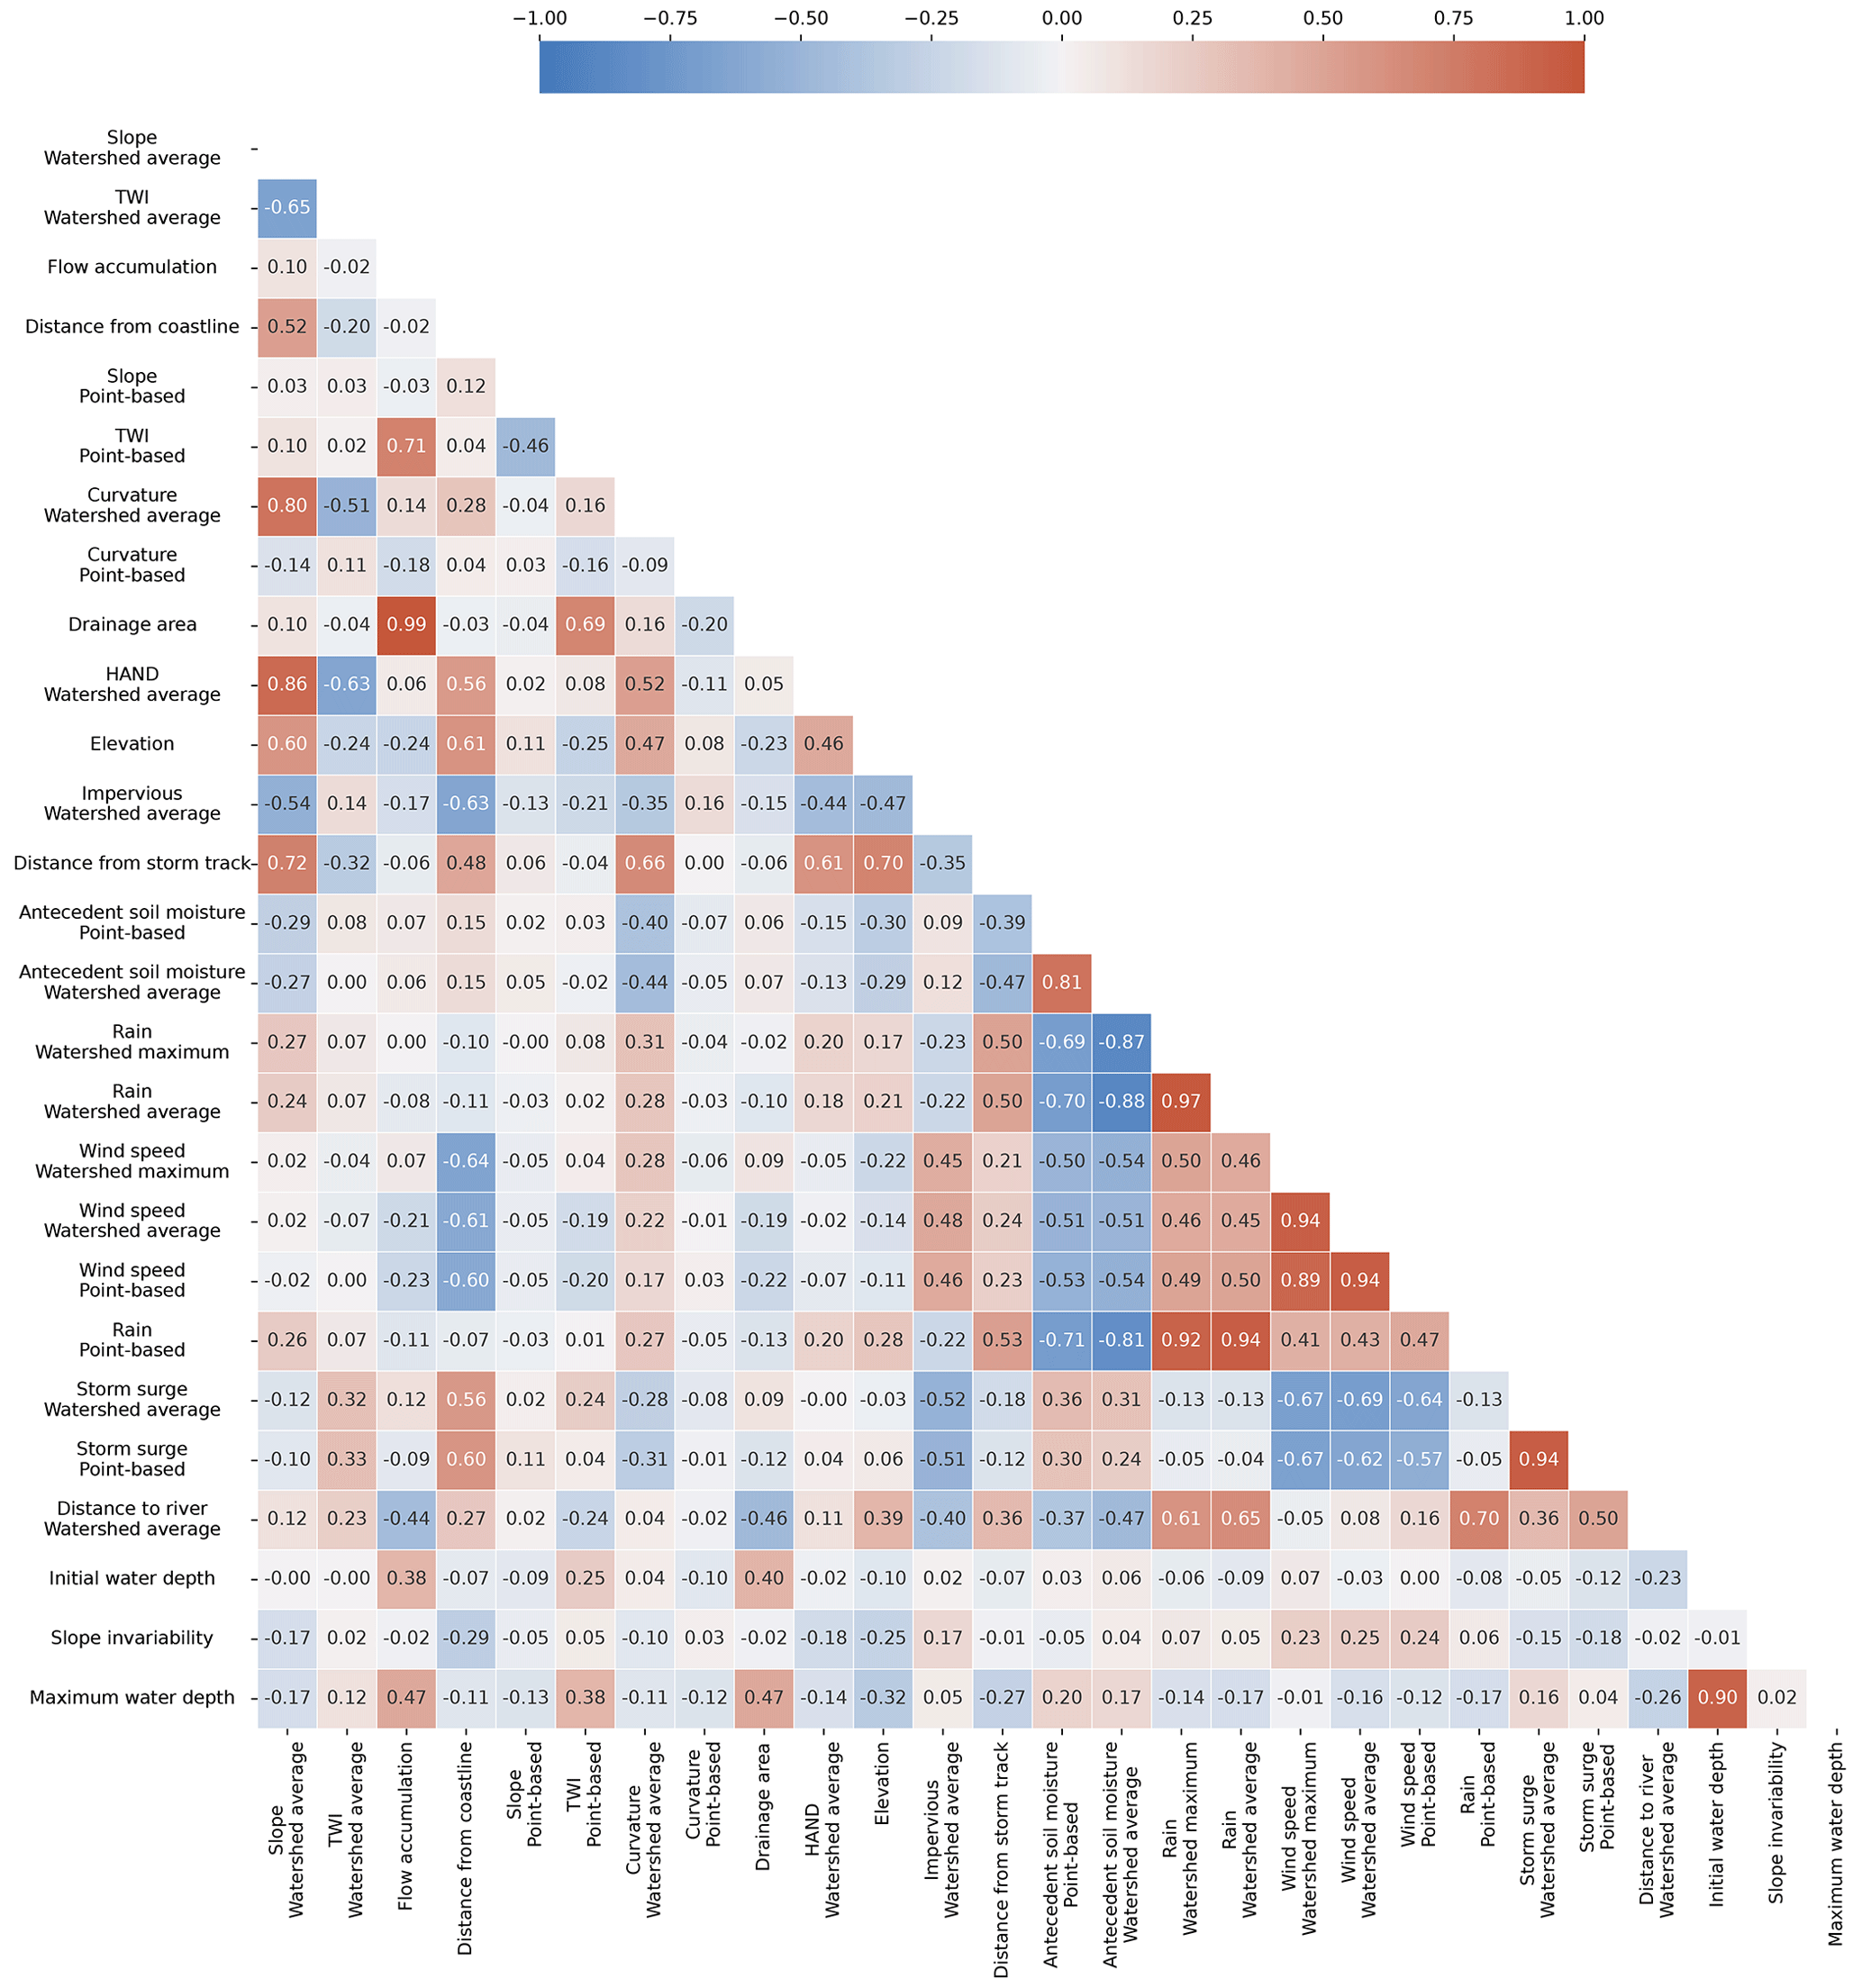
Next, we conducted PCA to assess the importance of the features retained by Pearson's correlation analyses in hindcasting maximum water depths. The analyses showed that the slope at the stream gauge, slope aspect, slope invariability, curvature at the stream gauge, and average curvature across the contributing watershed were the least important features for capturing the overall variability in maximum flood depth. Consequently, we excluded these features from our analyses. The lesser importance of slope at the stream gauge and slope aspect may be since river slope is related to bathymetry, which is typically not represented well by DEMs (Bhuyian and Kalyanapu, 2020).
The forward feature selection method showed that the initial water depth, elevation, TWI, antecedent soil moisture, rainfall, and distance from the storm surge at the stream gauge (all point-based), as well as the average storm surge and maximum wind speed across the contributing watershed, along with their interactions were selected for the final ML model. Considering the interactions among the features improved the model performance. This was expected because combinations of some of the features better explain the underlying physical processes. For instance, using a combination of the storm surge and TWI as one unified feature can be an indication of the physical propagation of storm surges that occur primarily in waterways.
4.2 Machine learning (ML) model development
4.2.1 Model development and performance evaluation
In the development of our ANN-MLP model for hindcasting maximum water depths during Hurricane Ida, we used Bayesian search with a cross-validation strategy for hyperparameter optimization. Details of the optimization can be found in the Supplement.
The model demonstrated an excellent performance on the training dataset (R2=0.94, MAE=0.64 m, MDAE=0.44 m, and NRMSE=24 %). On the test dataset, the model achieved an R2 of 0.91, an MAE of 0.77 m, an MDAE of 0.42 m, and an NRMSE of 28 %, further suggesting the satisfactory performance by the model. The training history plot showed that the model performance improved with each epoch during training, indicating that the model was learning from the data. The model training process stopped at epoch 87 due to early stopping.
4.2.2 Model explainability
Figure 6 shows the performance of the ML model in hindcasting maximum water depths at stream gauges, comparing estimated values against observed values for both training and testing datasets. In the training phase (Fig. 6a), points are clustered along the identity line but tend to underestimate large water depths. This pattern suggests that the model learned the training data well, especially for smaller water depths, but did not fully capture the behavior that leads to the larger water depths. The underestimation of high values is expected due to the lower number of observations. The test data (Fig. 6b) revealed a similar pattern of underestimation for higher values; this could be because the number of observed high water depths is small.
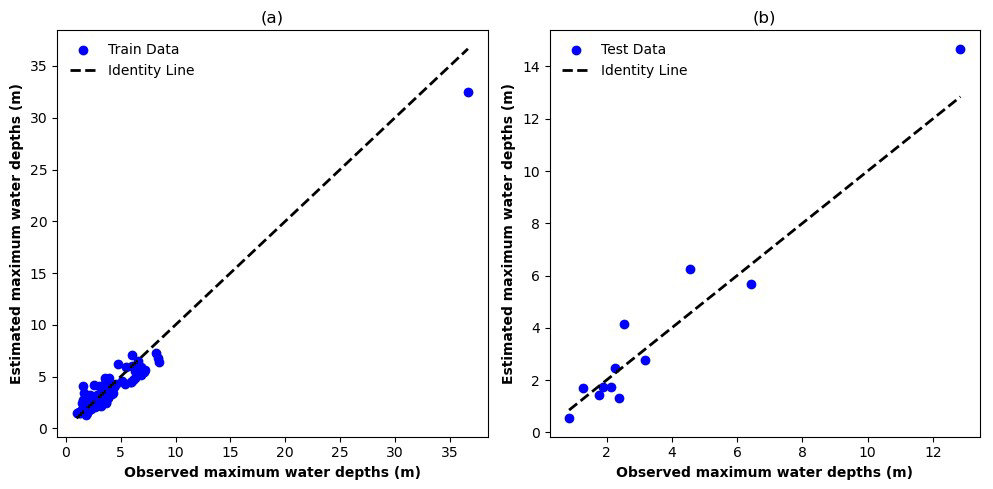
Figure 6Scatterplots of estimated vs. observed maximum water depths for (a) train and (b) test data. The identity line represents a perfect match between the estimated and observed values.
Figure 7 provides an overview of the influence of distinctive features on the model estimation on maximum water depths. Features like the antecedent soil moisture and maximum wind speed across the contributing watershed were found to substantially influence the water depth estimations. The inclusion of elevation as an important feature in our study closely aligns with the findings of Hosseini et al. (2020) and Chen et al. (2023) in their flash flood susceptibility and hazard assessments on a small non-tidal and a large coastal watershed. Elevation has been recognized as a crucial factor influencing flood occurrences, as it directly affects the water flow and drainage patterns within a watershed (Rafiei-Sardooi et al., 2021).
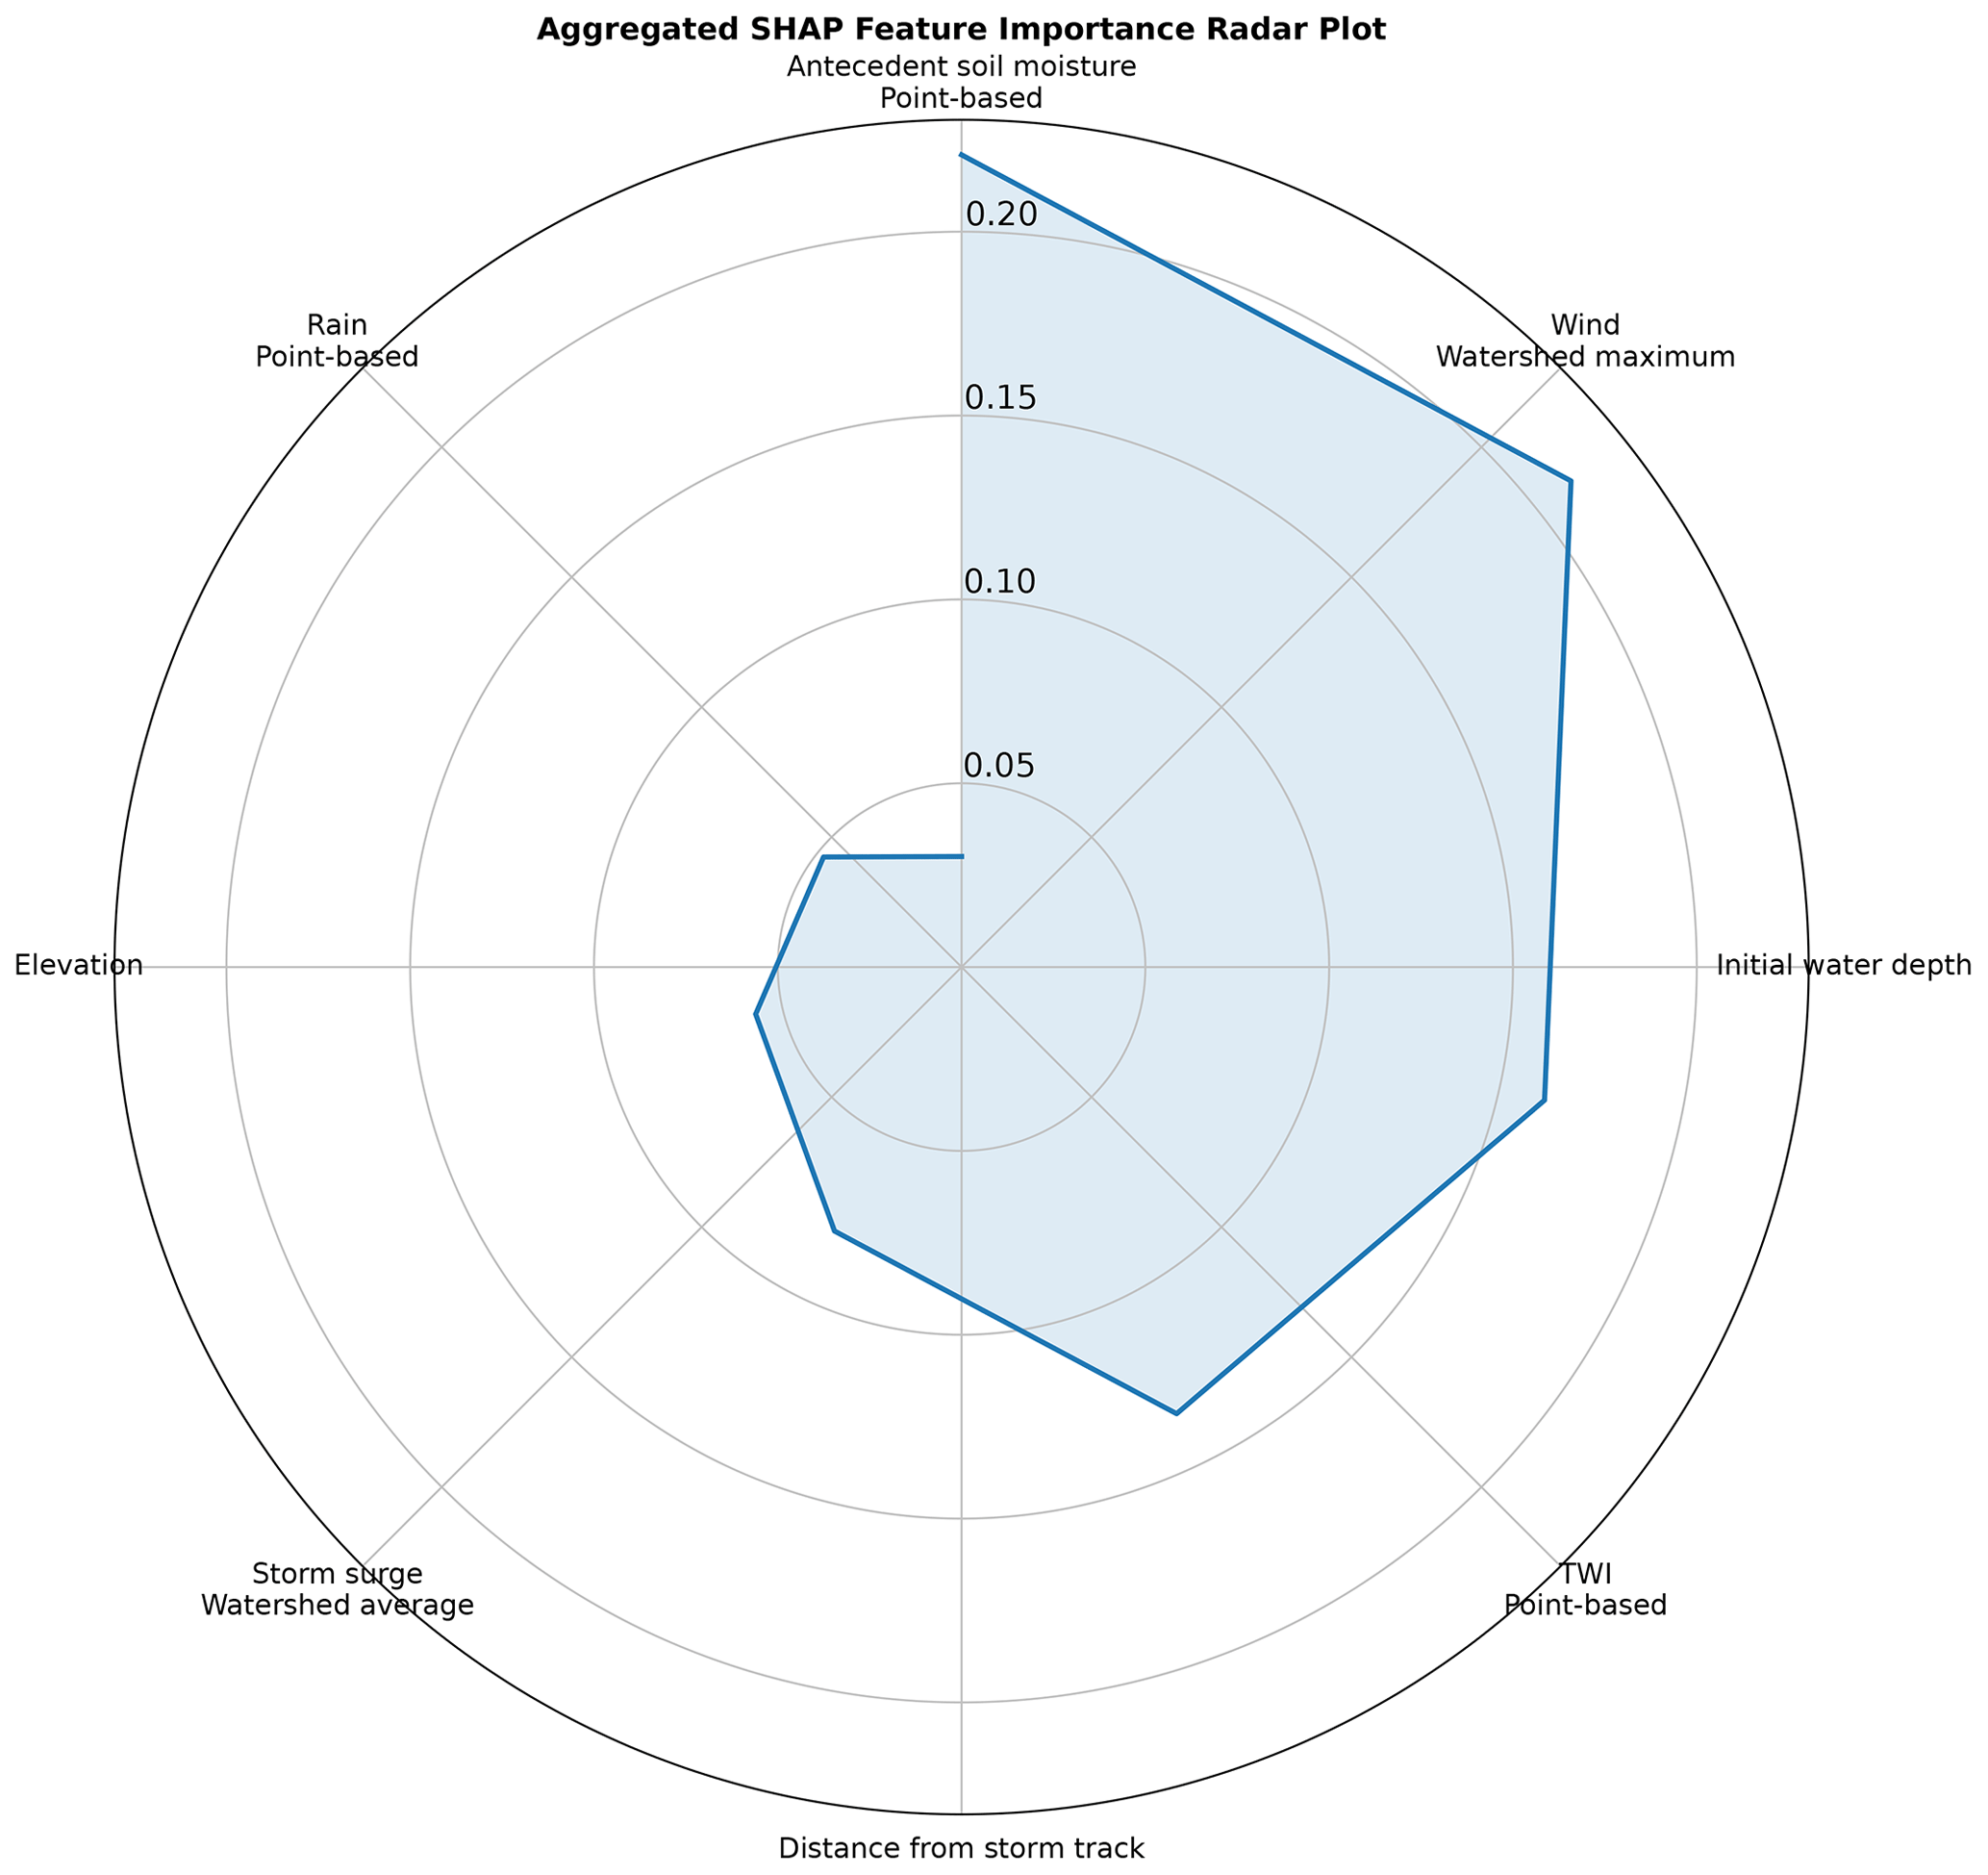
Figure 7Aggregated SHapley Additive exPlanations (SHAP) feature importance radar plot of the ML model for hindcasting maximum water depths.
On the other hand, features such as the interaction of initial water depth and rainfall and local rainfall were identified as the least key features in estimating maximum water depths. In a coastal context, where the landscape reaction to oceanic events often overshadows the rainfall effect, this outcome is noticeable. The finding about the lower importance of rainfall in flood estimation concurs with the results by Salvati et al. (2023) when pinpointing vulnerable regions within a non-coastal medium-sized watershed. The study suggested that rainfall may have a lower impact on flood occurrences or flood depth estimations compared to other influential factors. The consideration of the interactions between rainfall and other features may also obscure the direct influence of rainfall on the model's predictions, especially in complex flood modeling.
It is important to note that the least important features are not necessarily uninformative; they simply contribute less to the model's output relative to the most important features. This can be due to the nature of the data, the modeling approach, or the specific context of the problem being addressed.
4.3 Examining the machine learning (ML) model transferability across flood events
The transferability of the trained and tested model (against Hurricane Ida) was examined by applying it to three other events within the same watershed. Table 4 summarizes the evaluation metrics for the three hurricanes.
Table 4Model performance across historical flood events. MAE: mean absolute error; MDAE: median absolute error; RMSE: root mean square error; FQ: ratio of estimated to observed maximum flood depth.

These results demonstrated the model ability to be transferred across different hurricanes within the same watershed (R2>0.70). With an MAE of less than 1.71 m for all hurricanes, our model performance is consistent with the CNN model of Guo et al. (2021), demonstrating its capability for making satisfactory flood depth estimates. However, when compared to the original model performance on Hurricane Ida, the R2 values and other metrics show weaker model performance for the transferability to other hurricanes, suggesting reduced estimative accuracy but not to the extent that the model performance becomes unsatisfactory.
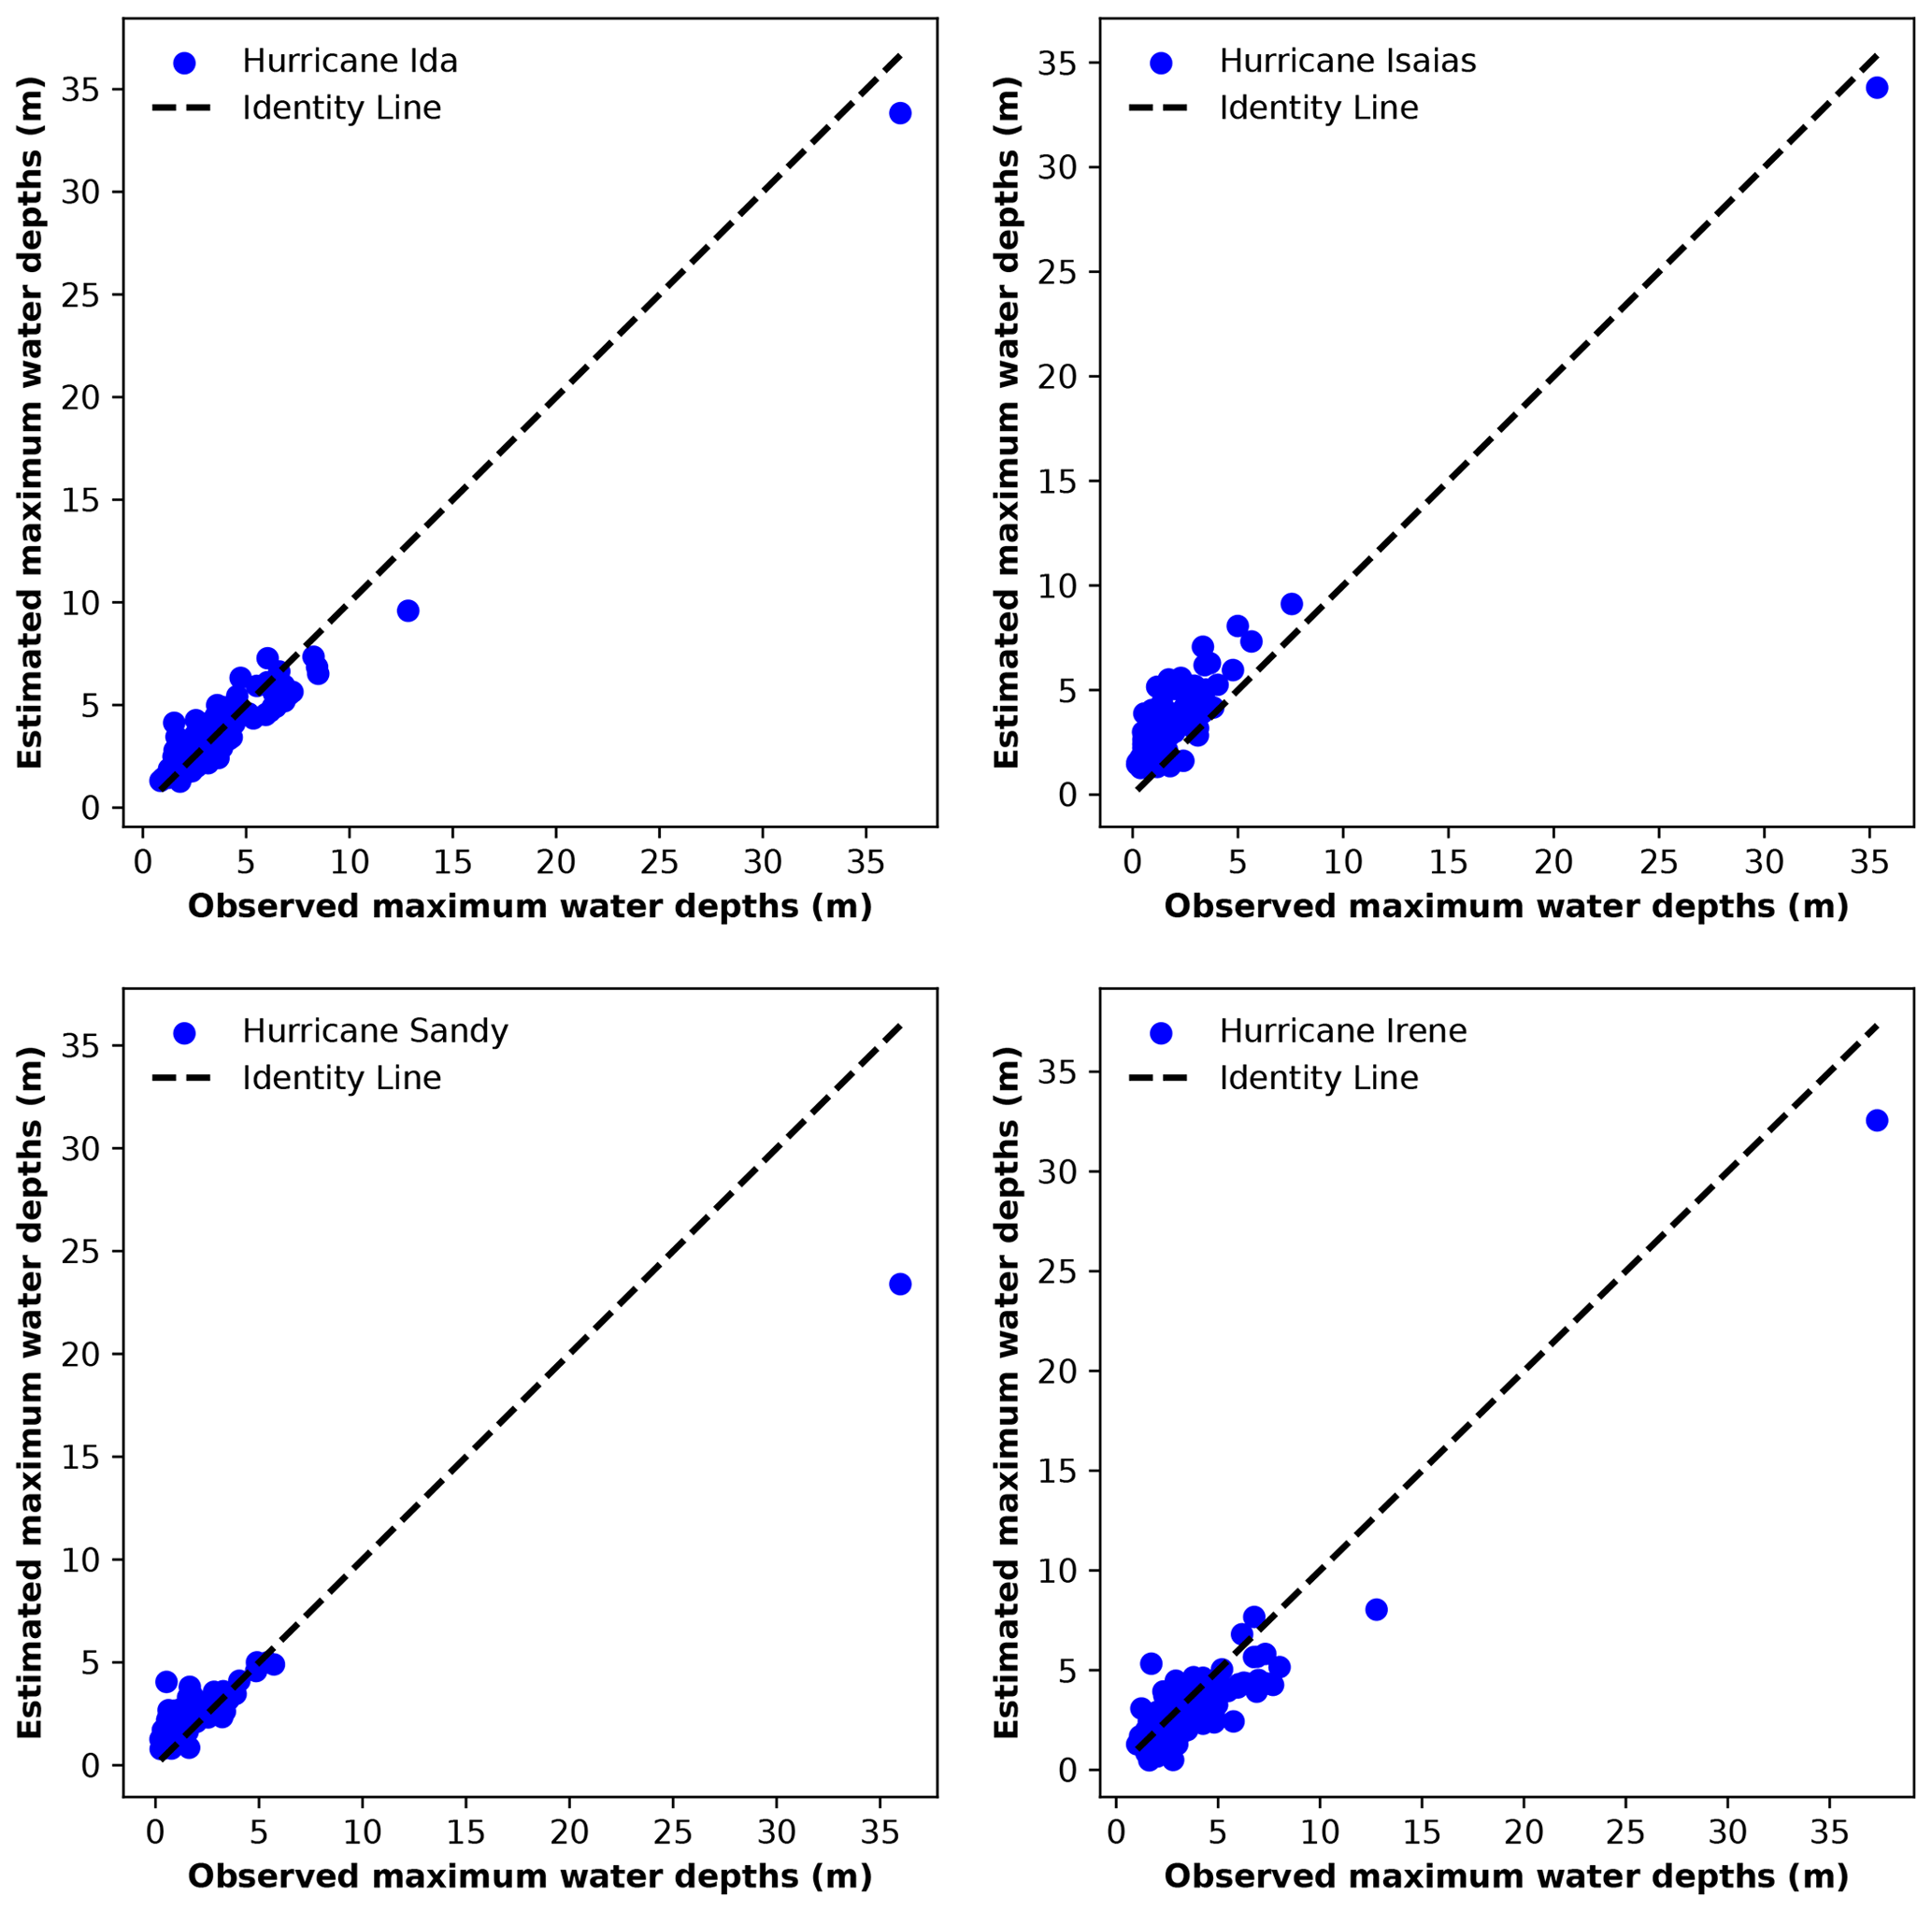
Figure 8 shows the relationship between observed and estimated maximum water depths for the four storm events. Most observed water depths for the hurricanes were low. For all four events, the data points suggested that the model tends to underestimate the high water depths and overestimate the low water depths (Fig. 8). The plots for hurricanes Sandy and Irene show a more dispersed set of points, suggesting a wider variance in the model estimates compared to the observations. This implied that the model is less accurate in capturing the flood dynamics of these events or that these events have unique characteristics that are not fully learned by the ML model.
For Hurricane Ida, our original model, 32 % of the stream gauges had an FQ between 90 % and 110 %, implying satisfactory estimates at these gauges (Gallegos et al., 2012; Schubert and Sanders, 2012). Hurricanes Irene, Sandy, and Isaias had fewer gauges with moderate FQ values of 16 %, 14 %, and 3.5 % of all stream gauges, respectively, suggesting that the model estimations were less satisfactory for these events compared to Ida in terms of bias. However, the transferability was still more successful for Irene than the other two hurricanes, which is similar to what we found based on the other metrics (Table 4).
We attributed the model transferability performance to four main factors: water depth, antecedent soil moisture, storm track, and the primary driver of flooding. Based on Table 2, hurricanes Ida and Irene exhibited significant similarities in river water depths and antecedent soil moisture, which influenced their respective river water depths. These two hurricanes had similar antecedent soil moisture conditions, while Hurricane Sandy had a higher antecedent soil moisture percentage range of 17 % to 38 % compared to both Ida and Isaias, indicating a potentially higher level of saturation before the storm arrival. These results partly explain the better model transferability for Hurricane Irene compared to hurricanes Isaias and Sandy.
The original storm track of Hurricane Ida was located to the southeast of the watershed, moving northeast, and remained fully outside the watershed (Fig. 4). Hurricane Irene's path, which was somewhat similar to Ida's, stretched from the southeast to the northeast, resulting in the best model transferability. The key difference was that Irene's storm path lay inside the watershed along its eastern border. Consequently, the model, assuming a track similar to Ida's (the event that the model was trained for), underestimated maximum water depths during Hurricane Irene. For hurricanes Isaias and Sandy, for which the storm track was farther from the watershed and dissimilar from Ida's path, the model overestimated the water depths. Isaias' storm track moved from the southwest to the northwest of the watershed, while Sandy's unique path propagated from the southeast to the southwest, leading to the lowest satisfactory in terms of the model transferability among the events.
The other reason why the model transferability was most successful for Hurricane Irene was that the event mainly driven by significant rainfall, similar to Hurricane Ida (the event that the model was trained for). In contrast, the model performed worse for hurricanes Sandy and Isaias because these events were mainly driven by storm surges. The original model, which assigned lower importance to storm surges, was not effective in predicting the water depths in Sandy and Isaias. In fact, here we see another significant advantage of strategically using physically meaningful features rather than the more commonly used black-box approach. By considering the physical phenomena in our model development, we can better understand the model's strengths and weaknesses and more effectively evaluate its performance.
Despite these distinct characteristics of the storm events, the ML model demonstrated satisfactory performance when applied to hurricanes Sandy and Isaias, suggesting some level of transferability, mainly because we incorporated a wide array of pertinent flood-influencing features and the spatial dimension (contributing watershed). While the model performs well, the inconsistency of the success level of transferability across flood events presents opportunities to incorporate additional features or training approaches, enhancing the model robustness to different storm tracks relative to the watershed and weighing the model features based on the main flood driver (e.g., rainfall or storm surges).
This study underscores the complexity of efficiently predicting water depths for major hurricanes and emphasizes the necessity of refining models for better performance during such extreme events. It has highlighted the importance of deeper analyses of features causing prediction discrepancies and has suggested that addressing different flood types (fluvial vs. storm surge) separately can enhance the model performance. This approach, alongside adjustments for specific flood characteristics like storm tracks and similar influential factors that are distinct for each event, can improve the performance of hindcast models, aiding in the development of more transferable ML-based models.
4.4 Limitations and future research
While this study showed promising results about ML-based flood modeling, it is important to acknowledge its limitations to identify areas for future research. One limitation is the presence of inherent uncertainties in the model that can impact the accuracy of the estimations. These uncertainties can stem from various sources, including the quality and accuracy of the observed data (Bales and Wagner, 2009; Gallegos et al., 2012; Merwade et al., 2008; Teng et al., 2017) and input data (features). For instance, relying solely on spatially aggregated values of features (mean and maximum used in this study) may not adequately capture the spatial heterogeneity of pertinent variables across the upper watershed. Future research should prioritize addressing these uncertainties by exploring alternative data sources and methodologies. The ANN-MLP model was tuned using observed flood data, and an optimal hyperparameter set was used based on the hyperparameter optimization methods. This deterministic approach does not incorporate the uncertainty from model parameterization. Probabilistic models are needed to address this uncertainty. Parameterization uncertainty acknowledges that the exact values of model parameters (e.g., weights in an ANN-MLP) determined through training may not perfectly capture the true underlying processes, leading to variability in our predictions. Probabilistic models address this uncertainty by incorporating it directly into the modeling process, offering a range of possible outcomes with associated probabilities (posterior probability distributions) rather than a single deterministic output. This is achieved through techniques like Bayesian inference, where prior knowledge about parameters is updated with observed data to produce a posterior distribution of parameters. This approach provides a more nuanced understanding of uncertainty, allowing predictions to reflect both the variability observed in the data and the confidence in the model's parameter estimates. To address the limitations of deterministic models, like the ANN-MLP used in this study, future research should explore integrating probabilistic modeling techniques such as Bayesian inference. Exploring alternative data sources and methodologies, such as incorporating spatially detailed features or dynamic time series data, could also help in capturing the complexities of watershed characteristics more accurately.
Furthermore, we did not have sub-daily data available for all model features. Incorporating sub-daily data is highly likely to improve the model accuracy in capturing intra-daily variability and flood dynamics, but it was not explored due to data constraints. Future research should incorporate sub-daily data into flood depth hindcast models. A further limitation of this study related to the time dimension is that wind events, storm surges, rainfall, and overland flow processes have different time signatures. Pluvial and storm surge flooding can be closely coincident with the storm event, but river flood waves may take much longer to arrive at a particular location. The time lag between these processes was not considered in our ML model, which was not dynamic in time and only hindcasted maximum river water depths. Incorporating time variability into the features can better represent the time-varying nature of flood dynamics.
Another limitation of this study is the issue of bathymetry, which is typically not represented well by DEMs like USGS's NED. Refining the DEMs with bathymetry data such as NOAA's Continuously Updated DEM (CUDEM) dataset and channel cross-sections is recommended to better represent the terrain of channels and floodplains in the model.
Additionally, we modeled maximum water depths across a large watershed (HUC6), whereby many details may not be important. For small watersheds and especially urbanized ones, we emphasize the importance of considering local factors such as sewer and drainage systems in flood depth hindcast, where pluvial floods may be prevalent. However, obtaining data on sewer and drainage systems can be challenging due to availability, lack of quality, and confidentiality of the data, particularly at the desired spatial and temporal resolutions. Future research should strive to improve the availability and accessibility of such data to enhance the accuracy of flood depth hindcasting, especially in urban areas. In small urban watersheds, other details such as land management practices and other local features can also be important for flood depth hindcasting and should be incorporated in the ML-based model.
This study primarily focused on hindcasting maximum water depths and did not consider other important flood characteristics, such as duration, frequency, and extent, all of which are important for loss estimates, decision-making, and risk management (Ahmadisharaf and Kalyanapu, 2019; Ebrahimian et al., 2015, 2016; Kreibich et al., 2009; Merz et al., 2010; Qi and Altinakar, 2011a, b, 2012). To gain a fuller picture of flood hazards, future research should aim to develop ML models that can hindcast these additional flood characteristics. We also focused on river maximum water depths and did not hindcast inundation on floodplains (out-of-channel). Developing ML-based models that can satisfactorily hindcast out-of-channel maximum water depths should be a focus of future research; the transferability of ML-based models for such estimations should also be evaluated. High water marks (HWMs) can be used to train the model for such hindcasting. However, HWMs are subject to large uncertainties (Schubert et al., 2022). Therefore, one challenge in developing models that hindcast maximum water depths over floodplains is the availability of reliable observations. Satellite-based observations are also often limited to flood status data; maximum water depths cannot be estimated using these types of datasets. Newly launched satellites, such as the Surface Water and Ocean Topography (SWOT) mission, can provide additional data for such estimations.
As part of future work, it is also essential to consider the sensitivity of stream gauges to changes in flow once water exceeds bankfull levels. This is significant as water height changes at a slower rate beyond bankfull levels due to the compound channel shape. Wide floodplains can lead to similar stage elevations for quite different flow conditions. This sensitivity assessment can offer insights about whether water depths can be estimated once flood conditions are established, which has implications for the model transferability across events.
We recommend that future work compares the performance of our ML-based model to traditional physically based and morphology-based models using the same datasets. By evaluating the performance, generalizability, and computational efficiency of our ML-based model versus these traditional modeling approaches, we will be able to better validate the strengths of our data-driven methodology. Detailed error analyses between the approaches can also reveal insights into where additional physics knowledge needs to be incorporated into the ML-based model structure and training to improve performance.
Thus, although we found ML-based models are transferable across flood events when informed by relevant physical features at meaningful locations, there are still several areas that require further investigation. By addressing these limitations, future research can corroborate our findings about the performance and transferability of ML-based models in estimating maximum water depths as computationally efficient modeling frameworks.
This paper developed an ML-based model for hindcasting maximum water depths to address two major limitations of past research into applying ML models for flood estimations: solely predicting the flood status (classification-based models) and debate on the transferability of these models across events. We used ANN-MLP to hindcast maximum water depths for an event in a coastal watershed that is affected by fluvial and tidal floods. The model was informed by underlying physical flood processes and initial conditions (in the watershed and rivers), represented through a set of features (geographic location, topographic, climatic, land surface, hydrologic, hydrodynamic, and soil). Unlike previous applications of ML algorithms, our model estimated maximum water depths by accounting for the spatial distribution of the processes through considering both local contributions (at a given location) and those from the upstream watersheds. We demonstrated the model on a HUC6 watershed, the Lower Hudson, in the northeastern United States and evaluated its transferability across major flood events – hurricanes Ida, Sandy, Irene, and Isaias. Feature selection techniques were used to identify the most influential features for flood hindcasting. Hyperparameter optimization was performed to fine-tune the ML model, and its performance was evaluated using various metrics. The results showed that the model performed satisfactorily in estimating maximum water depths for the original event, Hurricane Ida (R2=0.94, MAE=0.64 m, MDAE=0.45 m, NRMSE=24 %, and FQ=138 %). The model transferability (i.e., applying the validated model as is without any additional parameter tuning) within the same watershed to three other events showed that the developed model was promising in the estimations (R2>0.7, MAE<1.71 m, MDAE<1.78 m, NRMSE<109 %, and FQ<370 %). This showed the model ability to capture complex relationships between the maximum flood depth and pertinent features beyond what it was originally trained for. Future research is needed to further evaluate the transferability of ML models across events and watersheds with different drainage areas for flood depth estimations.
The ML codes are accessible via GitHub: https://github.com/mpakdehi/ANN_MLP-flood-depth-model (Pakdehi, 2024a).
All the data are in the public domain and can be acquired from https://doi.org/10.5281/zenodo.13924231 (Pakdehib, 2024b).
The supplement related to this article is available online at: https://doi.org/10.5194/nhess-24-3537-2024-supplement.
MP: data curation, formal analysis, investigation, methodology, software, validation, visualization, writing (original draft preparation); EA: conceptualization, methodology, funding acquisition, project administration, supervision, writing (review and editing); BN: methodology, writing (review and editing); EC: visualization, writing (review and editing).
The contact author has declared that none of the authors has any competing interests.
Publisher's note: Copernicus Publications remains neutral with regard to jurisdictional claims made in the text, published maps, institutional affiliations, or any other geographical representation in this paper. While Copernicus Publications makes every effort to include appropriate place names, the final responsibility lies with the authors.
This article is part of the special issue “Hydro-meteorological extremes and hazards: vulnerability, risk, impacts, and mitigation”. It is not associated with a conference.
We thank Paul Bates for a detailed review of and fruitful comments on this paper.
This research has been supported by the Directorate for Engineering, Division of Civil, Mechanical and Manufacturing Innovation (grant no. 2203180). Florida State University Libraries partially supported the open‐access fees of this article through the Open Access Publishing Fund.
This paper was edited by Efthymios Nikolopoulos and reviewed by two anonymous referees.
Abdollahi, A. and Pradhan, B.: Urban Vegetation Mapping from Aerial Imagery Using Explainable AI (XAI), Sensors, 21, 4738, https://doi.org/10.3390/s21144738, 2021.
Abdrabo, K. I., Kantoush, S. A., Esmaiel, A., Saber, M., Sumi, T., Almamari, M., Elboshy, B., and Ghoniem, S.: An Integrated Indicator-Based Approach for Constructing an Urban Flood Vulnerability Index as an Urban Decision-Making Tool Using the PCA and AHP Techniques: A Case Study of Alexandria, Egypt, Urban Clim., 48, 101426, https://doi.org/10.1016/j.uclim.2023.101426, 2023.
Abrahart, R., Kneale, P. E., and See, L. M.: Neural Networks for Hydrological Modeling, CRC Press, ISBN 10:905809619X, ISBN 13:978-9058096197, 2004.
Adamowski, J., Chan, H. F., Prasher, S. O., and Sharda, V. N.: Comparison of Multivariate Adaptive Regression Splines with Coupled Wavelet Transform Artificial Neural Networks for Runoff Forecasting in Himalayan Micro-Watersheds with Limited Data, J. Hydroinform., 14, 731–744, https://doi.org/10.2166/hydro.2011.044, 2011.
Ahmadisharaf, E. and Kalyanapu, A. J.: A Coupled Probabilistic Hydrologic and Hydraulic Modelling Framework to Investigate the Uncertainty of Flood Loss Estimates, J. Flood Risk Manage., 12, e12536, https://doi.org/10.1111/jfr3.12536, 2019.
Ahmadisharaf, E., Kalyanapu, A. J., Lillywhite, J. R., and Tonn, G. L.: A Probabilistic Framework to Evaluate the Uncertainty of Design Hydrograph: Case Study of Swannanoa River Watershed, Hydrolog. Sci. J., 63, 1776–1790, https://doi.org/10.1080/02626667.2018.1525616, 2018.
Ahmadisharaf, E., Camacho, R. A., Zhang, H. X., Hantush, M. M., and Mohamoud, Y. M.: Calibration and Validation of Watershed Models and Advances in Uncertainty Analysis in TMDL Studies, J. Hydrol. Eng., 24, 03119001, https://doi.org/10.1061/(ASCE)HE.1943-5584.0001794, 2019.
Allen, D. M.: The Relationship Between Variable Selection and Data Agumentation and a Method for Prediction, Technometrics, 16, 125–127, https://doi.org/10.1080/00401706.1974.10489157, 1974.
Anderson, T. R., Fletcher, C. H., Barbee, M. M., Romine, B. M., Lemmo, S., and Delevaux, J. M. S.: Modeling Multiple Sea Level Rise Stresses Reveals up to Twice the Land at Risk Compared to Strictly Passive Flooding Methods, Sci. Rep., 8, 14484, https://doi.org/10.1038/s41598-018-32658-x, 2018.
Avila, L. A. and Cangialosi, J.: Tropical Cyclone Report – Hurricane Irene (AL092011), 11 April 2013, National Hurricane Center, https://www.nhc.noaa.gov/data/tcr/AL092011_Irene.pdf (last access: 1 May 2024), 2013.
Bafitlhile, T. M. and Li, Z.: Applicability of ε-Support Vector Machine and Artificial Neural Network for Flood Forecasting in Humid, Semi-Humid and Semi-Arid Basins in China, Water, 11, 85, https://doi.org/10.3390/w11010085, 2019.
Bales, J. D. and Wagner, C. R.: Sources of Uncertainty in Flood Inundation Maps, J. Flood Risk Manage., 2, 139–147, https://doi.org/10.1111/j.1753-318X.2009.01029.x, 2009.
Bates, P. D.: Flood Inundation Prediction, Annu. Rev. Fluid Mech., 54, 287–315, https://doi.org/10.1146/annurev-fluid-030121-113138, 2022.
Bates, P. D., Dawson, R. J., Hall, J. W., Horritt, M. S., Nicholls, R. J., Wicks, J., and Mohamed Hassan, M. A. A.: Simplified Two-Dimensional Numerical Modelling of Coastal Flooding and Example Applications, Coast. Eng., 52, 793–810, https://doi.org/10.1016/j.coastaleng.2005.06.001, 2005.
Berkhahn, S., Fuchs, L., and Neuweiler, I.: An Ensemble Neural Network Model for Real-Time Prediction of Urban Floods, J. Hydrol., 575, 743–754, https://doi.org/10.1016/j.jhydrol.2019.05.066, 2019.
Beven II, J. L., Hagen, A., and Berg, R.: Tropical Cyclone Report – HURRICANE IDA (AL092021), 4 April 2022, National Hurricane Center, https://www.nhc.noaa.gov/data/tcr/AL092021_Ida.pdf (last access: 1 May 2024), 2022.
Beven, K. J. and Kirkby, M. J.: A Physically Based, Variable Contributing Area Model of Basin Hydrology/Un Modèle à Base Physique de Zone d'appel Variable de l'hydrologie Du Bassin Versant, Hydrolog. Sci. Bull., 24, 43–69, https://doi.org/10.1080/02626667909491834, 1979.
Bhuyian, M. N. M. and Kalyanapu, A.: Predicting Channel Conveyance and Characterizing Planform Using River Bathymetry via Satellite Image Compilation (RiBaSIC) Algorithm for DEM-Based Hydrodynamic Modeling, Remote Sens., 12, 2799, https://doi.org/10.3390/rs12172799, 2020.
Blake, E. S., Kimberlain, T. B., Berg, R. J., Cangialosi, J. P., and Beven II, J. L.: Tropical Cyclone Report – Hurricane Sandy (AL182012), 12 February 2013, National Hurricane Center, https://www.nhc.noaa.gov/data/tcr/AL182012_Sandy.pdf (last access: 1 May 2024), 2013.
Brunner, G. W.: HEC-RAS, River Analysis System Hydraulic Reference Manual, February 2016, https://www.hec.usace.army.mil/software/hec-ras/documentation/HEC-RAS 5.0 Reference Manual.pdf (last access: 1 August 2023), 2016.
Cao, Y., Jia, H., Xiong, J., Cheng, W., Li, K., Pang, Q., and Yong, Z.: Flash Flood Susceptibility Assessment Based on Geodetector, Certainty Factor, and Logistic Regression Analyses in Fujian Province, China, ISPRS Int. J. Geo-Inf., 9, 748, https://doi.org/10.3390/ijgi9120748, 2020.
Chang, L.-C., Liou, J.-Y., and Chang, F.-J.: Spatial-Temporal Flood Inundation Nowcasts by Fusing Machine Learning Methods and Principal Component Analysis, J. Hydrol., 612, 128086, https://doi.org/10.1016/j.jhydrol.2022.128086, 2022.
Chen, Y., Zhang, X., Yang, K., Zeng, S., and Hong, A.: Modeling Rules of Regional Flash Flood Susceptibility Prediction Using Different Machine Learning Models, Front. Earth Sci., 11, 1117004, https://doi.org/10.3389/feart.2023.1117004, 2023.
Costabile, P., Costanzo, C., and Macchione, F.: Performances and Limitations of the Diffusive Approximation of the 2-d Shallow Water Equations for Flood Simulation in Urban and Rural Areas, Appl.Numer. Math., 116, 141–156, https://doi.org/10.1016/j.apnum.2016.07.003, 2017.
Dawson, C. W., Abrahart, R. J., Shamseldin, A. Y., and Wilby, R. L.: Flood Estimation at Ungauged Sites Using Artificial Neural Networks, J. Hydrol., 319, 391–409, https://doi.org/10.1016/j.jhydrol.2005.07.032, 2006.
Dixit, A., Sahany, S., Rajagopalan, B., and Choubey, S.: Role of Changing Land Use and Land Cover (LULC) on the 2018 Megafloods over Kerala, India, Clim. Res., 89, 1–14, https://doi.org/10.3354/cr01701, 2022.
Ebrahimian, A., Ardeshir, A., Zahedi Rad, I., and Ghodsypour, S. H.: Urban Stormwater Construction Method Selection Using a Hybrid Multi-Criteria Approach, Automat. Construct., 58, 118–128, https://doi.org/10.1016/j.autcon.2015.07.014, 2015.
Ebrahimian, A., Gulliver, J. S., and Wilson, B. N.: Effective Impervious Area for Runoff in Urban Watersheds: EIA in Urban Watersheds, Hydrol. Process., 30, 3717–3729, https://doi.org/10.1002/hyp.10839, 2016.
Elkhrachy, I.: Flash Flood Water Depth Estimation Using SAR Images, Digital Elevation Models, and Machine Learning Algorithms, Remote Sens., 14, 440, https://doi.org/10.3390/rs14030440, 2022.
Fereshtehpour, M., Esmaeilzadeh, M., Saleh Alipour, R., and Burian, S. J.: Impacts of DEM Type and Resolution on Deep Learning-Based Flood Inundation Mapping, Earth Sci. Inform., 17, 1125–1145, https://doi.org/10.1007/s12145-024-01239-0, 2024.
Fernández-Pato, J., Caviedes-Voullième, D., and García-Navarro, P.: Rainfall/Runoff Simulation with 2D Full Shallow Water Equations: Sensitivity Analysis and Calibration of Infiltration Parameters, J. Hydrol., 536, 496–513, https://doi.org/10.1016/j.jhydrol.2016.03.021, 2016.
Gallegos, H. A., Schubert, J. E., and Sanders, B. F.: Structural Damage Prediction in a High-Velocity Urban Dam-Break Flood: Field-Scale Assessment of Predictive Skill and Modeling Efficiency, J. Eng. Mech., 138, 1249–1262, https://doi.org/10.1061/(ASCE)EM.1943-7889.0000427, 2012.
Geisser, S.: The Predictive Sample Reuse Method with Applications, J. Am. Stat. Assoc., 70, 320–328, https://doi.org/10.1080/01621459.1975.10479865, 1975.
Gudiyangada Nachappa, T., Piralilou, S. T., Gholamnia, K., Ghorbanzadeh, O., Rahmati, O., and Blaschke, T.: Flood Susceptibility Mapping with Machine Learning, Multi-Criteria Decision Analysis and Ensemble Using Dempster Shafer Theory, J. Hydrol., 590, 125275, https://doi.org/10.1016/j.jhydrol.2020.125275, 2020.
Guo, Z., Leitão, J. P., Simões, N. E., and Moosavi, V.: Data-Driven Flood Emulation: Speeding up Urban Flood Predictions by Deep Convolutional Neural Networks, J. Flood Risk Manage., 14, e12684, https://doi.org/10.1111/jfr3.12684, 2021.
Horel, E. and Giesecke, K.: Computationally Efficient Feature Significance and Importance for Machine Learning Models, arXiv [preprint], https://doi.org/10.48550/ARXIV.1905.09849, 2019.
Hosseini, F. S., Choubin, B., Mosavi, A., Nabipour, N., Shamshirband, S., Darabi, H., and Haghighi, A. T.: Flash-Flood Hazard Assessment Using Ensembles and Bayesian-Based Machine Learning Models: Application of the Simulated Annealing Feature Selection Method, Sci. Total Environ., 711, 135161, https://doi.org/10.1016/j.scitotenv.2019.135161, 2020.
Hosseiny, H., Nazari, F., Smith, V., and Nataraj, C.: A Framework for Modeling Flood Depth Using a Hybrid of Hydraulics and Machine Learning, Sci. Rep., 10, 8222, https://doi.org/10.1038/s41598-020-65232-5, 2020.
Hu, A. and Demir, I.: Real-Time Flood Mapping on Client-Side Web Systems Using HAND Model, Hydrology, 8, 65, https://doi.org/10.3390/hydrology8020065, 2021.
Huang, F., Tao, S., Li, D., Lian, Z., Catani, F., Huang, J., Li, K., and Zhang, C.: Landslide Susceptibility Prediction Considering Neighborhood Characteristics of Landslide Spatial Datasets and Hydrological Slope Units Using Remote Sensing and GIS Technologies, Remote Sens., 14, 4436, https://doi.org/10.3390/rs14184436, 2022.
Jafarzadegan, K. and Merwade, V.: Probabilistic Floodplain Mapping Using HAND-Based Statistical Approach, Geomorphology, 324, 48–61, https://doi.org/10.1016/j.geomorph.2018.09.024, 2019.
Jafarzadegan, K., Moradkhani, H., Pappenberger, F., Moftakhari, H., Bates, P., Abbaszadeh, P., Marsooli, R., Ferreira, C., Cloke, H. L., Ogden, F., and Duan, Q.: Recent Advances and New Frontiers in Riverine and Coastal Flood Modeling, Rev. Geophys., 61, e2022RG000788, https://doi.org/10.1029/2022RG000788, 2023.
Jiang, J., Shu, Y., Wang, J., and Long, M.: Transferability in Deep Learning: A Survey, arXiv [preprint], https://doi.org/10.48550/arXiv.2201.05867, 2024.
Joseph, V. R.: Optimal Ratio for Data Splitting, Stat. Anal. Data Min., 15, 531–538, https://doi.org/10.1002/sam.11583, 2022.
Kalyanapu, A. J., Shankar, S., Pardyjak, E. R., Judi, D. R., and Burian, S. J.: Assessment of GPU Computational Enhancement to a 2D Flood Model, Environ. Model. Softw., 26, 1009–1016, https://doi.org/10.1016/j.envsoft.2011.02.014, 2011.
Karamouz, M., Saleh Alipour, R., Roohinia, M., and Fereshtehpour, M.: A Remote Sensing Driven Soil Moisture Estimator: Uncertain Downscaling With Geostatistically Based Use of Ancillary Data, Water Resour. Res., 58, e2022WR031946, https://doi.org/10.1029/2022WR031946, 2022.
Khosravi, K., Pham, B. T., Chapi, K., Shirzadi, A., Shahabi, H., Revhaug, I., Prakash, I., and Bui, D. T.: A Comparative Assessment of Decision Trees Algorithms for Flash Flood Susceptibility Modeling at Haraz Watershed, Northern Iran, Sci. Total Environ., 627, 744–755, https://doi.org/10.1016/j.scitotenv.2018.01.266, 2018.
Kim, S., Matsumi, Y., Pan, S., and Mase, H.: A Real-Time Forecast Model Using Artificial Neural Network for after-Runner Storm Surges on the Tottori Coast, Japan, Ocean Eng., 122, 44-53, https://doi.org/10.1016/j.oceaneng.2016.06.017, 2016.
Kreibich, H., Piroth, K., Seifert, I., Maiwald, H., Kunert, U., Schwarz, J., Merz, B., and Thieken, A. H.: Is Flow Velocity a Significant Parameter in Flood Damage Modelling?, Nat. Hazards Earth Syst. Sci., 9, 1679–1692, https://doi.org/10.5194/nhess-9-1679-2009, 2009.
Kulp, S. A. and Strauss, B. H.: New Elevation Data Triple Estimates of Global Vulnerability to Sea-Level Rise and Coastal Flooding, Nat. Commun., 10, 4844, https://doi.org/10.1038/s41467-019-12808-z, 2019.
Kundzewicz, Z. W., Su, B., Wang, Y., Xia, J., Huang, J., and Jiang, T.: Flood Risk and Its Reduction in China, Adv. Water Resour., 130, 37–45, https://doi.org/10.1016/j.advwatres.2019.05.020, 2019.
Latto, A., Hagen, A., and Berg, R.: Tropical Cyclone Report – HURRICANE ISAIAS (AL092020), 11 June 2021, National Hurricane Center, https://www.nhc.noaa.gov/data/tcr/AL092020_Isaias.pdf (last access: 1 May 2024), 2021.
Lee, D.-H., Kim, Y.-T., and Lee, S.-R.: Shallow Landslide Susceptibility Models Based on Artificial Neural Networks Considering the Factor Selection Method and Various Non-Linear Activation Functions, Remote Sens., 12, 1194, https://doi.org/10.3390/rs12071194, 2020.
Löwe, R., Böhm, J., Jensen, D. G., Leandro, J., and Rasmussen, S. H.: U-FLOOD – Topographic Deep Learning for Predicting Urban Pluvial Flood Water Depth, J. Hydrol., 603, 126898, https://doi.org/10.1016/j.jhydrol.2021.126898, 2021.
Lundberg, S. and Lee, S.-I.: A Unified Approach to Interpreting Model Predictions, arXiv [preprint], https://doi.org/10.48550/arXiv.1705.07874, 2017.
Macedo, F., Oliveira, M. R., Pacheco, A., and Valadas, R.: Theoretical Foundations of Forward Feature Selection Methods Based on Mutual Information, Neurocomputing, 325, 67–89, https://doi.org/10.1016/j.neucom.2018.09.077, 2019.
McCulloch, W. S. and Pitts, W.: A Logical Calculus of the Ideas Immanent in Nervous Activity, Bull. Math. Biophys., 5, 115–133, https://doi.org/10.1007/BF02478259, 1943.
Merwade, V., Olivera, F., Arabi, M., and Edleman, S.: Uncertainty in Flood Inundation Mapping: Current Issues and Future Directions, J. Hydrol. Eng., 13, 608–620, https://doi.org/10.1061/(ASCE)1084-0699(2008)13:7(608), 2008.
Merz, B., Kreibich, H., Schwarze, R., and Thieken, A.: Review Article “Assessment of Economic Flood Damage”, Nat. Hazards Earth Syst. Sci., 10, 1697–1724, https://doi.org/10.5194/nhess-10-1697-2010, 2010.
Ming, X., Liang, Q., Xia, X., Li, D., and Fowler, H. J.: Real-Time Flood Forecasting Based on a High-Performance 2-D Hydrodynamic Model and Numerical Weather Predictions, Water Resour. Res., 56, e2019WR025583, https://doi.org/10.1029/2019WR025583, 2020.
Mishra, A., Mukherjee, S., Merz, B., Singh, V. P., Wright, D. B., Gabriele, V., Paul, S., Kumar D. N., Khedun, C. P., Niyogi, D., Schumann, G., and Stedinger, J. R.: An Overview of Flood Concepts, Challenges, and Future Directions, J. Hydrol. Eng., 27, 03122001, https://doi.org/10.1061/(ASCE)HE.1943-5584.0002164, 2022.
National Hurricane Center: Storm track maps, https://www.nhc.noaa.gov/index.shtml (last access: 1 May 2023), 2022.
Nguyen, Q. H., Ly, H.-B., Ho, L. S., Al-Ansari, N., Le, H. V., Tran, V. Q., Prakash, I., and Pham, B. T.: Influence of Data Splitting on Performance of Machine Learning Models in Prediction of Shear Strength of Soil, Math. Probl. Eng., 2021, e4832864, https://doi.org/10.1155/2021/4832864, 2021.
NOAA: NOAA Tides & Currents, CO-OPS Map – NOAA Tides & Currents, https://tidesandcurrents.noaa.gov/map/index.html (last access: 1 May 2023), 2023.
NOAA's NCEI: Data Search|National Centers for Environmental Information (NCEI), https://www.ncei.noaa.gov/access/search/data-search/local-climatological-data (last access: 1 May 2023), 2022.
Pakdehi, M.: ANN_MLP-flood-depth-model, GitHub [code], https://github.com/mpakdehi/ANN_MLP-flood-depth-model (last access: 13 October 2024), 2024a.
Pakdehi, M.: mpakdehi/ANN_MLP-flood-depth-model: ANN_MLP-flood-depth-model (ANN_MLP-flood-depth-model), Zenodo [data set], https://doi.org/10.5281/zenodo.13924231, 2024b.
Park, M. H., Ju, M., and Kim, J. Y.: Bayesian Approach in Estimating Flood Waste Generation: A Case Study in South Korea, J. Environ. Manage., 265, 110552, https://doi.org/10.1016/j.jenvman.2020.110552, 2020.
Pham, B. T., Luu, C., Phong, T. V., Trinh, P. T., Shirzadi, A., Renoud, S., Asadi, S., Le, H. V., von Meding, J., and Clague, J. J.: Can Deep Learning Algorithms Outperform Benchmark Machine Learning Algorithms in Flood Susceptibility Modeling?, J. Hydrol., 592, 125615, https://doi.org/10.1016/j.jhydrol.2020.125615, 2021.
Qi, H. and Altinakar, M. S.: A Conceptual Framework of Agricultural Land Use Planning with BMP for Integrated Watershed Management, J. Environ. Manage., 92, 149–155, https://doi.org/10.1016/j.jenvman.2010.08.023, 2011a.
Qi, H. and Altinakar, M. S.: Vegetation Buffer Strips Design Using an Optimization Approach for Non-Point Source Pollutant Control of an Agricultural Watershed, Water Resour. Manage., 25, 565–578, https://doi.org/10.1007/s11269-010-9714-9, 2011b.
Qi, H. and Altinakar, M. S.: GIS-Based Decision Support System for Dam Break Flood Management under Uncertainty with Two-Dimensional Numerical Simulations, J. Water Resour. Pl. Manage., 138, 334–341, https://doi.org/10.1061/(ASCE)WR.1943-5452.0000192, 2012.
Rafiei-Sardooi, E., Azareh, A., Choubin, B., Mosavi, A. H., and Clague, J. J.: Evaluating Urban Flood Risk Using Hybrid Method of TOPSIS and Machine Learning, Int. J. Disast. Risk Reduct., 66, 102614, https://doi.org/10.1016/j.ijdrr.2021.102614, 2021.
Rahmati, O., Pourghasemi, H. R., and Zeinivand, H.: Flood Susceptibility Mapping Using Frequency Ratio and Weights-of-Evidence Models in the Golastan Province, Iran, Geocarto Int., 31, 42–70, https://doi.org/10.1080/10106049.2015.1041559, 2016.
Reckien, D.: What Is in an Index? Construction Method, Data Metric, and Weighting Scheme Determine the Outcome of Composite Social Vulnerability Indices in New York City, Reg. Environ. Change, 18, 1439–1451, https://doi.org/10.1007/s10113-017-1273-7, 2018.
Rennó, C. D., Nobre, A. D., Cuartas, L. A., Soares, J. V., Hodnett, M. G., Tomasella, J., and Waterloo, M. J.: HAND, a New Terrain Descriptor Using SRTM-DEM: Mapping Terra-Firme Rainforest Environments in Amazonia, Remote Sens. Environ., 112, 3469–3481, https://doi.org/10.1016/j.rse.2008.03.018, 2008.
Rezaie, F., Panahi, M., Bateni, S. M., Jun, C., Neale, C. M. U., and Lee, S.: Novel Hybrid Models by Coupling Support Vector Regression (SVR) with Meta-Heuristic Algorithms (WOA and GWO) for Flood Susceptibility Mapping, Nat. Hazards, 114, 1247–1283, https://doi.org/10.1007/s11069-022-05424-6, 2022.
Rumelhart, D. E., McClelland, J. L., and PDP Research Group: Parallel Distributed Processing: Explorations in the Microstructure of Cognition: Foundations, The MIT Press, https://doi.org/10.7551/mitpress/5236.001.0001, 1986.
Salvati, A., Moghaddam Nia, A., Salajegheh, A., Ghaderi, K., Talebpour Asl, D., Al-Ansari, N., Solaimani, F., and Clague, J. J.: Flood Susceptibility Mapping Using Support Vector Regression and Hyper-Parameter Optimization, J. Flood Risk Manage., 16, e12920, https://doi.org/10.1111/jfr3.12920, 2023.
Schubert, J. E. and Sanders, B. F.: Building Treatments for Urban Flood Inundation Models and Implications for Predictive Skill and Modeling Efficiency, Adv. Water Resour., 41, 49–64, https://doi.org/10.1016/j.advwatres.2012.02.012, 2012.
Schubert, J. E., Luke, A., AghaKouchak, A., and Sanders, B. F.: A Framework for Mechanistic Flood Inundation Forecasting at the Metropolitan Scale, Water Resour. Res., 58, e2021WR031279, https://doi.org/10.1029/2021WR031279, 2022.
Sheridan, S. C., Lee, C. C., Adams, R. E., Smith, E. T., Pirhalla, D. E., and Ransibrahmanakul, V.: Temporal Modeling of Anomalous Coastal Sea Level Values Using Synoptic Climatological Patterns, J. Geophys. Res.-Oceans, 124,6531–6544, https://doi.org/10.1029/2019JC015421, 2019.
Sridhar, V., Ali, S. A., and Sample, D. J.: Systems Analysis of Coupled Natural and Human Processes in the Mekong River Basin, Hydrology, 8, 140, https://doi.org/10.3390/hydrology8030140, 2021.
Stone, M.: Cross-Validatory Choice and Assessment of Statistical Predictions, J. Roy. Stat. Soc. Ser. B, 36, 111–133, https://doi.org/10.1111/j.2517-6161.1974.tb00994.x, 1974.
Stow, C. A., Roessler, C., Borsuk, M. E., Bowen, J. D., and Reckhow, K. H.: Comparison of Estuarine Water Quality Models for Total Maximum Daily Load Development in Neuse River Estuary, J. Water Resour. Pl. Manage., 129, 307–314, https://doi.org/10.1061/(ASCE)0733-9496(2003)129:4(307), 2003.
Sun, D., Xu, J., Wen, H., and Wang, Y.: An Optimized Random Forest Model and Its Generalization Ability in Landslide Susceptibility Mapping: Application in Two Areas of Three Gorges Reservoir, China, J. Earth Sci., 31, 1068–1086, https://doi.org/10.1007/s12583-020-1072-9, 2020.
Teng, J., Jakeman, A. J., Vaze, J., Croke, B. F. W., Dutta, D., and Kim, S.: Flood Inundation Modelling: A Review of Methods, Recent Advances and Uncertainty Analysis, Environ. Model. Softw., 90, 201–216, https://doi.org/10.1016/j.envsoft.2017.01.006, 2017.
USGS.: TNM Download V2, https://apps.nationalmap.gov/downloader/ (last access: 1 May 2023), 2022.
Viglione, A., Di Baldassarre, G., Brandimarte, L., Kuil, L., Carr, G., Salinas, J. L., Scolobig, A., and Blöschl, G.: Insights from Socio-Hydrology Modelling on Dealing with Flood Risk – Roles of Collective Memory, Risk-Taking Attitude and Trust, J. Hydrol., 518, 71–82, https://doi.org/10.1016/j.jhydrol.2014.01.018, 2014.
Wagenaar, D., Lüdtke, S., Schröter, K., Bouwer, L. M., and Kreibich, H.: Regional and Temporal Transferability of Multivariable Flood Damage Models, Water Resour. Res., 54, 3688–3703, https://doi.org/10.1029/2017WR022233, 2018.
Wang, J., Tang, Q., Yun, X., Chen, A., Sun, S., and Yamazaki, D.: Flood Inundation in the Lancang-Mekong River Basin: Assessing the Role of Summer Monsoon, J. Hydrol., 612, 128075, https://doi.org/10.1016/j.jhydrol.2022.128075, 2022.
Wang, Z., Lai, C., Chen, X., Yang, B., Zhao, S., and Bai, X.: Flood Hazard Risk Assessment Model Based on Random Forest, J. Hydrol., 527, 1130–1141, https://doi.org/10.1016/j.jhydrol.2015.06.008, 2015.
Wan Jaafar, W. Z. and Han, D.: Uncertainty in Index Flood Modelling Due to Calibration Data Sizes, Hydrol. Process., 26, 189–201, https://doi.org/10.1002/hyp.8135, 2012.
Wenger, S. J. and Olden, J. D.: Assessing Transferability of Ecological Models: An Underappreciated Aspect of Statistical Validation, Meth. Ecol. Evol., 3, 260–267, https://doi.org/10.1111/j.2041-210X.2011.00170.x, 2012.
Youssef, A. M., Pradhan, B., Dikshit, A., and Mahdi, A. M.: Comparative Study of Convolutional Neural Network (CNN) and Support Vector Machine (SVM) for Flood Susceptibility Mapping: A Case Study at Ras Gharib, Red Sea, Egypt, Geocarto Int., 37, 11088–11115, https://doi.org/10.1080/10106049.2022.2046866, 2022.
Zahura, F. T., Goodall, J. L., Sadler, J. M., Shen, Y., Morsy, M. M., and Behl, M.: Training Machine Learning Surrogate Models From a High-Fidelity Physics-Based Model: Application for Real-Time Street-Scale Flood Prediction in an Urban Coastal Community, Water Resour. Res., 56, e2019WR027038, https://doi.org/10.1029/2019WR027038, 2020.
Zhang, F., Zhu, X., and Liu, D.: Blending MODIS and Landsat Images for Urban Flood Mapping, Int. J. Remote Sens., 35, 3237–3253, https://doi.org/10.1080/01431161.2014.903351, 2014.
Zhao, G., Pang, B., Xu, Z., Peng, D., and Zuo, D.: Urban Flood Susceptibility Assessment Based on Convolutional Neural Networks, J. Hydrol., 590, 125235, https://doi.org/10.1016/j.jhydrol.2020.125235, 2020.
Zheng, X., Tarboton, D. G., Maidment, D. R., Liu, Y. Y., and Passalacqua, P.: River Channel Geometry and Rating Curve Estimation Using Height above the Nearest Drainage, J. Am. Water Resour. Assoc., 54, 785–806, https://doi.org/10.1111/1752-1688.12661, 2018.
Zhu, D., Ren, Q., Xuan, Y., Chen, Y., and Cluckie, I. D.: An Effective Depression Filling Algorithm for DEM-Based 2-D Surface Flow Modelling, Hydrol. Earth Syst. Sci., 17, 495–505, https://doi.org/10.5194/hess-17-495-2013, 2013.
Zhu, J.-J., Yang, M., and Ren, Z. J.: Machine Learning in Environmental Research: Common Pitfalls and Best Practices, Environ. Sci. Technol., 57, 17671–17689, https://doi.org/10.1021/acs.est.3c00026, 2023.