the Creative Commons Attribution 4.0 License.
the Creative Commons Attribution 4.0 License.
 | 19 Jul 2024
Estuarine hurricane wind can intensify surge-dominated extreme water level in shallow and converging coastal systems
James J. Benedict
Ning Sun
Zhaoqing Yang
Robert D. Hetland
David Judi
Taiping Wang
Based on the projected increase in hurricane landfall frequency on the middle to lower US east coast, we examined the crucial role of the estuarine wind field in exacerbating coastal flooding. A regionally refined atmospheric and two high-resolution hydrology and ocean models are integrated to provide plausible and physically consistent ensembles of hurricane events and the associated flooding inside the Delaware Bay and River, a US mid-Atlantic estuary. Model results show that the hurricane propagation direction, estuarine geometry, remote surge from the open ocean, and direct nearshore upwind stress could magnify the flood magnitude. More specifically, inland-bound tracks that make landfall before reaching the mid-Atlantic coast produce a more significant surge within Delaware Bay than the shore-parallel tracks, where the estuarine wind direction plays the primary role in surge amplification. Ultimately, this study emphasized the need for integrated models to capture the nonlinear dynamics and interactions in flood hazard modeling.
- Article
(14231 KB) - Full-text XML
-
Supplement
(1147 KB) - BibTeX
- EndNote


Due to their low-lying topography and high population densities, coastal cities and estuaries are particularly susceptible to storm surges, which result in significant economic and social impacts like damage to infrastructure, loss of property and livelihoods, and loss of life (Dietrich et al., 2010; Bilskie et al., 2016; Valle-Levinson et al., 2020). Recent climate studies have indicated that, under different greenhouse gas emission rates and global warming scenarios, there is a potential for more frequent hurricane landfalls on the US Atlantic coast at the end of the 21st century (Knutson et al., 2022; Balaguru et al., 2023). Some other works have shown a potential increase in hurricane maximum intensity (Emanuel, 2005, 2021), an increase in the 10 m wind speed (Roberts et al., 2020), and a decrease in translation speed (Emanuel, 2021; Garner et al., 2021) in the future. These projected trends in hurricane characteristics can amplify the risk faced by coastal cities and estuaries to storm surges and coastal flooding in the future climate. More recently, using Coupled Model Intercomparison Project version 5 (CMIP5) global climate model datasets, Weaver and Garner (2023) examined the hurricane landfall patterns on the US east coast for a warmer climate. They showed a positive trend in hurricane genesis points moving northward and making more landfalls along the mid-Atlantic region as they traveled through the US northeast (similar to Hurricane Irene 2011). This is a matter of concern for the US mid-Atlantic region that covers two of the largest estuaries in the US: the Delaware and Chesapeake bays. These estuarine regions house ∼ 27 million inhabitants, a large density of metropolitan areas, natural ecosystems (e.g., salt marshes and freshwater wetlands), transportation networks, and industrial ports (Callahan and Leathers, 2021). The hurricane landfall trend in this area certainly raises interest in the associated storm surge hazard that might help develop flood risk assessment tools for federal, state, and local agencies.
To estimate the hurricane-induced flood risk, significant effort has been invested in storm surge prediction using high-resolution numerical models that resolve fundamental underlying physics (Weisberg and Zheng, 2006; Wang et al., 2008; Hu et al., 2009; Dietrich et al., 2011). However, a significant impediment to accurate storm surge predictions continues to be the uncertainty in predicting hurricane properties that drive storm surge (Cyriac et al., 2018; Cangialosi et al., 2020). More specifically, an inaccurate representation of any of these hurricane characteristics – intensity, size, translation speed, and the angle of landfall with the coast – can introduce large biases in predicting the surge and coastal flooding (Suh and Lee, 2018). In a recent study, Hsu et al. (2023) examined the role of these variables for three different hurricanes that propagated through the South Atlantic Bight (Hurricane Matthew in 2016, Hurricane Dorian in 2019, Hurricane Isaias in 2020) and showed how they affect the peak storm surge and wave runup on the South Atlantic coastline. For the same region, Parker et al. (2023) demonstrated that various combinations of tide, non-tidal residual, and wave setup and their spatially varying interaction can control the total water level at different US Southeast Atlantic coastline regions. In addition, storm surge also strongly depends on the local geometry of the basin and bathymetric features (e.g., the angle of a coastline) such that an adequate representation of the system's geometry is essential for properly estimating the hydrodynamic response (Weisberg and Zheng, 2006; Resio and Westerink, 2008; Suh and Lee, 2018). Geometry is especially important in estuarine regions, where the storm surge and storm tide (sum of surge and the astronomical tide) propagation and flood generation can vary spatially based on the size and bathymetry of the bay, cross-sectional area, the shape of the system (e.g., funnel-shaped estuary, rectangular shaped tidal lagoons), and river discharge from the hurricane-induced precipitation (Mori et al., 2014; Familkhalili and Talke, 2016). In general, in hyper-tidal estuaries (exhibiting large tidal range) or convergent estuaries (channel area convergence dominates bottom friction), the variability in tide–surge interaction can amplify the extreme water level (Lyddon et al., 2018). In addition, the magnitude and duration of the estuarine winds during hurricane landfall can exacerbate the spatial extent and amplitude of surge-driven flooding (Shen et al., 2006a; Weisberg and Zheng, 2008).
In shallow estuaries, the local wind field can create a surface slope between the bay mouth and the upstream end (Weisberg and Zheng, 2006, 2008). This evolution becomes much more complex for a convergent system where the nonlinear interaction between the tide, surge, and local geometry influences the flow acceleration, ultimately amplifying or damping the surge-induced flooding (Wong and Moses-Hall, 1998). When the remote surge generated by the wind field in the open ocean reaches the coastal environment, it interacts with the estuarine wind and generates a complex setup or setdown within the estuary (Shen et al., 2006b; Defne et al., 2019). There have been many studies on the storm surge hindcast and long-term flood hazard projections for different coastal or estuarine regions (e.g., Villarini et al., 2014; Wahl et al., 2015; Marsooli et al., 2019; Lin et al., 2019; Bates et al., 2021; Gori et al., 2022); however, the effect of estuarine winds on surge amplification during hurricane landfall is not often separately analyzed. For several US coastal regions, Lin et al. (2010) and Marsooli and Lin (2018) used higher-resolution hydrodynamic models to assess the sensitivity of coastal flooding to different storm characteristics, but they also focused primarily on the overall surge evolution during the entire hurricane period and not on the local amplification by the nearshore wind field during landfall.
Similarly, several other studies used the simplified storm surge model – Sea, Lake, and Overland Surges from Hurricanes (SLOSH; Jelesnianski, 1992) – to assess basin-scale flooding from individual extreme events (Powell and Houston, 1996; Houston et al., 1999) or the ensemble of probabilistic hurricane tracks (Taylor and Glahn, 2008). While these studies extensively discussed the role of landfall location, wind direction, and coastal geometry, the role of estuarine wind in the local amplification of storm surge remained unexplored. Also, it should be noted that in a system with an irregular bottom and rapidly converging width, it is challenging to assess the role of estuarine wind using simplified models like SLOSH due to the absence of advective terms in the momentum equations, exclusion of the river flow, and the parametric representation of the hurricane wind field (Glahn et al., 2009). To properly examine the role of estuarine wind and the nonlinear interaction in surge amplification in a complex system, an integrated modeling framework with higher-order physics is required that resolves the atmospheric, hydrologic, and hydrodynamic processes during hurricane landfall.
This study aimed to answer, depending on the estuarine wind field (i.e., landfall location and wind direction), how different the hydrodynamic responses during flooding are when compared between an inland hurricane (making landfall before reaching Delaware Bay) and a shore-parallel track (making landfall after passing Delaware Bay). This is an important question because of the potential changes in landfall trends in a warmer climate in the US mid-Atlantic region. We focused on two tasks: (1) integrating an earth system model (Energy Exascale Earth System Model (E3SM); Golaz et al., 2022) with high-resolution models that couple the hydrology (Distributed Hydrology Soil Vegetation Model (DHSVM); Wigmosta et al., 1994) and hydrodynamic (Finite Volume Community Ocean Model (FVCOM); Chen et al., 2003) models to provide a high-fidelity flood estimate and (2) evaluating the role of the estuarine wind field in amplifying storm surge during hurricane landfall. We chose Delaware Bay and River (DBR), a shallow and convergent estuary in the US mid-Atlantic, historically highly vulnerable to storm-induced flooding. We also selected Hurricane Irene (2011) as a focal event for the study, which caused one of the most severe estuary-wide flood hazards in DBR. Using E3SM, we first perturbed Hurricane Irene (2011) to get an ensemble of Irene-like tracks with different characteristics. Then using the coupled DHSVM–FVCOM, we predicted the total water level from different tracks and the flood distribution along the entire DBR. Incorporating these three models provided a high-fidelity representation of coupled atmospheric, fluvial, and coastal processes, which allows for improved flood estimates for Irene-like events. Finally, we separately looked at the role of the estuarine wind field in amplifying the surge as the tide propagates upstream.
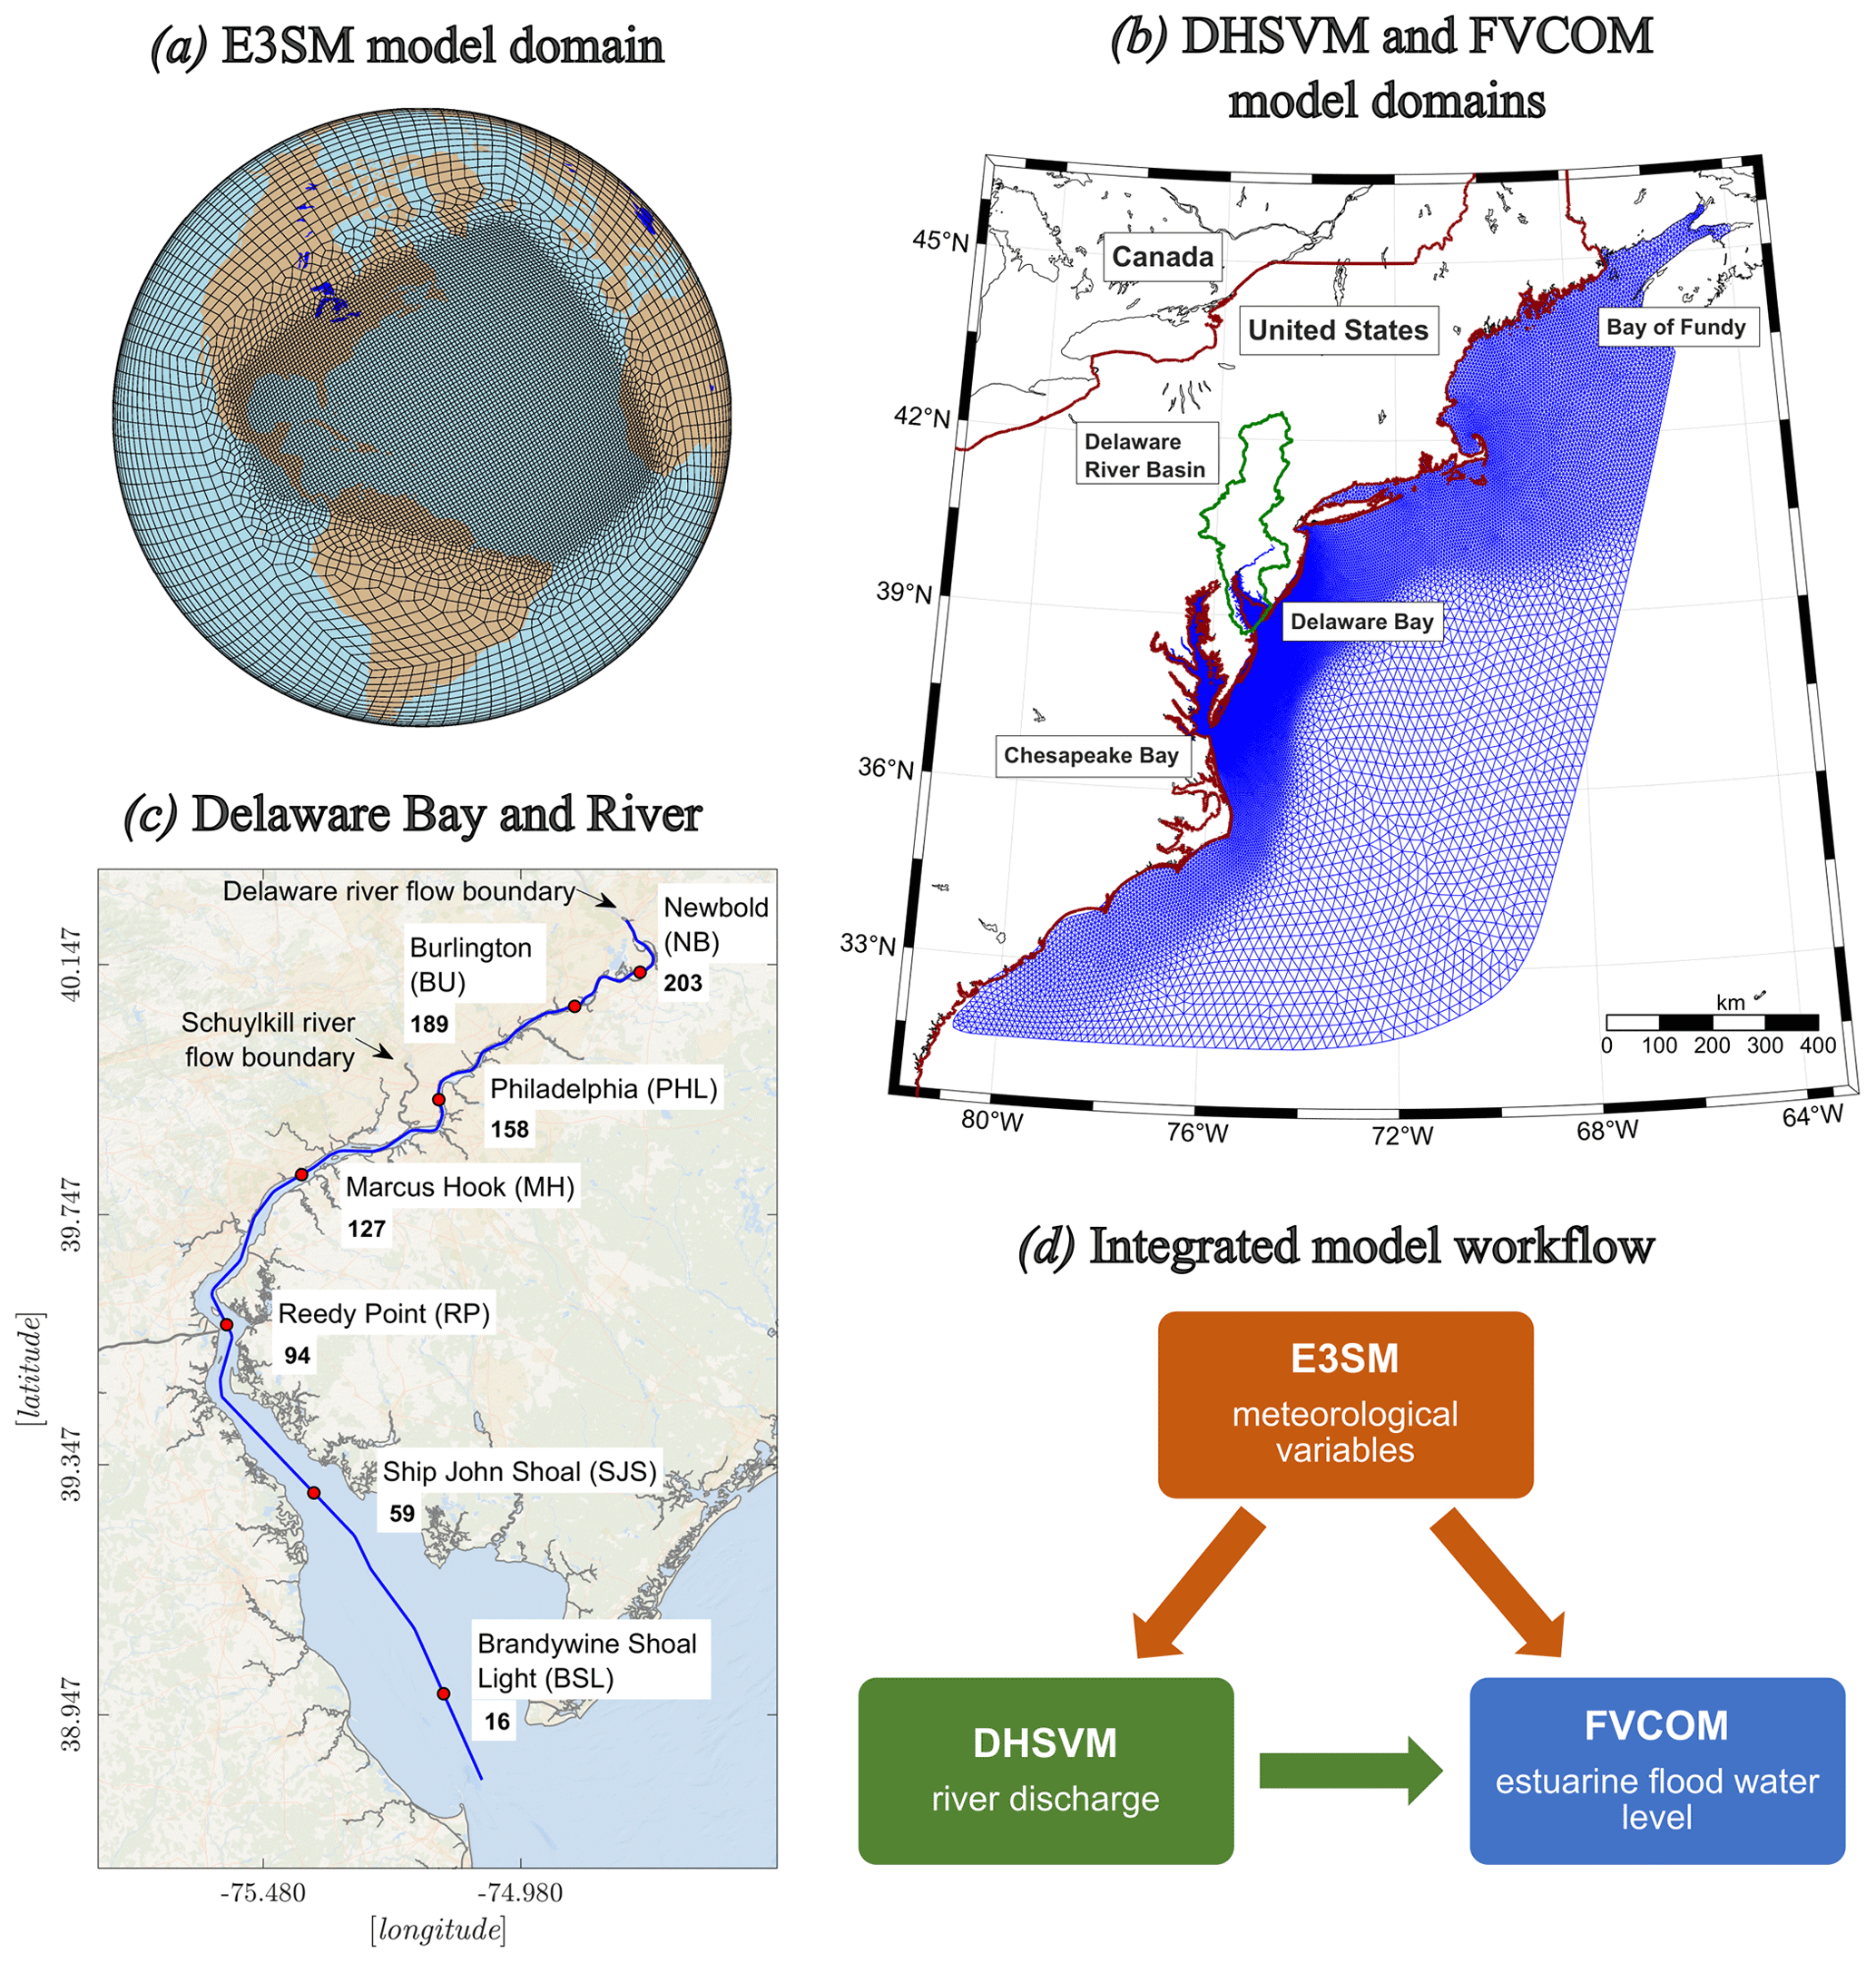
Figure 1(a) E3SM grid resolution: 100 km globally uniform resolution and a 25 km resolution over the North Atlantic. (b) Regional-scale model domains, where blue triangles show the FVCOM grid cells and green polygons represent the DHSVM model coverage. (c) Focus area of the study, Delaware Bay and River (DBR). Red circles show tide gauge locations used for FVCOM model validation with their distance from the bay mouth (in kilometers). (d) Schematic showing the coupling strategy between the different models used in this study.
The US DOE Energy Exascale Earth System Model version 2 (hereafter, “E3SM”; Golaz et al., 2022) is used to simulate an ensemble of Irene-like tracks. E3SM integrations are conducted using prognostic atmosphere, land, and river model components, while oceanic sea surface temperatures (SSTs) and sea ice cover are prescribed based on observations (Huang et al., 2021). The atmosphere model version used in this study has 71 levels and uses a regionally refined horizontal grid mesh of ∼ 25 km over the North Atlantic basin and eastern North America with a coarser horizontal resolution (∼ 100 km) outside this region (Fig. 1a and as described in and used by Zarzycki et al., 2017). The atmosphere model is initialized globally based on ECMWF Reanalysis version 5 (ERA5; Hersbach et al., 2020), and all simulations span 30 d to cover the atmospheric spin-up and evolution of Hurricane Irene as well as the meteorological conditions in the wake of the event. Additional details of the E3SM setup and validation metrics are found in Appendix A.
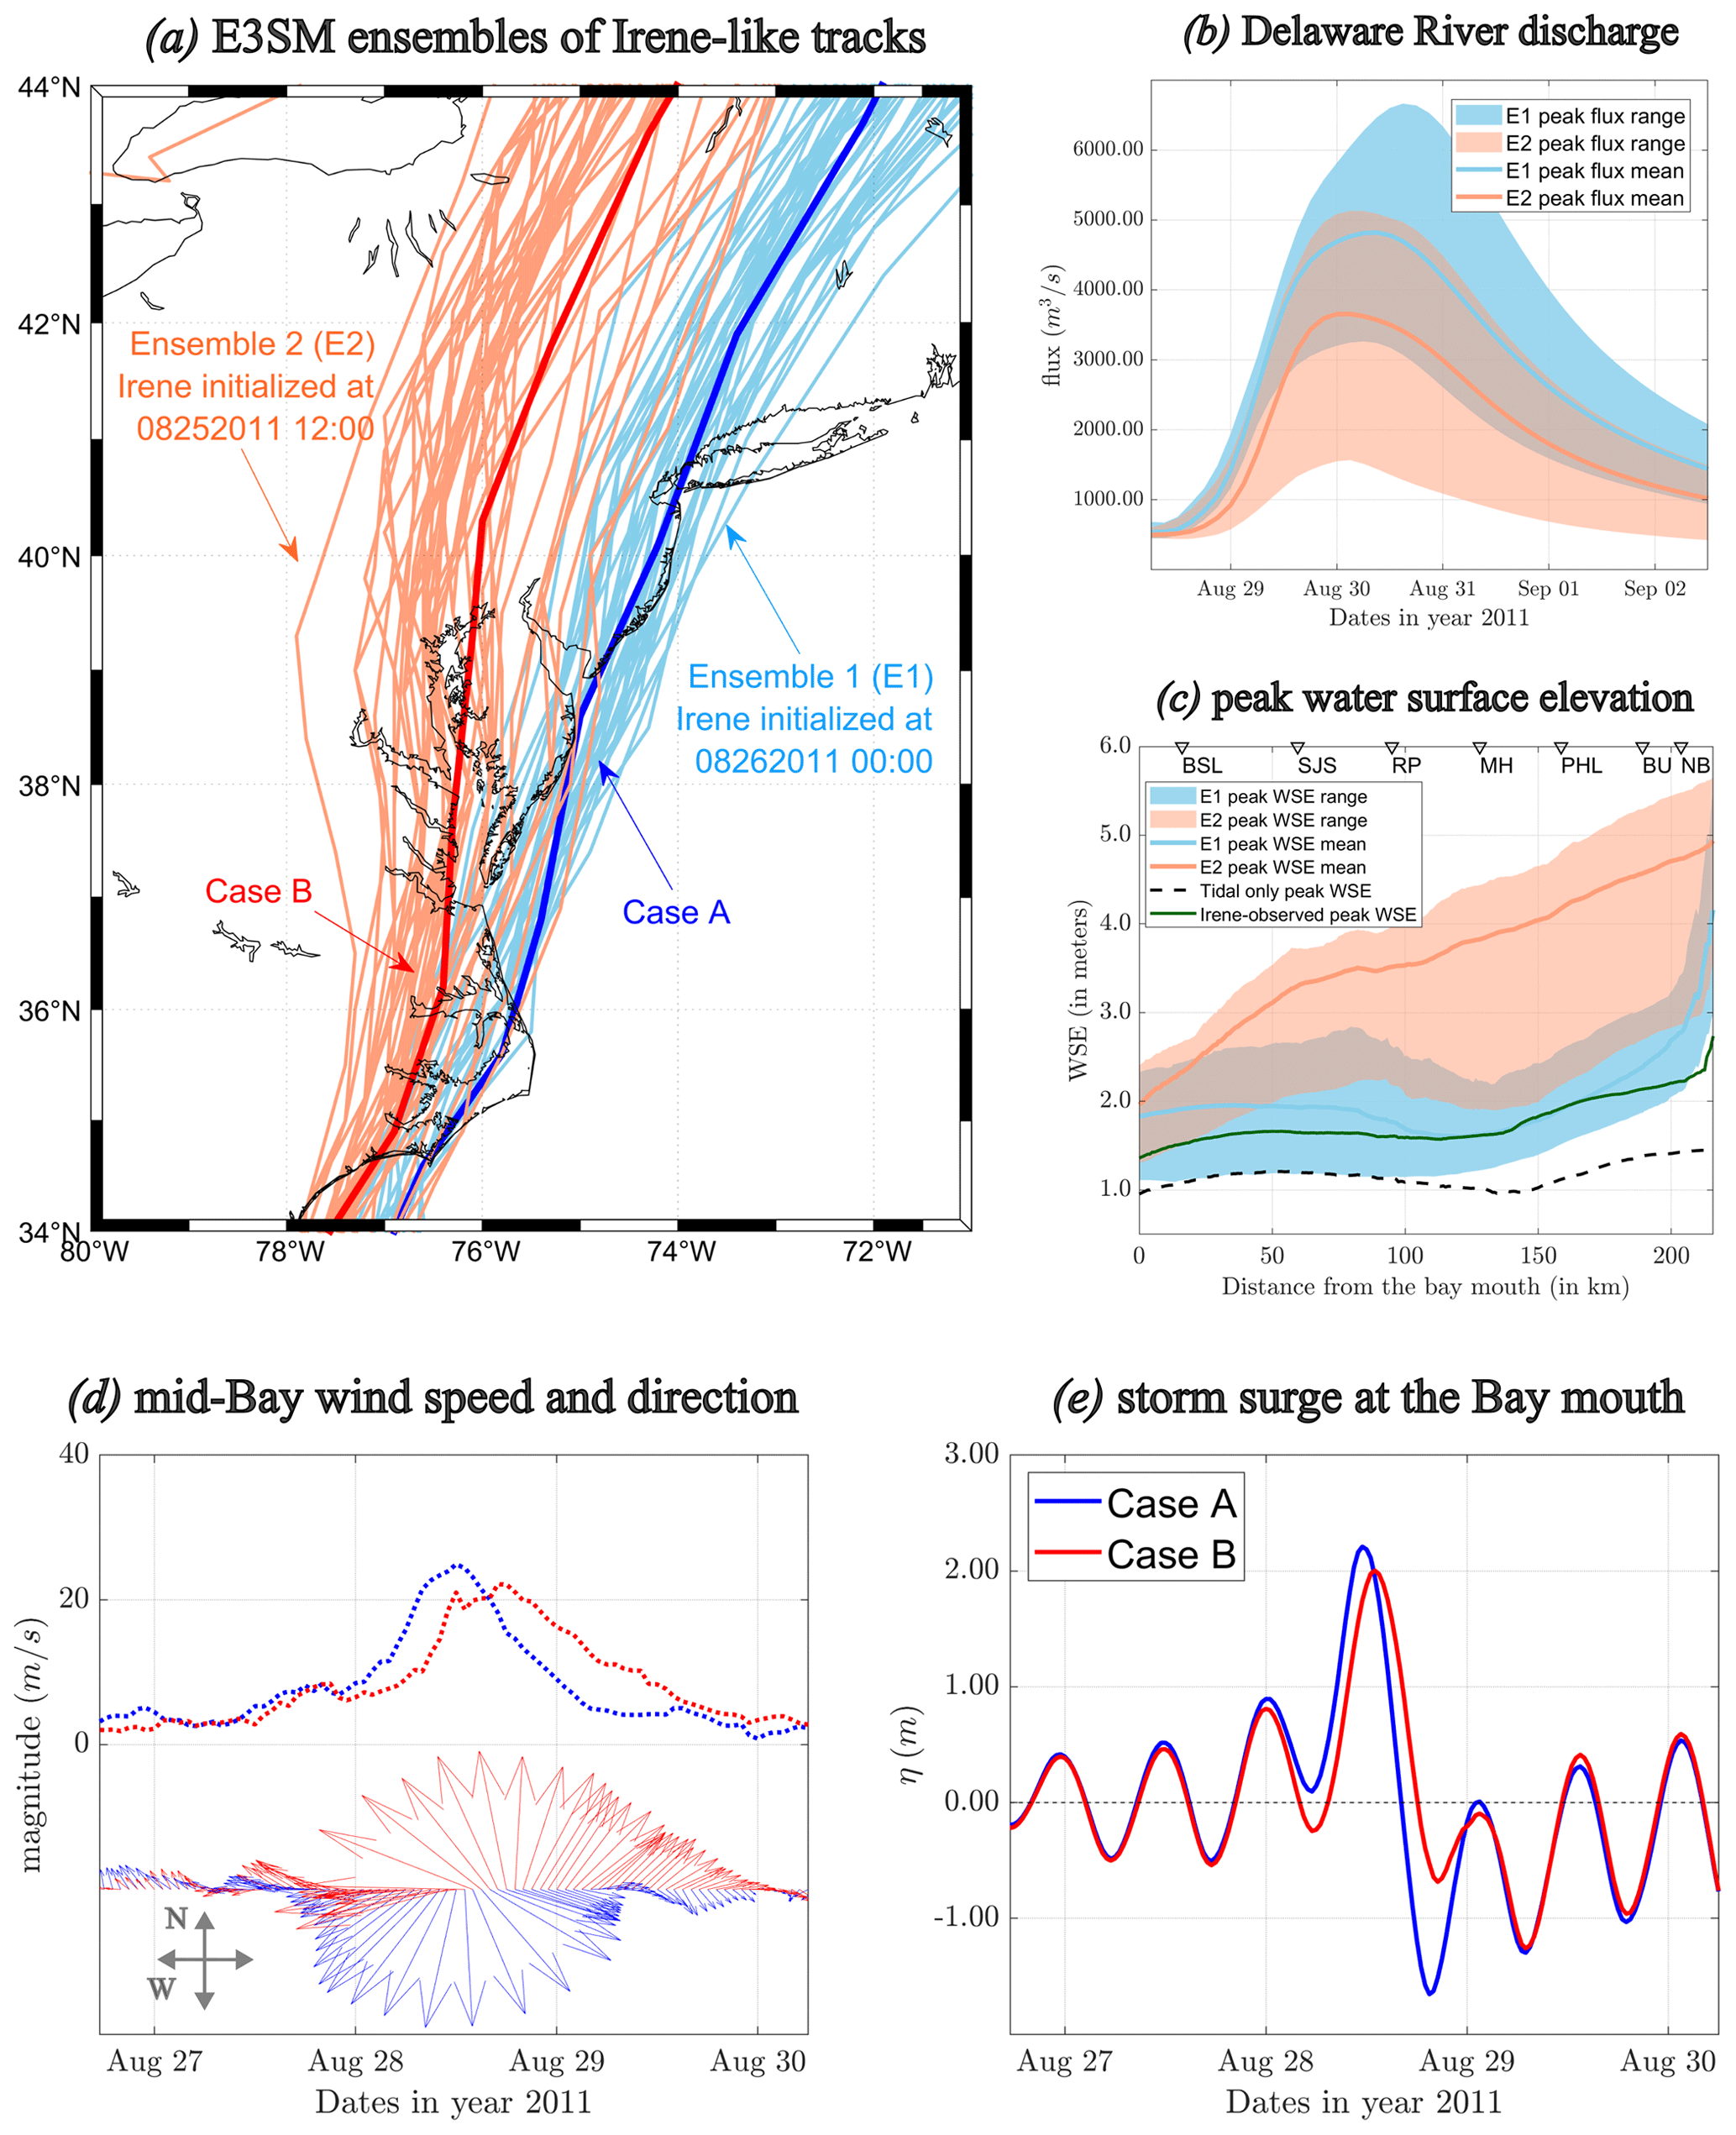
Figure 2(a) Ensembles of Irene-like tracks generated using E3SM. (b) Delaware River discharge for the tracks in (a) by DHSVM. (c) Predicted peak water surface in DBR using FVCOM. The observed peak water surface elevation during Hurricane Irene is shown using a solid green line. (d) Estuarine wind speed and direction (lengths of the vectors are scaled using wind speed) for Cases A and B. (e) Storm surge elevation for the same events.
We conduct an E3SM ensemble to acknowledge (a) our incomplete understanding of the model physics and (b) the inherent uncertainty of model initial conditions. To address (a), we perturb model physics parameters to which tropical cyclones are most sensitive (He and Posselt (2015); see Appendix A for the list of perturbed parameters and additional information on the model ensemble setup and analyses). This is accomplished by first defining acceptable numerical ranges for each parameter of interest (based on He and Posselt, 2015) and then randomly drawing 50 values within those ranges to use within the model integration. In this way, 50 unique parameter “sets” are created. To address (b), E3SM is initialized at two times separated by 12 h (26 August 2011 00Z (hereafter “E1”) and 25 August 2011 12Z (hereafter “E2”)). Both the ERA5-based meteorological patterns and the diagnosed storm center at these two initialization times are slightly different from each other and ultimately result in a more diverse spread of simulated Irene tracks. E1 was identified as the optimal initialization time that produced reasonable Irene tracks at the earliest forecast lead time, while E2 was also retained to understand the sensitivities of the predicted tracks to large-scale meteorological patterns at initialization time. In total, two 50-member ensembles (E1 and E2) are generated (Fig. 2a).
Subsequently, we employ the Distributed Hydrology Soil Vegetation Model (DHSVM) to estimate the fluvial flooding in the Delaware River Basin. DHSVM used meteorological variables from the E3SM model as climate forcing, including precipitation, air temperature, downward shortwave and longwave radiation, wind speed, and relative humidity. DHSVM is a process-based, spatially distributed hydrological model that operates at the grid cell level. It simulates key overland and subsurface hydrological processes by solving the full energy and water balance equations. The model physics and formulations have been extensively described in the existing literature (e.g., Wigmosta et al., 1994; Sun et al., 2015, 2024; Perkins et al., 2019). For this study, we used a 90 m resolution for DHSVM in the Delaware River Basin and ran the model at a 3-hourly time step.
Finally, to predict the extreme water surface elevation (WSE) with the atmospheric and riverine forcings, we use the unstructured grid Finite Volume Community Ocean Model (FVCOM) (Chen et al., 2003), which has been extensively used for storm surge modeling in many estuaries worldwide (e.g., Weisberg and Zheng, 2006; Rego and Li, 2009). We chose the 3D barotropic and hydrostatic version, which resolves simplified Reynolds-averaged Navier–Stokes equations (with Boussinesq approximations). The model domain extends 700 km offshore from the mid-Atlantic coast to adequately capture the air–sea interaction and 215 km from the Delaware Bay mouth to the river flow boundary (Fig. 1b and c). The horizontal grid resolution is assigned to 25 km along the open-ocean boundary to 20 m in the river to seamlessly simulate the interaction between large- and small-scale flood processes. Subsequently, we enforced the lateral and sea surface boundary conditions: (1) tidal forcing at the open-ocean boundary (WSE from the TPXO8.0 global ocean tide model; Egbert and Erofeeva, 2002), (2) river flow from DHSVM, and (3) 10 m wind speed and mean sea-level pressure from E3SM. More details about the topography and bathymetry datasets used for grid development, activated model physics, and assigned numerical variables/coefficients are given in Deb et al. (2023).
At the onset, DHSVM-simulated daily flows (averaged from the 3-hourly flows) were validated against USGS daily flow observations at six gauge locations on the main stem of the Delaware River for Hurricane Irene (2011) (Appendix B). After observing a satisfactory model performance (Nash–Sutcliffe efficiency and the Kling–Gupta efficiency), we simulated the E3SM ensembles that produced a different range of peak river discharge at the Delaware River boundary, shown in Fig. 2b. The range and the ensemble mean of the river discharge from the two sets show a clear distinction, where the inland-oriented tracks (E2) produced a smaller magnitude and an earlier peak (∼ 12 h) compared to the shore-parallel tracks (E1). In this work, as we focused on the response of estuarine flooding to different hurricane characteristics, we directly used the DHSVM data as river forcing for FVCOM without discussing the underlying physical processes responsible for the variation in magnitude and phase of the fluvial discharge.
Before running FVCOM with meteorological conditions from E3SM and river forcing from DHSVM, we also validated the hydrodynamic model by comparing predicted WSE with the observed data for two hurricanes, Hurricane Irene (2011) and Hurricane Sandy (2012), that both had a devastating impact on DBR. For both cases, we found that the model successfully predicts the amplitude and phase of the storm surge and shows an excellent agreement between the model and observed data at various tide gauge locations throughout the system (Appendix C). Thus, the model was deemed fit for purpose for our subsequent studies using ensemble forcing.
The ensemble simulations, forced with two 50-member ensembles of Irene-like cases (E1 and E2), show significant variability (𝒪(1 m) standard deviation in WSE) in the range of along-channel peak WSE over the ensemble forcing (Fig. 2c). E2, with more inland tracks, generates a much higher range of surge than E1 for a significant portion of DBR; E2 also has a significantly higher ensemble mean WSE, especially in the mid-bay approximately 150 km from the mouth, where the E2-forced ensemble mean WSE is over 2 m higher (∼ 100 % increase) than the E1-forced case. E1, which produced reasonable Irene tracks (Fig. A1), also shows a fair range of WSE and an ensemble mean comparable to the observed along-channel peak WSE for Hurricane Irene (2011). Here, observed peak WSE means the FVCOM model WSE generated using reanalysis forcing and validated using field datasets. At the upstream end, near Newbold (NB), the peak WSE range deviates from the observed range due to the influence of river discharge and the biases that propagated from the E3SM precipitation field (details provided in Appendix A).
Interestingly, close to the bay mouth and near the upstream river boundary, the distributions of E1- and E2-forced WSE are similar despite strong differences in the mid-bay. The similarity at the bay mouth indicates that the offshore hurricane wind field (outside the bay) generated a narrow range of the remote surge, which propagated upstream from the bay entrance. Then, there is a local generation of storm surge inside the bay (between Brandywine Shoal Light (BSL) and Burlington (BU)), significantly higher for E2 likely due to a combination of the hurricane's estuarine wind field and convergence of the estuarine width. The river discharge plays a secondary role; we can see that for E1, which produces a much higher flux magnitude, the impact is only significant for the region between BU and NB (the narrowest portion near the DHSVM flow boundary). In general, for all the tracks from E1 and E2, the peak river discharge at the Delaware River boundary lagged behind the storm surge at the bay entrance by 2 d, making the impact of river discharge negligible during the landfall period on 28 August 2011 12Z. The higher surface slope near the river boundary for E1, shown in Fig. 2c, was generated primarily from the peak river discharge that occurred around 30 August 2011 12Z (Fig. 2b). While a similar along-channel gradient can also be generated for E2 around 30 August 2011 12Z, the significantly higher surge during the landfall (28 August 2011 12Z) elevated the peak WSE much more than the following river-discharge-driven condition. A more detailed explanation of this WSE variation is given in the following section.
In this section, we examined the impact of estuarine wind directions in amplifying storm surges along the converging DBR system. We selected two tracks from the ensembles – Cases A from E1 and B from E2 (Fig. 2a) – that produced a nearly similar surge at the Delaware Bay mouth (the “remote surge” hereafter), shown in Fig. 2e. Cases A and B also have comparable 10 m elevation wind magnitudes inside the bay (Fig. 2d), though the strongest winds are in opposite directions: Case A with a primarily northerly wind and Case B a southerly wind. We provided a more thorough description of different process comparisons that led to these event selections in the Supplement titled “Hurricane case selection”.
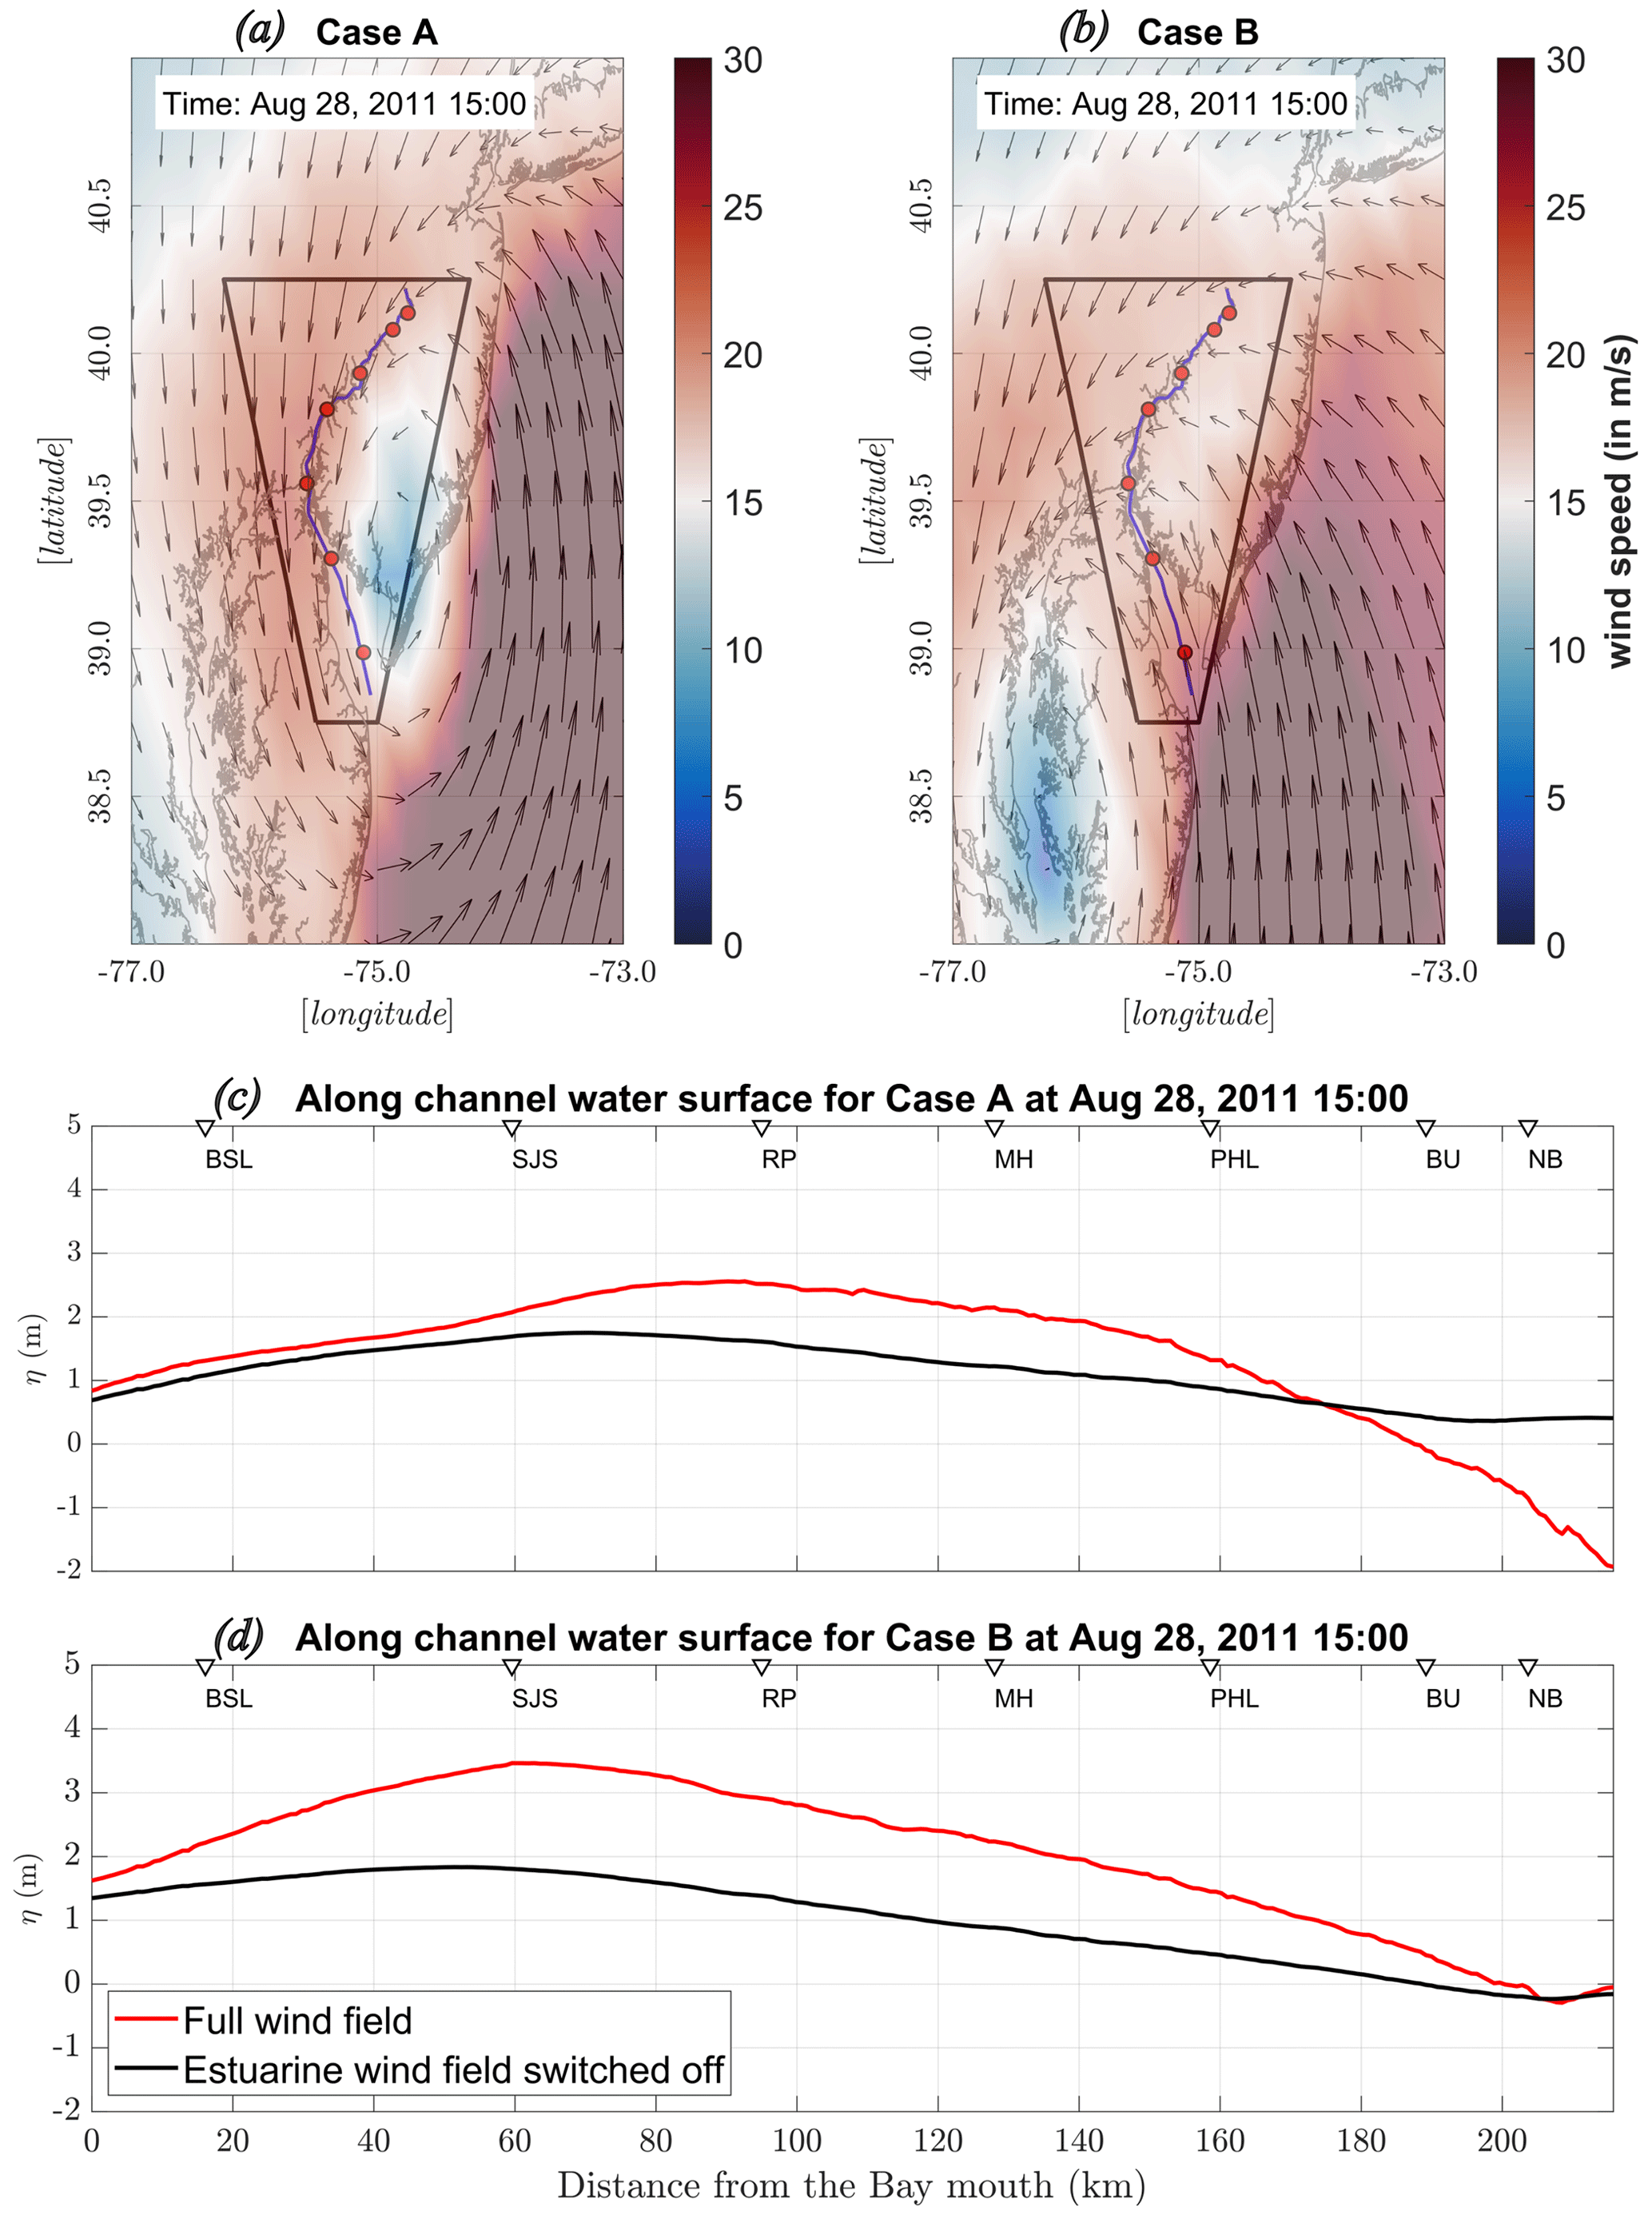
Figure 3(a, b) Instantaneous 10 m elevation wind field during the landfall for hurricane Cases A and B. Polygon shape drawn on top of DBR to represent the region used to dampen the wind stress. (c, d) Comparison of the instantaneous along-channel water surface with and without the estuarine wind for both cases.
Figure 3a and b show a 2D representation of hurricane wind field for the two events when the estuarine wind speed peaked (∼ 20 m s−1) inside DBR. To isolate the role of estuarine wind, we defined a region (the black polygon in Fig. 3a and b) that covers the hydrodynamic model domain from the bay mouth to the upstream model boundary. We used this bounding polygon to select the E3SM grid cells that fully cover the FVCOM model domain. FVCOM uses a bilinear interpolation method to assign wind velocity at the unstructured grid cells from the meteorological dataset. To represent a scenario with nominal estuarine wind during hurricane landfall, we multiplied the E3SM wind velocity vectors (in m s−1) within the polygon by 0.1 to uniformly dampen the wind magnitude in the selected cells, regardless of the instantaneous location of the hurricane. For the two cases, A and B, this artificial dampening reduced the peak wind speed magnitude to ∼ 2.0 m s−1, making the impact of the hurricane wind field negligible. In addition, the polygon and E3SM grid cells extensively covered the FVCOM model domain, going beyond the FVCOM boundary, to better interpolate the wind forcing. Figure 3c and d show the instantaneous WSE along the main channel for the two tracks based on simulations with and without the effect of estuarine wind fields within the defined region.
It is evident that the local estuarine wind stress plays a significant role in both cases in altering WSE as the storm surge propagates upstream. However, the estuarine wind plays a more prominent role in Case B, where the southerly wind is directed up-channel, and pushes more water northward into the converging portion of the bay, resulting in a rapid increase in the water level from BSL to NB (Fig. 2c). In contrast, Case A shows a markedly different response within the system, as the northerly wind causes a setdown at the upstream portion of DBR and a setup in the mid-bay resulting from the interaction of the local and remote surge, which produced higher flooding (∼ 1.0 m) between Ship John Shoal (SJS) and Philadelphia (PHL) (Fig. 3c).
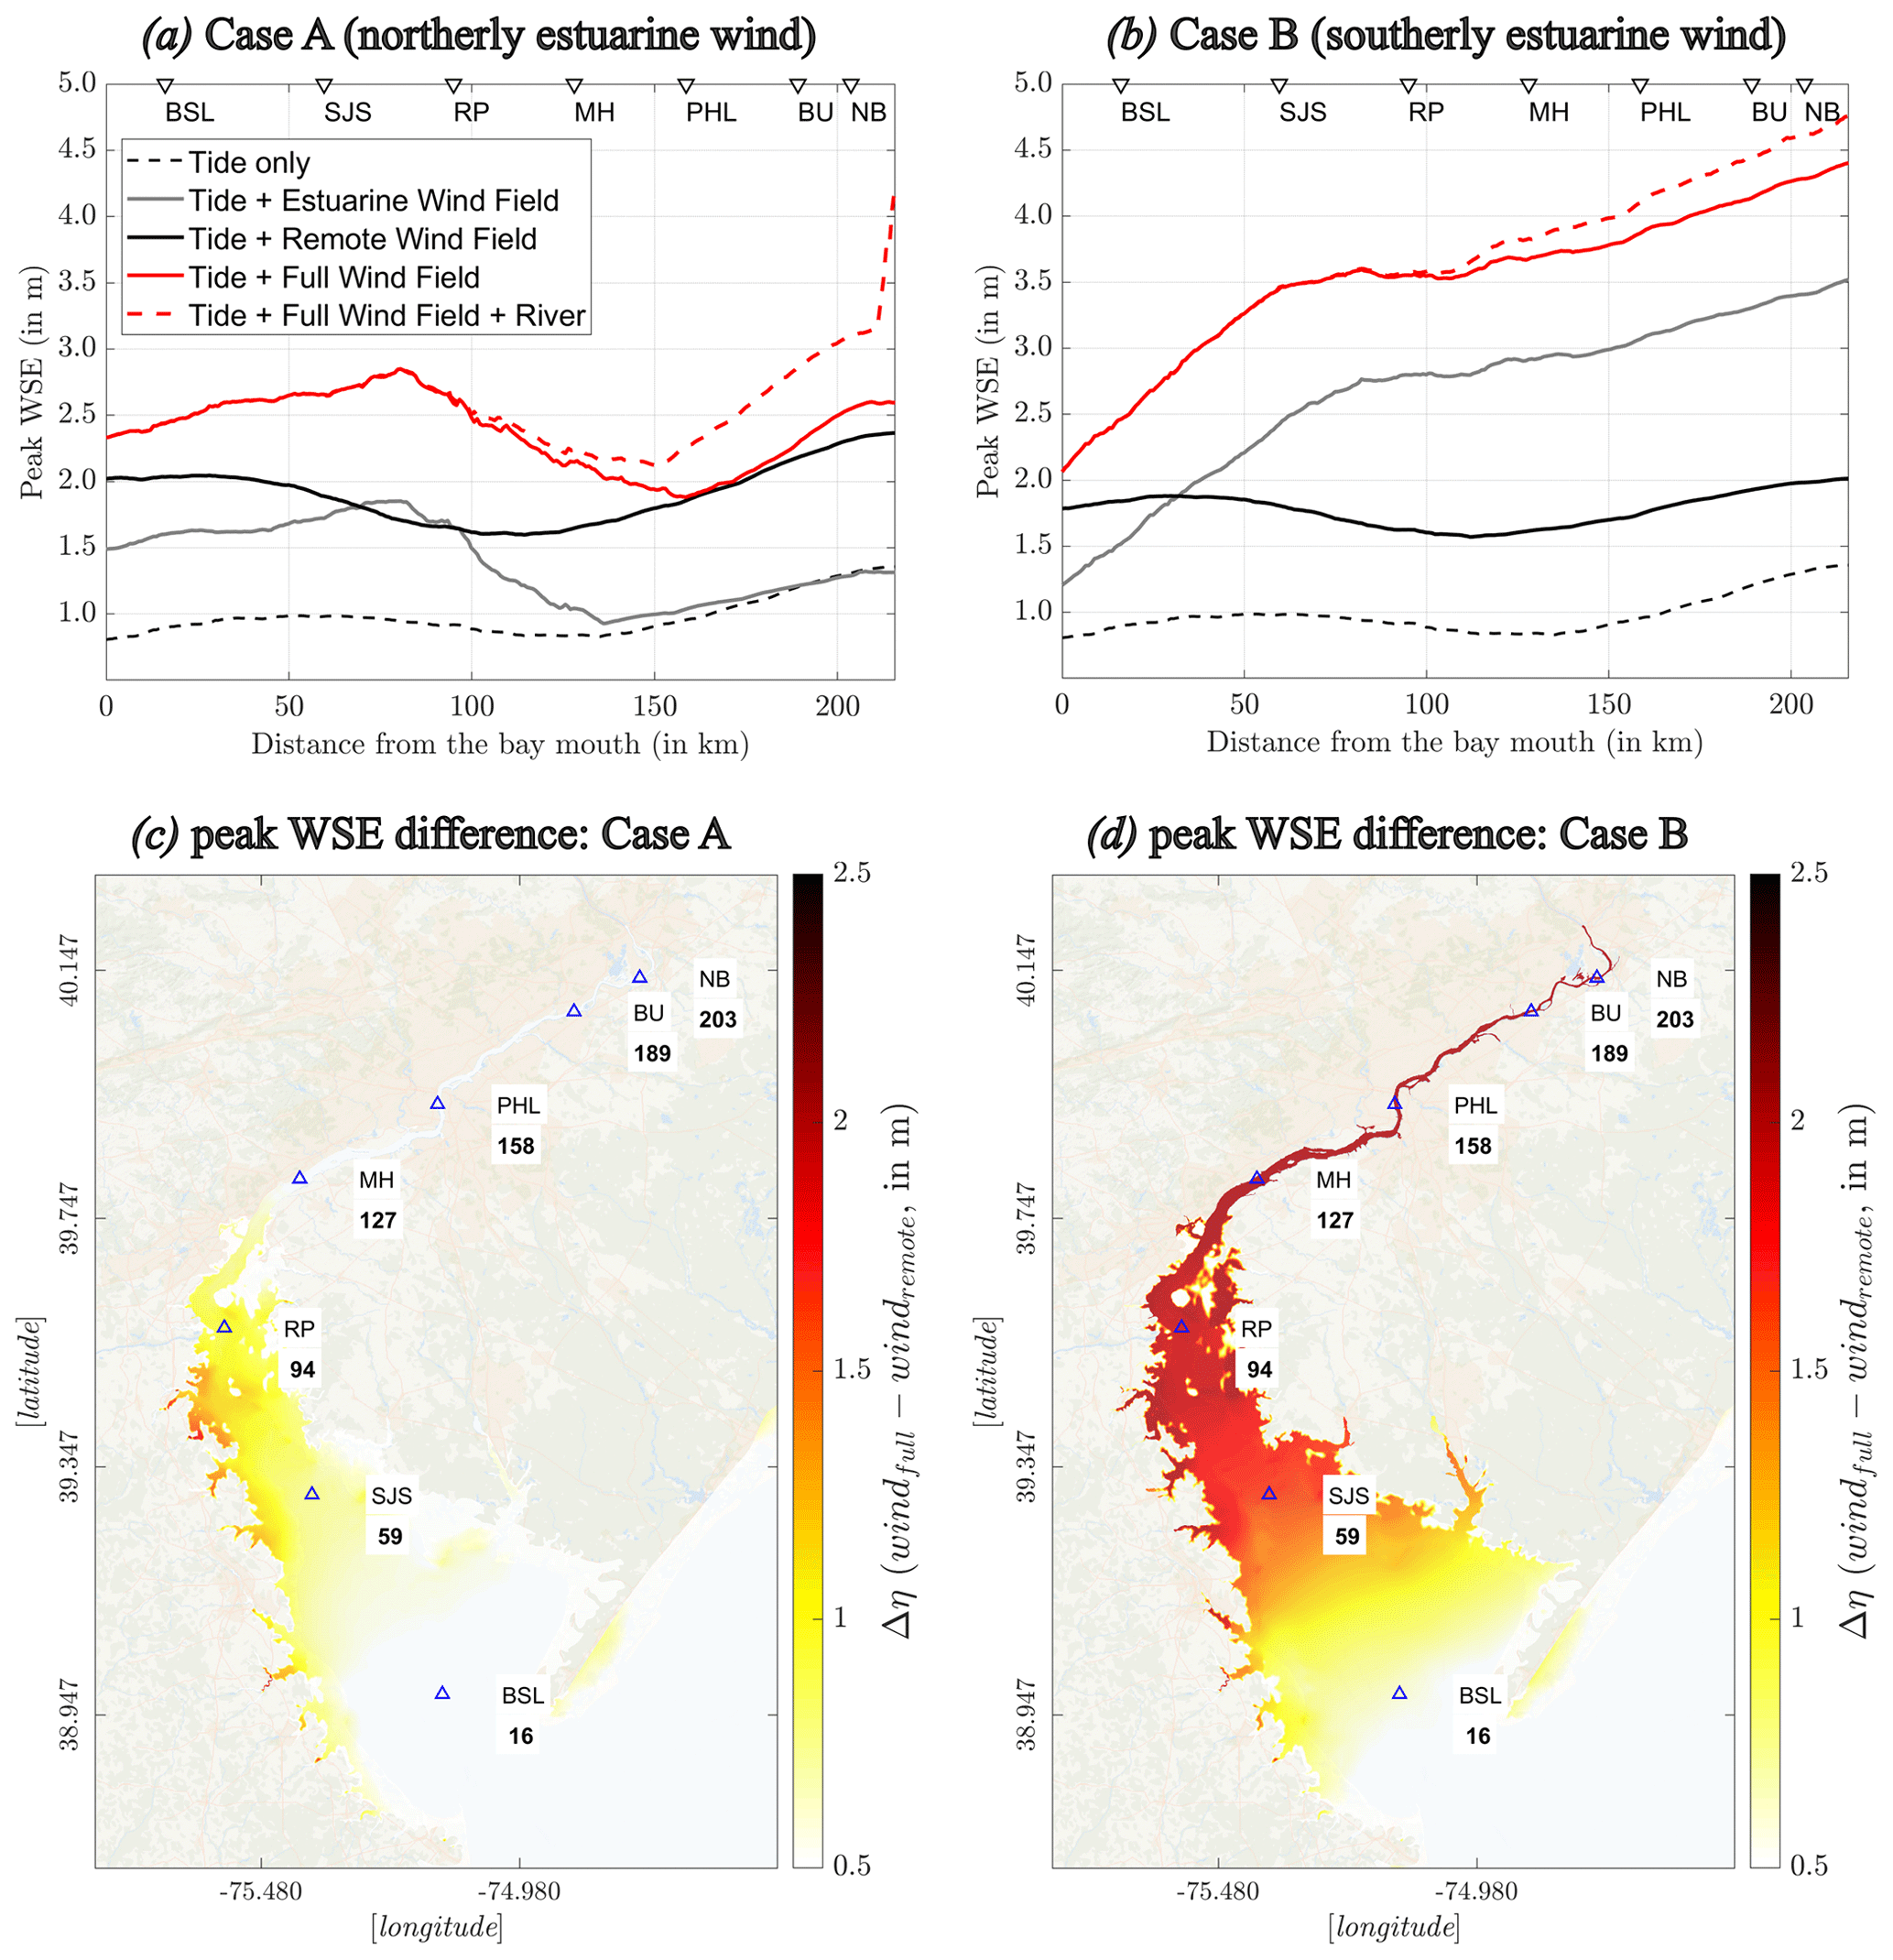
Figure 4(a, b) Changes to along-channel peak water surface elevation for different force combinations for Cases A and B. (c, d) The difference in peak water surface with and without estuarine wind for the same cases.
Previous studies have demonstrated how the local estuarine wind field created surface slope during hurricane landfalls at Tampa Bay, FL (Weisberg and Zheng, 2006), and Chesapeake Bay, VA (Shen et al., 2006b). They have shown that, in shallow estuaries, the cross-shore component of wind stress creates a large downwind surface slope and surge. To explain this process mechanistically, Wong and Trowbridge (1990) and Shen et al. (2006a) provided linear solutions for WSE along a hypothetical rectangular estuary by dividing the total water level into two parts: remote surge and setup/setdown from local wind forcing. While the linear and simplified momentum equations (using a constant bottom and width of the estuary) can provide a fundamental understanding of the spatially varying surge amplitude, the evolution of flooding becomes much more complex for a convergent system. In such cases, the nonlinear interaction between the tide, surge, and local geometry may increase or decrease along-channel WSE (Weisberg and Zheng, 2008; Xiao et al., 2021). In a complex system with irregular bottom and rapidly converging estuary width like DBR, the simplified equations cannot reasonably predict the surface variation shown in Fig. 3c and d, and a high-resolution 3D numerical modeling framework is necessary to address the nonlinear interactions and the associated surge generation.
The evolution of peak WSE for the entire period of the hurricanes was examined by designing a few scenarios to identify the primary drivers of estuarine storm surge intensity. In the hydrodynamic model run, surface wind stresses (estuarine, remote, and both) were included along with the tidal forcing in a sequence to explain the incremental flood amplification, shown in Fig. 4a and b. As described earlier, we multiplied the E3SM wind velocity vectors (in m s−1) by 0.1 outside and within the polygon (shown in Fig. 3a and b) to make estuarine and remote wind-stress-only cases, respectively. For Case A (with a northerly wind from E1), the estuarine wind aligned against the incident tidal wave (without remote surge) and produced a steep slope between Marcus Hook (MH) and SJS due to the complex tide–wind interaction and channel convergence. The downwind water surface pressure gradient in the estuary caused additional resistance to the propagating flood tide. Combined with the convergence effect, this nonlinear interaction amplified the bay water level (Fig. 4a). When the full wind field is included, we can see a similar along-channel peak WSE gradient where the difference in peak water level, varying from 0.73 to 1.05 m, came from the remote surge propagation through Delaware Bay. Figure 4a also shows that the remote surge, as it travels through the system, follows a similar trend of the peak tidal WSE where some amplitude damping occurs close to Reedy Point (RP) due to higher flooding of the surrounding low-lying wetlands. The combined effect of the remote surge and local setup from the estuarine wind field is attributed to a locally amplified flooding on the bay–river interaction zone (between SJS and MH), where the peak water surface increased by more than 1.0 m (∼ 60 %) at certain locations. A spatial map of the peak WSE difference between surge from the full wind field and the remote field only (Δη in meters) is given in Fig. 4c to demonstrate the extent of the flooding in the same zone. Finally, when the river discharge from the hurricane precipitation field is added to the full wind simulation, it seems to generate a steep WSE gradient and compound flooding on the upstream part of the Delaware River (Fig. 4a), where the river width is significantly narrower than the estuary and bay mouth.
Case B, with a southerly wind, shows much higher flooding (almost doubled near the head) for the full simulation than Case A (Fig. 4b). As the estuarine wind and remote surge propagated in the same direction, the direct upwind push of the water from the large bay surface raised the peak WSE from BSL to the upstream model boundary. While we can see a change in the water surface slope near SJS from the higher overland flooding, the combined WSE from wind-generated local surge and remote surge demonstrates a linear increase along the channel. Between BSL and SJS, the estuarine wind and remote surge interacted similarly to the previous observations of Wong and Trowbridge (1990) and Shen et al. (2006a). However, from SJS to the remaining narrow reach, the channel cross-section area convergence amplified the peak WSE as the wave propagated upstream. Compared to the remote-surge-only case, the combined estuarine wind and remote surge case produced a 2 m higher water surface elevation (∼ 100 % increase). The inclusion of river discharge did not make any notable difference in the upstream regions (as seen in Case A) due to the larger surge-driven channel water volume and surface area. Figure 4d shows the peak WSE difference (Δη) for Case B, where we see a dramatic increase in along-channel flooding from the estuarine wind field. This case illustrates that the local estuarine wind stress can significantly amplify WSE from the bay entrance to upstream regions in converging estuaries (nearly 2.5 m or 150 % for Case B), even when the offshore surge near the entrance is not catastrophic.
This study examined the role of different hurricane landfall locations and the associated estuarine wind field on the local amplification of storm surges in a converging coastal system. A key finding was that small differences in hurricane tracks could cause drastic differences in the bay surface wind stress (timescale is on the order of hours) and the along-channel storm surge response due to local geometry. Previous works related to the sensitivity of storm surge and coastal flooding to hurricane landfall locations, wind field (speed and direction), and geometry (e.g., Powell and Houston, 1996; Houston et al., 1999; Shen et al., 2006b; Weisberg and Zheng, 2008; Marsooli and Lin, 2018) have not separately examined the role of this shorter period (translation period through the estuary) and estuarine-scale landfalling wind using physics-based integrated modeling frameworks.
Thus, there is a clear need to better understand the complex, nonlinear response of storm surge to storm track, as simple metrics such as distance to storm track could be misleading and fail to capture the intricacies of the response. Further work is also needed to examine the role of hurricane intensity; the radius of maximum wind; translation speed; and the interaction between tide, non-tidal residual, and waves separately, all of which could similarly influence the coastal flood level (Suh and Lee, 2018; Parker et al., 2023; Hsu et al., 2023). These essential hurricane characteristics and oceanic processes can affect both the remote and local surge generation, requiring a future study focusing on their overall impact on the same area. Also, this work emphasized the utility of a model hierarchy, which is crucial for accurately representing important localized factors such as the estuarine wind field. This approach is essential for improving future coastal hazard projections on the US Atlantic coast for a warmer climate.
The integrated modeling framework combining an earth system model (E3SM), hydrology model (DHSVM), and hydrodynamic model (FVCOM) helped generate two plausible and physically consistent ensembles of Irene-like events, associated river discharge, and the coastal flood water level, respectively. Peak water surface elevation inside Delaware Bay and River, a shallow and convergent system, showed a pivotal relationship with the estuarine wind directions. Even though tracks in E2 (inland hurricanes) made landfall much earlier before reaching the bay compared to E1 (shore-parallel hurricanes), and both had a similar storm surge magnitude at the bay mouth (propagated from the open ocean), the inland-oriented tracks produced greater flooding inside the bay and river despite much smaller river discharge. Upon examining the flood generation mechanisms step-by-step, we observed that the estuarine hurricane wind could significantly amplify flooding in shallow and converging estuaries when it follows the surge propagation direction. Case B, which has shown this effect, produced a nearly 2.5 m or 150 % increase in the peak WSE from the bay entrance to the upstream river portion compared to the case with remote surge only. The water surface gradient demonstrated a spatially varying effect of the nonlinear interaction between tide, surge, wind stress, and the estuary geometry, where the channel convergence rapidly raised the peak WSE as the flood wave propagated upstream. When the surge and estuarine wind direction opposed each other (as seen for E1), the complex interaction produced a setdown in the river, a setup in the bay, and a higher surge in the middle of the estuary. As shown for Case A, while the flooding is limited to the mid-portion of the estuary, the peak WSE increased again by more than 60 % compared to the case without bay surface wind stress.
Ultimately, the analysis showed that even if a hurricane makes landfall before reaching the mid-Atlantic region and does not bring a record extreme water level near the bay mouth from offshore, the direct upwind forcing over the estuarine surface area itself can produce a record level of flooding if it aligns with the surge direction. In converging estuarine systems worldwide (e.g., the Delaware Bay and River (USA), Humber Estuary (UK), Hooghly Estuary (India), the Meghna River Estuary (Bangladesh), and the Pearl River Estuary (China)) that are highly vulnerable to hurricane-induced flooding, physically consistent and integrated modeling frameworks are critical to correctly resolve these nonlinear tide, wind, and surge dynamics and improve the coastal hazard projections for a future climate. In other coastal systems, such as sheltered tidal lagoons or river deltas, properly resolving the estuarine local wind using an integrated framework is essential as well; however, the interacting effect of geometry and tide, wind, and surge dynamics in flood amplification will be less significant than the converging ones.
The US DOE Energy Exascale Earth System Model version 2 (hereafter, “E3SM”; Golaz et al., 2022) land model shares the same horizontal grid as the atmosphere model (described in the main text). The E3SM river runoff model uses a horizontal grid mesh of ∼ 12 km, though output from this component is not addressed in this study. The atmosphere model is initialized globally using ECMWF Reanalysis version 5 (ERA5; Hersbach et al., 2020), while initial conditions for the land and river models are taken from the end of a 1-year E3SM simulation forced by observed, time-evolving atmospheric data.
Table A1List of E3SM atmospheric physics parameters modified in this study, including the associated parameterization scheme, default values and minimum and maximum ranges used, and a short description. Parameter value ranges are taken from He and Posselt (2015). For a description of parameterization schemes, see Golaz et al. (2022). CAPE signifies convective available potential energy.
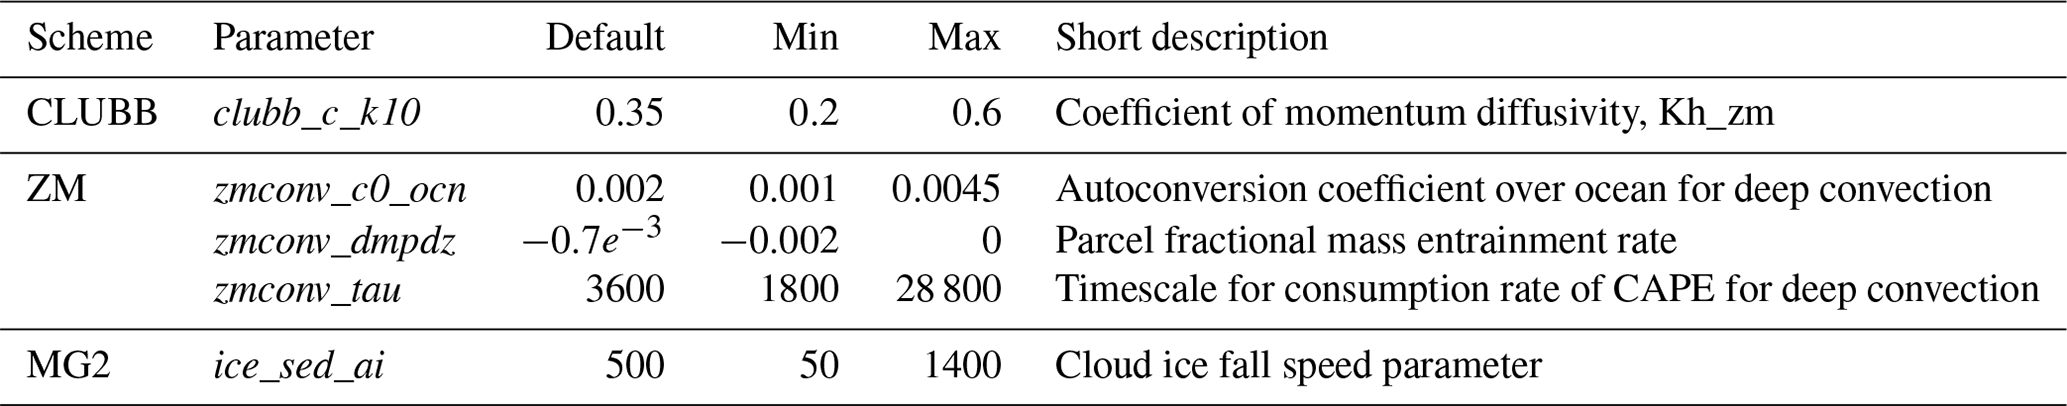
Our E3SM ensemble setup is guided by the approach used in Reed et al. (2020). For all E3SM simulations described in this study, the Betacast software toolkit (Zarzycki and Jablonowski, 2015, see “Code and data availability” section for software access) is used to facilitate ensemble configuration and management. A “test” collection of 100 simulations is conducted using 10-member ensembles each initialized every 12 h from 27 August 00Z (approximately 12 h before Hurricane Irene's first US landfall in North Carolina) back to 22 August, 12Z. The test ensemble members use randomly drawn values (within defined bounds) of parameters to which hurricanes are most sensitive (see Table A1), according to the hurricane parameter sensitivity study of He and Posselt (2015) and as used in Reed et al. (2020) and Reed et al. (2021). The same parameter sets are used across each initialization time as in Reed et al. (2020). All E3SM-simulated tracks and storm characteristics (e.g., minimum sea-level pressure, maximum surface winds) of Irene are computed using the TempestExtremes software package (Ullrich et al., 2021), and model errors in storm location and intensity compared to the National Centers for Environmental Information (NCEI) International Best Track Archive for Climate Stewardship (IBTrACS; Knapp et al., 2010, 2018) are obtained using version 10.0.0 of the Model Evaluation Tools Tropical Cyclone (MET-TC) diagnostic package (Brown et al., 2021) (see “Code and data availability” section for access to TempestExtremes and MET-TC). For each initialization time, test ensemble mean hurricane track and intensity errors are computed, and an optimal initialization time (in this case, 26 August 00Z) is identified that attempts to maximize both simulation fidelity and forecast lead time. To create a larger sample size, the test ensemble initialized at the optimal time (26 August 00Z) and the ensemble initialized 12 h earlier (25 August 12Z) are expanded to 50 members each (Reed et al., 2020, produced a 100-member ensemble at a single initialization time). In total, two 50-member ensembles are generated by initializing E3SM at two times separated by 12 h (26 August 00Z (hereafter “E1”) and 25 August 12Z (hereafter “E2”)). Each ensemble member within E1 uses a unique parameter set, with the same parameter sets being imposed on E2 members (i.e., E2 member N uses the same parameter values as E1 member N, despite different initialization times).
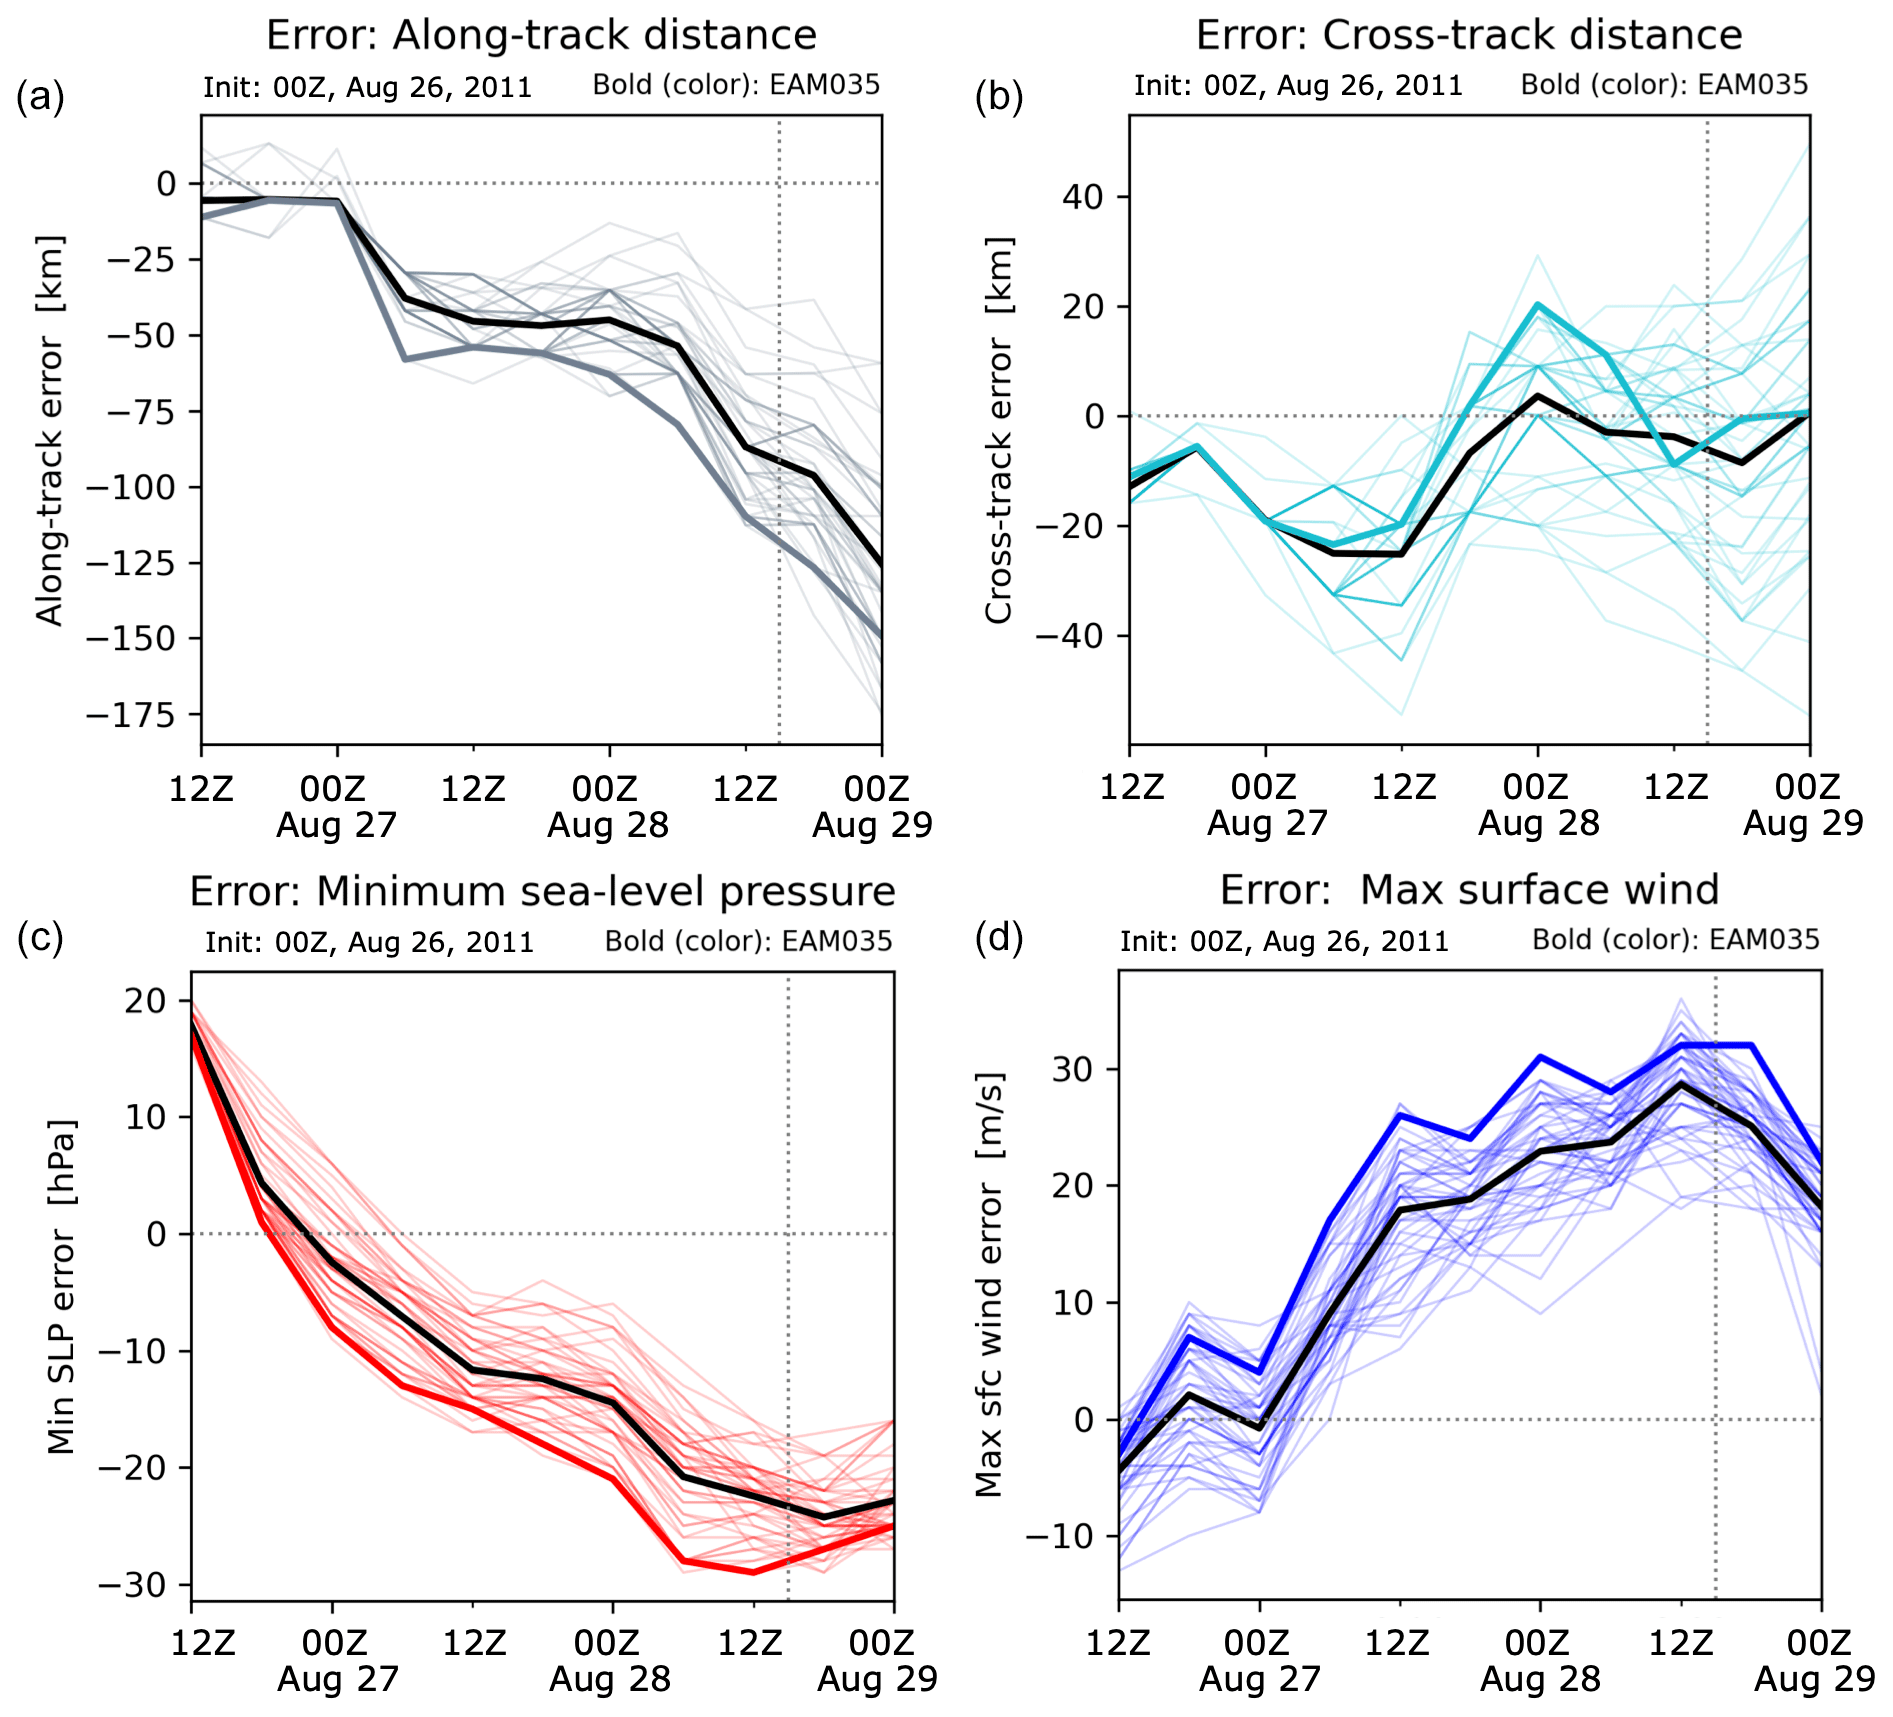
Figure A1(a) Time-evolving, along-track distance error (simulation minus observations) for E3SM ensemble members (light gray), the ensemble mean (bold black), and the selected ensemble member analyzed in this study (bold gray) for Hurricane Irene initialized on 26 August 2011 00Z. (b–d) As in the upper left panel (a), but for the cross-track error, minimum sea-level pressure error, and maximum surface wind, respectively. The dotted gray line marks 28 August 2011 15Z, the time corresponding to the snapshot of Hurricane Irene shown in Fig. 2.
Figure A1 displays the time evolution of errors in along- and cross-track distances, minimum central sea-level pressure, and maximum surface wind associated with Hurricane Irene simulated by E3SM initialized on 26 August 2011 00Z (ensemble E1). Similar time series for ensemble E2 (not shown) indicate larger distance errors – consistent with a more westward/inland track – but similar errors in minimum central pressure and maximum surface winds by construction. Figure A1 shows that Hurricane Irene simulated for E1 generally follows the correct trajectory (cross-track errors less than 20 km) but has a forward speed that is slower than observed (along-track errors of roughly −50 to −100 km). Further, the E1 version of Irene predicts a central pressure that is too low and surface winds that are too high, indicating an overestimation of hurricane intensity.
We also use the Climate Prediction Center “Unified Gauge-Based Analysis of Daily Precipitation over CONUS” product (Chen et al., 2008), provided at daily resolution on a 0.25° × 0.25° horizontal grid, to assess space–time-averaged precipitation accumulations. Figure A2 displays the evolution of mid-Atlantic watershed-averaged (Fig. A2a) 3-hourly precipitation amounts and (Fig. A2b) cumulative sum of precipitation. Watershed-averaged precipitation intensity peaks near 28 August 2011 15Z–18Z for both the ensemble mean and selected E1 member. E3SM exhibits a slow onset of the watershed-averaged cumulative sum of precipitation through 28 August 2011 12Z (Fig. A2, right) but later overestimates cumulative precipitation through 29 August 2011 12Z. This equates to a ∼ 15 mm (∼ 20 %) underestimation of cumulative precipitation during the initial impact window but a ∼ 30 mm (∼ 33 %) overestimation of storm total precipitation. Together, Figs. A1 and A2 indicate that E3SM simulates a version of Irene that is too slow and too strong, leading to a delayed onset of precipitation in the mid-Atlantic watershed but ultimately an overestimation of storm total precipitation.
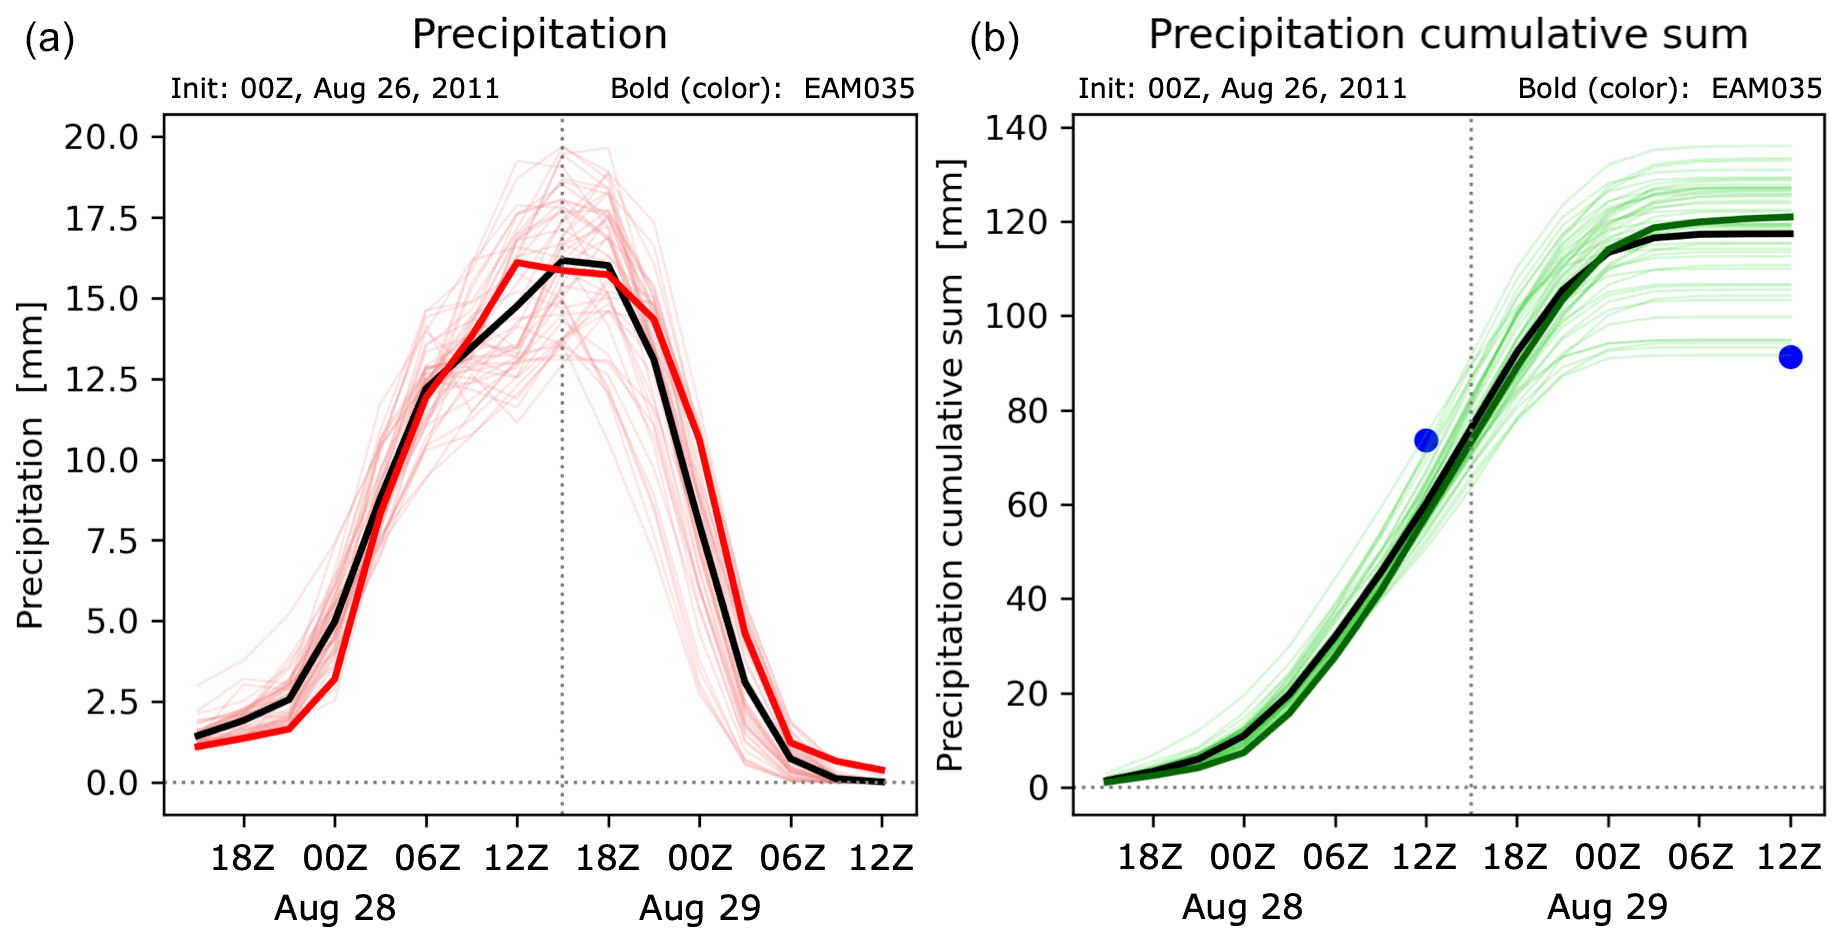
Figure A2(a) Time evolution of 3-hourly precipitation amount averaged across the mid-Atlantic Hydrologic Unit Code (HUC) 02 watershed for E3SM ensemble members (light red), the ensemble mean (black), and the selected ensemble member analyzed in this study (bold red) for Hurricane Irene initialized on 26 August 2011 00Z. (b) As in the left panel (a), but for the cumulative sum of watershed-averaged precipitation from 27 August 2011 12Z through 29 August 2011 12Z, representing the time window of Irene precipitation impacts on the watershed. In the right panel (b), Climate Prediction Center (CPC) rain gauge values are shown as blue dots and indicate cumulative sums for the 24-hour period ending at the time plotted.
To evaluate the hydrological model for its robustness in capturing the spatial and temporal variability in flow responses, we chose Hurricane Irene (2011) as the focal event and used a gridded (∼ 6 km) CONUS-scale meteorological dataset developed by Livneh et al. (2013) for model forcing. The source Livneh dataset consists of daily records of precipitation, maximum and minimum air temperature, and wind speed over the period 1950–2013, and they were disaggregated from the daily records to the 3-hourly interval. Then, we evaluated the DHSVM-simulated daily flows (averaged from the 3-hourly flows) against the United States Geological Survey (USGS) daily flow observations at six gauge locations. These locations represented a range of drainage areas from 4118–17 560 km2 along the longitudinal profile (upstream–downstream) of the main stem of the Delaware River (Fig. B1a). The model performance was measured using Nash–Sutcliffe efficiency (NSE) and the Kling–Gupta efficiency (KGE; Gupta et al., 2009); they are commonly used for measuring hydrological model performance and can be estimated as
where Mn and On are simulated and observed daily flow, respectively; N is the total number of days used in metric calculations; and is observed daily mean flow over N days.
where r is the linear correlation, α is the viability error, and β is the bias between observed and simulated daily flows. Both NSE and KGE range from −∞ to 1, and a value of 1 indicates perfect agreement between simulation and observations.
The comparison between simulations and observations of daily streamflow is shown in Fig. B1b. We observed a good agreement for Hurricane Irene (2011), where NSE daily range is from 0.71–0.91, and KGE range is from 0.59–0.91. Even though the model captured the timing of peak river discharge for all evaluated gauges, a higher peak flow bias is observed at USGS-01428500 and USGS-01463500. Among various factors that might have contributed to this bias, some key sources are uncertainties in climate input and topography and the uncertainty in stage–discharge rating curves and streamflow records.
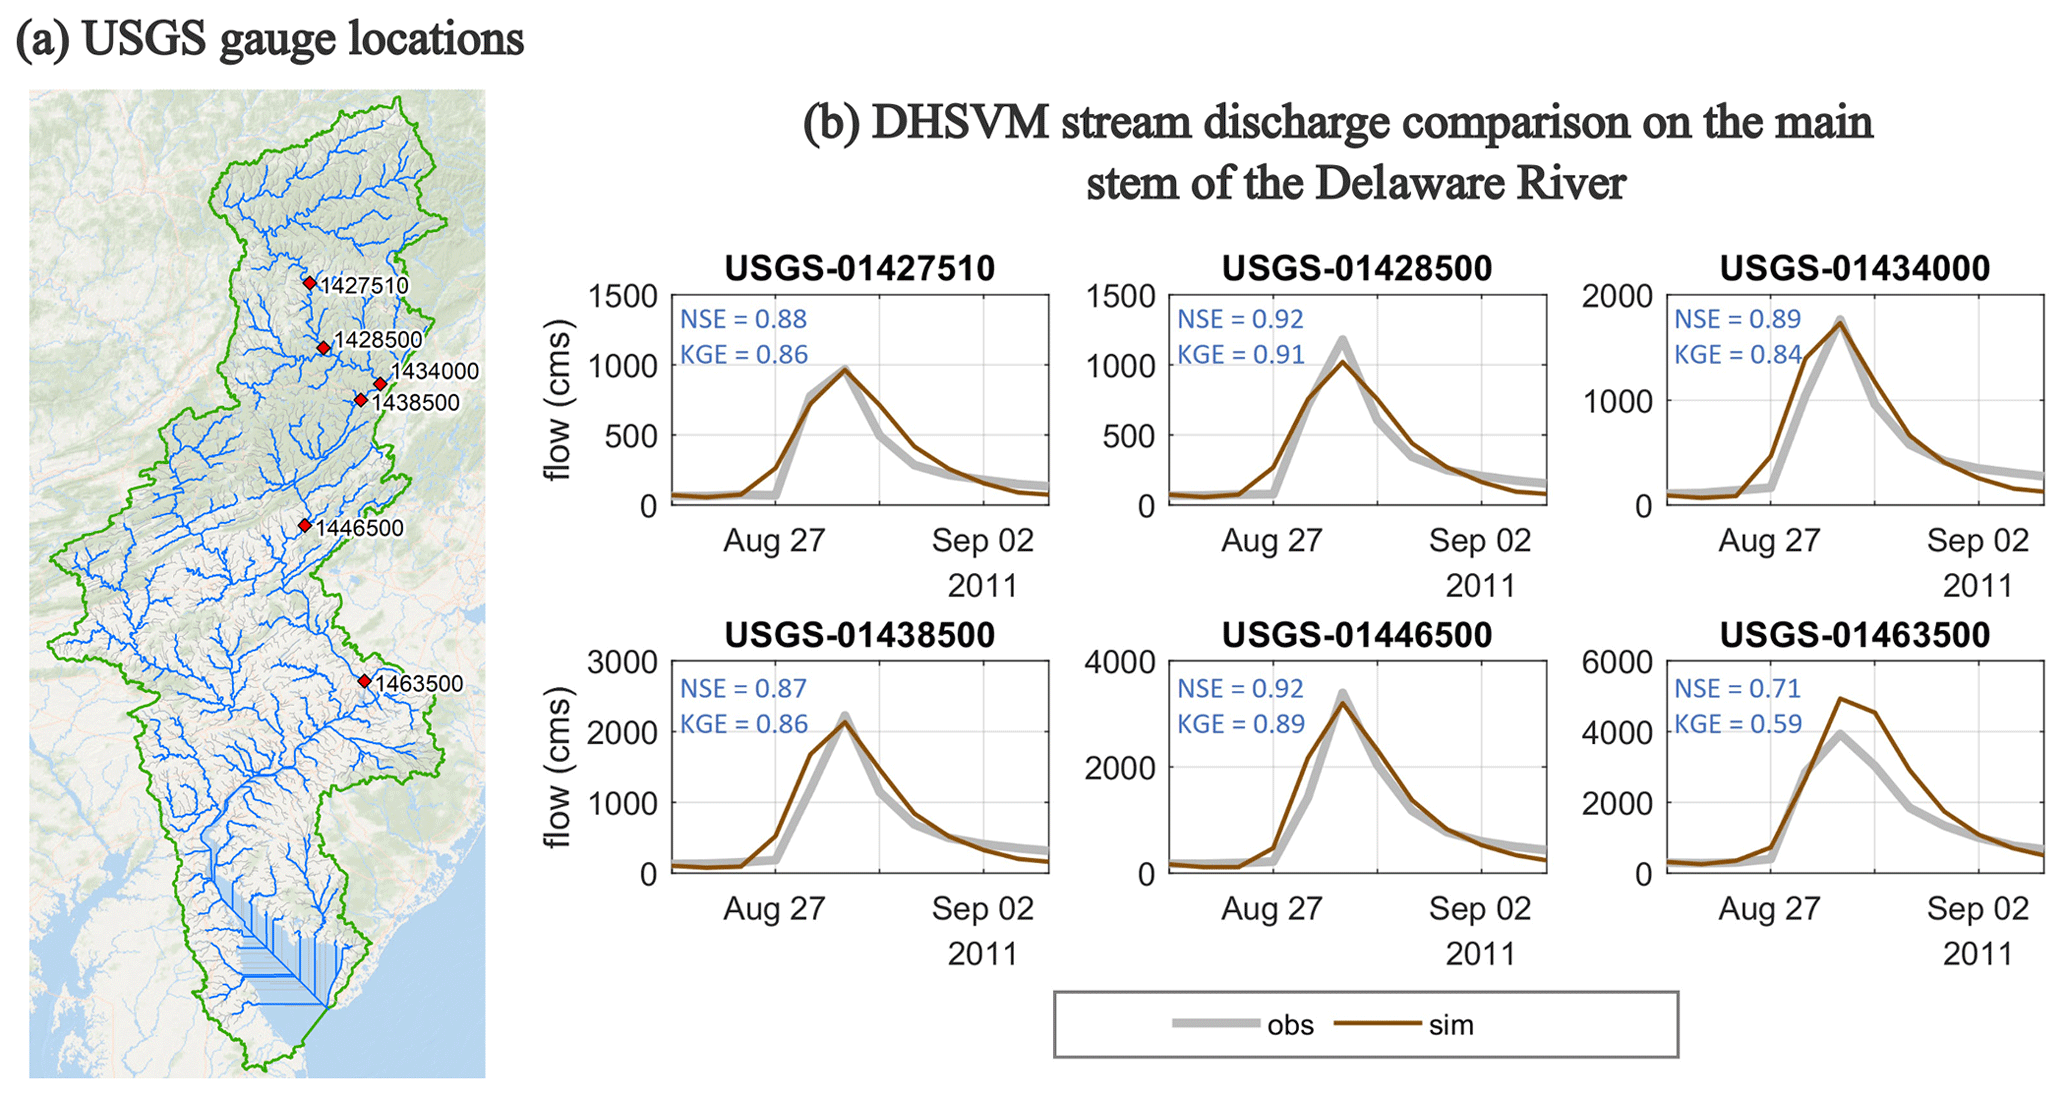
Figure B1(a) USGS stream gauge locations in the Delaware River Basin. (b) Comparison between observed and simulated river discharge at the USGS stream gauge locations.
To validate the FVCOM model results, we used a different set of model forcing than the one mentioned in the main text (Sect. 2). The sea surface wind stress and atmospheric pressure field of Hurricane Irene (2011) were collected from ERA5, a global atmospheric reanalysis model that provided the highest resolution from the available public data – a spatial resolution of 30 km. As the hydrology model (DHSVM) was only calibrated for Hurricane Irene (2011), for validating FVCOM for both Hurricane Irene (2011) and Hurricane Sandy (2012), we assigned the river flow condition using USGS stream gauges available at the Delaware River and Schuylkill River model boundary. Also, we collected water surface elevation (WSE) data from the NOAA Tides and Currents database (https://tidesandcurrents.noaa.gov, last access: 15 July 2024) for model validation. Finally, to quantify FVCOM model WSE error statistics, we estimated the linear correlation coefficient (corr), average bias index (bias), and model skill as
where Mn and On are simulated and observed water surface elevation, respectively; N is the total number of samples used in metric calculations; and and are the mean of the samples.
Figure C1 shows that the model WSE and phase match very well with the in situ WSE and show a strong ability to predict the peak surge elevation for both hurricanes. While the model peak surface amplitude agrees well, even in Philadelphia, there is a slightly elevated amplitude error after the landfall period of Hurricane Sandy (2012). This could be from the missing sub-tidal elevation at the model northwestern open boundary, where we have a smaller area coverage for the ocean. The error estimates are shown in the scatter plot (Fig. C2), where we only included gauges representing different estuary- and river-dominant zones. Overall, the correlation coefficient varies from 0.92 to 0.96 and the skill score from 0.92 to 0.98, and the averaged bias index indicates a model underprediction due to a slightly elevated tidal damping during the flood.
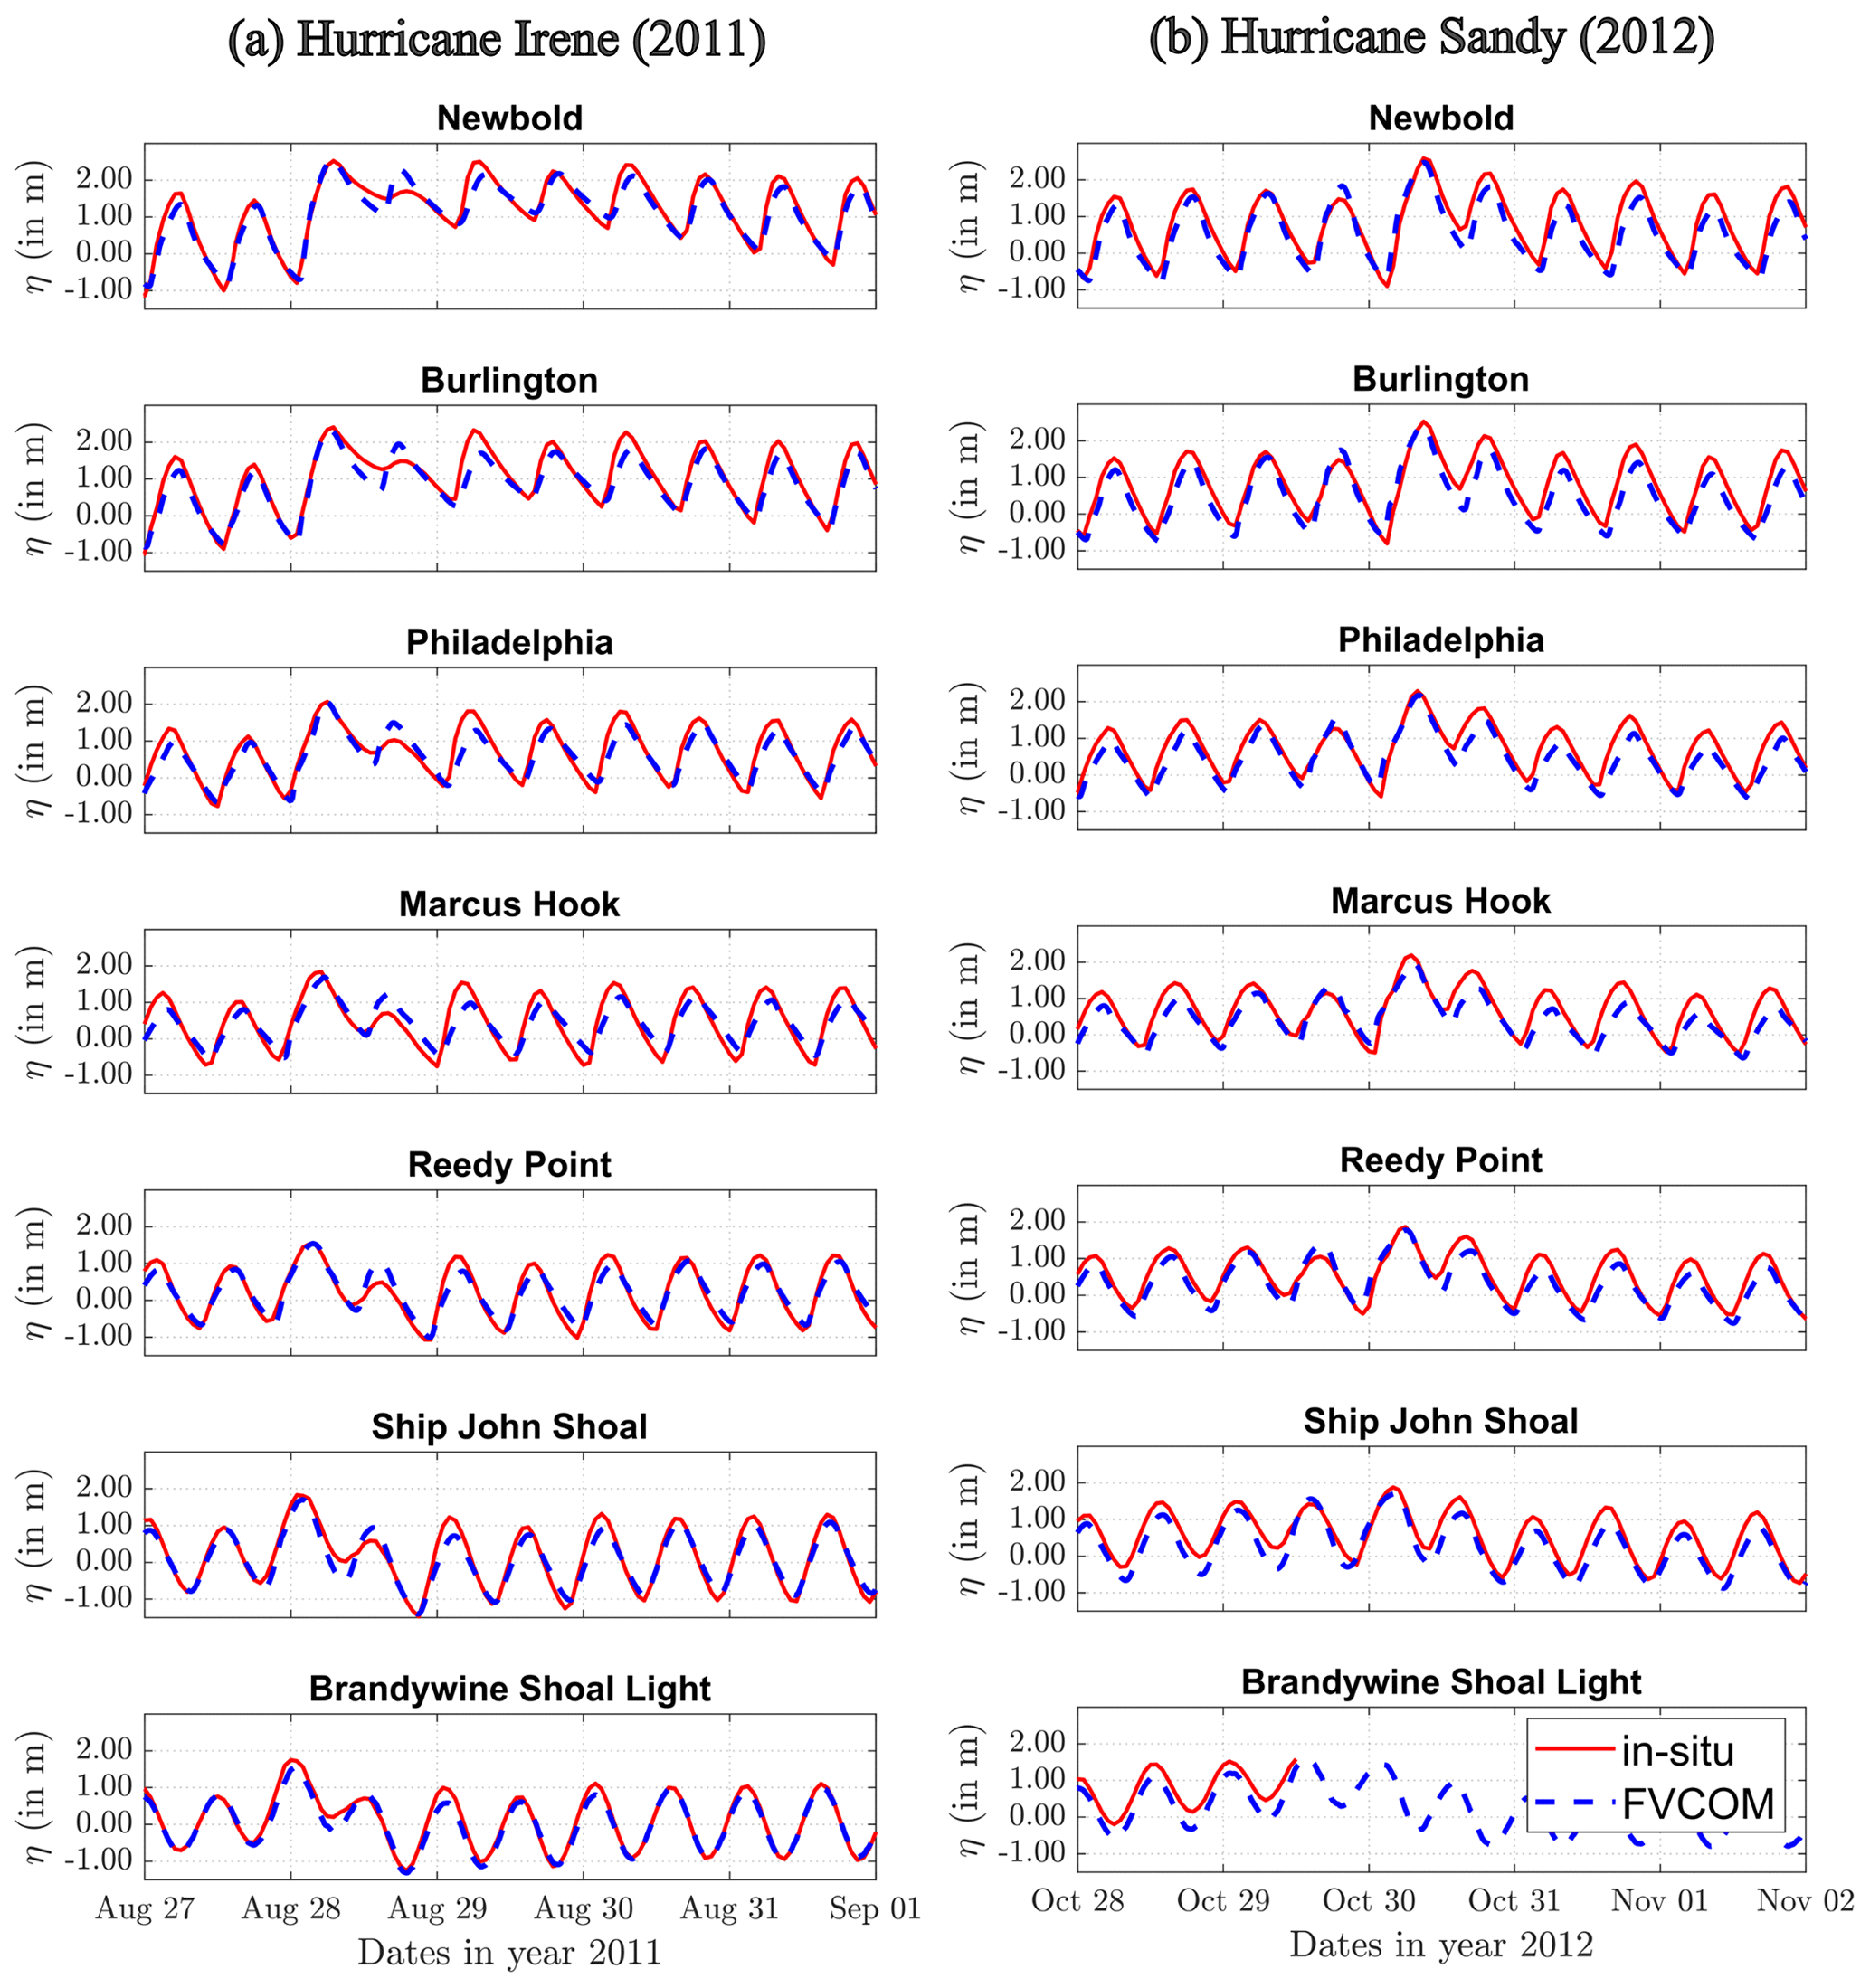
Figure C1Water surface elevation comparison between model results and in situ observations (in meters) at NOAA tide gauge locations in Delaware Bay and River during (a) Hurricane Irene (2011) and (b) Hurricane Sandy (2012).
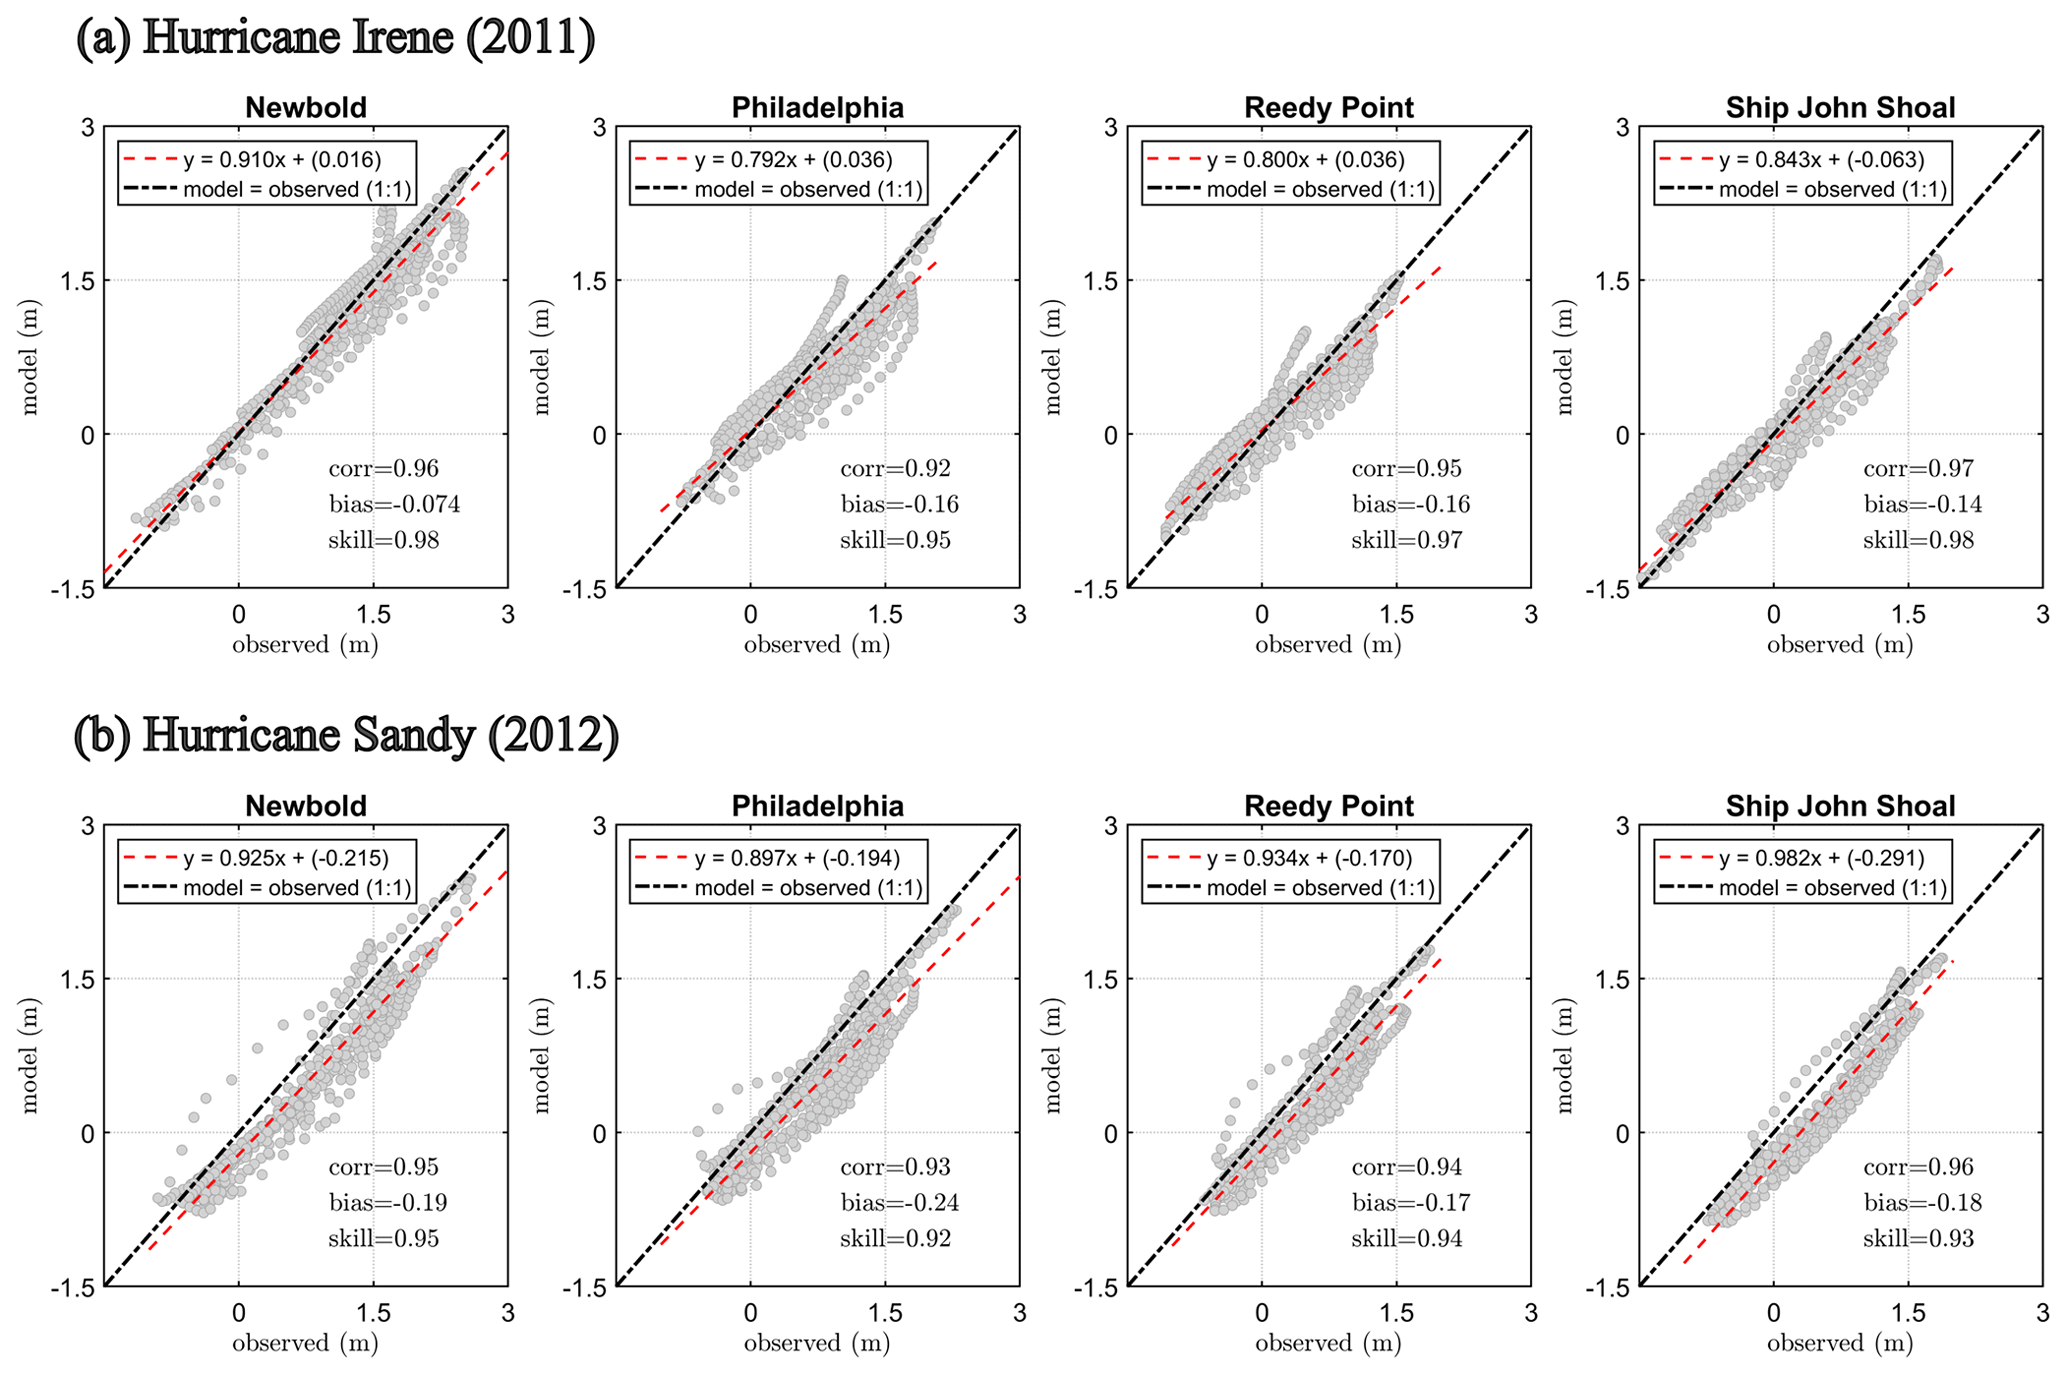
Figure C2Scatter comparison and statistics for (a) Hurricane Irene (2011) and (b) Hurricane Sandy (2012) water surface elevation at four NOAA tide gauge locations that represent different bay and river zones, going from the upstream river to the estuary.
ECMWF Reanalysis version 5 data were obtained from https://doi.org/10.24381/cds.bd0915c6 (Hersbach et al., 2023). NOAA OI-SST version 2 data were obtained from https://www.psl.noaa.gov/data/gridded/data.noaa.oisst.v2.highres.html (NOAA, 2024). The E3SM version 2 code base is accessible via a GitHub repository at https://doi.org/10.11578/E3SM/dc.20240301.3 (E3SM Project, 2024). The 3D ocean model FVCOM code is available from the MEDM Lab (https://github.com/FVCOM-GitHub/FVCOM, MEDM Lab, 2018). The Distributed Hydrology Soil Vegetation Model (DHSVM) code is available at https://www.pnnl.gov/projects/distributed-hydrology-soil-vegetation-model (PNNL, 2024). Hydrodynamic model tidal boundary conditions are assigned using OSU TPXO Tide Models (https://www.tpxo.net/home, OSU TPXO, 2024), and model validations are performed using tidal water level from NOAA tides and currents (https://tidesandcurrents.noaa.gov/, National Ocean Service and National Oceanic and Atmospheric Administration, 2024). E3SM ensemble setup and management were facilitated using the Betacast software package (https://doi.org/10.5281/zenodo.6047091, Zarzycki, 2023). All E3SM-simulated tracks and storm characteristics are computed using the TempestExtremes software package (https://github.com/ClimateGlobalChange/tempestextremes, Ullrich, 2024), and model errors in storm location and intensity compared to the IBTrACS observation-based dataset are obtained using version 10.0.0 of the Model Evaluation Tools Tropical Cyclone (MET-TC) diagnostic package (available at https://github.com/dtcenter/MET, Developmental Testbed Center, 2024). Model datasets used for further analysis are provided here at https://doi.org/10.5281/zenodo.7988098 (Deb, 2024).
The supplement related to this article is available online at: https://doi.org/10.5194/nhess-24-2461-2024-supplement.
MD, ZY, and RH contributed to the concept of the study. Model simulations and data processing were conducted by MD, JB, and NS. FVCOM grid generation was worked on by MD and TW. The first version of the manuscript was drafted by MD and JB. DJ supervised the research and funding acquisition. All authors discussed the various model performances and results and revised the manuscript.
The contact author has declared that none of the authors has any competing interests.
Publisher's note: Copernicus Publications remains neutral with regard to jurisdictional claims made in the text, published maps, institutional affiliations, or any other geographical representation in this paper. While Copernicus Publications makes every effort to include appropriate place names, the final responsibility lies with the authors.
All model simulations were performed using resources available through Research Computing at Pacific Northwest National Laboratory and the National Energy Research Scientific Computing Center (NERSC), a US Department of Energy Office of Science User Facility located at Lawrence Berkeley National Laboratory operated under contract no. DE-AC02-05CH11231 using NERSC award BER-ERCAP m3780 for 2022. CPC Global Unified Gauge-Based Analysis of Daily Precipitation data provided by the NOAA PSL, Boulder, Colorado, USA, from their website at https://psl.noaa.gov (last access: 15 July 2024). Finally, we thank Mauricio Gonzalez, Ana Julia Abascal, and an anonymous reviewer for their constructive comments, which contributed to improving the manuscript.
This work was supported by the MultiSector Dynamics (MSD) and Cross-Cutting (CC) program areas of the US Department of Energy, Office of Science, Office of Biological and Environmental Research as part of the multi-program, collaborative Integrated Coastal Modeling (ICoM) project (grant no. 75415).
This paper was edited by Mauricio Gonzalez and reviewed by Ana Julia Abascal and one anonymous referee.
Balaguru, K., Xu, W., Chang, C.-C., Leung, L. R., Judi, D. R., Hagos, S. M., Wehner, M. F., Kossin, J. P., and Ting, M.: Increased U. S. coastal hurricane risk under climate change, Science Advances, 9, eadf0259, https://doi.org/10.1126/sciadv.adf0259, 2023. a
Bates, P. D., Quinn, N., Sampson, C., Smith, A., Wing, O., Sosa, J., Savage, J., Olcese, G., Neal, J., Schumann, G., Giustarini, L., Coxon, G., Porter, J. R., Amodeo, M. F., Chu, Z., Lewis-Gruss, S., Freeman, N. B., Houser, T., Delgado, M., Hamidi, A., Bolliger, I., E. McCusker, K., Emanuel, K., Ferreira, C. M., Khalid, A., Haigh, I. D., Couasnon, A., E. Kopp, R., Hsiang, S., and Krajewski, W. F.: Combined Modeling of US Fluvial, Pluvial, and Coastal Flood Hazard Under Current and Future Climates, Water Resour. Res., 57, e2020WR028673, https://doi.org/10.1029/2020WR028673, 2021. a
Bilskie, M. V., Hagen, S. C., Medeiros, S. C., Cox, A. T., Salisbury, M., and Coggin, D.: Data and numerical analysis of astronomic tides, wind-waves, and hurricane storm surge along the northern Gulf of Mexico, J. Geophys. Res.-Oceans, 121, 3625–3658, https://doi.org/10.1002/2015JC011400, 2016. a
Brown, B., Jensen, T., Gotway, J. H., Bullock, R., Gilleland, E., Fowler, T., Newman, K., Adriaansen, D., Blank, L., Burek, T., Harrold, M., Hertneky, T., Kalb, C., Kucera, P., Nance, L., Opatz, J., Vigh, J., and Wolff, J.: The Model Evaluation Tools (MET): More than a Decade of Community-Supported Forecast Verification, B. Am. Meteorol. Soc., 102, E782–E807, https://doi.org/10.1175/bams-d-19-0093.1, 2021. a
Callahan, J. A. and Leathers, D. J.: Estimation of Return Levels for Extreme Skew Surge Coastal Flooding Events in the Delaware and Chesapeake Bays for 1980–2019, Frontiers in Climate, 3, https://doi.org/10.3389/fclim.2021.684834, 2021. a
Cangialosi, J. P., Blake, E., DeMaria, M., Penny, A., Latto, A., Rappaport, E., and Tallapragada, V.: Recent Progress in Tropical Cyclone Intensity Forecasting at the National Hurricane Center, Weather Forecast., 35, 1913–1922, https://doi.org/10.1175/WAF-D-20-0059.1, 2020. a
Chen, C., Liu, H., and Beardsley, R. C.: An Unstructured Grid, Finite-Volume, Three-Dimensional, Primitive Equations Ocean Model: Application to Coastal Ocean and Estuaries, J. Atmos. Ocean. Tech., 20, 159–186, https://doi.org/10.1175/1520-0426(2003)020<0159:AUGFVT>2.0.CO;2, 2003. a, b
Chen, M., Shi, W., Xie, P., Silva, V. B. S., Kousky, V. E., Higgins, R. W., and Janowiak, J. E.: Assessing objective techniques for gauge-based analyses of global daily precipitation, J. Geophys. Res., 113, D04110, https://doi.org/10.1029/2007jd009132, 2008. a
Cyriac, R., Dietrich, J., Fleming, J., Blanton, B., Kaiser, C., Dawson, C., and Luettich, R.: Variability in Coastal Flooding predictions due to forecast errors during Hurricane Arthur, Coast. Eng., 137, 59–78, https://doi.org/10.1016/j.coastaleng.2018.02.008, 2018. a
Deb, M.: Estuarine hurricane wind and Delaware Bay and River extreme water level, Zenodo [data set], https://doi.org/10.5281/zenodo.7988098 2024. a
Deb, M., Sun, N., Yang, Z., Wang, T., Judi, D., Xiao, Z., and Wigmosta, M. S.: Interacting Effects of Watershed and Coastal Processes on the Evolution of Compound Flooding During Hurricane Irene, Earths Future, 11, e2022EF002947, https://doi.org/10.1029/2022EF002947, 2023. a
Defne, Z., Ganju, N. K., and Moriarty, J. M.: Hydrodynamic and Morphologic Response of a Back-Barrier Estuary to an Extratropical Storm, J. Geophys. Res.-Oceans, 124, 7700–7717, https://doi.org/10.1029/2019JC015238, 2019. a
Developmental Testbed Center: Model Evaluation Tools Tropical Cyclone (MET-TC), Computer Software, GitHub [code], https://github.com/dtcenter/MET (last access: 16 July 2024), 2024. a
Dietrich, J. C., Bunya, S., Westerink, J. J., Ebersole, B. A., Smith, J. M., Atkinson, J. H., Jensen, R., Resio, D. T., Luettich, R. A., Dawson, C., Cardone, V. J., Cox, A. T., Powell, M. D., Westerink, H. J., and Roberts, H. J.: A High-Resolution Coupled Riverine Flow, Tide, Wind, Wind Wave, and Storm Surge Model for Southern Louisiana and Mississippi. Part II: Synoptic Description and Analysis of Hurricanes Katrina and Rita, Mon. Weather Rev., 138, 378–404, https://doi.org/10.1175/2009MWR2907.1, 2010. a
Dietrich, J., Zijlema, M., Westerink, J., Holthuijsen, L., Dawson, C., Luettich, R., Jensen, R., Smith, J., Stelling, G., and Stone, G.: Modeling hurricane waves and storm surge using integrally-coupled, scalable computations, Coast. Eng., 58, 45–65, https://doi.org/10.1016/j.coastaleng.2010.08.001, 2011. a
Egbert, G. D. and Erofeeva, S. Y.: Efficient Inverse Modeling of Barotropic Ocean Tides, J. Atmos. Ocean. Tech., 19, 183–204, https://doi.org/10.1175/1520-0426(2002)019<0183:EIMOBO>2.0.CO;2, 2002. a
Emanuel, K.: Increasing destructiveness of tropical cyclones over the past 30 years, Nature, 436, 686–688, 2005. a
Emanuel, K.: Response of Global Tropical Cyclone Activity to Increasing CO2: Results from Downscaling CMIP6 Models, J. Climate, 34, 57–70, https://doi.org/10.1175/JCLI-D-20-0367.1, 2021. a, b
E3SM Project, DOE: Energy Exascale Earth System Model v3.0.0, Computer Software, E3SM Project, DOE [code], https://doi.org/10.11578/E3SM/dc.20240301.3, 2024. a
Familkhalili, R. and Talke, S. A.: The effect of channel deepening on tides and storm surge: A case study of Wilmington, NC, Geophys. Res. Lett., 43, 9138–9147, https://doi.org/10.1002/2016GL069494, 2016. a
Garner, A. J., Kopp, R. E., and Horton, B. P.: Evolving Tropical Cyclone Tracks in the North Atlantic in a Warming Climate, Earths Future, 9, e2021EF002326, https://doi.org/10.1029/2021EF002326, 2021. a
Glahn, B., Taylor, A., Kurkowski, N., and Shaffer, W.: The role of the SLOSH model in National Weather Service storm surge forecasting, National Weather Digest, 33, 3–14, 2009. a
Golaz, J.-C., Roekel, L. P. V., Zheng, X., Roberts, A. F., Wolfe, J. D., Lin, W., Bradley, A. M., Tang, Q., Maltrud, M. E., Forsyth, R. M., Zhang, C., Zhou, T., Zhang, K., Zender, C. S., Wu, M., Wang, H., Turner, A. K., Singh, B., Richter, J. H., Qin, Y., Petersen, M. R., Mametjanov, A., Ma, P.-L., Larson, V. E., Krishna, J., Keen, N. D., Jeffery, N., Hunke, E. C., Hannah, W. M., Guba, O., Griffin, B. M., Feng, Y., Engwirda, D., Vittorio, A. V. D., Dang, C., Conlon, L. M., Chen, C.-C.-J., Brunke, M. A., Bisht, G., Benedict, J. J., Asay-Davis, X. S., Zhang, Y., Zhang, M., Zeng, X., Xie, S., Wolfram, P. J., Vo, T., Veneziani, M., Tesfa, T. K., Sreepathi, S., Salinger, A. G., Eyre, J. E. J. R., Prather, M. J., Mahajan, S., Li, Q., Jones, P. W., Jacob, R. L., Huebler, G. W., Huang, X., Hillman, B. R., Harrop, B. E., Foucar, J. G., Fang, Y., Comeau, D. S., Caldwell, P. M., Bartoletti, T., Balaguru, K., Taylor, M. A., McCoy, R. B., Leung, L. R., and Bader, D. C.: The DOE E3SM Model Version 2: Overview of the Physical Model and Initial Model Evaluation, J. Adv. Model. Earth Sy., 14, e2022MS003156, https://doi.org/10.1029/2022ms003156, 2022. a, b, c, d
Gori, A., Lin, N., Xi, D., and Emanuel, K.: Tropical cyclone climatology change greatly exacerbates US extreme rainfall–surge hazard, Nat. Clim. Change, 12, 171–178, 2022. a
Gupta, H. V., Kling, H., Yilmaz, K. K., and Martinez, G. F.: Decomposition of the mean squared error and NSE performance criteria: Implications for improving hydrological modelling, J. Hydrol., 377, 80–91, https://doi.org/10.1016/j.jhydrol.2009.08.003, 2009. a
He, F. and Posselt, D. J.: Impact of Parameterized Physical Processes on Simulated Tropical Cyclone Characteristics in the Community Atmosphere Model, J. Climate, 28, 9857–9872, https://doi.org/10.1175/JCLI-D-15-0255.1, 2015. a, b, c, d
Hersbach, H., Bell, B., Berrisford, P., Hirahara, S., Horányi, A., Muñoz-Sabater, J., Nicolas, J., Peubey, C., Radu, R., Schepers, D., Simmons, A., Soci, C., Abdalla, S., Abellan, X., Balsamo, G., Bechtold, P., Biavati, G., Bidlot, J., Bonavita, M., Chiara, G., Dahlgren, P., Dee, D., Diamantakis, M., Dragani, R., Flemming, J., Forbes, R., Fuentes, M., Geer, A., Haimberger, L., Healy, S., Hogan, R. J., Hólm, E., Janisková, M., Keeley, S., Laloyaux, P., Lopez, P., Lupu, C., Radnoti, G., Rosnay, P., Rozum, I., Vamborg, F., Villaume, S., and Thépaut, J.-N.: The ERA5 global reanalysis, Q. J. Roy. Meteor. Soc., 146, 1999–2049, https://doi.org/10.1002/qj.3803, 2020. a, b
Hersbach, H., Bell, B., Berrisford, P., Biavati, G., Horányi, A., Muñoz Sabater, J., Nicolas, J., Peubey, C., Radu, R., Rozum, I., Schepers, D., Simmons, A., Soci, C., Dee, D., and Thépaut, J.-N.: ERA5 hourly data on pressure levels from 1940 to present, Copernicus Climate Change Service (C3S) Climate Data Store (CDS) [data set], https://doi.org/10.24381/cds.bd0915c6, 2023. a
Houston, S. H., Shaffer, W. A., Powell, M. D., and Chen, J.: Comparisons of HRD and SLOSH surface wind fields in hurricanes: Implications for storm surge modeling, Weather Forecast., 14, 671–686, 1999. a, b
Hsu, C.-E., Serafin, K. A., Yu, X., Hegermiller, C. A., Warner, J. C., and Olabarrieta, M.: Total water levels along the South Atlantic Bight during three along-shelf propagating tropical cyclones: relative contributions of storm surge and wave runup, Nat. Hazards Earth Syst. Sci., 23, 3895–3912, https://doi.org/10.5194/nhess-23-3895-2023, 2023. a
Hu, K., Ding, P., Wang, Z., and Yang, S.: A 2D/3D hydrodynamic and sediment transport model for the Yangtze Estuary, China, J. Marine Syst., 77, 114–136, https://doi.org/10.1016/j.jmarsys.2008.11.014, 2009. a
Huang, B., Liu, C., Banzon, V., Freeman, E., Graham, G., Hankins, B., Smith, T., and Zhang, H.-M.: Improvements of the Daily Optimum Interpolation Sea Surface Temperature (DOISST) Version 2.1, J. Climate, 34, 2923–2939, https://doi.org/10.1175/JCLI-D-20-0166.1, 2021. a
Jelesnianski, C. P.: SLOSH: Sea, lake, and overland surges from hurricanes, vol. 48, US Department of Commerce, National Oceanic and Atmospheric Administration, https://repository.library.noaa.gov/view/noaa/7235 (last access: 16 July 2024), 1992. a
Knapp, K. R., Kruk, M. C., Levinson, D. H., Diamond, H. J., and Neumann, C. J.: The International Best Track Archive for Climate Stewardship (IBTrACS), B. Am. Meteorol. Soc., 91, 363–376, https://doi.org/10.1175/2009bams2755.1, 2010. a
Knapp, K. R., Diamond, H. J., Kossin, J. P., Kruk, M. C., and Schreck, C. J.: International Best Track Archive for Climate Stewardship (IBTrACS) Project, Version 4, B. Am. Meteorol. Soc., 91, 363–376, https://doi.org/10.1175/2009bams2755.1, 2018. a
Knutson, T. R., Sirutis, J. J., Bender, M. A., Tuleya, R. E., and Schenkel, B. A.: Dynamical downscaling projections of late twenty-first-century U. S. landfalling hurricane activity, Climatic Change, 171, 28, https://doi.org/10.1007/s10584-022-03346-7, 2022. a
Lin, N., Emanuel, K. A., Smith, J. A., and Vanmarcke, E.: Risk assessment of hurricane storm surge for New York City, J. Geophys. Res.-Atmos., 115, D18121, https://doi.org/10.1029/2009JD013630, 2010. a
Lin, N., Marsooli, R., and Colle, B. A.: Storm surge return levels induced by mid-to-late-twenty-first-century extratropical cyclones in the Northeastern United States, Climatic Change, 154, 143–158, 2019. a
Lyddon, C., Brown, J. M., Leonardi, N., and Plater, A. J.: Uncertainty in estuarine extreme water level predictions due to surge-tide interaction, PLOS ONE, 13, e0206200, https://doi.org/10.1371/journal.pone.0206200, 2018. a
Marsooli, R. and Lin, N.: Numerical Modeling of Historical Storm Tides and Waves and Their Interactions Along the U. S. East and Gulf Coasts, J. Geophys. Res.-Oceans, 123, 3844–3874, https://doi.org/10.1029/2017JC013434, 2018. a, b
Marsooli, R., Lin, N., Emanuel, K., and Feng, K.: Climate change exacerbates hurricane flood hazards along US Atlantic and Gulf Coasts in spatially varying patterns, Nat. Commun., 10, 3785, https://doi.org/10.1038/s41467-019-11755-z, 2019. a
MEDM Lab: UMass Dartmouth, The Finite Volume Coastal Ocean Model, Computer Software, GitHub [code], https://github.com/FVCOM-GitHub/FVCOM (last access: 16 July 2024), 2024. a
Mori, N., Kato, M., Kim, S., Mase, H., Shibutani, Y., Takemi, T., Tsuboki, K., and Yasuda, T.: Local amplification of storm surge by Super Typhoon Haiyan in Leyte Gulf, Geophys. Res. Lett., 41, 5106–5113, https://doi.org/10.1002/2014GL060689, 2014. a
National Ocean Service and National Oceanic and Atmospheric Administration: Water Levels, https://tidesandcurrents.noaa.gov/ (last access: 16 July 2024), 2024. a
NOAA: NOAA OI SST V2 High Resolution Dataset, NOAA [data set], https://www.psl.noaa.gov/data/gridded/data.noaa.oisst.v2.highres.html (last access: 16 July 2024), 2024. a
OSU TPXO: OSU TPXO Tide Models, https://www.tpxo.net/home (last access: 16 July 2024), 2024. a
Parker, K., Erikson, L., Thomas, J., Nederhoff, K., Barnard, P., and Muis, S.: Relative contributions of water-level components to extreme water levels along the US Southeast Atlantic Coast from a regional-scale water-level hindcast, Nat. Hazards, 117, 2219–2248, https://doi.org/10.1007/s11069-023-05939-6, 2023. a
Perkins, W. A., Duan, Z., Sun, N., Wigmosta, M. S., Richmond, M. C., Chen, X., and Leung, L. R.: Parallel Distributed Hydrology Soil Vegetation Model (DHSVM) using global arrays, Environ. Modell. Softw., 122, 104533, https://doi.org/10.1016/j.envsoft.2019.104533, 2019. a
PNNL: Distributed Hydrology Soil Vegetation Model, https://www.pnnl.gov/projects/distributed-hydrology-soil-vegetation-model (last access: 16 July 2024), 2024. a
Powell, M. D. and Houston, S. H.: Hurricane Andrew's landfall in south Florida. Part II: Surface wind fields and potential real-time applications, Weather Forecast., 11, 329–349, 1996. a, b
Reed, K., Wehner, M. F., Stansfield, A. M., and Zarzycki, C. M.: Anthropogenic Influence on Hurricane Dorian's Extreme Rainfall, B. Am. Meteorol. Soc., 102, S9–S15, https://doi.org/10.1175/bams-d-20-0160.1, 2021. a
Reed, K. A., Stansfield, A. M., Wehner, M. F., and Zarzycki, C. M.: Forecasted attribution of the human influence on Hurricane Florence, Science Advances, 6, eaaw9253, https://doi.org/10.1126/sciadv.aaw9253, 2020. a, b, c, d
Rego, J. L. and Li, C.: On the importance of the forward speed of hurricanes in storm surge forecasting: A numerical study: Forward Speed Of A Hurricane, Geophys. Res. Lett., 36, L07609, https://doi.org/10.1029/2008GL036953, 2009. a
Resio, D. T. and Westerink, J. J.: Modeling the physics of storm surges, Phys. Today, 61, 33–38, https://doi.org/10.1063/1.2982120, 2008. a
Roberts, M. J., Camp, J., Seddon, J., Vidale, P. L., Hodges, K., Vannière, B., Mecking, J., Haarsma, R., Bellucci, A., Scoccimarro, E., Caron, L.-P., Chauvin, F., Terray, L., Valcke, S., Moine, M.-P., Putrasahan, D., Roberts, C. D., Senan, R., Zarzycki, C., Ullrich, P., Yamada, Y., Mizuta, R., Kodama, C., Fu, D., Zhang, Q., Danabasoglu, G., Rosenbloom, N., Wang, H., and Wu, L.: Projected Future Changes in Tropical Cyclones Using the CMIP6 HighResMIP Multimodel Ensemble, Geophys. Res. Lett., 47, e2020GL088662, https://doi.org/10.1029/2020GL088662, 2020. a
Shen, J., Gong, W., and Wang, H. V.: Water level response to 1999 Hurricane Floyd in the Chesapeake Bay, Cont. Shelf Res., 26, 2484–2502, https://doi.org/10.1016/j.csr.2006.07.021, 2006a. a, b, c
Shen, J., Wang, H., Sisson, M., and Gong, W.: Storm tide simulation in the Chesapeake Bay using an unstructured grid model, Estuar. Coast. Shelf S., 68, 1–16, https://doi.org/10.1016/j.ecss.2005.12.018, 2006b. a, b, c
Suh, S.-W. and Lee, H.-Y.: Forerunner storm surge under macro-tidal environmental conditions in shallow coastal zones of the Yellow Sea, Cont. Shelf Res., 169, 1–16, https://doi.org/10.1016/j.csr.2018.09.007, 2018. a, b
Sun, N., Yearsley, J., Voisin, N., and Lettenmaier, D. P.: A spatially distributed model for the assessment of land use impacts on stream temperature in small urban watersheds, Hydrol. Process., 29, 2331–2345, https://doi.org/10.1002/hyp.10363, 2015. a
Sun, N., Wigmosta, M. S., Yan, H., Eldardiry, H., Yang, Z., Deb, M., Wang, T., and Judi, D.: Amplified Extreme Floods and Shifting Flood Mechanisms in the Delaware River Basin in Future Climates, Earths Future, 12, e2023EF003868, https://doi.org/10.1029/2023EF003868, 2024. a
Taylor, A. A. and Glahn, B.: Probabilistic guidance for hurricane storm surge, in: 19th Conf. on Probability and Statistics, January 2008, New Orleans, LA, Amer. Meteor. Soc., https://ams.confex.com/ams/88Annual/techprogram/paper_132793.htm (last access: 16 July 2024), 2008. a
Ullrich, P.: ClimateGlobalChange/tempestextremes, GitHub [code], https://github.com/ClimateGlobalChange/tempestextremes (last access: 16 July 2024), 2024. a
Ullrich, P. A., Zarzycki, C. M., McClenny, E. E., Pinheiro, M. C., Stansfield, A. M., and Reed, K. A.: TempestExtremes v2.1: a community framework for feature detection, tracking, and analysis in large datasets, Geosci. Model Dev., 14, 5023–5048, https://doi.org/10.5194/gmd-14-5023-2021, 2021. a
Valle-Levinson, A., Olabarrieta, M., and Heilman, L.: Compound flooding in Houston-Galveston Bay during Hurricane Harvey, Sci. Total Environ., 747, 141272, https://doi.org/10.1016/j.scitotenv.2020.141272, 2020. a
Villarini, G., Goska, R., Smith, J. A., and Vecchi, G. A.: North Atlantic Tropical Cyclones and U. S. Flooding, B. Am. Meteorol. Soc., 95, 1381–1388, https://doi.org/10.1175/BAMS-D-13-00060.1, 2014. a
Wahl, T., Jain, S., Bender, J., Meyers, S. D., and Luther, M. E.: Increasing risk of compound flooding from storm surge and rainfall for major US cities, Nat. Clim. Change, 5, 1093–1097, 2015. a
Wang, S., McGrath, R., Hanafin, J., Lynch, P., Semmler, T., and Nolan, P.: The impact of climate change on storm surges over Irish waters, Ocean Model., 25, 83–94, https://doi.org/10.1016/j.ocemod.2008.06.009, 2008. a
Weaver, M. M. and Garner, A. J.: Varying genesis and landfall locations for North Atlantic tropical cyclones in a warmer climate, Scientific Reports, 13, 5482, https://doi.org/10.1038/s41598-023-31545-4, 2023. a
Weisberg, R. H. and Zheng, L.: Hurricane storm surge simulations for Tampa Bay, Estuar. Coast., 29, 899–913, https://doi.org/10.1007/BF02798649, 2006. a, b, c, d, e
Weisberg, R. H. and Zheng, L.: Hurricane storm surge simulations comparing three-dimensional with two-dimensional formulations based on an Ivan-like storm over the Tampa Bay, Florida region, J. Geophys. Res.-Oceans, 113, C12001, https://doi.org/10.1029/2008JC005115, 2008. a, b, c, d
Wigmosta, M. S., Vail, L. W., and Lettenmaier, D. P.: A distributed hydrology-vegetation model for complex terrain, Water Resour. Res., 30, 1665–1679, 1994. a, b
Wong, K.-C. and Moses-Hall, J. E.: On the relative importance of the remote and local wind effects to the subtidal variability in a coastal plain estuary, J. Geophys. Res.-Oceans, 103, 18393–18404, https://doi.org/10.1029/98JC01476, 1998. a
Wong, K.-C. and Trowbridge, J. H.: Some observational evidence on the effect of atmospheric forcing on tidal variability in the upper Delaware Bay, J. Geophys. Res., 95, 16229, https://doi.org/10.1029/JC095iC09p16229, 1990. a, b
Xiao, Z., Yang, Z., Wang, T., Sun, N., Wigmosta, M., and Judi, D.: Characterizing the Non-linear Interactions Between Tide, Storm Surge, and River Flow in the Delaware Bay Estuary, United States, Frontiers in Marine Science, 8, 1811332, https://doi.org/10.3389/fmars.2021.715557, 2021. a
Zarzycki, C. M.: Betacast, Computer Software, Zenodo [code], https://doi.org/10.5281/zenodo.6047091, 2023. a
Zarzycki, C. M. and Jablonowski, C.: Experimental Tropical Cyclone Forecasts Using a Variable-Resolution Global Model, Mon. Weather Rev., 143, 4012–4037, https://doi.org/10.1175/mwr-d-15-0159.1, 2015. a
Zarzycki, C. M., Thatcher, D. R., and Jablonowski, C.: Objective tropical cyclone extratropical transition detection in high-resolution reanalysis and climate model data, J. Adv. Model. Earth Sy., 9, 130–148, https://doi.org/10.1002/2016ms000775, 2017. a
- Abstract
- Introduction
- Model setup and integration
- Hurricane-induced estuarine flooding
- The role of local estuarine wind in surge amplification
- Discussion and conclusions
- Appendix A: E3SM setup and validation
- Appendix B: DHSVM validation
- Appendix C: FVCOM validation
- Code and data availability
- Author contributions
- Competing interests
- Disclaimer
- Acknowledgements
- Financial support
- Review statement
- References
- Supplement