the Creative Commons Attribution 4.0 License.
the Creative Commons Attribution 4.0 License.
 | 12 Jul 2024
Characterizing hail-prone environments using convection-permitting reanalysis and overshooting top detections over south-central Europe
Antonio Giordani
Michael Kunz
Kristopher M. Bedka
Heinz Jürgen Punge
Tiziana Paccagnella
Valentina Pavan
Ines M. L. Cerenzia
Silvana Di Sabatino
The challenges associated with reliably observing and simulating hazardous hailstorms call for new approaches that combine information from different available sources, such as remote sensing instruments, observations, or numerical modelling, to improve understanding of where and when severe hail most often occurs. In this work, a proxy for hail frequency is developed by combining overshooting cloud top (OT) detections from the Meteosat Second Generation (MSG) weather satellite with convection-permitting High rEsolution ReAnalysis over Italy (SPHERA) reanalysis predictors describing hail-favourable environmental conditions. Atmospheric properties associated with ground-based reports from the European Severe Weather Database (ESWD) are considered to define specific criteria for data filtering. Five convection-related parameters from reanalysis data quantifying key ingredients for hailstorm occurrence enter the filter: most unstable convective available potential energy (CAPE), K index, surface lifted index, deep-layer shear, and freezing-level height. A hail frequency estimate over the extended summer season (April–October) in south-central Europe is presented for a test period of 5 years (2016–2020). OT-derived hail frequency peaks at around 15:00 UTC in June–July over the pre-Alpine regions and the northern Adriatic Sea. The hail proxy statistically matches with ∼63 % of confirmed ESWD reports, which is roughly 23 % more than the previous estimate over Europe coupling deterministic satellite detections with coarser global reanalysis ambient conditions. The separation of hail events according to their severity highlights the enhanced appropriateness of the method for large-hail-producing hailstorms (with hailstone diameters ≥ 3 cm). Further, signatures for missed small-hail occurrences are identified, which are characterized by lower instability and organization and warmer cloud top temperatures.
- Article
(15750 KB) - Full-text XML
- BibTeX
- EndNote


Hailstorms cause billions of euros of damage every year by severely damaging buildings (Paterson and Sankaran, 1994), crops (Zhou et al., 2016), vehicles (Hohl et al., 2002), and infrastructure. Individual hail events can produce losses exceeding EUR 1 billion (Gunturi and Tippett, 2017), as reported for Europe (Kunz et al., 2018), the United States (Changnon and Burroughs, 2003), and Australia (Yeo et al., 1999). Hail forms in severe thunderstorms within strong updraughts that penetrate above their local cirrus anvil level, containing large amounts of supercooled liquid content and having a sufficient lifetime for the accretion process that forms graupel and hail (Knight and Knight, 2001; Houze, 2014). Anthropogenic global warming is expected to further increase air temperature and, thus, the amount of low-level atmospheric moisture. As a consequence, these changes may generally increase the probability of hail formation and the development of larger hailstones (Dessens et al., 2015; Brimelow et al., 2017; Trapp et al., 2019). However, the response of hailstorms to climate change is highly heterogeneous (Raupach et al., 2021) and still uncertain (Allen et al., 2020; Seneviratne et al., 2021).
The low probability of hail occurrence at a certain location makes its observation a major challenge (Prein and Holland, 2018; Allen et al., 2020). A comprehensive, standardized, and operational surface hail observing system is missing across most of Europe. Current observation methods rely on weather station networks, which usually lack specific sensors for hail detection due to their high cost (e.g. the automatic sensors deployed in parts of Switzerland; Löffler-Mang et al., 2011; Kopp et al., 2022), or hailpad networks, which cover only smaller regions and require significant resources for their maintenance (e.g. Changnon Jr, 1970; Giaiotti et al., 2003; Xie et al., 2008; Sánchez et al., 2009; Palencia et al., 2010; Manzato, 2012; Dessens et al., 2015). Information about hail occurrence can be obtained from severe-weather reports, collected by storm spotters, voluntary observers, or the media. This practice has been systematically adopted in the United States (Allen et al., 2015), Australia (Allen and Allen, 2016), and Europe (Dotzek et al., 2009; Púčik et al., 2019). Nevertheless, hail reports are potentially affected by spatio-temporal heterogeneity biases (e.g. higher number of reports in densely populated areas or during daytime compared to nighttime), undersampling bias of the largest hailstones, or under-reporting in the case of non-damaging hailstorms (Allen et al., 2020).
To compensate for direct hail measurement limitations, proxies retrieved from remote sensing instruments have been employed to characterize hail incidence over a certain region with higher spatio-temporal homogeneity (e.g. Murillo and Homeyer, 2019; Gobbo et al., 2021; Mecikalski et al., 2021). Radar reflectivity, sometimes combined with other observational data (e.g. melting level or lightning detections), has been widely used for detecting hail and estimating its size and probability of occurrence (e.g. Puskeiler et al., 2016; Nisi et al., 2020; Fluck et al., 2021). However, radar coverage is often limited to the national scale, sensor networks are not always homogenized among themselves, and limitations exist with respect to the correct inference of hailstone size (Ortega, 2018). To overcome these restrictions, satellite-based products have been used to characterize hail occurrence. Satellites can sample larger regions of the world with enhanced spatial homogeneity compared to radars (Cecil and Blankenship, 2012). Hailstorm detection methods are based on the microwave, infrared (IR), or visible spectrum measured with passive instruments (e.g. Cecil, 2009; Melcón et al., 2016; Bang and Cecil, 2019; Laviola et al., 2020; Khlopenkov et al., 2021). Particularly, severe convective thunderstorms are detectable in the IR as local cold-spot anomalies, which are commonly referred to as overshooting cloud tops (OTs) (Adler et al., 1985). It is well known that thunderstorms presenting satellite OT signatures have the potential to produce a variety of hazardous weather at the surface, such as tornadoes, heavy rainfall, downbursts, large hail, or wind gusts, all of which are typically concentrated near OT regions (Reynolds, 1980; Brunner et al., 2007; Setvák et al., 2013; Mikuš and Mahović, 2013; Bedka and Khlopenkov, 2016; Mecikalski et al., 2021). Moreover, several studies have reported a link between large hail at the surface and OT intensity (Bedka, 2011; Punge et al., 2014; Proud, 2015; Jurković et al., 2015; Punge et al., 2017; Bedka et al., 2018; Punge et al., 2023; Wilhelm et al., 2021; Scarino et al., 2023). OTs can rapidly form and evolve within a thunderstorm; they usually exist for less than 15 min (even less than 5 min – Elliott et al., 2012) with a maximum diameter of roughly 15 km (Fujita, 1992; Brunner et al., 2007) and with typical temperatures ranging from 190 to 215 K (Allen et al., 2020). The detection of OTs from infrared satellite imagery has been automated by Bedka et al. (2010) and subsequently refined and optimized with probabilistic approaches by Bedka and Khlopenkov (2016) and Khlopenkov et al. (2021). However, not all severe OT-generating thunderstorms produce hail with a potential to reach the ground (e.g. owing to non-supportive environmental conditions or hailstone melt during fall in the case of very high freezing-level heights).
To reduce the uncertainty in single-source records, potential hail proxies are often combined with hail-favouring environmental conditions, either from proximity soundings or from numerical models, used to discriminate hail events from non-hail events. These specific conditions are described through atmospheric parameters statistically associated with hailstorm formation (e.g. Johns and Doswell III, 1992; Brooks et al., 2003). This approach improves the estimation of the potential for severe thunderstorms (Thompson et al., 2003; Hitchens and Brooks, 2014; Tippett et al., 2014) and enables researchers to develop hail climatologies on the global (Riemann-Campe et al., 2009; Prein and Holland, 2018; Chen et al., 2020) or regional scale (Gascón et al., 2015; Púčik et al., 2017; Li et al., 2018; Tang et al., 2019; Taszarek et al., 2021). Reanalysis datasets play a major role in this context, given the spatial homogeneity and long-term records they provide. Several studies have estimated hail hazard by coupling large-scale reanalysis/regional climate models with lightning data (Rädler et al., 2018; Battaglioli et al., 2023); surface-based reports (Prein and Holland, 2018; Torralba et al., 2023); or combinations of lightning, insurance loss data, severe-weather reports (Mohr et al., 2015), and radar data (Taszarek et al., 2020). The combination of hail-favouring ambient conditions from reanalysis with OT detections has been applied to describe hail hazard over Europe (Punge et al., 2017), Australia (Bedka et al., 2018), and South Africa (Punge et al., 2023). However, the hail proxies obtained by blending reanalysis data with OT detections rely on global datasets such as ERA-Interim (Dee et al., 2011) or ERA5 (Hersbach et al., 2020), characterized by coarse horizontal resolutions (i.e. about 79 and 31 km, respectively), which could produce significant inaccuracies. Indeed, a fine spatio-temporal resolution in the models constitutes a crucial necessity for improving the representation of deep moist convection (Wilhelmson and Wicker, 2001; Bryan et al., 2003; Wu and Arakawa, 2014; Clark et al., 2016; Allen et al., 2020; Raupach et al., 2021).
Convection-permitting (CP) numerical models produce simulations with horizontal grid spacings of a few kilometres. This allows us to switch off physical parameterizations for convection in the model, which have been demonstrated to enhance the model's skills in forecasting convective phenomena thanks to the explicit representation of most convective motions (e.g. Prein et al., 2015; Trapp and Hoogewind, 2016; Hoogewind et al., 2017; Prein et al., 2017; Liu et al., 2017; Trapp et al., 2019; Lupo et al., 2020; Giovannini et al., 2021; Chen et al., 2021; Tiesi et al., 2022). CP models have in particular provided added value for the representation of tornadic or large-hail environments (Clark et al., 2013; Adams-Selin and Ziegler, 2016; Labriola et al., 2019; Gagne et al., 2019; Manzato et al., 2020; Malečić et al., 2022). The need to enhance the characterization of high-impact atmospheric phenomena has prompted the development of a new CP regional reanalysis over south-central Europe, namely the High rEsolution ReAnalysis over Italy (SPHERA; Cerenzia et al., 2022), which has been demonstrated to enhance the representation of severe precipitation over Italy and neighbouring countries (Giordani et al., 2023). This region is particularly relevant as it represents one of the major hail hotspots over Europe (i.e. northern Italy; Taszarek et al., 2020).
This work aims at presenting a new method for hail hazard assessment obtained by combining satellite OT detections from the Meteosat Second Generation (MSG) Spinning Enhanced Visible and InfraRed Imager (SEVIRI) instrument with a set of environmental predictors from SPHERA and European Severe Weather Database (ESWD) hail reports. The purpose is to characterize hail hazard exemplarily for south-central Europe by selecting the cloud top storm signatures associated with favourable environmental conditions for hail development. These are described by the distributions of dynamic and thermodynamic reanalysis predictors in the presence of confirmed surface hail reports. The identification of hail-related OTs is performed by removing detections presenting environments whose descriptors fall within the tails of the relative distributions that are unconducive to hail development. For this reason, in the following the use of the reanalysis-based conditions to exclude non-hail events identified by OTs only is referred to as filtering. An application and evaluation of the approach are proposed during the extended summer season (April–October) over a 5-year test period (2016–2020), which coincides with the last years available for SPHERA reanalysis and during which numerous hail reports have been collected. Additionally, the high-resolution CP regional reanalysis allows for a detailed representation of the environmental conditions prevailing during hailstorms. Hence, in order to investigate the atmospheric states potentially associated with hail, the distributions of the numerical convective indices considered are conditionally analysed depending on hail severity, inferred from the reports, and on the ability to detect the hail proxy.
Section 2 presents the datasets used, while the OT reanalysis filter procedure used to retain potentially hail-related OTs is described in Sect. 3. The resulting hail frequency over the analysed test period and the associated ambient conditions are reported in Sect. 4 and are discussed in Sect. 5. Finally, conclusions are drawn in Sect. 6.
This section describes the sets of hail reports, OT detections, and reanalysis proxies considered. The diagram in Fig. 1 illustrates how the data are processed and combined to obtain the hail proxy and to characterize the associated environments. The investigation period pertains to the extended summer (April–October), representing the climatological season for hail at mid-latitudes, over the period of 2016–2020. The reference area pertains to the entire SPHERA reanalysis domain (i.e. approximately 35–49° N, 6–19° E; Fig. 3a), including the countries of Italy, Switzerland, Austria, Slovenia, Croatia, parts of Bosnia and Herzegovina, and Germany.

Figure 1Flowchart summarizing the data processing. The red rectangles indicate the datasets included, blue ellipses the operations performed, white rectangles the intermediate steps, and green rectangles the final outcomes. Panel (a) (yellow outer rectangle) shows the steps applied to define the hail proxy, while panel (b) (purple outer rectangle) illustrates the steps for the post-processing validation and environmental characterization.
2.1 ESWD hail reports
The European Severe Weather Database (ESWD; https://www.eswd.eu/, last access: 10 July 2024; Dotzek et al., 2009) constitutes a primary source of severe-convective-storm data in Europe, being the only available European multinational archive of hail reports. Maintained by the European Severe Storms Laboratory (ESSL), the ESWD provides quality-checked data collected by networks of voluntary observers, meteorological services, weather enthusiasts, and news and media reports. Thanks to technological innovations and increasing public awareness of extreme meteorological events, reports have rapidly increased in number in recent years (Groenemeijer et al., 2017). Despite recent advances, the ESWD still suffers from deficits in data representativity owing to the spatial inhomogeneity in the localization of a large part of reports, biased towards the most populated areas (i.e. the main urban centres), and the relatively short temporal series covering only the last few years. However, the ESWD forms the only reliable source of direct hail data for Europe, including information such as location, date, hour (with an estimate of the temporal accuracy), and maximum size of hailstones. Further, an operational quality control procedure categorizes each report into different quality levels: QC0 (“as received”), QC0+ (“plausibility checked”), QC1 (“confirmed by reliable source”), and QC2 (“scientific case study”).
A total of 2813 hail reports with a minimum quality level of QC0+ were available for this study (Fig. 2). Among them, 2249 reports (80 %) contained hail size information (for a minimum hailstone diameter of 2 cm – Fig. 2c) used to quantify hail severity. Hereafter we refer to small hail as hail with maximum hailstone diameters of <3 cm, large hail as hail with maximum hailstone diameters of ⩾3 cm, and very large hail as hail with maximum hailstone diameters of ⩾5 cm. Note that this nomenclature is slightly different from that adopted by ESSL (which refers to large hail for reports with maximum hailstone diameters of ⩾2 cm). The three different classes account for 39 %, 61 %, and 16 % of ESWD reports with information about hail size, respectively. Their spatial distribution (Fig. 2a) shows strong inhomogeneity with a larger number of reports in northern Italy, south-eastern Austria, eastern Slovenia, and northern Croatia. The regions with the lowest number of hail reports are central-southern Italy and all islands, the main Alpine crest (extending along the northern Italian border with France, Switzerland, and Austria), and the southern Balkans (southern Croatia and Bosnia and Herzegovina). The temporal accuracy is ⩽1 h for 98 % of the reports (Fig. 2b) and is considerably high (⩽15 min) for 77 % of the sample. Their temporal distribution indicates the maximum probability of hail being at 15:00 UTC (Fig. 2d) and in July (Fig. 2e), with a similar number of reports (between 400 and 500) for the first 3 years considered (Fig. 2f). A substantial increase is noted for 2019 and, to a slightly lesser extent, for 2020, most likely owing to the general increase in public awareness, and hence reports, in recent years (Púčik et al., 2019). The PRETEMP group has been collecting a large number of storm reports over Italy since 2019, which have been fed into the ESWD (De Martin et al., 2023).
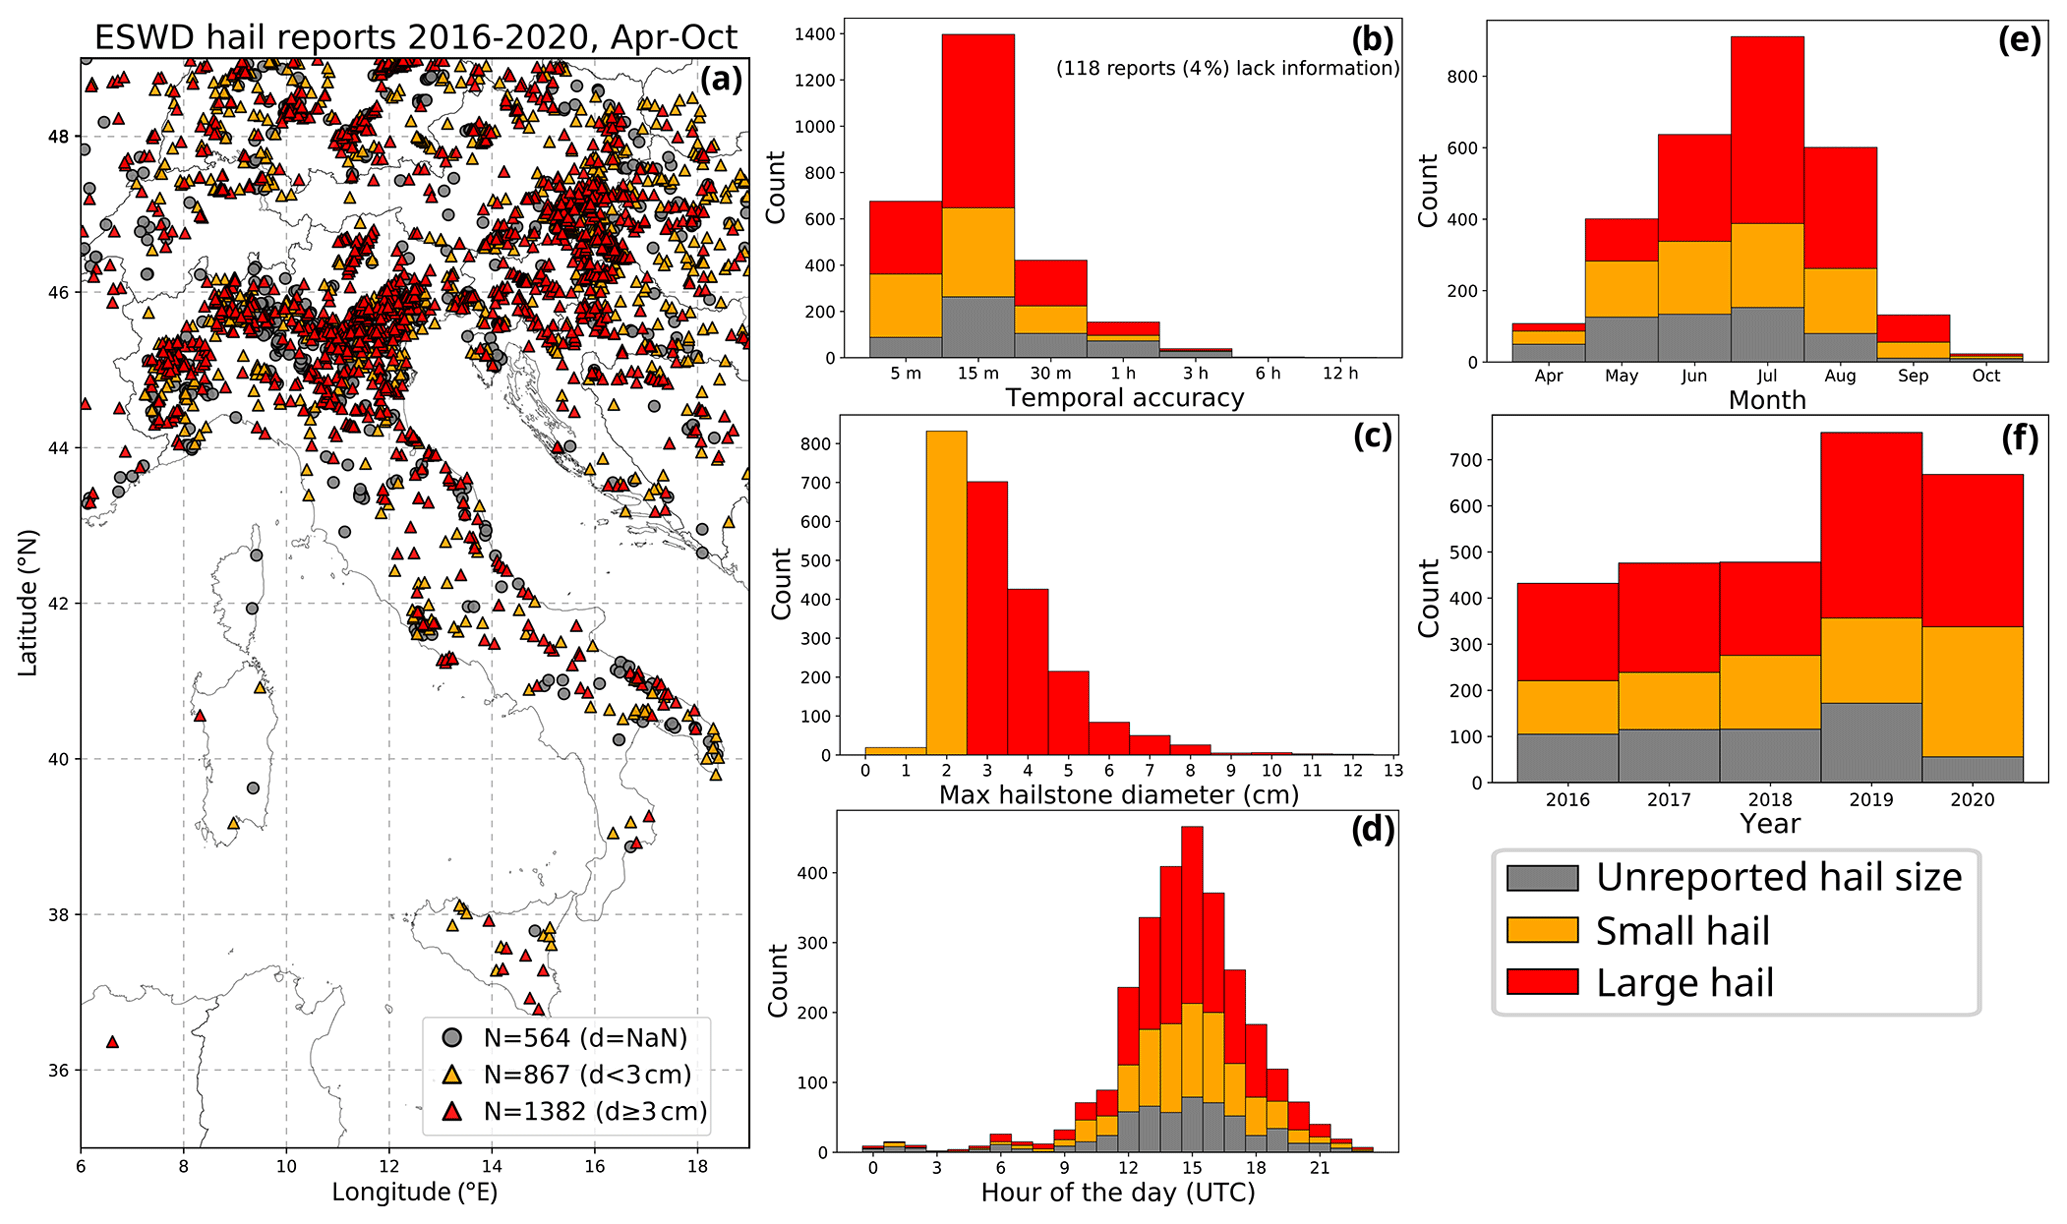
Figure 2ESWD hail reports in April–October over 2016–2020. The reports are classified by distinguishing among three classes: reports with no information on hail size (in grey), small hail (maximum diameter < 3 cm, in orange), and large hail (maximum diameter ⩾ 3 cm, in red). (a) Spatial distribution, (b) temporal accuracy distribution, (c) maximum hailstone diameter distribution, (d) number of reports per hour of the day (UTC), (e) number of reports per month, and (f) number of reports per year.
2.2 Overshooting top detections
The remote detection of OTs automated by Bedka et al. (2010) has previously been used to characterize OT climatological distribution in North America (Bedka et al., 2010), Europe (Bedka, 2011), and Australia (Bedka et al., 2018). The OT detection algorithm relies on the comparison between clusters of cold pixels likely related to strong updraughts with a tropopause temperature with pixels consistent with the temperature of the anvil of the thunderstorm, as detected with IR satellite scans. A large temperature difference (>6 K) helps to separate true OTs from other non-convective clouds (e.g. cirrus) as this difference is indicative of updraught penetration through the anvil of at least 1–2 km (Griffin et al., 2016). Recently, the automatic OT detection algorithm has been substantially improved by considering a probabilistic approach (Bedka and Khlopenkov, 2016; Khlopenkov et al., 2021) instead of the binary yes/no decisions based on predefined fixed temperature thresholds. The statistical combination of tropopause-relative IR brightness temperature, the prominence of a candidate OT relative to the surrounding anvil, and the spatial uniformity and size of the area covered by the anvil deliver a 3 km gridded probabilistic OT estimate across the domain. The validation of this methodology (Khlopenkov et al., 2021; Cooney et al., 2021) revealed important improvements compared to the original detection algorithm of Bedka et al. (2010).
The present study considers IR imagery from the geostationary MSG Spinning Enhanced Visible and InfraRed Imager (SEVIRI) (Schmetz et al., 2002) between 2016 and 2020 at a continuous temporal resolution of 15 min over south-central Europe. Only OTs detected with the Khlopenkov et al. (2021) algorithm having a probability > 50 % are considered, similar to Punge et al. (2023). This statistical constraint was derived by the comparison of OT detections with radar echo tops (Cooney et al., 2021) and demonstrated enhanced reliability being indicative of colder and more prominent anvil-relative tops. The spatial distribution of the 991 042 OTs detected over 872 d is shown on a 10 km regular grid in Fig. 3b. A generally higher number of OTs over land is observed, especially around the Alps, Apennines, and Dinaric Alps mountainous ranges. The main OT hotspot over the study domain extends throughout the northern Po Valley region adjacent to the Alps, which is bounded to the north by the most prominent minimum located in the vicinity of the Alpine crest (i.e. along the northern Italian border with south-eastern France, southern Switzerland, and western Austria, Fig. 3a).
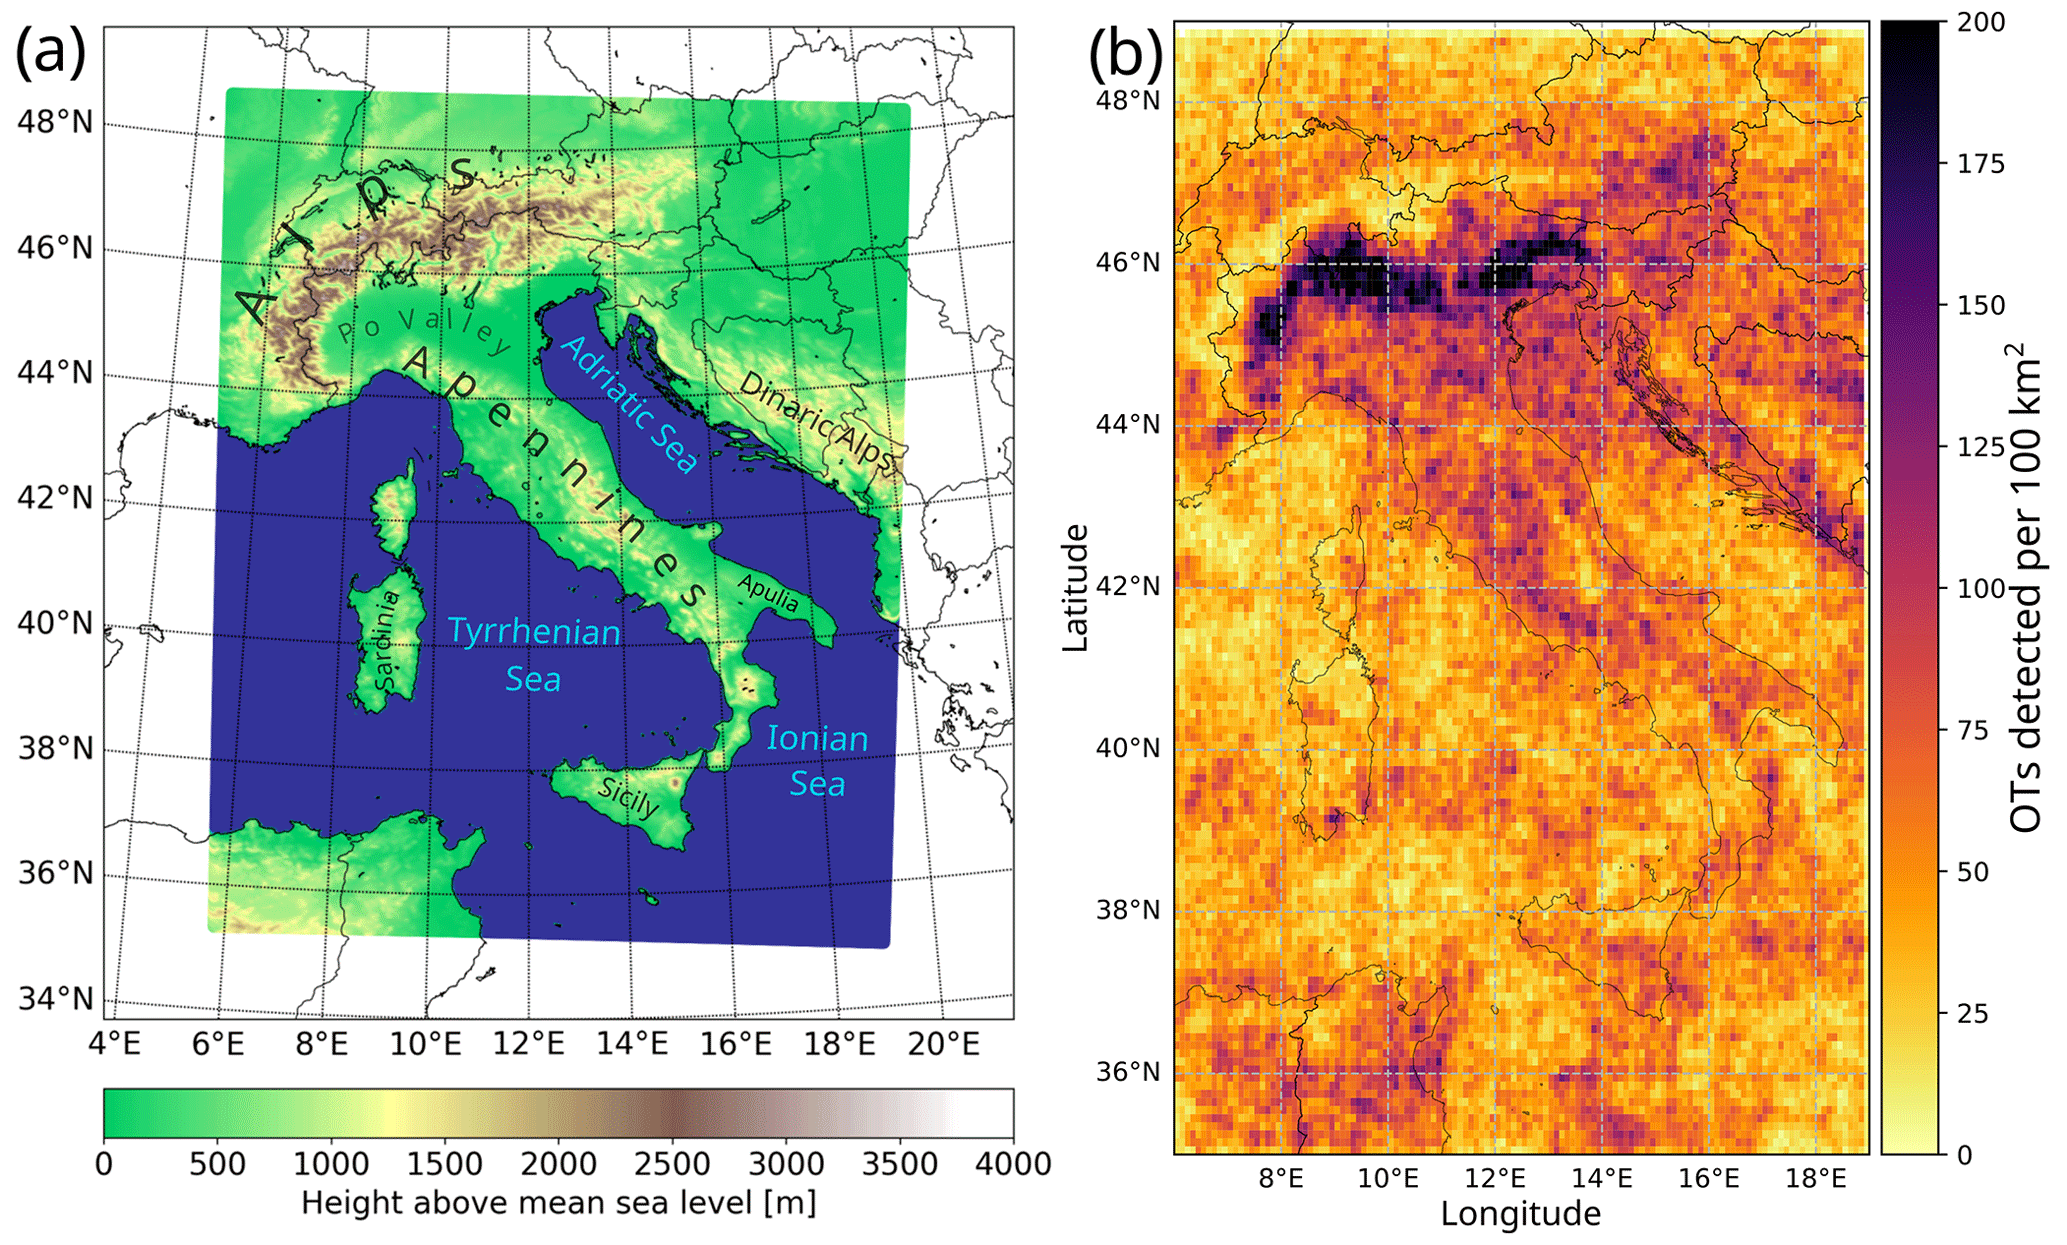
Figure 3(a) The spatial domain and model orography of SPHERA reanalysis. (b) Number of overshooting tops detected per grid cell (on a 10 km regular grid) during April–October in 2016–2020.
2.3 SPHERA reanalysis ambient predictors
The atmospheric conditions associated with convective environments that favour hail formation are inferred from the high-resolution regional reanalysis SPHERA (Cerenzia et al., 2022; Giordani et al., 2023). SPHERA is a dynamical downscaling of the global reanalysis ERA5 driven by the non-hydrostatic limited-area model COnsortium for Small-scale MOdeling (COSMO; Schättler et al., 2018) at the convection-permitting horizontal grid spacing of 0.02° over 65 vertical levels. The assimilation of observations (wind speed, pressure, air humidity, and temperature), coming from various sources (surface weather stations, radiosoundings, radar, and aircraft reports), with a continuous nudging scheme steers the simulations towards the observed state. Three-dimensional output is produced on a hourly basis for south-central Europe (Fig. 3a) during 1995–2020.
The meteorological parameters selected to describe ambient conditions favourable to hailstorm development and to identify potential hail-related OTs rely on statistical relationships between hail observations and proximal atmospheric soundings (e.g. Kunz, 2007; Prein and Holland, 2018; Kunz et al., 2020; Allen et al., 2020; Jelić et al., 2020). These parameters represent the key dynamical and thermodynamical ingredients necessary for hailstorm formation: atmospheric instability and low-level moisture, storm organization, and freezing-level altitude.
Atmospheric instability and related updraught strength of a thunderstorm are particularly relevant as strong updraughts are necessary for hail growth. Numerous radiosounding-based instability indices have been proposed to predict the potential for thunderstorm development. As of today, the preference for an index that is most suitable for representing favourable conditions for hail occurrence is not univocal, as it could depend on the different ambient conditions over specific regions (e.g. Europe compared to the United States, where the majority of the indices have been designed; Brooks, 2009; Taszarek et al., 2020, 2021). Hence, to better identify hail-favourable meteorological conditions and reduce possible misrepresentation by using a single quantity (that may potentially be unsuitable in some situations), three different thermodynamic parameters are considered. These are most unstable (MU) convective available potential energy (CAPE), the K index, and the surface lifted index (SLI), which showed the highest skill for severe-thunderstorm predictions in central Europe (Kunz, 2007) and for which formulations are reported in Appendix A. The K index relies only on the environmental characteristics of the vertical temperature and moisture content of the atmospheric profile. Hence, the K index quantifies the thunderstorm potential conditional on the low-level moisture content and its vertical extent. On the other hand, both SLI and CAPE consider the temperature difference between the environment and the lifted parcel rising with the convective air mass. Particularly, SLI is a “two-level” index (based on the temperature difference between the ambient and the rising parcel at 500 hPa), while CAPE is an integrated measure of buoyancy over the entire vertical column.
Additionally, organized thunderstorms in the form of multicells, supercells, or mesoscale convective systems (MCSs) are more likely to produce hail. The degree of organization of a storm is usually quantified with the 0–6 km wind vector difference (deep-layer shear – DLS; Markowski and Richardson, 2011), which is frequently used for investigating hail-favouring conditions (e.g. Trapp et al., 2007; Wellmann et al., 2020). Hence, DLS is included in the OT filtering procedure.
Finally, the amount of moisture available below the freezing level has an influence on the hydrometeor density in the updraught and hence potentially on the growth rate of the hailstones (Johnson and Sugden, 2014; Allen et al., 2015). On the one hand, a too-low freezing level may limit the amount of supercooled water in the updraught necessary for hail growth (Prein and Holland, 2018). On the other hand, thunderstorms with a high freezing level (H0) are less likely to produce hail on the ground owing to enhanced melting during hail fall (Dessens et al., 2015). This causes, for example, the lower hail probability observed near the tropics where the surface atmospheric layers are generally warmer and the tropopause layer is higher (Prein and Holland, 2018). Hence, H0, defined as the altitude of the 0 °C isotherm above mean sea level, is employed to filter out OTs associated with conditions that are unconducive to hail development.
While CAPE, SLI, and H0 are direct outputs of SPHERA, DLS and the K index are computed from temperature and wind profiles. Every parameter is available at hourly frequency at the native horizontal resolution of 0.02° (i.e. ∼2.2 km). However, local rapidly evolving deep convective processes are characterized by a low intrinsic predictability, and this may affect the representativity of the local indices considered. Hence, SPHERA fields are remapped onto a common grid of 10 km to avoid possibly “noisy” estimates and to reduce data representativity issues.
Recent findings suggest links between convective storm severity and specific characteristics of the OT detections, such as their spatial extension (Marion et al., 2019) or the temperature gradient between the OT and the tropopause (Khlopenkov et al., 2021). However, some OTs with intense updraughts reaching the tropopause and penetrating the lower stratosphere may be associated with convective environments not necessarily conducive to severe weather phenomena such as hail. The necessary discrimination between hail- and non-hail-producing OTs can be attained by additionally considering convection-related environmental conditions estimated with reanalysis (Punge et al., 2017; Bedka et al., 2018; Punge et al., 2023).
SPHERA predictors are extracted around each OT detection in a spatio-temporal neighbourhood of 0.63°×0.63° (approximately 70 km × 70 km) over the 3 h preceding an OT and during the hour at which the OT is issued. This relatively large spatial matching window is required owing to the extremely localized and rapidly evolving nature of hailstorms in order to limit double-penalty issues due to the difficulties of the models to predict the exact localization of convective processes (Ebert, 2008; Marsigli et al., 2021). Additionally, to take into account pre-convective conditions from SPHERA, a temporal window before the OT event is considered. Within this spatio-temporal neighbourhood, the maximum (for CAPE, K index, and DLS) or minimum (for SLI and H0) values of these parameters are extracted.
The filter to select potential hail-related OTs is then constructed by employing confirmed ESWD hail reports. The environmental parameters are selected in the vicinity of the reports by considering the same spatio-temporal neighbourhood used for the OTs (i.e. 0.63°×0.63° spatial window, 0–3 h temporal window), and the thresholds are defined as percentiles pth of the distributions of the parameters (following the approach of Punge et al., 2017). Contrarily to Punge et al. (2017), where thresholds based on the 2nd or 98th percentiles were prescribed, here the slightly more stringent 5th percentile (for CAPE, K index, and DLS) or 95th percentile (for SLI and H0) is selected. This is justified by the higher spatio-temporal resolution of SPHERA reanalysis (2.2 km and 1 h), which, compared to ERA-Interim (79 km and 6 h) considered by Punge et al. (2017), is expected to significantly enhance the representation of the atmospheric conditions described by the indices (e.g. in the form of sharper peaks in the parameter distributions owing to a clearer distinction of the modelled dynamical features).
The ESWD-based cumulative density functions (CDFs) of the predictors are reported in Fig. 4. To investigate the relationship between each parameter and hailstorm severity, the CDFs are shown for the distribution of the entire hail report set and distinguished between small, large, and very large hail. A general shift in the predictors towards severe-convective environments is detected for increasing hail sizes. Indeed, moving from the purple to the red lines in Fig. 4, increased instability (greater CAPE and K index and lower SLI), enhanced organization (greater DLS), and higher freezing levels are noted. This suggests the ability of the numerical proxies to identify hail-related ambient conditions. The shaded areas in Fig. 4 indicate the tail of the CDFs (corresponding to the 5th or 95th percentile portions) where the filter is active.
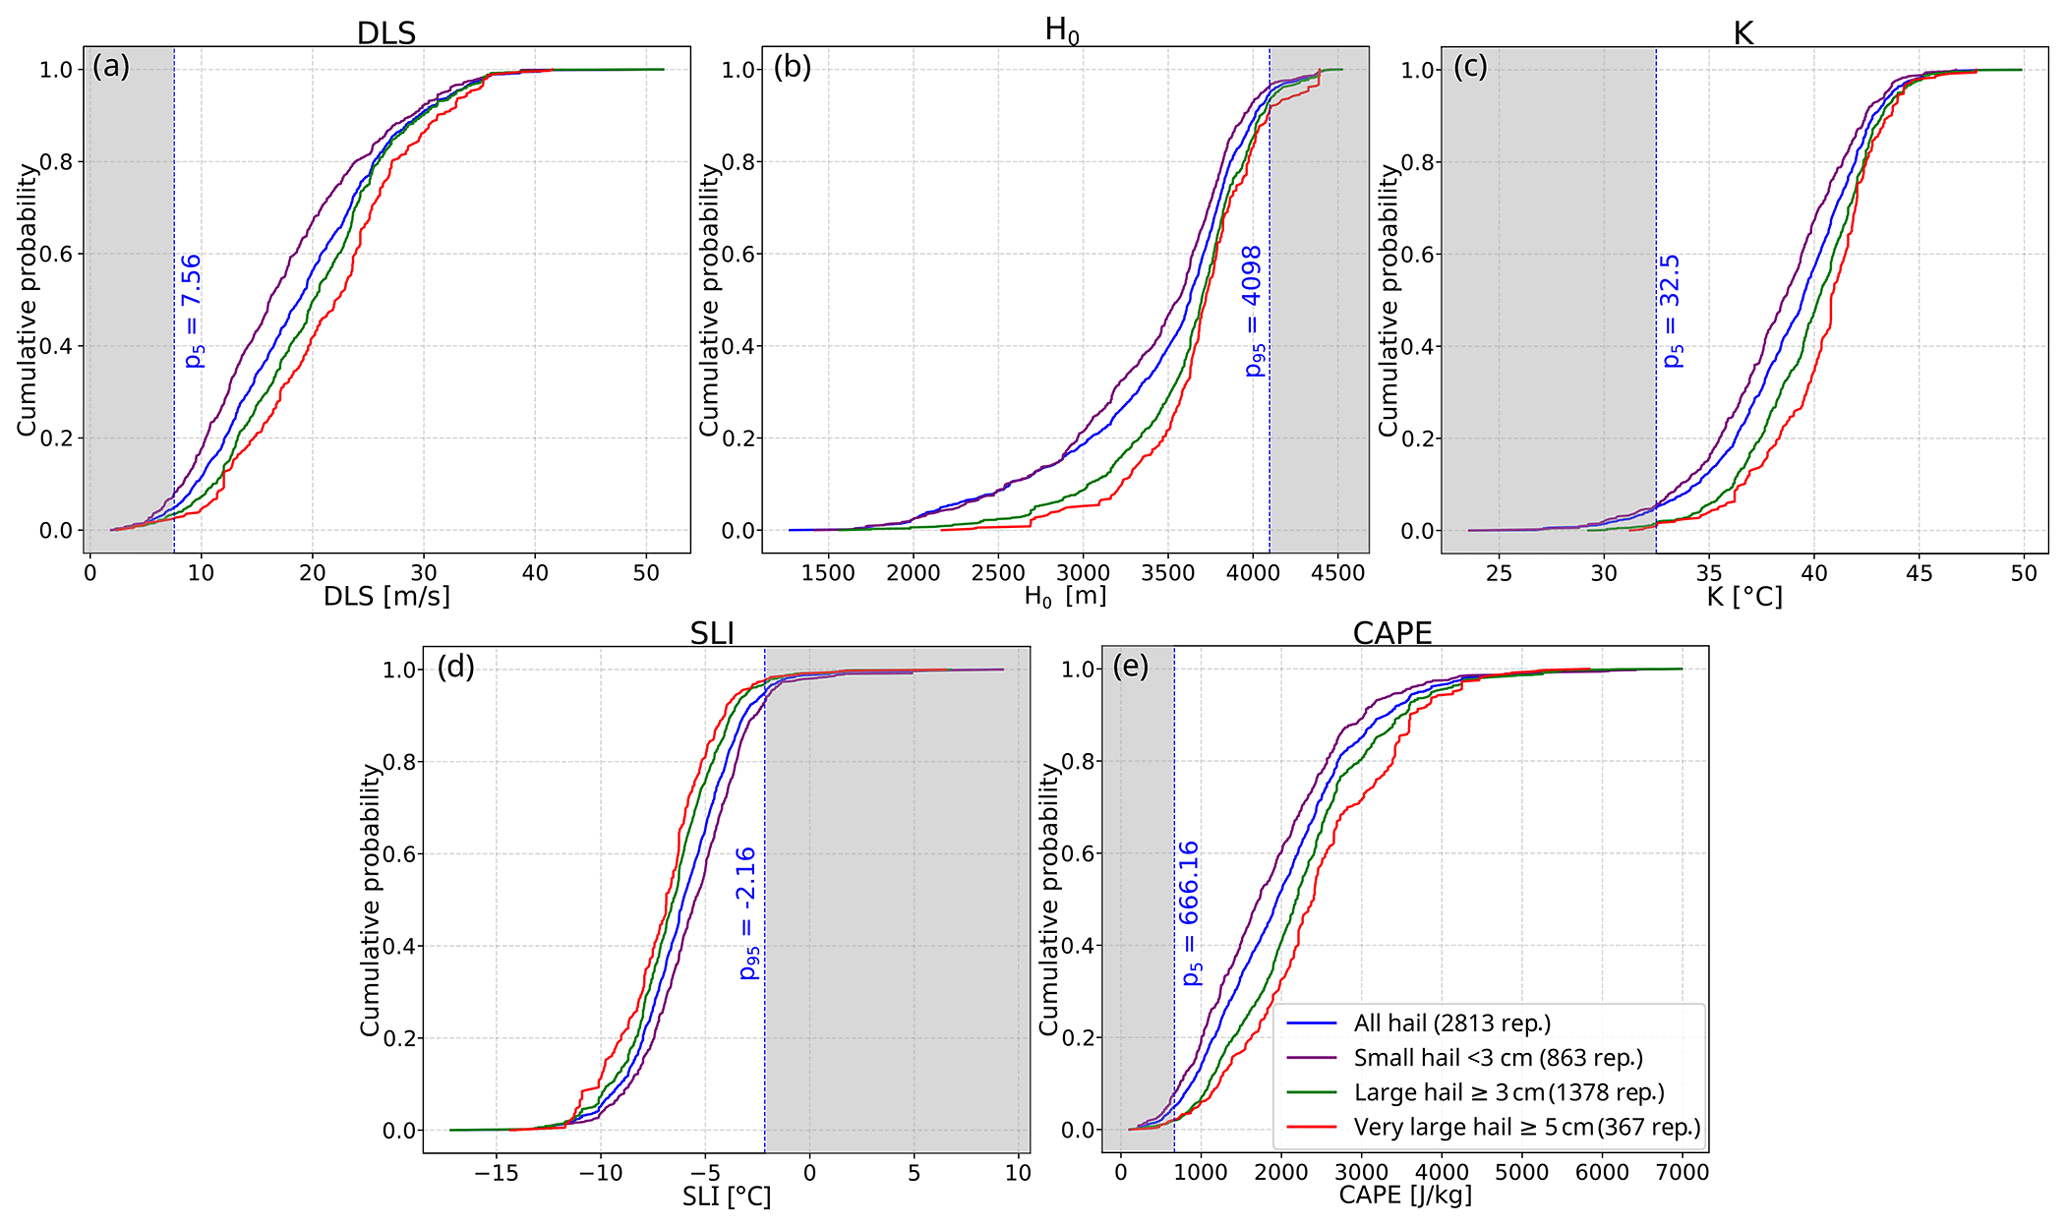
Figure 4Cumulative density functions of the five parameters selected from SPHERA in the presence of ESWD hail reports. Hail reports are divided into different classes: all reports (blue lines), small hail (<3 cm, purple lines), large hail (⩾3 cm, green lines), and very large hail (⩾5 cm, red lines). The vertical dashed blue lines indicate the thresholds selected for defining the OT hail filter reported in Table 1. The shadowed portion of the distributions indicates the range of values where the filter is effective. (a) DLS, (b) H0, (c) K index, (d) SLI, and (e) CAPE.
3.1 Reanalysis parameter contribution to OT filtering
Table 1 reports the thresholds obtained, the number of OTs, and the relative percentages filtered by applying the five parameter conditions together (hereafter referred to as full filter) and for each parameter. Singular-parameter contributions to the filter vary from 7.0 % to 11.2 %. Since the same OTs are sometimes filtered by more than one variable, the percentage of removed OTs with the full filter is lower than the sum of the singular filters and reaches 27.0 %. The number of days when instability index filters (SLI, CAPE, and K index) are active amounts to ∼70 % and beyond. This suggests their dominant contribution in the OT selection compared to DLS, which filters in roughly half of the days, or to H0, which is active in less than one-third of the days. The resulting full filter is active in almost the totality (95 %) of days with at least one detected OT.
Table 1Variables and thresholds used in the OT filter, relative number and percentage of OTs filtered, and number of days with active OT filtering (with percentages expressed out of the 872 d when at least one OT is detected).

To understand the impacts of the different parameters in the OT filtering, their spatio-temporal contributions are investigated. Figure 5 shows the spatially distributed filtered percentage of OTs for the single-parameter filters (Fig. 5a–e) and for the full filter (Fig. 5f). Instability parameters (Fig. 5a–c) filter mainly over certain areas of the sea (especially in the southern and western Mediterranean) and the Alpine crest, particularly along the Italian–Swiss border. The largest contribution over the sea is given by the K index, while over land CAPE and SLI are more active. This is presumably due to the explicit inclusion of the water vapour content in the atmospheric column in the K index, which weighs more over the sea. H0 (Fig. 5d) filters most OTs over lower latitudes (Tunisia and Algeria) and high-elevation terrains, especially over the whole Alpine crest. This enhanced removal is attributable to the generally colder atmospheric profiles found over the Alps (compared to lower-elevation regions) where the simulated topography reaches elevations as high as 3950 m in SPHERA reanalysis (Fig. 3a), and the freezing level usually exceeds the imposed threshold of 4098 m. However, as seen by the spatial distributions of ESWD reports (Fig. 2a) and OTs (Fig. 3b), the Alpine crest is the least populated region of the domain in terms of hail reports and prominent OTs. This is attributed to the difficulties of deep organized convective systems to develop in extremely complex terrains, in agreement with a recent climatology of lightning flashes and associated conditions for convective initiation over the Alpine area (Manzato et al., 2022b). Hence, it is believed that the chosen H0 threshold is not detrimental to the analysis presented here (a possible proposal for a more sophisticated H0 filtering could be topography dependent).
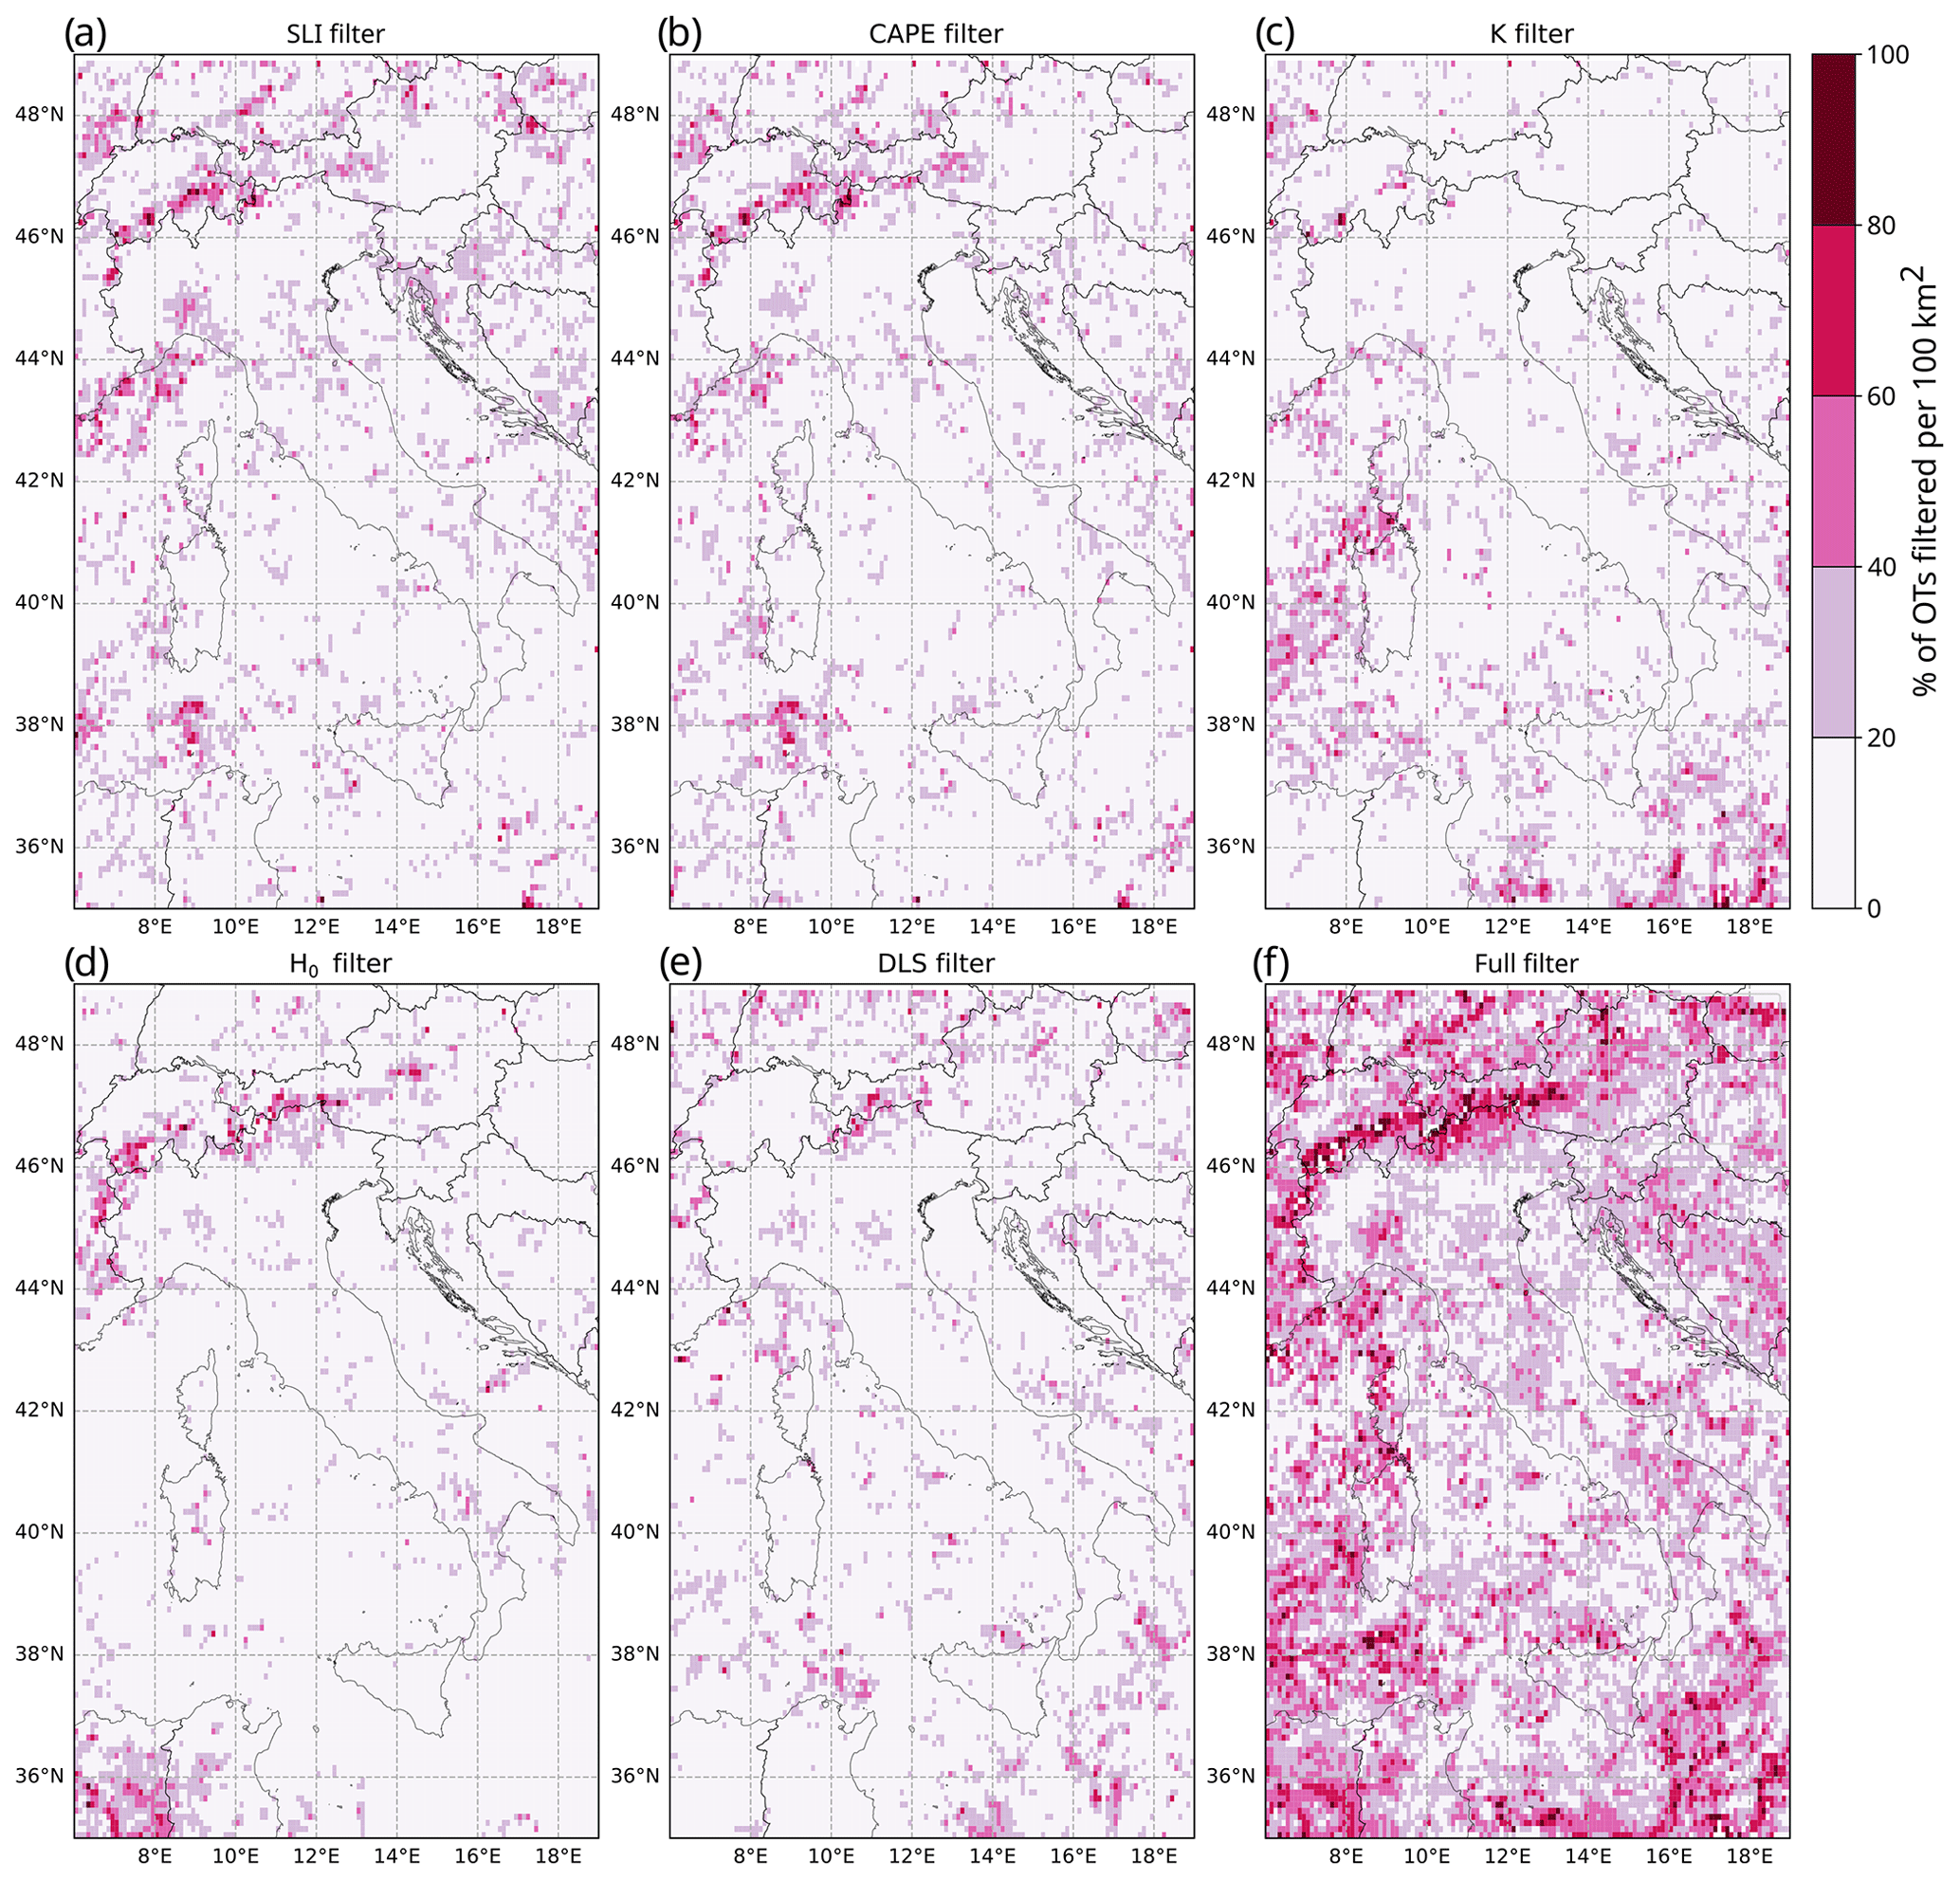
Figure 5Percentage of filtered OTs per grid cell (on a 10 km regular grid). (a) SLI, (b) CAPE, (c) K index, (d) H0, (e) DLS, and (f) full filter.
The DLS filter (Fig. 5e) shows less prominent spatial peaks than other parameters but enhanced activity in the northern part of the domain (i.e. southern Germany and northern Austria) and in the south-eastern Mediterranean Sea.
The combination of the five individual filters (Fig. 5f) delivers maximum filtering (∼100 %) along the northern Italian border where the main mountain peaks of the Alps are located and substantially high (∼60 %) but locally variable filtering over the western and southern Mediterranean Sea, southern Germany, and eastern Austria.
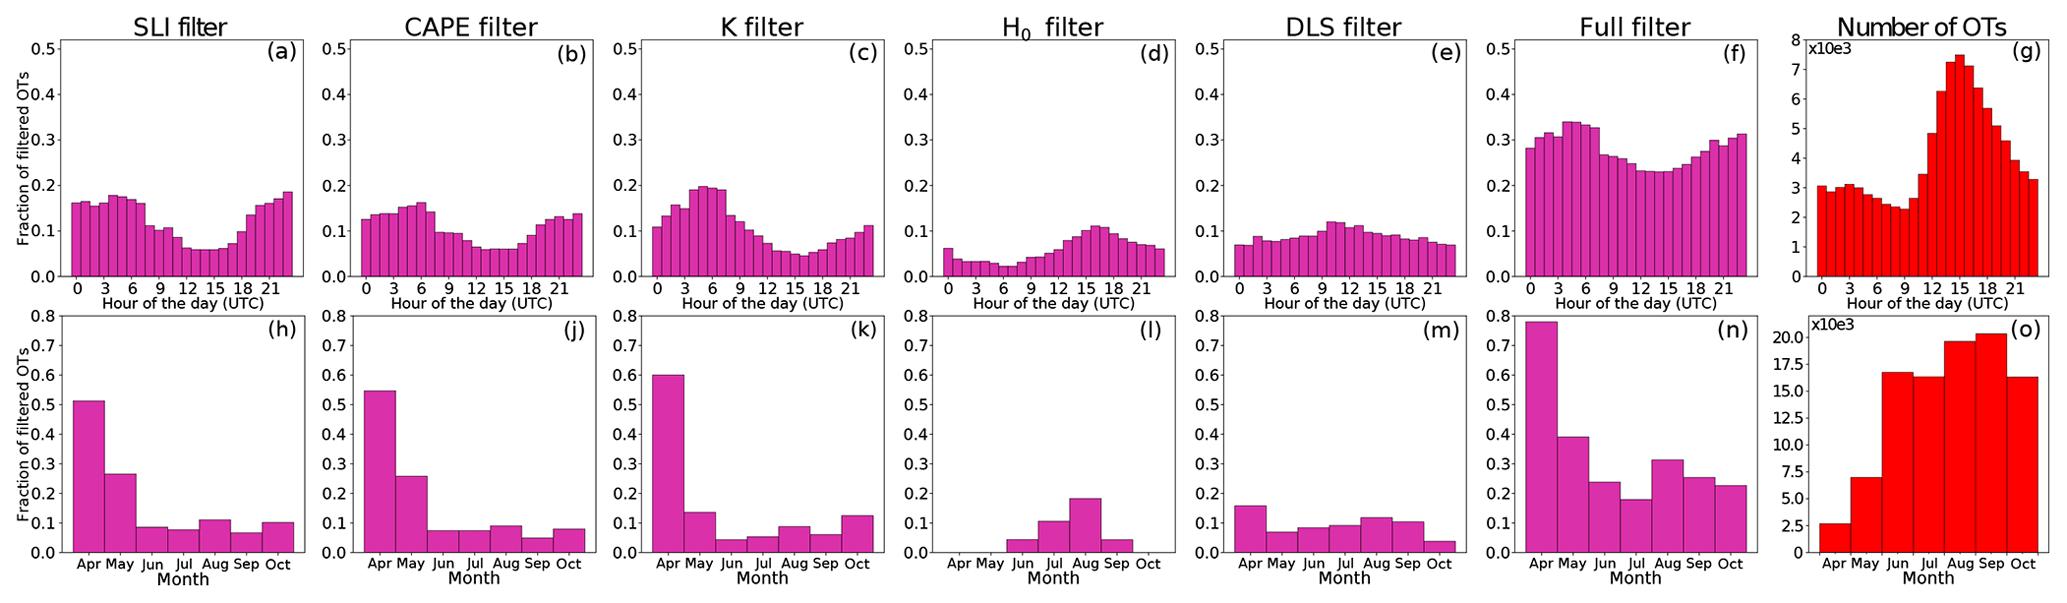
Figure 6Percentage of filtered OTs aggregated over the spatial domain per hour of the day (a–g) and per month (h–o) considering singular-parameter filters: (a, h) SLI, (b, j) CAPE, (c, k) K index, (d, l) H0, (e, m) DLS, and (f, n) the full filter. The total number of OTs per hour of the day and per month is reported in panels (g) and (o), respectively.
Figure 6 shows the percentage of filtered OTs for the different parameters depending on the hour of the day (upper row) and the month of the year (lower row), aggregated over the whole spatial domain. Further, Fig. 6g and o show the total number of OTs detected per hour of the day and month, respectively. It should be kept in mind that the local time zone over the considered region, central European summer time (CEST), is 2 h ahead of the UTC time zone. The OT activity shows a well-defined diurnal cycle (with the maximum number of detections at 15:00 UTC) and a decisive increase from spring to summer, which further rises in August and September. Instability parameters (SLI, CAPE, and K index) filter mainly during the night and early morning (reaching 20 % around 04:00–07:00 UTC) and in April (exceeding 50 %), May, and October. This reflects the lower likelihood of hail-favouring convective conditions at these times of the day and year. Conversely, their contribution to the filter is minimal when the increased heating of the boundary layer enhances the potential for convective activity and reduces convective inhibition, increasing the possibility of hail formation (e.g. Markowski and Richardson, 2011), i.e. during the central hours of the day (with less than 10 % removal around 14:00–16:00 UTC) and during June–July–August (JJA). No evident differences among the three parameters are detected.
The H0 contribution (Fig. 6d–l) is roughly opposite to that of the instability. The largest removal is found in the afternoon (∼12 % at 16:00–18:00 UTC) and in late summer, especially in August (about 20 %). This seasonal variation is likely linked to the warming of the lower troposphere peaking in August in this region, owing to the annual cycle of solar insolation, producing an upward shift in the freezing level. On the other hand, the daily cycle in the H0 filter cannot be generally related to the diurnal cycle of boundary layer warming. In fact, at altitudes of ∼4 km above sea level (a.s.l.), temperature changes are mainly driven by horizontal advective processes rather than by vertical sensible heat fluxes, which are hardly affected by low-level daily variability. The largest percentage of H0-driven OT removal is found over the main Alpine crest (Fig. 5d), where the atmospheric boundary layer could extend over 4 km a.s.l., despite being very shallow, implying a possible diurnal impact on the H0 variation. In any case, this does not constitute a critical issue for the purpose of the analysis presented here, as indicated by the almost complete lack of multiple hail proxy signals in the Alpine region (i.e. hail reports, OT, and lightning detections).
The DLS filter (Fig. 6e–m) shows the least diurnal and seasonal variations, with slightly higher OT removal rates around 10:00 UTC (∼12 %) and in April (∼15 %). The reduced variability in DLS filtering compared to all the other parameters is most likely attributed to its kinetic (rather than thermodynamic) nature and to its direct relationship with synoptic-scale forcings. Indeed, during the considered warm season of the year, the typical synoptic conditions found in the study region are dominated by a persistent anticyclonic ridge. This large-scale forcing produces a generally less variable and lower wind magnitude difference between the surface and at ∼6 km altitude compared to its cold-season counterpart, which is characterized by more dynamism (e.g. stronger jet streams) and associated with the DLS climatological maximum (Taszarek et al., 2018).
The resulting full filter on the daily term (Fig. 6f) shows maximum removal of more than 30 % in the morning and evening (04:00–07:00 and 20:00–23:00 UTC, respectively) and up to a minimum of ∼23 % around 13:00–15:00 UTC. Considering the seasonal cycle (Fig. 6n), the parameter combination shows enhanced filtering in spring (April with almost 80 % and May with almost 40 %) followed by August with a removal above 30 %. Hail-favouring conditions are most likely to be established in July and June, where minimum OT removals of ∼13 % and ∼22 % are issued, respectively. This tendency is in good agreement with the observed hailstorm distribution over the years considered (Fig. 2e) and with more robust 28-year ESWD-based hail climatology (Púčik et al., 2019).
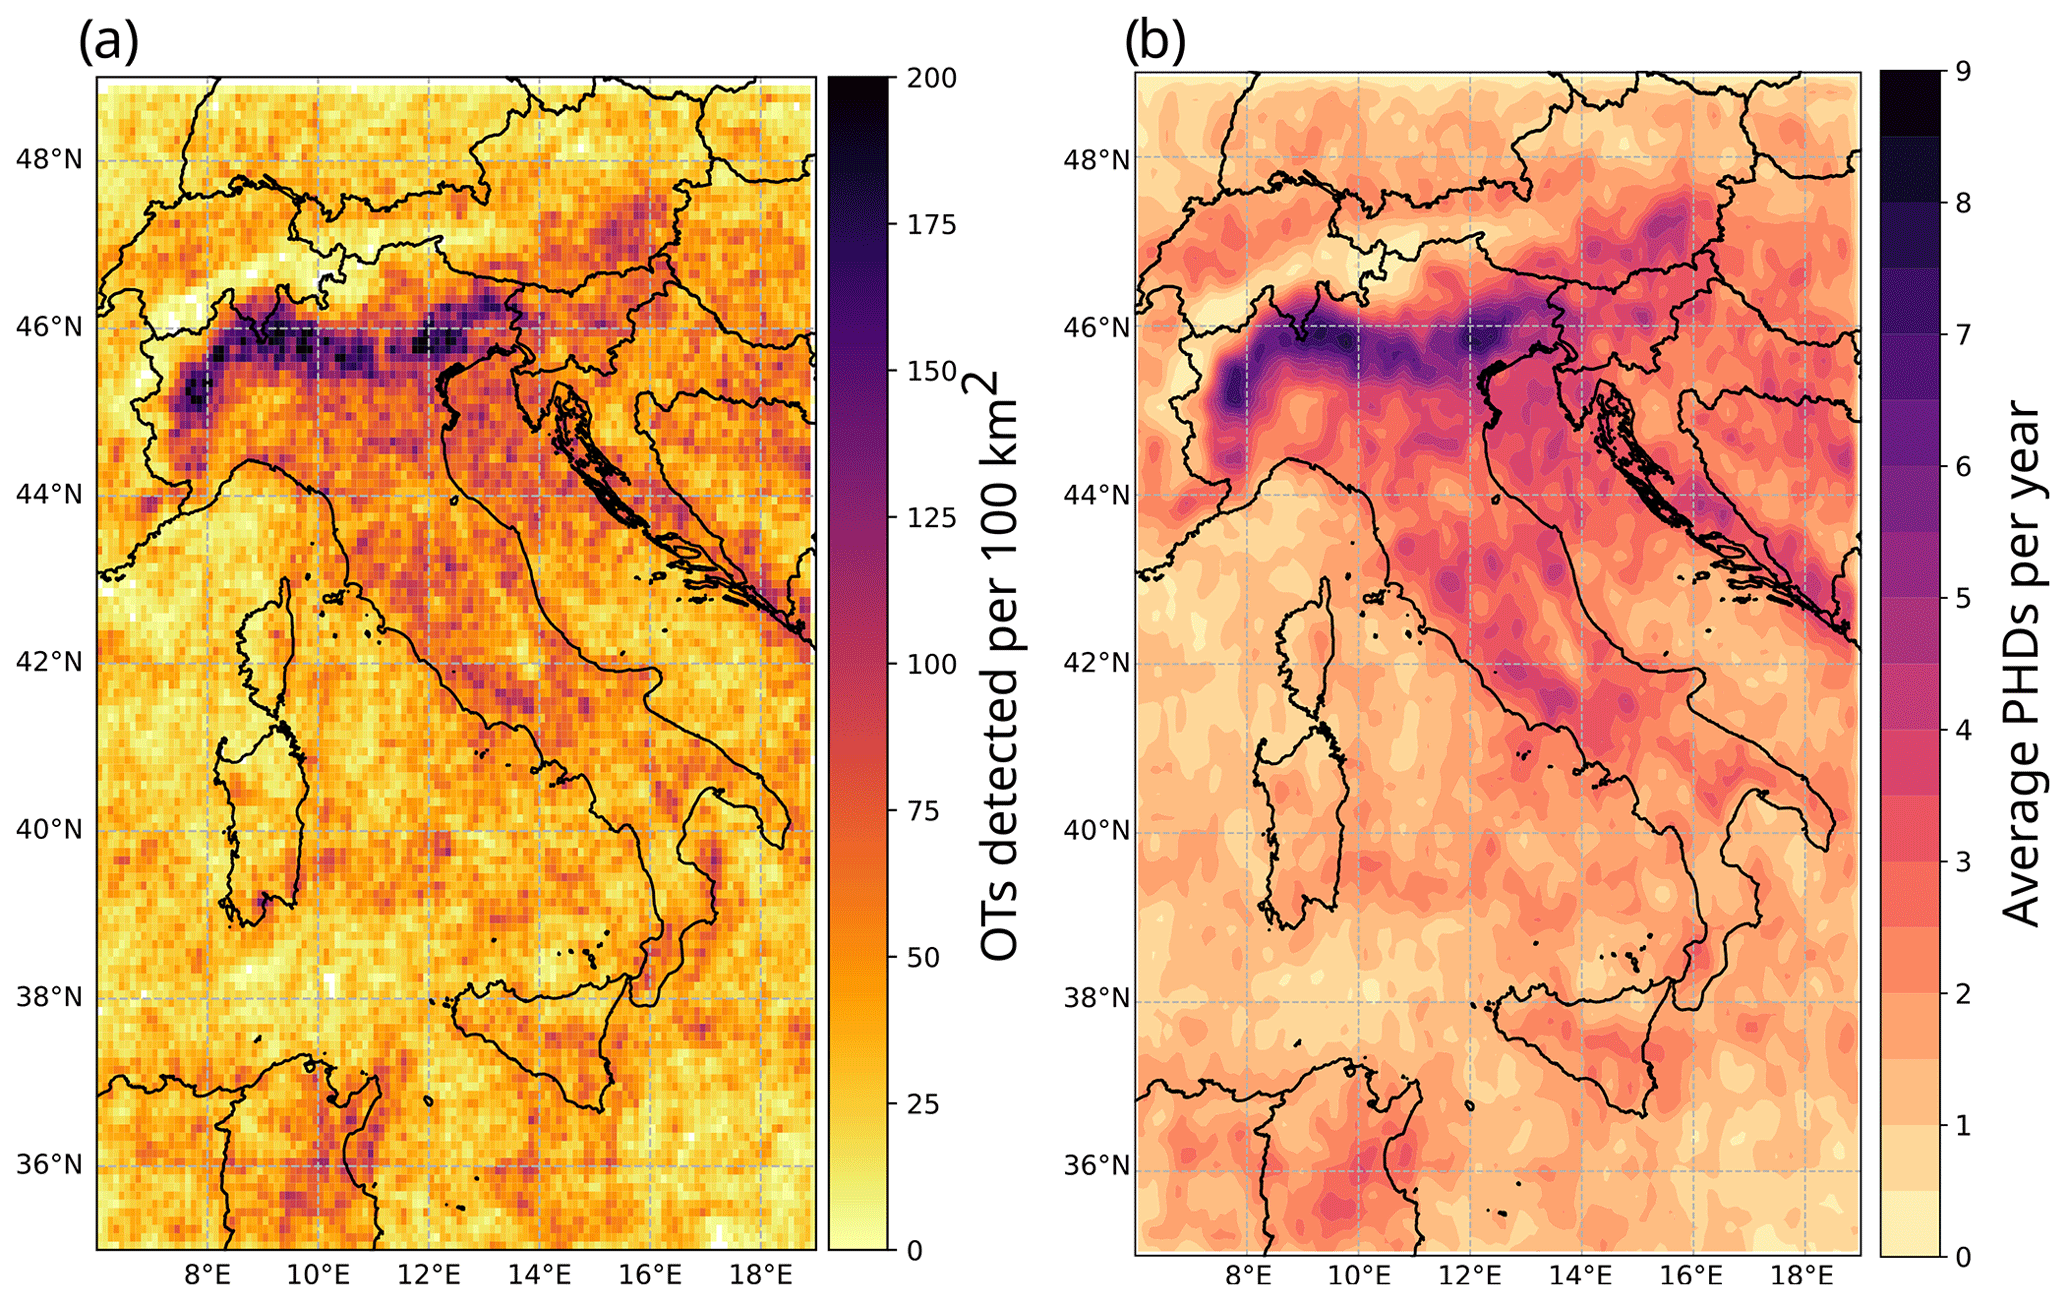
Figure 7(a) Same as Fig. 3b but for OTs retained after the hail-specific filter. (b) The resulting average number of potential hail days (PHDs) per year over 2016–2020 estimated from the hail-related OT distribution in (a) after spatial smoothing with a Gaussian filter.
4.1 Spatio-temporal characterization
Figure 7a shows the spatial distribution of the 723 142 OTs retained after applying the filtering described in the previous section over the five extended warm seasons considered. Compared to the original distribution (Fig. 3b), a decrease in the number of OTs over the main Alpine crest is evident, associated with the maximum removal rate in that area (Fig. 5f). Fewer OTs are also detected over land at lower latitudes (Algeria and Tunisia), over the Mediterranean Sea, throughout the Apennines, and in north-eastern continental areas (Austria, Slovenia, Croatia, and Bosnia). The main hotspot of OT frequency in the region along the southern pre-Alps and northern Po Valley is well preserved after filtering. Further, the resulting contrast with the minimum OT frequency found over the main Alpine crest is more pronounced than before filtering. This suggests the identification of preferential areas for hail formation, which show good agreement with the findings from Punge et al. (2017) and recent radar-based hail climatology (Nisi et al., 2020).
Hail frequency in a certain area is usually estimated as the number of hail days per year rather than the number of every single hailstorm (Punge and Kunz, 2016). In this case, a potential hail day (PHD) is defined as a day when at least one hail-related OT is detected per reference area of 10×10 km2. The sensitivity tests performed by increasing the number of OTs defining a PHD showed stable and mutually consistent spatial structures (only from >10 OTs per day did the distributions start to lose too much detail). The resulting average PHD distribution is reported in Fig. 7b after spatial smoothing with a Gaussian filter. This is done to minimize potential uncertainties arising from spatio-temporal shifts between the OT proxy and the occurrence of hail on the ground and to homogenize the gridded distribution. The result suggests a maximum hailstorm frequency of ≥7 PHDs per year in the vicinity of the southern Alpine slopes and ∼0 PHDs over the Alpine crest.
The intra-annual variations in hail frequency are estimated on a monthly basis in terms of the geographical distribution of PHDs per month (Fig. 8) and with histograms of hail-related OTs over the whole domain separately for land and sea areas (Fig. 9). Hail frequency is found to be almost zero in early spring but increases from April to May, when the cooler temperatures over land and the sea surface lead to lower low-level moisture, which limits the development of deep moist convection. Hail likelihood rapidly increases in June and July over continental areas, with a well-defined peak around the Alpine region. Particularly in July, besides the widespread maximum over the southern pre-Alps in northern Italy, circumscribed hotspots over central Switzerland and south-western Germany are detected, in accordance with Nisi et al. (2016). Starting from August and extending to September, a significant reduction in the hail-filtered OT rate over land is evident (Figs. 8e, f and 9a), coupled with a gradual increase in thunderstorm development over the warm waters of the Tyrrhenian and Adriatic seas (Fig. 9b). Finally, in October (Fig. 8g) a further shift in hailstorm activity towards the lower latitudes of the southern Mediterranean Sea is detected while maintaining the hail hotspot over the Tyrrhenian Sea. This is linked to the increased cooling of the continental surface and the growing likelihood of mid-latitude cyclone formation in this region resulting from the maintenance of warm sea surface temperatures (e.g. Flaounas et al., 2022).
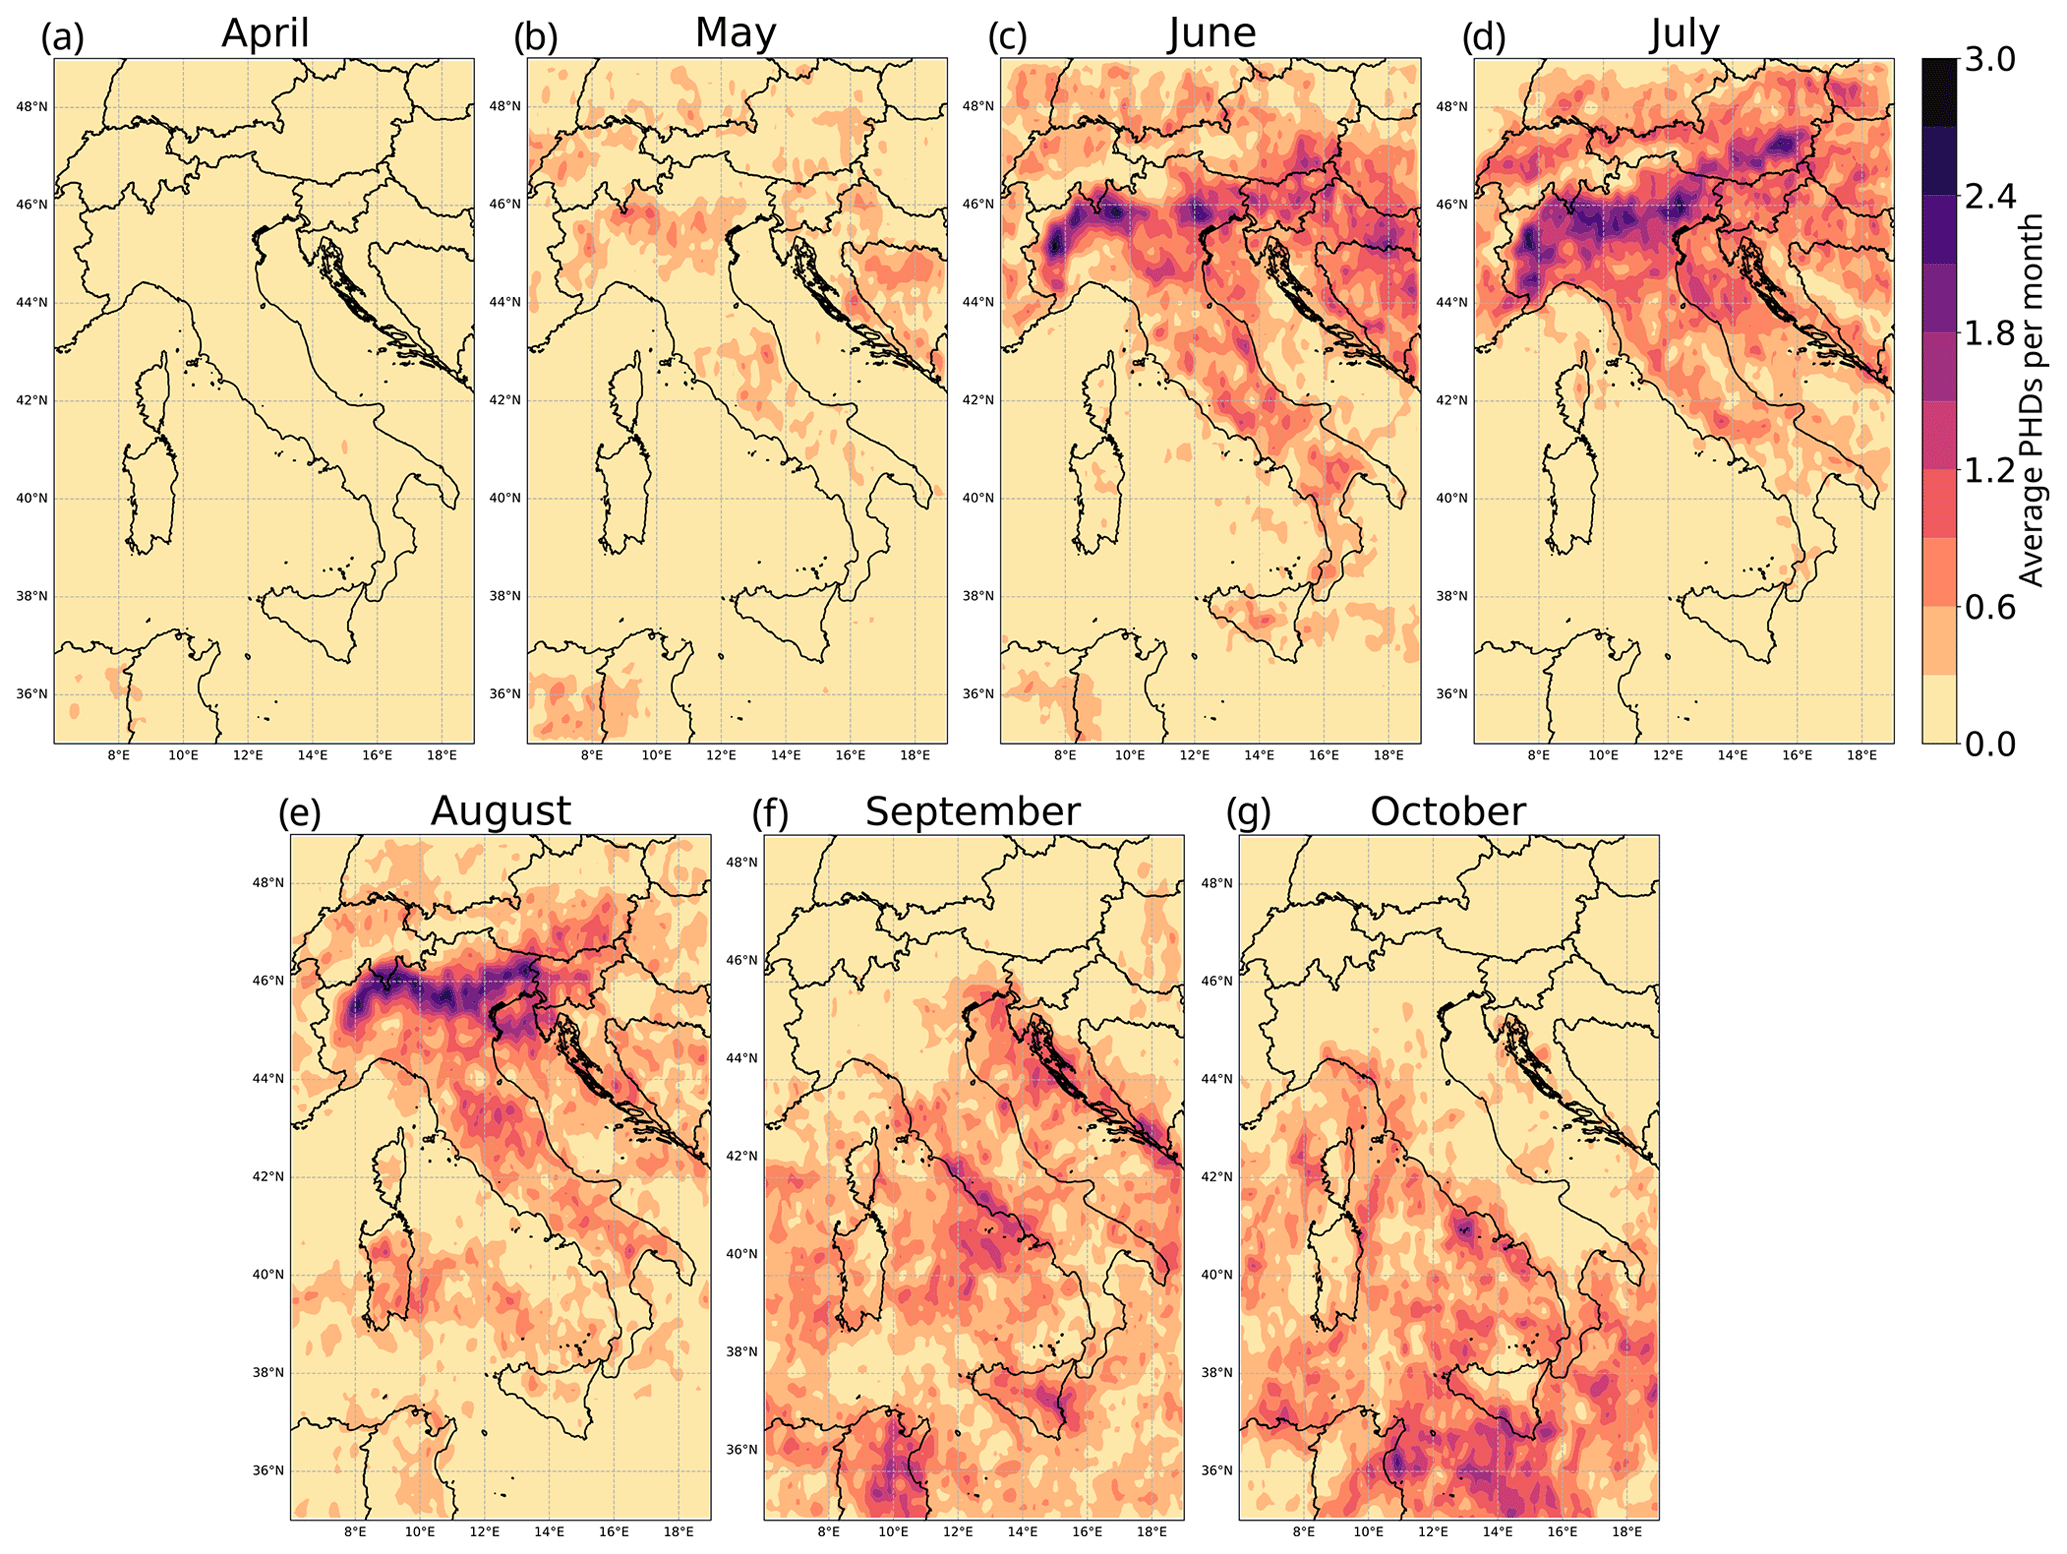
Figure 8Same as Fig. 7b but distinguishing between (a) April, (b) May, (c) June, (d) July, (e) August, (f) September, and (g) October.

Figure 10 shows the diurnal cycle of hail-related OT activity separated between land and sea areas. Over land, very infrequent OT detections are revealed during the night and early morning, with a rapid increase starting from 10:00 UTC and peaking at 15:00 UTC (i.e. 17:00 CEST). This reflects the maximum diurnal heating of the near-surface troposphere, which reduces convective inhibition and increases the likelihood of atmospheric instability conditions. During the afternoon, a slightly more gradual decrease is detected. Over the sea, OTs are more likely to form during the night and early morning (from 23:00 to 09:00 UTC) compared to over land, with a local maximum at 03:00 UTC. This is most likely linked to the north-eastern Adriatic hotspot of nocturnal hailstorm generation (discussed in the next paragraph – Fig. 11b). Afterwards, a gradual decrease in marine OT activity is detected after around 12:00 UTC, when OT frequency fluctuates slightly during the afternoon and increases during the evening. These findings are in good agreement with the spatio-temporal distribution of the European OT characterization (over 2004–2009) of Bedka (2011).
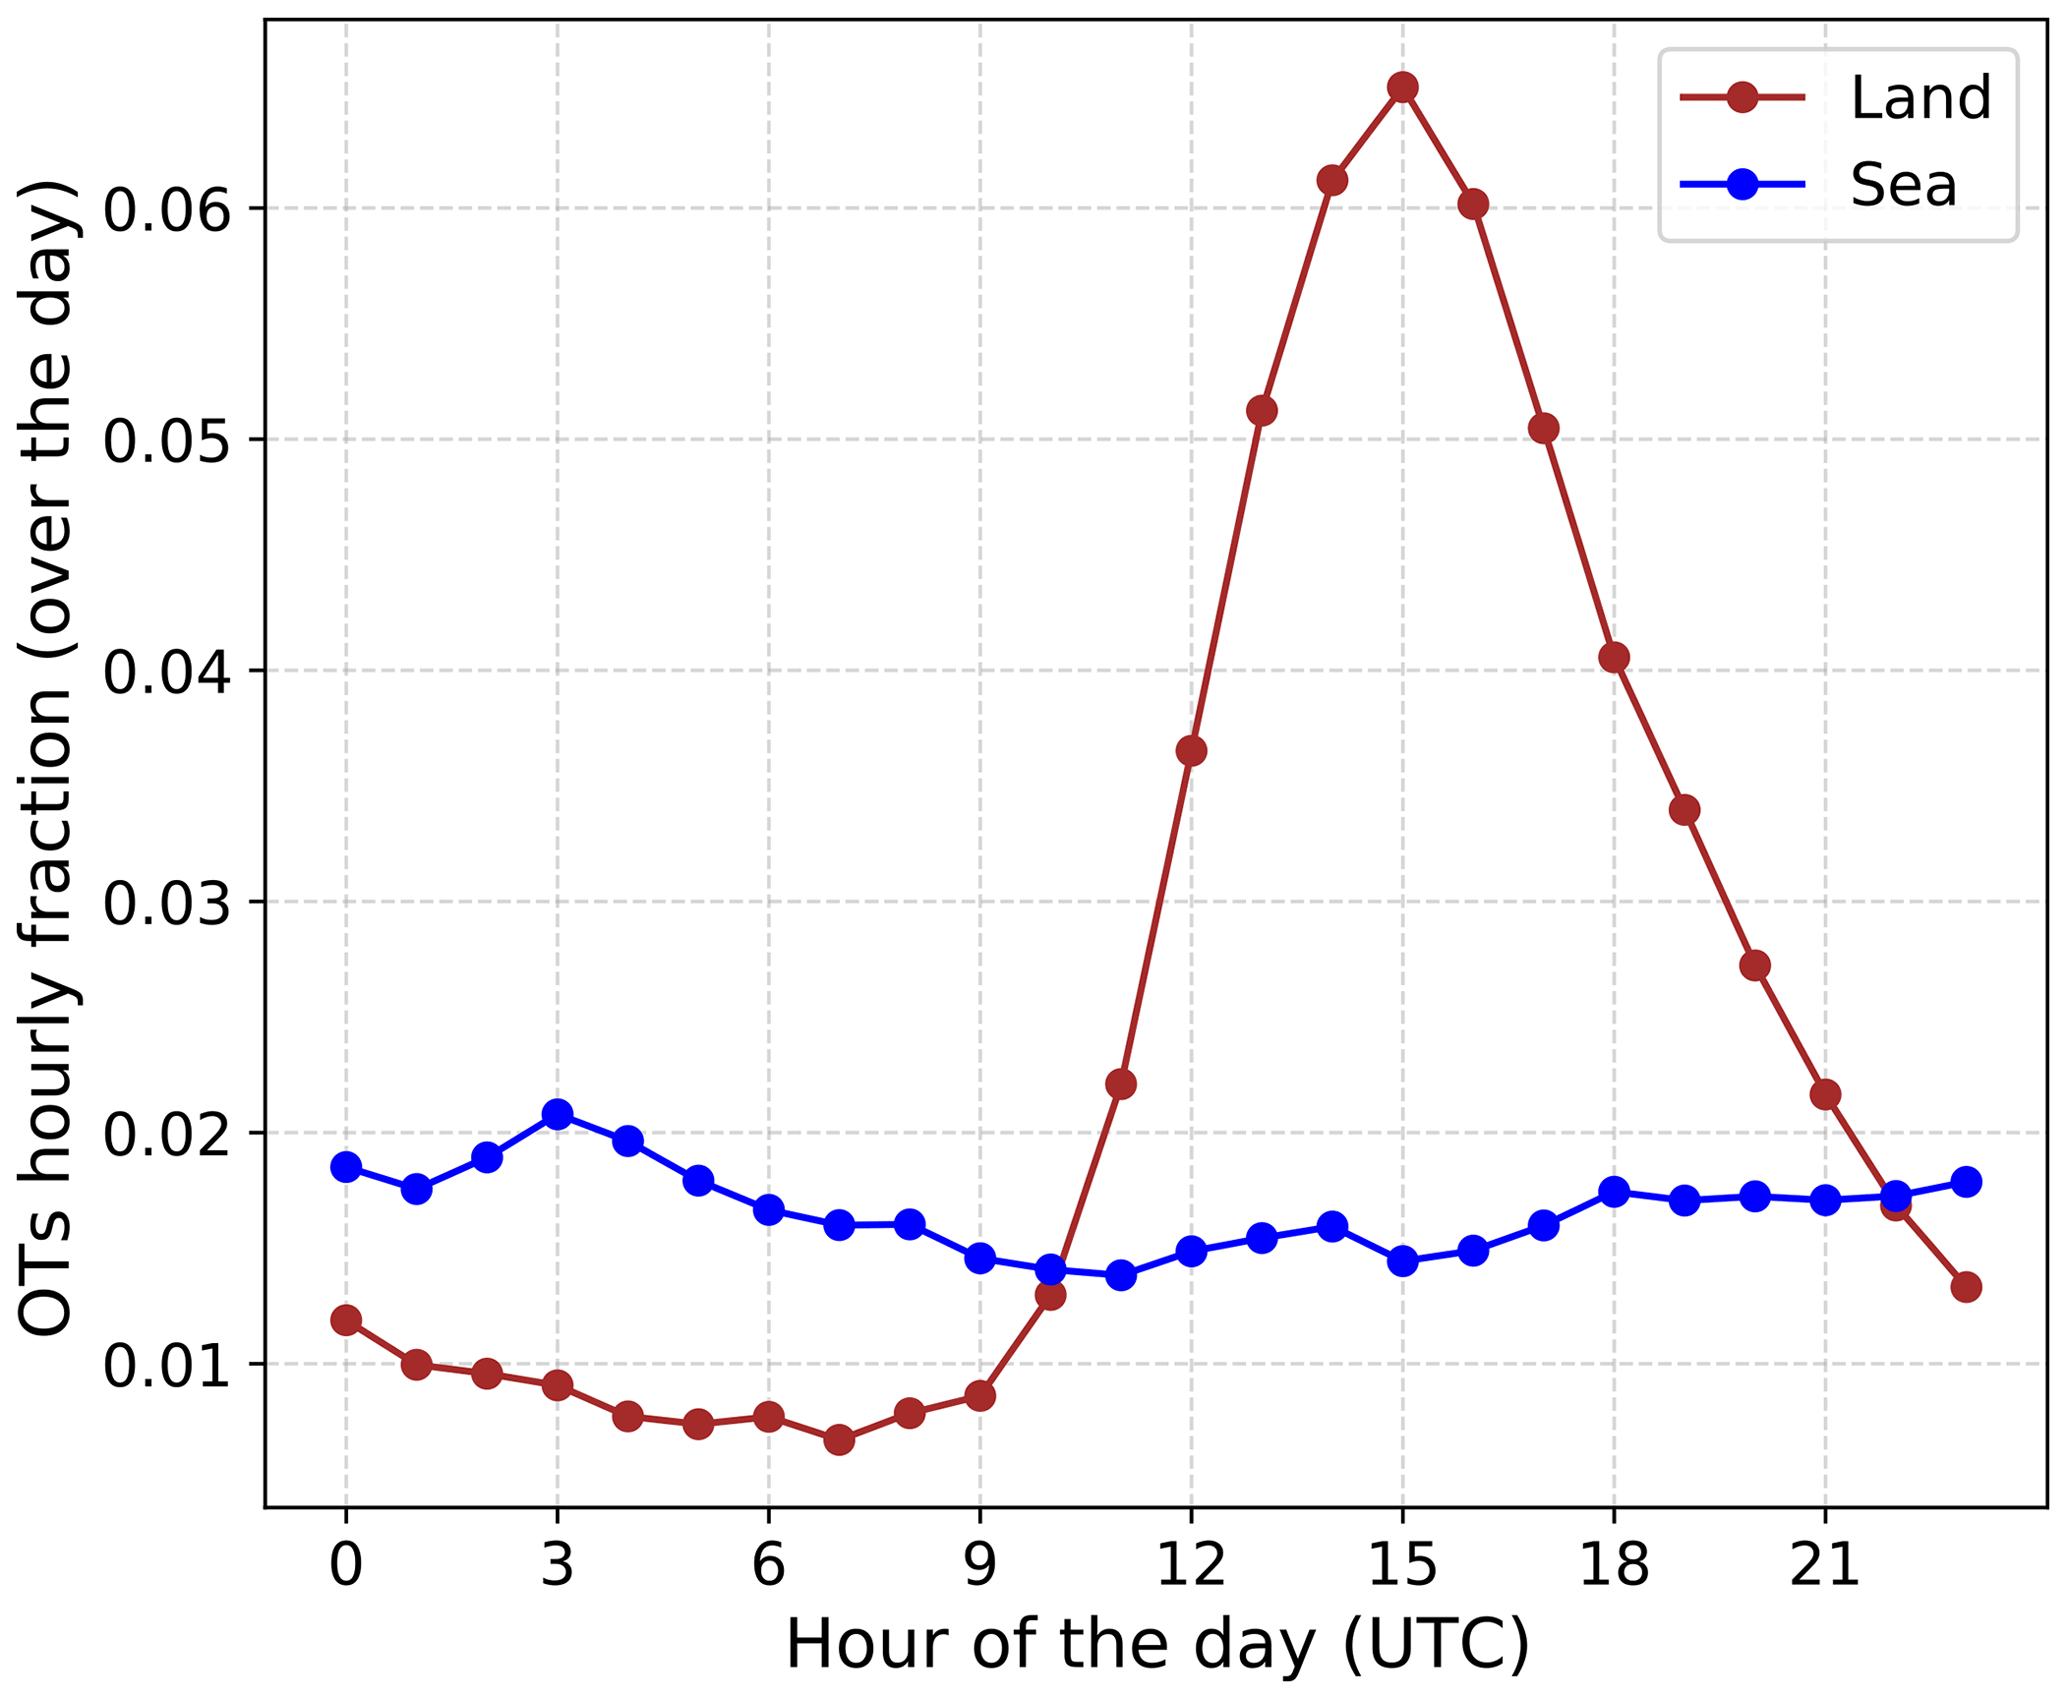
Figure 10Hourly percentage of hail-related OTs separating land (in red) from sea surface (in blue) and aggregating over the whole spatial domain.
Following these results, a separation between daytime (10:00 to 21:45 UTC) and nighttime (22:00 to 09:45 UTC) is proposed in Fig. 11. Hail is generally found to be more frequent over land during daytime (Fig. 11a) and over the sea during nighttime (Fig. 11b). Hail likelihood during daytime is the highest over southern pre-Alpine areas and significantly pronounced over high-elevation terrains, especially in the eastern continental part of the domain (Austria, Slovenia, and the Balkans) and over the central-southern Italian peninsula. During nighttime, the northern Adriatic Sea is an evident hail hotspot, with the maximum along the western Croatian coast. This may be linked to the combination of the north-eastern mountains, supporting convective development, with local near-surface wind convergence, causing the formation and organization of convective cells over coastal areas during the afternoon and early evening (Mikuš et al., 2012; Jelić et al., 2020). A further relevant nighttime hotspot is detected over north-western Italy along the border with Switzerland and all along the pre-Alpine southern flank area. This is presumably linked to late-evening thunderstorm formation over the foothills, most likely imputable to katabatic winds interacting with thermally driven Alpine pumping circulation (Bica et al., 2007). The interaction between these flows produces local convergences, enhances vertical wind shear and orographic lifting, and ultimately promotes convection initiation over the region (Nisi et al., 2020). Finally, the western Italian coast also shows prominent (to a lesser extent) nocturnal potential hail signals, which are mostly underestimated by ESWD-based estimates (Fig. 2d), likely owing to the reduced observational activity during nighttime (Fig. B1).
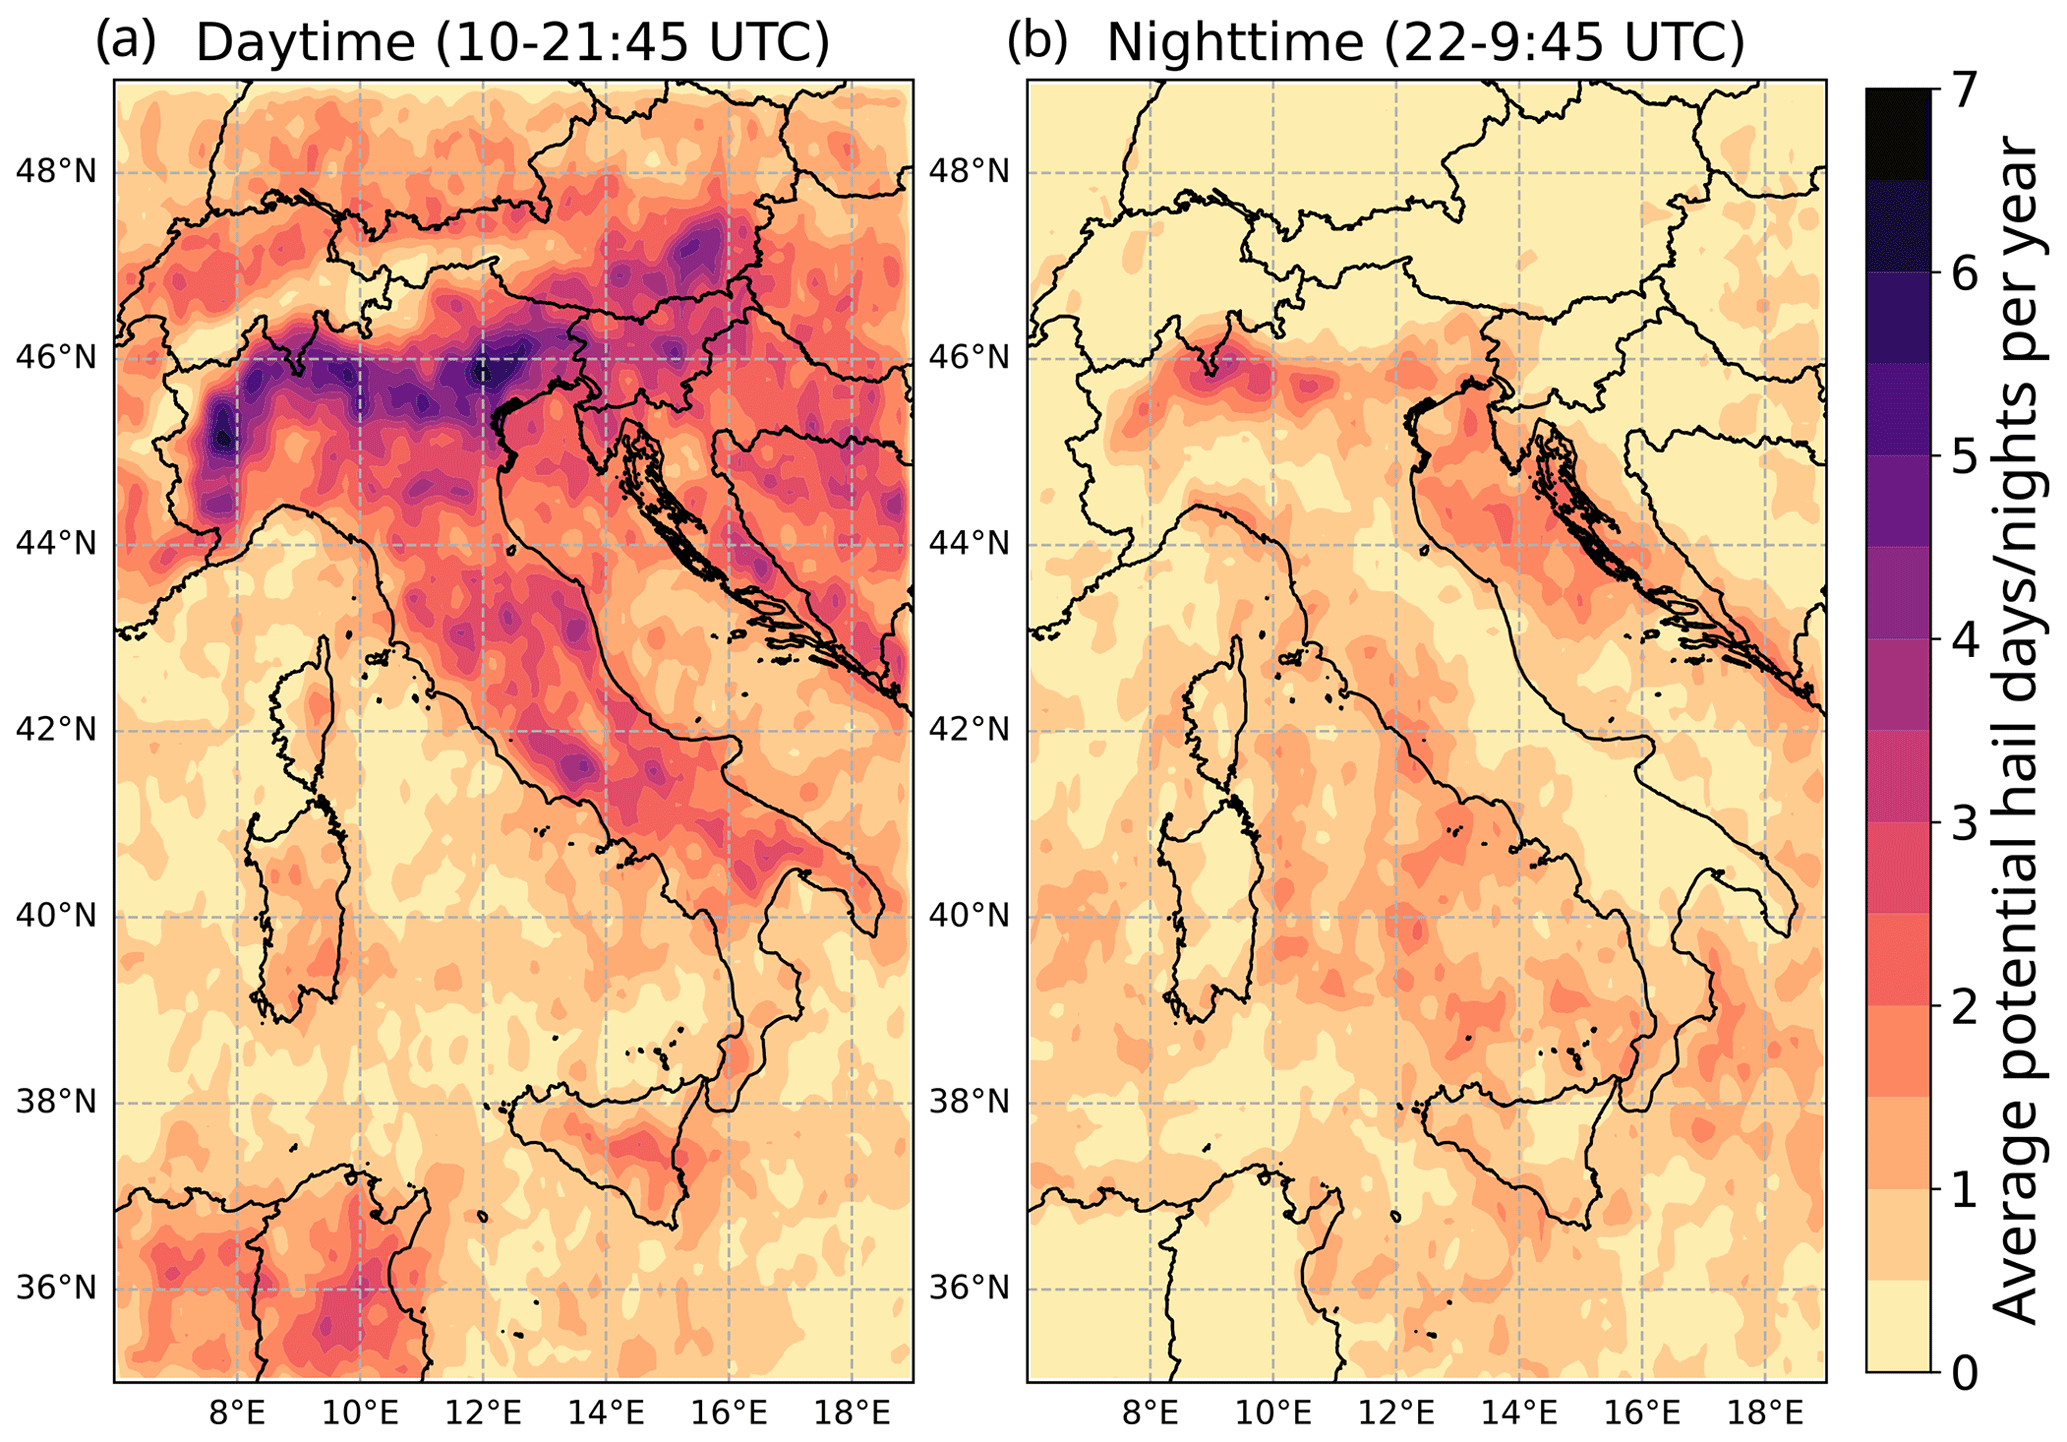
Figure 11Same as Fig. 7b but separating (a) daytime (i.e. 10:00–21:45 UTC) from (b) nighttime (i.e. 22:00–09:45 UTC).
4.2 Hail proxy matching with ESWD hail reports
The appropriateness of the hail proxy is evaluated by comparing both filtered and unfiltered OT detections with ESWD hail reports. The objective is to quantify how often an OT is found in the spatio-temporal vicinity of observed and confirmed hailstorms. The same ESWD sample used to define the environmental thresholds of the reanalysis parameters to filter the OTs (Sect. 3) has been used to validate the final dataset. However, the comparison between reports and hail-related OT detections is believed not to be affected by any substantial overfitting issue. This holds true given that the main source of information used to build the proxy is that on OTs, while the SPHERA indices are only used to filter these data in a very conservative way, which is by removing the events when hail is unlikely to occur because the SPHERA parameter values fall in the tail of their respective distributions. Unfortunately, a complete assessment of the performance of the hail proxy is not possible because of the incomplete information provided by crowd-sourced reports, as discussed in Sect. 2.1. Several events may be missed or under-reported in the crowd-sourced data (e.g. in sparsely populated areas such as mountainous regions or during nighttime), which is recognized to be the dominant issue of the ESWD database (Púčik et al., 2019). Statistically, this implies that in the contingency table we can only assess the hit-and-miss rates describing the joint distribution of the “forecast” (OT detections) and observations (hail reports) and not the false alarms or the correct negatives.
The matching condition between satellite detections and hail reports consists of a temporal window of ±1 h around the OT detection time and 25 km from each OT location. This relatively sharp temporal window is considered given the temporal accuracy ≤1 h characterizing more than 98 % of ESWD reports (Fig. 2b). The 25 km distance criterion is retained from Bedka (2011) and Punge et al. (2017) and accounts for a maximum storm motion of 60 km h−1 and possible latitude/longitude uncertainty in ESWD reports. The matching with the set of hail reports having a quality level of QC1 or higher (2293 reports) is considered for both the original and the hail-filtered OT datasets (over land only) to highlight possible differences owing to the filter procedure. Further, the subset of 1720 ESWD reports presenting high temporal accuracy (TA) ≤ 15 min is separately considered in the matching to investigate the impact of a lower temporal uncertainty in the surface reference state. Additionally, to investigate the sensitivity of the matching conditions between the hail proxy and observations, a less conservative spatio-temporal constraint of ±3 h over 75 km is proposed. The results are listed in Table 2.
Table 2Comparison between OT detections and ESWD reports (with quality level QC1 or higher) considering the two spatio-temporal matchings of 25 km over ±1 h and 75 km over ±3 h, for both the original (Orig OT) and the hail-filtered (Filt OT) datasets, only over land. The number of ESWD reports matching OT detections (Matching ESWD reports row) and the number of OTs agreeing with at least one ESWD report (OTs matching ESWD reports row) are reported. The comparison when considering only ESWD reports with high temporal accuracy (TA ≤ 15 min) is reported in bold.
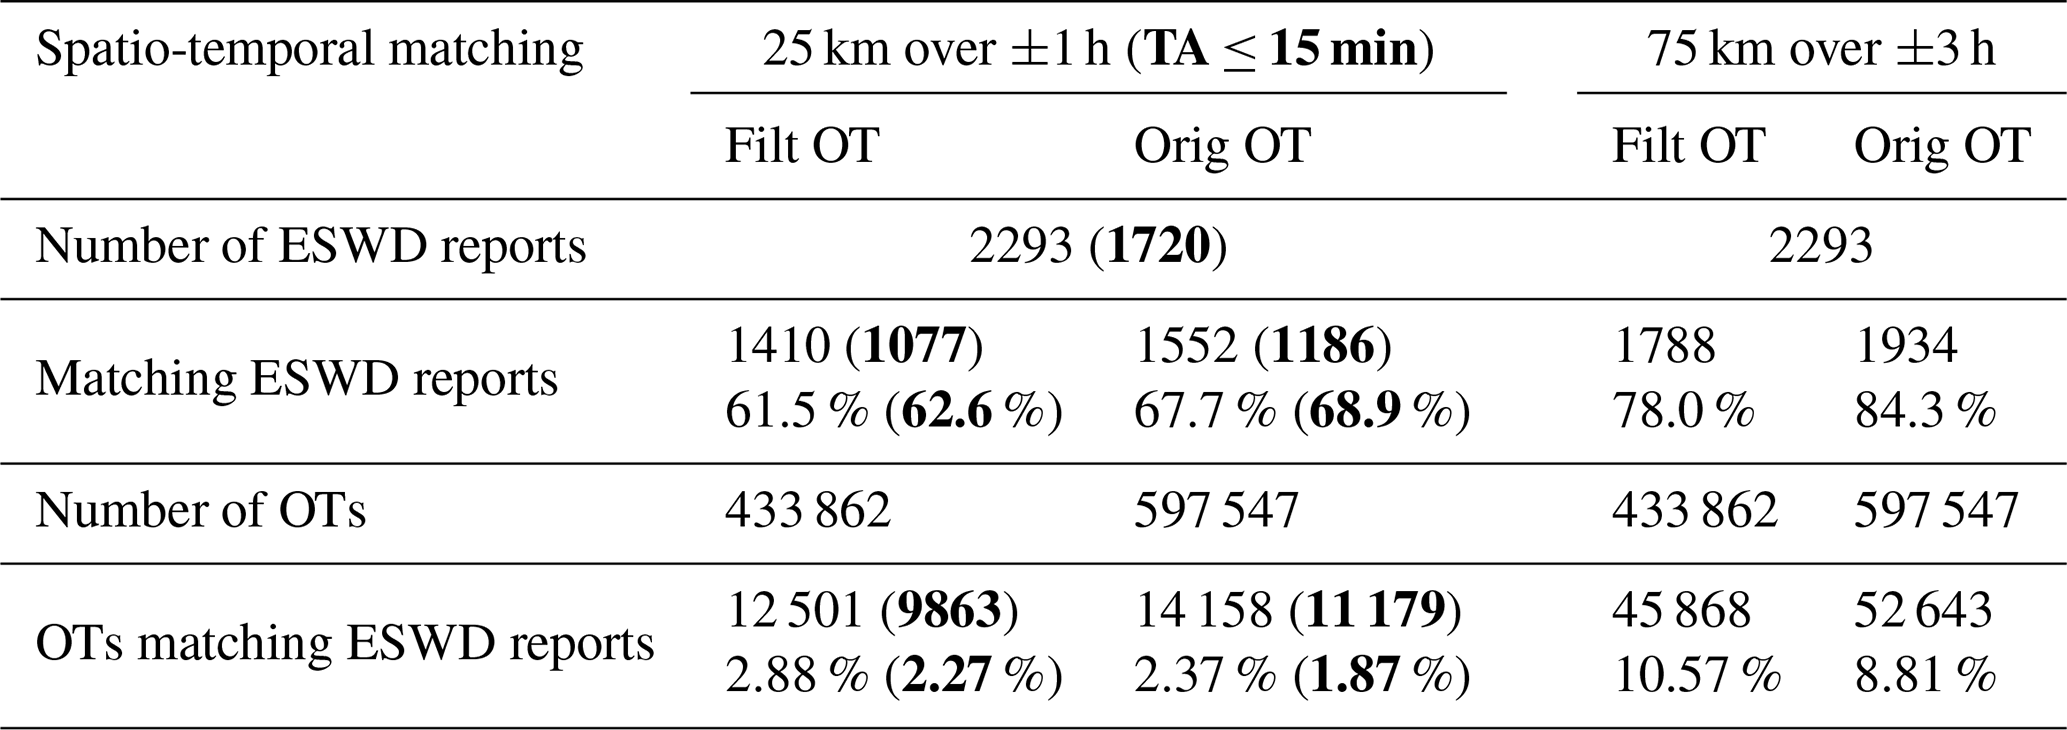
With respect to the 25 km over ±1 h matching, an OT of the unfiltered dataset is found in the vicinity of 67.7 % of the ESWD hail reports, while for hail-filtered OTs, the hit rate reduces to 61.5 %. When considering only reports with high temporal accuracy (≤15 min), the percentages increase slightly to 68.9 % and 62.6 %, respectively. To give an objective evaluation of these results, a comparison with a similar analysis previously performed by Punge et al. (2017) is proposed. However, given several differences in the research design, it is necessary to focus only on the qualitative aspects. The main differences between the present study and that of Punge et al. (2017) are the following: a larger spatial domain covering all of Europe (extending from England to Russia and from Norway to Egypt) over 10 years (2004–2014), the consequent different spatial coverage in the distribution of ESWD reports (which are only scarcely available in some regions such as France or Portugal during their analysis period), the employment of the former non-probabilistic version of the OT detection algorithm from satellite infrared imagery, and the substantially coarser description of hail-favouring convective environments owing to ERA-Interim reanalysis. Using the same spatio-temporal window considered here, Punge et al. (2017) found a hit rate decreasing from 40.3 % to 39.7 % for the unfiltered and filtered OT datasets, respectively, for a subset of 2475 ESWD reports (with quality level ⩾ QC1 and temporal accuracy ⩽ 15 min). This indicates that the proxy obtained in the present analysis has improved by roughly 23 % compared to that obtained by Punge et al. (2017) in terms of agreement with hail reports. The main reason for this improvement is likely the new probabilistic OT detection algorithm of Khlopenkov et al. (2021) allowing for the identification of weaker-looking satellite features that were previously harder to detect with fixed temperature thresholds. Further, this is also accompanied by a reduction in false OT detections. As a possible indication of this, the percentage of OTs found in the vicinity of hail reports by Punge et al. (2017) increased from 0.67 % to 0.84 % after the filter, contrarily to the detected values of 1.87 % and 2.27 %, respectively (for TA ≤ 15 min – Table 2). Considering the more generous spatio-temporal window of 75 km over ±3 h, a decisive increase in all hit rates is noted: the percentages of hail reports detected by the filtered and unfiltered OT sets are 78.0 % and 84.3 %, and the respective OT rates matching ESWD are 10.57 % and 8.81 %.
The inter-monthly and inter-daily variability of the hit rates is analysed in Fig. B1. The differences found between the filtered and unfiltered OTs matching the ESWD for the whole temporal aggregation tend to persist for every temporal sub-period. An increase in both hit rates is noted when moving from spring to summer, while a slight decrease is detected when moving from daytime to nighttime.
Even if an increase in the percentage of OTs associated with hail reports is detected, its absolute value remains low. This may be related to under-reporting issues in the ESWD dataset or the limits of the conservative design of the filter proposed. The relevance of the under-reporting problems of the hail database is highlighted by the strong year-to-year variability in the percentage of filtered OTs found in the vicinity of ESWD reports (not shown). Considering the 75 km over ±3 h matching, in the year with the largest number of reports (2019, with 659 reports) the percentage of OTs in their vicinity exceeds 18 %. Conversely, when the lowest number of hail reports was issued (2016, with 298 reports), the number of matching satellite detections is slightly less than 7 %. With respect to the limits of the designed OT filtering procedure, the aim of the minimum conditions imposed is to remove all possible situations that are unconducive to hail development in a thunderstorm. The retained environmental characteristics and the associated OTs are also shared by storms producing severe weather other than hail. A potential way forward to more sharply discriminate hail environments specifically within this superposition could be to include additional hail-related observations to expand the sample of ambient conditions, such as hailpad records. However, hailpad networks cover only a smaller part of the selected region, which prevents a substantial enlargement of the validated OT data sample. Therefore, the ESWD still represents the best available dataset for ground-truth hail occurrence.
4.3 Hailstorm environmental signatures
To better understand under which conditions hail reports are correctly identified or missed by the OT-based approach, the associated environmental conditions described with the CP reanalysis predictors are investigated. Parameter distributions are analysed separately for identified and missed reports. Further, to take into account the role of hail severity, only the subset of 2249 ESWD reports with information on the maximum hailstone size is considered (in the following referred to as ESWD-S), and results are reported distinguishing between small (<3 cm) and large hail (⩾3 cm). For some hailstorms sharing the same ambient conditions at a specific temporal stage of the storm, more than one report is issued. For this reason, duplicate values of the parameter distributions that at the same hour present exactly the same values of all five SPHERA parameters are discarded, and only those associated with the report presenting the largest maximum hailstone size are kept. This is necessary to avoid artificial deviations owing to repetitions of the samples in the resulting distributions. Finally, the satellite-measured cloud top thermal characteristics in the presence of ESWD-S reports are analysed to further detail the ambient features of hailstorms.
The cumulative density functions of SPHERA parameters in the presence of ESWD-S reports, separated into four categories based on matching and hail severity conditions, are presented in Fig. 12. A total of 66 % reports are successfully detected by the filter-based proxy, the majority of which (69 %) pertains to large hail, while missed cases are similarly associated with small (46 %) and large hail (54 %). By increasing the hailstone size, the distributions tend to shift towards values with enhanced potential for severe convection (i.e. larger CAPE, K index, and DLS and smaller SLI) and higher H0. The most evident separation for all parameters (including DLS but to a lesser extent) emerges for the missed (small-hail) class (Fig. 12 – dashed red lines), showing cumulative density curves systematically shifted towards less unstable, less sheared, and warmer environments. Interestingly, only 4 % of identified ESWD-S reports show at least one parameter falling in its filtered data range (i.e. shadowed areas in Fig. 12), while the percentage decisively increases to 42 % for missed reports.
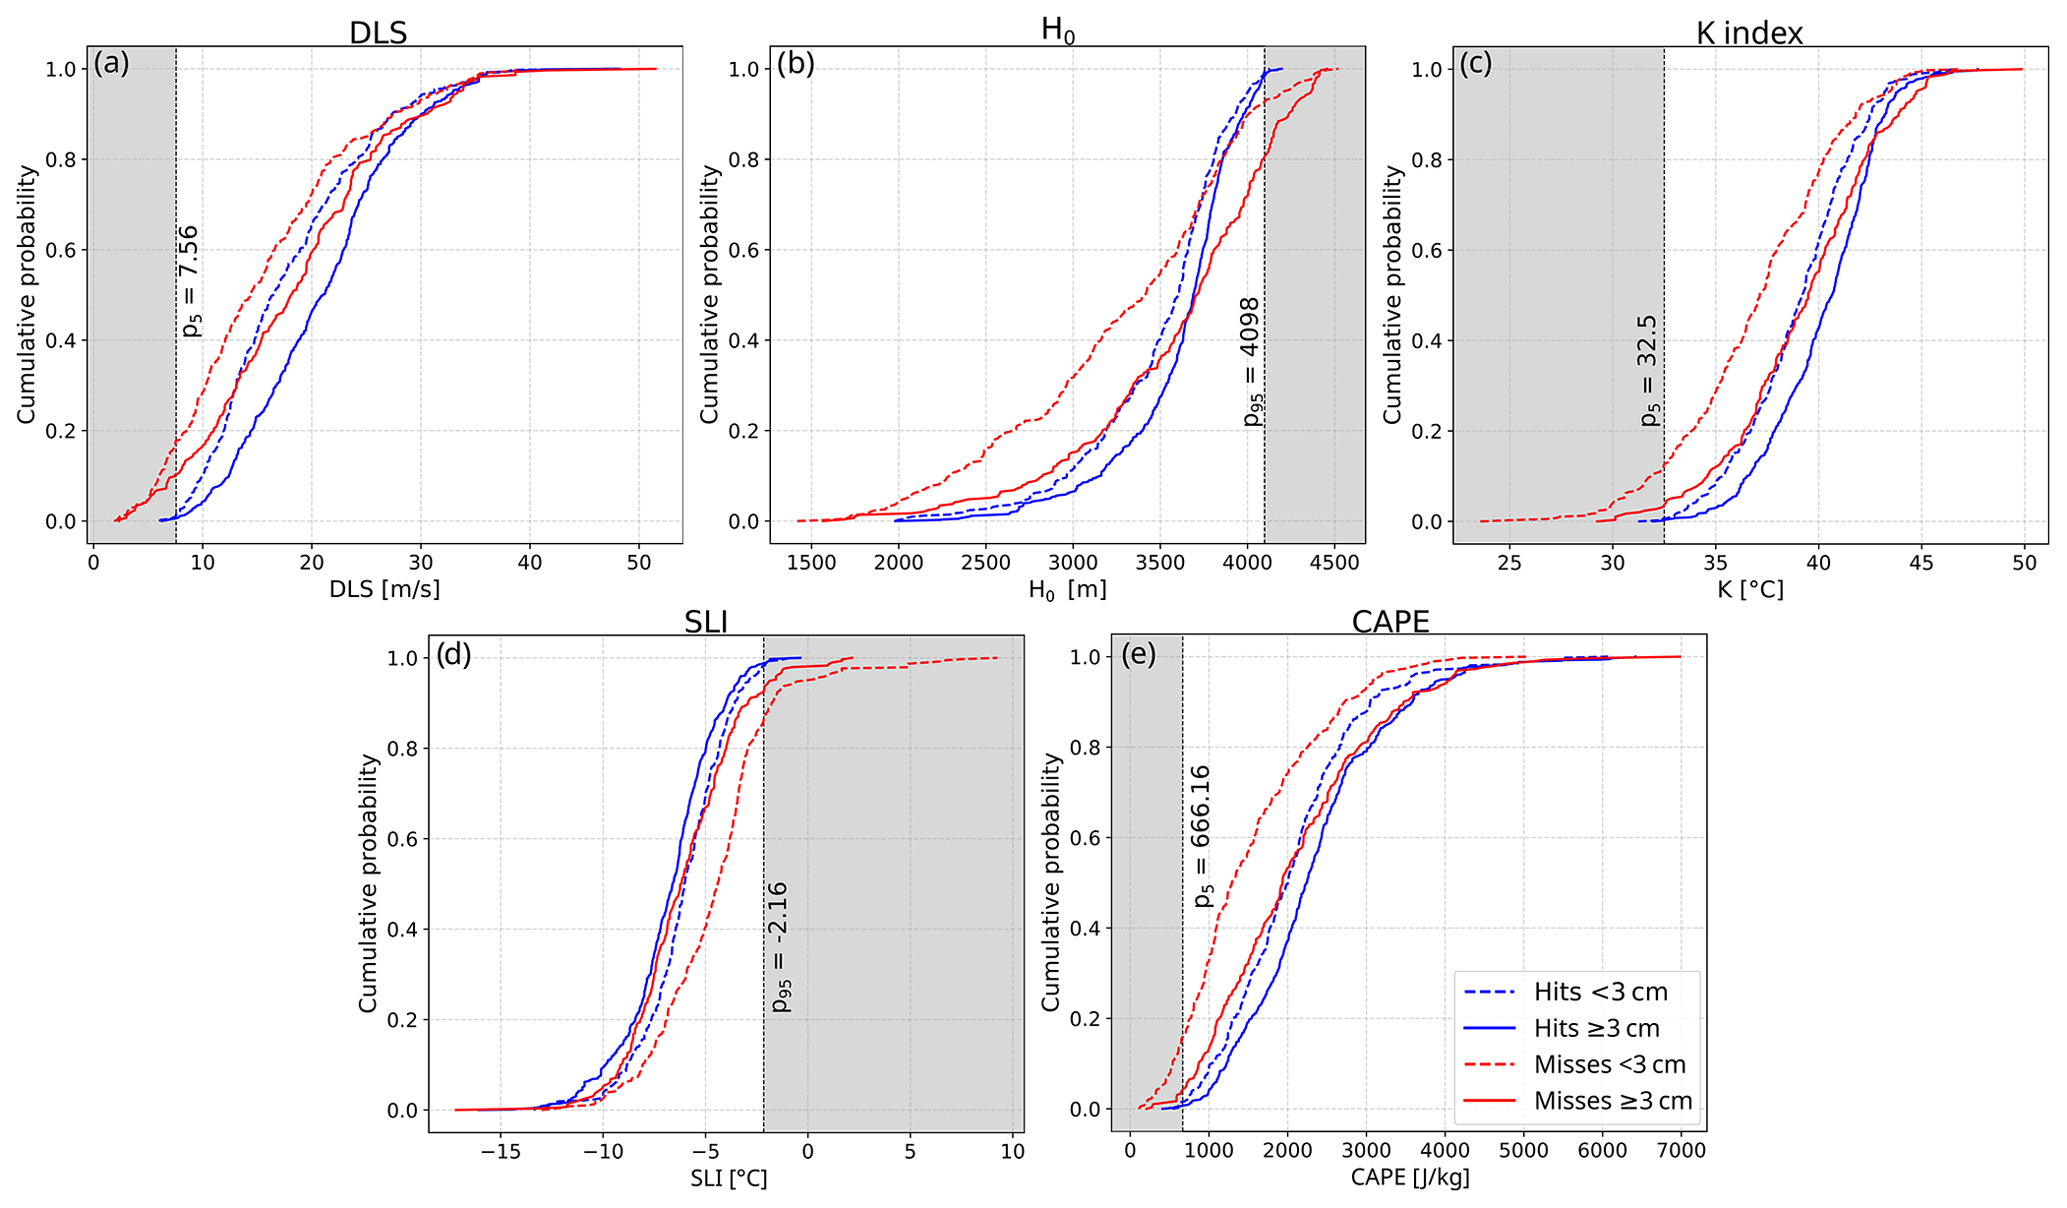
Figure 12Cumulative density functions of the five parameters selected from SPHERA in the presence of ESWD-S hail reports. The same criteria described in Sect. 3 apply in order to spatio-temporally aggregate the parameters in the vicinity of hail reports. Reports are divided into small hail (<3 cm, dashed lines) and large hail (⩾3 cm, solid lines) when identified (in blue) or missed (in red) by the hail-specific OT dataset. The vertical dashed black lines indicate the thresholds identified for filtering (Table 1). The shadowed portion of the distributions shows when the filter is active. (a) DLS, (b) H0, (c) K index, (d) SLI, and (e) CAPE.
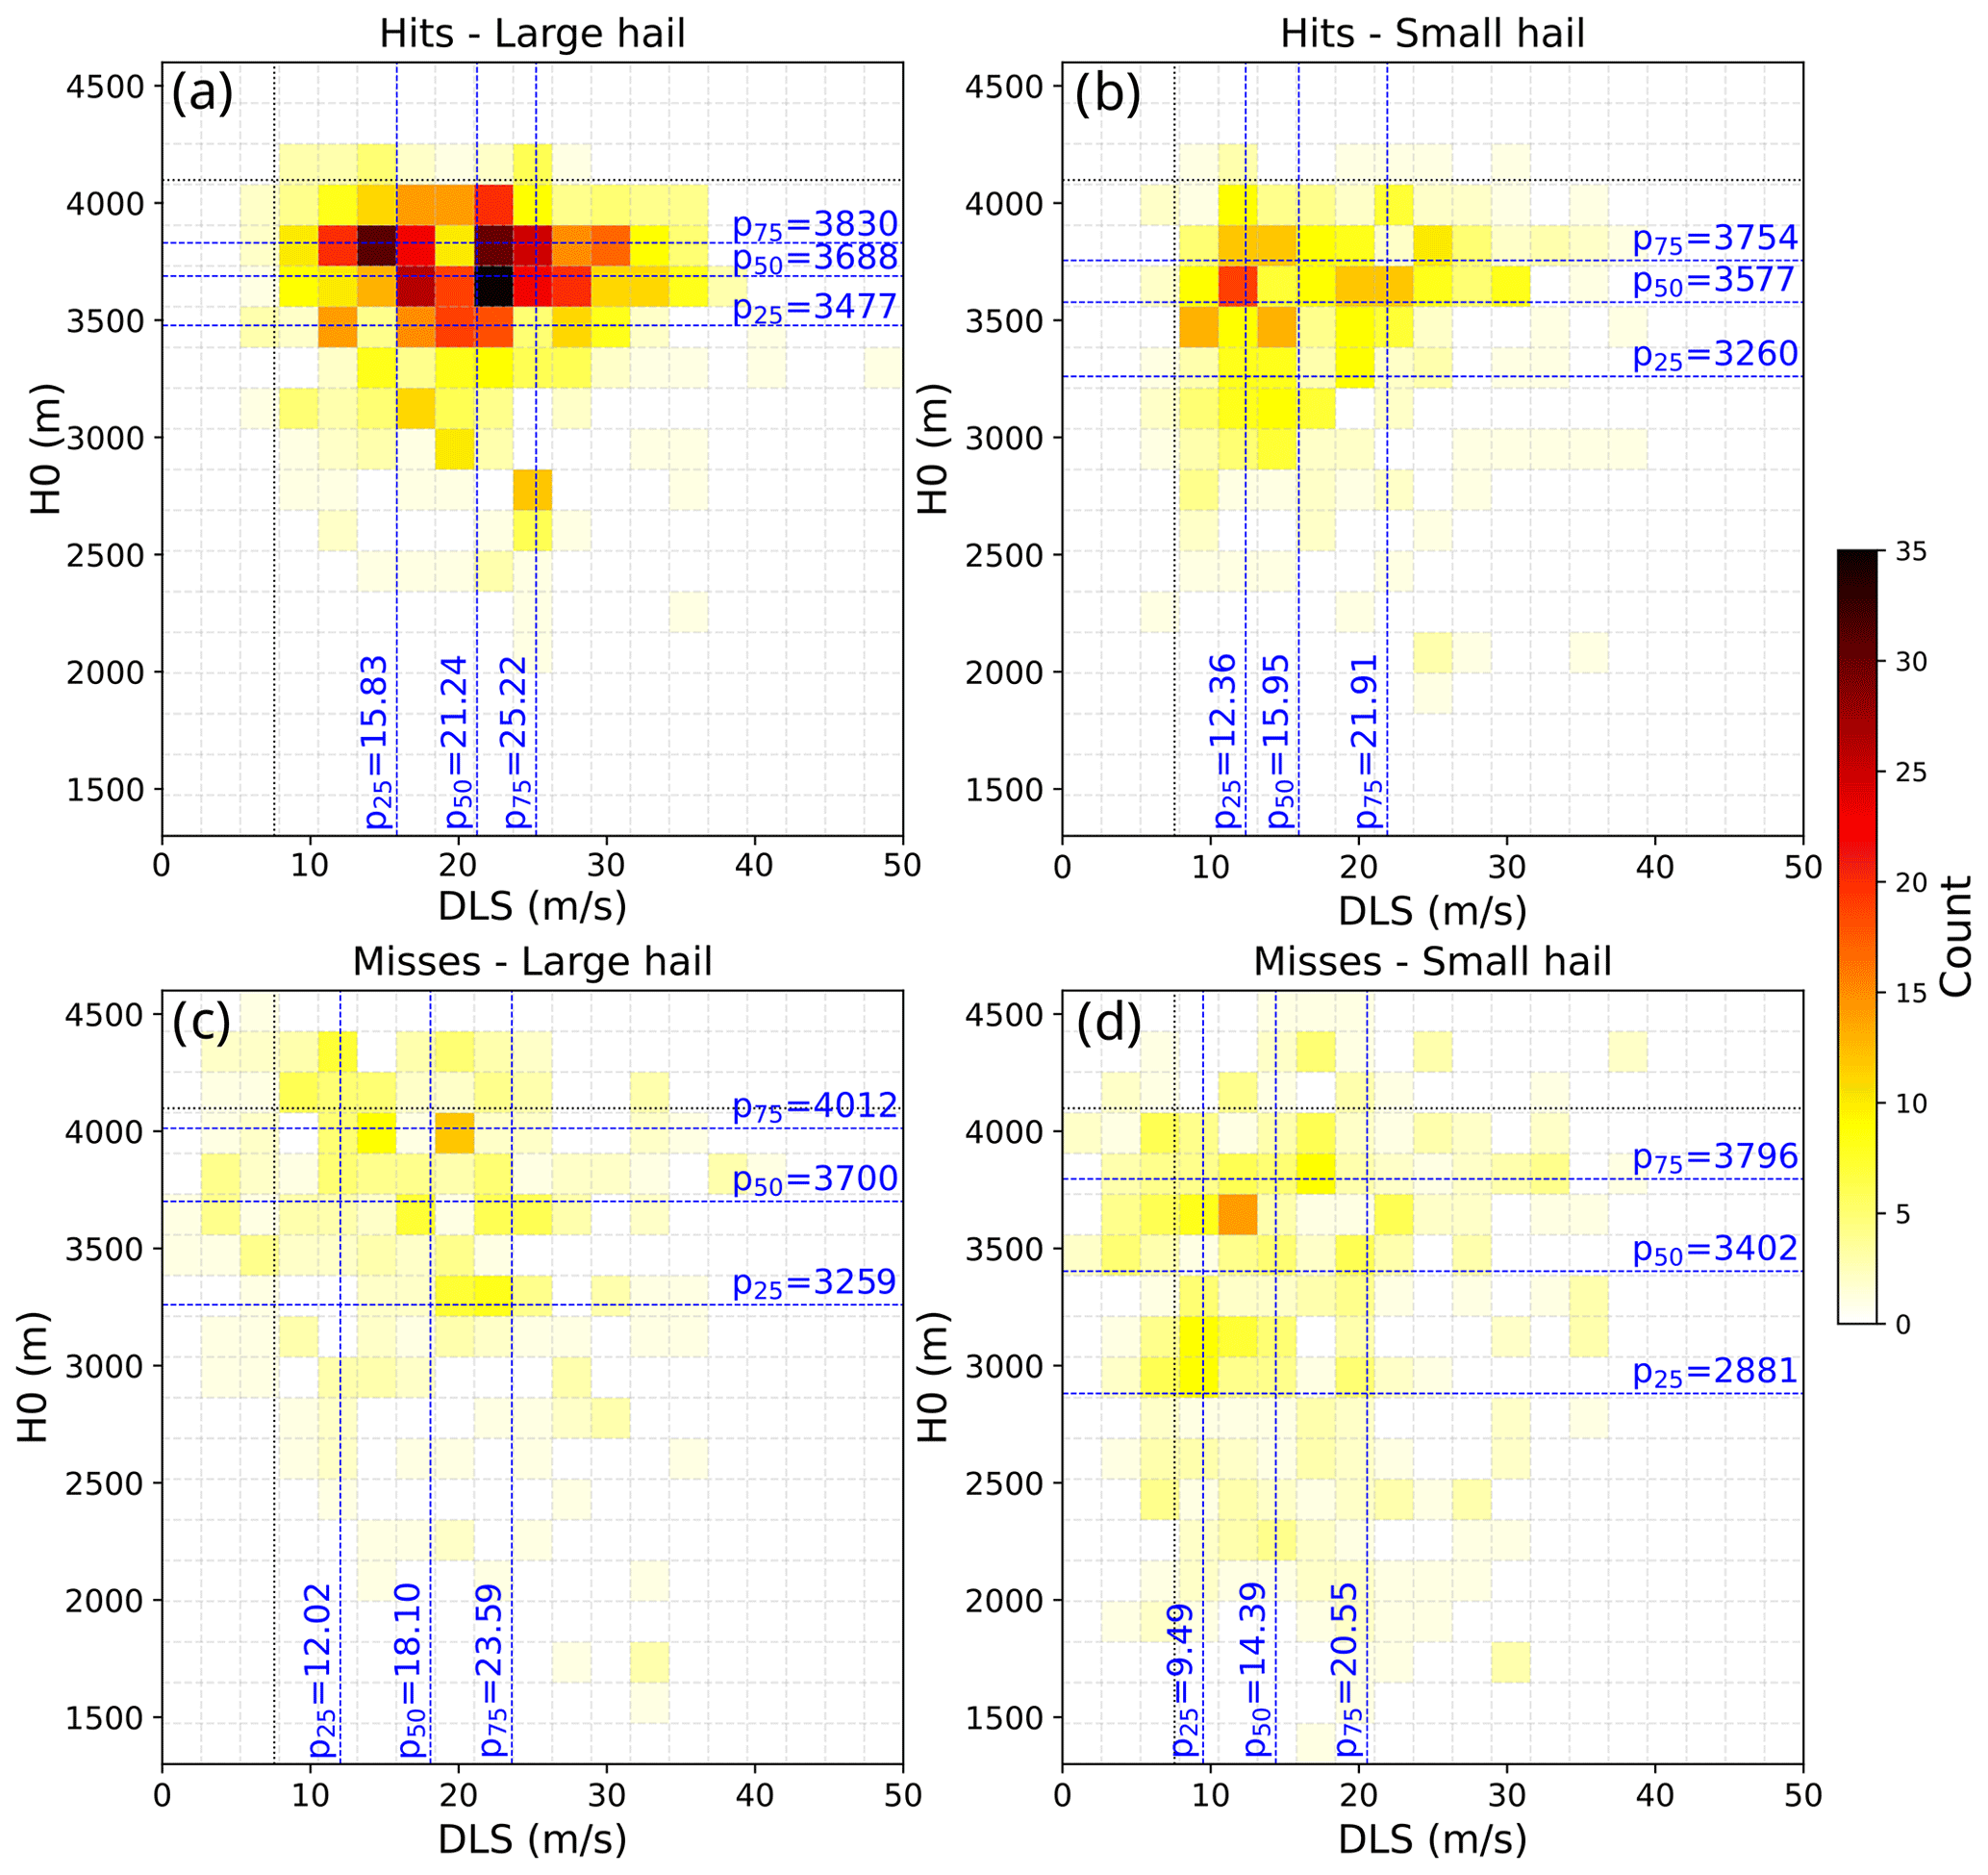
To investigate the inter-relationships between ambient descriptors, hailstorm severity, and matching conditions, the parameter spaces for the four hail report classes are considered in the form of bivariate histograms. Figure 13 shows the joint distributions of H0 and the K index for the four hailstorm classes. A joint increase in freezing-level height with atmospheric instability and low-level moisture content is noted, suggesting a positive linear relationship between H0 and the K index. The distributions for hits (Fig. 13a and b) are compact and do not present relevant differences among hail sizes. On the other hand, miss counterparts (Fig. 13c and d) extend over wider ranges and show evident shifts between small and large hail (with H0 and K-index medians greater by roughly 300 m and 2.3 °C, respectively). This suggests that missed large-hail events are characterized by generally warm vertical atmospheric profiles (with ∼20 % of freezing-level heights above the imposed threshold), while missed small-hail events tend to form in lower-instability and colder ambient conditions.
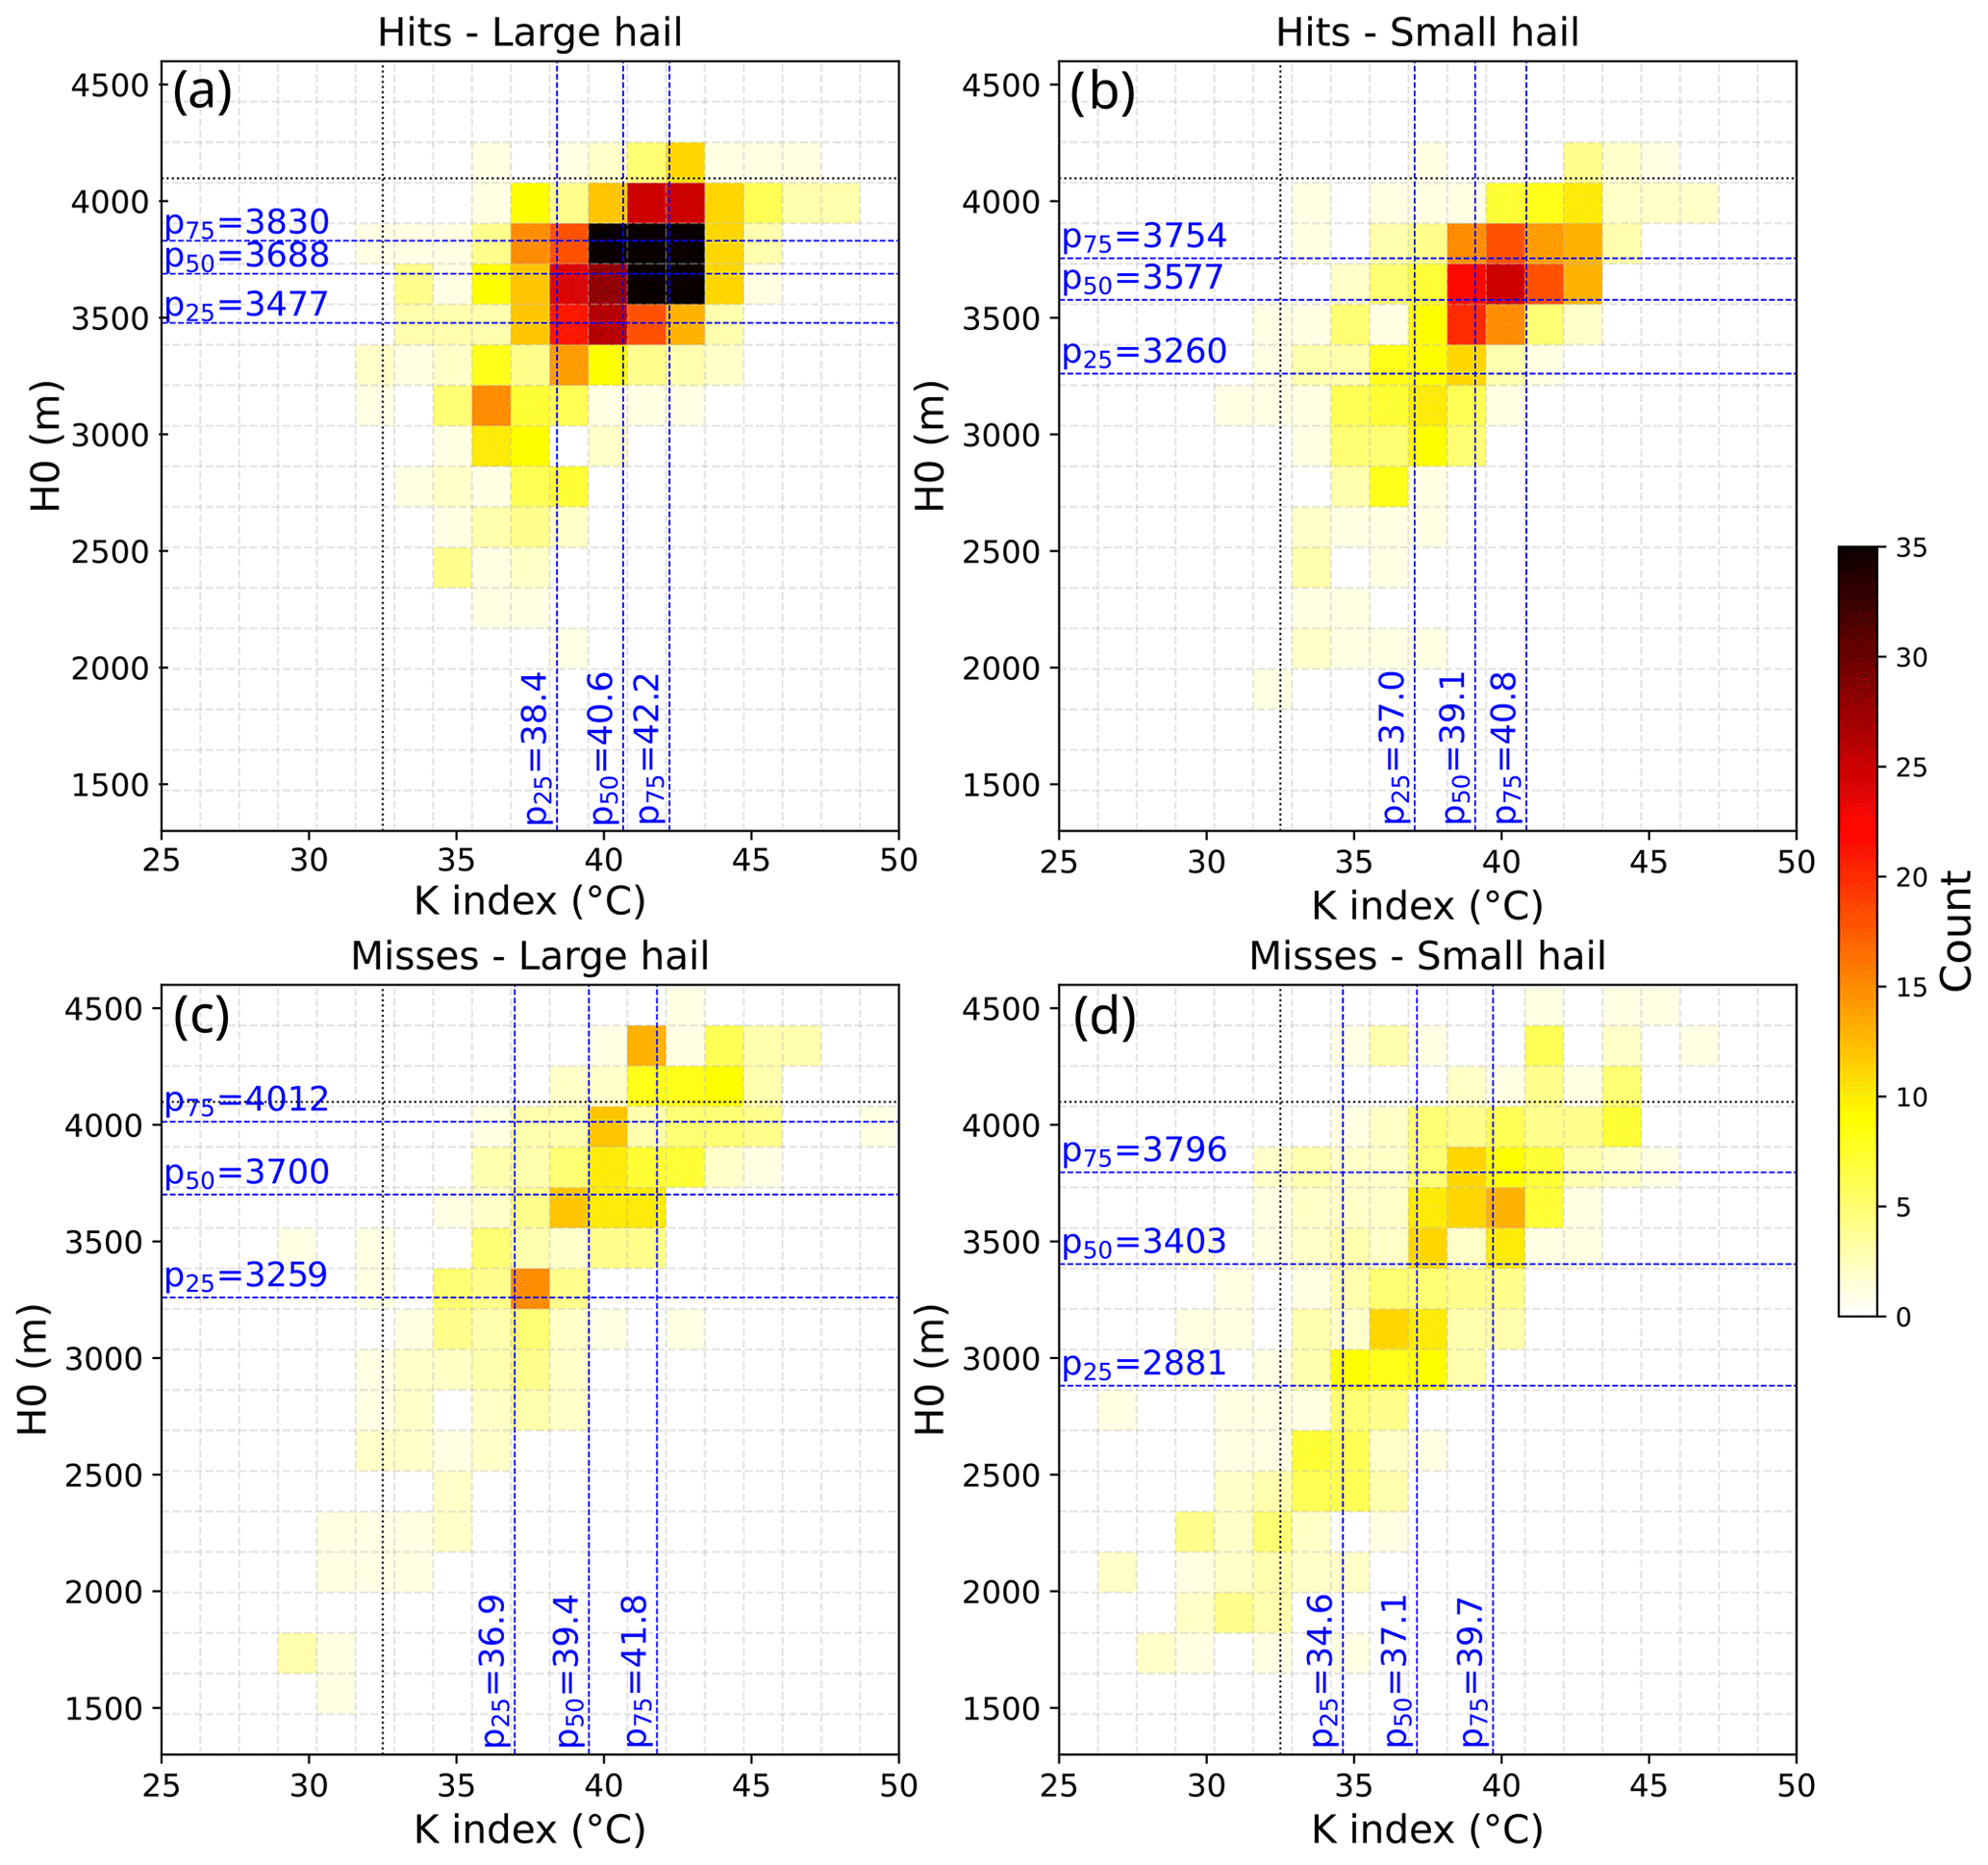
Figure 13Bivariate histogram distributions of H0 vs. K index in presence of ESWD-S hail reports for the separation considered in Fig. 12: (a) hits – large hail, (b) hits – small hail, (c) misses – large hail, and (d) misses – small hail. The blue dashed vertical and horizontal lines represent the median (p50) and the interquartile range (IQR) values (p25 and p75) of the distributions. The black dotted lines report the thresholds used for the filter defined in Table 1.
More dispersion characterizes the joint H0–DLS distributions (Fig. 14). In all four classes, DLS covers a broad spectrum with interquartile ranges (IQRs) of ∼10 m s−1, confirming the difficulty in separating events by their hailstone sizes through the vertical wind shear (Kunz et al., 2020). The difference of roughly 7 m s−1 in median DLS values from small-hail misses (14.39 m s−1) to large-hail hits (21.24 m s−1) suggests the increase in hail severity with storm organization.
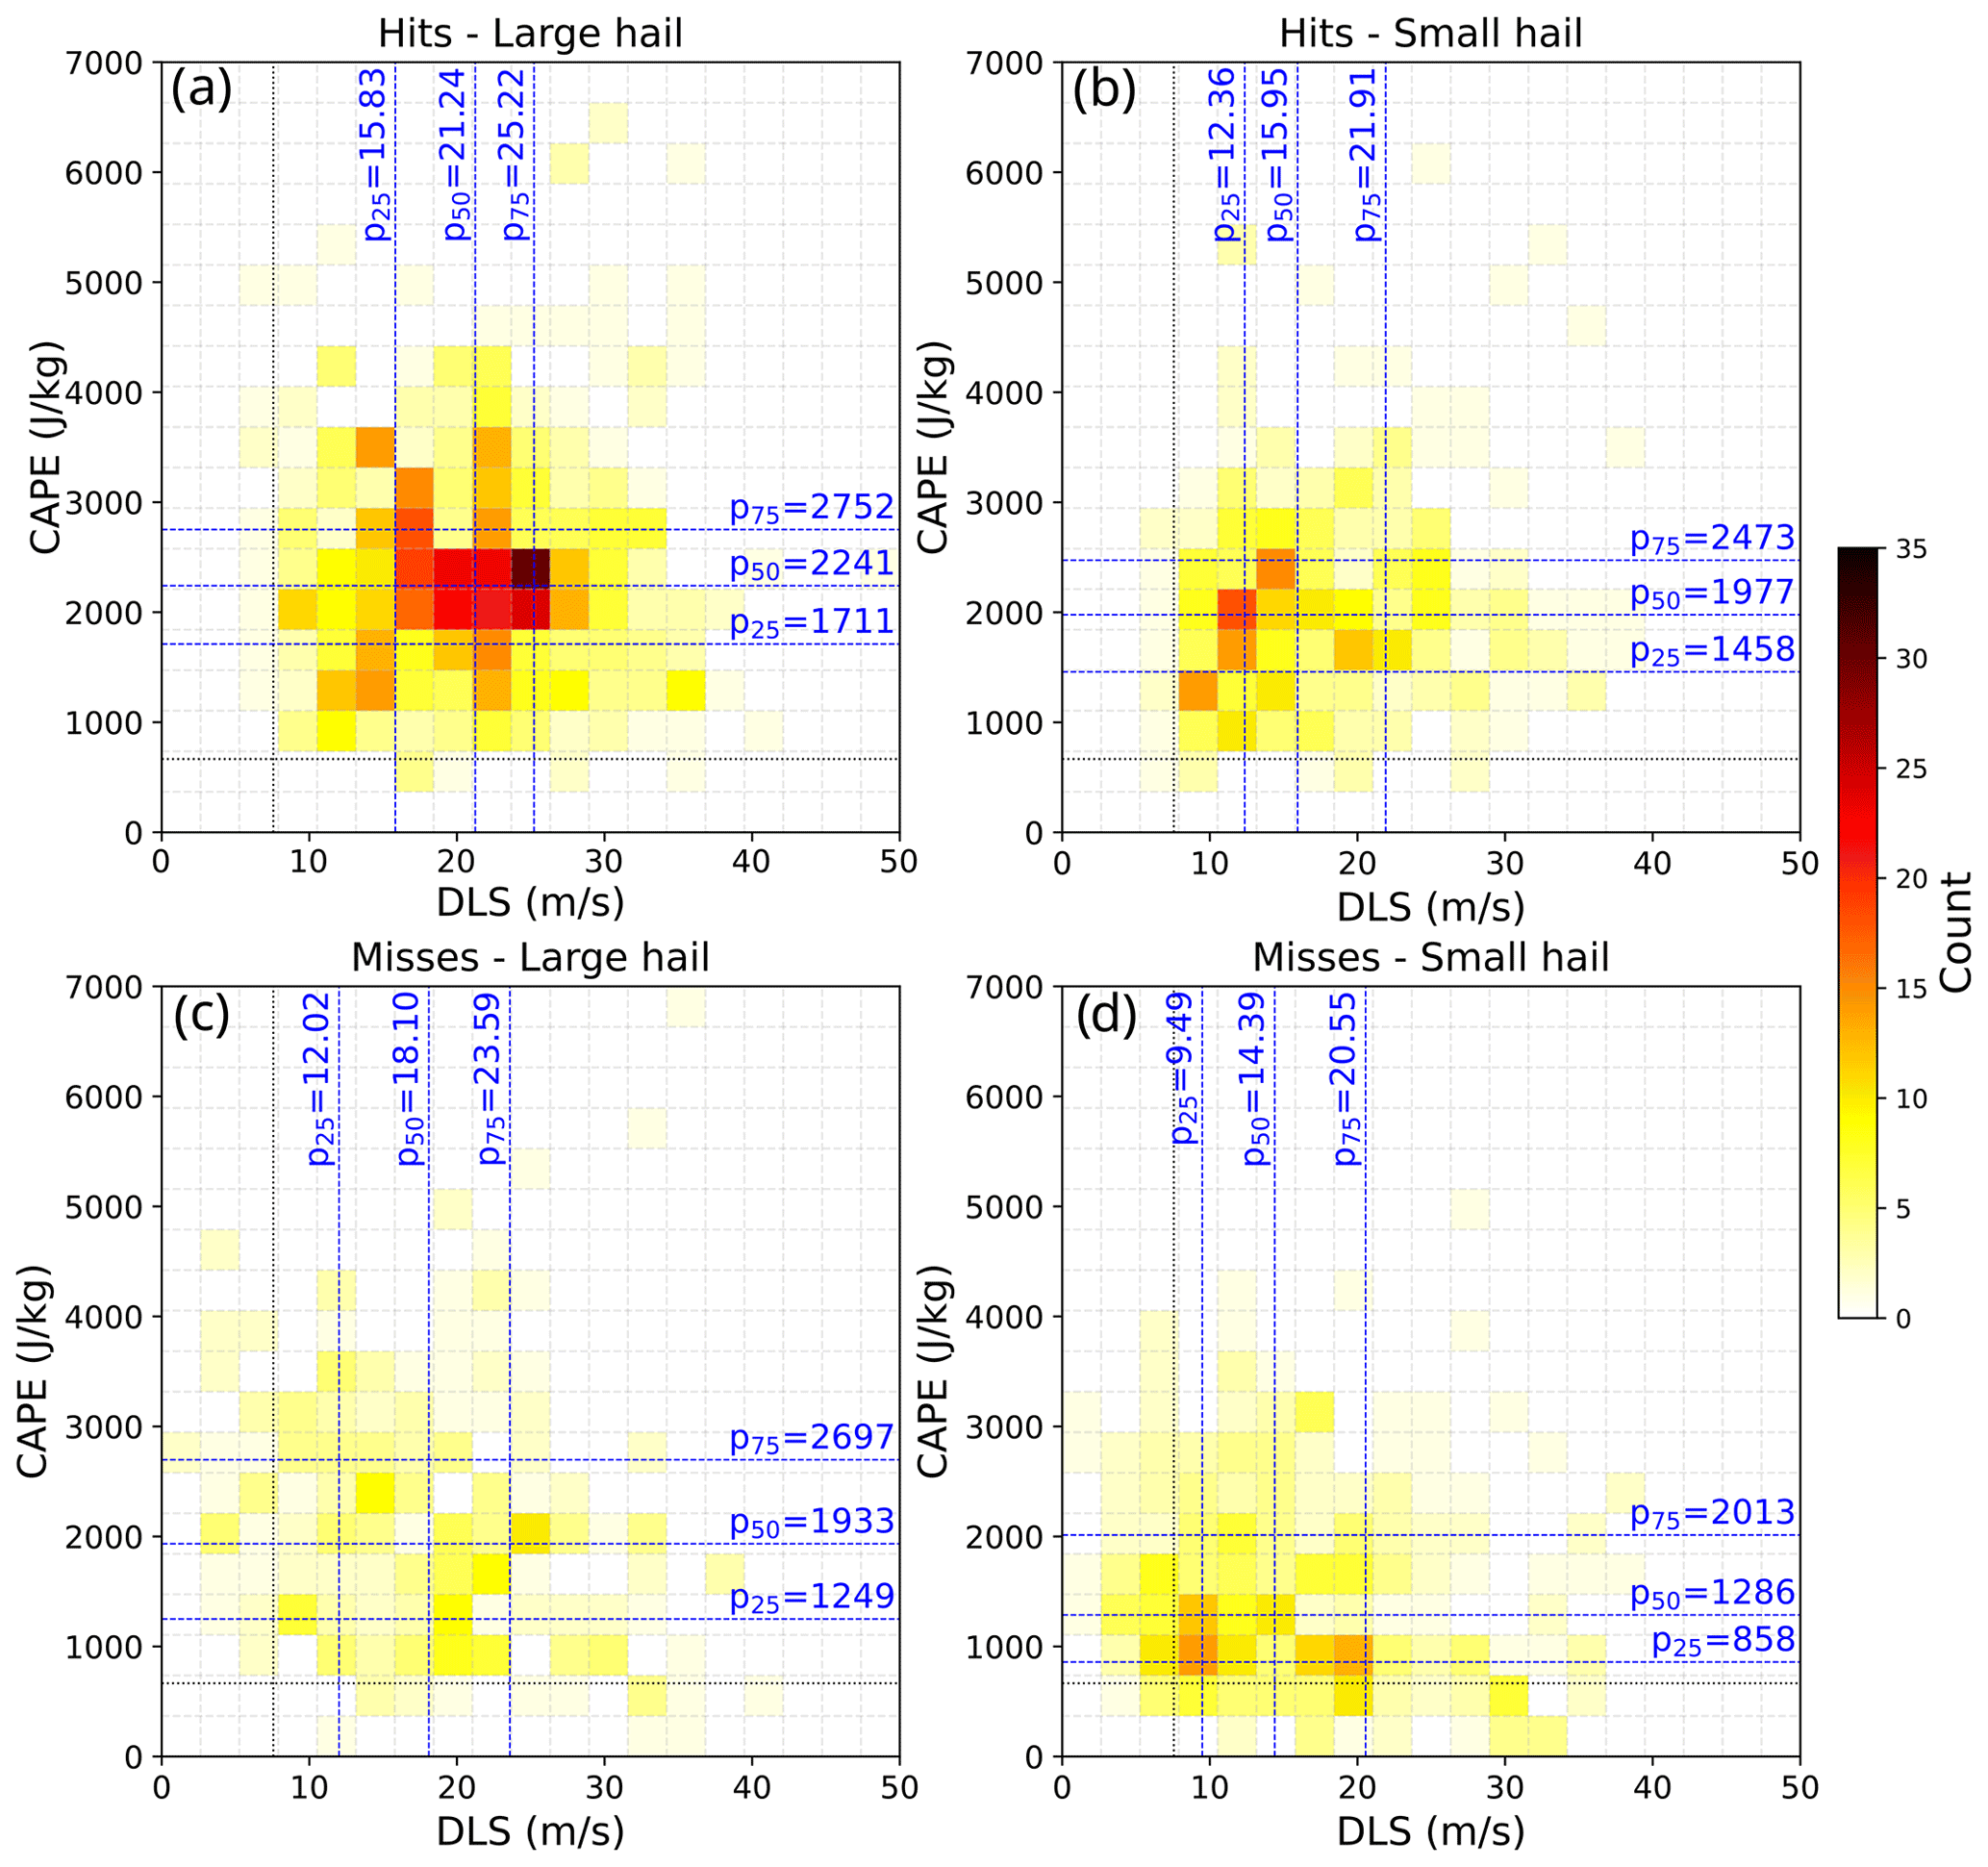
Significant spread also characterizes the CAPE–DLS spaces describing the relationship between atmospheric instability and storm organization (Fig. 15). In this case the most different conditions emerge for the missed small-hail class as well, characterized by generally pronounced low-CAPE (median 1286 J kg−1) and low-DLS environments.
A factor playing a central role in the identification of an OT from satellite scans data is the thermal characteristic of the cloud top where the OT can be found. Previous research has shown how OTs linked to deep convective clouds can be detected as cold pixels in infrared satellite imagery scans (e.g. Morel and Senesi, 2002; Mikuš and Mahović, 2013). These cold spots are associated with small and sharp infrared brightness temperature (IRBT) minima that are near to or colder than the tropopause temperature associated with the anvil cirrus cloud. Hence, a critical variable included in the Khlopenkov et al. (2021) algorithm for automatic OT detection is the temperature difference ΔT between infrared brightness and tropopause temperatures. A large ΔT (>6 K) indicates the penetration of the updraught through the anvil of at least 1–2 km (Griffin et al., 2016). The investigation of the cloud top thermal conditions in the presence of true hailstorms could help understand why these conditions have been correctly identified or not with the OT filter approach. For this reason, the minimum IRBT and ΔT distributions in the presence of ESWD-S reports are considered (for any OT probability of occurrence and not only for >50 % as imposed up to now). The distributions are separated between identified and missed reports for small-, large-, and very-large-hail occurrences (Fig. 16).
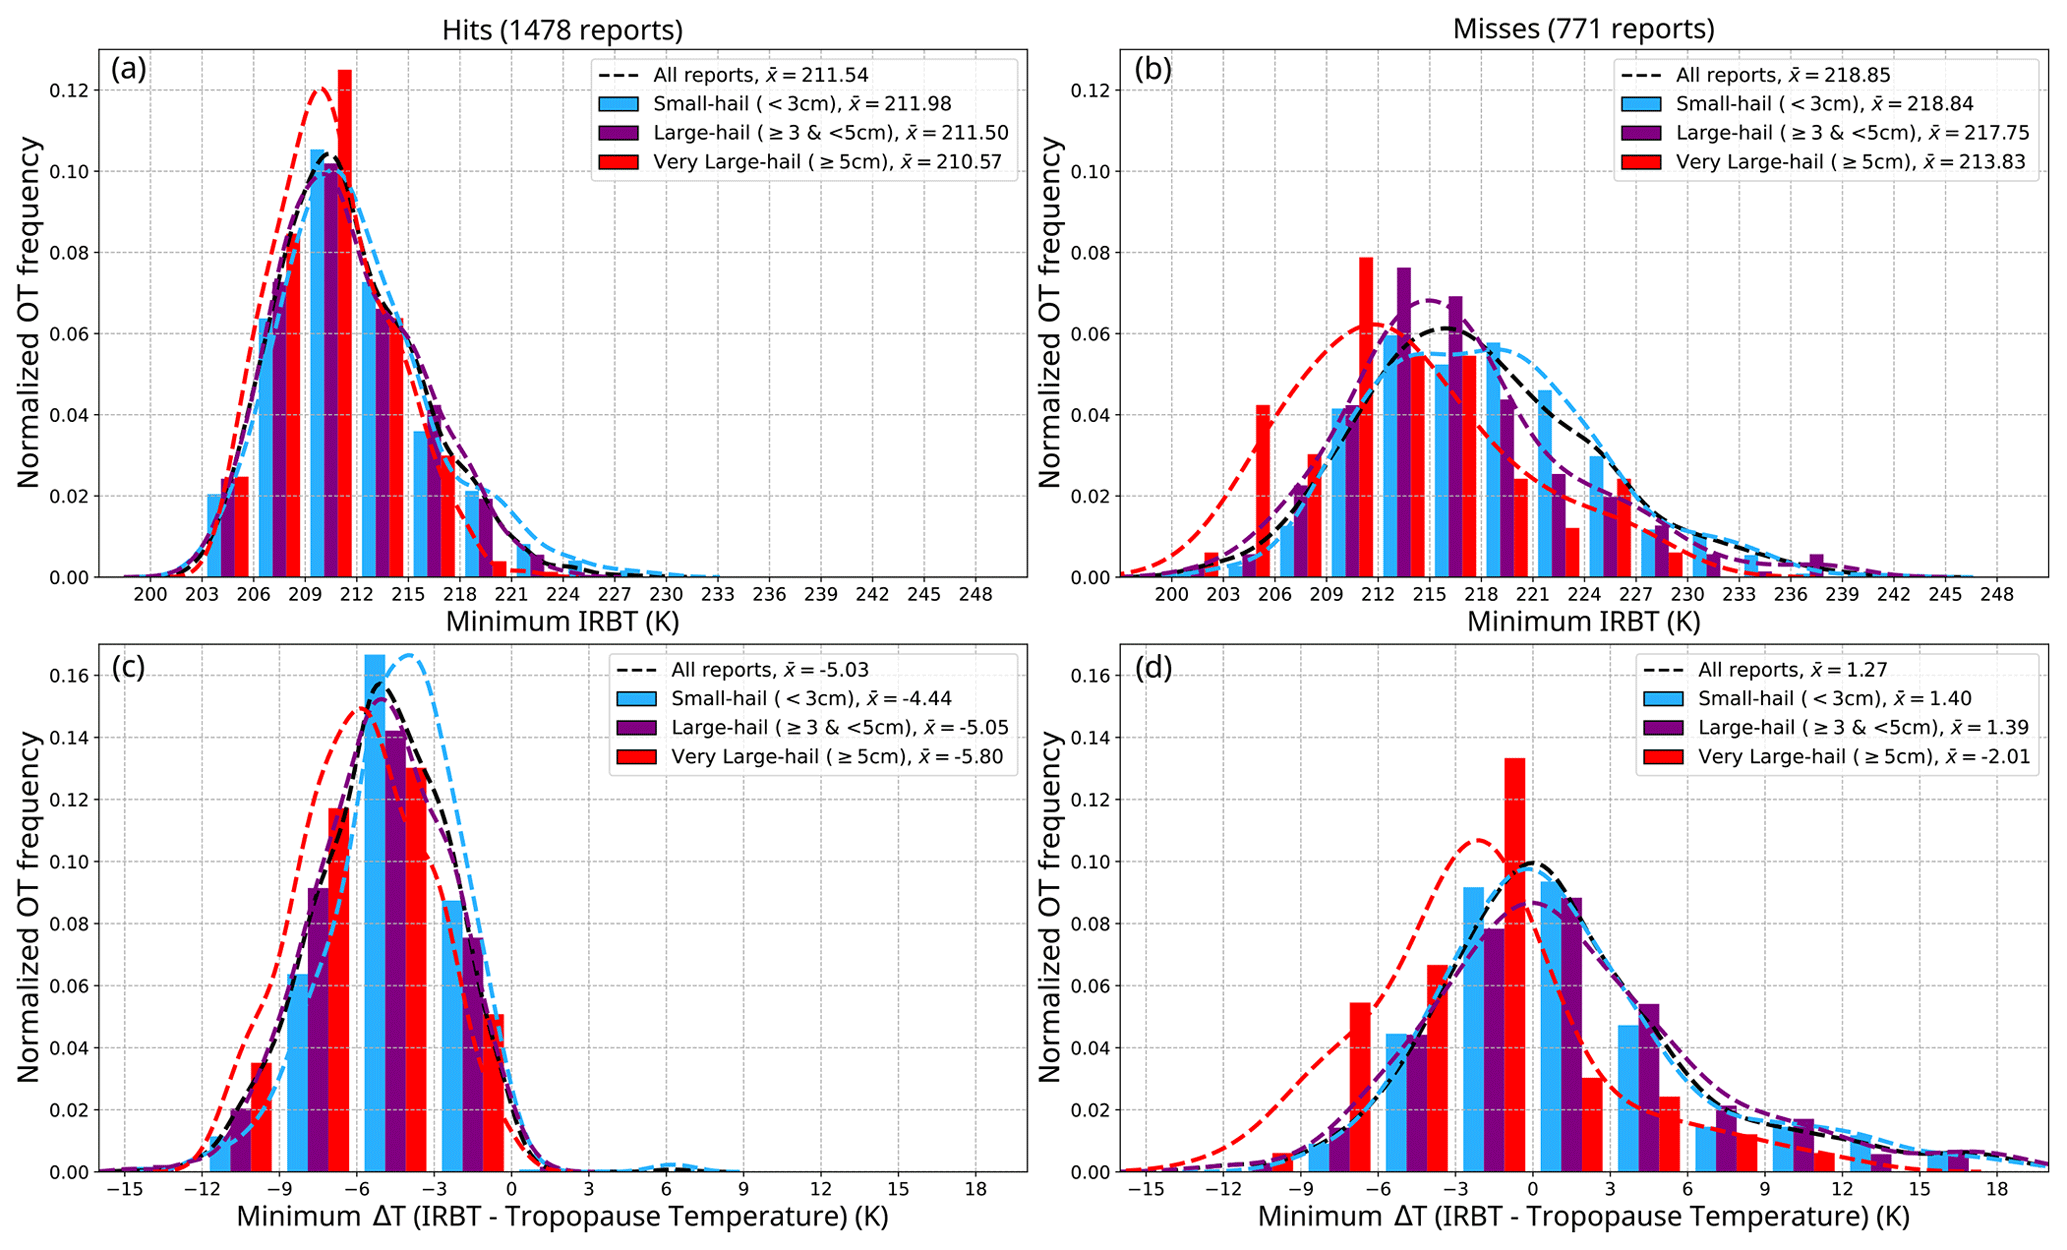
Figure 16Normalized distributions of minimum IRBT (a, b) and ΔT (c, d) in the presence of identified (a, c) and missed (b, d) hail reports. The histogram bars quantify the normalized frequency of OTs in the presence of the ESWD-S subset for small (light blue), large (purple), and very large hail (red). Indicated are the mean values () for each distribution. The kernel-density estimated probability density functions are shown with dashed curves in respective colours; additionally, the density functions for the whole ESWD set (also including reports without maximum hailstone size information) are displayed with dashed black curves.
Sharp IRBT minimum distributions characterize identified reports of all hailstone sizes (Fig. 16a), with mean values of ∼211 K and rarely exceeding temperatures higher than 224 K. The relative ΔT minima (Fig. 16c) show almost no positive values, meaning that IRBT is almost always colder than the tropopause temperature. Further, the central values of all ΔT populations are below −4 K, as expected from severe thunderstorms producing prominent OTs (e.g. Scarino et al., 2023). Missed reports (Fig. 16b) present more blunted and higher IRBT minimum distributions, extending to temperatures as high as 239 K. The associated mean values suggest a more pronounced separation among hail severity classes, especially in the case of very large hail (∼5 K colder than for small hail). ΔT minima (Fig. 16d) confirm and strengthen these results: the majority (i.e. 54 %) of missed ESWD reports is associated with positive ΔT, reaching values as large as +15 K. These conditions indicate tropopause temperatures substantially lower than those of the detected OT, suggesting unremarkable IR signatures. The enhanced separation in ΔT distributions between small and very large hail, the latter being on average more than 3 K colder, indicates the difficulty of forming large hailstones in these environments.
In this paper a new method for potential hail hazard assessment and for characterizing the associated environmental conditions has been presented and applied over a 5-year test period. The obtained results show good agreement with recent hail climatologies over the study region (Punge and Kunz, 2016). The least hail-prone area over the whole spatial domain is the main Alpine crest, owing to the difficulties of organized convective systems to develop in extremely complex terrains, and is in agreement with radar- (Nisi et al., 2018, 2020) and lightning-based (Manzato et al., 2022b) climatologies over the Alps. Pre-mountainous regions over the eastern Alps show enhanced likelihood for hail formation as described by the OT hail proxy, with local maxima over south-eastern Austria and Slovenia, in good agreement with Svabik et al. (2013). Moderate hail frequency is detected in southern Germany, which is considered a main European hotspot for hail hazard (Punge et al., 2014, 2017; Fluck et al., 2021); this may be caused by the limited temporal extent of the analysis. The northern Adriatic Sea represents the primary marine hotspot for hailstorms, particularly enhanced along the Croatian coastline during nighttime in late summer (August–September), similar to Jelić et al. (2020). The most favourable conditions for hail are found along the Italian pre-Alps, but the potential for hailstorm formation is met throughout north-central Italy. This agrees with several hail climatologies on the national (Baldi et al., 2014) or regional level over north-western (Davini et al., 2012) and north-eastern Italy (Giaiotti et al., 2003; Sartori, 2012; Manzato et al., 2022a). On the seasonal scale, the detected intra-annual variability agrees well with the recent Italian ERA5- and ESWD-based hail characterization of Torralba et al. (2023) over 1979–2020. Good temporal matching is also found with the ESWD report statistics during 1990–2018 over Europe (Púčik et al., 2019).
The hail-related environmental conditions identified and the relative tendencies depending on hailstone dimensions are also in line with previous work, highlighting a high degree of variability in the environmental conditions leading to hail, which confirms recent findings (Nixon et al., 2023). Torralba et al. (2023) found CAPE > 900 J kg−1 and a median K index of 30 °C for hail occurrence, with increasing values with hail severity, indicating enhanced instability for severe-hail development, as expected (e.g. Púčik et al., 2015; Marcos et al., 2021). Kunz et al. (2020), distinguishing between <3 and ⩾5 cm hailstones, identified scattered DLS distributions ranging between ∼0–30 m s−1 for the former and between ∼5–30 m s−1 for the latter, confirming a high degree of dispersion between hail severity and storm organization, corroborated by proximity radiosounding data (Púčik et al., 2015). The CAPE–DLS space has been used in numerous studies as a proxy for hail. Wide ranges in the joint distribution have been found by Púčik et al. (2015, 2023) but with a clear lack of severe events in low-CAPE and low-DLS environments (which tend to concentrate on the opposite high-CAPE and high-DLS range), similar to the tendency found in this analysis and by Taszarek et al. (2020). The freezing-level characterization is also in accordance with previous studies: Jelić et al. (2020) found an upper limit of ∼4000 m above which no hail on the ground has been observed. Finally, the positive relationship between freezing-level height and instability, where large hail can form in stabler environments if H0 is low, while more instability is needed if H0 is higher, has also been detected by Prein and Holland (2018).
The proposed method for hail characterization has demonstrated enhanced appropriateness for the identification of large-hail-producing storms. This is revealed by the large number of identified ESWD reports having large maximum hail diameters and sharper distributions of their environmental characteristics. In the case of smaller hailstones, a larger degree of uncertainty is revealed by less explicit OT signatures, related to higher cloud top temperatures, and by environments with lower freezing levels and instability (associated with weaker updraughts that are less evident from the OT perspective). Hence, the fixed thresholds of the high-resolution reanalysis parameters introduced to filter the OTs could mask these occasions. In any case, since the primary interest is to enhance the characterization of the most damaging hailstorms, the developed methodology has demonstrated to be appropriate for this scope.
A method for hailstorm identification obtained by combining convection-permitting SPHERA reanalysis environmental predictors, satellite MSG OT detections, and crowd-sourced ESWD hail reports has been presented. The analysis over 2016–2020 during the extended summer season (April–October) allows us to assess the appropriateness of the hail proxy over south-central Europe for a sample period and to investigate the environmental conditions associated with hail. The proxy is based on a filter to identify convective updraughts potentially linked to the formation of hailstones in a thunderstorm by considering the surrounding environment. Five numerical predictors, quantifying key ingredients for hail development (i.e. most unstable CAPE, K index, SLI, DLS, and freezing-level height), are employed to filter OT detections. Single predictors give different spatio-temporal contributions in the identification of hail-related conditions, and their joint use enables us to single out satellite-detected updraughts where hail is possible. Indeed, the resulting hail proxy shows a maximum hail potential over northern Italy pre-Alpine areas in June and July peaking at 15:00 UTC. A hail-related OT is found in the vicinity of 62.6 % of ESWD reports, exceeding roughly 23 % more than the previous OT filter estimate over Europe (Punge et al., 2017) and suggesting an improved appropriateness of the new method. Enhanced suitability of the proxy is observed in the case of severe hailstorms: the majority (69 %) of correctly identified reports is linked to hailstones exceeding 3 cm diameters. Furthermore, the analysis of the ambient conditions for different hail severity classes suggests the tendency for large (small) hail to form in environments with higher (lower) instability and wind shear and within warmer (colder) atmospheric vertical profiles, as expected. However, considerable spread in the associated parameter distributions is found, especially for the missed small-hail class, which also shows the most distinct environmental signature. Additionally, the analysis of the observed thunderstorm top temperature minima reveals systematically warmer conditions when ground hail reports are missed.
The 5 years considered in this study constitutes one of the main limitations owing to the large year-to-year variability associated with hail. Indeed, a period of a few years is insufficient for a robust assessment of hail frequency. However, it is appropriate for our purposes to present the novel methodology and to assess its potential. Possible future temporal extensions of the analysis could decisively enhance its robustness with the purpose to develop a sound climatology for hail. Further, the selection of other numerical parameters should also be tested in future work with the aim to improve the identification of hail-producing environments. Possible choices could include the CAPE above the −10 °C isotherm, which recently demonstrated enhanced skill for hail detection over Europe (Battaglioli et al., 2023), or the storm depth and the storm-relative flow below the hail growth layer, which may enhance the prediction of the maximum potential hailstone size (Kumjian and Lombardo, 2020; Nixon et al., 2023). Additionally, a promising direction for further research developments in the field is given by machine learning approaches, which allow greater dimensionality within forecast parameters and consent to objectively selecting optimal predictors for hail in a certain region (Gagne et al., 2017, 2019; Gensini et al., 2021; Torralba et al., 2023; Scarino et al., 2023). Hence, in future extensions of this work these methods should be considered to potentially improve the environmental characterization associated with hail.
The imperfect OT observations with the MSG IR satellite instrument constitute a further source of improvement. Indeed, the majority of missed ESWD reports is associated with detected cloud top temperatures that are higher than those at the tropopause, which are more challenging to identify with the automatic algorithm of Khlopenkov et al. (2021) applied to the MSG SEVIRI. This difficulty, as noted by Cooney et al. (2021), may be linked to satellite scans performed when storm tops are not optically thick enough at the initial stages of the storm development, resulting in outgoing radiation being scanned in warmer and deeper regions of the cloud than the updraught top, likely owing to the insufficient density of the particles in this region (Sherwood et al., 2004). This results in smaller temperature differences between the tropopause and cloud top, ultimately reducing the probability of OT detection and, consequently, causing one to miss the hail event. Hence, possible ways to overcome this issue and to improve the OT detection methodology are the inclusion of visible channel textures together with IR detections (Bedka and Khlopenkov, 2016) or the enhancement in the spatio-temporal resolution of the satellite scanning that in this study is limited to 3 km and 15 min (at the time of analysis the 5 min rapid-scan data from MSG were not easily processable with the OT detection algorithm). Particularly, a higher temporal frequency for detecting thunderstorm OTs, such as that possible with the Geostationary Operational Environmental Satellite (GOES) 16 or 17 or with the novel Meteosat Third Generation (MTG) satellite, is essential, given the rapidity of their formation and dissipation, which may even be below 15 min (Elliott et al., 2012).
In this study high-resolution numerical simulations are included to describe atmospheric ambient conditions, which are considered a promising avenue of development in hail research (Allen et al., 2020). Indeed, coarser global datasets have generally been employed in similar studies, whose simulations include physical parameterizations to account for deep moist convection, implying potential significant errors and inaccuracies (Prein et al., 2015). The present study benefits from the information obtained from the new regional reanalysis SPHERA, whose 2.2 km horizontal resolution allows us to switch off parameterization schemes and to use a finer surface topography. However, a quantification of the added value introduced by this innovation was not feasible, and, generally, no quantitative studies have been performed so far to assess the benefits of finer-spatial-grid-spacing configurations over coarser datasets specifically for the reproduction of hailstorm environments. Hence, possible future studies could analyse in detail the sensitivity of the driver dataset describing hail environmental predictors to better understand the role of kilometre-scale simulations in this context.
Ultimately, this work offers a way to retrieve information on local-scale hail frequency and characteristics over south-central Europe, a region of the world particularly affected by damaging hail hazard, which can be valuable and desirable for several reasons. Besides improving scientific understanding of the atmospheric dynamical processes associated with hail, the correct assessment of the related risk is essential for insurance agencies in order to provide adequate estimates for specific portfolios. Further, other stakeholders may include several sectors that are highly vulnerable to hail hazard, such as the building construction and maintenance market, energy supply systems (e.g. solar thermal systems), and farmers or wine-growing enterprises that need to decide on crop protection measures (Punge and Kunz, 2016).
We report the formulations of the thermodynamic parameters selected from SPHERA reanalysis in the following.
-
MU CAPE,
where g is the gravitational acceleration, zi is the altitude in the lowest 300 hPa where the equivalent potential temperature is at its maximum (i.e. most unstable conditions), and LZB is the level of zero buoyancy (or equilibrium level) where the virtual temperature of the parcel equals the virtual temperature of the surrounding environment . CAPE represents the integrated amount of work over the vertical air column exerted by the upward buoyancy force over the air parcel.
-
K index,
where Txx hPa and Tdxx hPa are the temperature and the dew-point temperature at the isobaric level xx hPa, respectively. The terms entering the K index represent the lapse rate, the low-level moisture content, and the moist layer depth, respectively.
-
SLI,
The SLI evaluates the temperature difference between the environment at 500 hPa and a parcel lifted dry adiabatically from the surface to the lifting condensation level and pseudo-adiabatically to 500 hPa.
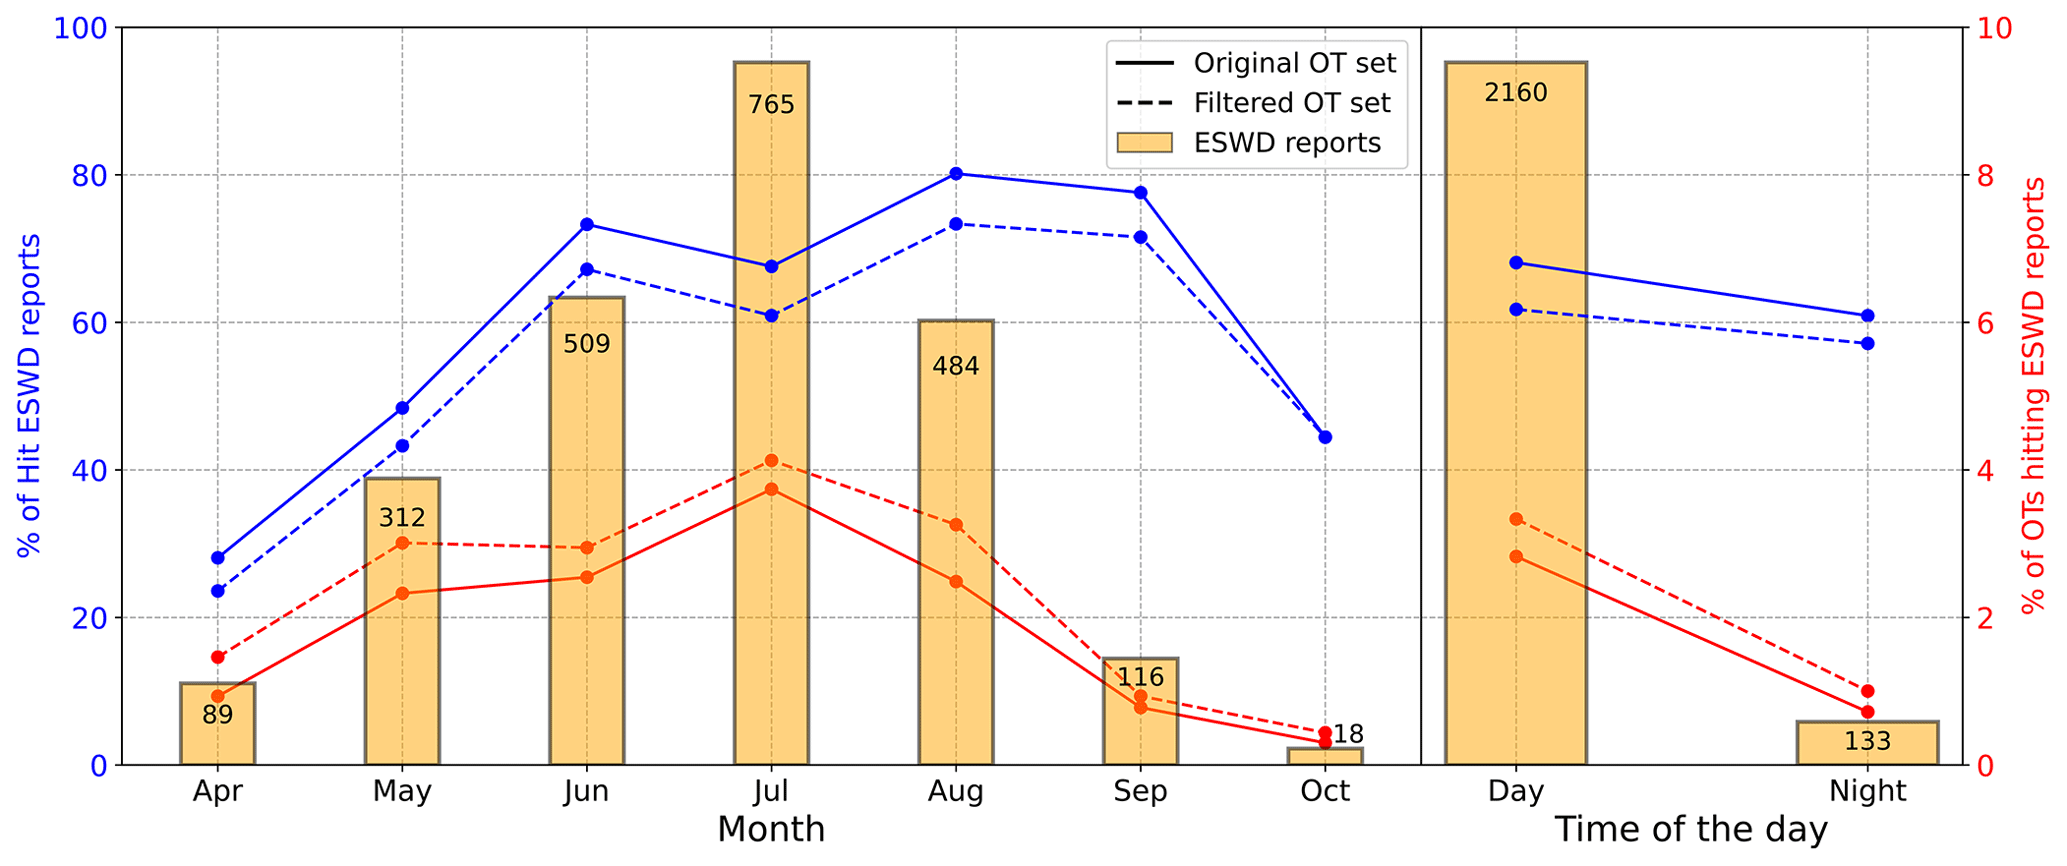
Figure B1Inter-monthly (left panel) and inter-daily (right panel) variability of the performance described in Sect. 4.2 considering the 25 km over ±1 h spatio-temporal window for matching. Solid (dashed) blue lines report the number of ESWD reports identified by the original (filtered) OT set. The red line counterparts report the number of OTs matching ESWD reports. The bars indicate the number of ESWD reports detected per month or time of the day (daytime, 10:00–21:45 UTC, or nighttime, 22:00–09:45 UTC).
The Python scripts developed to process and visualize reanalysis parameters, OT detections, and hail report datasets are freely available at https://github.com/agiord/hail-analysis (Giordani, 2024).
SPHERA reanalysis data are stored at the ARPAE-SIMC repository and are available from the corresponding author upon request (antonio.giordani3@unibo.it). Overshooting top detection data have been made available by NASA (contact Kristopher Bedka for any inquiry: kristopher.m.bedka@nasa.gov). Access to ESWD hail reports was partly granted by ADA Life Project funding under contract LIFE19 CCA/IT/001257 under the LIFE programme of the European Commission and partly by the Karlsruhe Institute of Technology (KIT) in collaboration with ESSL.
AG: data curation, formal analysis, investigation, methodology, software, visualization, writing (original draft), review and editing. MK: conceptualization, supervision, critical review of all drafts. KMB: conceptualization, methodology, resources, supervision, writing (original draft), review and editing. HJP: conceptualization, methodology, software, writing (original draft). TP: funding acquisition, supervision. VP: conceptualization, funding acquisition, supervision, writing (review and editing). IMLC: data curation, resources, writing (review and editing). SDS: funding acquisition, project administration, supervision.
The contact author has declared that none of the authors has any competing interests.
Publisher's note: Copernicus Publications remains neutral with regard to jurisdictional claims made in the text, published maps, institutional affiliations, or any other geographical representation in this paper. While Copernicus Publications makes every effort to include appropriate place names, the final responsibility lies with the authors.
The first author is thankful to the colleagues of ARPAE-SIMC for the fruitful discussions, in particular to Davide Cesari for substantial help with pre-processing SPHERA reanalysis data. We thank two anonymous referees for their careful reading of our manuscript and the insightful suggestions which significantly contributed to enhancing the quality of this paper.
The work of some of the authors was supported by the OPEn-air laboRAtories for Nature baseD solUtions to Manage hydro-meteo risks (OPERANDUM) project, which is funded by the European Union's Horizon 2020 research and innovation programme under grant agreement no. 776848; the ECOsystem for SustaInable Transition in Emilia-Romagna (ECOSISTER) project, funded by the European Union's NextGenerationEU programme – Piano Nazionale di Ripresa e Resilienza (PNRR); and ADaptation in Agriculture (ADA) under contract LIFE19 CCA/IT/001257 under the LIFE programme of the European Commission. Michael Kunz's participation in this work has been supported by the Helmholtz Association (the Changing Earth – Sustaining our Future research programme). Kristopher M. Bedka's participation in this project has been supported by the NASA Applied Sciences Disasters programme project award 18-DISASTER18-0008.
This paper was edited by Joaquim G. Pinto and reviewed by two anonymous referees.
Adams-Selin, R. D. and Ziegler, C. L.: Forecasting hail using a one-dimensional hail growth model within WRF, Mon. Weather Rev., 144, 4919–4939, 2016. a
Adler, R. F., Markus, M. J., and Fenn, D. D.: Detection of severe Midwest thunderstorms using geosynchronous satellite data, Mon. Weather Rev., 113, 769–781, 1985. a
Allen, J., Giammanco, I., Kumjian, M., Jurgen Punge, H., Zhang Q., Groenemeijer, P., Kunz, M., and Ortega, K.: Understanding Hail in the Earth System, Rev. Geophys., 58, e2019RG000665, https://doi.org/10.1029/2019RG000665, 2020. a, b, c, d, e, f, g
Allen, J. T. and Allen, E. R.: A review of severe thunderstorms in Australia, Atmos. Res., 178, 347–366, 2016. a
Allen, J. T., Tippett, M. K., and Sobel, A. H.: An empirical model relating US monthly hail occurrence to large-scale meteorological environment, J. Adv. Model. Earth Syst., 7, 226–243, 2015. a, b
Baldi, M., Ciardini, V., Dalu, J. D., De Filippis, T., Maracchi, G., and Dalu, G.: Hail occurrence in Italy: Towards a national database and climatology, Atmos. Res., 138, 268–277, 2014. a
Bang, S. D. and Cecil, D. J.: Constructing a multifrequency passive microwave hail retrieval and climatology in the GPM domain, J. Appl. Meteorol. Clim., 58, 1889–1904, 2019. a
Battaglioli, F., Groenemeijer, P., Tsonevsky, I., and Púčik, T.: Forecasting large hail and lightning using additive logistic regression models and the ECMWF reforecasts, Nat. Hazards Earth Syst. Sci., 23, 3651–3669, https://doi.org/10.5194/nhess-23-3651-2023, 2023. a, b
Bedka, K., Brunner, J., Dworak, R., Feltz, W., Otkin, J., and Greenwald, T.: Objective satellite-based detection of overshooting tops using infrared window channel brightness temperature gradients, J. Appl. Meteorol. Clim., 49, 181–202, 2010. a, b, c, d
Bedka, K. M.: Overshooting cloud top detections using MSG SEVIRI Infrared brightness temperatures and their relationship to severe weather over Europe, Atmos. Res., 99, 175–189, 2011. a, b, c, d
Bedka, K. M. and Khlopenkov, K.: A probabilistic multispectral pattern recognition method for detection of overshooting cloud tops using passive satellite imager observations, J. Appl. Meteorol. Clim., 55, 1983–2005, 2016. a, b, c, d
Bedka, K. M., Allen, J. T., Punge, H. J., Kunz, M., and Simanovic, D.: A long-term overshooting convective cloud-top detection database over Australia derived from MTSAT Japanese advanced meteorological imager observations, J. Appl. Meteorol. Clim., 57, 937–951, 2018. a, b, c, d
Bica, B., Knabl, T., Steinacker, R., Ratheiser, M., Dorninger, M., Lotteraner, C., Schneider, S., Chimani, B., Gepp, W., and Tschannett, S.: Thermally and dynamically induced pressure features over complex terrain from high-resolution analyses, J. Appl. Meteorol. Clim., 46, 50–65, 2007. a
Brimelow, J. C., Burrows, W. R., and Hanesiak, J. M.: The changing hail threat over North America in response to anthropogenic climate change, Nat. Clim. Change, 7, 516–522, 2017. a
Brooks, H. E.: Proximity soundings for severe convection for Europe and the United States from reanalysis data, Atmos. Res., 93, 546–553, 2009. a
Brooks, H. E., Lee, J. W., and Craven, J. P.: The spatial distribution of severe thunderstorm and tornado environments from global reanalysis data, Atmos. Res., 67, 73–94, 2003. a
Brunner, J. C., Ackerman, S. A., Bachmeier, A. S., and Rabin, R. M.: A quantitative analysis of the enhanced – V feature in relation to severe weather, Weather Forecast., 22, 853–872, 2007. a, b
Bryan, G. H., Wyngaard, J. C., and Fritsch, J. M.: Resolution requirements for the simulation of deep moist convection, Mon. Weather Rev., 131, 2394–2416, 2003. a
Cecil, D. J.: Passive microwave brightness temperatures as proxies for hailstorms, J. Appl. Meteorol. Clim., 48, 1281–1286, 2009. a
Cecil, D. J. and Blankenship, C. B.: Toward a global climatology of severe hailstorms as estimated by satellite passive microwave imagers, J. Climate, 25, 687–703, 2012. a
Cerenzia, I. M. L., Giordani, A., Paccagnella, T., and Montani, A.: Towards a convection-permitting regional reanalysis over the Italian domain, Meteorol. Appl., 29, e2092, https://doi.org/10.1002/met.2092, 2022. a, b
Changnon, S. A. and Burroughs, J.: The tristate hailstorm: The most costly on record, Mon. Weather Rev., 131, 1734–1739, 2003. a
Changnon Jr, S. A.: Hailstreaks, J. Atmos. Sci., 27, 109–125, 1970. a
Chen, J., Dai, A., Zhang, Y., and Rasmussen, K. L.: Changes in convective available potential energy and convective inhibition under global warming, J. Climate, 33, 2025–2050, 2020. a
Chen, Y., Paschalis, A., Kendon, E., Kim, D., and Onof, C.: Changing spatial structure of summer heavy rainfall, using convection-permitting ensemble, Geophys. Res. Lett., 48, e2020GL090903, https://doi.org/10.1029/2020GL090903, 2021. a
Clark, A. J., Gao, J., Marsh, P. T., Smith, T., Kain, J. S., Correia Jr., J., Xue, M., and Kong, F.: Tornado pathlength forecasts from 2010 to 2011 using ensemble updraft helicity, Weather Forecast., 28, 387–407, 2013. a
Clark, P., Roberts, N., Lean, H., Ballard, S. P., and Charlton-Perez, C.: Convection-permitting models: a step-change in rainfall forecasting, Meteorol. Appl., 23, 165–181, 2016. a
Cooney, J. W., Bedka, K. M., Bowman, K. P., Khlopenkov, K. V., and Itterly, K.: Comparing Tropopause-Penetrating Convection Identifications Derived From NEXRAD and GOES Over the Contiguous United States, J. Geophys. Res.-Atmos., 126, e2020JD034319, https://doi.org/10.1029/2020JD034319, 2021. a, b, c
Davini, P., Bechini, R., Cremonini, R., and Cassardo, C.: Radar-based analysis of convective storms over northwestern Italy, Atmosphere, 3, 33–58, 2012. a
Dee, D. P., Uppala, S. M., Simmons, A. J., Berrisford, P., Poli, P., Kobayashi, S., Andrae, U., Balmaseda, M. A., Balsamo, G., Bauer, P., Bechtold, P., Beljaars, A. C. M., van de Berg, L., Bidlot, J., Bormann, N., Delsol, C., Dragani, R., Fuentes, M., Geer, A. J., Haimberger, L., Healy, S. B., Hersbach, H., Hólm, E. V., Isaksen, L., Kållberg, P., Köhler, M., Matricardi, M., McNally, A. P., Monge-Sanz, B. M., Morcrette, J.-J., Park, B.-K., Peubey, C., de Rosnay, P., Tavolato, C., Thépaut, J.-N., and Vitart, F.: The ERA-Interim reanalysis: Configuration and performance of the data assimilation system, Q. J. Roy. Meteorol. Soc., 137, 553–597, 2011. a
De Martin, F., Carlon, N., Pavan, F., Carpentari, S., Giazzi, M., Peressutti, G., Miglietta, M. M., and Davolio, S.: Toward a dedicated warning system of severe storms in Italy: the PRETEMP project, Poster presented at the 11th European Conference on Severe Storms, Bucharest, Romania, 8–12 May 2023, ECSS2023-18, https://doi.org/10.5194/ecss2023-18, 2023. a
Dessens, J., Berthet, C., and Sanchez, J.: Change in hailstone size distributions with an increase in the melting level height, Atmos. Res., 158, 245–253, 2015. a, b, c
Dotzek, N., Groenemeijer, P., Feuerstein, B., and Holzer, A. M.: Overview of ESSL's severe convective storms research using the European Severe Weather Database ESWD, Atmos. Res., 93, 575–586, 2009. a, b
Ebert, E. E.: Fuzzy verification of high-resolution gridded forecasts: a review and proposed framework, Meteorol. Appl., 15, 51–64, 2008. a
Elliott, M. S., MacGorman, D. R., Schuur, T. J., and Heinselman, P. L.: An analysis of overshooting top lightning mapping array signatures in supercell thunderstorms, in: Proc. 22nd Int. Lightning Detection Conf., 2–3 April 2012, Broomfield, Colorado, USA, https://www.vaisala.com/sites/default/files/documents/An Analysis of Overshooting Top Lightning Mapping Array (last access: 10 July 2024), 2012. a, b
Flaounas, E., Davolio, S., Raveh-Rubin, S., Pantillon, F., Miglietta, M. M., Gaertner, M. A., Hatzaki, M., Homar, V., Khodayar, S., Korres, G., Kotroni, V., Kushta, J., Reale, M., and Ricard, D.: Mediterranean cyclones: current knowledge and open questions on dynamics, prediction, climatology and impacts, Weather Clim. Dynam., 3, 173–208, https://doi.org/10.5194/wcd-3-173-2022, 2022. a
Fluck, E., Kunz, M., Geissbuehler, P., and Ritz, S. P.: Radar-based assessment of hail frequency in Europe, Nat. Hazards Earth Syst. Sci., 21, 683–701, https://doi.org/10.5194/nhess-21-683-2021, 2021. a, b
Fujita, T. T.: Memoirs of an Effort to Unlock the Mystery of Severe Storms: During the 50 Years, 1942–1992, University of Chicago, https://cir.nii.ac.jp/crid/1130572417839208210 (last access: 10 July 2024), 1992. a
Gagne, D. J., McGovern, A., Haupt, S. E., Sobash, R. A., Williams, J. K., and Xue, M.: Storm-based probabilistic hail forecasting with machine learning applied to convection-allowing ensembles, Weather Forecast., 32, 1819–1840, 2017. a
Gagne II, D. J., Haupt, S. E., Nychka, D. W., and Thompson, G.: Interpretable deep learning for spatial analysis of severe hailstorms, Mon. Weather Rev., 147, 2827–2845, 2019. a, b
Gascón, E., Merino, A., Sánchez, J., Fernández-González, S., García-Ortega, E., López, L., and Hermida, L.: Spatial distribution of thermodynamic conditions of severe storms in southwestern Europe, Atmos. Res., 164, 194–209, 2015. a
Gensini, V. A., Converse, C., Ashley, W. S., and Taszarek, M.: Machine learning classification of significant tornadoes and hail in the United States using ERA5 proximity soundings, Weather Forecast., 36, 2143–2160, 2021. a
Giaiotti, D., Nordio, S., and Stel, F.: The climatology of hail in the plain of Friuli Venezia Giulia, Atmos. Res., 67, 247–259, 2003. a, b
Giordani, A.: hail-analysis, GitHub [code], https://github.com/agiord/hail-analysis (last access: 10 July 2024), 2024. a
Giordani, A., Cerenzia, I. M. L., Paccagnella, T., and Di Sabatino, S.: SPHERA, a new convection-permitting regional reanalysis over Italy: Improving the description of heavy rainfall, Q. J. Roy. Meteorol. Soc., 149, 781–808, https://doi.org/10.1002/qj.4428, 2023. a, b
Giovannini, L., Davolio, S., Zaramella, M., Zardi, D., and Borga, M.: Multi-model convection-resolving simulations of the October 2018 Vaia storm over Northeastern Italy, Atmos. Res., 253, 105455, https://doi.org/10.1016/j.atmosres.2021.105455, 2021. a
Gobbo, S., Ghiraldini, A., Dramis, A., Dal Ferro, N., and Morari, F.: Estimation of hail damage using crop models and remote sensing, Remote Sens., 13, 2655, https://doi.org/10.3390/rs13142655, 2021. a
Griffin, S. M., Bedka, K. M., and Velden, C. S.: A method for calculating the height of overshooting convective cloud tops using satellite-based IR imager and CloudSat cloud profiling radar observations, J. Appl. Meteorol. Clim., 55, 479–491, 2016. a, b
Groenemeijer, P., Púčik, T., Holzer, A. M., Antonescu, B., Riemann-Campe, K., Schultz, D. M., Kühne, T., Feuerstein, B., Brooks, H. E., Doswell III, C. A., Koppert, H. J., and Sausen, R.: Severe convective storms in Europe: Ten years of research and education at the European Severe Storms Laboratory, B. Am. Meteorol. Soc., 98, 2641–2651, 2017. a
Gunturi, P. and Tippett, M.: Managing severe thunderstorm risk: Impact of ENSO on US tornado and hail frequencies, Technical Rep., WillisRe, Minneapolis, https://www.columbia.edu/~mkt14/files/WillisRe_Impact_of_ENSO_on_US_Tornado_and_Hail_frequencies_Final.pdf (last access: 10 July 2024), 2017. a
Hersbach, H., Bell, B., Berrisford, P., Hirahara, S., Horányi, A., Muñoz-Sabater, J., Nicolas, J., Peubey, C., Radu, R., Schepers, D., Simmons, A., Soci, C., Abdalla, S., Abellan, X., Balsamo, G., Bechtold, P., Biavati, G., Bidlot, J., Bonavita, M., De Chiara, G., Dahlgren, P., Dee, D., Diamantakis, M., Dragani, R., Flemming, J., Forbes, R., Fuentes, M., Geer, A., Haimberger, L., Healy, S., Hogan, R. J., Hólm, E., Janisková, M., Keeley, S., Laloyaux, P., Lopez, P., Lupu, C., Radnoti, G., de Rosnay, P., Rozum, I., Vamborg, F., Villaume, S., and Thépaut, J.-N.: The ERA5 global reanalysis, Q. J. Roy. Meteorol. Soc., 146, 1999–2049, 2020. a
Hitchens, N. M. and Brooks, H. E.: Evaluation of the Storm Prediction Center's convective outlooks from day 3 through day 1, Weather Forecast., 29, 1134–1142, 2014. a
Hohl, R., Schiesser, H.-H., and Knepper, I.: The use of weather radars to estimate hail damage to automobiles: an exploratory study in Switzerland, Atmos. Res., 61, 215–238, 2002. a
Hoogewind, K. A., Baldwin, M. E., and Trapp, R. J.: The impact of climate change on hazardous convective weather in the United States: Insight from high-resolution dynamical downscaling, J. Climate, 30, 10081–10100, 2017. a
Houze Jr., R. A.: Cloud dynamics, Academic Press, https://doi.org/10.1016/B978-0-12-374266-7.09984-4, 2014. a
Jelić, D., Megyeri, O. A., Malečić, B., Belušić Vozila, A., Strelec Mahović, N., and Telišman Prtenjak, M.: Hail climatology along the northeastern Adriatic, J. Geophys. Res.-Atmos., 125, e2020JD032749, https://doi.org/10.1029/2020JD032749, 2020. a, b, c, d
Johns, R. H. and Doswell III, C. A.: Severe local storms forecasting, Weather Forecast., 7, 588–612, 1992. a
Johnson, A. W. and Sugden, K. E.: Evaluation of sounding-derived thermodynamic and wind-related parameters associated with large hail events, E-J. Sev. Storms Meteorol., 9, 1–42, https://doi.org/10.55599/ejssm.v9i5.57, 2014. a
Jurković, P. M., Mahović, N. S., and Počakal, D.: Lightning, overshooting top and hail characteristics for strong convective storms in Central Europe, Atmos. Res., 161, 153–168, 2015. a
Khlopenkov, K. V., Bedka, K. M., Cooney, J. W., and Itterly, K.: Recent advances in detection of overshooting cloud tops from longwave infrared satellite imagery, J. Geophys. Res.-Atmos., 126, e2020JD034359, https://doi.org/10.1029/2020JD034359, 2021. a, b, c, d, e, f, g, h, i
Knight, C. A. and Knight, N. C.: Hailstorms, in: Severe convective storms, Springer, 223–254, https://doi.org/10.1007/978-1-935704-06-5_6, 2001. a
Kopp, J., Schröer, K., Schwierz, C., Hering, A., Germann, U., and Martius, O.: The summer 2021 Switzerland hailstorms: weather situation, major impacts and unique observational data, Weather, 78, 184–191, https://doi.org/10.1002/wea.4306, 2022. a
Kumjian, M. R. and Lombardo, K.: A hail growth trajectory model for exploring the environmental controls on hail size: Model physics and idealized tests, J. Atmos. Sci., 77, 2765–2791, 2020. a
Kunz, M.: The skill of convective parameters and indices to predict isolated and severe thunderstorms, Nat. Hazards Earth Syst. Sci., 7, 327–342, https://doi.org/10.5194/nhess-7-327-2007, 2007. a, b
Kunz, M., Blahak, U., Handwerker, J., Schmidberger, M., Punge, H. J., Mohr, S., Fluck, E., and Bedka, K. M.: The severe hailstorm in southwest Germany on 28 July 2013: Characteristics, impacts and meteorological conditions, Q. J. Roy. Meteorol. Soc., 144, 231–250, 2018. a
Kunz, M., Wandel, J., Fluck, E., Baumstark, S., Mohr, S., and Schemm, S.: Ambient conditions prevailing during hail events in central Europe, Nat. Hazards Earth Syst. Sci., 20, 1867–1887, https://doi.org/10.5194/nhess-20-1867-2020, 2020. a, b, c
Labriola, J., Snook, N., Jung, Y., and Xue, M.: Explicit ensemble prediction of hail in 19 May 2013 Oklahoma City thunderstorms and analysis of hail growth processes with several multimoment microphysics schemes, Mon. Weather Rev., 147, 1193–1213, 2019. a
Laviola, S., Levizzani, V., Ferraro, R. R., and Beauchamp, J.: Hailstorm detection by satellite microwave radiometers, Remote Sens., 12, 621 https://doi.org/10.3390/rs12040621, 2020. a
Li, M., Zhang, D.-L., Sun, J., and Zhang, Q.: A statistical analysis of hail events and their environmental conditions in China during 2008–15, J. Appl. Meteorol. Clim., 57, 2817–2833, 2018. a
Liu, C., Ikeda, K., Rasmussen, R., Barlage, M., Newman, A. J., Prein, A. F., Chen, F., Chen, L., Clark, M., Dai, A., Dudhia, J., Eidhammer, T., Gochis, D., Gutmann, E., Kurkute, S., Li, Y., Thompson G., and Yates, D.: Continental-scale convection-permitting modeling of the current and future climate of North America, Clim. Dynam., 49, 71–95, 2017. a
Löffler-Mang, M., Schön, D., and Landry, M.: Characteristics of a new automatic hail recorder, Atmos. Res., 100, 439–446, 2011. a
Lupo, K. M., Torn, R. D., and Yang, S.-C.: Evaluation of stochastic perturbed parameterization tendencies on convective-permitting ensemble forecasts of heavy rainfall events in New York and Taiwan, Weather Forecast., 35, 5–24, 2020. a
Malečić, B., Cui, R., Demory, M.-E., Horvath, K., Jelic, D., Schär, C., Prtenjak, M. T., Velasquez, P., and Ban, N.: Simulating Hail and Lightning over the Alpine Adriatic Region – A model Intercomparison Study, Authorea Preprints, https://doi.org/10.1029/2022JD037989, 2022. a
Manzato, A.: Hail in northeast Italy: Climatology and bivariate analysis with the sounding-derived indices, J. Appl. Meteorol. Clim., 51, 449–467, 2012. a
Manzato, A., Riva, V., Tiesi, A., and Marcello Miglietta, M.: Observational analysis and simulations of a severe hailstorm in northeastern Italy, Q. J. Roy. Meteorol. Soc., 146, 3587–3611, 2020. a
Manzato, A., Cicogna, A., Centore, M., Battistutta, P., and Trevisan, M.: Hailstone Characteristics in Northeast Italy from 29 Years of Hailpad Data, J. Appl. Meteorol. Clim., 61, 1779–1795, 2022a. a
Manzato, A., Serafin, S., Miglietta, M. M., Kirshbaum, D., and Schulz, W.: A pan-Alpine climatology of lightning and convective initiation, Mon. Weather Rev., 150, 2213–2230, https://doi.org/10.1175/MWR-D-21-0149.1, 2022b. a, b
Marcos, J., Sánchez, J., Merino, A., Melcón, P., Mérida, G., and García-Ortega, E.: Spatial and temporal variability of hail falls and estimation of maximum diameter from meteorological variables, Atmos. Res., 247, 105142, https://doi.org/10.1016/j.atmosres.2020.105142, 2021. a
Marion, G., Trapp, R. J., and Nesbitt, S. W.: Using overshooting top area to discriminate potential for large, intense tornadoes, Geophys. Res. Lett., 46, 12520–12526, 2019. a
Markowski, P. and Richardson, Y.: Mesoscale meteorology in midlatitudes, in: Vol. 2, John Wiley & Sons, https://doi.org/10.1002/9780470682104, 2011. a, b
Marsigli, C., Ebert, E., Ashrit, R., Casati, B., Chen, J., Coelho, C. A. S., Dorninger, M., Gilleland, E., Haiden, T., Landman, S., and Mittermaier, M.: Review article: Observations for high-impact weather and their use in verification, Nat. Hazards Earth Syst. Sci., 21, 1297–1312, https://doi.org/10.5194/nhess-21-1297-2021, 2021. a
Mecikalski, J. R., Sandmæl, T. N., Murillo, E. M., Homeyer, C. R., Bedka, K. M., Apke, J. M., and Jewett, C. P.: A random-forest model to assess predictor importance and nowcast severe storms using high-resolution radar–GOES satellite-lightning observations, Mon. Weather Rev., 149, 1725–1746, 2021. a, b
Melcón, P., Merino, A., Sánchez, J. L., López, L., and Hermida, L.: Satellite remote sensing of hailstorms in France, Atmos. Res., 182, 221–231, 2016. a
Mikuš, P. and Mahović, N. S.: Satellite-based overshooting top detection methods and an analysis of correlated weather conditions, Atmos. Res., 123, 268–280, 2013. a, b
Mikuš, P., Prtenjak, M. T., and Mahović, N. S.: Analysis of the convective activity and its synoptic background over Croatia, Atmos. Res., 104, 139–153, 2012. a
Mohr, S., Kunz, M., and Keuler, K.: Development and application of a logistic model to estimate the past and future hail potential in Germany, J. Geophys. Res.-Atmos., 120, 3939–3956, 2015. a
Morel, C. and Senesi, S.: A climatology of mesoscale convective systems over Europe using satellite infrared imagery. I: Methodology, Q. J. Roy. Meteorol. Soc., 128, 1953–1971, 2002. a
Murillo, E. M. and Homeyer, C. R.: Severe hail fall and hailstorm detection using remote sensing observations, J. Appl. Meteorol. Clim., 58, 947–970, 2019. a
Nisi, L., Martius, O., Hering, A., Kunz, M., and Germann, U.: Spatial and temporal distribution of hailstorms in the Alpine region: a long-term, high resolution, radar-based analysis, Q. J. Roy. Meteorol. Soc., 142, 1590–1604, 2016. a
Nisi, L., Hering, A., Germann, U., and Martius, O.: A 15-year hail streak climatology for the Alpine region, Q. J. Roy. Meteorol. Soc., 144, 1429–1449, 2018. a
Nisi, L., Hering, A., Germann, U., Schroeer, K., Barras, H., Kunz, M., and Martius, O.: Hailstorms in the Alpine region: Diurnal cycle, 4D-characteristics, and the nowcasting potential of lightning properties, Q. J. Roy. Meteorol. Soc., 146, 4170–4194, 2020. a, b, c, d
Nixon, C. J., Allen, J. T., and Taszarek, M.: Hodographs and skew Ts of hail-producing storms, Weather Forecast., 38, 2217–2236, 2023. a, b
Ortega, K. L.: Evaluating multi-radar, multi-sensor products for surface hailfall diagnosis, E-J. Sever. Storms Meteorol., 13, 1–36, https://doi.org/10.55599/ejssm.v13i1.69, 2018. a
Palencia, C., Giaiotti, D., Stel, F., Castro, A., and Fraile, R.: Maximum hailstone size: Relationship with meteorological variables, Atmos. Res., 96, 256–265, 2010. a
Paterson, D. A. and Sankaran, R.: Hail impact on building envelopes, J. Wind Eng. Indust. Aerodynam., 53, 229–246, 1994. a
Prein, A. F. and Holland, G. J.: Global estimates of damaging hail hazard, Weather Clim. Extrem., 22, 10–23, 2018. a, b, c, d, e, f, g
Prein, A. F., Langhans, W., Fosser, G., Ferrone, A., Ban, N., Goergen, K., Keller, M., Tölle, M., Gutjahr, O., Feser, F., Brisson, E., Kollet, S., Schmidli, J., van Lipzig, N. P. M., and Leung L.: A review on regional convection-permitting climate modeling: Demonstrations, prospects, and challenges, Rev. Geophys., 53, 323–361, 2015. a, b
Prein, A. F., Rasmussen, R. M., Ikeda, K., Liu, C., Clark, M. P., and Holland, G. J.: The future intensification of hourly precipitation extremes, Nat. Clim. Change, 7, 48–52, 2017. a
Proud, S. R.: Analysis of overshooting top detections by Meteosat Second Generation: a 5-year dataset, Q. J. Roy. Meteorol. Soc., 141, 909–915, 2015. a
Púčik, T., Groenemeijer, P., Rỳva, D., and Kolář, M.: Proximity soundings of severe and nonsevere thunderstorms in central Europe, Mon. Weather Rev., 143, 4805–4821, 2015. a, b, c
Púčik, T., Groenemeijer, P., Rädler, A. T., Tijssen, L., Nikulin, G., Prein, A. F., van Meijgaard, E., Fealy, R., Jacob, D., and Teichmann, C.: Future changes in European severe convection environments in a regional climate model ensemble, J. Climate, 30, 6771–6794, 2017. a
Púčik, T., Castellano, C., Groenemeijer, P., Kühne, T., Rädler, A. T., Antonescu, B., and Faust, E.: Large hail incidence and its economic and societal impacts across Europe, Mon. Weather Rev., 147, 3901–3916, 2019. a, b, c, d, e
Púčik, T., Groenemeijer, P., Taszarek, M., and Battaglioli, F.: Pre-storm environments and storm-scale properties of the major hailstorms of 2021 and 2022 in Europe, in: 11th European Conference on Severe Storms, 8–12 May 2023, Bucharest, Romania, ECSS2023-124, https://doi.org/10.5194/ecss2023-124, 2023. a
Punge, H., Bedka, K., Kunz, M., and Werner, A.: A new physically based stochastic event catalog for hail in Europe, Nat. Hazards, 73, 1625–1645, 2014. a, b
Punge, H., Bedka, K., Kunz, M., and Reinbold, A.: Hail frequency estimation across Europe based on a combination of overshooting top detections and the ERA-INTERIM reanalysis, Atmos. Res., 198, 34–43, 2017. a, b, c, d, e, f, g, h, i, j, k, l, m, n, o
Punge, H. J. and Kunz, M.: Hail observations and hailstorm characteristics in Europe: A review, Atmos. Res., 176, 159–184, 2016. a, b, c
Punge, H. J., Bedka, K. M., Kunz, M., Bang, S. D., and Itterly, K. F.: Characteristics of hail hazard in South Africa based on satellite detection of convective storms, Nat. Hazards Earth Syst. Sci., 23, 1549–1576, https://doi.org/10.5194/nhess-23-1549-2023, 2023. a, b, c, d
Puskeiler, M., Kunz, M., and Schmidberger, M.: Hail statistics for Germany derived from single-polarization radar data, Atmos. Res., 178, 459–470, 2016. a
Rädler, A. T., Groenemeijer, P., Faust, E., and Sausen, R.: Detecting severe weather trends using an additive regressive convective hazard model (AR-CHaMo), J. Appl. Meteorol. Clim., 57, 569–587, 2018. a
Raupach, T. H., Martius, O., Allen, J. T., Kunz, M., Lasher-Trapp, S., Mohr, S., Rasmussen, K. L., Trapp, R. J., and Zhang, Q.: The effects of climate change on hailstorms, Nat. Rev. Earth Environ., 2, 213–226, 2021. a, b
Reynolds, D. W.: Observations of damaging hailstorms from geosynchronous satellite digital data, Mon. Weather Rev., 108, 337–348, 1980. a
Riemann-Campe, K., Fraedrich, K., and Lunkeit, F.: Global climatology of convective available potential energy (CAPE) and convective inhibition (CIN) in ERA-40 reanalysis, Atmos. Res., 93, 534–545, 2009. a
Sánchez, J., Gil-Robles, B., Dessens, J., Martin, E., Lopez, L., Marcos, J., Berthet, C., Fernández, J., and García-Ortega, E.: Characterization of hailstone size spectra in hailpad networks in France, Spain, and Argentina, Atmos. Res., 93, 641–654, 2009. a
Sartori, G.: Eventi meteorologici estremi, Dati e valutazioni sulla radicalizzazione del clima in Veneto, Rapporto Tecnico, Consiglio Regionale del Veneto, https://www.yumpu.com/it/document/view/15065933/eventi-meteorologici-estremi-consiglio-regionale-veneto (last access: 10 July 2024), 2012. a
Scarino, B., Itterly, K., Bedka, K., Homeyer, C. R., Allen, J., Bang, S., and Cecil, D.: Deriving Severe Hail Likelihood from Satellite Observations and Model Reanalysis Parameters using a Deep Neural Network, Artific. Intel. Earth Syst., 2, 1–55, 2023. a, b, c
Schättler, U., Doms, G., and Schraff, C.: A description of the nonhydrostatic regional COSMO-model. Part VII: user's guide, Rep. COSMO-Model, Deutscher Wetterdienst, p. 195, https://doi.org/10.5676/DWD_pub/nwv/cosmo-doc_6.00_VII, 2018. a
Schmetz, J., Pili, P., Tjemkes, S., Just, D., Kerkmann, J., Rota, S., and Ratier, A.: An introduction to Meteosat Second Generation (MSG), B. Am. Meteorol. Soc., 83, 977–992, 2002. a
Seneviratne, S., Zhang, X., Adnan, M., Badi, W., Dereczynski, C., Di Luca, A., Ghosh, S., Iskandar, I., Kossin, J., Lewis, S., Otto, F., Pinto, I., Satoh, M., Vicente-Serrano, S., Wehner, M., and Zhou, B.: Weather and Climate Extreme Events in a Changing Climate, in: Climate Change 2021: The Physical Science Basis, Contribution of Working Group I to the Sixth Assessment Report of the Intergovernmental Panel on Climate Change, Cambridge University Press, Cambridge, UK and New York, NY, USA, 1513–1766, https://doi.org/10.1017/9781009157896.013, 2021. a
Setvák, M., Bedka, K., Lindsey, D. T., Sokol, A., Charvát, Z., Št'ástka, J., and Wang, P. K.: A-Train observations of deep convective storm tops, Atmos. Res., 123, 229–248, 2013. a
Sherwood, S. C., Chae, J.-H., Minnis, P., and McGill, M.: Underestimation of deep convective cloud tops by thermal imagery, Geophys. Res. Lett., 31, L11102, https://doi.org/10.1029/2004GL019699, 2004. a
Svabik, O., Meyer, V., Tüchler, L., and Zenkl, G.: Hail risk areas in Austria, on the basis of reports 1971–2011 and weather radar images 2002–2011, in: 7th European Conference on Severe Storms, 3–7 June 2013, Helsinki, Finland, p. 2, https://www.essl.org/ECSS/2013/programme/abstracts/50.pdf (last access: 10 July 2024), 2013. a
Tang, B. H., Gensini, V. A., and Homeyer, C. R.: Trends in United States large hail environments and observations, NPJ Clim. Atmos. Sci., 2, 1–7, 2019. a
Taszarek, M., Brooks, H. E., Czernecki, B., Szuster, P., and Fortuniak, K.: Climatological aspects of convective parameters over Europe: A comparison of ERA-Interim and sounding data, J. Climate, 31, 4281–4308, 2018. a
Taszarek, M., Allen, J. T., Púčik, T., Hoogewind, K. A., and Brooks, H. E.: Severe convective storms across Europe and the United States. Part II: ERA5 environments associated with lightning, large hail, severe wind, and tornadoes, J. Climate, 33, 10263–10286, 2020. a, b, c, d
Taszarek, M., Allen, J. T., Brooks, H. E., Pilguj, N., and Czernecki, B.: Differing trends in United States and European severe thunderstorm environments in a warming climate, B. Am. Meteorol. Soc., 102, E296–E322, 2021. a, b
Thompson, R. L., Edwards, R., Hart, J. A., Elmore, K. L., and Markowski, P.: Close proximity soundings within supercell environments obtained from the Rapid Update Cycle, Weather Forecast., 18, 1243–1261, 2003. a
Tiesi, A., Mazzà, S., Conte, D., Ricchi, A., Baldini, L., Montopoli, M., Picciotti, E., Vulpiani, G., Ferretti, R., and Miglietta, M. M.: Numerical simulation of a Giant-hail-bearing Mediterranean supercell in the Adriatic Sea, Atmosphere, 13, 1219, https://doi.org/10.3390/atmos13081219, 2022. a
Tippett, M. K., Sobel, A. H., Camargo, S. J., and Allen, J. T.: An empirical relation between US tornado activity and monthly environmental parameters, J. Climate, 27, 2983–2999, 2014. a
Torralba, V., Hénin, R., Cantelli, A., Scoccimarro, E., Materia, S., Manzato, A., and Gualdi, S.: Modelling hail hazard over Italy with ERA5 large-scale variables, Weather Clim. Extrem., 39, 100535, https://doi.org/10.1016/j.wace.2022.100535, 2023. a, b, c, d
Trapp, R. J. and Hoogewind, K. A.: The realization of extreme tornadic storm events under future anthropogenic climate change, J. Climate, 29, 5251–5265, 2016. a
Trapp, R. J., Diffenbaugh, N. S., Brooks, H. E., Baldwin, M. E., Robinson, E. D., and Pal, J. S.: Changes in severe thunderstorm environment frequency during the 21st century caused by anthropogenically enhanced global radiative forcing, P. Natl. Acad. Sci. USA, 104, 19719–19723, 2007. a
Trapp, R. J., Hoogewind, K. A., and Lasher-Trapp, S.: Future changes in hail occurrence in the United States determined through convection-permitting dynamical downscaling, J. Climate, 32, 5493–5509, 2019. a, b
Wellmann, C., Barrett, A. I., Johnson, J. S., Kunz, M., Vogel, B., Carslaw, K. S., and Hoose, C.: Comparing the impact of environmental conditions and microphysics on the forecast uncertainty of deep convective clouds and hail, Atmos. Chem. Phys., 20, 2201–2219, https://doi.org/10.5194/acp-20-2201-2020, 2020. a
Wilhelm, J., Mohr, S., Punge, H. J., Mühr, B., Schmidberger, M., Daniell, J. E., Bedka, K. M., and Kunz, M.: Severe thunderstorms with large hail across Germany in June 2019, Weather, 76, 228–237, 2021. a
Wilhelmson, R. B. and Wicker, L. J.: Numerical modeling of severe local storms, in: Severe convective storms, Springer, 123–166, https://doi.org/10.1007/978-1-935704-06-5_4, 2001. a
Wu, C.-M. and Arakawa, A.: A unified representation of deep moist convection in numerical modeling of the atmosphere. Part II, J. Atmos. Sci., 71, 2089–2103, 2014. a
Xie, B., Zhang, Q., and Wang, Y.: Trends in hail in China during 1960–2005, Geophys. Res. Lett., 35, L13801, https://doi.org/10.1029/2008GL034067, 2008. a
Yeo, S., Leigh, R., and Kuhne, I.: The April 1999 Sydney Hailstorm, Aust. J. Emerg. Manage., 14, 23–25, 1999. a
Zhou, J., Pavek, M. J., Shelton, S. C., Holden, Z. J., and Sankaran, S.: Aerial multispectral imaging for crop hail damage assessment in potato, Comput. Elect. Agricult., 127, 406–412, 2016. a
- Abstract
- Introduction
- Data
- OT reanalysis filter design
- Hail frequency and ambient conditions
- Discussion
- Conclusion
- Appendix A: Thermodynamic parameters
- Appendix B: Matching with ESWD hail reports: inter-monthly and inter-daily variability
- Code availability
- Data availability
- Author contributions
- Competing interests
- Disclaimer
- Acknowledgements
- Financial support
- Review statement
- References