the Creative Commons Attribution 4.0 License.
the Creative Commons Attribution 4.0 License.
 | 14 Feb 2023
The characteristics of the 2022 Tonga volcanic tsunami in the Pacific Ocean
Gui Hu
Zhiyuan Ren
Kan Zhang
On 15 January 2022, an exceptional eruption of the Hunga Tonga–Hunga Ha'apai volcano generated atmospheric and tsunami waves that were widely observed in the oceans globally, gaining remarkable attention from scientists in related fields. The tsunamigenic mechanism of this rare event remains enigmatic due to its complexity and lack of direct underwater observations. Here, to explore the tsunamigenic mechanisms of this volcanic tsunami event and its hydrodynamic processes in the Pacific Ocean, we conduct statistical analysis and spectral analysis of the tsunami recordings at 116 coastal gauges and 38 deep-ocean buoys across the Pacific Ocean. Combined with the constraints of some representative barometers, we obtain the plausible tsunamigenic origins of the volcano activity. We identify four distinct tsunami wave components generated by air–sea coupling and seafloor crustal deformation. Those tsunami components are differentiated by their different propagating speeds or period bands. The first-arriving tsunami component with an ∼ 80–100 min period was from shock waves spreading at a velocity of ∼ 1000 m s−1 in the vicinity of the eruption. The second component with extraordinary tsunami amplitude in the deep ocean was from Lamb waves. The Lamb wave with a ∼ 30–40 min period radically propagated outward from the eruption site with spatially decreasing propagation velocities from ∼ 340 to ∼ 315m s−1. The third component with a ∼ 10–30 min period was probably from some atmospheric-gravity-wave modes propagating faster than 200 m s−1 but slower than Lamb waves. The last component with a ∼ 3–5 min period originated from partial caldera collapse with dimension of ∼ 0.8–1.8 km. Surprisingly, the 2022 Tonga volcanic tsunami produced long oscillation in the Pacific Ocean which is comparable with that of the 2011 Tohoku tsunami. We point out that the long oscillation is associated not only with the resonance effect with the atmospheric acoustic-gravity waves but more importantly with their interactions with local bathymetry. This rare event also calls for more attention to the tsunami hazards produced by an atypical tsunamigenic source, e.g. volcanic eruption.
- Article
(14388 KB) - Full-text XML
-
Supplement
(429 KB) - BibTeX
- EndNote


On 15 January 2022 at 04:14:45 UTC, a submarine volcano erupted violently at the uninhabited island of Hunga Tonga–Hunga Ha'apai (HTHH) at 20.546∘ S, 175.390∘ W (USGS, 2022). The volcano is located ∼ 67 km north of Nuku'alofa, the capital of Tonga (NASA, 2022) (Fig. 1). The blasts launched plumes of ash, steam, and gas ∼ 58 km high into stratosphere (Yuen et al., 2022), which not only blanketed nearby islands in ash (Duncombe, 2022; NASA, 2022) but also caused various atmospheric acoustic-gravity wave (AGW) modes of various scales, e.g. Lamb waves from atmospheric surface pressure disturbance associated with the eruption (Liu and Higuera, 2022; Adam, 2022; Kubota et al., 2022; Matoza et al., 2022). Tsunamis with conspicuous sea level changes were detected by coastal tide gauges and Deep-ocean Assessment and Reporting of Tsunamis (DART) buoy stations in the Pacific (Fig. 1), Atlantic, and Indian oceans as well as the Caribbean and Mediterranean seas (Carvajal et al., 2022; Kubota et al., 2022; Ramírez-Herrera et al., 2022), while the large waves were mainly concentrated in the Pacific Ocean, like on the coastlines of New Zealand, Japan, California, and Chile (Carvajal et al., 2022). The event caused at least three fatalities in Tonga. Two people drowned in northern Peru when ∼ 2 m destructive tsunami waves inundated an island in the Lambayeque region, Chile (Edmonds, 2022).
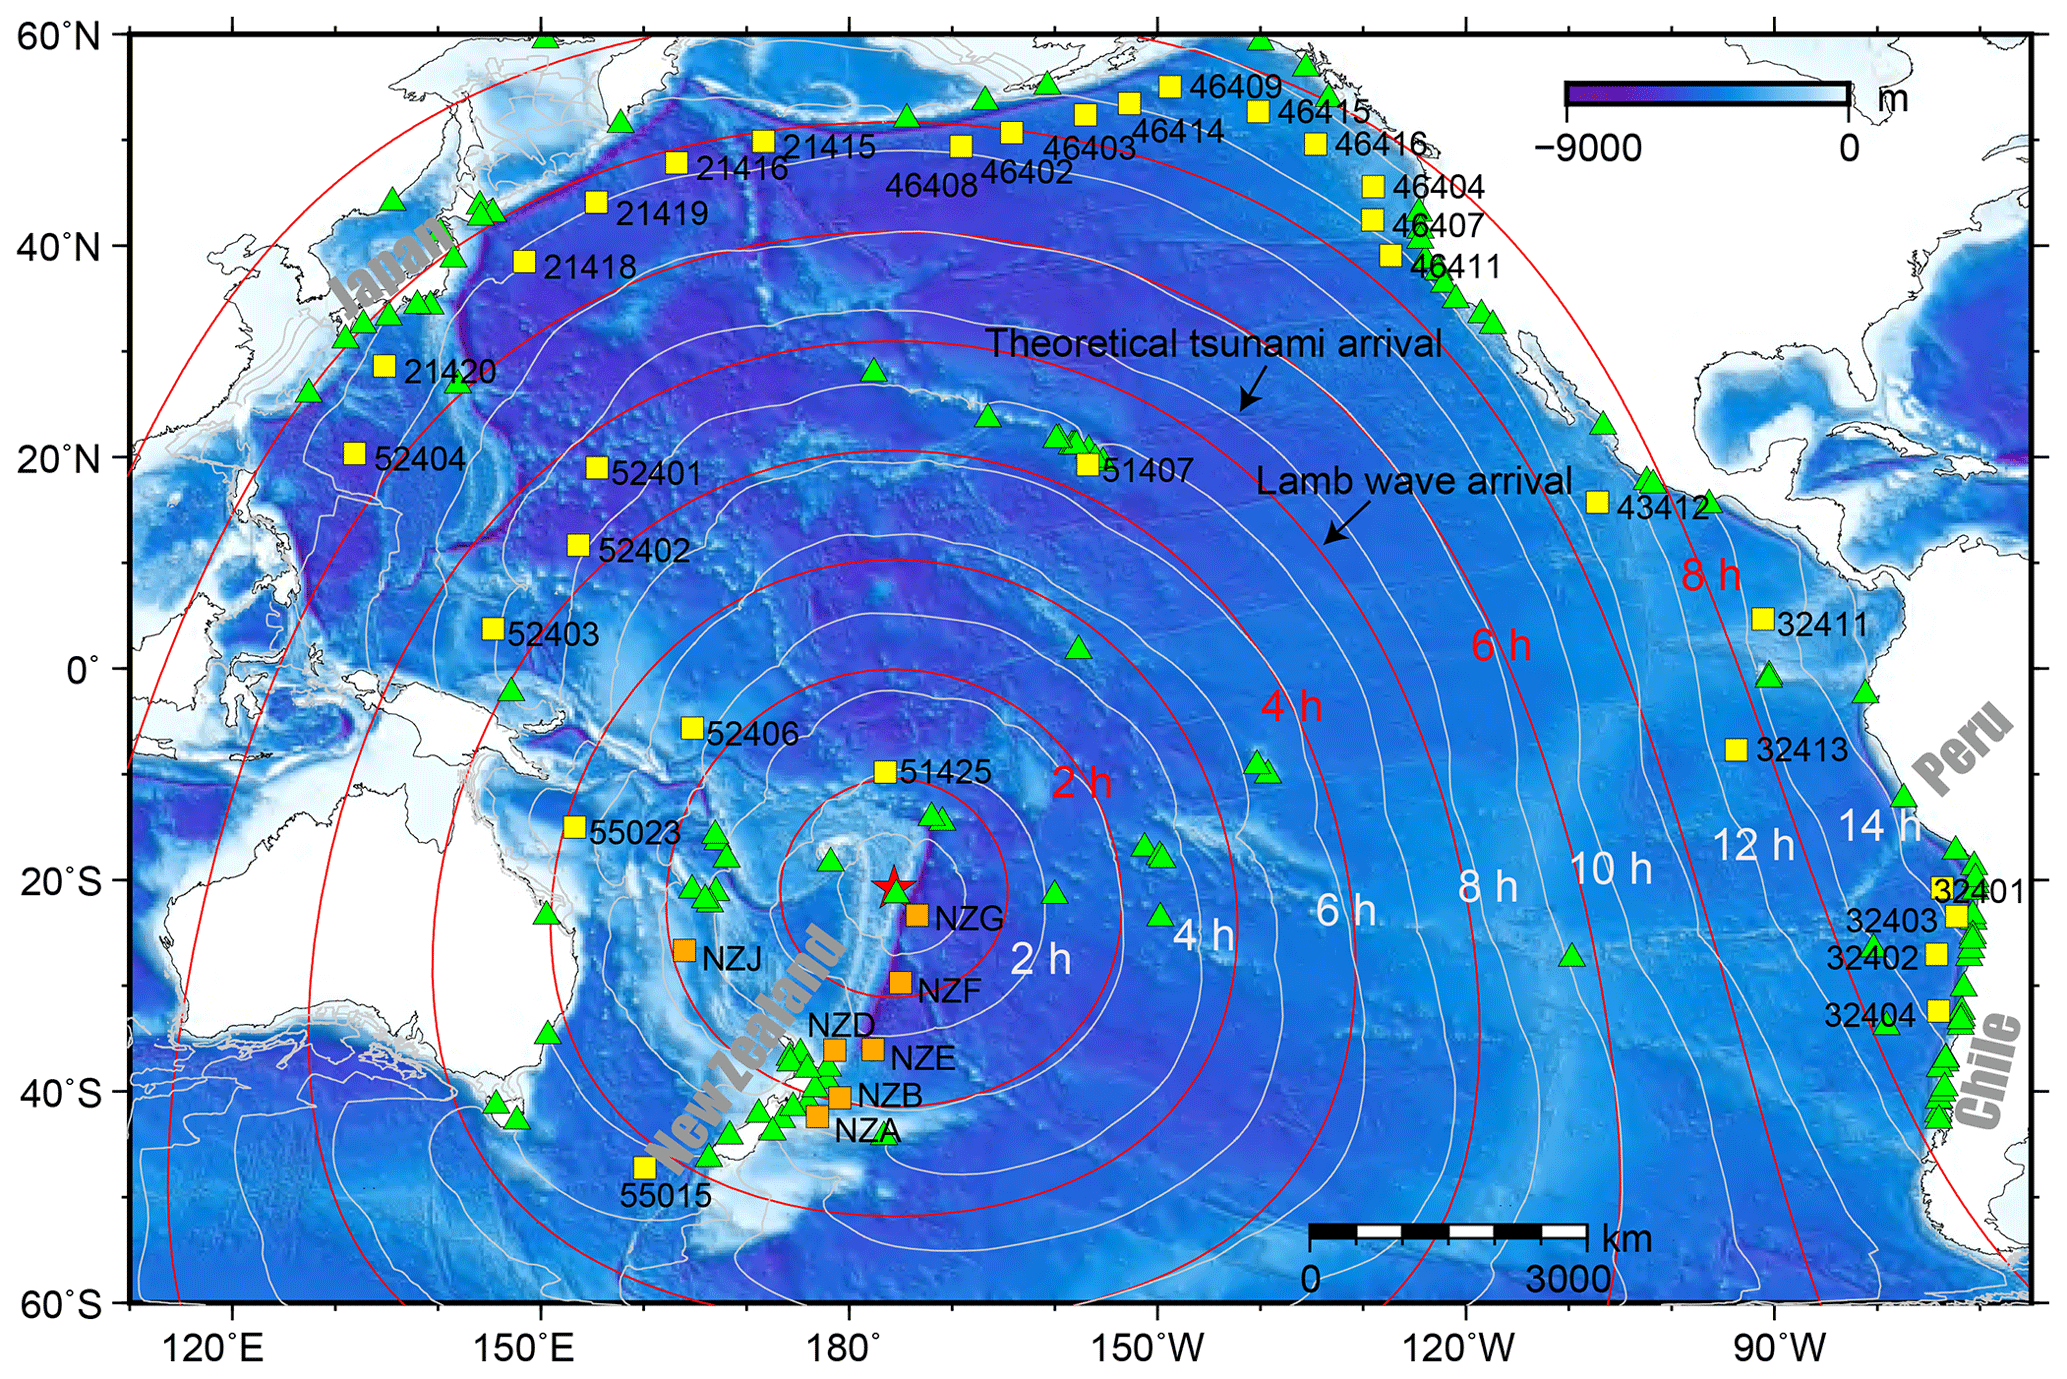
Figure 1The spatial distribution of the eruption site (red star), DART stations (squares), tide gauges (triangles), and the calculated tsunami arrival times. White contours indicate the modelled arrival times of conventional tsunamis. Red contours indicate the estimated arrival times of Lamb waves (see how we derive these contours in Sect. 3.1).
Satellite images revealed that the elevation of the island of HTHH has gone through a dramatic change before and after the mid-January 2022 eruption. Previously, after the 2015 eruption, the two existing islands of Hunga Tonga and Hunga Ha'apai were linked together. The volcanic island rose 1.8 km from the seafloor where it stretched ∼ 20 km across and topped an underwater caldera ∼ 5 km in diameter (Garvin et al., 2018; NASA, 2022). After the violent explosion on 15 January 2022, the island formed as recently as 2015 was completely gone, with only small tips left in the far southwestern and northeastern parts of the island of HTHH (NASA, 2022). The HTHH volcano lies along the northern part of the Tonga–Kermadec arc, where the Pacific plate subducts under the Indo-Australian plate (Billen et al., 2003). The convergence rate (15–24 cm yr−1) between the Tonga–Kermadec subduction system and the Pacific plate is among the fastest recorded plate velocity on earth, forming the second deepest trench around the globe (Satake, 2010; Bevis et al., 1995). The fast convergence rate contributes to the frequent earthquakes, tsunamis, and volcanic eruptions in this region historically (Bevis et al., 1995). The 2022 HTHH volcano is part of a submarine-volcano chain that extends all the way from New Zealand to Fiji (Plank et al., 2020). The HTHH volcano had many notable eruptions before 2022 since its first recorded eruption in 1912, i.e. in 1937, 1988, 2009, and 2014–2015 (Global Volcanism Program, https://volcano.si.edu, last access: 1 March 2022).
The 2022 HTHH eruption was the first volcanic event which generated worldwide tsunami signatures since the 1883 Krakatau event (Matoza et al., 2022; Self and Rampino, 1981; Nomanbhoy and Satake, 1995). The tsunamigenic mechanism of this rare volcanic-eruption-induced tsunami is still poorly understood due to its complex nature and the deficiencies of near-field seafloor surveys. Various tsunami generation mechanisms have been proposed so far based on the observations of ground-based and spaceborne geophysical instrumentations (Kubota et al., 2022; Matoza et al., 2022; Carvajal et al., 2022). The mechanisms are closely associated with the air–sea coupling of atmospheric waves. Atmospheric waves propagating in the atmospheric fluid are generated by different physical mechanisms (Gossard and Hooke, 1975). A Lamb wave is a horizontally propagating acoustic wave in the Lamb mode which is trapped on the earth's surface with a group velocity close to the mean sound velocity of the lower atmosphere (e.g. Lamb, 1932). An atmospheric gravity wave is triggered when air molecules in the atmosphere are disturbed vertically rather than horizontally (e.g. Le Pichon et al., 2010). Nonlinear propagation of an atmospheric wave may cause period lengthening and the formation of shock waves (Matoza et al., 2022). The most-mentioned mechanism of the tsunami is the fast-travelling atmospheric Lamb wave generated by the atmospheric pressure rise of ∼ 2 hPa during the eruption. The Lamb wave circled the earth several times with a travelling speed close to that of the sound wave in the lower atmosphere, leading to globally observed sea level fluctuations (Adam, 2022; Duncombe, 2022; Kubota et al., 2022; Matoza et al., 2022) (Fig. 1). The second mechanism is suggested to be a variety of other acoustic-gravity wave modes (Adam, 2022; Matoza et al., 2022; Themens et al., 2022; Zhang et al., 2022). The third mechanism may be related to the seafloor crustal deformation induced by one or more volcanic activities in the vicinity of the eruption site (e.g. pyroclastic flows, partial collapse of the caldera) (Carvajal et al., 2022), which are more responsible for the near-field tsunamis with conventional tsunami speeds.

Figure 2Detided tsunami waveforms at (a) DART buoys and (b) tide gauges. Waveforms in both subplots are shown in ascending distance. Azi stands for azimuth. The data are normalized with respect to the largest amplitude of each tide gauge.
To investigate the possible tsunamigenic mechanisms and detailed hydrodynamic behaviours of this rare volcanic tsunami event, in this study, we collect, process, and analyse the sea level measurements from 116 tide gauges and 38 DART buoys in the Pacific Ocean (shown in Figs. 1 and 2). We first perform a statistical analysis of the tsunami waveforms to estimate the propagating speed of the Lamb wave and to understand the tsunami wave characteristics in the Pacific Ocean through demonstrating the tsunami wave properties, i.e. arrival times, wave heights, and durations. We then conduct wavelet analysis for representative DART buoys and tide gauges, respectively, to explore tsunamigenic mechanisms of the event and to better understand its hydrodynamic processes in the Pacific Ocean. Aided by wavelet analysis of corresponding barometers near the selected DART buoys and comparison with tsunami records of the 2011 Tohoku tsunami, we are able to piece together all the analyses and demonstrate that the 2022 HTHH tsunami was generated by air–sea coupling with a wide range of atmospheric waves with different propagating velocities and period bands, as well as seafloor crustal deformation associated with the volcanic eruption. We demonstrate as well that the tsunami was amplified at the far-field Pacific coastlines where the local bathymetric effects play a dominant role in tsunami scale.
2.1 Data
We collected high-quality sea level records across the Pacific Ocean at 38 DART buoys (31 stations from https://nctr.pmel.noaa.gov/Dart/, last access: 1 March 2022; 7 stations from https://tilde.geonet.org.nz/dashboard/, last access: 1 March 2022) and 116 tide gauges from the IOC (Intergovernmental Oceanographic Commission, http://www.ioc-sealevelmonitoring.org, last access: 1 March 2022) (Fig. 1). The epicentral distances of tide gauges and DART buoys range between 74–10 790 and 375–10 414 km, respectively. The sampling rates of DART buoys are changing over time. Passing of a tsunami event generally can trigger the DART system to enter its high-frequency-sampling mode (15 s or 1 min) from its normal-frequency-sampling mode (15 min) (http://www.ndbc.noaa.gov/dart, last access: 1 March 2022). In contrast, sampling rates of normal tide gauges at coasts are uniform with a sampling interval of 1 min. The sampling interval of both DART and tide gauges is preprocessed to 15 s. Firstly, we eliminate abnormal spikes and fill gaps by linear interpolation. Secondly, we applied a fourth-order Butterworth high-pass filter with a cut-off frequency of 3.5 × 10⁻⁵ Hz (∼ 8 h) to remove the tidal components (Fig. 2) (Heidarzadeh and Satake, 2013). After the two steps, a quality control step is conducted to select high-quality data, in which we delete waveforms with spoiled data or massive data loss due to equipment failure or with the maximum tsunami heights of tide gauges less than 0.2 m; following this the selected data will be ready for further statistics and spectral analysis. We also collect and analyse the atmospheric pressure disturbance data recorded by some representative barometers. The sampling rates of the barometers are generally uniform with 1 min interval except for some stations in New Zealand with a 10 min interval. We employ a fourth-order Butterworth bandpass filter with a period band of between 2–150 min for the barometers with a 1 min sampling rate. The filtered data are used for wavelet analysis of barometer waveforms. However, we apply the bandpass filter between 30–150 min to display long-period waveforms in the barometer based on two reasons. (1) The barometer data we use for this analysis include some stations in New Zealand with a 10 min sampling rate. (2) Filtering out the short-period waves helps highlight long-period wave components associated with the tsunami event.
The tsunami waveforms recorded by DART buoys which are installed offshore in the deep water are expected to contain certain characteristics of the tsunami source (Wang et al., 2020, 2021). The waveforms recorded by tide gauge distributed along coastlines are significantly influenced by local bathymetry and topography, which are used for investigating the bathymetric effect on tsunami behaviours (Rabinovich et al., 2017, 2006; Rabinovich, 2009). Therefore, we use the DART buoy data for source-related analysis and choose some tide gauge data to investigate the tsunami behaviours at the Pacific coastlines.
2.2 Tsunami modelling
We use a numerical tsunami modelling package JAGURS (Baba et al., 2015) to simulate the tsunami propagation of the 2022 HTHH event and obtain the theoretical arrival time of a conventional tsunami based on the shallow-water wave speed (white contours in Fig. 1). The code solves linear Boussinesq-type equations in a spherical coordinate system using a finite-difference approximation with the leapfrog method. We specify a unit Gaussian-shaped vertical sea surface displacement at the volcanic base as the source of a conventional tsunami. For a unit source i with a centre at longitude φi and latitude θi, the displacement distribution Zi(φθ) can be expressed as
where we set characteristic length σ as 5 km (NASA, 2022). The bathymetric data are from the GEBCO 2019 with 15 arcsec resolution (General Bathymetric Chart of the Oceans, downloaded from https://www.gebco.net, last access: 1 April 2019).
2.3 Spectral analysis of tsunami waves
To investigate the temporal changes in the dominant wave periods, we conduct continuous wavelet transformation (frequency–time) analysis for some representative DART buoys, tide gauges, and barometers, in which a wavelet Morlet mother function is implemented (Kristeková et al., 2006). The first 32 h time series of DART buoys and barometers after the eruption (at 04:14:45 UTC on 15 January 2022) are used for source-related wavelet analysis. The first 48 h time series of tide gauges after the eruption are employed for hydrodynamics-related wavelet analysis at coastlines. We adopt the averaged root mean square (ARMS) method as a measure of absolute average tsunami amplitude with a moving time window of 20 min to calculate the tsunami duration (Heidarzadeh and Satake, 2014). We define the time durations as the time periods where ARMS levels of tsunami waves are above those prior to the tsunami arrivals.
3.1 The decreasing propagation velocities of the Lamb wave
Although many types of atmospheric waves were generated by the 2022 HTHH eruption, the most prominent signature was the Lamb waves which were globally observed by ground-based and spaceborne geophysical instrumentations (Kulichkov et al., 2022; Liu et al., 2022; Lin et al., 2022; Matoza et al., 2022; Themens et al., 2022; Adam, 2022; Kubota et al., 2022). Interestingly, we notice that a wide range of the velocities from 280 to 340 m s−1 were proposed through observations and Lamb wave modelling (e.g. Kubota et al., 2022; Lin et al., 2022; Matoza et al., 2022; Themens et al., 2022). The travelling velocity of Lamb waves in the real atmosphere is affected by temperature distributions, winds, and dissipation (Otsuka, 2022). To investigate whether the propagation speeds of the Lamb wave change in space and time, we analyse the waveforms recorded by the DART buoys in the Pacific Ocean. DART buoys with a pressure sensor deployed at the ocean's bottom record the sea level change that is transferred from pressure records in pascals, instead of direct water height. For the 2022 HTHH tsunami event, the pressure fluctuation at a DART buoy is a superposition of the pressure changes caused by tsunamis and the Lamb wave (Kubota et al., 2022). The Pacific DART buoys recorded the most discernible air–sea coupling pulse with Lamb waves in the deep ocean that arrived earlier than the conventional tsunami (Fig. 1). The tsunami waveforms recorded by tide gauges did not clearly detect the tsunami signals associated with the Lamb waves and therefore are not sufficient for further analysis (Fig. 2). Thus, we estimate the speed of Lamb waves using the waveforms recorded by the Pacific DART buoys. The Lamb wave arrivals are constrained within the arrival time range of possible velocities between 280–340 m s−1. The time points at which the tsunami amplitudes first exceed 1 × 10⁻⁴ m above sea level are defined as Lamb wave arrivals. Using different velocity values as constraints, we illustrate that the velocities of Lamb wave were generally uniform but slightly decrease with the increase in propagation distance (Fig. 3). The Lamb waves initially propagated radially at a speed of ∼ 340 m s−1 before slowing to ∼ 325 m s−1 after reaching ∼ 3400 km and further decreasing to ∼ 315 m s−1 at 7400 km. In an isothermal troposphere assumption, the phase velocity of the Lamb wave (CL) can be estimated with the following equation (Gossard and Hooke, 1975):
where γ=1.4 (air specific heat ratio corresponding to atmospheric temperature), R = 8314.36 J kmol−1 K−1 (the universal gas constant), and M = 28.966 kg kmol−1 (molecular mass for dry air) are constant for the air and T is the absolute temperature in kelvin. Thus, Lamb wave velocity is mainly affected by the air temperature, meaning the travelling velocity of Lamb waves might decrease when propagating from regions with high temperature towards those with low temperatures, e.g. the North Pole. By assuming a set of possible temperatures in January (Table 1), we calculate the velocities of CL could range between 312–343 m s−1 when temperatures vary between −30 and 20 ∘C. Therefore, the decreased velocity of the Lamb waves could be a consequence of cooling of the air temperature.
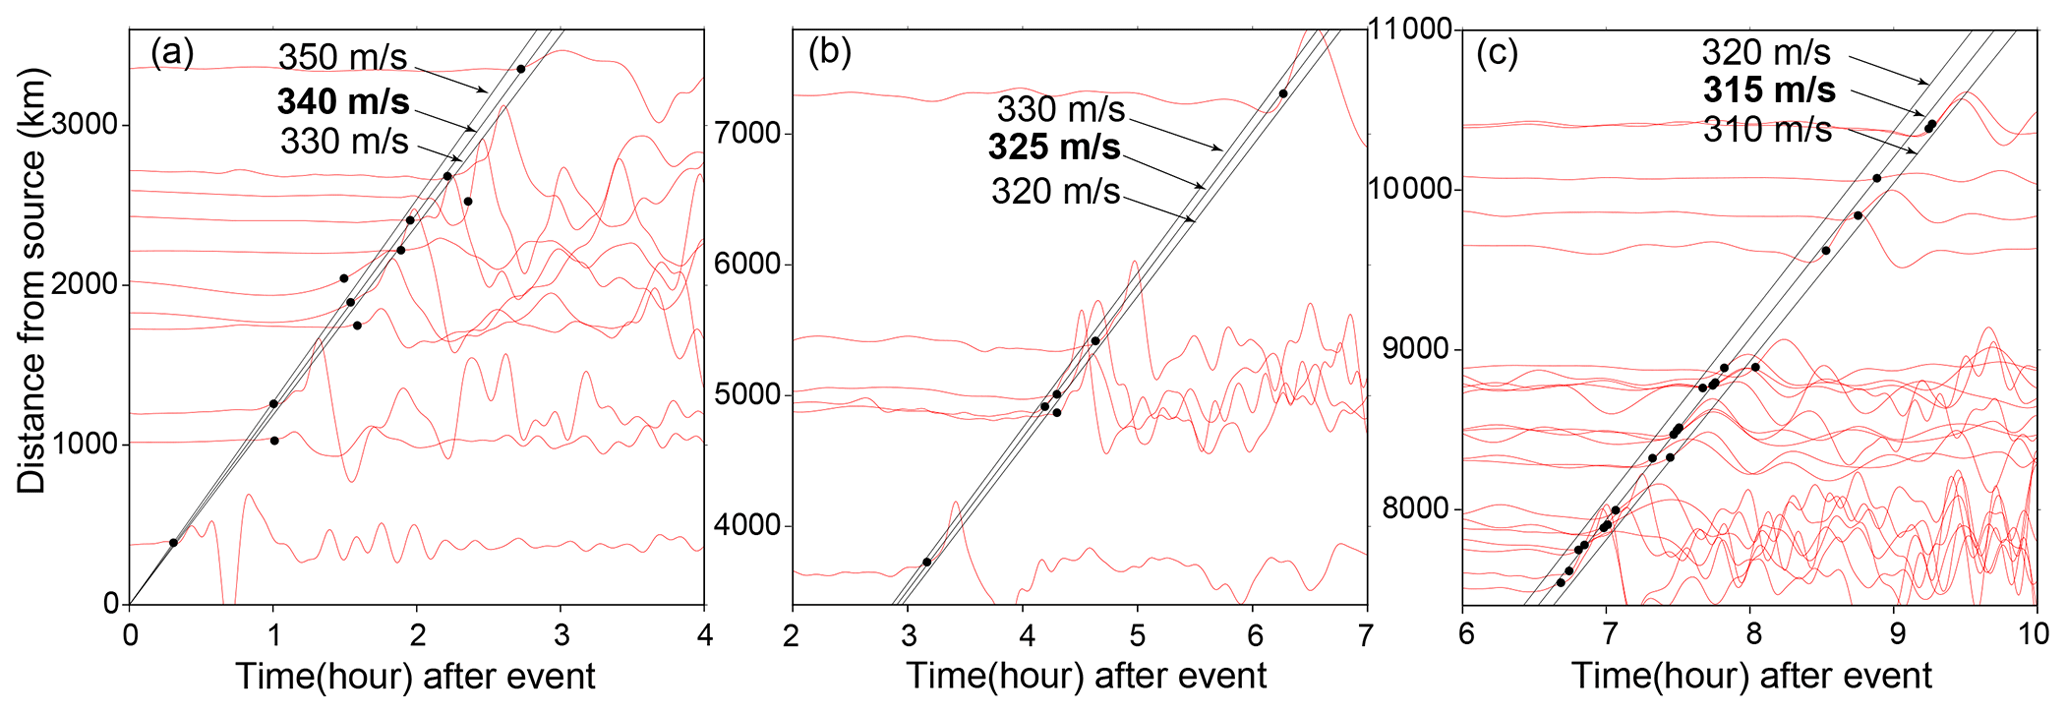
Figure 3Identifying the Lamb-wave-induced tsunami velocities using different constant velocities as constraints. Black dots mark the arrival times of the Lamb waves. Black lines represent different velocities.
Table 1Estimated Lamb wave velocities in an isothermal troposphere assumption.

3.2 Tsunami features observed by DART buoys and tide gauges
The statistics of tsunami heights and arrival times recorded at 38 DART buoys and 116 tide gauges across the Pacific Ocean are used to interpret the tsunami characteristics. The comparison of the statistical characters between DART and tide gauge observations yields some useful information regarding the hydrodynamic process of tsunami propagation and helps to identify tsunami wave components with different travelling velocities.
The average value of the maximum tsunami wave heights (trough to crest) of the 116 tide gauge stations is ∼ 1.2 m. Figure 4a shows tide gauges with large tsunami heights exceeding 2 m are mainly distributed in coastlines with complex geometries (Fig. S1a in the Supplement), such as gauges around New Zealand, Japan, and North and South America. For example, the largest tsunami height among tide gauges is 3.6 m at a bay-shaped coastal area, Chañaral in Chile (Fig. S1b). In sharp contrast to tide gauges, the maximum tsunami heights of most Pacific DART buoys are less than 0.2 m. The largest tsunami height in the DART buoys is only ∼ 0.4 m recorded at the nearest one, 375 km from the volcano (Fig. 4b). The comparison between DART buoys and tide gauges indicates that the direct contribution of air–sea coupling to the tsunami heights is probably on a level of tens of centimetres (Kubota et al., 2022). The metre-scale tsunami heights at the coastlines suggest the bathymetric effect could play a major role during tsunami propagation. In respect to the arrival of maximum tsunami waves, the time lags between Lamb wave-induced tsunamis, and the maximum heights of tide gauges mainly range between ∼ 0–10 h (Fig. 4c). The delayed times of ∼ 10 h are observed in New Zealand, Hawaii, and the west coast of the Americas (Fig. 4c), suggesting the interaction between tsunami waves and local topography/bathymetry delays the arrival of the maximum waves (e.g. Hu et al., 2022). For example, the delayed maximum tsunami height can be attributed to the edge waves (Satake et al., 2020) and resonance effect (Wang et al., 2021) from tsunami interplay with harbours/bays, islands, and continental shelves of various sizes. The significant regional dependence of the coastal tsunami heights and the time lags of the maximum tsunami waves can be attributed to the complexity of local bathymetry, such as continental shelves with different slopes and harbours/bays with different shapes and sizes (Satake et al., 2020). On the other hand, for tsunami events with earthquake origins (e.g. Heidarzadeh and Satake, 2013), the first waves recorded by DART buoys are normally observed as the largest wave since DART buoys are located in the deep ocean and less influenced by bathymetric variation. In the case of the Tonga tsunami event, we observe the inconsistency between the arrivals of the Lamb wave-induced tsunami waves and the maximum tsunami heights (Fig. 4d). The time lags of the maximum waves of DART buoys present a coarsely increasing tendency with the increasing distance from the eruption site, which indicates the contribution of another tsunami generation mechanism propagating with a uniform but lower speed than the Lamb wave.
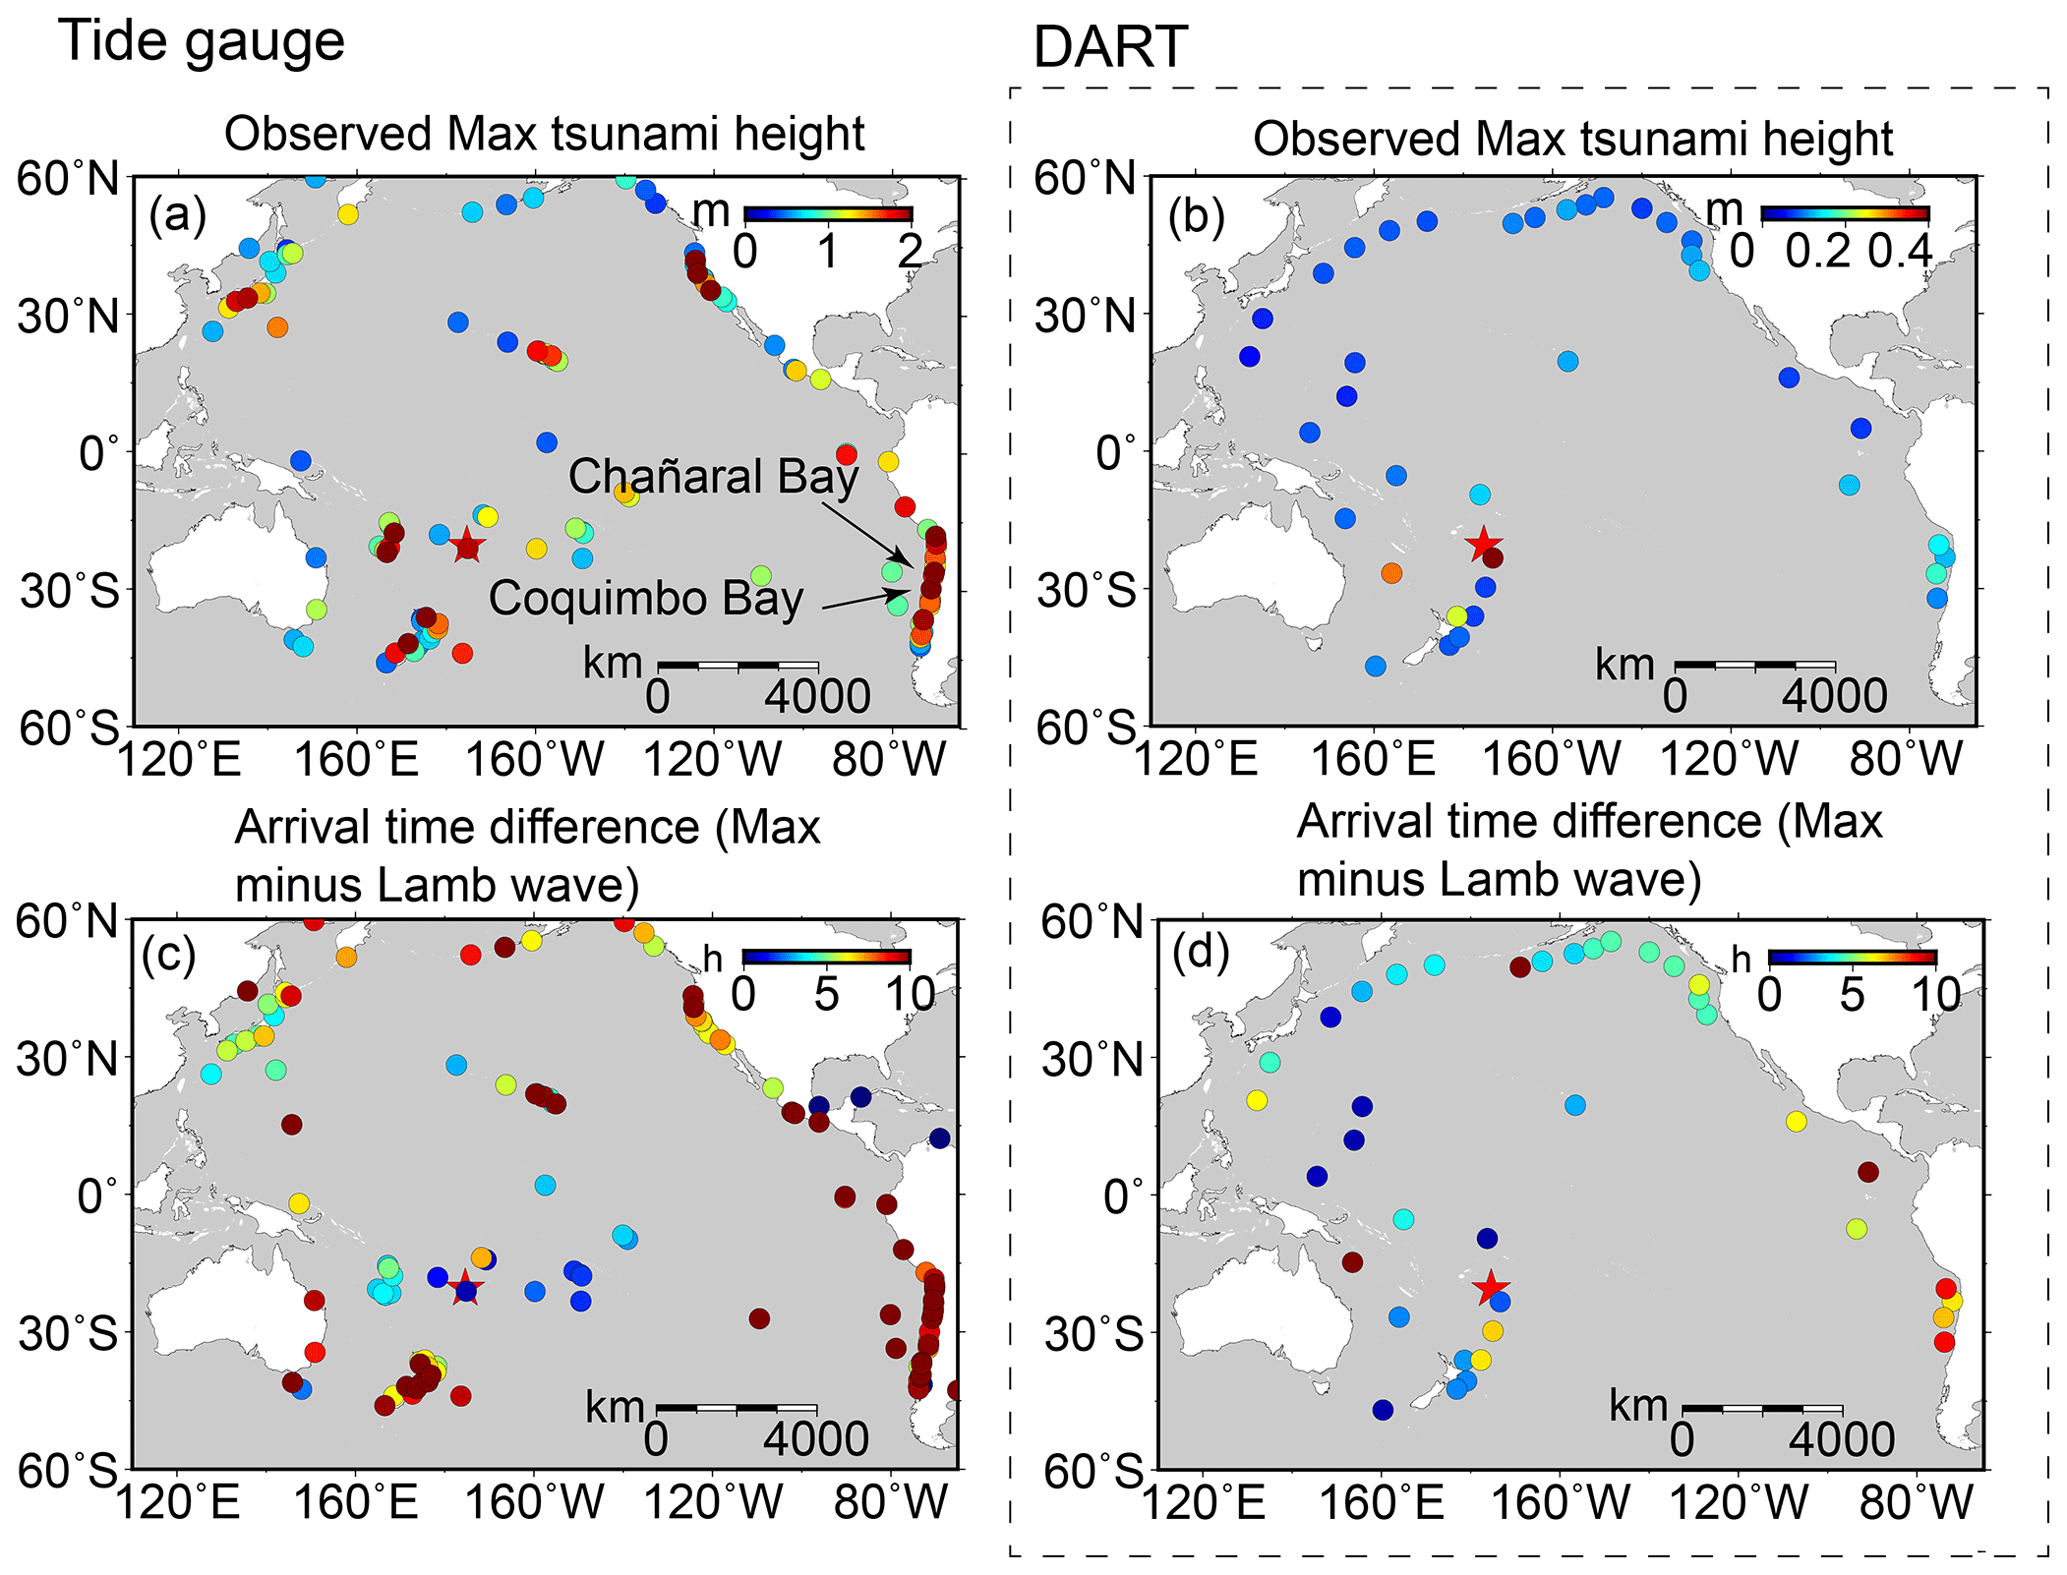
Figure 4The spatiotemporal signatures of the 2022 HTHH tsunami across the Pacific Ocean. (a) Observed maximum tsunami height (trough-to-crest height) of tide gauges. (c) Arrival differences between the maximum tsunami height of tide gauges and Lamb waves. Panels (b) and (d) are the same as (a) and (c) but for DART buoys.
3.3 Tsunami components identified from wavelet analysis
The statistical analysis of tsunami waveforms at tide gauges and DART buoys suggest the tsunami waves likely contain several components with different source origins. To further identify these tsunami components, we conduct wavelet analysis for tsunami waveforms recorded by representative DART buoys and air pressure waveforms recorded by selected barometers. We demonstrate the analysis result through the frequency–time (f–t) plot of wavelet which shows how energy and period vary at frequency and time bands (Figs. 5 and 6). Tsunami components have clear signatures in all f–t plots as the energy levels are quite large when they arrive. Figure 5 shows the wavelet analysis of six DART buoys located in vicinity of the eruption site (< 3664 km). Figure 6 shows the wavelet analysis of 10 DART buoys distributed in the Pacific rim which are far away from the source location. We observe three interesting phenomena: (1) most of the tsunami wave energy is concentrated in four major period bands, i.e. 3–5, ∼ 10–30, ∼ 30–40, and ∼ 80–100 min; (2) the significant tsunami component with a period band of 3–5 min is recorded by stations between the eruption site and the north tip of New Zealand; and (3) there exists one exceptional tsunami component with a longer wave period of ∼ 80–100 min mainly recorded in Tonga, New Zealand, and Hawaii, which travels even faster than the Lamb waves.
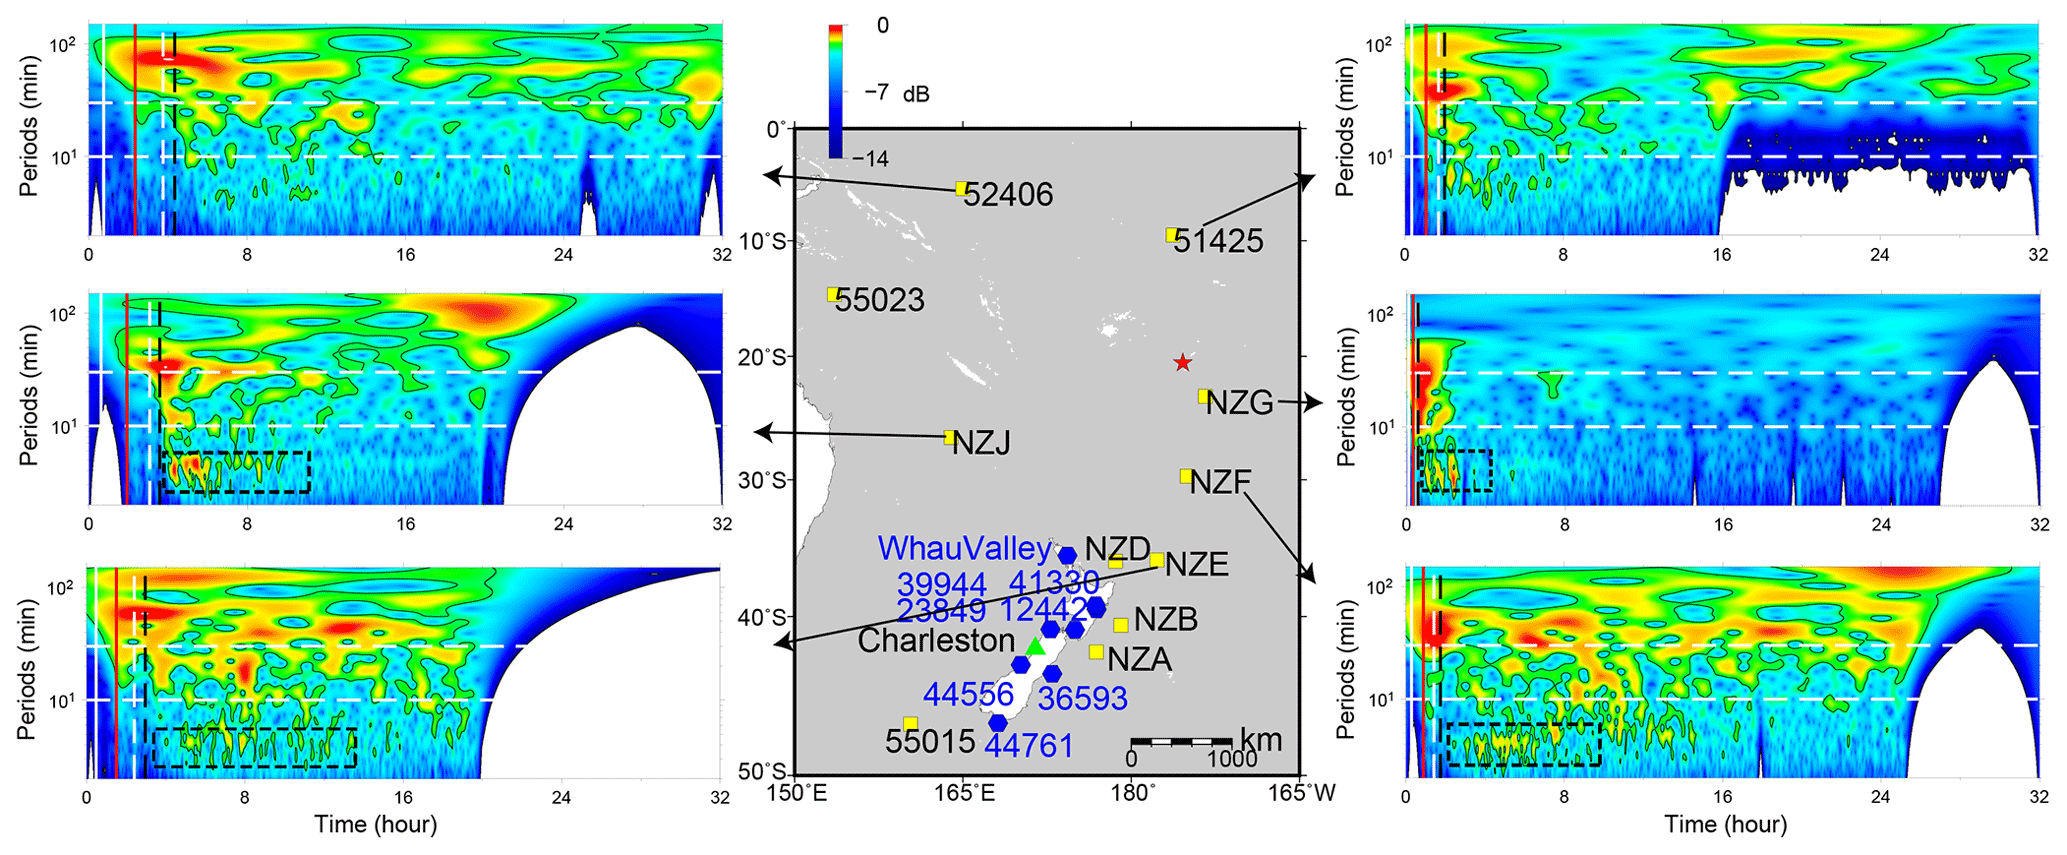
Figure 5Wavelet analysis of representative DART buoys in vicinity of the HTHH volcano. In each subplot, the solid vertical white lines mark the arrival time with a travelling velocity of 1000 m s−1. The solid vertical red lines mark the arrivals of Lamb waves. The dashed vertical white lines mark the lower limit of AGWs' velocity of 200 m s−1 (Kubota et al., 2022). The dashed vertical black lines represent the theoretical tsunami arrivals. The dashed horizontal white lines mark two reference wave periods of 10 and 30 min. The blue hexagons represent the locations of barometers. The green triangle marks the location of the tide gauges at Charleston. The decibel (dB) metric is calculated as dB = , where A is wavelet power and A0 is a reference wavelet power of the maximum one (Thomson and Emery, 2014).
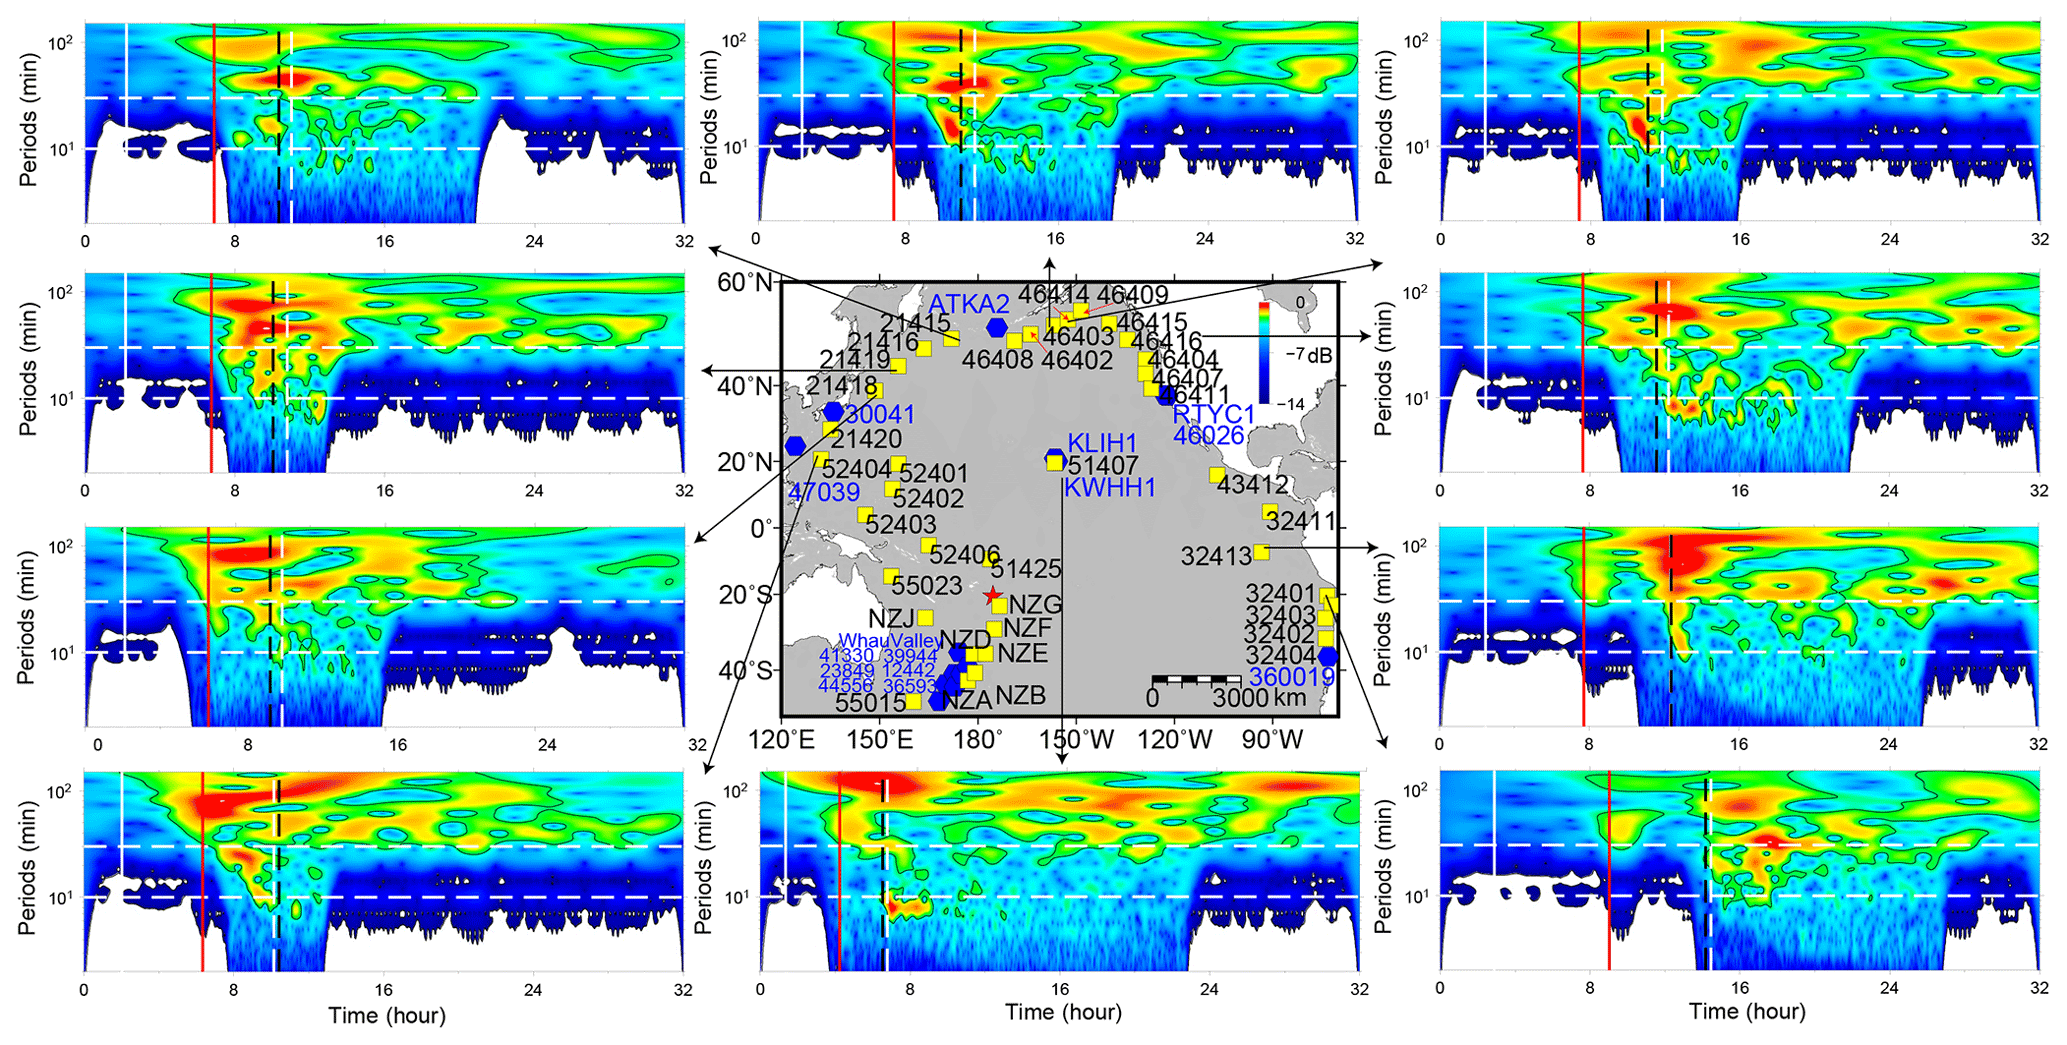
Figure 6Wavelet analysis of representative DART buoys far away from the HTHH volcano. In each subplot, the solid vertical white lines mark the arrival time with a travelling velocity of 1000 m s−1. The solid vertical red lines mark the arrivals of Lamb waves. The dashed vertical white lines mark the lower limit of AGWs' velocity of 200 m s−1. The dashed vertical black lines represent the theoretical tsunami arrivals. The dashed horizontal white lines mark two reference wave periods of 10 and 30 min. The blue hexagons represent the locations of barometers.
To further explore the source mechanism of these tsunami components, we take advantage of the published information related to different propagating velocities of atmospheric gravity waves (Kubota et al., 2022) and add four kinds of propagating velocities as criteria to differentiate the tsunami arrivals from different sources (Figs. 5 and 6). The first reference speed is 1000 m s−1 related to the radically propagating atmospheric shock waves near the source region (Matoza et al., 2022; Themens et al., 2022). The second one is the velocities of the Lamb wave ranging between 315–340 m s−1 derived from the aforementioned results in Sect. 3.1 (Fig. 3). The third one is 200 m s−1 corresponding to the lower limit of atmospheric-gravity-wave modes other than Lamb waves also excited by the volcanic eruptions (Kubota et al., 2022). The last is the arrival time of conventional tsunamis given by tsunami modelling (Fig. 1). The theoretical velocity of conventional tsunamis is significantly nonuniform spatially as compared with those of the atmospheric waves. The conventional tsunami propagation speed is determined by the water depth along the propagation route. The velocity of non-dispersion shallow-water waves (CH) in the ocean is given by
where g is gravity acceleration (9.81 m s−2) and H is the water depth. The propagation velocities of tsunamis are ∼ 296–328 m s−1 in the deepest trenches on earth (i.e. ∼ 11 km in the Mariana Trench and ∼ 9 km in the Tonga Trench). The velocities decrease quickly to only ∼ 44 m s−1 at ∼ 200 m depth along the edge of the continental shelf. With an average depth of ∼ 4–5 km, the average velocities in the Pacific Ocean range between ∼ 200–224 m s−1. Thus, conventional tsunami velocities present significant slowness and variability. We delineate the arrival times of the four reference speeds in Figs. 5 and 6.
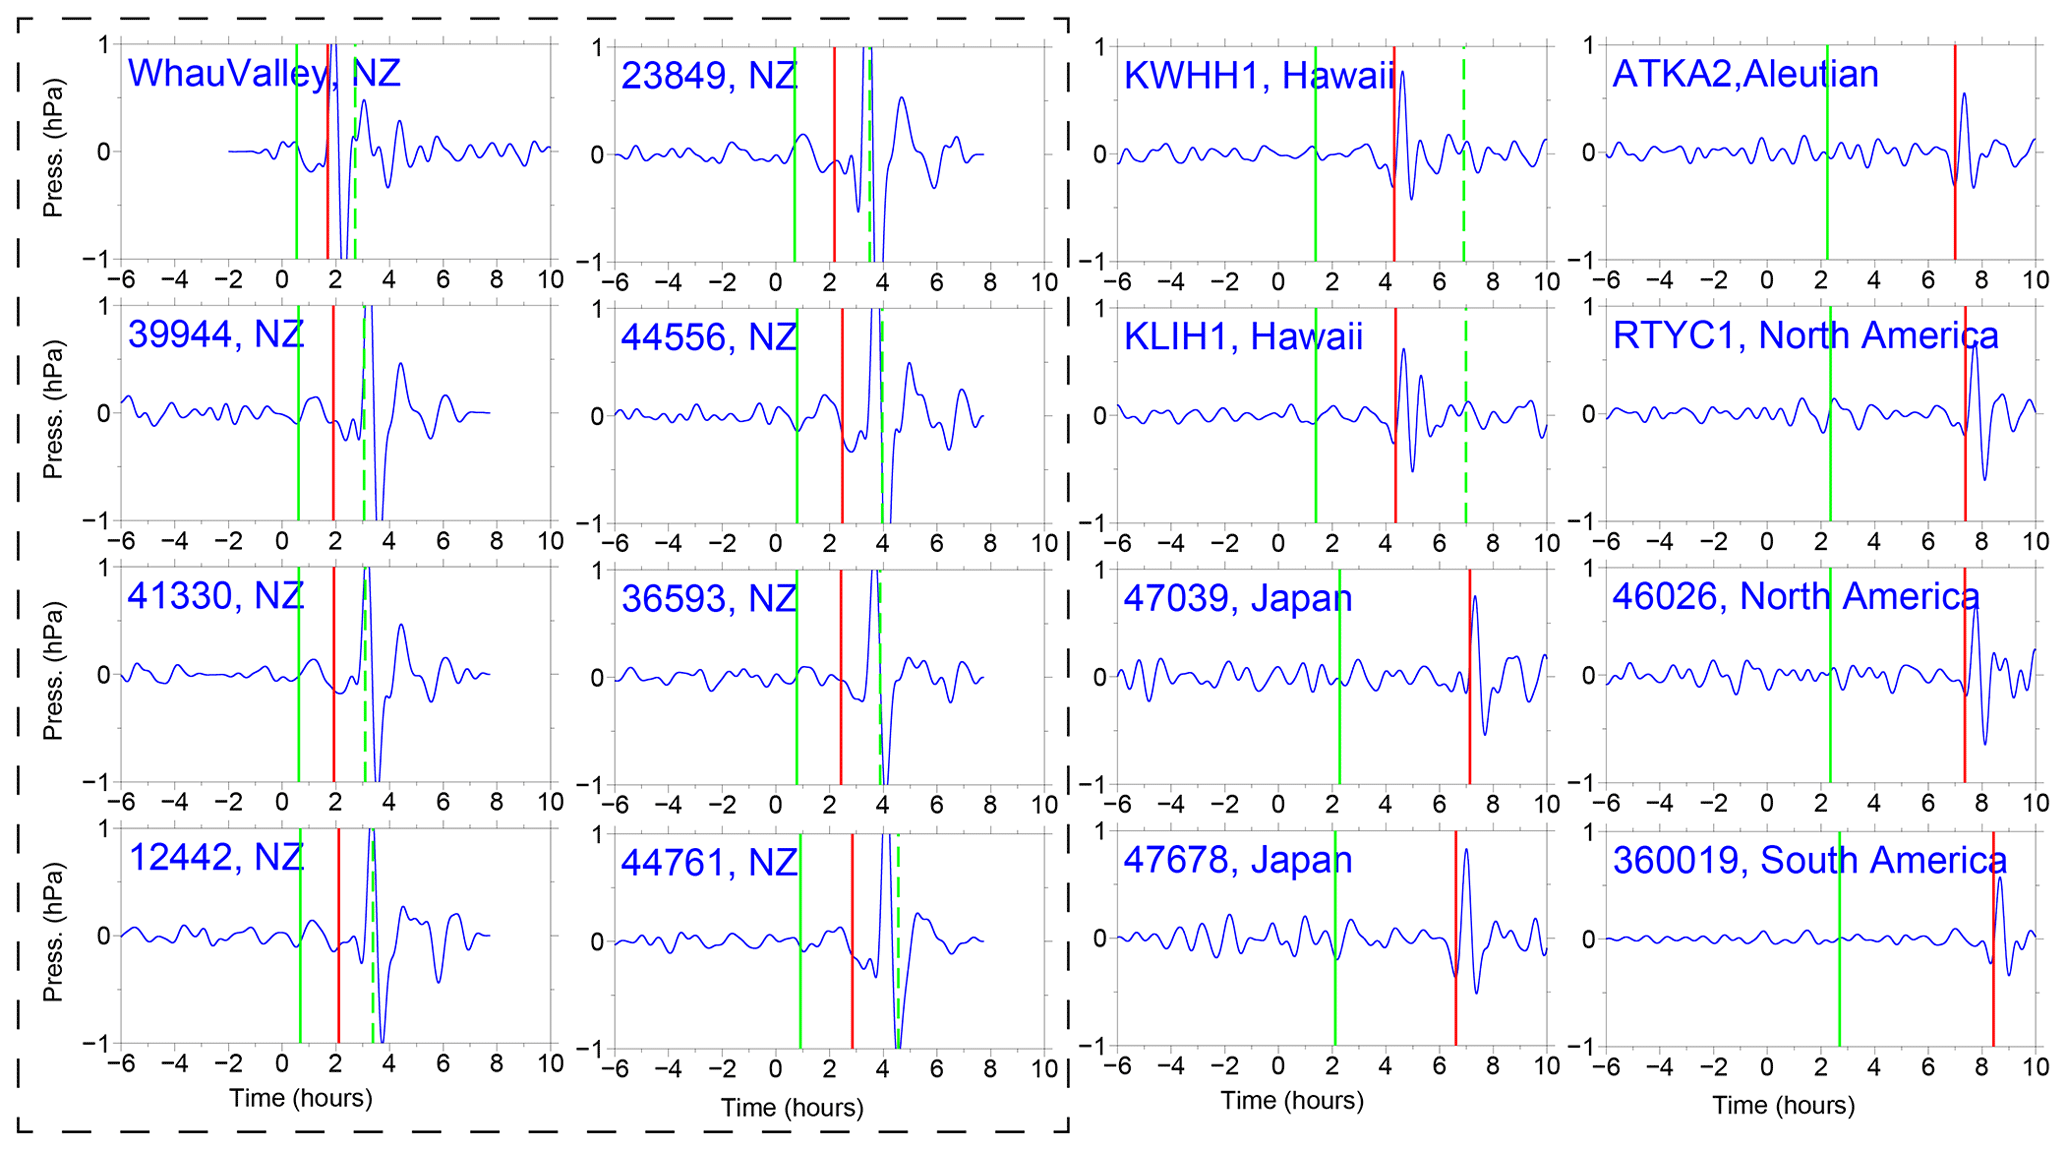
Figure 7Shock-wave-related atmospheric pressure waveforms of selected barometers in the Pacific Ocean. All traces have been filtered between 30 and 150 min. In each subplot, the solid vertical green lines mark the arrival time with a travelling velocity of 1000 m s−1. The solid vertical red lines mark the arrivals of Lamb waves. The dashed vertical green lines mark the lower limit of AGWs' velocity of 200 m s−1.

Figure 8Wavelet analysis of some representative barometers. In each subplot, the solid vertical white lines mark the arrival time with travelling velocity of 1000 m s−1. The solid vertical red lines mark the arrivals of Lamb waves. The dashed vertical white lines mark the lower limit of AGWs' velocity of 200 m s−1. The dashed horizontal white lines mark three reference periods of 10 and 30 min.
One particularly remarkable phenomenon is that the wave component with an ∼ 80–100 min period propagated at a very fast speed of ∼ 1000 m s−1 in the vicinity of the HTHH site, i.e. New Zealand and Hawaii (e.g. stations 52406, NZJ, NZE, and 51425 in Fig. 5; 51407 in Fig. 6). We infer that the tsunami component within the ∼ 80–100 min period band was likely produced by the atmospheric shock waves during the initial stage of the volcanic eruption and spatially only covers the near-source region. To verify this observation, we select 16 representative barometers located in the near-source region and far-field area for wavelet analysis (see the locations in Figs. 5 and 6). Figure 7 shows the waveforms of long-period atmospheric pressure waves at selected locations. Figure 8 provides the frequency–time (f–t) plot of wavelet analysis for some representative barometers. Interestingly, we are able to discern the air pressure pulses prior to Lamb waves at barometers in New Zealand (the two columns on the left in Fig. 7), although such signals are not detectable in the barometers far from the source (the two columns on the right in Fig. 7). The spatial distribution of such unusual pressure changes suggests that the fast-travelling shock waves were only limited in the near-source region, as reflected in the travelling ionospheric disturbances (Matoza et al., 2022; Themens et al., 2022). Additionally, we also see that the long-period signals of ∼ 80–100 min appear in DART buoys far away from the eruption site. Such signals may be related to the long-period gravity waves (Matoza et al., 2022).
The tsunami components with period band of ∼ 30–40 min can be readily associated with Lamb waves because the arrival times of the tsunami components and Lamb waves have an excellent match, as shown in the tsunami data recorded by DART buoys (e.g. NZJ and 51425 in Fig. 5; 51407, 32401, and 32413 in Fig. 6) and pressure data by barometers (Fig. 8).
For the tsunami components with the period band of ∼ 10–30 min, although the arrivals of ∼ 10–30 min tsunami components cover some conventional tsunami arrival times, they do not consistently match. The tsunami components that mainly occur within the velocity range between Lamb waves and the lower gravity waves' velocities have a good agreement with the velocity range of several atmospheric-gravity-wave modes (Matoza et al., 2022; Themens et al., 2022; Kubota et al., 2022). Similarly, the air pressure data also show energy peaks at the ∼ 10–30 min period band, which is consistent with the tsunami data (Fig. 8). Such consistency further verifies the contribution of atmospheric gravity waves to the volcanic tsunami.
The tsunami components with the shortest period of ∼ 3–5 min (stations NZE, NZF, NZG, and NZJ; marked with black dashed squares in Fig. 5) are only observed at DART records near the eruption location. Meanwhile, the arrival times of these components agree well with the modelled arrivals of conventional tsunamis. Thus, we believe the observed shortest period band should originate from the seafloor crustal deformation. We further infer that this component could be generated by the partial underwater caldera collapse and/or subaerial/submarine landslide failures associated with the 2022 HTHH volcanic eruption.
4.1 Tsunami from caldera collapse and its long-distance travelling capability
The tsunami wave energy distributed in different period bands is identified with reference arrival times. The tsunami component with a 3–5 min period is most likely generated by seafloor crustal deformation in the volcanic site, but the specific mechanism is not determined. A variety of possible scenarios associated with the eruption could be responsible for the near-field tsunami waves, such as volcanic earthquakes, pyroclastic flows entering the sea, underwater caldera flank collapse, and subaerial/submarine failures (Self and Rampino, 1981; Pelinovsky et al., 2005). To further investigate the source mechanism, we apply a simplified model (Rabinovich, 1997) to estimate the probable dimension of the tsunami source:
where L is the typical dimension (length or width) of the tsunami source, H is the average water depth in the source area, g is the gravity acceleration, and T is the primary tsunami period. By comparing with the post-2015 morphology of the HTHH caldera which was obtained through drone photogrammetry and multibeam sounder surveys, Stern et al. (2022) estimate that much of the newly formed island of Hunga Tonga and the 2014–2015 cone were destroyed by the 2022 eruption and the vertical deformation of the island of Hunga Ha'apai is ∼ 10–15 m (Stern et al., 2022). With no more quantitative constraint of the seafloor deformation, we tentatively assume H as 10–15 m, and then the possible dimension of seafloor crustal deformation responsible for the small-scale tsunami could be in the scale of 0.8–1.8 km (Fig. 9a). The estimated size is very likely from partial caldera collapse that usually has limited scale in a volcanic site (Ramalho et al., 2015; Omira et al., 2022). If this is the case, the partial flank collapse could be located between the islands of Hunga Tonga and Hunga Ha'apai.

Figure 9Mechanism of the tsunami component with a 3–5 min period. (a) The source dimension estimated by Eq. (4). (b) Wavelet analysis of tide gauge at Charleston, New Zealand, 2680 km away from the eruption site. The solid vertical white line marks the arrival time with a travelling velocity of 1000 m s−1. The solid vertical red line marks the arrival of the Lamb wave. The dashed vertical white line marks the lower limit of AGWs' velocity of 200 m s−1. The dashed vertical black line marks the theoretical tsunami arrivals.
An interesting phenomenon is that the tsunami component with a 3–5 min period can still be observed in a bay-shaped coastal area at Charleston in New Zealand (see the location in Fig. 5), which is 2680 km away from the eruption site and maintains a high energy level lasting up to 14 h (Fig. 9b). The long travelling capability could be associated with the ∼ 10 000 m deep water depth of the Tonga Trench that keeps the source signals from substantial attenuation. In the deep open ocean, the wavelength of a tsunami can reach 200 km, but the height of the tsunami may be only a few centimetres. Tsunami waves in the deep ocean can travel thousands of kilometres at high speeds, meanwhile losing very little energy in the process. The long oscillation can be attributed to the multiple reflections of the incoming waves trapped in the shallow-water bay at Charleston.
Generally, devastating tsunamis with a long-distance travelling capability are mostly generated by megathrust earthquakes (Titov et al., 2005). Caldera collapses or submarine landslides with a limited scale normally only generate local tsunamis, e.g. the 1998 PNG (Papua New Guinea) tsunami event (Kawata et al., 1999) and the 1930 Cabo Girão tsunami event (Ramalho et al., 2015). Therefore, it is exceptional that the tsunami component from scale-limited failure could travel at least 2680 km away from the eruption site. This demonstrates that tsunamis from a small-scale tsunamigenic source have the capability of travelling long distances and causing long oscillation at favoured conditions, e.g. deep trench, ocean ridge, and bay-shaped coasts.
4.2 The possible mechanisms of long tsunami oscillation
An important tsunami behaviour of the 2022 HTHH tsunami is the long-lasting oscillation of ∼ 3 d in the Pacific Ocean (Fig. 10a), which is comparable to that of the 2011 Tohoku tsunami of ∼ 4 d (Heidarzadeh and Satake, 2013). We demonstrate the duration time of the tsunami oscillation through an ARMS (averaged root mean square) approach that is a measure of the absolute average tsunami amplitude within a time period. The long-lasting tsunami energy can be observed at many regions, such as the coasts of New Zealand, Japan, the Aleutian Islands, Chile, Hawaii, and the west coast of the Americas. Several mechanisms could account for the long-lasting tsunami, including (1) Lamb waves circling the earth multiple times (Amores et al., 2022; Matoza et al., 2022), (2) the resonance effect between ocean waves and atmospheric waves (Kubota et al., 2022), and (3) the bathymetric effect. We discuss the contribution of each mechanism in the following section.
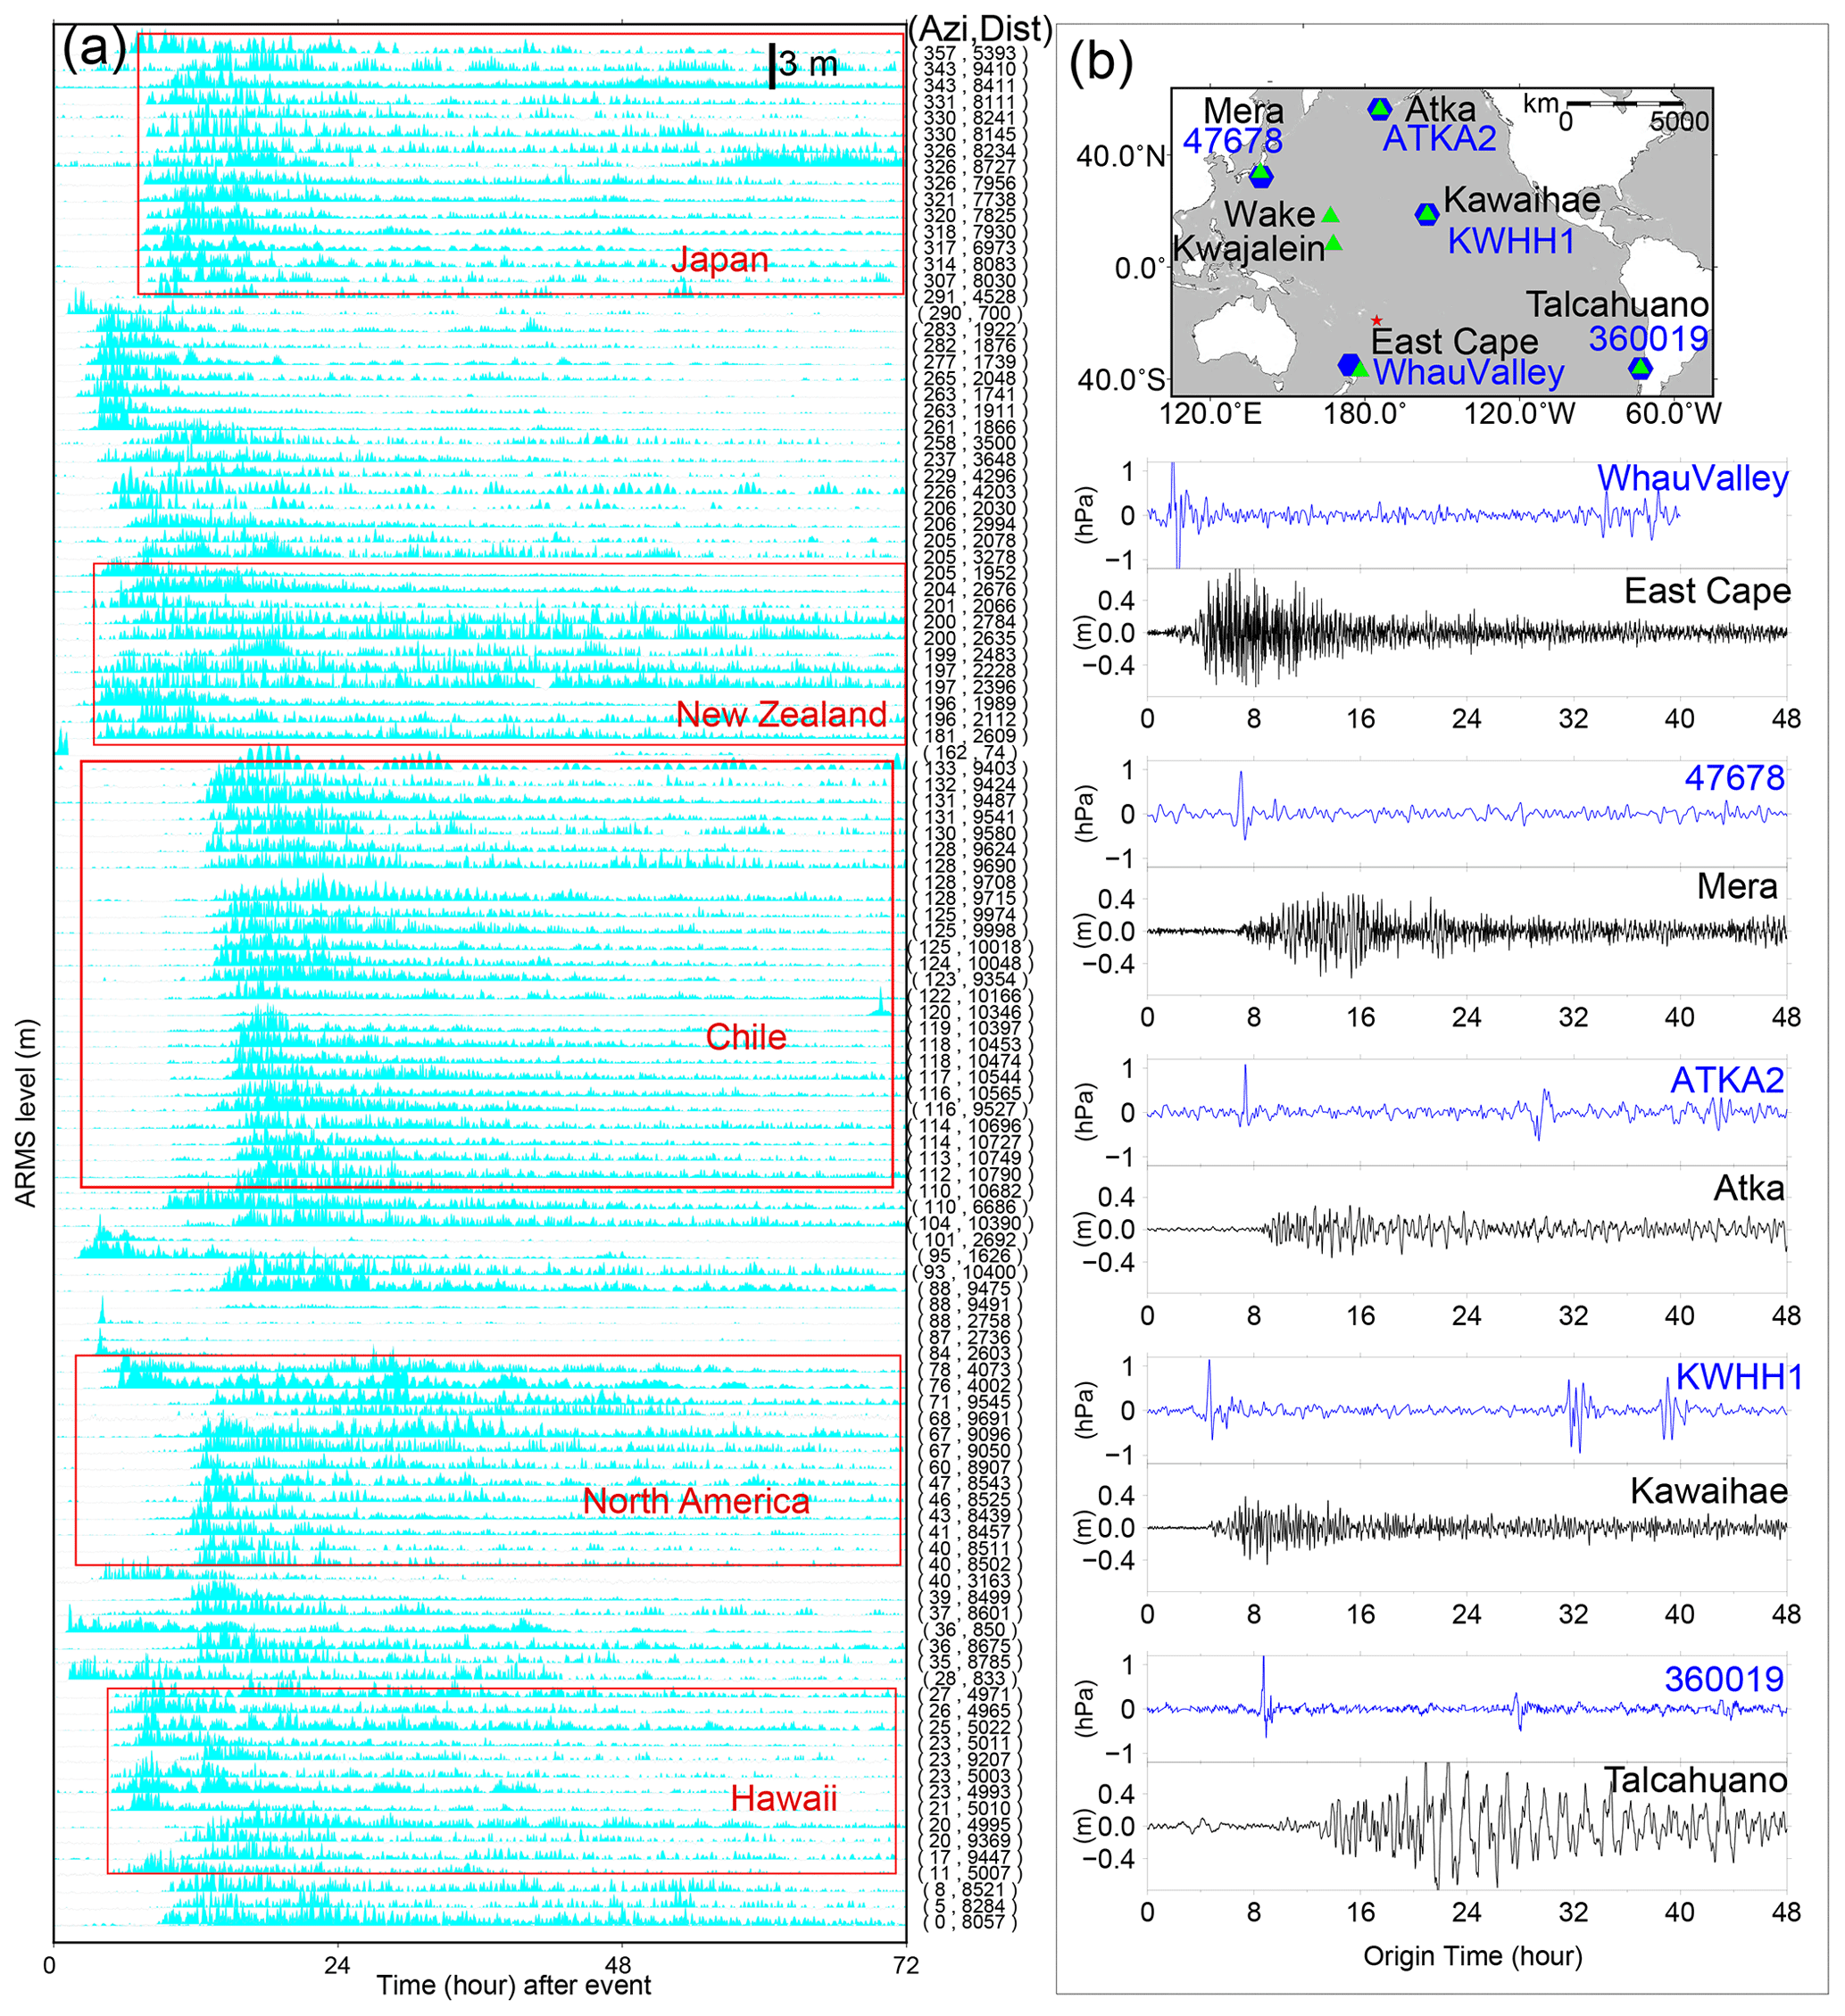
Figure 10Tsunami duration. (a) Tsunami durations at 116 Pacific tide gauges through the ARMS level approach. (b) The location of barographs (blue hexagons) and nearby tide gauges (green triangles), as well as their waveforms.
To investigate the contribution of Lamb waves to the long-lasting tsunami, we compare the air pressure disturbances recorded by selected barometers together with the tsunami waveforms of nearby tide gauges (Fig. 10b). While the barometers present discernible wave pulses at each Lamb wave's arrival, only the first Lamb wave triggered a clear tsunami signal and no detectable tsunami signatures correspond to the following passage, suggesting the Lamb waves do not directly contribute to the long oscillation.
The resonance effects between ocean waves and atmospheric waves could contribute to the long oscillation on coastlines. Besides the Lamb wave, Watanabe et al. (2022) detected internal Pekeris waves which propagate with a slower horizonal phase speed of ∼ 245 m s−1 and gravity waves with an even slower propagation speed by analysing radiance observations taken from the Himawari-8 geostationary satellite. Atmospheric waves with such speeds are more likely to be resonant with the conventional tsunami waves and provide continuous energy supply (Kubota et al., 2022).
To examine the role of local bathymetry in the long-lasting tsunami, we choose a well-studied and well-recorded event, the 2011 Mw 9.0 Tohoku tsunami, as a reference event and compare the tsunami records of these two events at the same coastal stations. Although the two tsunami events were generated by completely different mechanisms, i.e. large-scale seafloor deformation for the Mw 9.0 megathrust earthquake (Mori et al., 2011) and fast-moving atmospheric waves for the Mw 5.8 volcanic eruption (Matoza et al., 2022), they both produced widespread transoceanic tsunamis which were recorded well in the Pacific DART buoys and tide gauges. In the near field, the 2011 Tohoku earthquake produced a runup of up to 40 m at Miyako in the Iwate Prefecture in Japan's Tohoku region (Mori et al., 2011). The epicentre is approximately 70 km east of the coast of the Oshika Peninsula of the Tohoku region. However, the 2022 HTHH tsunami produced only ∼ 13 m runup in the near field from eyewitness accounts in Kanokupolu, 60 km from the volcano (Lynett et al., 2022). However, in the far field (> 1000 km), we observe comparable tsunami wave heights in certain coastal regions. Based on the tsunami records at 21 tide gauges surrounding the Pacific Ocean, Heidarzadeh and Satake (2013) calculated the average value of the maximum tsunami heights (trough to crest) of the 2011 Tohoku tsunami is 1.6 m, with the largest height of 3.9 m at Coquimbo Bay in Chile (Heidarzadeh and Satake, 2013). Coincidently, the statistics of 116 tide gauges in this study also suggest the average tsunami heights of the 2022 HTHH tsunami are around the same order, ∼ 1.2 m, among which the largest height is 3.6 m at Chañaral Bay in Chile. Interestingly, in the coastal region of South America, the locations of the largest tsunami heights of both events are adjacent (Fig. 4a), i.e. Coquimbo (2011 Tohoku tsunami) and Chañaral (2022 HTHH tsunami).

Figure 11Wavelet analysis of tsunami waveforms recorded by four tide gauges during (a) the 2022 HTHH tsunami event and (b) the 2011 Tohoku tsunami event. Horizontal white dashed lines, respectively, mark reference periods of 10 and 30 min.
To further compare the far-field hydrodynamic processes between these two events quantitatively, we conduct wavelet analysis for four representative tide gauges distributed across the Pacific Ocean, i.e. coastal gauges at East Cape in New Zealand, Kwajalein Island, Wake Island, and Talcahuano in Chile (see their locations in Fig. 10b). The temporal changes in tsunami energy of both events can be seen in Fig. 11. At each tide gauge, the tsunami energy of the 2011 HTHH (Fig. 11a) and the 2022 Tohoku tsunamis (Fig. 11b) for the first few hours after the arrivals is nonuniform with different significant peaks distributed within a wide period band of ∼ 3–100 min. Then, the following long-lasting energy of both at each station presents a similar pattern and is concentrated in an identical and fairly narrower period channel, i.e. ∼ 20–30 min at East Cape in New Zealand, ∼ 40–60 min at Kwajalein Island, ∼ 10 min at Wake Island, and ∼ 100 min at Talcahuano in Chile, which reflects the local bathymetric effects of natural permanent oscillations (Hu et al., 2022; Satake et al., 2020). Specifically, many bathymetric effects can contribute to the long-lasting tsunami, such as multiple reflections across the basins or the continental shelves and the excited tsunami resonance in harbours/bays with variable shapes and sizes (Aranguiz et al., 2019; Satake et al., 2020). For example, tide gauges around New Zealand are primarily distributed in harbours/ports with major natural oscillation modes of ∼ 20–30 min (De Lange and Healy, 1986; Lynett et al., 2022). The first oscillation mode of central Chile is centred around ∼ 100 min (Aranguiz et al., 2019). Consequently, Fig. 11 illustrates that the long-lasting tsunami energy of the two events is, respectively, distributed in a 20–30 min period at East Cape in New Zealand and in a ∼ 100 min period at Talcahuano in central Chile. The coupling of the bathymetric oscillation mode with a tsunami containing similar-period wave results in the excitement of tsunami resonance, which amplifies tsunami waves and prolongs the tsunami oscillation at the two stations (Hu et al., 2022).
Simply put, we do not have clear evidence that atmospheric acoustic-gravity waves from the 2022 HTHH eruption directly contribute to the long-lasting tsunami, but the resonance effect associated with ocean waves could be a possible source of increased wave energy and amplification. However, the similarity of far-filed hydrodynamic behaviours between the 2022 HTHH volcanic tsunami and the 2011 Tohoku seismogenic tsunami demonstrates well that both went through similar hydrodynamic processes after their arrivals. The consistency shows that the long-lasting 2022 HTHH tsunami event can very likely be attributed by the interplay between local bathymetry and conventional tsunami left after each passage of atmospheric waves, which can explain why the two completely distinct tsunami events possess a comparable duration time well.
4.3 Challenges for tsunami warning
The generation mechanisms and hydrodynamic characteristics of the 2022 HTHH volcanic tsunami are more complicated than a purely seismogenic tsunami, which challenges the traditional tsunami warning approach.
The first challenge is posed by the tsunami components with propagating velocities faster than the conventional tsunami. The Tonga volcanic tsunami event provides an excellent example which highlights that the tsunamigenic mechanisms not only are limited to tectonic activities related to the sudden seafloor displacements but also include a variety of atmospheric waves with distinct propagation velocities. The tsunami components in the 2022 HTHH event generated by the air–sea coupling possess a wide range of velocities from 1000 to 200 m s−1. The Lamb waves recorded in both the 2022 HTHH event and the 1833 Krakatoa volcanic event travelled along the earth's surface globally several times (Carvajal et al., 2022). The tsunami waves produced by Lamb waves, the wave components associated with resonance of the air–sea coupling, and their superimposition increase the difficulty of tsunami warning.
Another critical challenge is associated with the interplay between tsunami waves and local bathymetry. The tsunami waves left by each passage of the atmospheric waves can interact with local bathymetry at coastlines, such as continental shelves with different slopes and harbours/bays with different shapes and sizes. The interaction can intensify the tsunami impact and excite a variety of natural oscillation periods. The 2022 HTHH tsunami with an extremely wide period range of ∼ 2–100 min has a great potential to couple with the excited natural oscillations and form extensive tsunami resonance phenomena. The resonance effects result in long-lasting oscillation and delayed tsunami wave peaks. The uncertain arrivals of the maximum tsunami waves pose an extra challenge to tsunami warning.
In the study, we explore the tsunamigenic mechanisms and the hydrodynamic characteristics of the 2022 HTHH volcanic tsunami event. Through extensive analysis of waveforms recorded by the DART buoys, tide gauges, and barometers in the Pacific Ocean, we reach the main findings as follows:
-
We identify four distinct tsunami wave components based on their distinct propagation velocities or period bands (∼ 80–100, 10–30, 30–40, and 3–5 min). The generation mechanisms of these tsunami components range from air–sea coupling to seafloor crustal deformation during the volcanic eruption.
-
The first-arriving tsunami component with an 80–100 min period was most likely from a shock wave spreading at a velocity of ∼ 1000 m s−1 in the vicinity of the eruption. This tsunami component was not clearly identified by currently available publication, and it is not easy to be visually observed through time series of the waveforms. The physical mechanism is yet to be understood. The second tsunami component with a 30–40 min period was from Lamb waves and was the most discussed tsunami source of this event so far. A thorough analysis of DART measurements indicates that the Lamb waves travelled at the speed of ∼ 340 m s−1 in the vicinity of the eruption and decreased to ∼ 315 m s−1 when travelling away due to cooling of the air temperature. The third tsunami component was from some atmospheric-gravity-wave modes with a propagation velocity faster than 200 m s−1 but slower than Lamb waves. The last tsunami component with the shortest periods of 3–5 min was probably produced by a partial caldera collapse with an estimated dimension of ∼ 0.8–1.8 km.
-
Although the resonance effect with the atmospheric acoustic-gravity waves could be a source of increased wave energy, its direct contribution to the long-lasting oscillation is not yet demonstrated. However, the comparison of hydrodynamical characteristics between the 2022 HTHH tsunami event and the 2011 Tohoku tsunami event demonstrated well that the interactions between the ocean waves left by atmospheric waves and local bathymetry contribute to the long-lasting Pacific oscillation of the 2022 tsunami event.
-
The extraordinary features of this rare volcanic tsunami event challenge the current tsunami warning system which is mainly designed for seismogenic tsunamis. It is necessary to improve the awareness of people at risk about the potential tsunami hazards associated with volcanic eruptions. New approaches are expected to be developed for tsunami hazard assessments with these unusual sources: various atmospheric waves radiated by volcanic eruptions besides those traditionally recognized, e.g. earthquakes, landslides, caldera collapses, and pyroclastic flows.
The JAGURS tsunami simulation code is employed for tsunami modelling (https://doi.org/10.5281/zenodo.6118212, jagurs-admin, 2022; Baba et al., 2015).
Bathymetry data are obtained from https://www.gebco.net/data_and_products/gridded_bathymetry_data/ (GEBCO, 2019). The sea level records in the deep ocean are available from https://nctr.pmel.noaa.gov/Dart/ (PMEL, 2022) and https://tilde.geonet.org.nz/ui/data-exploration/ (last access: 1 March 2022; GeoNet, 2022). The sea level records of tide gauges are downloaded from http://www.ioc-sealevelmonitoring.org/list.php (last access: 1 March 2022; IOC, 2022). Barometer data can be accessed from https://climatologia.meteochile.gob.cl/application/informacion/grupoEstaciones (last access: 1 March 2022; DGCA, 2022), https://www.weather.gov/ilm/observations (last access: 1 March 2022; NOAA, 2022), https://www.data.jma.go.jp/obd/stats/etrn/index.php (last access: 1 March 2022; JMA, 2022), https://wow.metoffice.gov.uk/observations/create (last access: 1 March 2022; WOW, 2022), and https://www.met.gov.fj (last access: 1 March 2022; FMS, 2022).
The supplement related to this article is available online at: https://doi.org/10.5194/nhess-23-675-2023-supplement.
GH is responsible for the methodology, data curation, software, and writing (original draft preparation). LL is responsible for the methodology, writing (reviewing and editing), and supervision. ZR is responsible for the data curation and software. KZ is responsible for the data curation.
The contact author has declared that none of the authors has any competing interests.
Publisher's note: Copernicus Publications remains neutral with regard to jurisdictional claims in published maps and institutional affiliations.
We sincerely thank the two anonymous reviewers and editor Mauricio Gonzalez for their constructive suggestions that have significantly improved the quality of this paper.
This research has been supported by the Foundation for Innovative Research Groups of the National Natural Science Foundation of China (grant nos. 41976197 and 12002099), the Southern Marine Science and Engineering Guangdong Laboratory (Guangzhou) (grant no. 311021002), the Key Research and Development Program of Hunan Province of China (grant no. ZDYF2020209), the Southern Marine Science and Engineering Guangdong Laboratory (Guangzhou) (grant no. SML2021SP305), and the Fundamental Research Funds for the Central Universities (grant no. 2021qntd23).
This paper was edited by Mauricio Gonzalez and reviewed by two anonymous referees.
Adam, D.: Tonga volcano created puzzling atmospheric ripples, Nature, 601, 7894, https://doi.org/10.1038/d41586-022-00127-1, 2022.
Amores, A., Monserrat, S., Marcos, M., Argüeso, D., Villalonga, J., Jordà, G., and Gomis, D.: Numerical simulation of atmospheric Lamb waves generated by the 2022 Hunga-Tonga volcanic eruption, Geophys. Res. Lett., 49, e2022GL098240, https://doi.org/10.1029/2022GL098240, 2022.
Aranguiz, R., Catalán, P. A., Cecioni, C., Bellotti, G., Henriquez, P., and González, J.: Tsunami Resonance and Spatial Pattern of Natural Oscillation Modes With Multiple Resonators, J. Geophys. Res.-Oceans, 124, 7797–7816, https://doi.org/10.1029/2019JC015206, 2019.
Baba, T., Takahashi, N., Kaneda, Y., Ando, K., Matsuoka, D., and Kato, T.: Parallel Implementation of Dispersive Tsunami Wave Modeling with a Nesting Algorithm for the 2011 Tohoku Tsunami, Pure Appl. Geophys., 172, 3455–3472, https://doi.org/10.1007/s00024-015-1049-2, 2015.
Bevis, M., Taylor, F. W., Schutz, B. E., Recy, J., Isacks, B. L., Helu, S., Singh, R., Kendrick, E., Stowell, J., Taylor, B., and Calmantli, S.: Geodetic observations of very rapid convergence and back-arc extension at the tonga arc, Nature, 374, 249–251, https://doi.org/10.1038/374249a0, 1995.
Billen, M. I., Gurnis, M., and Simons, M.: Multiscale dynamics of the Tonga–Kermadec subduction zone, Geophys. J. Int., 153, 359–388, https://doi.org/10.1046/j.1365-246X.2003.01915.x, 2003, 2003.
Carvajal, M., Sepúlveda, I., Gubler, A., and Garreaud, R.: Worldwide Signature of the 2022 Tonga Volcanic Tsunami, Geophys. Res. Lett., 49, e2022GL098153, https://doi.org/10.1029/2022GL098153, 2022.
De Lange, W. P. and Healy, T. R.: New Zealand tsunamis 1840–1982, New Zeal. J. Geol. Geophys., 29, 115–134, https://doi.org/10.1080/00288306.1986.10427527, 1986.
DGCA: Directorate General of Civil Aviation (Chile), DGCA [data set], https://climatologia.meteochile.gob.cl/application/informacion/grupoEstaciones, last access: 1 March 2022.
Duncombe, J.: The Surprising Reach of Tonga's Giant Atmospheric Waves, Eos, 103, https://doi.org/10.1029/2022EO220050, 2022.
Edmonds, M.: Hunga-Tonga-Hunga-Ha'apai in the south Pacific erupts violently, Temblor, https://doi.org/10.32858/temblor.231, 2022.
FMS: Fiji Meteorological Service, FMS [data set], https://www.met.gov.fj, last access: 1 March 2022.
Garvin, J. B., Slayback, D. A., Ferrini, V., Frawley, J., Giguere, C., Asrar, G. R., and Andersen, K.: Monitoring and Modeling the Rapid Evolution of Earth's Newest Volcanic Island: Hunga Tonga Hunga Ha'apai (Tonga) Using High Spatial Resolution Satellite Observations, Geophys. Res. Lett., 45, 3445–3452, https://doi.org/10.1002/2017GL076621, 2018.
GEBCO: The General Bathymetric Chart of the Oceans, GEBCO [data set], https://www.gebco.net/data_and_products/gridded_bathymetry_data/, last access: 1 April 2019.
GeoNet: Earth Observation Network System in New Zealand, GeoNet [data set], https://tilde.geonet.org.nz/ui/data-exploration, last access: 1 March 2022.
Gossard, E. E. and Hooke, W. H.: Waves in the Atmosphere: Atmospheric Infrasound and Gravity Waves – Their Generation and Propagation, in: Developments in Atmospheric Science, Vol. 2, Elsevier Science Ltd., ISBN 978-0444411969, 1975.
Heidarzadeh, M. and Satake, K.: Waveform and Spectral Analyses of the 2011 Japan Tsunami Records on Tide Gauge and DART Stations Across the Pacific Ocean, Pure Appl. Geophys., 170, 1275–1293, https://doi.org/10.1007/s00024-012-0558-5, 2013.
Heidarzadeh, M. and Satake, K.: Excitation of Basin-Wide Modes of the Pacific Ocean Following the March 2011 Tohoku Tsunami, Pure Appl. Geophys., 171, 3405–3419, https://doi.org/10.1007/s00024-013-0731-5, 2014.
Hu, G., Feng, W., Wang, Y., Li, L., He, X., Karakaş, Ç., and Tian, Y.: Source characteristics and exacerbated tsunami hazard of the 2020 Mw 6.9 Samos earthquake in eastern Aegean Sea, J. Geophys. Res.-Sol. Ea., 127, e2022JB023961, https://doi.org/10.1029/2022JB023961, 2022.
IOC: Sea Level Station Monitoring Facility, IOC [data set], http://www.ioc-sealevelmonitoring.org/list.php, last access: 1 March 2022.
jagurs-admin: jagurs-admin/jagurs: JAGURS-D_V0516 (JAGURS-D_V0516), Zenodo [code], https://doi.org/10.5281/zenodo.6118212, 2022.
JMA: Japan Meteorological Agency, JMA [data set], https://www.data.jma.go.jp/obd/stats/etrn/index.php, last access: 1 March 2022.
Kawata, Y., Benson, B. C., Borrero, J. C., Borrero, J. L., Davies, H. L., Lange, W. P. de, Imamura, F., Letz, H., Nott, J., and Synolakis, C. E.: Tsunami in Papua New Guinea Was as Intense as First Thought, Eos, Trans. Am. Geophys. Union, 80, 101–105, https://doi.org/10.1029/99EO00065, 1999.
Kristeková, M., Kristek, J., Moczo, P., and Day, S. M.: Misfit Criteria for Quantitative Comparison of Seismograms, B. Seismol. Soc. Am., 96, 1836–1850, https://doi.org/10.1785/0120060012, 2006.
Kubota, T., Saito, T., and Nishida, K.: Global fast-traveling tsunamis by atmospheric pressure waves on the 2022 Tonga eruption, Science, 377, 91–94, https://doi.org/10.1126/science.abo4364, 2022.
Kulichkov, S. N., Chunchuzov, I. P., Popov, O. E., Gorchakov, G. I., Mishenin, A. A., Perepelkin, V. G., Bush, G. A., Skorokhod, A. I., Vinogradov, Y. A., Semutnikova, E. G., Šepic, J., Medvedev, I. P., Gushchin, R. A., Kopeikin, V. M., Belikov, I. B., Gubanova, D. P., Karpov, A. V., and Tikhonov, A. V.: Acoustic-Gravity Lamb Waves from the Eruption of the Hunga-Tonga-Hunga-Hapai Volcano, Its Energy Release and Impact on Aerosol Concentrations and Tsunami, Pure Appl. Geophys., 179, 1533–1548, https://doi.org/10.1007/s00024-022-03046-4, 2022.
Lamb, H.: Hydrodynamics, Cambridge Univ. Press, ISBN 978-0486602561, 1932.
Le Pichon, A., Blanc, E., and Hauchecorne, A.: Infrasound monitoring for atmospheric studies, Springer Science & Business Media, 735 pp., https://doi.org/10.1007/978-1-4020-9508-5, 2010.
Lin, J., Rajesh, P. K., Lin, C. C. H., Chou, M., Liu, J.-Y., Yue, J., Hsiao, T.-Y., Tsai, H.-F., Chao, H.-M., and Kung, M.-M.: Rapid Conjugate Appearance of the Giant Ionospheric Lamb Wave Signatures in the Northern Hemisphere After Hunga- Tonga Volcano Eruptions, Geophys. Res. Lett., 49, e2022GL098222, https://doi.org/10.1029/2022GL098222, 2022.
Liu, P. L.-F. and Higuera, P.: Water waves generated by moving atmospheric pressure: Theoretical analyses with applications to the 2022 Tonga event, arXiv [preprint], https://doi.org/10.48550/arXiv.2205.05856, 12 May 2022.
Liu, X., Xu, J., Yue, J., and Kogure, M.: Strong Gravity Waves Associated With Tonga Volcano Eruption Revealed by SABER Observations, Geophys. Res. Lett., 49, e2022GL098339, https://doi.org/10.1029/2022GL098339, 2022.
Lynett, P., McCann, M., Zhou, Z., Renteria, W., Borrero, J., Greer, D., Fa'anunu, `Ofa, Bosserelle, C., Jaffe, B., Selle, S. La, Ritchie, A., Snyder, A., Nasr, B., Bott, J., Graehl, N., Synolakis, C., Ebrahimi, B., and Cinar, G. E.: Diverse tsunamigenesis triggered by the Hunga Tonga-Hunga Ha'apai eruption, Nature, 609, 728–733, https://doi.org/10.1038/s41586-022-05170-6, 2022.
Matoza, R. S., Matoza, R. S., Fee, D., Assink, J. D., Iezzi, A. M., Green, D. N., Kim, K., Lecocq, T., Krishnamoorthy, S., Lalande, J., Nishida, K., and Gee, K. L.: Atmospheric waves and global seismoacoustic observations of the January 2022 Hunga eruption, Tonga, Science, 377, 95–100, https://doi.org/10.1126/science.abo7063, 2022.
Mori, N., Takahashi, T., Yasuda, T., and Yanagisawa, H.: Survey of 2011 Tohoku earthquake tsunami inundation and run-up, Geophys. Res. Lett., 38, L00G14, https://doi.org/10.1029/2011GL049210, 2011.
NASA: Dramatic changes at Hunga Tonga-Hunga Ha`apai, National Aeronautics and Space Administration, https://earthobservatory.nasa.gov/images/149367/dramatic-changes-at-hunga-tonga-hunga-haapai, last access: 5 May 2022.
NOAA: National Weather Service, National Oceanic and Atmospheric Administration [data set], https://www.weather.gov/ilm/observations, last access: 1 March 2022.
Nomanbhoy, N. and Satake, K.: Generation mechanism of tsunamis from the 1883 Krakatau Eruption, Geophys. Res. Lett., 22, 509–512, https://doi.org/10.1029/94GL03219, 1995.
Omira, R., Baptista, M. A., Quartau, R., Ramalho, R. S., Kim, J., Ramalho, I., and Rodrigues, A.: How hazardous are tsunamis triggered by small-scale mass-wasting events on volcanic islands? New insights from Madeira–NE Atlantic, Earth Planet. Sci. Lett., 578, 117333, https://doi.org/10.1016/j.epsl.2021.117333, 2022.
Otsuka, S.: Visualizing Lamb Waves From a Volcanic Eruption Using Meteorological Satellite Himawari-8, Geophys. Res. Lett., 49, e2022GL098324, https://doi.org/10.1029/2022GL098324, 2022.
Pelinovsky, E., Choi, B. H., Stromkov, A., Didenkulova, I., and Kim, H.: Analysis of Tide-Gauge Records of the 1883 Krakatau Tsunami, in: Tsunamis, edited by: Satake, K., Adv. Nat. Technol. Hazards Res., 23, Springer, Dordrecht, https://doi.org/10.1007/1-4020-3331-1_4, 2005.
Plank, S., Marchese, F., Genzano, N., Nolde, M., and Martinis, S.: The short life of the volcanic island New Late'iki (Tonga) analyzed by multi-sensor remote sensing data, Sci. Rep., 10, 22293, https://doi.org/10.1038/s41598-020-79261-7, 2020.
PMEL: DART® (Deep-ocean Assessment and Reporting of Tsunamis), NOAA Center for Tsunami Research [data set], https://nctr.pmel.noaa.gov/Dart/, last access: 1 March 2022.
Rabinovich, A. B.: Spectral analysis of tsunami waves: Separation of source and topography effects, J. Geophys. Res.-Oceans, 102, 12663–12676, https://doi.org/10.1029/97JC00479, 1997.
Rabinovich, A. B.: Seiches and harbor oscillations, in: Handbook of coastal and ocean engineering, World Scientific, 193–236, https://doi.org/10.1142/6914, 2009.
Rabinovich, A. B., Thomson, Æ. R. E., and Stephenson, F. E.: The Sumatra tsunami of 26 December 2004 as observed in the North Pacific and North Atlantic oceans, Surv. Geophys., 27, 647–677, https://doi.org/10.1007/s10712-006-9000-9, 2006.
Rabinovich, A. B., Titov, V. V., Moore, C. W., and Eble, M. C.: The 2004 Sumatra Tsunami in the Southeastern Pacific Ocean: New Global Insight From Observations and Modeling, J. Geophys. Res.-Oceans, 122, 7992–8019, https://doi.org/10.1002/2017JC013078, 2017.
Ramalho, R. S., Winckler, G., Madeira, J., Helffrich, G. R., Hipólito, A., Quartau, R., Adena, K., and Schaefer, J. M.: Hazard potential of volcanic flank collapses raised by new megatsunami evidence, Sci. Adv., 1, e1500456, https://doi.org/10.1126/sciadv.1500456, 2015.
Ramírez-Herrera, M. T., Coca, O., and Vargas-Espinosa, V.: Tsunami Effects on the Coast of Mexico by the Hunga Tonga-Hunga Ha'apai Volcano, Pure Appl. Geophys., 179, 1117–1137, https://doi.org/10.1007/s00024-022-03017-9, 2022.
Satake, K.: Earthquakes: Double trouble at Tonga, Nature, 466, 931–932, https://doi.org/10.1038/466931a, 2010.
Satake, K., Heidarzadeh, M., Quiroz, M., and Cienfuegos, R.: History and features of trans-oceanic tsunamis and implications for paleo-tsunami studies, Earth-Sci. Rev., 202, 103112, https://doi.org/10.1016/j.earscirev.2020.103112, 2020.
Self, S. and Rampino, M. R.: The 1883 eruption of Krakatau, Nature, 294, 699–704, https://doi.org/10.1038/294699a0, 1981.
Stern, S., Cronin, S., Ribo, M., Barker, S., Brenna, M., Smith, I. E. M., Ford, M., Kula, T., and Vaiomounga, R.: Post-2015 caldera morphology of the Hunga Tonga-Hunga Ha’apai caldera, Tonga, through drone photogrammetry and summit area bathymetry, EGU General Assembly 2022, Vienna, Austria, 23–27 May 2022, EGU22-13586, https://doi.org/10.5194/egusphere-egu22-13586, 2022.
Themens, D. R., Watson, C., Žagar, N., Vasylkevych, S., Elvidge, S., McCaffrey, A., Prikryl, P., Reid, B., Wood, A., and Jayachandran, P. T.: Global Propagation of Ionospheric Disturbances Associated With the 2022 Tonga Volcanic Eruption, Geophys. Res. Lett., 49, e2022GL098158, https://doi.org/10.1029/2022GL098158, 2022.
Thomson, R. E. and Emery, W. J.: Data Analysis Methods in Physical Oceanography, 3rd edn., Elsevier, New York, 716 pp., https://doi.org/10.1016/C2010-0-66362-0, 2014.
Titov, V., Rabinovich, A. B., Mofjeld, H. O., Thomson, R. E., and Gonza, F. I.: The Global Reach of the 26 December 2004 Sumatra Tsunami, Science, 309, 2045–2049, https://doi.org/10.1126/science.1114576, 2005.
USGS: M 5.8 Volcanic Eruption – 68 km NNW of Nuku`alofa, Tonga, U.S. Geol. Surv., https://earthquake.usgs.gov/earthquakes/eventpage/us7000gc8r/, last access: 4 May 2022.
Wang, Y., Heidarzadeh, M., Satake, K., Mulia, I. E., and Yamada, M.: A Tsunami Warning System Based on Offshore Bottom Pressure Gauges and Data Assimilation for Crete Island in the Eastern Mediterranean Basin, J. Geophys. Res.-Sol. Ea., 125, e2020JB020293, https://doi.org/10.1029/2020JB020293, 2020.
Wang, Y., Zamora, N., Quiroz, M., Satake, K., and Cienfuegos, R.: Tsunami Resonance Characterization in Japan Due to Trans-Pacific Sources: Response on the Bay and Continental Shelf, J. Geophys. Res.-Oceans, 126, 1–16, https://doi.org/10.1029/2020JC017037, 2021.
Watanabe, S., Hamilton, K., Sakazaki, T., and Nakano, M.: First Detection of the Pekeris Internal Global Atmospheric Resonance: Evidence from the 2022 Tonga Eruption and from Global Reanalysis Data, J. Atmos. Sci., 79, 3027–3043, https://doi.org/10.1175/jas-d-22-0078.1, 2022.
WOW: Weather Observation Website, Met Office [data set], https://wow.metoffice.gov.uk/observations/create, last access: 1 March 2022.
Yuen, D. A., Scruggs, M. A., Spera, F. J., Yingcai Zheng, Hao Hu, McNutt, S. R., Glenn Thompson, Mandli, K., Keller, B. R., Wei, S. S., Peng, Z., Zhou, Z., Mulargia, F., and Tanioka, Y.: Under the Surface: Pressure-Induced Planetary-Scale Waves, Volcanic Lightning, and Gaseous Clouds Caused by the Submarine Eruption of Hunga Tonga-Hunga Ha'apai Volcano Provide an Excellent Research Opportunity, Earthq. Res. Adv., 2, 100134, https://doi.org/10.1016/j.eqrea.2022.100134, 2022.
Zhang, S., Vierinen, J., Aa, E., Goncharenko, L. P., Erickson, P. J., Rideout, W., Coster, A. J., and Spicher, A.: 2022 Tonga Volcanic Eruption Induced Global Propagation of Ionospheric Disturbances via Lamb Waves, Front. Astron. Sp. Sci., 9, 1–10, https://doi.org/10.3389/fspas.2022.871275, 2022.