the Creative Commons Attribution 4.0 License.
the Creative Commons Attribution 4.0 License.
 | 18 Oct 2022
Earthquake-induced landslides in Haiti: analysis of seismotectonic and possible climatic influences
Hans-Balder Havenith
Kelly Guerrier
Romy Schlögel
Anika Braun
Sophia Ulysse
Anne-Sophie Mreyen
Karl-Henry Victor
Newdeskarl Saint-Fleur
Léna Cauchie
Dominique Boisson
Claude Prépetit
First analyses of landslide distribution and triggering factors are presented for the region affected by the 14 August 2021 earthquake (Mw=7.2) in the Nippes Department, Haiti. Landslide mapping was mainly carried out by comparing pre- and post-event remote imagery (∼0.5–1 m resolution) available on Google Earth Pro® and Sentinel-2 (10 m resolution) satellite images. The first covered about 50 % of the affected region (for post-event imagery and before completion of the map in January 2022), and the latter were selected to cover the entire potentially affected zone. On the basis of the completed landslide inventory, comparisons are made with catalogs compiled by others both for the August 2021 and the January 2010 seismic events, including one open inventory (by the United States Geological Survey) that was also used for further statistical analyses. Additionally, we studied the pre-2021 earthquake slope stability conditions. These comparisons show that the total number of landslides mapped for the 2021 earthquake (7091) is larger than the one recently published by another research team for the same event but slightly smaller than the number of landslides mapped by a third research team. It is also clearly smaller than the one observed by two other research teams for the 2010 earthquake (e.g., 23 567, for the open inventory). However, these apparently fewer landslides triggered in 2021 cover much wider areas of slopes (>80 km2) than those induced by the 2010 event (∼25 km2 – considering the open inventory). A simple statistical analysis indicates that the lower number of 2021 landslides can be explained by the missing detection of the smallest landslides triggered in 2021, partly due to the lower-resolution imagery available for most of the areas affected by the recent earthquake; this is also confirmed by an inventory completeness analysis based on size–frequency statistics. The much larger total area of landslides triggered in 2021, compared to the 2010 earthquake, can be related to different physical reasons: (a) the larger earthquake magnitude in 2021, (b) the more central location of the fault segment that ruptured in 2021 with respect to coastal zones, (c) and possible climatic preconditioning of slope instability in the 2021 affected area. These observations are supported by (1) a new pre-2021 earthquake landslide map; (2) rainfall distribution maps presented for different periods (including October 2016 – when Hurricane Matthew had crossed the western part of Haiti), covering both the 2010 and 2021 affected zones; and (3) shaking intensity prediction maps.
- Article
(13547 KB) - Full-text XML
- BibTeX
- EndNote


This paper presents an overview of landslides induced by the 14 August 2021 Nippes (Haiti) earthquake. The epicenter (18.434∘ N, 73.482∘ W; hypocentral depth of 10 km) of this event is located in the western part of the southern Haitian peninsula (see Unites States Geological Survey, USGS, Earthquake Hazards Program page, https://earthquake.usgs.gov, last access: 10 June 2022, presenting first information on the 2021 M 7.2 Nippes, Haiti, event).
Even though the magnitude of the 2021 earthquake is slightly larger than the one of 2010 (Mw=7.2 and Mw=7.0, respectively; see information on the https://earthquake.usgs.gov, last access: 10 June 2022, web page and by Stein et al., 2021), the recent event was far less catastrophic as it hit a less populated area compared to the 2010 earthquake that occurred just near the western entrance of the capital of Haiti, Port-au-Prince. The 2021 earthquake accounts for about 2250 fatalities (two-thirds of which occurred in the provincial city of Les Cayes, shown in Fig. 1), while the 2010 death toll is up to 300 000. However, it quickly became clear that the last event caused widespread slope failures that could be more intense than in 2010. Therefore, members of our research team completed some ground control during a 1-week field visit along segments of important roads hit by rockfalls near the epicentral region. Additionally, we mapped landslides over the whole area potentially hit by the 2021 event by using satellite imagery of variable resolution, as it will be explained in Sect. 3. The main target of this mapping task was to produce an input data set for an extensive landslide susceptibility analysis that will be presented in an upcoming publication.
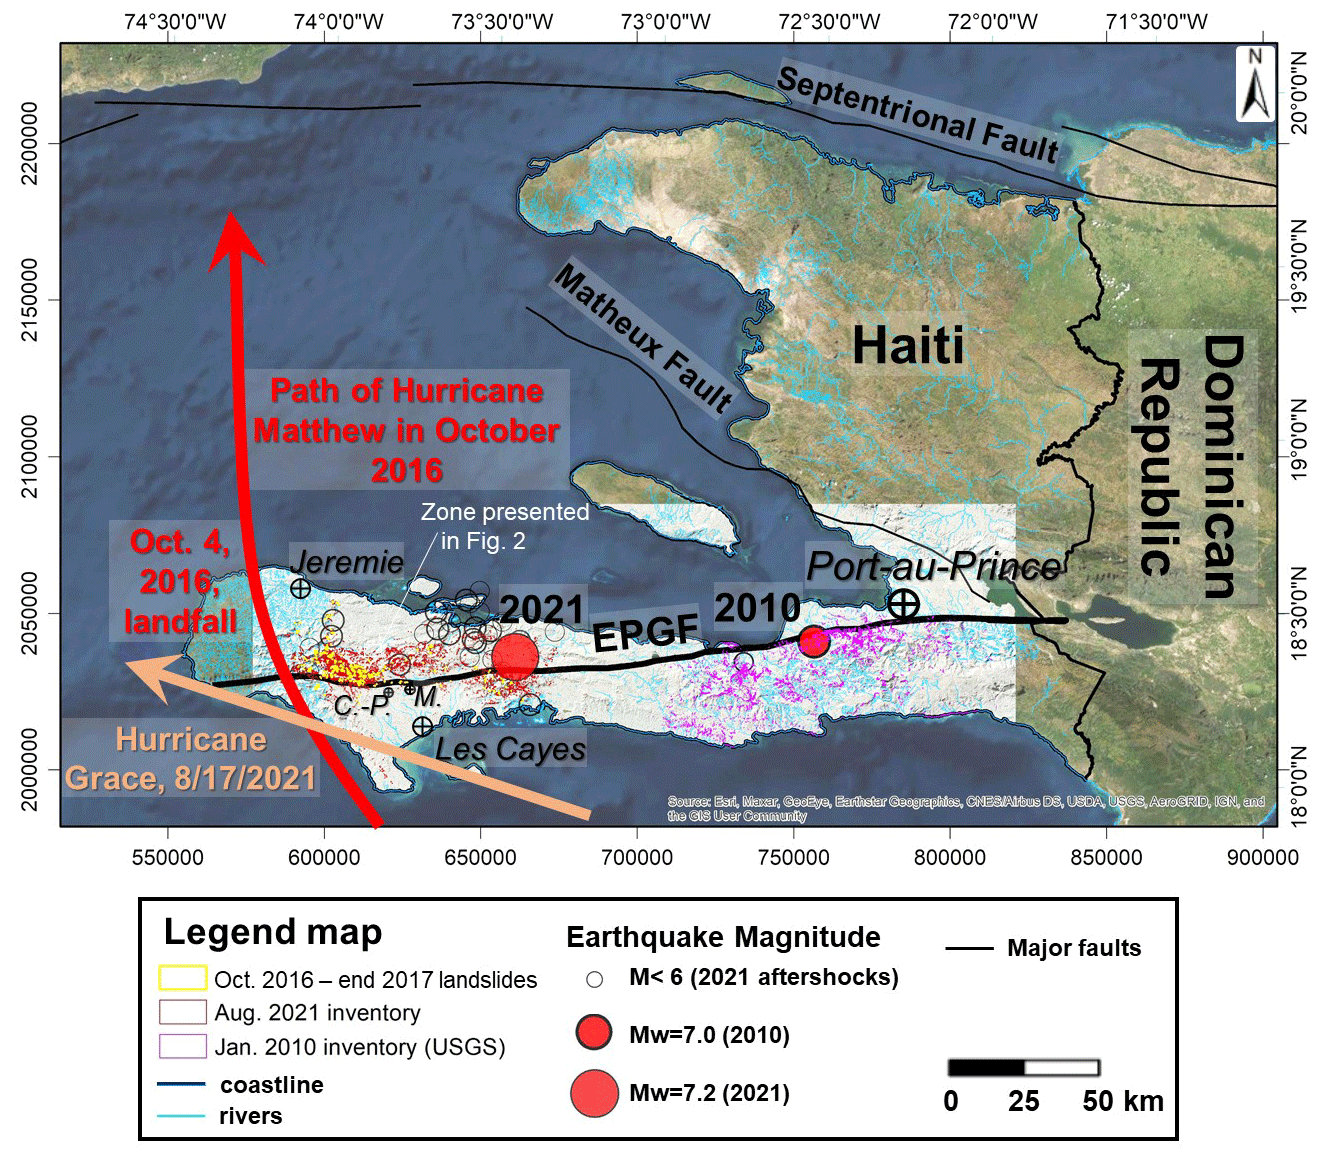
Figure 1Location of the study region in Haiti: satellite image view of Haiti (© ESRI), with study region highlighted by the hillshade. See also location of the 2010 and 2021 epicenters, as well as the major cities (see also “C.-P.” for Camp-Perrin and “M.” for Maniche) hit by those two events. Outlines of major faults are shown as well as the indication of the approximate paths of Hurricane Matthew in October 2016 and of Hurricane Grace in August 2021. Landslides mapped by Harp et al. (2016) are shown by light-violet polygons, and recently mapped landslides triggered in August 2021 are outlined in dark red. See also location of the zone presented in Fig. 2.
Such event-based seismically induced landslide inventories also allow us to complete a more systematic analysis of global patterns of those mass movements, such as size–frequency relationships (Malamud et al., 2004; Tanyaş et al., 2019b), estimates of the expected number of landslides and affected area (Havenith et al., 2016; Keefer and Wilson, 1989; Marc et al., 2017), and very general earthquake-triggered landslide susceptibility markers (Tanyas et al., 2019a). At the regional scale, event-based landslide inventories are valuable to understand more specific patterns of seismic slope instability, particularly with respect to the earthquake mechanism and the geological and climatic context (Gorum et al., 2011; Tanyaş et al., 2022).
Below, we will also present statistical characteristics of this new 2021 inventory compared with equivalent results extracted from the USGS landslide catalog published by Harp et al. (2016) for the 2010 Haiti event that occurred at about 100 km in the east of the 2021 earthquake. Some statistical data are also compared with those of two other published inventories completed for the 2021 event – the one by Martinez et al. (2021, USGS open-file report) and the one by Zhao et al. (2022) – as well as with those of two additional catalogs compiled for the 2010 event (by Gorum et al., 2013, and Xu et al., 2014).
The tectonic setting of both events and also the climatic context of the landslide triggering are introduced in the following section.
Similar to the 12 January 2010 earthquake, the epicenter of the main shock of the 2021 event is located near the surface expression of the Enriquillo–Plantain Garden Fault (EPGF) that crosses the southern peninsula from west to east; this fault includes a succession of faulted anticlines forming the Massif de la Hotte mountains in the west (zone affected by the 2021 event) and the Massif de la Selle in the east (affected by the 2010 event). With a slip rate of about 7±2 mm yr−1 the EPGF is one of the two main strike-slip faults inferred to accommodate the 20 mm yr−1 relative motion between the Caribbean and North American plates (DeMets et al., 2000). Furthermore, the historical earthquakes of 1701, 1751, and 1770 are considered to have occurred along the central EPGF system (Ali et al., 2008; Bakun et al., 2012). Thus, EPGF marks one of the highest seismic hazard zones of the island (see location of the 2010 and 2021 earthquake epicenters marked by stars plotted on the seismic hazard map completed by Frankel et al., 2011, in Fig. A1 in the Appendix A, as well as on the topographic map shown by red circles in Fig. 1).
For the 2010 event, Calais et al. (2010) and Symithe et al. (2013) showed that this earthquake was caused by the oblique rupture of a formerly unknown fault (called Léogâne) dipping towards the north and located immediately in the north of the EPGF. Data provided by the https://earthquake.usgs.gov web page (last access: 20 October 2021; considering the provided moment tensor solution; see also Okuwaki and Fan, 2022) indicate that the situation could be similar for the 2021 event, with a ruptured fault segment dipping towards the north, and mostly located in the north of the EPGF. Thus, also the recently ruptured fault segment would not belong to the EPGF (which is essentially a left-lateral strike-slip fault). It could be related to an adjacent blind fault segment with oblique slip character (left-lateral strike-slip combined with reverse movement) according to the information available on https://earthquake.usgs.gov (last access: 10 June 2022) and to Okuwaki and Fan (2022). The latter further indicate that especially the eastern part of the fault activation showed a more reverse-type rupture, while the western part showed a preferential strike-slip fault mechanism. However, by now there is still no clear answer to the question related to the fault itself. Therefore, below we will use the term “EPGF zone”, which includes the main strike-slip fault and annexed oblique (or combined) slip fault segments (the two that are now known, i.e., the one ruptured in 2010 and the one that produced the last earthquake) to denominate the tectonic structure that produced those two events.
The seismotectonic setting of the two events in 2010 and 2021 introduced above has certainly to be considered when explaining observed earthquake-triggered landslide distributions (see Sects. 4 and 5 below). However, also geological and climatic factors need to be analyzed to improve related interpretations. The geological influence on slope failure development in the earthquake-affected zones will be studied more in detail in a follow-up paper focused on landslide susceptibility analyses (see also Zhao et al., 2022, for a basic analysis of the geological influence on the 2021 landslide distribution), while some possible climatic influence is already investigated in this paper. Therefore, we had also mapped landslides existing before the 2021 earthquake by using high-resolution (≤1 m) imagery available on Google Earth Pro®, starting from October 2014 until the end of 2017, to study some preconditioning of slope instability that was induced in 2021. In particular, it is known that the region is often affected by hurricanes – the last catastrophic one, Matthew or Mathieu in French, had impacted the target area in October 2016. In addition, just 2 d after the main shock, on 16 August, another hurricane, Grace, hit the area and hampered help convoys to reach the areas most impacted by the earthquake. Right after this event, it was not immediately clear if Grace had contributed to landslide activity or not; this question will be analyzed in the following sections by comparing landslide distributions with monthly precipitation maps produced by the Global Precipitation Measurement (GPM) Mission (NASA) for different periods.
Figure 1 presents an overview map with outlines of landslides mapped by Harp et al. (2016) (shown by light-violet-pink polygons, near the 2010 M=7 epicenter) and the recently mapped landslides triggered in August 2021 (outlined in dark red, mainly in the west and south of the 2021 epicenter). This map also shows the approximate paths of the two aforementioned hurricanes near Haiti. Other digital outlines (also those presented in the following figures that also present more detailed views with more clearly visible outlines), such as roads, rivers, faults, and coastline, were provided by the Centre National de l'Information Géo-Spatiale (CNIGS) of Haiti.
The following sections will provide more detail about the landslide mapping itself, the completion of landslide statistics, the collection of climatic data, and the computation of seismic intensity maps. All those inputs will be used to explain both the common and the different main markers of landslide catalogs, respectively, for the 2010 and the 2021 events.
3.1 Landslide mapping
3.1.1 Field observations
Right after the main shock that hit Haiti on 14 August 2021 (precisely at 12:29:08 UTC, about 08:30 LT), it became clear that many landslides were triggered by this earthquake. Within a few hours after the main shock, there were reports about rockfalls cutting the main road RN7 connecting the large provincial cities of Les Cayes in the south and Jeremy in the north. Therefore, local members of our research team checked the situation to support local administration with cleaning the roads. Photographs of rockfalls in the central part of the target area are shown in Fig. 2 (those shown below all occurred in limestone rocks), together with the locations of the affected sites on a map.

Figure 2Examples of landslides photographed in the field, especially along the national road RN7, connecting the two provincial cities of Les Cayes in the south and Jeremy in the north. The map (semi-transparent hillshade on high-resolution satellite imagery, © ESRI) also shows the different ground failure effects mapped before (yellow polygons) and after the earthquake (dark-red polygons). See blue rectangle marking the outline of the view extent shown in Fig. 3 (and in Fig. A2).
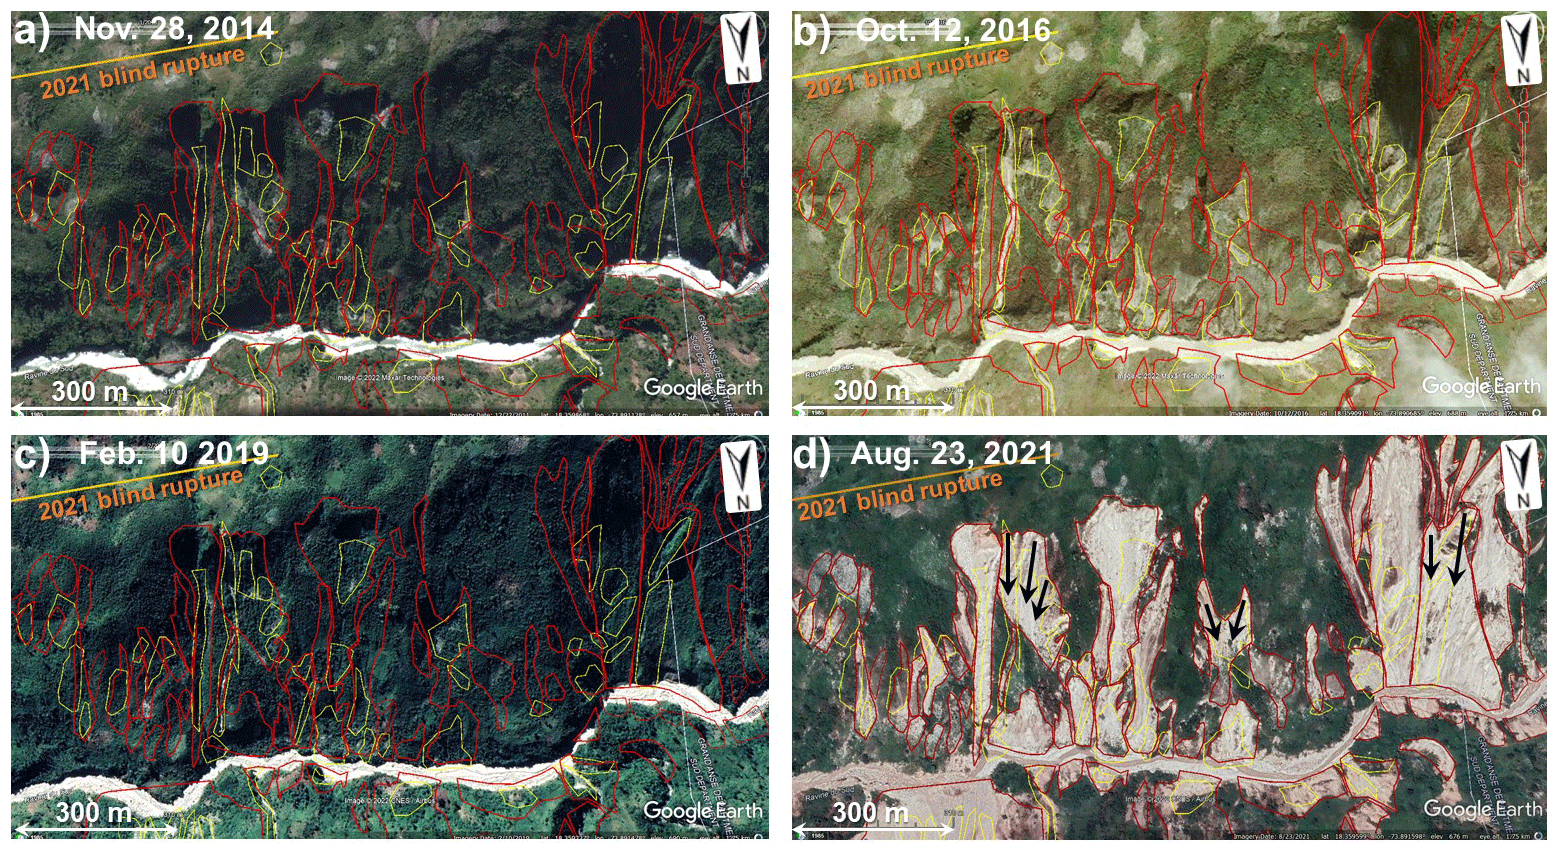
Figure 3Evolution of landslides within the zone marked in Fig. 2: November 2014 (a); October 2016, after Hurricane Matthew (b); a view of the area in February 2019 (c); and a view of the area in August 2021 (d), about 10 d after the earthquake. Landslides that occurred during or directly after the Hurricane Matthew event are outlined in yellow, and those that were triggered by the 14 August 2021 earthquake are shown by dark-red polygons; see also black arrows marking the coalescence of landslides with distinct sources (only for three examples shown). All views © Google Earth Pro.
These rockfalls were typically not very large (with a volume of generally less than 20 000 m3 – note that for volume estimates, we applied the equations proposed by Havenith et al., 2015, using as input the landslide deposit thickness calculations and surface area measurements), but there were many of them, and, in some cases, it took several days before the street could be reopened. During the field visits in August 2021, just after the main shock, our teams could confirm that this earthquake had triggered more extensive slope failures (covering wider surface areas) than the previous M=7.0 event in January 2010. After these visits we started to detect and map all landslides caused by the earthquake.
3.1.2 Regional mapping of landslides using remote imagery of August–November 2021
Mapping of earthquake-induced landslides is often done from pre- and post-event optical and radar satellite imagery; both can be publicly accessible. Optical imagery (which was used for this study) includes, amongst others, Sentinel-2 (Tanyaş et al., 2022) or Landsat-7 and 8 data, with resolutions starting from 10 m, and commercial higher-resolution data, which are often made publicly available for disaster response, through Google Earth, with resolutions down to 0.5 m (Harp et al., 2016; Kargel et al., 2016; Wartman et al., 2013). Sometimes mapping is also supported by (pre-event) digital elevation data (Gorum et al., 2011; Kargel et al., 2016) or even by field or helicopter reconnaissance. Landslides are mapped at different levels of spatial discretization, e.g., as landslide initiation points (Gorum et al., 2011), centroid points (Wartman et al., 2013), or landslide polygons (Tanyaş et al., 2022), and with a varying degree of detail, e.g., regarding the minimum mapped landslide size or the identification of landslide types. The quality and accuracy of the inventories depend typically on the resolution of the satellite data, cloud cover, and the availability of suitable pre-event data for a clear identification of co-seismic landslides. A recent review of earthquake-induced landslide inventories was presented by Tanyaş et al. (2017).
In our case, medium-resolution imagery available from the Copernicus Open Access Hub was used for the landslide mapping over the whole potentially affected area: Sentinel-2, with 10 m spatial resolution bands B2 (490 nm), B3 (560 nm), B4 (665 nm), and B8 (842 nm) collected for eight different dates, every 5 to 6 d, between 14 August 2021 (the first one was available about 2 h after the main shock) and the end of September 2021 (an example of a Sentinel-2 image view of this period is shown in the Appendix, in Fig. A2a, presenting a view of the zone shown in the map in Fig. 2). Analyzing all images was necessary due to the extensive (but spatially variable) cloud cover present on each image. Considering that only this medium-resolution imagery was freely available in the beginning, the authors are aware that the landslides could not be mapped with the highest precision and that not all smaller landslides could be identified (especially those smaller than 2000 m2, corresponding roughly to 4×5 pixels on a Sentinel-2 image). However, during the following months, also higher-resolution (0.5–1 m) imagery became available on Google Earth Pro® (GEPro) for about 50 % of the potentially affected region (before December 2021). For these areas, the initial landslide outlines could be refined, and also smaller slope failures could be mapped; an example of the resolution effect on landslide mapping is shown in the Appendix, in Fig. A2, comparing the aforementioned Sentinel-2 image (black–white, projected on the topography in GEPro) with a higher-resolution image of the same landslide zone that became available on GEPro in September 2021. On the basis of such comparisons between higher- and lower-resolution imagery, we could see that most larger landslides are actually composed of multiple initially smaller and narrower slides and flows, which had coalesced to form a larger coherent mass. Even on the higher-resolution imagery, no clear separation could be outlined within these landslide areas; indeed, the refinement could only help identify distinct sources of those larger mass movements, but the outline of the main sliding mass often remained the same. Furthermore, for most landslide zones, no clear distinction could be made between landslide scarp and deposits, as it can often be observed for such kind of disrupted mass movements.
3.1.3 Regional mapping of landslides using remote imagery of November 2014–August 2021, with focus on pre-seismic changes that occurred in October 2016
For the entire area, also a comparison with pre-event imagery was completed to be sure that only co-seismic (or nearly co-seismic – see explanation below) slope failures had been mapped; this check was especially necessary for the identification of the smaller co-seismic landslides. Therefore, the impacted region was screened by using high-resolution (0.5–1 m) imagery available on GEPro for the period between 2014 and August 2021. A pre-earthquake image (of 28 November 2014) of the same landslide-impacted area is shown in Fig. 3a, highlighting the contrast between the vegetated slopes present in the target region and the extensive denudation that occurred during the earthquake of August 2021 (see images shown in Fig. 3d, identical to the one shown in the Appendix in Fig. A2a). However, we could also observe by comparing multiple images available for the pre-event period that some denudation had already appeared for smaller zones before 2021. Zones marked by narrow debris slides and flows could be outlined especially on images available for the time just after 10 October 2016. Figure 3b presents an image of 12 October 2016 that shows the freshest type of denudation since 2014 (see yellow polygons outlining such denudation zones), some of which disappeared after a few years (see Fig. 2c), due to revegetation of the slopes (rapid revegetation can be observed as the whole area is located in tropical regions). This image and others available for the same period were added to GEPro after Hurricane Matthew had impacted, in early October 2016, the same area as the one hit by the 2021 earthquake. The consequences of this double impact on the target region will be analyzed in the Sects. 3 and 4 on the basis of precipitation distribution maps.
Actually, Haiti is quite often (at least once per year) crossed by hurricanes or severe tropical storms, some of which can trigger slope failures over wide areas. One such tropical storm that later developed into the hurricane called Grace had also crossed southern Haiti, just 2 to 3 d after the 14 August 2021 main shock. We introduce this fact here in the methodological part as it had two consequences for the landslide mapping. First, right after the earthquake, wide areas were covered by clouds during several days (some higher mountain parts even for weeks); thus, multiple satellite images of different dates (both Sentinel-2 and higher-resolution imagery on GEPro) had to be inspected to map landslides over the whole area. Second, we had to consider that Grace might also have induced slope failures and that landslides mapped by using post-hurricane imagery were not all seismically triggered or were at least enlarged by the effects of Grace. Therefore, by comparing the post-seismic, 14 August, Sentinel-2 image (collected before the Hurricane Grace event) with the one of 29 August 2021 (post-seismic and post-hurricane), we checked if additional or enlarged slope failures had appeared on the latter. An example of such a comparison is presented in Fig. A3, where red arrows point to zones marked by larger slope failures on the Sentinel-2 image of 29 August 2021. The latter were thus most likely reactivated by rainfall during the Grace climatic event (disregarding here the possible additional influence of aftershocks occurring at the same time in the region that could not be checked due to missing new high-resolution imagery after each event; it should also be noted that none of the aftershocks had a magnitude, Mw, larger than 6). Unfortunately, due to the extensive cloud cover in mid-August 2021, such a comparison could only be completed for about 10 % of the seismically impacted area. For those cloud-free zones, we estimate that Grace had mainly induced a widening of the initially seismically triggered slope failures, but the importance of this reactivation process cannot be quantified due to the extensive cloud cover and related shadow effects on the surface. However, we could at least see that no new landslides had been triggered within the earthquake-affected cloud-free zones. Effects of Hurricane Grace outside the region marked by stronger shaking have not been studied – this would require a completely new mapping approach.
3.2 Landslide distribution statistics, climatic context, and a first size–frequency analysis
Total landslide numbers and surface areas as well as other parameters characterizing the statistics have been compiled for the two inventories – the new one presented here for 2021 and the one for 2010 by Harp et al. (2016). In Sect. 4.2, related values are also compared with predicted ones. The latter numbers have been computed according to prediction laws proposed by Havenith et al. (2016) and Malamud et al. (2004). To estimate the total number (NLT; see Eq. 1) of landslides triggered by a specific earthquake, Havenith et al. (2016) recommend taking into consideration the shaking intensity factor (I, based on the Arias intensity, see Arias, 1970, and thus on the earthquake magnitude, M; see Eq. 7b in the next subsection), the fault factor F (depending on the type, FT, and size of the fault rupture, considering also the influence of a possible surface rupture), the topographic energy (TE, using mainly as parameter the maximum altitude difference in the affected region), the climatic background (CB) conditions, and the lithological factor (LF, depending on the presence of soft soils for instance). Related factor values used for the calculations are compared with estimated minimum and maximum values in Table 2, in the following section.
Compared with the prediction of the total number of landslides triggered by a specific earthquake proposed by Havenith et al. (2016), the one recommended by Malamud et al. (2004) is much simpler (Eq. 2) and only based on the earthquake magnitude, M.
For the calculation of the total area potentially affected by landslides (ALext, area within the maximum extent of landslide occurrence, equivalent to the area of distribution defined by Marc et al., 2017, and Tanyaş and Lombardo, 2019), Havenith et al. (2016) propose the following Eq. (3), which also directly considers the earthquake magnitude, M, and the hypocentral depth, D:
As Havenith et al. (2016), Keefer and Wilson (1989) also propose an equation to estimate the total area potentially affected by landslides during one earthquake event. Their estimate of ALext is purely based on the earthquake magnitude, similar to Eq. (2) proposed by Malamud et al. (2004) to estimate NLT:
Malamud et al. (2004) do not propose any formula to estimate the total area potentially affected by landslides during an earthquake event as Havenith et al. (2016) (see Eq. 3) but recommend the following prediction law (Eq. 5) to estimate the total area effectively covered by co-seismic landslides, ALT, based on the observed or predicted (using Eq. 2, or any other related prediction law, such as the one in Eq. 1) total number of landslides:
All the previous equations were used to compute the respective values presented in Table 1 in Sect. 4.2.
Size–frequency relations were computed for the 7091 landslide outlines in terms of frequency-density function (FDF) on the basis of the measured surface areas, f(AL). The same statistics were also computed for the 23 567 landslides mapped by Harp et al. (2016). Therefore, we used the method introduced by Malamud et al. (2004) for surface areas (Eq. 6):
where δNL is the number of landslides with areas between AL and AL+δAL (representing the difference between two landslide surface area classes). Surface areas were calculated in square kilometers (km2). Related distributions computed, respectively, for each landslide catalog (for the 2010 one by Harp et al., 2016, and for the new 2021 inventory) are then compared with theoretical frequency-density distributions, as proposed by Malamud et al. (2004). The latter are based on the three-parameter inverse-gamma probability distribution (see Eq. 3 in Malamud et al., 2004) that is multiplied by the total number of landslides of simulated events (100, 1000, etc.). In this regard, it should be noted that the original technique proposed by Malamud et al. (2004) to complete the size–frequency statistics is based on the probability-density values, corresponding to the frequency-density values divided by the total number of mapped landslides, NLT (which can be fit by the aforementioned three-parameter inverse-gamma probability distribution). However, as indicated above, due to the limited amount of high-resolution imagery available for the area potentially affected by seismic shaking in August 2021, not all small landslides could be mapped; therefore, the total number of landslides seismically triggered in August, NLT, is likely to be higher than 7091 (even if the potential hurricane effect is removed, as explained below), and the probability-density function cannot be correctly computed. For such cases, Malamud et al. (2004) recommend the computation of the frequency-density function to assess the completeness of the inventory by comparison with the aforementioned predefined theoretical frequency-density functions, as it will be shown for the 2010 and 2021 inventories in the following results section.
To provide information about the climatic context covering different periods of time, we used the Global Precipitation Measurement Mission (GPM, by NASA) data obtained via the https://giovanni.gsfc.nasa.gov/ (last access: 10 June 2022) website, corresponding to the merged satellite-gauge monthly precipitation estimate (in mm), assessed with a resolution of 0.1∘. Related maps were extracted for all months between August 2000 and July 2021, for the specific months of October 2016 and August 2021, and for all October months between 2000 and 2020. Note that we also extracted maps for shorter periods around the climatic events of Matthew in 2016 and Grace in 2021, but those did not provide any additional information. Additionally, we tried to support these merged satellite–rain gauge estimates by additional ground measurement data. However, the Centre National de l'Information Géo-Spatiale (CNIGS) of Haiti informed us that such data would not be available; therefore, we can only rely on these regional estimates.
3.3 Mapping of seismic landslide triggering factors
The aforementioned climatic data are supposed to help us better understand the pre-conditioning of slope stability in the target area and thus will also be used below for the interpretation of the landslide distribution statistics. However, it is obvious that for such an event the main trigger factors are still related to earthquake shaking; those have to be assessed to understand why extensive slope instability could be observed in one zone and only isolated minor failures occurred in another one. Such an analysis is completed for the 2010 and 2021 events by computing the Arias intensity distribution maps (for 2010, comparing the results with the landslide distribution as observed by Harp et al., 2016).
The Arias intensity, Ia, can be considered a quantitative measure of the degree of shaking (in m s−1) on the surface. With respect to any other intensity characterization (including the one based on surveys), it has the advantage of being more objective and comparable for different earthquakes (according to Harp and Wilson, 1995). Wilson and Keefer (1985) were the first to try to correlate seismically triggered landslide distributions with this intensity measure. They also defined the following empirical attenuation relationship (Eq. 7a) in terms of magnitude (M) and hypocentral distance (R):
where P considers a possible deviation from the main law (P=0 stands for the average value).
Afterwards, Keefer and Wilson (1989) have reviewed the application of this formula and defined a new one (Eq. 7b), for magnitudes greater than 7:
We applied the previous equation as both the 2010 and 2021 can be considered M≥7 events. The R value represents the hypocentral distance map, here computed by using as source zone the blind fault rupture segments of the 2010 and 2021 events (with 0 km epicentral distance and 10 km hypocentral depth along the respective segment; information extracted from https://earthquake.usgs.gov, last access: 20 October 2021).
All equations introduced above have been applied to obtain the computation results presented below, in the Sect. 4.2 and 4.4.
This section first summarizes a series of landslide type and general distribution characteristics. Second, landslide inventory and size–frequency statistics are presented and supported by an inventory completeness analysis. Third, a study of possible climatic slope failure preconditioning and post-seismic landslide surface changes is presented, which also compares landslide distributions with monthly precipitation maps (using output maps of the Global Precipitation Measurement Mission, GPM, produced by the NASA, for different periods, according to Acker and Leptoukh, 2007). Fourth, the landslide occurrence observed in 2010 and in 2021 is compared with respective shaking intensity prediction maps.
4.1 Landslide type and distribution characteristics
Before analyzing specific statistical values of the two landslide inventories – the one compiled by Harp et al. (2016) for the 2010 event and ours completed after the August 2021 earthquake – we first have a look at the general respective spatial landslide distributions and provide basic information on the type of the mapped landslides.
The map presented in Fig. 4a shows that the global extent of landslides triggered in 2010 (pink outlines within the pink maximum extent polygon) and in 2021 (dark-red outlines within the dark-red maximum extent polygon) is quite similar (exact values are presented in Table 1). This map also shows the location of the main shock and aftershocks (empty circles, from https://earthquake.usgs.gov, last access: 20 October 2021) and the outline of the (roughly 80 km long) blind fault rupture (extracted from USGS page: https://earthquake.usgs.gov/earthquakes/eventpage/us6000f65h/finite-fault, last access: 20 October 2021). Outlines of mapping zones presented in Fig. 5 are shown by light-blue rectangles. A major difference between the two landslide distributions can mainly be observed with respect to the location of the EPGF zone. While most landslides occurred in the south of the fault zone in 2010, a relatively symmetric distribution of landslides with respect to the location of the EPGF zone can be observed for the 2021 event. This is mainly due to the fact that the fault segment that ruptured near EPGF in 2010 is located close to the coast (actually just in the south of the coast, as can be seen in the map in Fig. 4a), and thus only limited onshore surface areas could be affected by landslides in the north of the EPGF zone in 2010. However, the location of the fault segment that ruptured in 2021 is more central within the southwestern peninsula of Haiti (see focus on this region in Fig. 4b).
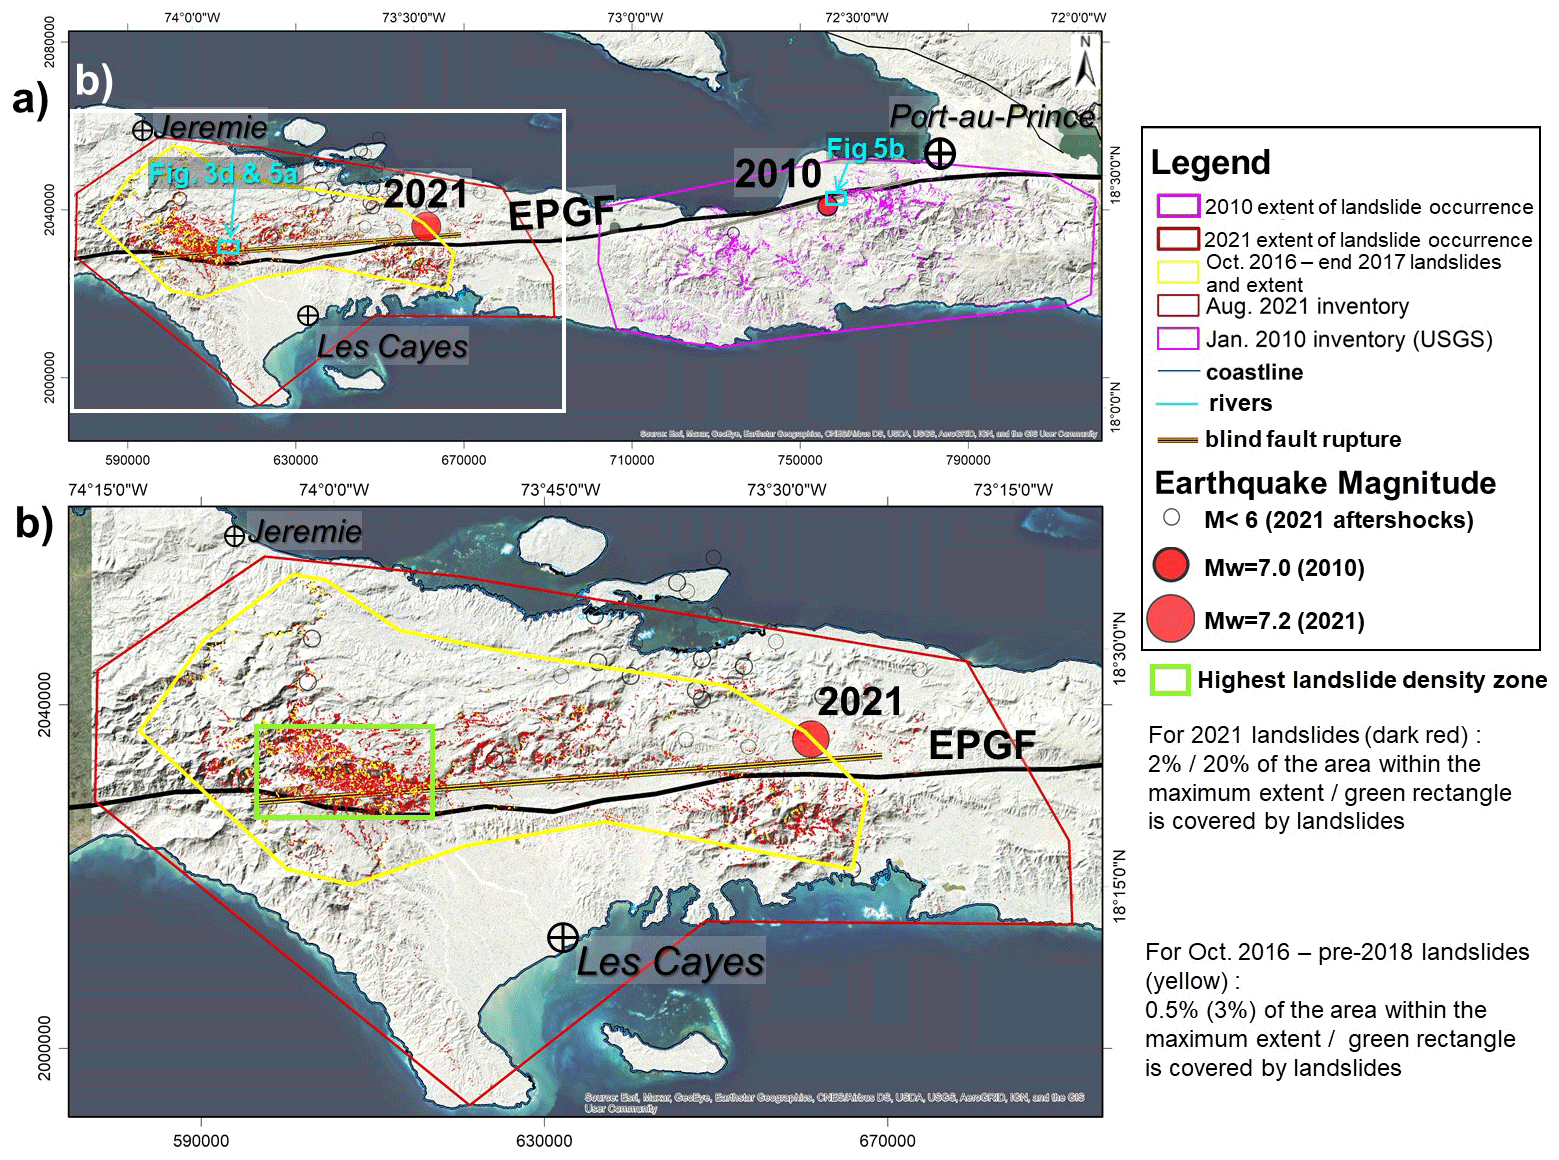
Figure 4(a) Study region with areas affected by the two Mw≥7 events. Individual landslides triggered in 2010 (Harp et al., 2016, inventory) and our landslides mapped for the 2021 earthquake and October 2016 hurricane events are shown, respectively, as pink, dark-red, and yellow polygons. The maximum extent of landslides triggered in 2010, in 2021, and in 2016 is outlined, respectively, by the large pink, dark-red, and yellow polygons. (b) Focus on the region hit by the August 2021 earthquake, with 7091 landslide locations. Map background © ESRI.
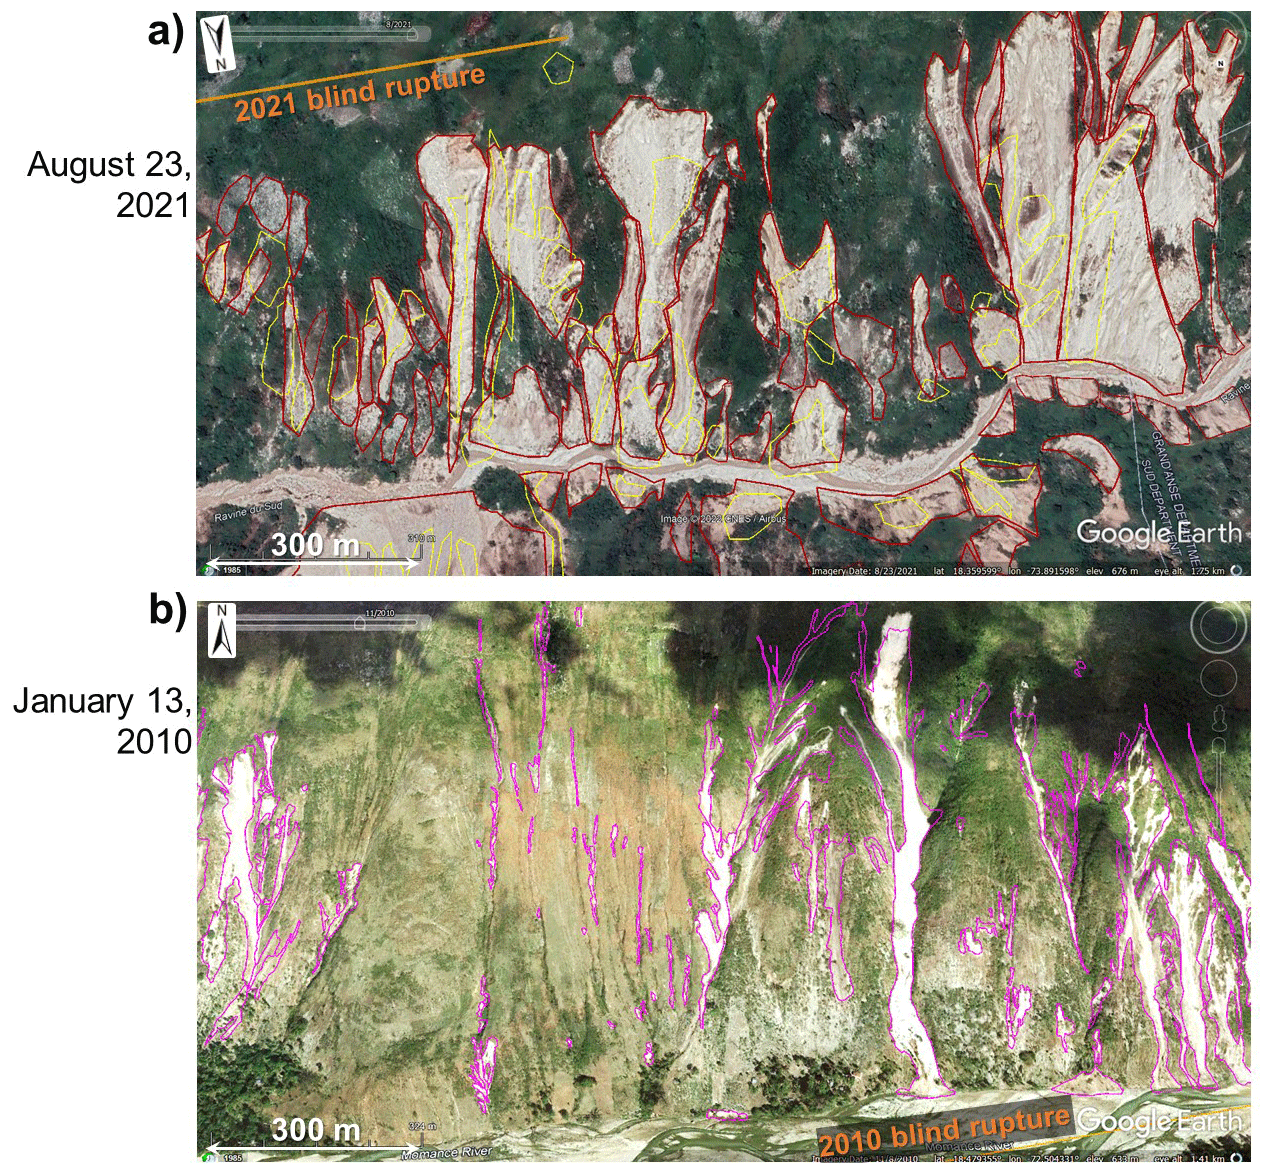
Figure 5(a) GEPro view (© Google Earth Pro) of landslides triggered by the August 2021 earthquake. (b) GEPro view (© Google Earth Pro) of landslides induced by the January 2010 main shock (with landslide outlines by Harp et al., 2016).
Another important observation is that there seems to be a gap between the zone affected by landslides in 2010 and the one affected in 2021. This means that, according to our present observations, the 2021 earthquake did not reactivate landslides triggered in 2010 – due to the large distance (>60 km) between the fault ruptures. However, it should be noted that this check could only be completed so far with the 10 m resolution Sentinel-2 imagery. Now, we cannot exclude that very small landslides (which we cannot identify on Sentinel-2 imagery) triggered in 2010 had been reactivated in 2021.
An important consequence of the specific location of the ruptured fault segments is that a few dozens of landslides with a surface area larger than 2000 m2 had occurred along the shore in 2010, where the two or three largest ones (likely including an important submarine part) had massively impacted the ocean and, thus, had produced up to 3 m high tsunami waves (see Olson et al., 2011; Poupardin et al., 2020; Fritz et al., 2013; Sassa and Takagawa, 2018). However, there is not a single report of a major coastal landslide for the 2021 event – as the fault rupture occurred at a distance of a minimum of 10 km away from the nearest shoreline. Instead, a wider onshore area was exposed to high-intensity earthquake shaking during the 2021 event. The related impact will be analyzed below on the basis of the statistical values presented in Table 1.
Concerning the types of landslides triggered by the 2021 earthquake, we can say that by far most of them can be classified as debris slides or flows (see examples in the GEPro view presented in Fig. 5a) and as medium-size (most with a volume of less than 20 000 m3) rockfalls (as shown above in Fig. 2). Thus, we estimate that at least 95 % of all landslides mapped are relatively shallow (with a depth of less than 10 m). Actually, not a single large massive landslide (>107 m3) could be identified. A similar observation was made by Harp et al. (2016) for the landslides triggered in 2010 (see view in Fig. 5b). However, when comparing individual landslides induced in 2021 with those triggered in 2010, the latter are almost systematically narrower than those of 2021 (compare the very narrow slides and flows in Fig. 5b with the typically wider ones in Fig. 5a), while located in similar geological (limestone) and topographic (hilly-mountainous) environments. Actually, in the so-called Ravine du Sud (Gorge of the South), part of which is shown above in Fig. 3 (and in the Appendix, in Figs. A2 and A3), numerous very extensive slope failures (but still relatively shallow) could be observed; most of them formed by coalescent neighboring debris slides. Thus, entire slope units (delimited by upper and lateral slope crests and the valley bottom) finally collapsed as one single mass movement. Such kind of extensive slope failures occurred far less frequently in 2010 – at least onshore, while at least a few aforementioned coastal and mostly submarine landslides must have been quite massive as their impact had triggered tsunami waves, as indicated above. This assumption cannot be further verified as no higher-resolution marine floor surface data are available. However, we are aware that a full mapping of submarine or mixed subaerial–submarine slope failures would be necessary to better understand the landslide distribution characteristics, especially for the 2010 event, as further discussed below.
The fact that no really massive landslides had occurred (onshore), both in 2010 and 2021, also explains why only a few longer-lasting landslide dams had formed on the rivers. We could identify only about 100 minor dams (with a volume of less than 50 000 m3, according to our estimate, based on the maximum surface area value of about 5000 m2 measured for the largest observed dam and a related maximum possible thickness of 15 m, compared with the local morphological setting) after the August 2021 main shock, most of which had disappeared before the end of October 2021; and, only a few dozens of them were impounding temporary lakes. In this regard it should be noted that Zhao et al. (2022) do not make any reference to landslide dams formed in 2021, while Martinez et al. (2021) have outlined almost 300 (at least partial) landslide dams after the event. However, the latter also indicate that most of them failed a few days after formation; still, at the time of publication of their open-file report in December 2021, they consider 35 of the remaining dams as potentially hazardous. Here, we will not further analyze this aspect as any related hazard assessment would require a site-specific approach that is not targeted by this first study completed at a regional scale.
While debris slides are the predominant type of 2021 slope failures in the central mountain ranges, widespread soil slides (but of smaller volume, typically of less than 10 000 m3) had occurred along the hills (with an absolute crest altitude of less than 400 m and a relative height of less than 200 m with respect to the nearby valley bottom) of the peninsula located in the southwest of Les Cayes (southern part of map in Fig. 4b). As the slopes are very gentle and often seem to be less than 5∘, it could be that those failures, many of which affected agricultural areas (marked by brownish disrupted fields), are related to liquefaction phenomena. However, also this observation has to be reexamined by ground-control and site-specific studies, as the remote analysis based on 1 m resolution imagery does not allow us to fully confirm this interpretation.
4.2 Landslide inventory and size–frequency statistics
4.2.1 Landslide inventory statistics
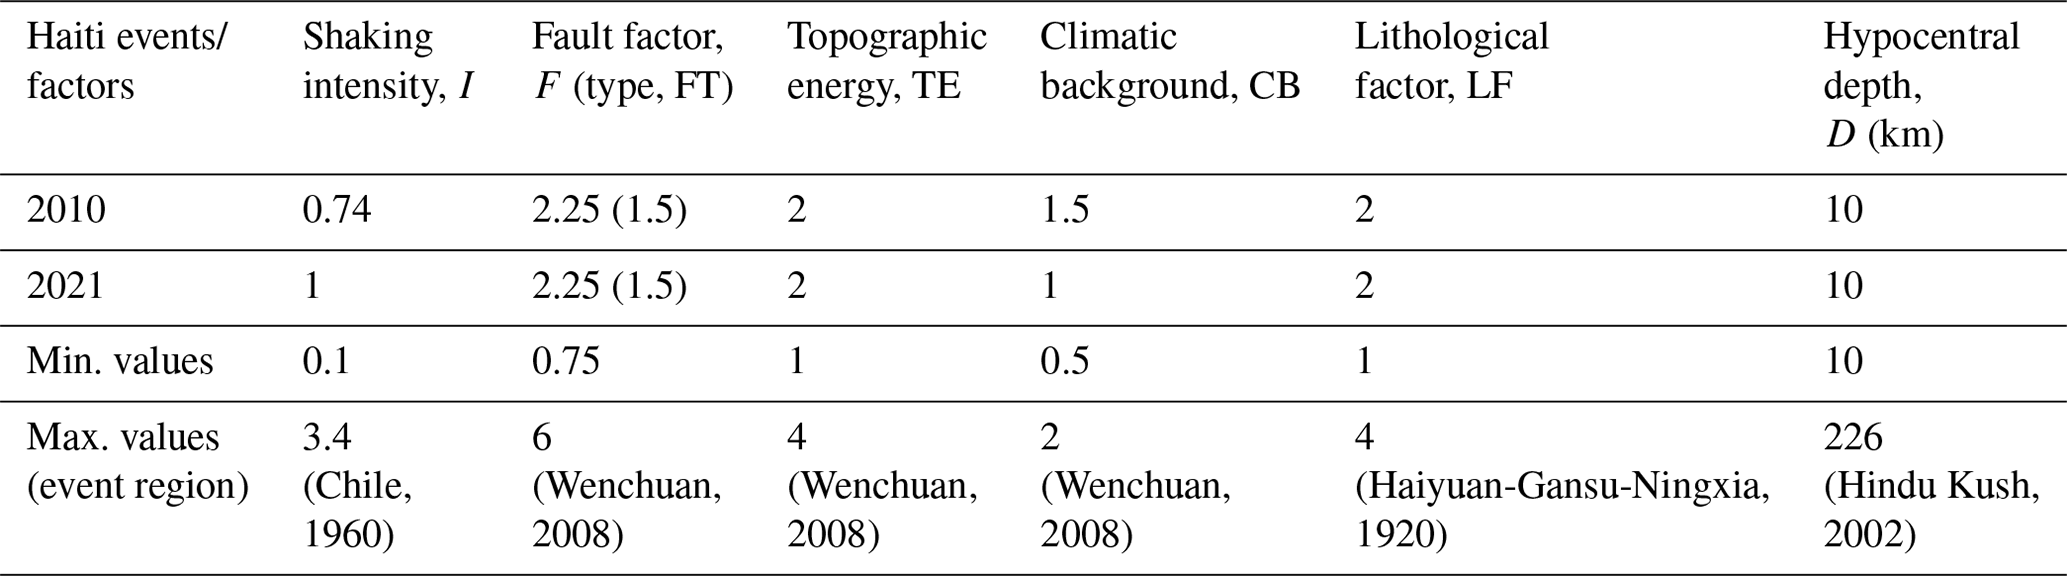
Table 1 presents an overview of general landslide inventory statistics for the 2010 and 2021 events. The numbers in the first row show that apparently fewer landslides have been triggered in August 2021 (considering also the numbers of 4893 landslides published in the open-file report by Martinez et al., 2021, and of 8444 landslides mapped by Zhao et al., 2022) than in January 2010. At least two inventories, the one by Harp et al. (2016) and the one of Xu et al. (2014), include far more landslide outlines (23 567 for the first and 30 828 for the second) than our catalog for 2021 (7091). Only the inventory by Gorum et al. (2013) that was the first one to be completed for the 2010 event contains fewer data (4490 points – not polygons – marking the landslide location). However, paradoxically, a much wider surface area is covered by the apparently fewer 2021 landslides (a total area of 84 km2; see row 3 in Table 1, also to be compared with a smaller total area of 2021 landslides indicated by Zhao et al., 2022, of 45.6 km2) than by the more numerous 2010 landslides (sum of surface areas of about 25 km2, calculated for the Harp et al., 2016, inventory). This discrepancy will be discussed below, considering the fact that 2021 landslides could only be mapped from higher-resolution imagery for about half of the potentially affected area (in the eastern part). For the western zone, only Sentinel-2 images were available until the end of 2021. Those 10 m resolution images typically do not allow for the (complete) mapping of landslides smaller than 2000–3000 m2. Therefore, we focus only general landslide inventory statistics, first, by comparing the observed landslide numbers with those predicted by Havenith et al. (2016) and Malamud et al. (2004), respectively, for the two earthquakes – always keeping in mind that the 2021 inventory is not complete for landslides smaller than about 3000 m2 (this value will also be analyzed below on the basis of the size–frequency relationship). As introduced above (see Eq. 1), according to Havenith et al. (2016), this number depends on the seismic intensity (I, using as input the Ia value computed for the respective earthquake magnitude), the fault factor (type, size, and possible surface rupture), the topographic energy (maximum difference of altitudes in the affected area), the climatic background (in this case marked by tropical wet climate), and the lithological factor (here using an average type, for rocks in general). For the precise classification of the different factors, the reader is referred to Table 1 in Havenith et al. (2016). Here, we used the values presented below in Table 2 (considering both events in 2010 and 2021), which indicate the following:
-
the shaking intensity values, I=0.74 in 2010 and I=1 in 2021, are characteristic for the respective magnitudes (note that this factor can reach a value of up to 3.5 in the case of high-magnitude earthquakes, with Mw>8);
-
the fault factor, F=2.25, can be considered similar in both cases, marked by an oblique slip that occurred along a fault segment with a length of 50–100 km, with no clear surface rupture (note that F can reach a value of up to 6 in the case of a surface rupture of an activated reverse fault segment with a length of more than 300 km, such as observed for the Wenchuan earthquake in 2008);
-
the topographic energy value, TE=2, in both cases characterizes a surface morphology marked by local altitude changes of more than 500 m within a hilly region (only smaller mountains with an altitude of less than 2500 m can be found in the regions affected by the 2010 and 2021 events; note that Havenith et al., 2016, selected a value 4 to mark the high steep slopes in the Longmenshan Mountains affected by the Wenchuan earthquake in 2008);
-
the climatic background factor, CB=1.5, marks relatively wet conditions for the 2021 event, while CB=1 indicates average conditions for the 2010 event (the higher value chosen for 2021 considers some preconditioning of slope instability by Hurricane Matthew, as explained in the next section; note that Havenith et al., 2016, selected a value CB=2 for the very wet conditions that can be found in the Longmenshan Mountains affected by the Wenchuan earthquake, characterized by yearly precipitation values of more than 3000 mm – while the target areas in Haiti are marked by values of about 2000 mm);
-
the lithological factor, LF=2, indicates that both weathered rocks and soft soils can be found in the affected area (note that Havenith et al., 2016, selected a maximum value, LF=4, for the Haiyuan–Gansu–Ningxia earthquake event, China, in 1920 (also known as the 1920 Haiyuan earthquake), as it affected an area that is almost entirely covered by loess deposits, which are highly susceptible to slope failure).
Table 1The 2010 and 2021 landslide inventory characteristics – where not specified for the 2010 event, the Harp et al. (2016) inventory is used. The largest values for each specific observation/estimate (if more than 1 indicated) are bold.
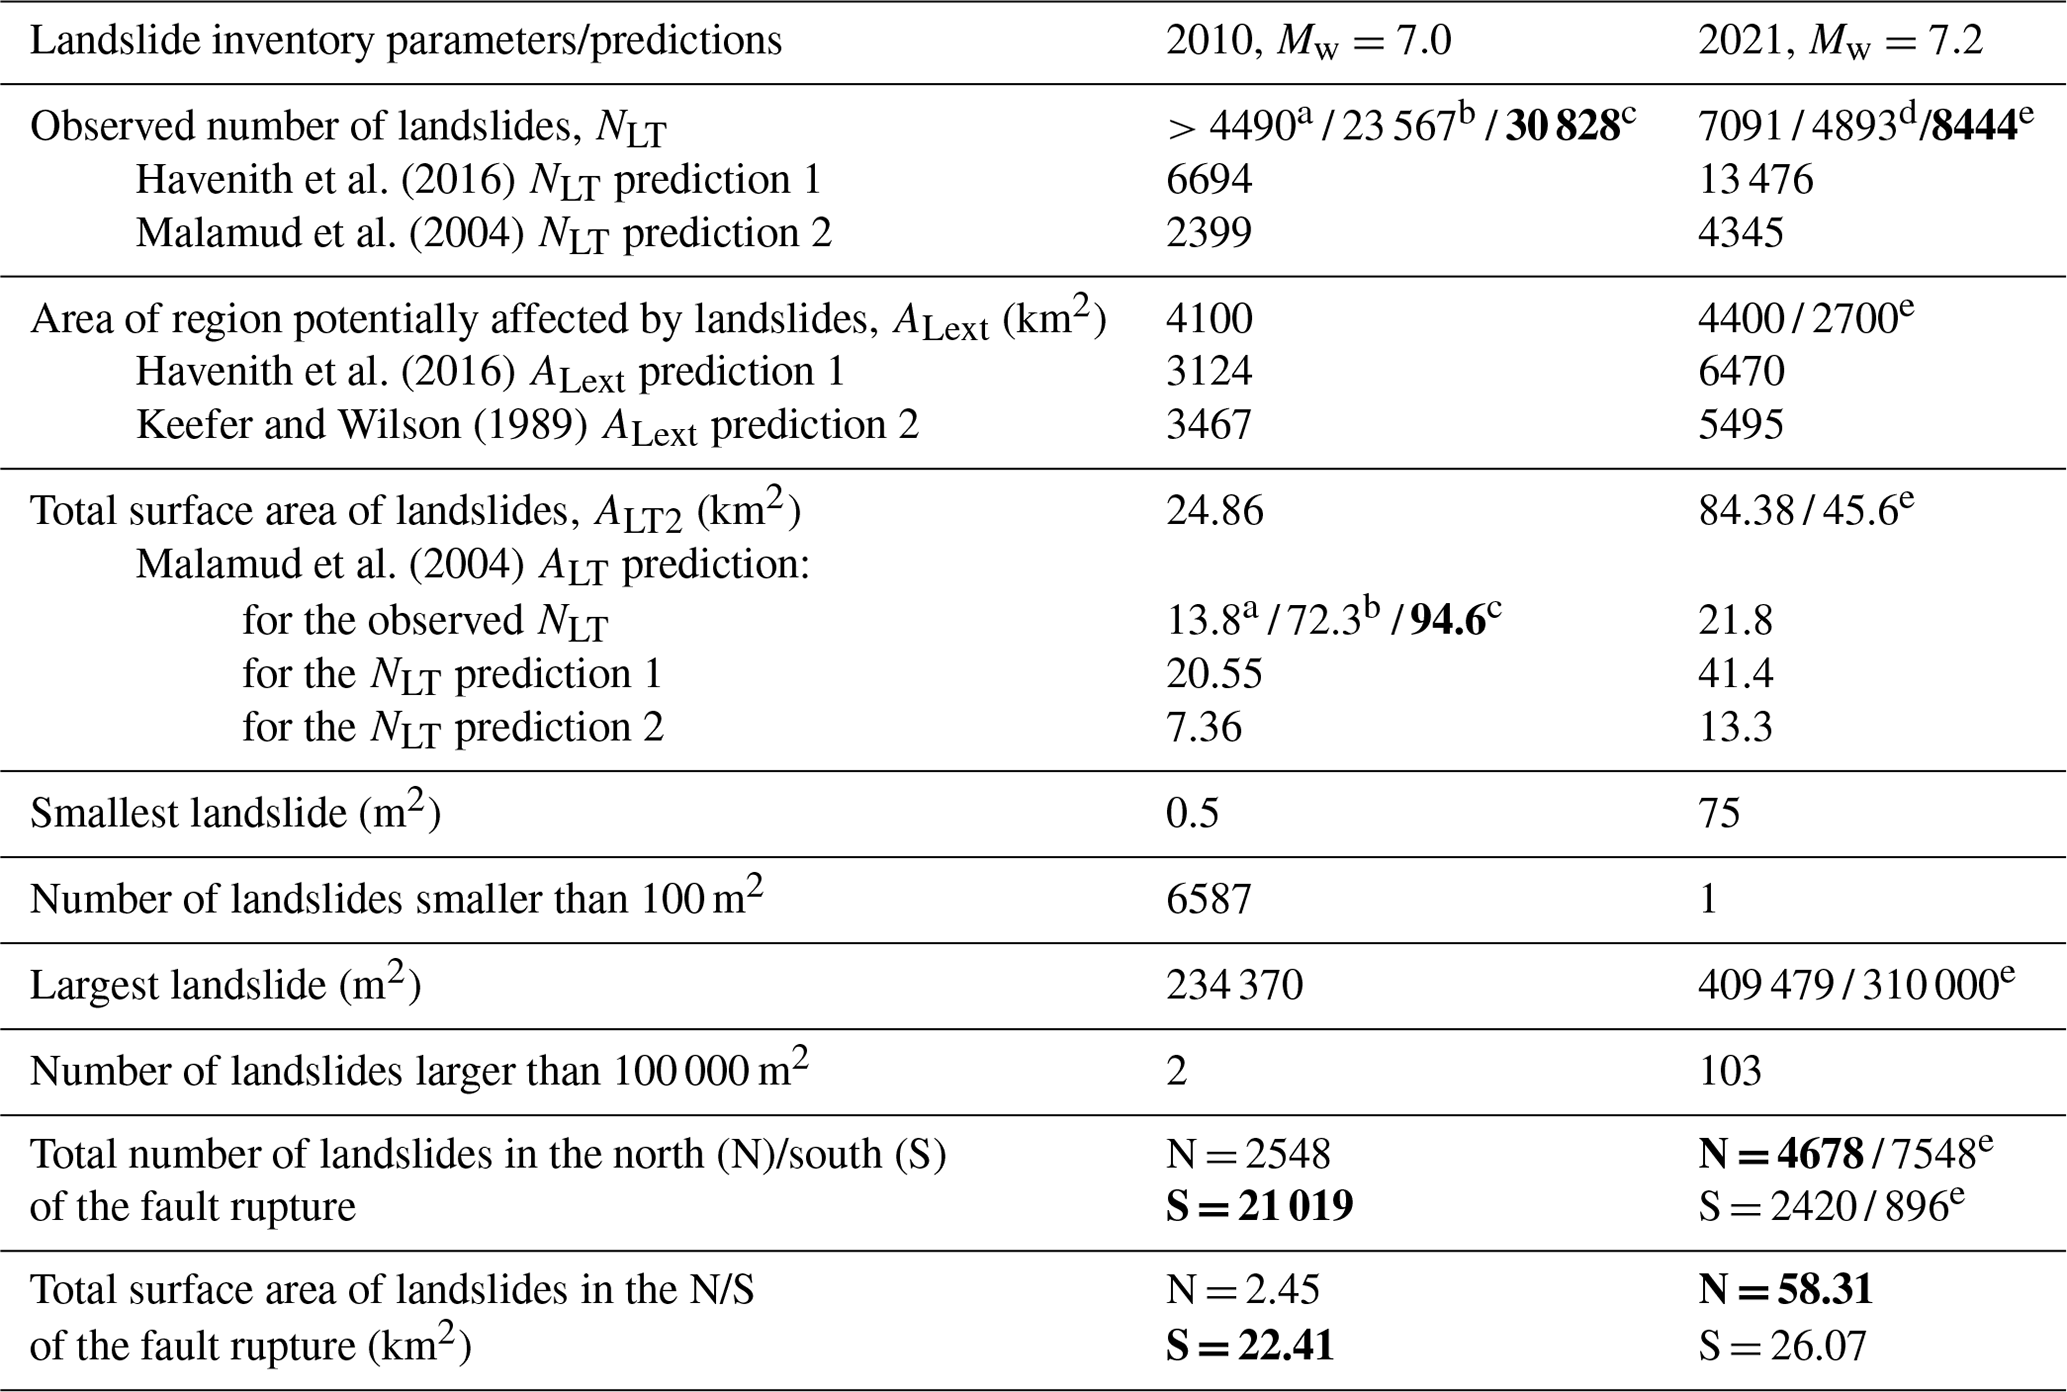
a Number of landslides observed for the 2010 event by Gorum et al. (2013). b Number of landslides observed for the 2010 event by Harp et al. (2016). c Number of landslides observed for the 2010 event by Xu et al. (2014). d Number of landslides observed for the 2021 event by Martinez et al. (2021). e Number of landslides observed for the 2021 event by Zhao et al. (2022).
Table 2Factors contributing to the total number and surface area of landslides triggered by the 2010 and the 2021 earthquakes, according to the prediction proposed by Havenith et al. (2016). The minimum and maximum values proposed by Havenith et al. (2016) are also indicated, the latter with information on the region affected by the event, to which this maximum factor value was attributed.
When these different factor values are combined according to Eq. (1) presented above, the total numbers of landslides, NLT, predicted for the 2010 and 2021 events are, respectively, 6694 and 13 476. These values can be compared with the numbers predicted by the simple equation (Eq. 2), proposed by Malamud et al. (2004), using only the earthquake magnitude as input: 2399 for the 2010 event and 4345 for the 2021 event. The latter prediction seems to clearly underestimate the observed numbers of triggered landslides, while those predicted by using Eq. (1) by Havenith et al. (2016) provide intermediate values: larger than the number observed by Gorum et al. (2013) but smaller than the numbers observed by Harp et al. (2016) and by Xu et al. (2014). The two predictions (Eqs. 1 and 2) were also applied to the 2021 event; the first one producing a higher NLT (13 476) than the observed value and the second one producing a lower value (4345).
As shown on the maps in Fig. 5, also the total area within the maximum extent of landslide occurrence, ALext, was outlined and then measured for the 2010 and 2021 events. Actually, related areas are relatively similar: 4400 km2 for 2021 and 4100 km2 for 2010. It should be noted that Zhao et al. (2022) identified all 2021 landslides within a smaller extent area of 2700 km2. This can partly be explained by the fact that they did not map any landslides in the southern zone (marked by the presence of the smaller soil slides). All these values can be compared in Table 1 with the predictions by Havenith et al. (2016) and by Keefer and Wilson (1989), corresponding, respectively, to 3124 and 3467 km2 for the 2010 event and to 6470 and 5495 km2 for the 2021 event. In this case, the very simple equation proposed by Keefer and Wilson (1989) provides an estimate of ALext that is closer to the observed values than the one produced by the more complex relationship proposed by Havenith et al. (2016).
The third row of Table 1 compares the total observed slope areas affected by landslides, ALT, corresponding, respectively, to a value of 24.86 km2 for the 2010 event and of 84.38 km2 for the 2021 event (the latter value being significantly smaller for Zhao et al., 2022, close to 45 km2), with the values predicted by Eq. (5) by Malamud et al. (2004) for each event. For 2010, we applied this relationship to the three observed values indicated in the first row and by using the NLT, predicted respectively by Havenith et al. (2016) and Malamud et al. (2004). Among all total landslide surface area values predicted for the 2010 event, it can be seen that the one based on the Havenith et al. (2016) NLT estimate produces the best fit (20.55 km2) when compared with the observed value of 24.86 km2. For 2021, the respective predictions all underestimate the observed total landslide surface area value, ALT, by a factor of at least 2, even when the highest NLT estimate (using Eq. 1) by Havenith et al. (2016) is used. Using the preceding information, it is also useful to compare the density values (here, expressed in %) of landslide areas within the maximum extent surface area, which correspond to 0.5 % and 2 %, respectively for the 2010 and 2021 events. Within the green rectangle (zone with highest landslide density) shown in Fig. 4 above, even 20 % of all the area is covered by landslides. Possible explanations for the much larger total area (and the higher density) of landslides triggered in 2021 compared with 2010 will be provided in the discussion.
The fourth and fifth rows of Table 1 show that the smallest landslide mapped by Harp et al. (2016) has a surface area of 0.5 m2, and their inventory contains 6587 landslide polygons smaller than 100 m2, while our inventory for 2021 only includes one landslide with a surface area smaller than this value. This comparison also confirms that our inventory is likely to be incomplete for such small landslides, as there is no physical reason why there would be much fewer smaller landslides triggered in 2021 than in 2010. On the other hand, the largest landslide mapped for the 2021 event (>400 000 m2) has almost twice the size of the largest one that occurred in 2010, when actually only 2 landslides larger than 100 000 m2 had been triggered; in 2021, we could outline more than 100 landslides larger than this value. And, for these larger landslides, we can be sure that we mapped them all and outlined them correctly, without amalgamating distinct slope failures.
Finally, Table 1 provides information about the distribution of the 2010 and 2021 landslides with respect to the blind fault rupture projected on the surface (near the EPGF outline). As already introduced above, a much larger number of landslides occurred in the north of the latter in 2021 (4678, which is ∼66 % of all landslides) compared to 2010 (2548, at least for onshore slope failures); for 2021, Zhao et al. (2022) even mapped 89.4 % of all landslides (7548 landslides as indicated in Table 1) in the north of the activated fault. This higher proportion of landslides in the north of the fault compared to ours can also partly be explained by the fact that Zhao et al. (2022) did not map any distant soil slides in the south of the fault rupture. Consequently, more landslides occurred in 2010 in the south of the respective blind fault rupture. As the total number of mapped landslides is much larger for the 2010 event (which also means that only the relative proportions should really be considered), the difference between those numbers is very high: 21 019 occurred in the south of the fault rupture in 2010 (about 90 % of all landslides) and only 2420 in the south of the respective fault rupture in 2021 (about 35 %). However, when the total surface area affected by landslides is considered, the 2021 event affected more zones both in the south and the north of the fault rupture than the 2010 event. Still, the distribution of landslides for each event with respect to the fault rupture remains the same also when considering the affected surface areas: they are much larger in the south of the fault rupture for the 2010 event but larger in the north for the 2021 event. The main explanation for this difference has already been provided above: the fault segment that ruptured in 2010 is located close to the coast, with limited onshore surface areas being exposed to landslide activity in the north of the respective fault rupture, while the location of the fault rupture in 2021 is more central with respect to the shorelines of the southwestern peninsula of Haiti.
In addition to the numbers shown in Table 1 and explained above, we also provide two values for the smaller landslide inventory compiled for the period between 10 October 2016 and the end of 2017. For this period, 625 landslide zones have been outlined (see yellow polygons shown on the views and map in Figs. 3 and 4), covering a total surface area of 9.5 km2 (located within an area of maximum extent of these landslides of 1770 km2 as outlined in yellow, above in Fig. 4). This also means that about 0.5 % of the area within the maximum extent was covered by landslides. Highest concentration of landslides can be observed within the green rectangle shown in Fig. 4, where 3 % of the total area is covered by landslides. However, we must indicate that these values represent approximations as only 50 % of the potentially affected area is covered by cloud-free imagery on GEPro for this period, most of which actually covers the short period between 10 and 28 October 2016 (just after the Hurricane Matthew event). Post-2017 imagery was not used as we could observe that many landslides identified shortly after 10 October 2016 had already disappeared in 2018–2020 due to revegetation of the affected area (see, above, the comparison between GEPro views of October 2016 and February 2020 in Fig. 3).
4.2.2 Landslide size–frequency statistics
We also computed frequency-density values for various landslide surface area classes as shown on the graph in Fig. 6. There are two important parameters to be analyzed for the observed frequency-density distributions, according to Malamud et al. (2004), among others: the first part is represented by the power-law decay (see also introduction in Stark and Hovius, 2001) that appears as a linear decay in the log–log graph below; the second part is the so-called “rollover”, which can be observed for a landside surface area where the exponentially decreasing number of larger landslides turns into a decrease in the number of smaller landslides. Here, we will only focus on the power-law decay that can be observed for the larger landslides, for which we consider both the 2010 and the 2021 inventories as complete. Figure 6 shows that such a power-law decay can be observed for 2010 landslides larger than 2000 m2 and for 2021 landslides larger than about 4000 m2. This comparison confirms the likely incompleteness of the 2021 inventory, even for landslides smaller than 4000 m2. The rollover part will not be analyzed here as it occurs for smaller landslides, well below this limit of completeness of our 2021 inventory (referring to estimates by Malamud et al., 2004).
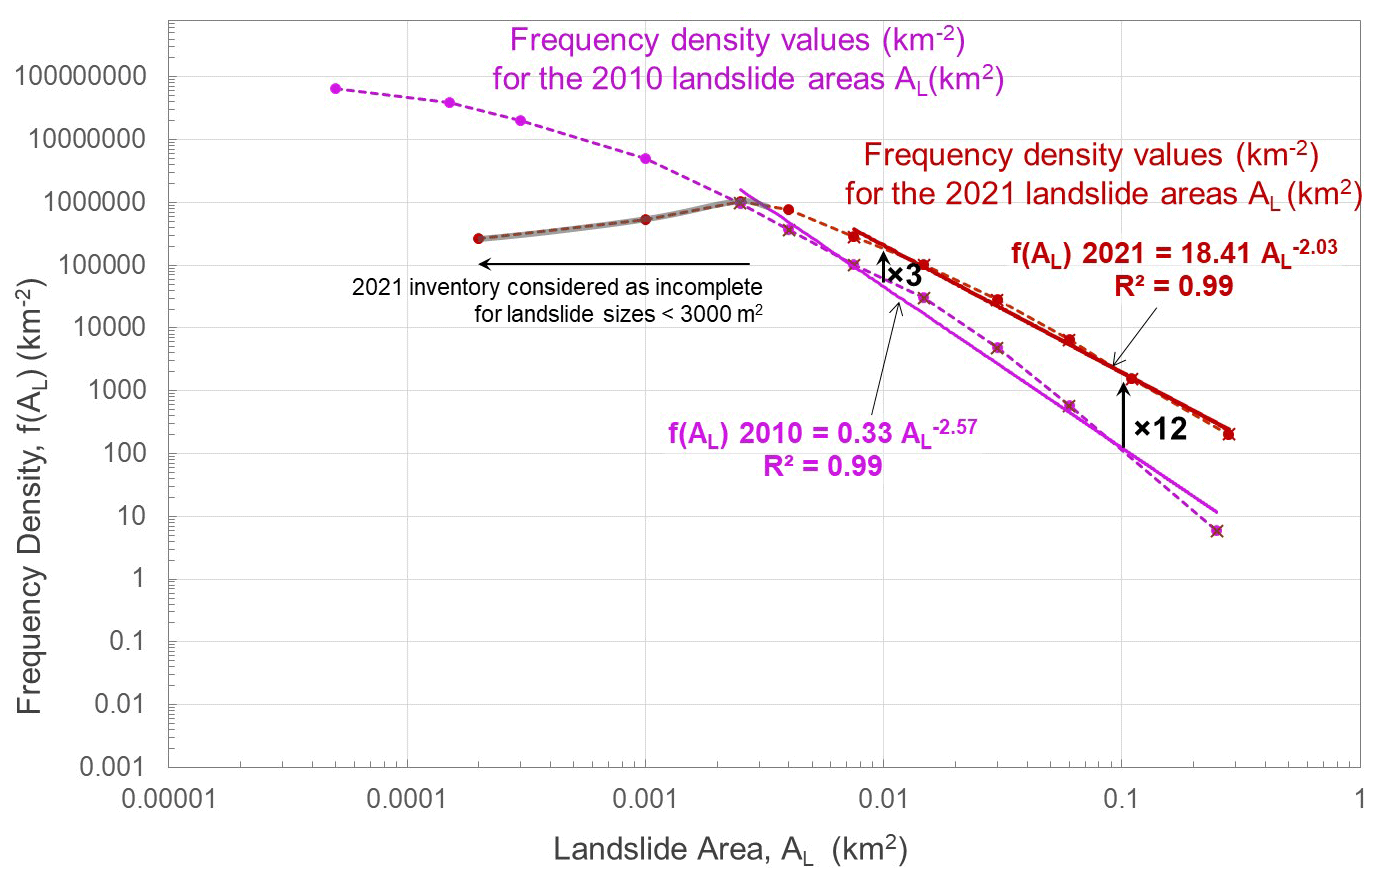
Figure 6Frequency-density graphs developed for the 2010 (in pink, by Harp et al., 2016) and the new 2021 landslide inventories (in dark red), with related power-law decays outlined.
For the larger landslides, the comparison between frequency-density outputs of the 2010 and 2021 landslide inventories presented in Fig. 6 first shows that related values are higher for the latter catalog. Actually, related frequency-density values are 3 times larger for the landslide size class of 10 000 m2 and even 12 times for the one of 100 000 m2. And, for those larger landslide classes, the absolute value of the power-law decay is slightly higher (−2.57, for the pink line fitting the 2010 data) for the 2010 inventory than for the 2021 one (−2.03, for the red line fitting the 2021 data – to be compared with the equivalent value of −2.47 determined by the Zhao et al., 2022, for their inventory). Thus, the relative smaller decay exponent observed for the 2021 landslide inventory explains why related frequency-density values are increasingly (i.e., for larger landslide sizes) higher compared with the 2010 values observed for the same landslide size classes. These different size–frequency characteristics of the 2010 and 2021 landslide inventories will shortly be discussed below (considering the constraint of inventory completeness for both events), but the most important information to be retained at this level is that for all landslide classes larger than 4000 m2 more landslides have been observed in 2021 than in 2010.
4.3 Climatic (pre- and post-seismic) conditioning of slope instability
The climatic influence on landslide occurrence (in 2021) has been introduced above, by considering the possible impacts of hurricanes on slope failure occurrence, marked both by preconditioning of slope instability and by post-seismic intensification. We first start analyzing the last effect, by considering the potential impact of Hurricane Grace on post-seismic landslide intensification, on 16–17 August 2021 (when it had crossed the target region and was actually classified as tropical depression at that stage). A possible effect of related rainfalls on landslide occurrence has already been highlighted, for instance, on the AGU landslide blog (by Petley, 2021, on https://blogs.agu.org/landslideblog, last access: 10 June 2022). This effect could be confirmed when we compared Sentinel-2 imagery collected right after the earthquake (2 h after the main shock) with images remotely sensed after 17 August 2021. As indicated above and shown in Fig. 4, an intensification of denudation could indeed be observed after the Tropical Storm Grace event. However, one important limitation has to be highlighted: this comparison could only be completed for about 10 % of the area potentially hit both by the earthquake and by Grace, due to the intense cloud cover present in the target region during that period. Furthermore, another effect could have contributed to slope failure intensification after the main shock on 14 August – the one related to the aftershocks (see empty circles shown in all maps above). However, analyzing this effect would require a refinement of the satellite image analysis both in space and time, which is hardly possible considering the extensive cloud cover present in the target area when all those seismic shocks occurred. Here, we will focus on the possible climatic influence, which can better be outlined when comparing the landslide distribution with actual precipitation maps. Therefore, we used the aforementioned Global Precipitation Measurement Mission (GPM) data. Figure 7 presents the three following types of GPM maps: average monthly precipitation maps for the whole period of 2000–July 2021, for all months of October between 2000–2020, and for October 2016, when Hurricane Matthew had crossed the island. Additionally, we compare in Fig. A4 the first and third map with the precipitation map produced for August 2021, when Hurricane Grace had affected the target area.
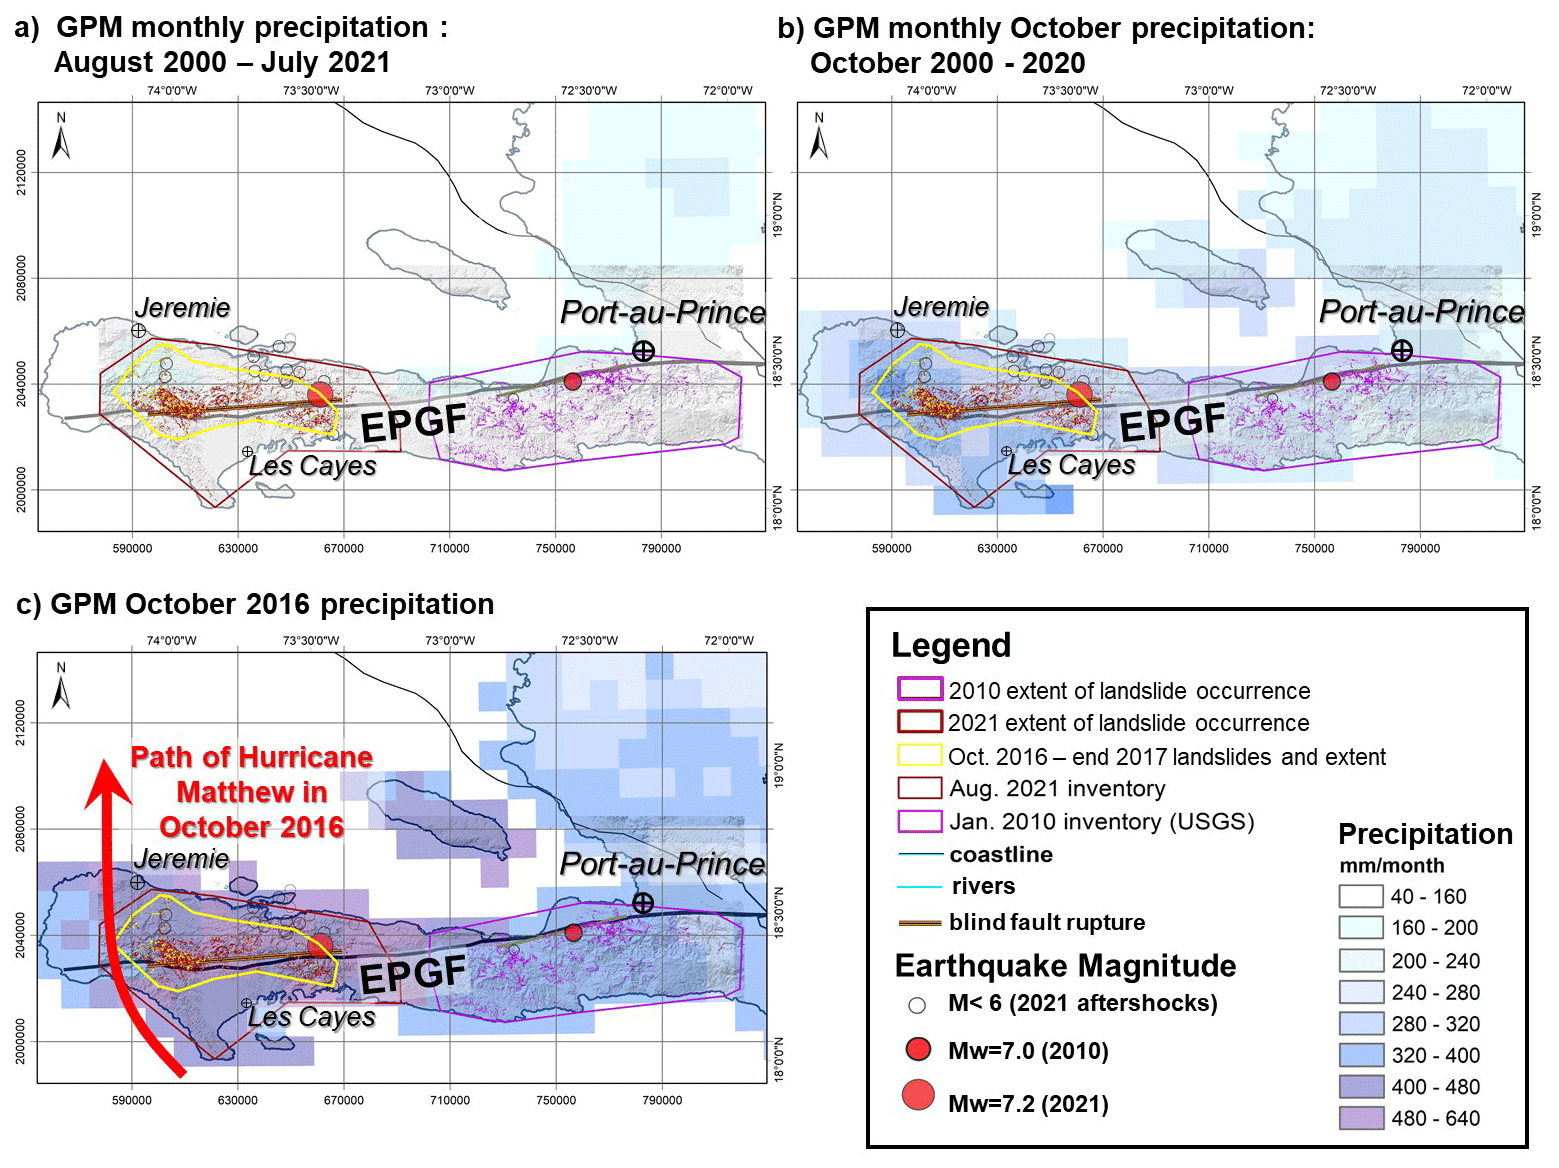
Figure 7Monthly © Global Precipitation Measurement Mission (NASA) maps (0.1∘ resolution, values in millimeters per month) for southwestern Haiti, (a) for all months between August 2000 and July 2021, (b) for the month of October between 2000 and 2020, and (c) for October 2016 (marked by the Hurricane Matthew event).
While comparing the average monthly precipitation rates between 2000 and 2021 (Fig. 7a) with the one of October 2016 (Fig. 7c), we can see that, for the latter month, a peak of intensity of 626 mm can be observed for the area between Grande Rivière de Nippes and Petite-Rivière-de-Nippes, situated immediately in the north of the epicentral area of the 2021 main shock. Actually, the whole area potentially affected by the August 2021 earthquake had been exposed to clearly higher precipitation rates of more than 400 mm in October 2016, while, according to the GPM, average precipitation recorded in October between 2000 and 2020 varies typically between 200 and 320 mm (as shown by the map, in Fig. 8b). For October 2016, those values were also the highest ones compared with the rest of the country and are also larger than those obtained for August 2021 (max. 320 mm) for the target zone, when Hurricane Grace had crossed this region. This clearly indicates that the precipitation values must be related to a specific (and even exceptional) climatic event, which can easily be identified as Hurricane Matthew, which had crossed the western peninsula (including the region hit later by the August 2021 earthquake) on 4–5 October 2016. And, precisely for this region that had been exposed to abnormal precipitation rates in October 2016, we could outline 625 landslides triggered after the Hurricane Matthew event and before the end of 2017 (yellow polygons shown above in the maps in Figs. 1–4 and below in Fig. 7). Additionally, most of these October 2016 to end of 2017 landslide zones (at least 90 % of them) are located within those mapped for the August 2021 seismic event (which are still marked by a much higher level of denudation compared to the October 2016 activation). In the discussion, we will analyze how such Hurricane Matthew might have preconditioned slope instability in the region hit by the 14 August 2021 earthquake. We will also consider a general influence of tropical storms on the wide distribution of the landslides triggered in 2010 (and also for those triggered in 2021, in addition to the Hurricane Matthew effect).

Figure 8(a) Arias intensity (Ia) attenuation maps computed (by using Eq. 7b, by Keefer and Wilson, 1989) for the 2010 and 2021 main shocks in Haiti; see also indication of the percent of total surface area of landslides observed for different Ia thresholds. (b) Focus on the respective map computed for the 2021 event.
By comparing equivalent data (not shown here) of the merged satellite-gauge precipitation estimate for August 2021 with the monthly precipitation map averaged for all months of the previous 20 years, we can clearly see that August 2021 was indeed marked by a higher precipitation rate, which is most likely related to the Grace event. However, the most intense precipitation did not affect the region hit by the 2021 earthquake but instead affected the eastern part of the peninsula, roughly covering the same region as the one affected by the 2010 event (note that we did not check any landslide reactivation after Grace for that area). The region hit by the 2021 earthquake was not affected by much higher monthly precipitation rates than usual: for the central seismically affected zone, in the north of Les Cayes, about 240–280 mm had been recorded in August 2021, against a monthly average of 200 mm. Thus, just by considering these data, one would not expect an important climatic contribution to slope failure occurrence in the region affected by the 2021 earthquake. Still, an influence could be observed, and this is likely to be related to the concentration of most of the monthly precipitation of August 2021 within the 2 d (16 and 17 August) of the Tropical Storm Grace event, just 2 d after the 2021 main shock. As indicated above, we estimate that related precipitation has resulted in an increase in landslide surface areas of about 10 %–15 %. Due to the limited extent of zones where this check can be made (only considering the cloud-free areas on the Sentinel-2 image of 14 August 2021), it was decided to map all areas covered by landslides after 14 August 2021, as well as those which are likely to have been (re)activated by rainfall. The total effect of the latter can barely be controlled and quantified outside the 10 % of cloud-free zones visible on the image collected right after the main shock. The only correction that can be made is to reduce the total surface area mapped as landslides by those 10 %–15 % to estimate the one that was actually affected by co-seismic slope failures: thus, instead of considering the value of 84 km2, it is possible that co-seismic landslides covered a total surface area of only 75–78 km2 – which is still 3 times more than the total surface area covered by the 2010 co-seismic landslides (close to 25 km2).
4.4 Shaking intensity maps
Above, we fist analyzed the possible climatic influence on seismically induced slope failures as it could affect the landslide distribution and thus has to be taken into consideration when assessing and interpreting the seismic effect on landslide occurrence. The latter will only be analyzed here at a regional scale. Therefore, we compare the landslide distributions observed for the 2010 and 2021 events with the respective estimated Arias intensity (Ia) attenuation maps, computed by applying Eq. (7b) introduced above, as recommended by Wilson and Keefer (1985) and also by later studies (e.g., Harp and Wilson, 1995, among many others). The map in Fig. 8a presents the 2010 and 2021 mainshock Ia attenuation values, with a maximum shaking intensity of 11.2 m s−1 computed for the 2021 event and 7.9 m s−1 for 2010 (respective maps are partly overlapping in the central region but not summed up, keeping the individual values). This map shows that all 2010 and 2021 landslides are included within a zone marked by an Ia threshold of 0.2 m s−1 (close to the one proposed by Keefer and Wilson, 1989, for disrupted slides and falls). Actually, for 2021, 99 % of the total landslide surface areas are even located within a zone marked by Ia values lager than 1 m s−1; however, only 80 % of the total surface areas of the 2010 landslides are included within the respective Ia≥1 m s−1 zone. Thus, the latter mass movements appear as more dispersed with respect to the estimated seismic intensity attenuation than the 2021 ones. The 2021 landslides are indeed most concentrated, as indicated above, within the green rectangle (see Fig. 8b, marked by Ia values of 4–11 m s−1), with an area of 2s00 km2 that contains 40 km2 of landslide-covered zones (20 % of total area).
Notwithstanding the relative dispersion of 2010 landslides and the overlap of Ia values larger than 0.2 m s−1 in the central zone between the two blind fault ruptures of 2010 and 2021, not a single landslide of 2010 seems to have been reactivated in 2021. This observation raises the question of whether the central landslide gap is due to an overestimation of the Ia values in this central zone (as this zone is marked by Ia values above the aforementioned minimum threshold of 0.2 m s−1, for both events, and thus should have been affected by landslides both in 2010 and 2021, according to the shaking intensity prediction parameter) or whether this zone is simply less susceptible to (seismic) slope failures.
To answer this and other related questions, a full landslide susceptibility analysis has been completed and will be presented in another paper. Here, only the possible links between landslide distribution – the aforementioned seismotectonic and climatic factors – will be discussed.
5.1 Discussion about landslide distribution characteristics
From the comparison of the two landslide catalogs (2010 and 2021), we could first infer that apparently not a single landslide triggered in August 2021 occurred within the zone previously impacted by the 2010 event. There is a gap of about 10 km between the westernmost 2010 and the easternmost 2021 landslide (see gap between the general outlines of the maximum extent of landslides triggered in 2010 and in 2021 shown on the map in Fig. 4a). Thus, we assume that there was no obvious preconditioning of landslide generation in 2021 by the 2010 event, while landslide studies completed in other parts of the World (e.g., by Parker et al., 2015, for events in New Zealand) could outline an influence of previous earthquakes on landslide occurrence during later events. The absence of this influence by the 2010 earthquake is probably due to the long distance (the gap) of about 60 km between the fault segments that ruptured in 2010 and in 2021. However, by citing Saint Fleur et al. (2020), Stein et al. (2021) hint at an older event, from 1770, with an assumed magnitude of 7.5 and an epicenter located precisely in the gap between the 2010 and 2021 blind fault ruptures, which could also have affected the region hit by the 2021 earthquake. At present, we cannot exclude that this older event had preconditioned some slopes (by soil weakening, rock fracturing) affected by some larger landslides in 2021; however, very shallow slope failures initiated in 1770 are unlikely to have stayed in place over such a long period of more than 250 years, as they would have been washed away by the next tropical rains.
Second, none of the two earthquakes triggered very massive landslides, such as deep-seated rockslides with a volume of more than 10×106 m3 (while extensive areas are covered by layered and weathered limestone that could also produce massive slope failures; but this aspect will not be further discussed here as the related geological influence on landslide occurrence will be analyzed in the landslide susceptibility paper presently under preparation). Such massive failures have been observed after many M7+ events in other mountainous regions of the world: see Fan et al. (2018) for the 2008 Mw=7.9 earthquake in China or Havenith et al. (2015) for a series of M>7 events that hit Central Asian mountain regions during the last 120 years. This is partly due to the fact that the regions hit by the two earthquakes in Haiti are represented by mountains of limited elevation changes, typically less than 1000 m – while, for instance, the Longmenshan Mountains hit by the 2008 Wenchuan earthquake present elevation changes of up to 3000 m over relatively short (<6 km) distances (Fan et al., 2018). This fact, combined with the higher magnitude of the Wenchuan earthquake (Mw=7.9), could partly explain the much larger number of massive rockslides triggered by the latter event in China. However, we also have to consider some counterexamples of regions marked by mountainous relief that did not produce any very massive rockslides during high-magnitude earthquakes (just like the 2010 and 2021 Haiti events), such as the part of the Himalayas hit in 2015 by the Gorkha earthquake (see Lacroix, 2016). Thus, this problem related to the more or less likely occurrence of massive rockslides in regions hit by high-magnitude earthquakes is relatively complex and cannot purely be approached by spatial analysis, as the one presented here. More extensive numerical simulations would actually be necessary (but are definitely not the target of our studies in Haiti) to assess the potential of seismically induced rockslides, such as those presented in Gischig et al. (2015) or Lemaire et al. (2020).
Third, considering the values presented in Table 1, we still have to explain why the total surface area covered by landslides in 2021 is much larger than the one covered by the 2010 landslides. We estimate that this fact is likely to be related to (a combination of some of) the four following points: (a) the first likely physical reason for the larger area hit by mass movements in 2021 is the higher triggering earthquake magnitude of the last event (this effect is also analyzed by comparing the influence of shaking intensity on landslide distribution); (b) another physical reason could be the possibly higher susceptibility to mass movements of the western part of the peninsula hit by the 2021 event, compared to the eastern part (this factor has to be analyzed on the basis of landslide susceptibility maps, considering also the geological influence, which have been computed and will be presented in a follow-up paper); (c) a third reason for the larger area affected by landslides in 2021 could be related to the aforementioned hurricane effects that will be further discussed below; (d) and, fourth, the more central location of the fault segment activated in 2021 with respect to the coasts of the peninsula certainly also explains parts of the larger total surface areas of (subaerial) slope failures triggered during the last event within the wider onshore hanging wall part, as already introduced above.
In this regard, we also highlighted the fact that the 2010 event triggered most landslides in the south of the activated fault segment, while in August 2021 about two-thirds of all landslides were triggered in the north of it. Considering the oblique slip character along the fault ruptures of 2010 and 2021 dipping to the north, the hanging wall is located on the north side of the blind fault rupture projected on the surface (according to the fault mechanism provided by the USGS Earthquake Hazards Program page, https://earthquake.usgs.gov, last access: 20 October 2021). In this regard, the Wenchuan earthquake has clearly marked the effect of the hanging wall on the landslide distribution: about 90 % of all landslides were triggered on top of the reverse fault dipping towards the west-northwest, and only a minor portion occurred on the more stable foot wall (Gorum et al., 2011; Fan et al., 2018). The hanging wall effect on landslide triggering can be explained by stronger upward-oriented shaking that contributes to a higher surface acceleration and more intense slope failures; additionally, all (or most of the) aftershocks occurred within the hanging wall, increasing the seismic shaking intensity cumulated over the active seismic period in the related surface area, which could have contributed to prolongated landslide activity as well (to be added to the climatic effect introduced above and discussed below). This effect may thus also be at the origin of the more widespread landslide occurrence in the north of the 2021 blind fault rupture. The reduced number of subaerial landslides induced on the hanging wall side of the 2010 fault rupture can be explained by the relative proximity of the respective fault rupture to the coast in the north and the absence of high and steep slopes (onshore) on this side. Actually, a few known massive landslides occurred near the coast but are mostly located on submarine slopes in the 2010 hanging wall zone. Three of them reportedly also caused tsunami waves (see Olson et al., 2011, among others) – a phenomenon that was not observed for the 2021 event, as the coasts are located farther away from the seismic source zone.
5.2 Discussion about landslide size–frequency characteristics
Above, we clearly outlined the incompleteness of our 2021 inventory, for landslides smaller than about 3000 m2; thus, it is likely that thousands of smaller landslides could not be mapped from the medium-resolution Sentinel-2 imagery (10 m) and the higher-resolution imagery (0.5–1 m) available on GEPro for 50 % of the target area before the end of 2021. To refine our landslide mapping in future, higher-resolution imagery must be used for the whole area affected by the 2021 event, and automatic landslide identification techniques shall be applied by combining image analysis and machine learning as proposed by Amatya et al. (2021). Actually, the manual mapping applied now would take too much time to outline the many thousands of very small landslides that have not been identified so far. Those would contribute to the increase in the weight of the smaller landslides in the 2021 inventory, especially of those smaller than 3000 m2. It can be assumed that Zhao et al. (2022) have identified a larger number of smaller landslides or have mapped separate landslides where we had considered them as merged larger mass movements, as they obtained a larger absolute value of the decay exponent (2.47, compared to ours, being 2.03). In addition, the total area affected by landslides mapped by Zhao et al. (2022) is clearly smaller than ours. From the combination of both observations, we may conclude the following: either we have over-mapped landslide areas or, by splitting coalescent mass movements, Zhao et al. (2022) have under-mapped failed slopes. Providing an answer to this question would require a more detailed analysis of both inventories, which is not possible here. For our inventory we may just say that its likely incompleteness limits its use for size–frequency analyses. By comparing related statistics with those made for the 2010 landslide inventory, we can just say that the last event has triggered numerous larger landslides than the one in 2010 (based on landslide size classes, for which the 2021 inventory can be considered complete). Actually, landslides triggered in 2010 mainly consisted of narrow slides and flows in weathered limestone rocks, while the 2021 earthquake also induced landslide processes over wider slope areas – as clearly shown by the 2021 and 2010 landslide zone views presented in Fig. 5; in the Ravine du Sud, even entire slope units had failed in August 2021 (but the failed parts were typically not very thick – less than 10 m).
5.3 Discussion about climatic pre-conditioning effects
We estimate that the different climatic conditions observed before the respective events may partly explain the more widespread occurrence of larger landslides related to the 2021 event. In this regard we indicated that the climatic contribution to landslide activity in 2021 might be twofold: first, some post-seismic intensification of slope failures could be observed after the Tropical Storm Grace event that had crossed the earthquake region on 16–17 August, 2 d after the main shock. However, related effects cannot really be quantified as only 10 % of the total surface area potentially affected by the earthquake appeared as cloud-free on imagery available right after the 14 August main shock and before 16 August (Grace event). For those limited areas, we estimate that Tropical Storm Grace caused a widening of about 10 %–15 % of all slope failures with respect to the purely earthquake-induced landslide activation. Second, by comparing the 2016–2017 landslide distribution with the one observed after 14 August 2021, it can be seen that most of the October 2016 to end of 2017 landslides occurred within the same region as the 2021 ones, and most were clearly reactivated by the seismic shaking in August 2021 (while also many of them had been revegetated in between). Above we could show that Hurricane Matthew had crossed the western part of the peninsula in October 2016, producing an abnormal amount of precipitation precisely over the area that was later hit by the earthquake (see GPM maps in Fig. 7), and where also hundreds of landslides had occurred just after mid-October 2016. Therefore, it is very likely that this climatic event has triggered many (and probably most) of the 625 mapped pre-seismic (October 2016–pre-2018) landslides, which preconditioned slope instability all over the area hit by the 2021 earthquake. Preconditioning of the August 2021 slope failures could have been related to rock weakening and fracturing, as well as removal of the protective vegetation cover during the 2016 Matthew event. Indeed, practically all 625 mapped October 2016–pre-2018 landslide zones (at least 90 % of them – and considering that only for 50 % of the entire potentially affected area in the 2016 landslide could be mapped over cloud-free zones) are located within the landslide areas mapped for the August 2021 seismic event (which are still marked by a much higher level of denudation compared to the October 2016 activation). The double hurricane effect (by Matthew in 2016 and by Grace just after the 2021 main shock) observed in the area hit by the 2021 earthquake could be responsible for the proportionally larger size of the 2021 landslides (estimating that the 2016 event, due to its extreme intensity, made the strongest contribution) compared with the 2010 ones. In addition, we have to consider that the 2010 earthquake had not been preceded by any particular hurricane event during the previous 10 years, at least not by any storm that had caused abnormal precipitation amounts (similar to those caused by Hurricane Matthew) within the region hit by the 2010 earthquake.
Furthermore, the combined seismic and climatic influence could also explain the very different spatial landslide distribution characteristics of the 2010 and 2021 catalogs: the relative dispersion of landslides observed after the 2010 event could thus be partly related to the spatially highly variable effect of tropical storms and hurricanes on landslide activity (acting over a longer period, with an influence that could last over decades), partly overprinting the more concentrated seismic effect (resulting in clusters of mass movements near the seismic source zone). The same dispersion might also have been observed for the 2021 event if the central part of the seismically affected area had not been hit by that major climatic event just 5 years before – doubling the landslide concentration effect in that area (specifically for the 2021 event). However, we acknowledge that a quantification of these opposite effects of climatic events, both on landslide dispersion and on their concentration, requires a more detailed analysis. The latter should also include some studies focused on specific sites, by completing numerical simulations of mass movements affected by variable climatic (modeling changing groundwater level) and seismic influences (including the effect of rock structures and types of lithologies and morphologies on shaking polarization and amplification). A related landslide spatial distribution analysis should then also consider the influence of extensive deforestation on slope destabilization, all over the country of Haiti. Actually, deforestation is responsible for the decrease of 90 % of the primary forest over the last few decades, especially in the southern regions of Haiti where the two earthquake events had occurred (see Hedges et al., 2018). As mostly shallow landslides occurred in 2010 and 2021, the effect of deforestation on the destabilization of shallow soils and weathered rock cover must be taken into consideration for landslide occurrence prediction. Such an extensive study would thus require the creation of an integrated seismotectonic–morpho-geological–climatic soil cover model allowing us to fully understand changing landslide activity in Haiti – which is not the target of the present analysis (but will be partly approached in the follow-up paper).
5.4 Discussion about the regional seismic shaking influence on landslide distribution
As for the climatic part, here, we only present regional data to outline some general seismic influences on landslide activity induced by the 2010 and 2021 earthquakes. Related maps (Fig. 8) show that the aforementioned gap of landslides between the areas affected by the earthquakes in 2010 and 2021 would indeed be marked both by a lower shaking intensity (but showing values that are still larger than the threshold Ia values observed elsewhere for landslide occurrence) and lower landslide susceptibility (a result that still has to be published). In the Appendix (Fig. A1), we also present the shakemaps produced by the USGS for the two events, but we did not compare landslide distributions with these maps as the latter do not seem to be coherent with respect to each other, noting that much larger intensities would have been produced by the lower magnitude event of 2010. Actually, it should be considered that such maps are also influenced by regional site effects (mostly on flat areas) that are not really relevant for landslide trigger mechanisms and are also depending on ground measurements of seismic intensity that had not been well constrained during the 2010 event due to missing seismic stations in Haiti at that time (a problem that starts to be solved now).
In this paper we presented a new landslide inventory created for the Mw=7.2 Nippes earthquake that occurred on 14 August 2021, in Haiti. Related spatial and statistical characteristics have been compared with those of the landslides mapped by others for the previous, Mw=7.0, 12 January 2010 earthquake that had occurred along the same fault zone (EPGF zone) but more to the east. Considering a series of uncertainties affecting the landslide statistics (related to the mapping technique, including the uncertain number of particularly small landslides triggered in 2021) and the environmental information (including some general climatic and geological conditions), this comparison allowed us to highlight the following points: (1) the 2021 earthquake triggered clearly bigger landslides than the one in 2010, and also the sum of all landslide areas is much larger than the one computed for the 2010 event; (2) a climatic preconditioning of slope instability could be outlined for the 2021 event, mainly in connection with the impacts of recent hurricanes in the 2021 affected region, which could also partly explain the more extensive landslide activity observed in 2021; (3) the 2010 landslides seem to be more dispersed around the epicentral area than the 2021 slope failures, which could be due to the opposite climatic effect inducing spatially more variable slope destabilization (also as no particular storm had hit the 2010 affected region just before or after the seismic event, as it was the case in 2021). This dispersion effect can also be enhanced by the spatially varying deforestation that is locally very intense in the target areas.
We estimate that this proof of a likely combined seismic and climatic influence on landslide activity (possibly augmented by morpho-geological and soil cover effects not studied in detail here) opens new avenues for geohazard research, especially for regions like Haiti that are regularly hit both by severe earthquakes and weather events. We also think that preconditioning of slope failures by multiple events over longer terms, including by former earthquakes, should be studied more in detail as this preconditioning could highly contribute to local and regional landslide hazards, both over short and longer terms. A full analysis of such a scenario would require the development of an integrated seismotectonic–morpho-geological–climatic soil (and vegetation) cover model, combining extensive spatial analyses with detailed numerical simulations, which can only be completed through an extensive international multi-disciplinary collaboration around this target – which is obviously missing for Haiti. Assessment of related risk would further require the involvement of experts in social geography and economy. Also, a closer collaboration between scientists and the population shall be promoted as recommended by Calais et al. (2022) and von Hillebrandt-Andrade and Vanacore (2022). We could really work on the prevention of at least parts of another future earthquake disaster in Haiti only when these goals are achieved.
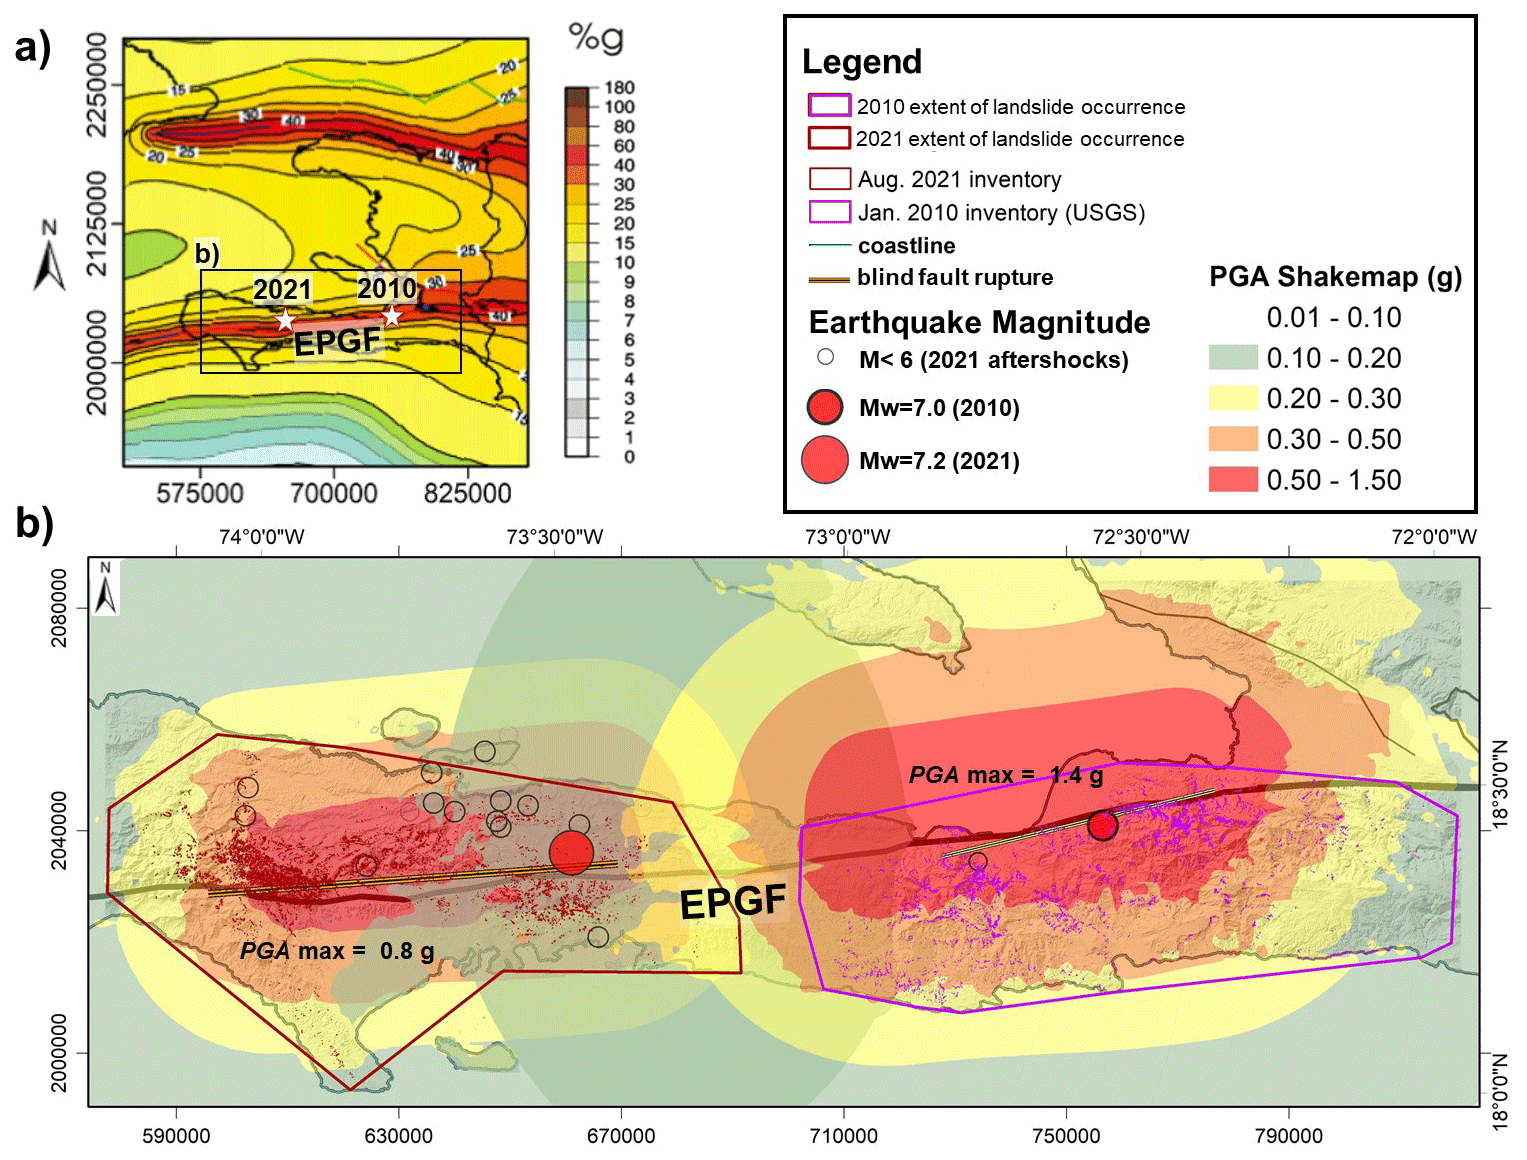
Figure A1(a) Seismic hazard map of Haiti (modified from Frankel et al., 2011) with location of the 12 January 2010 and 14 August 2021 main epicenters. (b) Combined overlays of shakemaps of the 2010 (right part of map) and 2021 (left part) earthquakes.
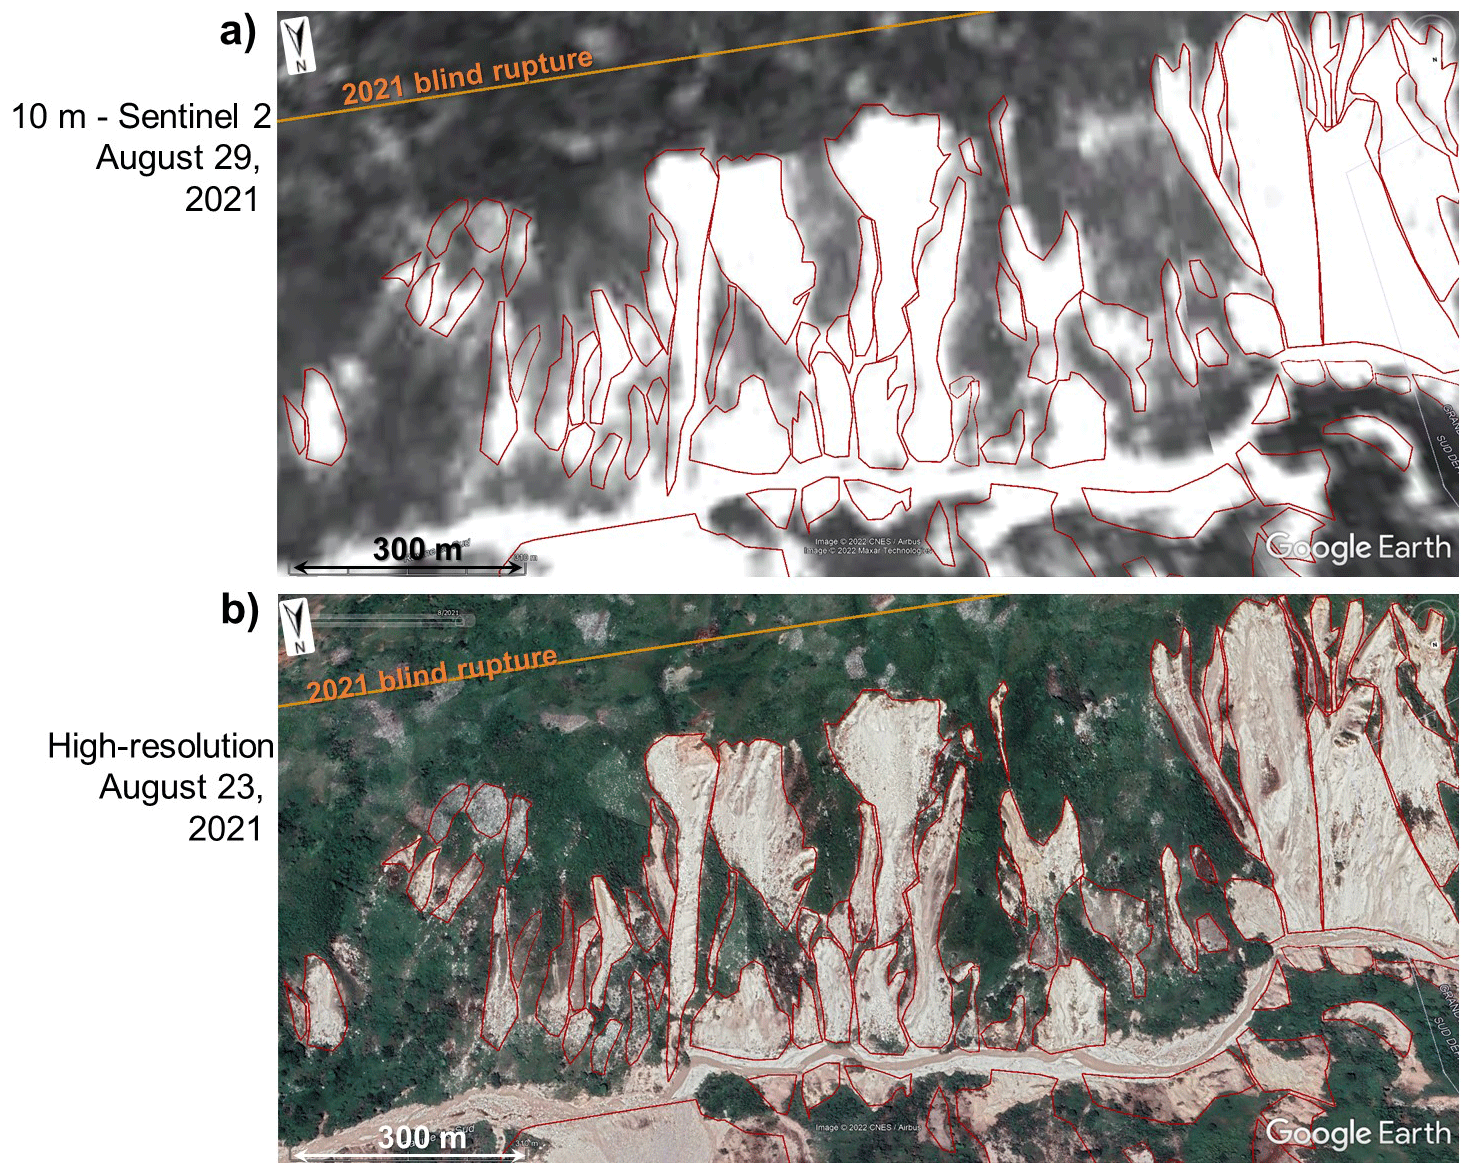
Figure A2Comparison between (a) a Sentinel-2 image (10 m resolution) and (b) a high-resolution (∼0.5–1 m) image (© Google Earth) of the same area affected by landslides triggered by the earthquake event in August 2021.
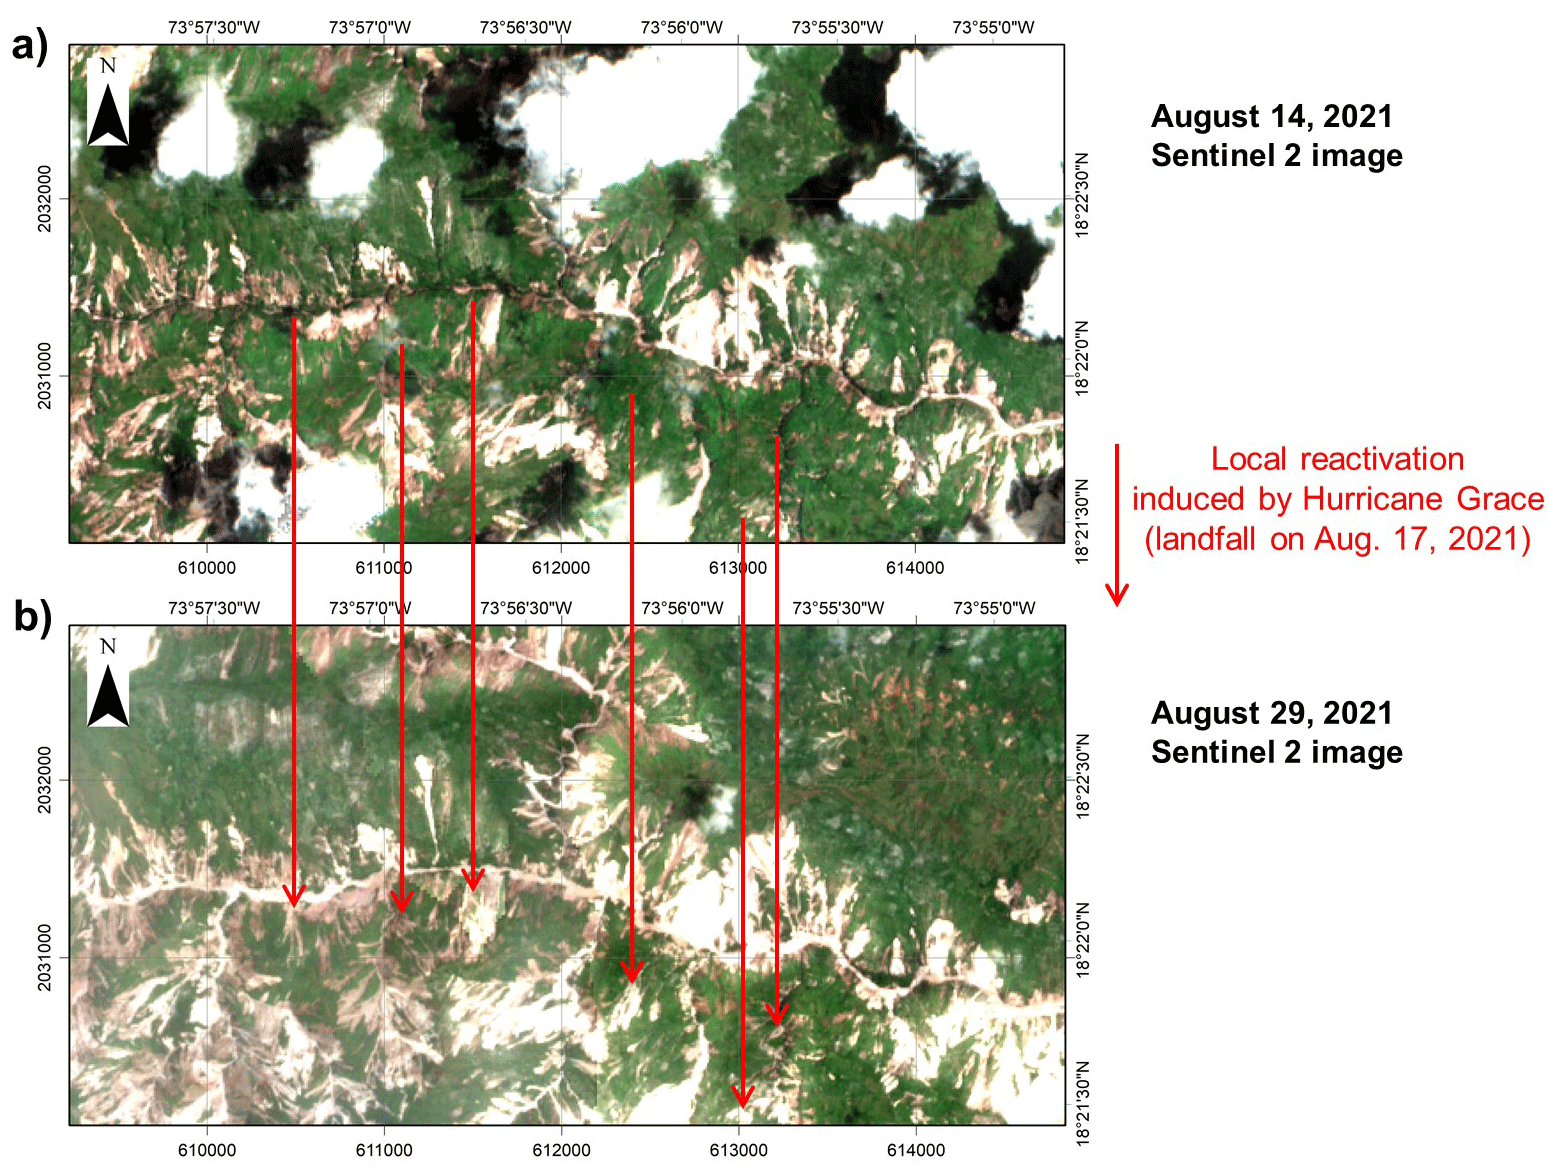
Figure A3Comparison between Sentinel-2 images (10 m resolution) for the same area obtained for (a) 14 August (about 2 h after the main shock) and for (b) 28 August 2021 (12 d after impact by Hurricane Grace that crossed the region on 16 August 2021). Red arrows point to zones where an intensification of denudation and sliding can be observed.
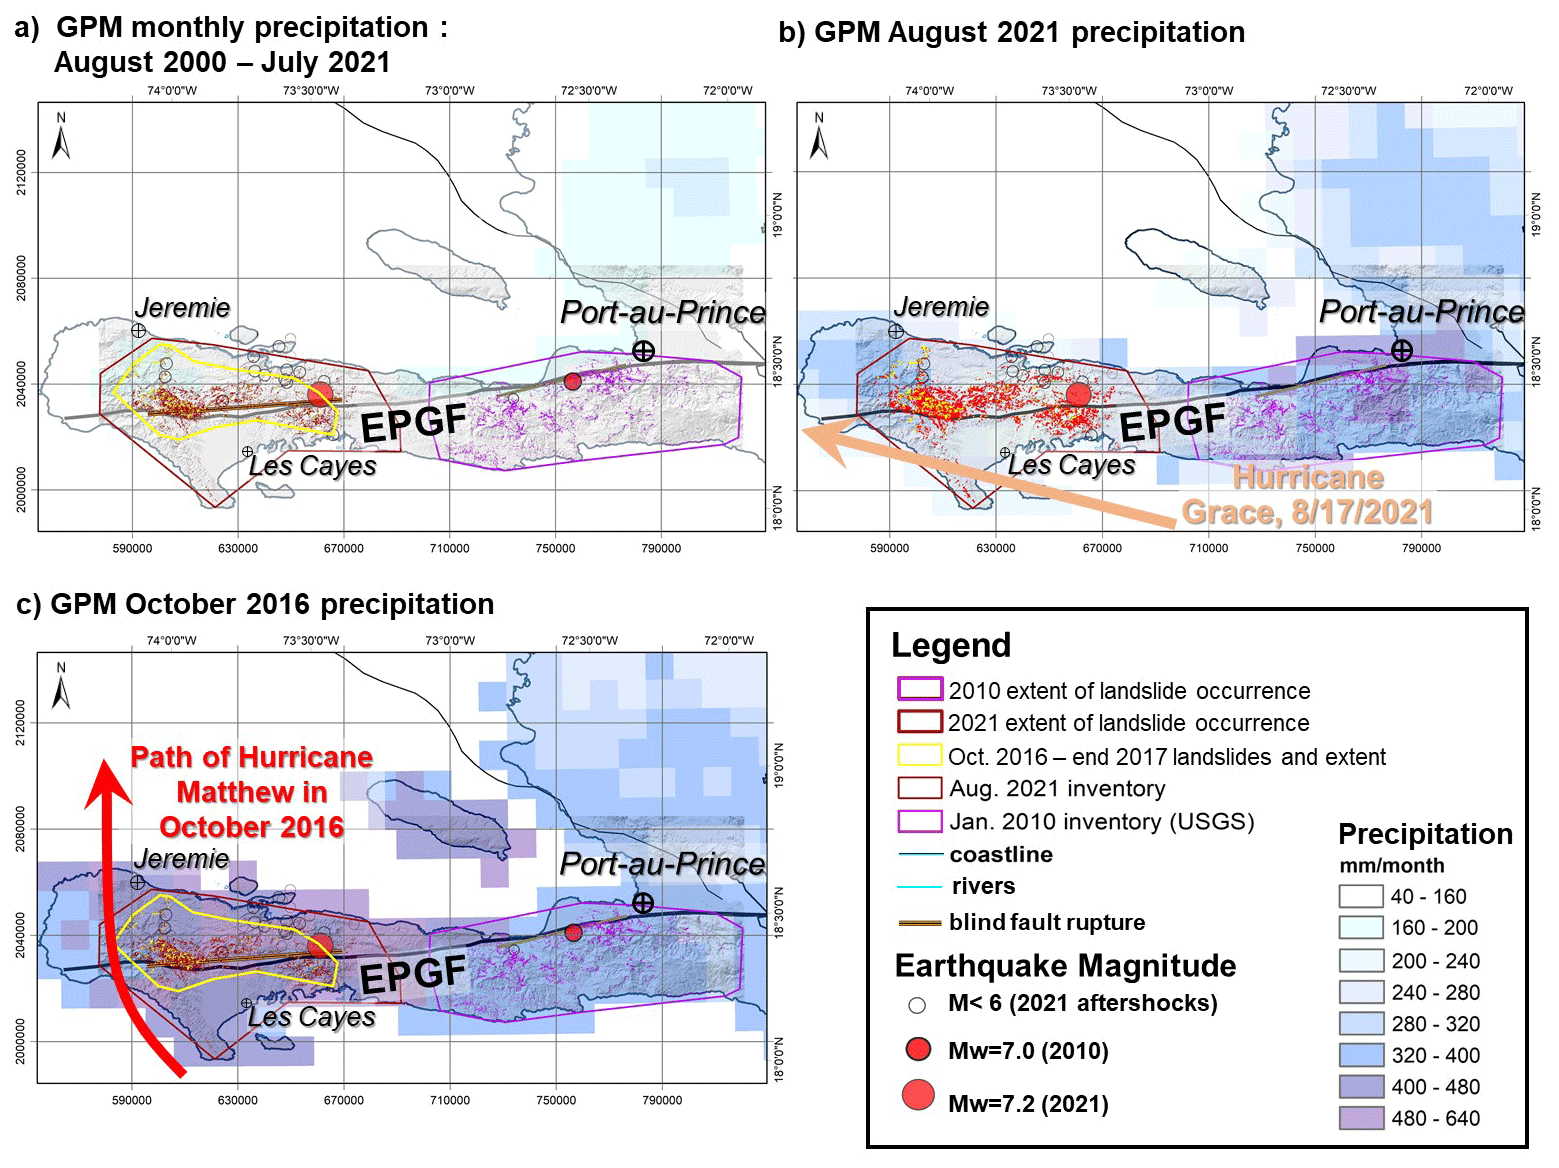
Figure A4Monthly © Global Precipitation Measurement Mission (NASA) maps (0.1∘ resolution, values in mm per month) for southwestern Haiti, (a) for all months between August 2000 and July 2021, (b) for August 2021 (marked by the Hurricane Grace event), and (c) for October 2016 (marked by the Hurricane Matthew event).
Data will be available after March 2023 on https://www.georisk.uliege.be/cms/c_4823285/en/georisk (last access: 5 October 2022).
HBH and KG contributed to the conceptualization, funding acquisition, project administration, data curation, formal analysis, investigation, methodology, resources, validation, visualization, and writing (original draft preparation, review, and editing).
RS and AB contributed to the investigation, methodology, supervision, and writing (review and editing).
SU, ASM, KHV, NSF, LC, DB, and CP contributed to the investigation, supervision, and writing (review and editing).
The contact author has declared that none of the authors has any competing interests.
Publisher's note: Copernicus Publications remains neutral with regard to jurisdictional claims in published maps and institutional affiliations.
This article is part of the special issue “Earthquake-induced hazards: ground motion amplification and ground failures”. It is not associated with a conference.
This study was partly supported by the “Earthquake Hazard and Vulnerability assessment – developing innovative solutions for sustainable Risk Reduction and Communication in Haiti” project funding (2019–2024) provided by the Belgian ARES – Académie de Recherche et D'Enseignement Supérieur.
This research has been supported by the Belgian ARES – Académie de Recherche et D'Enseignement Supérieur – with financial support provided by the Belgian Development Cooperation (grant provided for the project “Earthquake Hazard and Vulnerability assessment – developing innovative solutions for sustainable Risk Reduction and Communication in Haiti”).
This paper was edited by Céline Bourdeau and reviewed by two anonymous referees.
Acker, G. and Leptoukh, G.: Online Analysis Enhances Use of NASA Earth Science Data, Eos T. Am. Geophys. Un., 88, 14–17, 2007.
Ali, S. T., Freed, A. M., Calais, E., Manaker, D. M., and McCann, W. R.: Coulomb stress evolution in Northeastern Caribbean over the past 250 years due to coseismic, postseismic and interseismic deformation, Geophys. J. Int., 174, 904–918, https://doi.org/10.1111/j.1365-246X.2008.03634.x, 2008.
Amatya, P., Kirschbaum, D., Stanley, T., and Tanyas, H.: Landslide mapping using object-based image analysis and open source tools, Eng. Geol., 282, 106000, https://doi.org/10.1016/j.enggeo.2021.106000, 2021.
Arias, A.: A measure of earthquake intensity, in: Seismic design for Nuclear Powerplants, edited by: Hansen, R. J., MIT Press, Cambridge, Massachusetts, 438–483, ISBN 978-0262080415, 1970.
Bakun, W. H., Flores, C. H., and ten Brink, U. S.: Significant Earthquakes on the Enriquillo Fault System, Hispaniola, 1500–2010: Implications for Seismic Hazard, B. Seismol. Soc. Am., 102, 18–30, https://doi.org/10.1785/0120110077, 2012.
Calais, E., Freed, A., Mattioli, G., Amelung, F., Jónsson, S., Jansma, P., Hong, S. H., Dixon, T., Prépetit, C., and Momplaisir, R.: Transpressional rupture of an unmapped fault during the 2010 Haiti earthquake, Nat. Geosci., 3, 794–799, https://doi.org/10.1038/ngeo992, 2010.
Calais, E., Symithe, S., Monfret, T., Delouis, B., Lomax, A., Courboulex, F., Ampuero, J. P., Lara, P. E., Bletery, Q., Chèze, J., Peix, F., Deschamps, A., de Lépinay, B., Raimbault, B., Jolivet, R., Paul, S., St. Fleur, S., Boisson, D., Fukushima, Y., Duputel, Z., Xu, L., and Meng, L.: Citizen seismology helps decipher the 2021 Haiti earthquake, Science, 376, 283–287, https://doi.org/10.1126/science.abn1045, 2022.
DeMets, C., Jansma, P. E., Mattioli, G. S., Dixon, T. H., Farina, F., Bilham, R., Calais, E., and Mann, P.: GPS geodetic constraints on Caribbean-North America plate motion, Geophys. Res. Lett., 27, 437–440, https://doi.org/10.1029/1999GL005436, 2000.
Fan, X., Juang, C. H., Wasowski, J., Huang, R., Xu, Q., Scaringi, G., van Westen, C. J., and Havenith, H. B.: What we have learned from the 2008 Wenchuan Earthquake and its aftermath: A decade of research and challenges, Eng. Geol., 241, 25–32, https://doi.org/10.1016/j.enggeo.2018.05.004, 2018.
Frankel, A., Harmsen, S., Mueller, C., Calais, E., and Haase, J.: Seismic hazard maps for Haiti, Earthq. Spectra, 27, 23–41, https://doi.org/10.1193/1.3631016, 2011.
Fritz, H. M., Hillaire, J. V., Molière, E., Wei, Y., and Mohammed, F.: Twin tsunamis triggered by the 12 January 2010 Haiti earthquake, Pure Appl. Geophys., 170, 1463–1474, https://doi.org/10.1007/S00024-012-0479-3, 2013.
Gischig, V., Eberhardt, E., Moore, J., and Hungr, O.: On the seismic response of deep-seated rock slope instabilities – insights from numerical modeling, Eng. Geol., 193, 1–18, https://doi.org/10.1016/j.enggeo.2015.04.003, 2015.
Gorum, T., Fan, X., van Westen, C. J., Huang, R., Xu, Q., Tang, C., and Wang, G.: Distribution pattern of earthquake-induced landslides triggered by the 12 May 2008 Wenchuan earthquake, Geomorphology, 133, 152–167, https://doi.org/10.1016/j.geomorph.2010.12.030, 2011.
Gorum, T., van Westen, C. J., Korup, O., van der Meijde, M., Fan, X., and van der Meer, F. D.: Complex rupture mechanism and topography control symmetry of mass – wasting pattern, 2010 Haiti earthquake, Geomorphology, 184, 127–138, https://doi.org/10.1016/j.geomorph.2012.11.027, 2013.
Harp, E. L. and Wilson, R. C.: Shaking intensity thresholds for rock falls and slides: evidence from 1987 Whittier Narrows and Superstition Hills earthquake strong-motion records, B. Seismol. Soc. Am., 85, 1739–1757, 1995.
Harp, E. L., Jibson, R. W., and Schmitt, R. G.: Map of landslides triggered by the January 12, 2010, Haiti earthquake: U. S. Geological Survey Scientific Investigations Map 3353, 15 p., 1 sheet, scale 1:150 000, https://doi.org/10.3133/sim3353, 2016.
Havenith, H. B., Strom, A., Torgoev, I., Torgoev, A., Lamair, L., Ischuk, A., and Abdrakhmatov, K.: Tien Shan Geohazards Database: Earthquakes and Landslides, Geomorphology, 249, 16–31, https://doi.org/10.1016/j.geomorph.2015.01.037, 2015.
Havenith, H. B., Torgoev, A., Braun, A., Schlögel, R., and Micu, M.: A new classification of earthquake-induced landslide event sizes based on seismotectonic, topographic, climatic and geologic factors, Geoenvir. Disasters, 3, 2–24, https://doi.org/10.1186/s40677-016-0041-1, 2016.
Hedges, S. B., Cohen, W. B., Timyan, J., and Yang, Z.: Haiti's biodiversity threatened by nearly complete loss of primary forest, P. Natl. Acad. Sci. USA, 115, 11850–11855, https://doi.org/10.1073/pnas.1809753115, 2018.
Kargel, J., Leonard, G., Shugar, D., Haritashya, U., Bevington, A., Fielding, E., Fujita, K., Geertsema, M., Miles, E., Steiner, J., Anderson, E., Bajracharya, S., Bawden, G., Breashears, D., Byers, A., Collins, B., Dhital, M., Donnellan, A., Evans, T., Geai, M., Glasscoe, M., Green, D., Gurung, D., Heijenk, R., Hilborn, A., Hudnut, K., Huyck, C., Immerzeel, W., Liming, J., Jibson, R., Kääb, A., Khanal, N., Kirschbaum, D., Kraaijenbrink, P., Lamsal, D., Shiyin, L., Mingyang, L., McKinney, D., Nahirnick, N., Zhuotong, N., Ojha, S., Olsenholler, J., Painter, T., Pleasants, M., Pratima, K., Yuan, Q., Raup, B., Regmi, D., Rounce, D., Sakai, A., Donghui, S., Shea, J., Shrestha, A., Shukla, A., Stumm, D., van der Kooij, M., Voss, K., Xin, W., Weihs, B., Wolfe, D., Lizong, W., Xiaojun, Y., Yoder, M., and Young, N.: Geomorphic and geologic controls of geohazards induced by Nepal's 2015 Gorkha earthquake, Science, 351, aac8353, https://doi.org/10.1126/science.aac8353, 2016.
Keefer, D. K. and Wilson, R. C.: Predicting earthquake-induced landslides, with emphasis on arid and semi-arid environments, in: Landslides in a Semi-arid environment, edited by: Sadler, P. M. and Morton, D. M., Inland Geological Society, 2, 118–149, 1989.
Lacroix, P.: Landslides triggered by the Gorkha earthquake in the Langtang valley, volumes and initiation processes, Earth Planets Space, 68, 46, https://doi.org/10.1186/s40623-016-0423-3, 2016.
Lemaire, E., Mreyen, A.-S., Dufresne, A., and Havenith, H.-B.: Analysis of the influence of structural geology on the massive seismic slope failure potential supported by numerical modelling, Geosciences, 10, 323, https://doi.org/10.3390/geosciences10080323, 2020.
Malamud, B. D., Turcotte, D. L., Guzzetti, F., and Reichenbach, P.: Landslide inventories and their statistical properties, Earth Surf. Proc. Land., 29, 687–711, https://doi.org/10.1002/esp.1064, 2004.
Marc, O., Meunier, P., and Hovius, N.: Prediction of the area affected by earthquake-induced landsliding based on seismological parameters, Nat. Hazards Earth Syst. Sci., 17, 1159–1175, https://doi.org/10.5194/nhess-17-1159-2017, 2017.
Martinez, S. N., Allstadt, K. E., Slaughter, S. L., Schmitt, R., Collins, E., Schaefer, L. N., and Ellison, S.: Landslides triggered by the August 14, 2021, magnitude 7.2 Nippes, Haiti, earthquake, U. S. Geological Survey Open-File Report 2021–1112, 17 p., https://doi.org/10.3133/ofr20211112, 2021.
Okuwaki, R. and Fan, W.: Oblique convergence causes both thrust and strike-slip ruptures during the 2021 M 7.2 Haiti earthquake, Geophys. Res. Lett., 49, e2021GL096373, https://doi.org/10.1029/2021GL096373, 2022.
Olson, S., Green, R., Lasley, S., Martin, N., Cox, B., Rathje, E., Bachhuber, J., and French, J.: Documenting Liquefaction and Lateral Spreading Triggered by the 12 January 2010 Haiti Earthquake, Earthq. Spectra, 27, 93–116, https://doi.org/10.1193/1.3639270, 2011.
Parker, R. N., Hancox, G. T., Petley, D. N., Massey, C. I., Densmore, A. L., and Rosser, N. J.: Spatial distributions of earthquake-induced landslides and hillslope preconditioning in the northwest South Island, New Zealand, Earth Surf. Dynam., 3, 501–525, https://doi.org/10.5194/esurf-3-501-2015, 2015.
Petley, D.: Landslides from the 14 August 2021 earthquake in Haiti, https://blogs.agu.org/landslideblog/2021/09/03/landslides-from-the-14-august-2021-earthquake-in-haiti (last access: 10 June 2022), 2021.
Poupardin, A., Calais, E., Heinrich, P., Hébert, H., Rodriguez, M., Leroy, S., Aochi, H., and Douilly, R.: Deep submarine landslide contribution to the 2010 Haiti earthquake tsunami, Nat. Hazards Earth Syst. Sci., 20, 2055–2065, https://doi.org/10.5194/nhess-20-2055-2020, 2020.
Saint Fleur, N., Klinger, Y., and Feuillet, N.: Detailed map, displacement, paleoseismology, and segmentation of the Enriquillo-Plantain Garden Fault in Haiti, Tectonophysics, 778, 228368, https://doi.org/10.1016/j.tecto.2020.228368, 2020.
Sassa, S. and Takagawa, T.: Liquefied gravity flow-induced tsunami: first evidence and comparison from the 2018 Indonesia Sulawesi earthquake and tsunami disasters, Landslides, 16, 195–200, https://doi.org/10.1007/s10346-018-1114-x, 2018.
Stark, C. P. and Hovius, N.: The characterization of landslide size distributions, Geophys. Res. Lett., 28, 1091–1094, https://doi.org/10.1029/2000GL008527, 2001.
Stein, R. S., Toda, S., Lin, J., and Sevilgen, V.: Are the 2021 and 2010 Haiti earthquakes part of a progressive sequence?, Temblor, https://doi.org/10.32858/temblor.197, 2021.
Symithe, S. J., Calais, E., Haase, J. S., Freed, A. M., and Douilly, R.: Coseismic Slip Distribution of the 2010 M 7.0 Haiti Earthquake and Resulting Stress Changes on Regional Faults, B. Seismol. Soc. Am., 103, 2326–2343, https://doi.org/10.1785/0120120306, 2013.
Tanyaş, H. and Lombardo, L.: Variation in landslide-affected area under the control of ground motion and topography, Eng. Geol., 260, 105229, https://doi.org/10.1016/j.enggeo.2019.105229, 2019.
Tanyaş, H., Westen, C. J., Allstadt, K. E., Jessee, M. A. N., Görüm, T., Jibson, R. W., Godt, J. W., Sato, H. P., Schmitt, R. G., Marc, O., and Hovius, N.: Presentation and Analysis of a Worldwide Database of Earthquake-Induced Landslide Inventories, J. Geophys. Res.-Earth, 122, 1991–2015, https://doi.org/10.1002/2017jf004236, 2017.
Tanyas, H., Rossi, M., Alvioli, M., van Westen, C. J., and Marchesini, I.: A global slope unit-based method for the near real-time prediction of earthquake-induced landslides, Geomorphology, 327, 126–146, https://doi.org/10.1016/j.geomorph.2018.10.022, 2019a.
Tanyaş, H., Westen, C. J., Allstadt, K. E., and Jibson, R. W.: Factors controlling landslide frequency–area distributions, Earth Surf. Proc. Land., 44, 900–917, https://doi.org/10.1002/esp.4543, 2019b.
Tanyaş, H., Görüm, T., Fadel, I., Yıldırım, C., and Lombardo, L.: An open dataset for landslides triggered by the 2016 Mw 7.8 Kaikōura earthquake, New Zealand, Landslides, 19, 1405–1420, https://doi.org/10.1007/s10346-022-01869-9, 2022.
Von Hillebrandt-Andrade, C. and Vanacore, E.: Citizen science for studying earthquakes, Science, 376, 246–247, https://doi.org/10.1126/science.abo5378, 2022.
Wartman, J., Dunham, L., Tiwari, B., and Pradel, D.: Landslides in Eastern Honshu Induced by the 2011 Tohoku Earthquake Landslides in Eastern Honshu Induced by the 2011 Tohoku Earthquake, B. Seismol. Soc. Am., 103, 1503–1521, https://doi.org/10.1785/0120120128, 2013.
Wilson, R. C. and Keefer, D. K.: Predicting the areal limits of earthquake-induced landsliding, in: Evaluating Earthquake Hazards in the Los Angeles Region – An Earth Science Perspective, edited by: Ziony, J. I., U. S. Geol. Surv. Prof. Paper 1360, 316–345, 1985.
Xu, C., Shyu, J. B. H., and Xu, X.: Landslides triggered by the 12 January 2010 Port-au-Prince, Haiti, Mw=7.0 earthquake: visual interpretation, inventory compiling, and spatial distribution statistical analysis, Nat. Hazards Earth Syst. Sci., 14, 1789–1818, https://doi.org/10.5194/nhess-14-1789-2014, 2014.
Zhao, B., Wang, Y., Li, W., Lu, H., and Li, Z.: Evaluation of factors controlling the spatial and size distributions of landslides, 2021 Nippes earthquake, Haiti, Geomorphology, 415, 1–16, https://doi.org/10.1016/j.geomorph.2022.108419, 2022.
- Abstract
- Introduction
- Regional data and context of the earthquake-triggered landslides
- Methodological aspects of landslide and seismic trigger factor mapping
- Results: landslide inventory statistics and analysis of trigger conditions
- Discussion
- Conclusions
- Appendix A
- Data availability
- Author contributions
- Competing interests
- Disclaimer
- Special issue statement
- Acknowledgements
- Financial support
- Review statement
- References