the Creative Commons Attribution 4.0 License.
the Creative Commons Attribution 4.0 License.
 | 07 Oct 2022
Integrated seismic risk assessment in Nepal
Sanish Bhochhibhoya
Roisha Maharjan
Seismic risk analysis is necessary to mitigate the potential losses resulting from future earthquakes and supplement scientific risk management. In order to assist systematic evaluation and management of risk, it is indispensable to interpret risk in terms of social and economic consequences due to hazardous events like earthquakes. There is an interrelationship between hazards, physical risk, and the social characteristics of populations. Therefore, based on the existing studies focusing on each of these aspects, this paper presents the integrated seismic risk assessment along the subdivisional administrative units of Nepal using 2011 census data. The administrative unit “provinces” are subdivided into districts and each district into municipalities and village development committees (VDCs). The districts, municipalities, and VDCs were considered as our study units. In this paper, the physical or seismic risk was evaluated from the exposure model, hazard curves, and the vulnerability model of the country, whereas the social vulnerability was assessed using social vulnerability index (SoVI) methods. To formulate the physical risk, the assets used were five types of buildings under the exposure model. This model was combined with the physical vulnerability functions of the building and the hazard curves of the country. The result of the physical risk has been presented as annual average loss (AAL). Similarly, among 92 social vulnerability variables, 54 variables were reduced to 7 weighted parameters using principal component analysis (PCA). The scores of a total of 45 parameters were used to evaluate the SoVI index, which was further combined with the physical risk to evaluate integrated risk. The results showed that populated cities like Kathmandu, Hetauda, and Janakpur have a highly integrated risk index. Similarly, the Terai region bordering its neighbor India and some parts of the central hilly region are highly vulnerable, while most parts of the mountainous region in the central and eastern regions are the least vulnerable. The results from the present study can be utilized as a part of a comprehensive risk management framework at the district level to recuperate and recover from earthquakes.
- Article
(9651 KB) - Full-text XML
- BibTeX
- EndNote


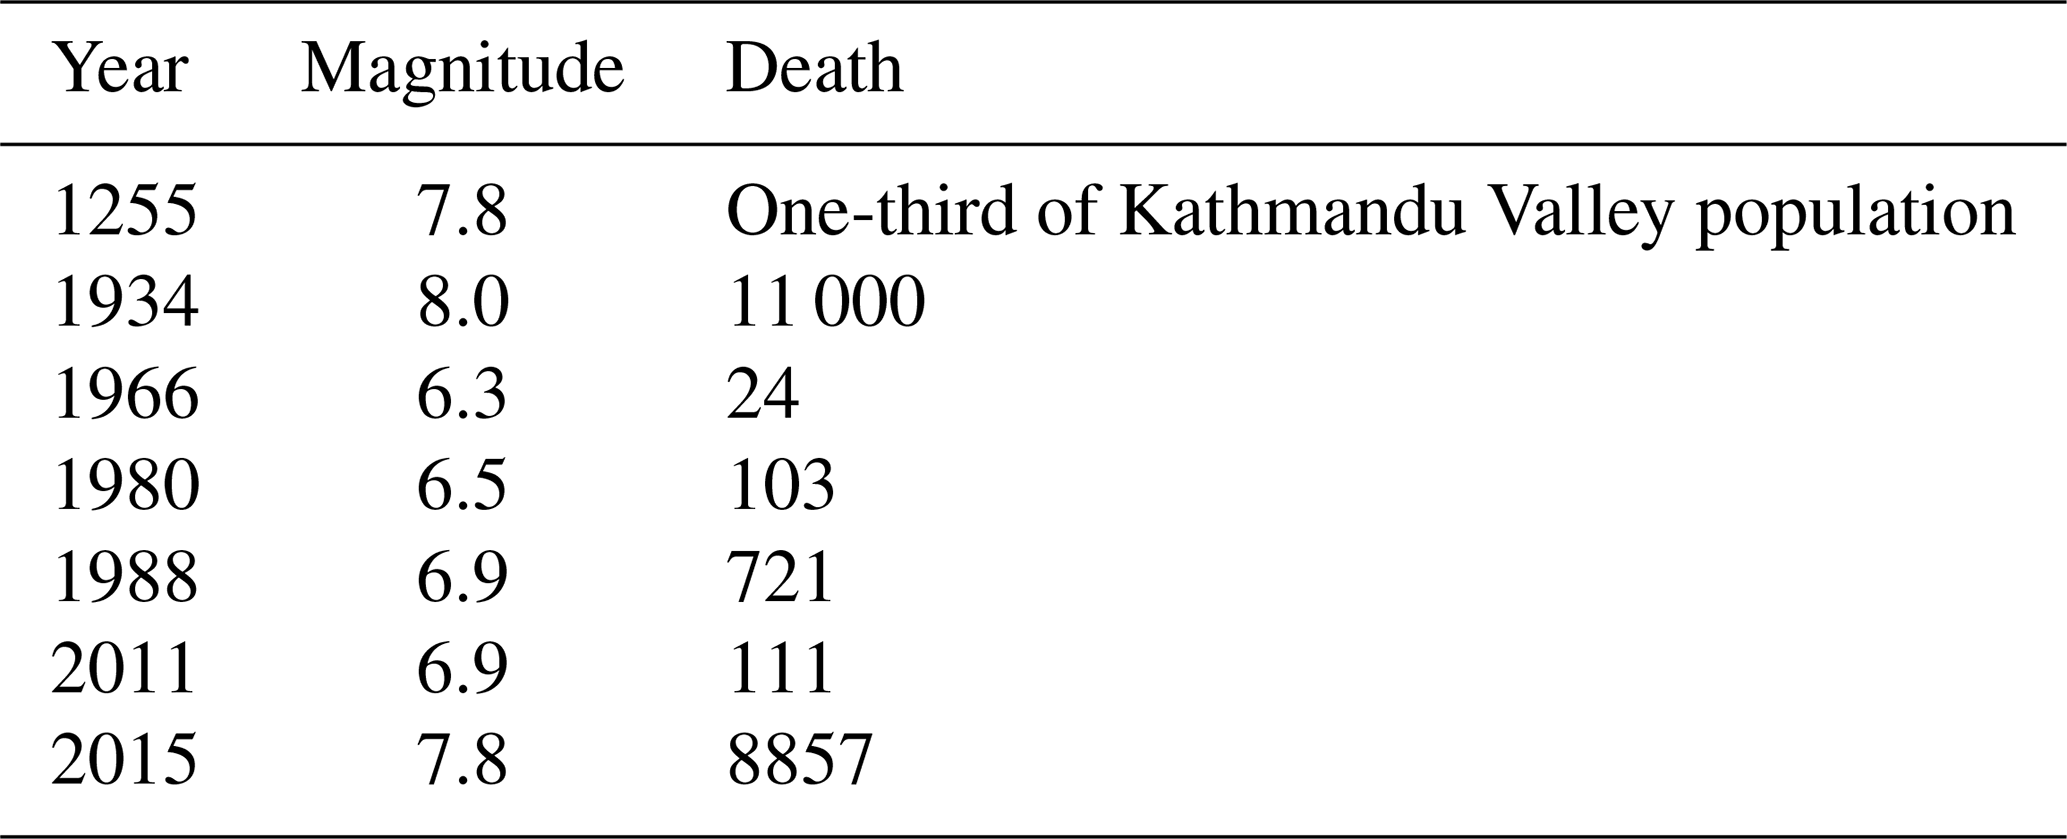
Nepal is one of the seismically active regions in the world with a long record of destructive earthquakes. This is due to the intrinsic geological features with high exposure to earthquakes causing potentially severe consequences. The most devastating earthquakes were reported in 1255, 1408, 1681, 1803, 1810, 1833, 1934, and 1988 (Pandey et al., 1999). Table 1 shows the number of deaths caused by the earthquake and poor hazard management in Nepal. From 2000 to 2015, 192 earthquakes greater than moment magnitude (Mw) 5, 14 earthquakes greater than Mw 6, and 1 earthquake greater than Mw 7.5 took place in Nepal. Among these earthquakes, the most recent one in 2015 killed 8948 people, destroyed world heritage sites, and caused estimated damage of USD 10 billion with a moment magnitude of Mw 7.8 (Mori et al., 2020). Around the globe, the impact of the seismic hazard has escalated due to increased population density, unmanaged urbanization, and other socioeconomic parameters (Pachauri et al., 2014). The destruction or disaster is the combination of exposure to natural hazards and conditions of vulnerability characterized by the place and the inability to mitigate the negative repercussions (UNISDR, 2009; Rao et al., 2020). Although natural hazards are not escapable, hazard mitigation, vulnerability assessment, and their integration can significantly reduce the negative effect and aid in recovery (Frigerio et al., 2016).
Table 1Deaths caused by Earthquakes in Nepal (Chaulagain et al., 2018).
Vulnerability is the key element and prerequisite for mitigating disaster and facilitating hazard-resilient communities (Guo and Kapucu, 2020; Douglas, 2007). The core elements of vulnerability include resilience, exposure, and sensitivity (Cutter et al., 2003). The biophysical and natural components and the built-in environment that are vulnerable have been meticulously examined; however, the social aspects of the vulnerability are highly understudied (Mileti, 1999). As a result, the loss estimation reports are usually unable to reflect social losses. It is imperative to include social vulnerability while assessing the natural hazards and their losses. According to Cutter et al. (2003), social vulnerability can be evaluated using the social vulnerability index (SoVI). For each country, SoVI is the corresponding measure of overall social vulnerability. The assessment of vulnerability and its mitigation necessitates the understanding of various factors like social, economic, and political contexts (Hewitt, 2007). SoVI analysis uses an all-inclusive framework in which each factor is viewed to play an equal contribution to the country's vulnerability (Cutter et al., 2003). This concept has been applied in geographical and social contexts around the world in the US (South Carolina) (Schmidtlein et al., 2011), Iran (Alizadeh et al., 2018), and Bangladesh (Rahman et al., 2015). Studying social vulnerability identifies the sensitive areas and populations that are prone to high risk and are less likely to acclimatize and recover from natural disasters.
To diminish the losses from natural and man-made hazards, individuals and policymakers need to be responsible and create a resilient community to combat the consequences caused by disasters. Policymakers should focus on mitigating future risks and make endeavors toward sustainable development. The knowledge transfer between individuals and policymakers is very constrained as hazard and risk assessment put limited focus on social components (Borden et al., 2007). In Nepal, the quantitative assessment of social vulnerability associated with seismic hazards is less owing to the lack of social data for analysis and mapping (Aksha et al., 2019). Many studies in the past have focused on geographical/physical vulnerability assessment of hazards like a flood (Dixit, 2003), landslides (Malakar, 2014), and extreme weather events (Shrestha, 2005). The studies by Mainali and Pricope (2019) and Aksha et al. (2019) incorporate vulnerability to climatic conditions and natural hazards in Nepal, respectively, with a wide range of socioeconomic factors. However, such studies in Nepal do not include extensive analyses of social vulnerability to earthquakes. The extent of destruction caused by earthquakes differs from one place to another based on the local vulnerability factors such as socioeconomic and cultural aspects. For example, the 2015 Gorkha Earthquake damaged more than 700 000 buildings, the majority of which were in underdeveloped rural areas with predominant traditional and low-quality masonry houses (Ulak, 2016). In this regard, integrated seismic risk assessment plays a prominent role in determining the areas vulnerable to seismic hazards and reducing the damage in the future. This signifies the need to incorporate the seismic risk assessment with social characteristics. In this study, the country-level earthquake risk estimates from the global earthquake model OpenQuake (Pagani et al., 2014) were analyzed by using the input models (seismic hazard sources, fragility functions, and consequence model) given by Chaulagain et al. (2015). The results of earthquake risk estimates were integrated with vulnerability parameters (social and economic factors) of Nepal. Here, 75 districts and the subdivision, municipalities, and village development committees (VDCs) were considered as the study unit. The administrative unit of Nepal is divided into seven provinces, which are further subdivided into 75 districts and each district into municipalities and VDCs. The administrative map of Nepal is shown in Fig. 1. This study focuses on social vulnerability and explores the physical risk from earthquakes at the village and municipal levels.
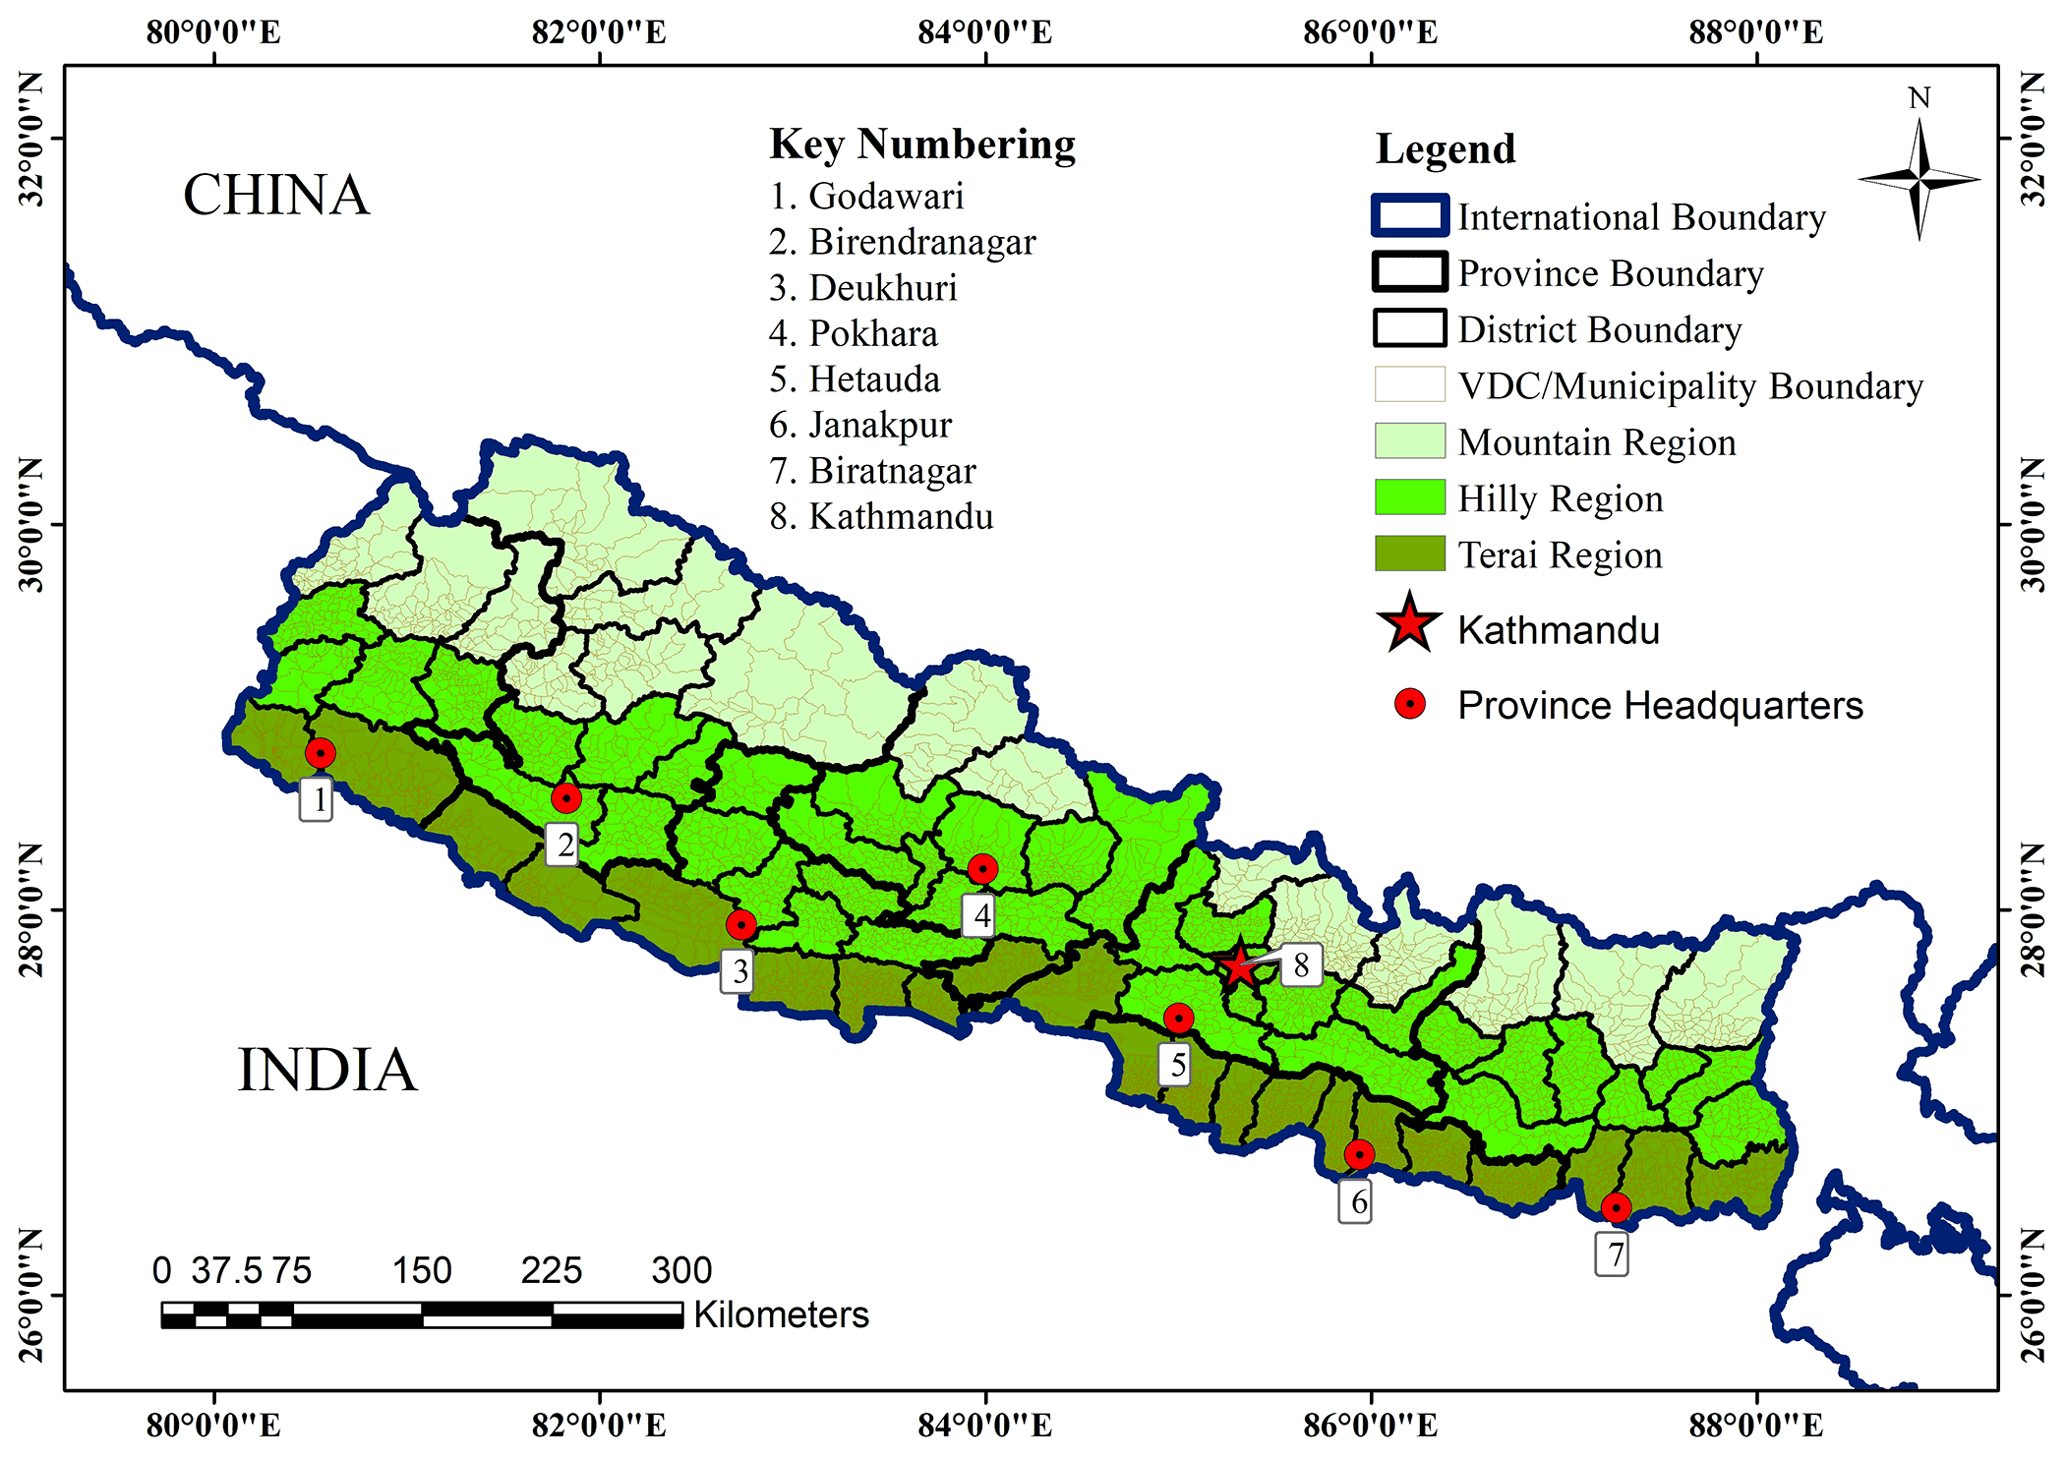
Figure 1Administrative map of Nepal showing VDCs, municipalities, 75 districts, 3 geographical regions, provinces, and province headquarters.
We assessed the seismic impact potential of the country by moving beyond the physical (direct) impact by integrating physical risk with measures of social vulnerability. The results are presented in the form of maps along the study area. The main objective is to expand on the information and knowledge of features that are more socially vulnerable to seismic risks so that policymakers and individuals can carry out a sustainable procedure to reduce the effect in the country. To the authors' best knowledge, no previous studies have been documented regarding integrating social vulnerability (preparation of society for any disaster) and seismic risk for Nepal.
2.1 Social vulnerability variables
Vulnerability is a multidimensional aspect, and it cannot be integrated into a single variable (Cutter and Finch, 2018; Contreras et al., 2020). There are many social vulnerability parameters that determine the impact of natural hazards such as socioeconomic status, geographical features, ethnicity (minority), home ownership/rental status, gender, and age (Burton and Silva, 2016). These intensify the impact of earthquakes; for instance, some people are privileged with social advantages, while some succumb to poverty and discrimination. The households with better economic status can recuperate from disasters better than low-income households (Mileti, 1999). Similarly, there is a lethargic pace in developmental activities, and the situation is aggravated by the centralized development only in the capital city, Kathmandu. As a result, people are obliged to work overseas, especially in Gulf countries, for employment opportunities owing to poverty (Aksha et al., 2019). In addition to it, ethnicity also creates barriers in distribution and access to financial resources after disasters (Cutter et al., 2003). Nepal is home to a wide number of caste and ethnic identity groups facing deep structural marginalization (Pherali, 2016). The diverse indigenous communities experience economic, social, and political marginalization and annexation of infrastructure and financial resources (Mishra et al., 2015). A significant number of minorities, females, and dependent age groups are more vulnerable (Borden et al., 2007). Furthermore, another group of vulnerable populations are renters because, in comparison to the homeowners, renters are financially unprepared for the recovery (Burby et al., 2003). Likewise, the topography of Nepal is also a hindrance to distributing relief materials to the affected regions in time which exacerbates the impact of natural hazards. There are three geographical regions in Nepal: the Terai, hilly, and Himalayan regions covering 24 %, 42 %, and 34 % of the total area, respectively. The flat, arable Terai plain region contains 50 % of the total population. The hilly region is basically situated in the south of the mountain region, which is less developed than the Terai region. However, the densely populated and highly urbanized cities of Kathmandu and Pokhara lie in the hilly region. The mountain region is characterized by severe climatic and rugged topographic conditions with limited economic activities and human habitation.
2.2 Parameters of earthquake risk assessment
Earthquake risk assessment is the combination of the exposure model, structural vulnerability, and seismic hazard analysis. Generally, the exposure model represents assets like buildings and population (Silva et al., 2020). In this study, the fundamental exposure data include building typologies and district-wide distribution of buildings. Likewise, the structural vulnerability function resembles expected loss at a given ground motion intensity level which can be derived either by empirical methods or by combining fragility and consequence functions (Martins et al., 2021). Using empirical methods vulnerability is derived in the form of losses from past events at given locations corresponding to the levels of intensity of ground motion. Fragility functions are defined by the probability of exceeding a set of limit states at a given intensity measure level (Gómez Zapata et al., 2021). These functions can be derived empirically or analytically or by modeling the asset behavior at increasing ground motion levels. Likewise, consequence functions are defined by the probability distribution of loss at a given performance level (Pagani et al., 2014).
The seismic hazard curve describes the annual probability of exceeding a specified ground motion level. The probabilistic approach can be used to derive hazard curves. This approach involves (a) delineation of seismic sources and their characteristics, (b) determination of regional seismicity, (c) use of the appropriate ground motion equation, and (d) combination of probability in terms of size, location, and ground motion parameter. There is abundant research on seismic hazard analysis in Nepal which uses various source typologies and characteristics. For instance, Stevens et al. (2018) used a mix of fault and area source models – in total six seismic sources with the Gutenberg a and b values along with maximum magnitude estimated for each source zone. Among the sources used in Stevens et al. (2018), the Main Himalayan Thrust is the principle seismic hazard source in Nepal, which is a huge, shallow-dipping reverse fault capable of producing the largest earthquakes. Similarly, Pandey et al. (2002) divided the whole Nepal region into 10 area sources and 24 fault sources. Thapa and Guoxin (2013) divided the Nepal region into 23 seismic source zones. Chaulagain et al. (2016) also used the same sources to carry out a seismic risk assessment. Similarly, selecting the ground motion prediction equation is one of the important steps in seismic hazard analysis, which governs the propagation of seismic ground motion from seismic source to site in terms of magnitude, distance, depth, and other site parameters (Cornell, 1968). However, in the context of Nepal, there are insufficient strong ground motion records to derive a precise equation capturing the actual response spectrum. On top of that, very little research has been conducted in terms of attenuation relationships in Nepal. Previous studies like Chaulagain et al. (2015) and Stevens et al. (2018) have used a combination of ground motion prediction equations (GMPEs) within the logic tree. The past seismic hazard analyses (Stevens et al., 2018; Chaulagain et al., 2015; Thapa and Guoxin, 2013) have produced a varying range of seismic hazard analyses of Nepal. According to Stevens et al. (2018), in the large part of Nepal, the accelerations in the range of 0.4–0.6 and 1.0–3.0 g may be expected for 10 % and 2 % probability of exceedance over a 50-year period, respectively. Chaulagain et al. (2015) evaluated the estimated PGAs (in g) at 10 % and 2 % probability of exceedance in 50 years in the range of 0.22–0.5 and 0.42–0.85 g, respectively. Thapa and Guoxin (2013) estimated the PGA at 10 % and 2 % probability of exceedance in 50 years in the range of 0.21–0.62 and 0.38–1.1 g, respectively.
This study assesses seismic risk by combining it with the human dimensions within the hazard zone similar to that in Burton and Silva (2016). This approach is an integrated seismic risk assessment. Here we have quantified the social and economic parameters in terms of social vulnerability indices and then integrated those indices with the results of classical probabilistic risk analysis.
3.1 Social vulnerability assessment
The social vulnerability index (SoVI) method was originally formulated by Cutter et al. (2003), and this index provides a comparative metric depicting an area's relative social vulnerability to hazard. Social vulnerability helps to explain the reason behind the difference in consequences in communities even though they are subjected to similar levels of ground shaking (Burton and Silva, 2016). We identified the meaningful variables incorporating the socioeconomic and physical context of Nepal. Moreover, to describe the vulnerability at the municipality and VDC level in Nepal, we computed a modified SoVI.
3.1.1 Indicators of social vulnerability assessment
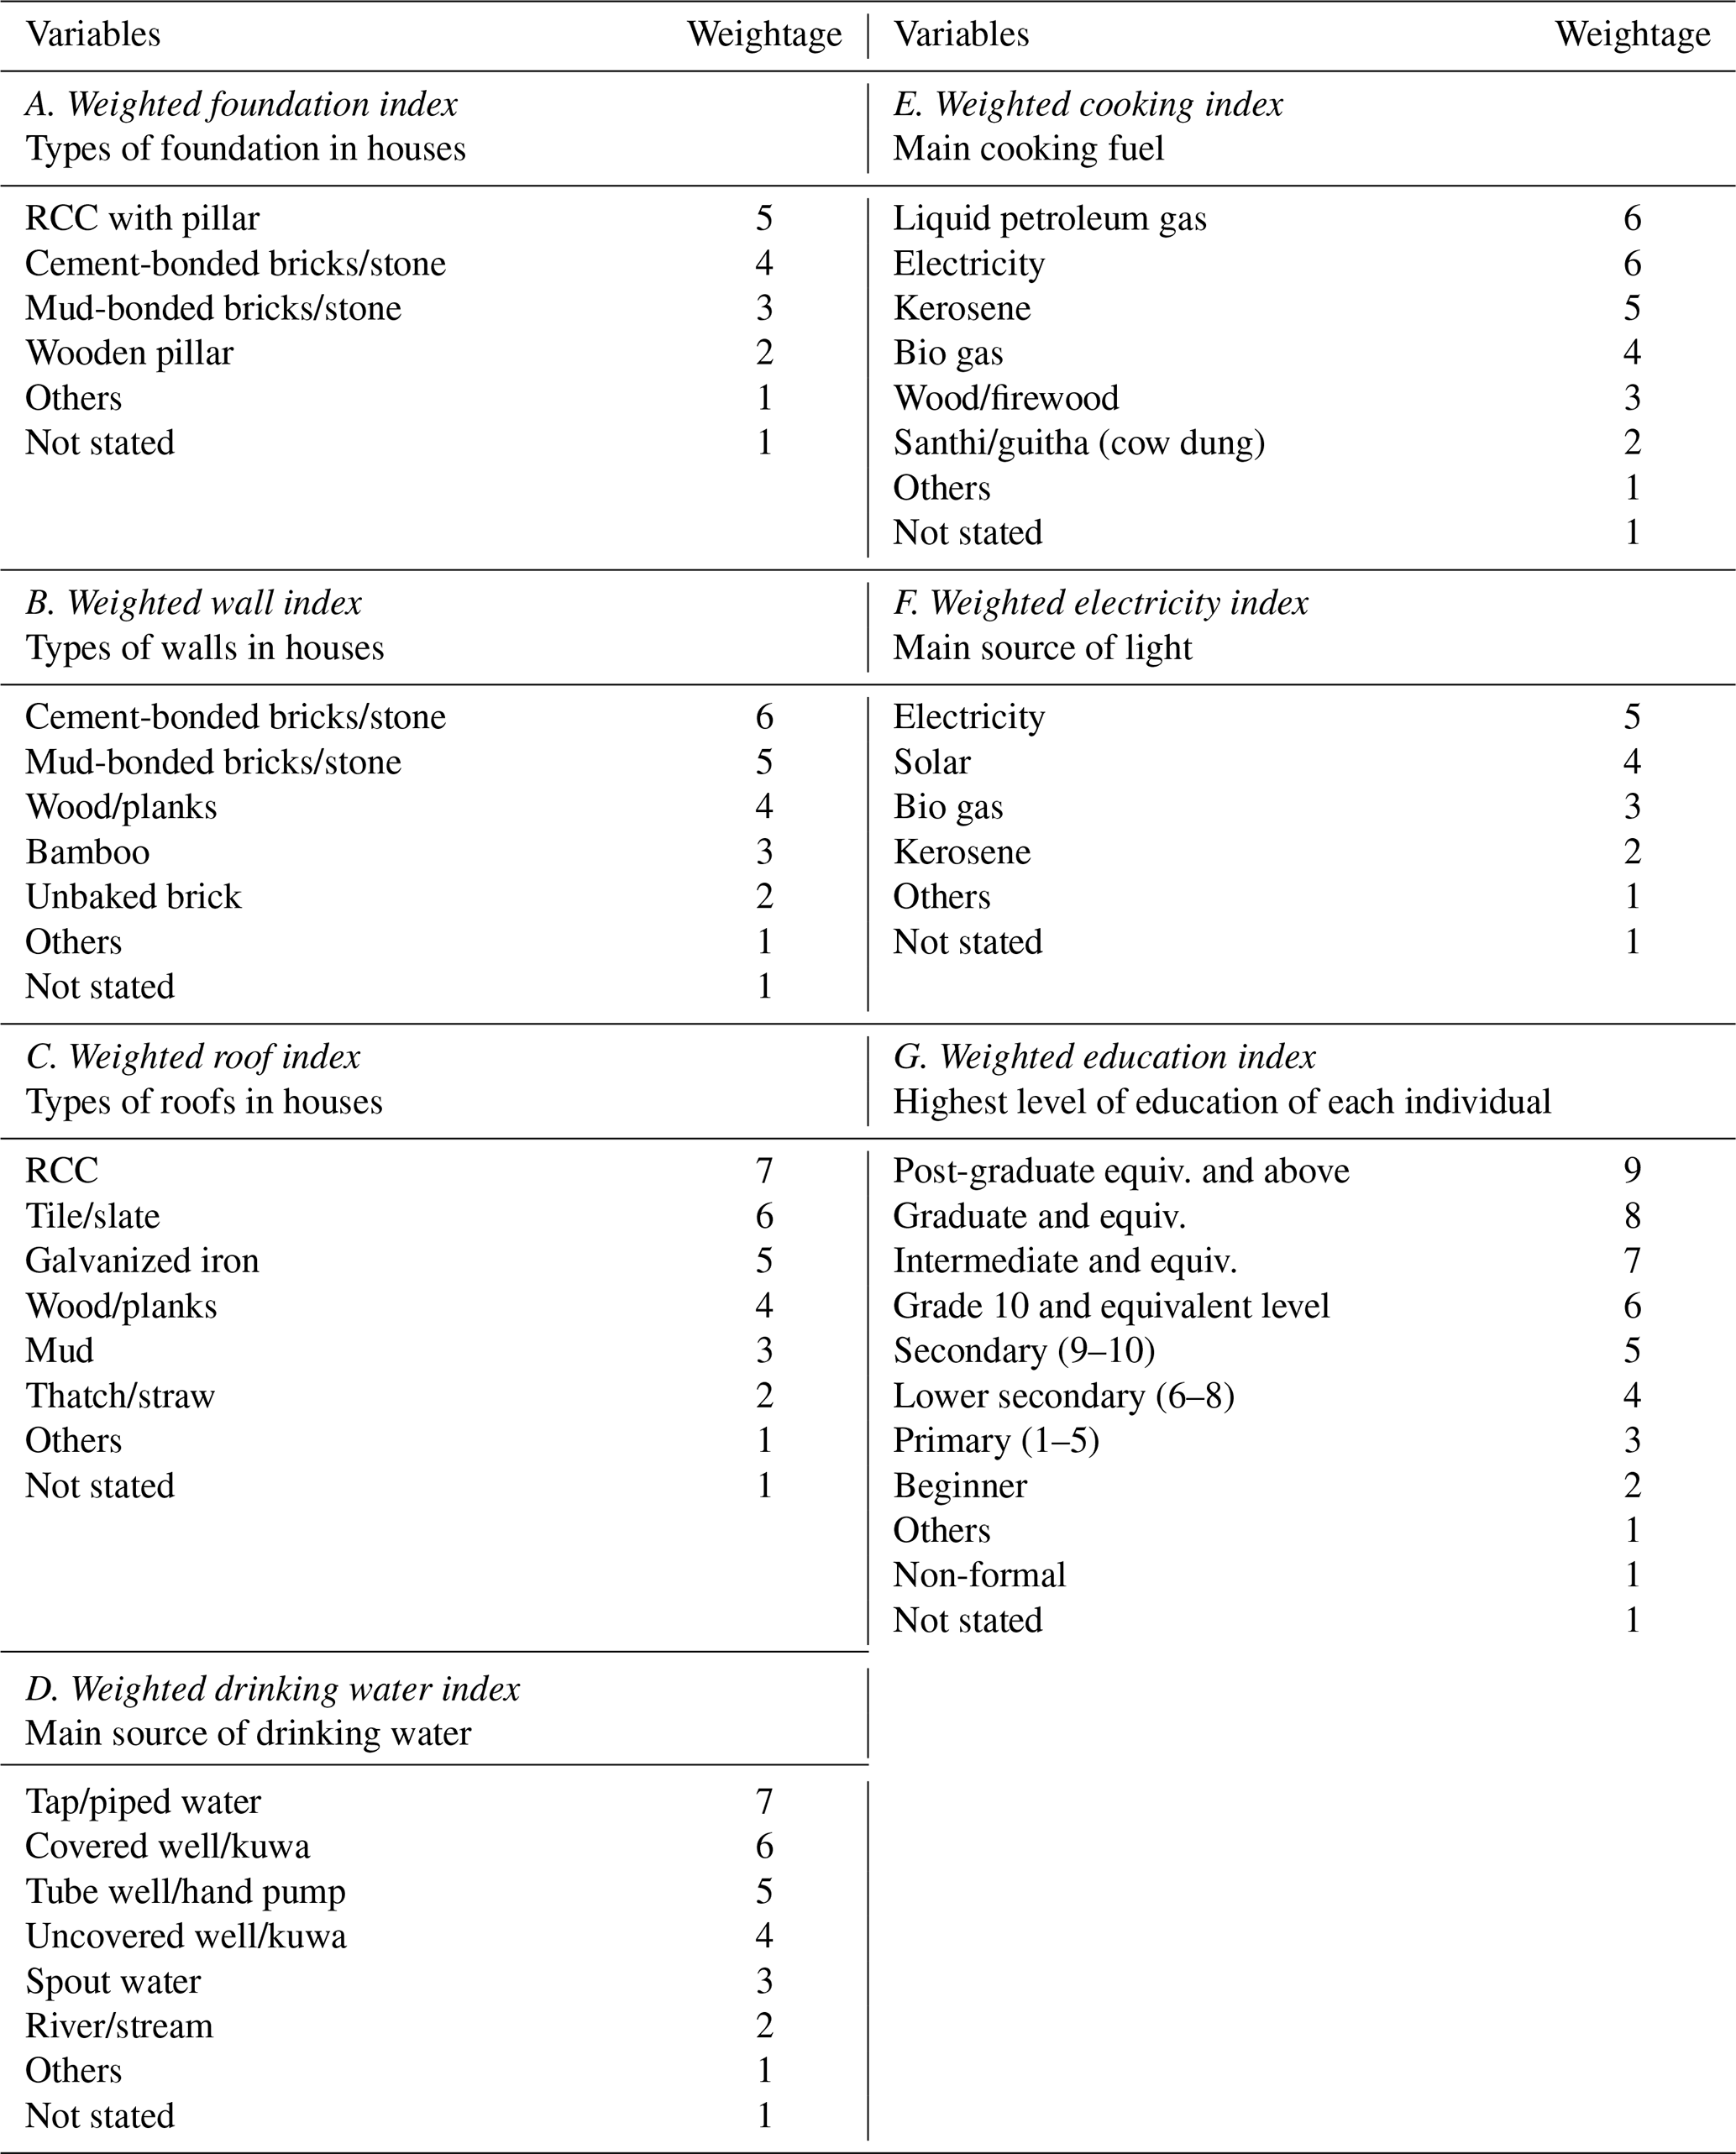
For social vulnerability, we extracted data from the most recent national-wide census of Nepal held in 2011 (CBS, 2011) and the Nepal Human Development Report 2014 (Sharma et al., 2014). Table 2 provides the list of all the variables used for social vulnerability assessment. Out of 45 variables, district-wide indicators were represented by 22 variables, and each subsection of districts (municipality and VDCs) was assumed to have a uniform indicator value. Among these 45 variables, 7 of them were a weighted combination of multiple variables, as shown in Table 2. These weighted variables were obtained from 54 variables mentioned in Table 3. Therefore, altogether 92 variables () were considered for SoVI index. This technique of weighing variables has been used in principal component analysis (PCA) used in the National Human Development Report (NHDR; Sharma et al., 2014). The NHDR (2014) also used the same weightage values for these variables. The modification to the original SoVI is required due to the difference in demographic characteristics between Nepal and the USA and the availability of data. We included variables from various categories like the housing unit status category, which reflects the features of the household, housing characteristics, and facilities. Similarly, population characteristics show female population characteristics, age structure, population density, population growth, child marriage, and disabled population.
Table 2Variables used to construct social vulnerability index and their loading values after PCA.
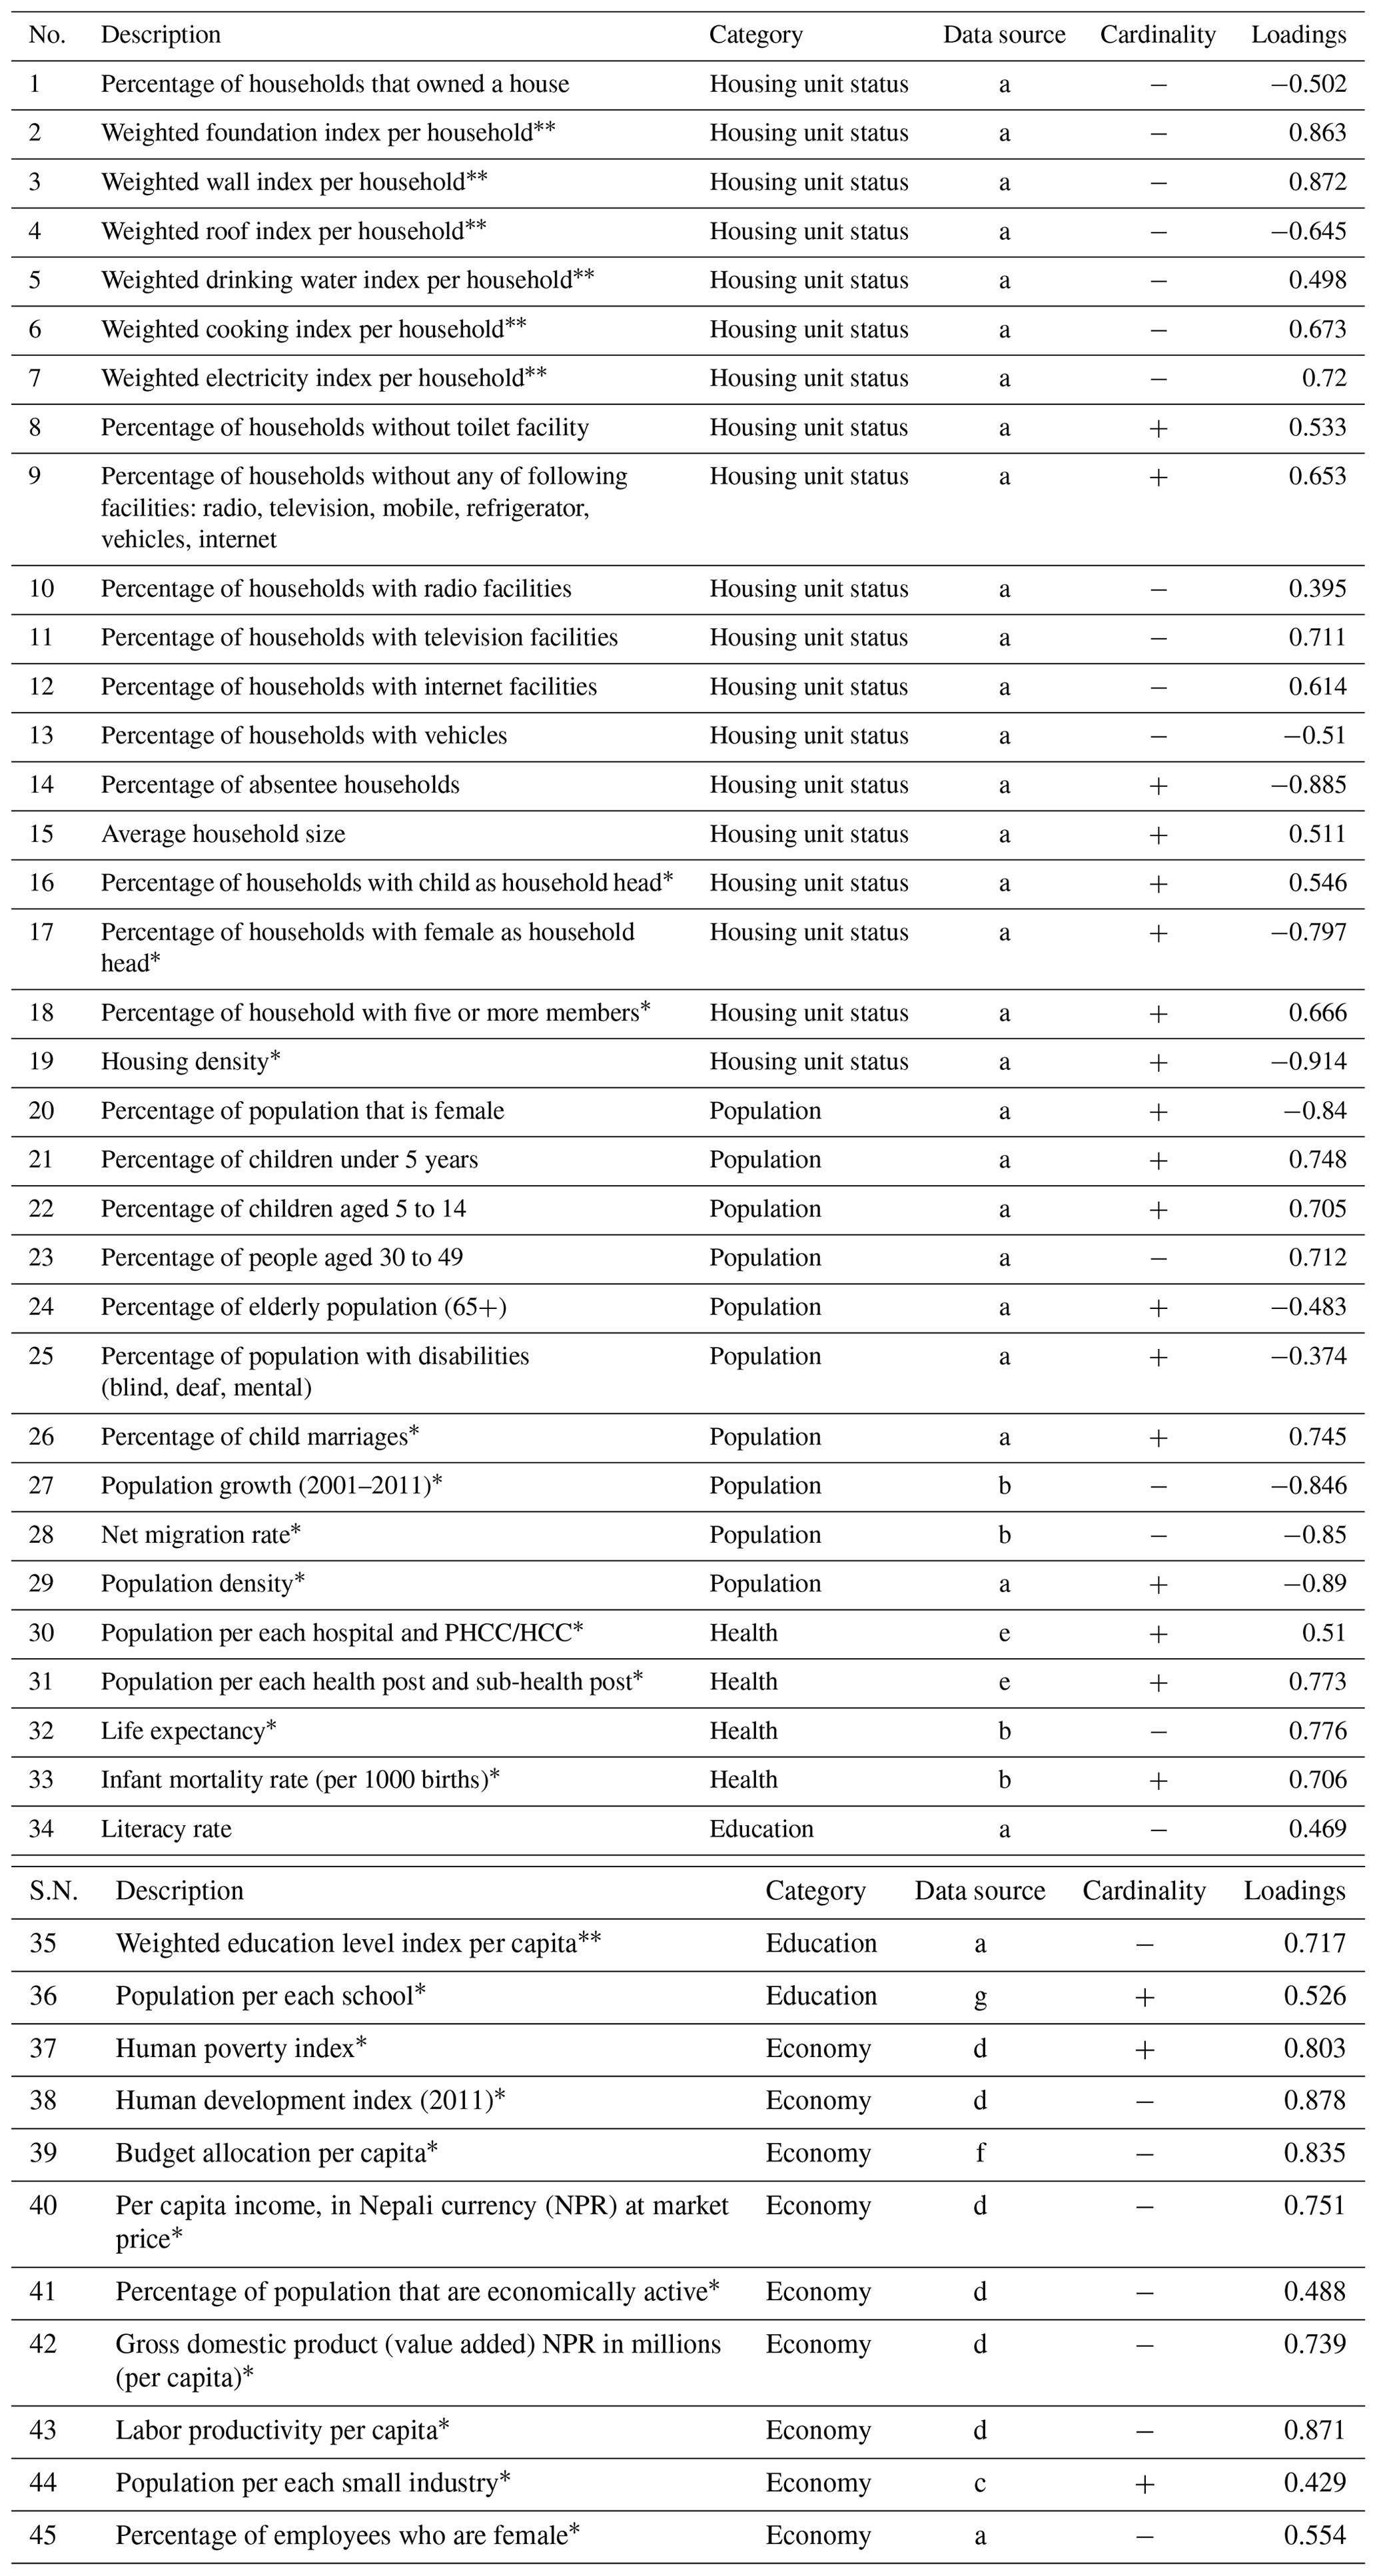
a National Population and Housing Census 2011 (CBS, 2012). b Population Monologue V01 (CBS, 2014a). c Population Monologue V03 (CBS, 2014b). d Nepal Human Development Report (Sharma et al., 2014). e Department of Health Services (2013). f Budget report for year 2070–2071 BS (Bikram Sambat, based on Nepali calendar) (2013–2014 CE). g Department of Education (2013–2014). ∗ District-wide data. PHCC signifies primary health care centre, and HCC signifies health care center. Weighted index calculated as per Table 3.
Table 3Weights corresponding to the weighted variables, as defined in Table 2.
The cardinality of each indicator (variables) is indicated in Table 2. Positive cardinality (+) means variables have a positive relationship with social vulnerability, while negative cardinality (−) means they have a negative relationship. Each indicator should be normalized to obtain a relatively uniform dimension. Hence, based on cardinality, we used a min–max method for each indicator using Eqs. (1) and (2), as used in Fang et al. (2019).
where Xi is the original value of indicator i, and Xi,max and Xi,min are the maximum and minimum values of the variable Xi. Si is the standard value of index i, which is in the range of 0 and 1.
3.1.2 Calculation of social vulnerability index (SoVI) by principal component analysis
The social vulnerability index was evaluated by incorporating socioeconomic variables through a mathematical procedure called principal component analysis (PCA). PCA transforms a number of possibly correlated variables into a smaller number of uncorrelated components (Abdi and Williams, 2010). The main idea of PCA is to reduce the dimensionality of a dataset with a large number of inter-related indicators whilst retaining the maximum possible variation present in the dataset (Jolliffe, 2002). The procedure of PCA used in this study is mentioned in further sections.
Number of principal components
It is very crucial to determine the number of components to carry out PCA (Franklin, 1995). We used parallel analysis (PA) by Horn (1965). Various studies like Humphreys and Montanelli (1975), Zwick and Velicer (1986), and Thompson and Daniel (1996) have shown that PA is an appropriate method to determine the number of factors. These studies assert that this method (PA) is the best available alternative to calculate the number of factors to be retained. In this method, eigenvalues from PCA prior to rotation were compared with “expected” eigenvalues which were obtained by simulating normal random samples with identical dimensionality (same number of samples and variables) using a Monte-Carlo simulation process. Initially, a factor was considered significant if the associated eigenvalue was bigger than the mean of those obtained from the random uncorrelated data. The default (and recommended) values for a number of random correlation matrices and percentile of eigenvalues are 100 and 95, respectively (Cota et al., 1993; Glorfeld, 1995; Velicer et al., 2000). We used the PA engine developed by Vivek et al. (2017) to calculate corresponding random eigenvalues. From parallel analysis, there were eight components with larger associated eigenvalues than those from the Monte-Carlo simulation, as shown in Table 4. These eight components explained 77.51 % of the variance in all variables.
Table 4Initial eigenvalues, variances, and results of parallel analysis for the first 10 principal components. The bold values represent the cutting-off point where the initial eigenvalue is less than that obtained from the Monte-Carlo simulation.
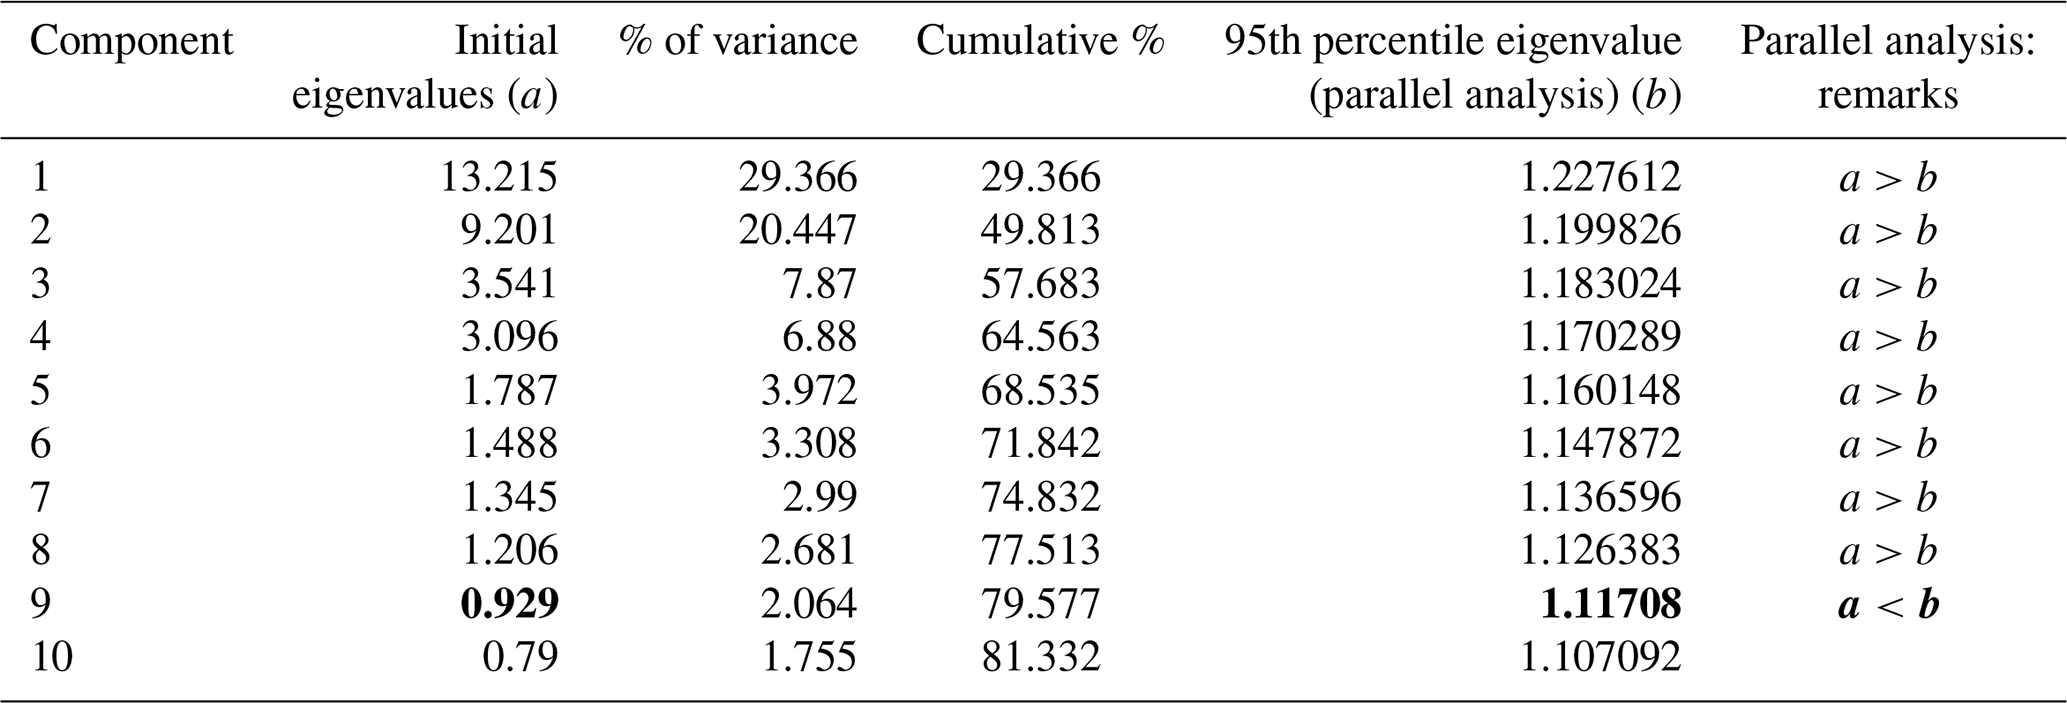
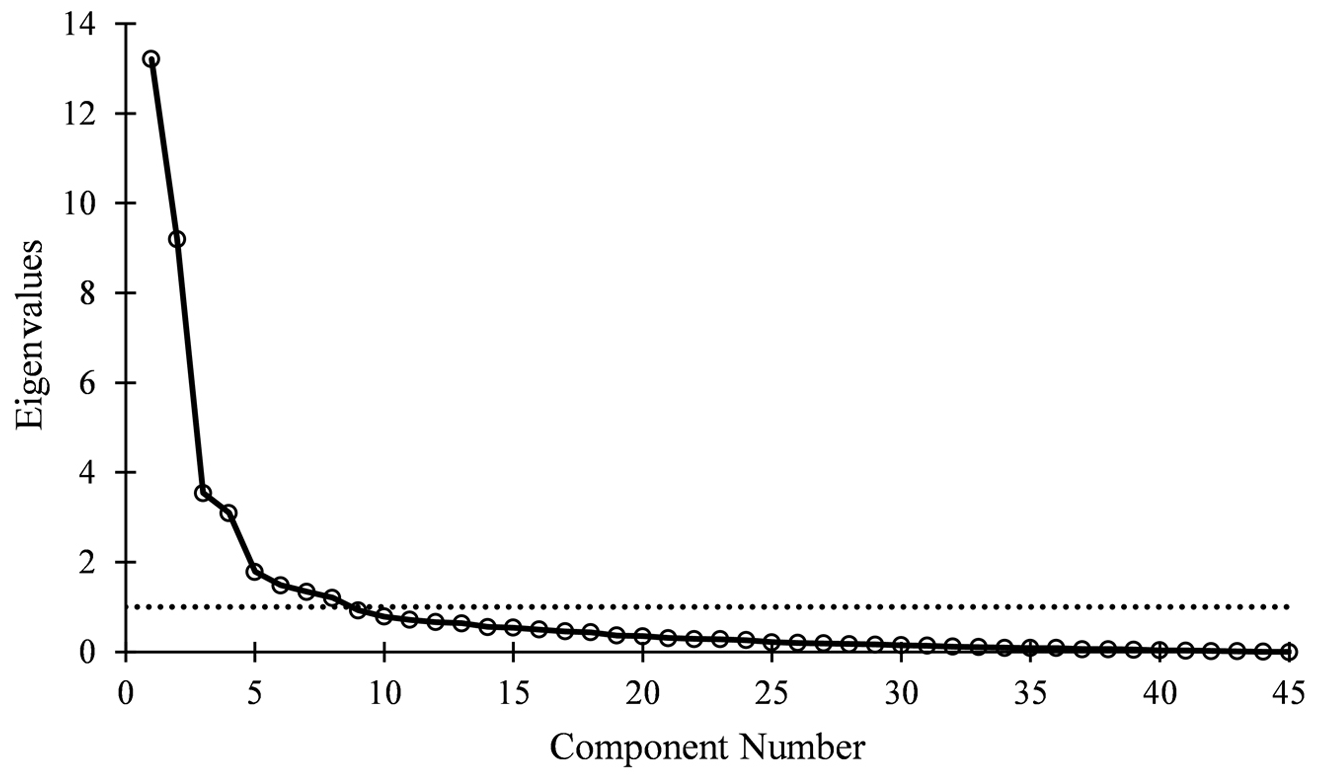
We also used two rules of thumb to calculate the number of components to be retained for comparison. The first rule of thumb used in this study was proposed by Kaiser (1960). As per this rule, only those principal components with eigenvalues greater than 1.0 were retained. As seen in Table 4, just like parallel analysis, Kaiser's rule also indicated eight principal components. The Cattell scree test was also used as the second rule of thumb, and the test proposed in Cattell (1966) is based on the scree plot (eigenvalues vs. the number of components). According to this test, a point where the scree plot moves from steep to shallow was taken as a cutting-off point, as shown in Fig. 2, which also indicated eight principal components similar to parallel analysis.
Suitability of data for PCA
We performed two tests, the Kaiser–Meyer–Olkin (KMO) test and Bartlett's test, to check the adequacy of data for PCA. The KMO measure of sampling adequacy depicts the proportion of variance in the variables that might be caused by underlying factors (Kaiser, 1970; Fekete, 2009). A KMO value greater than 0.8 was considered good, while a KMO value less than 0.5 required some remedy, either by deleting or adding variables (IBM Support, 2020). Similarly, Bartlett's test of sphericity is the suitability test, in which a value below 0.05 indicates the variables are related and suitable for structure detection. In this study, a KMO value of 0.873 and Bartlett's test value of 0.000 passed the requirements of data for PCA.
Statistical analysis
PCA was carried out in Statistical Package for Social Science (SPSS version 21.0). We employed the Varimax rotation with Kaiser normalization as applied by Aksha et al. (2019) and Fekete (2009), which maximized the variance shared among data and eases the interpretation by rotating the axes of the components perpendicular to them. For the interpretation of the result, we suppressed the absolute loading value less than 0.30 and considered eigenvalues greater than 1.0 as in Fekete (2009). Due to the lack of a justifiable method and evidence for weighting components, an equal weighting and additive approach were considered in our study. This approach was also used in Cutter et al. (2003) and Aksha et al. (2019). The loadings after PCA are presented in Table 2. Subsequently, SoVI scores were calculated by summing the scores of all principal components. As presented in the paper by Tate (2012), SoVI scores were used in the form of standard deviations (z scores) or quintiles to emphasize their relative value. Furthermore, z scores were considered to classify the social vulnerability of each VDC and municipality into five groups and then plotted the results in map form using ArcGIS.
3.2 Assessment of physical risk
The classical Probabilistic Seismic Hazard Analysis (PSHA)-based risk calculator was performed to calculate the annual average loss using OpenQuake. This calculator combines numerical integration, physical vulnerability functions of the assets, and seismic hazard curve at the location to calculate the loss distribution for the asset within a specified time period (Pagani et al., 2014). The calculator requires an exposure model describing the distribution of building typologies, physical vulnerability functions for each building type, and hazard curves calculated in the region of interest. The hazard curves required were also calculated using the OpenQuake engine using the classical PSHA approach. For hazard curve derivation, a source model and ground motion prediction were inputted in the OpenQuake engine. Finally, the value of annual average loss (AAL) for each VDC and municipality was rescaled into the range between 0 and 1 using min–max rescaling (Eq. 1).
3.2.1 Source model
In this study, the 23 source zones similar to those of Thapa and Guoxin (2013) were considered for probabilistic seismic hazard analysis. The seismic source zones are shown in Fig. 3. The delineated sources were assumed to be homogenous in terms of their seismicity such that every point was assigned an equal probability of occurrence of an earthquake. Thapa and Guoxin (2013) determined a “b” value of 0.85 for the entire region. Here, we considered the same “b” value as proposed in that study. Generally, small-magnitude earthquakes have a minute effect on infrastructures. Therefore, for the hazard analysis, the minimum magnitude (Mw) within all source zones was considered 4.0. Similarly, the hypocenter depth of 10 km was used for the entire region.
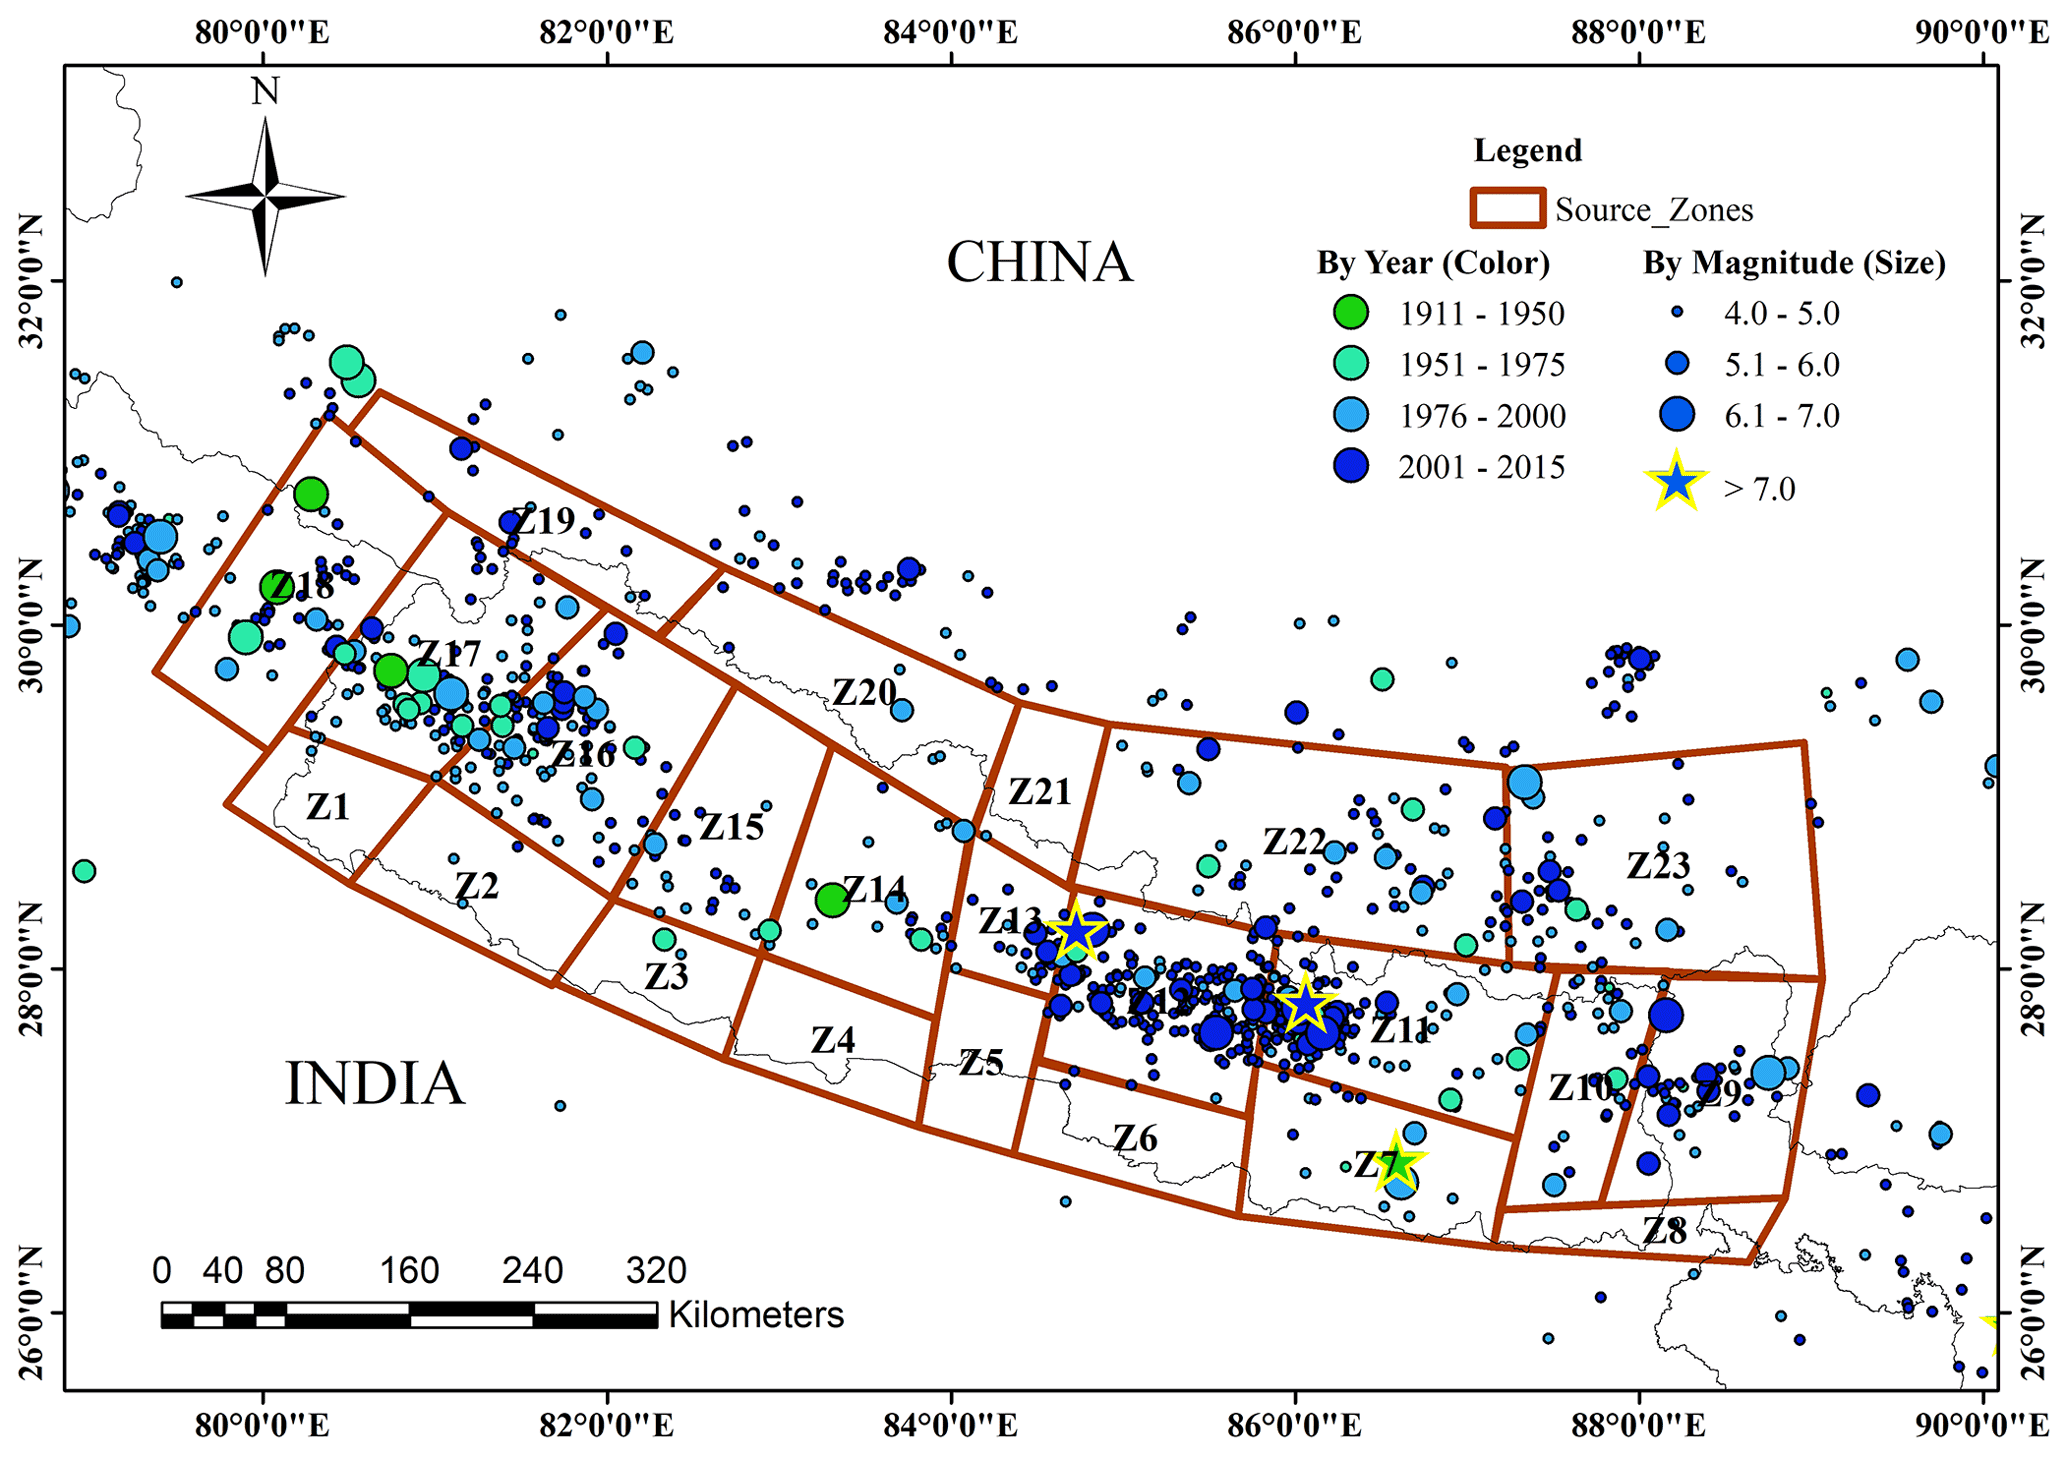
Figure 3Seismic source zones of Nepal (Thapa and Guoxin, 2013).
3.2.2 Attenuation relationship (selection of ground motion prediction equation)
We assumed the tectonic region to be a shallow crust and subduction interface like that in Chaulagain et al. (2016). Atkinson and Boore (2003), Youngs et al. (1997), Campbell and Bozorgnia (2008), Chiou and Youngs (2008), and Boore and Atkinson (2008) were used. These equations were used within a logic tree (equal weights for each equation) to conduct probabilistic seismic hazard and risk analysis in OpenQuake.
3.2.3 Exposure model and physical vulnerability model
In this study, the building descriptions and data from the 2011 census were used to develop the exposure model without considering the industrial or commercial buildings. In other words, only residential buildings were considered for the exposure model. The total number of households according to the 2011 census is 5 423 297. The exposure models used in the study are part of the seismic risk assessment with uncertainties, although present studies like Kalakonas et al. (2020), Bal et al. (2010), and Gómez Zapata et al. (2022) have pointed out how the epistemic uncertainties embedded in exposure models are propagated throughout the computation of seismic risk.
We considered five types of buildings – mud-bonded, cement-bonded, reinforced cement concrete (RCC), wooden, and adobe. Most of the residential buildings in Nepal consist of mud-mortar/bonded-brick masonry. In remote areas, wooden buildings are abundant, whereas in the central region, especially in Kathmandu and urban areas, cement-bonded or reinforced concrete buildings are present. The area and construction cost of each building type is shown in Table 5, as considered by Chaulagain et al. (2015). The spatial distribution of total buildings across the country is shown in Fig. 4a and the individual building typology is summarized in the box-and-whisker plot shown in Fig. 4b. From Fig. 4b, it can be observed that the average number of buildings that are RCC with pillar, mud-bonded, cement-bonded, wooden pillar, and adobe are 135.73, 603.36, 239.91, 340, and 46.33, respectively.
Table 5Area and construction cost of different Building Type (Chaulagain et al., 2015).
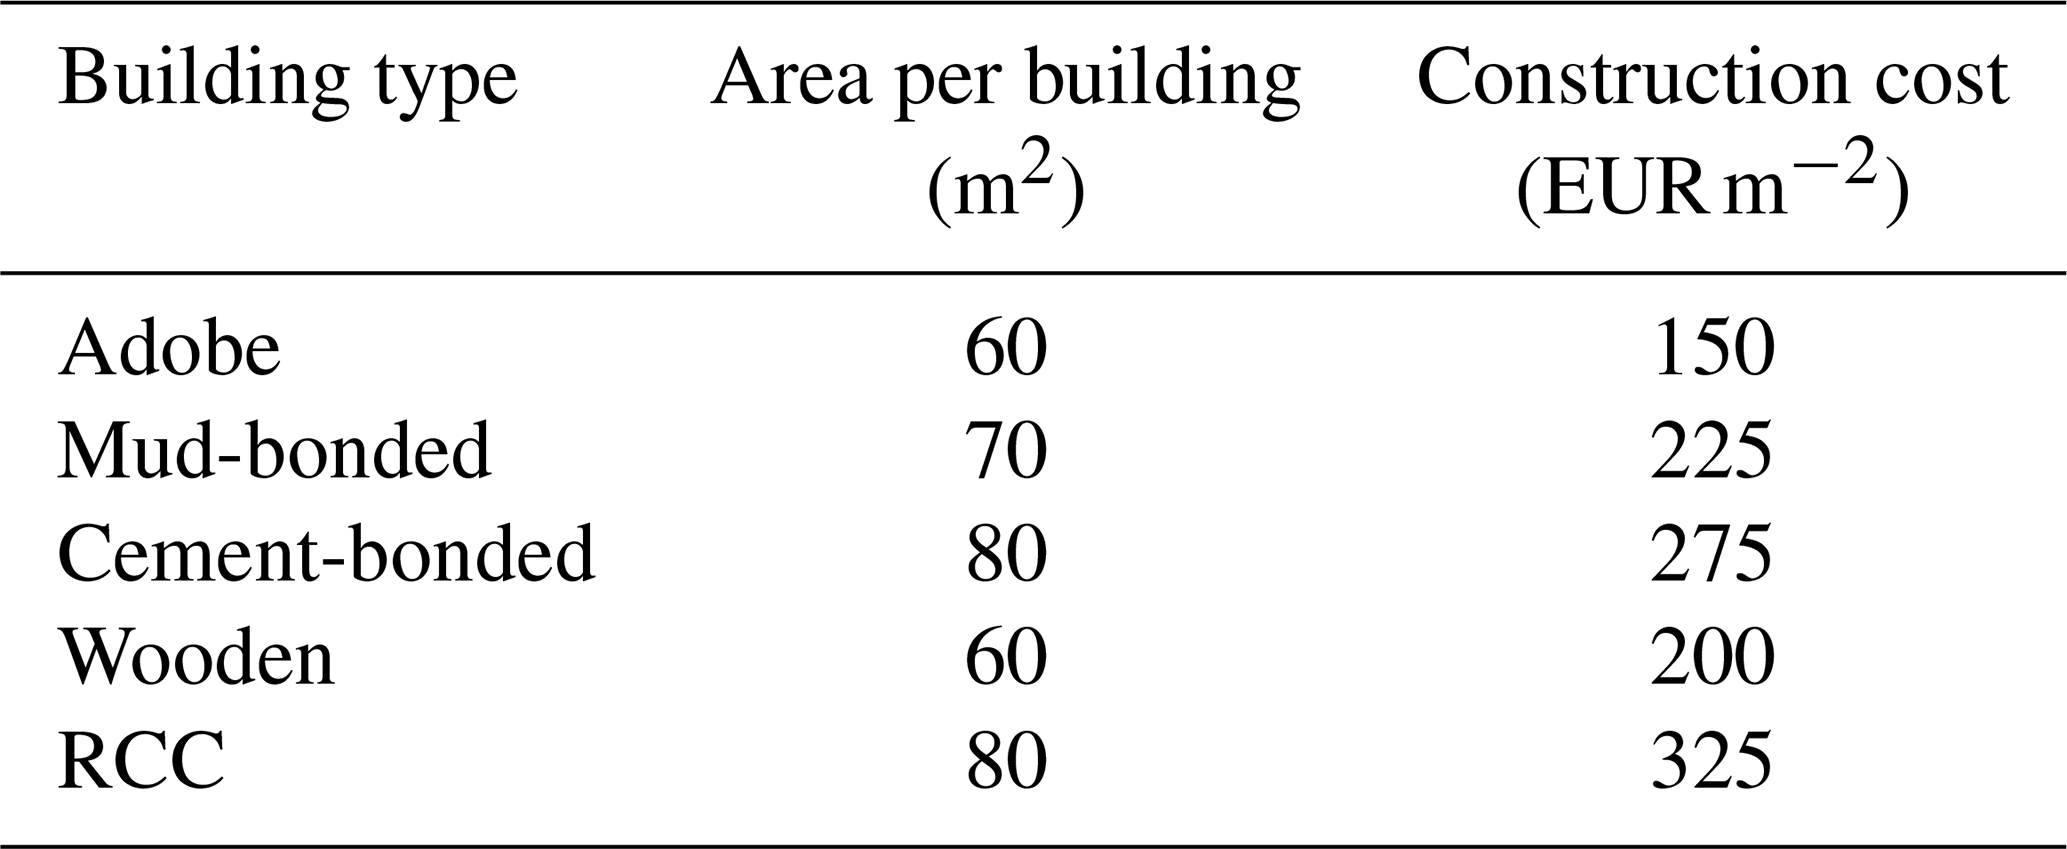
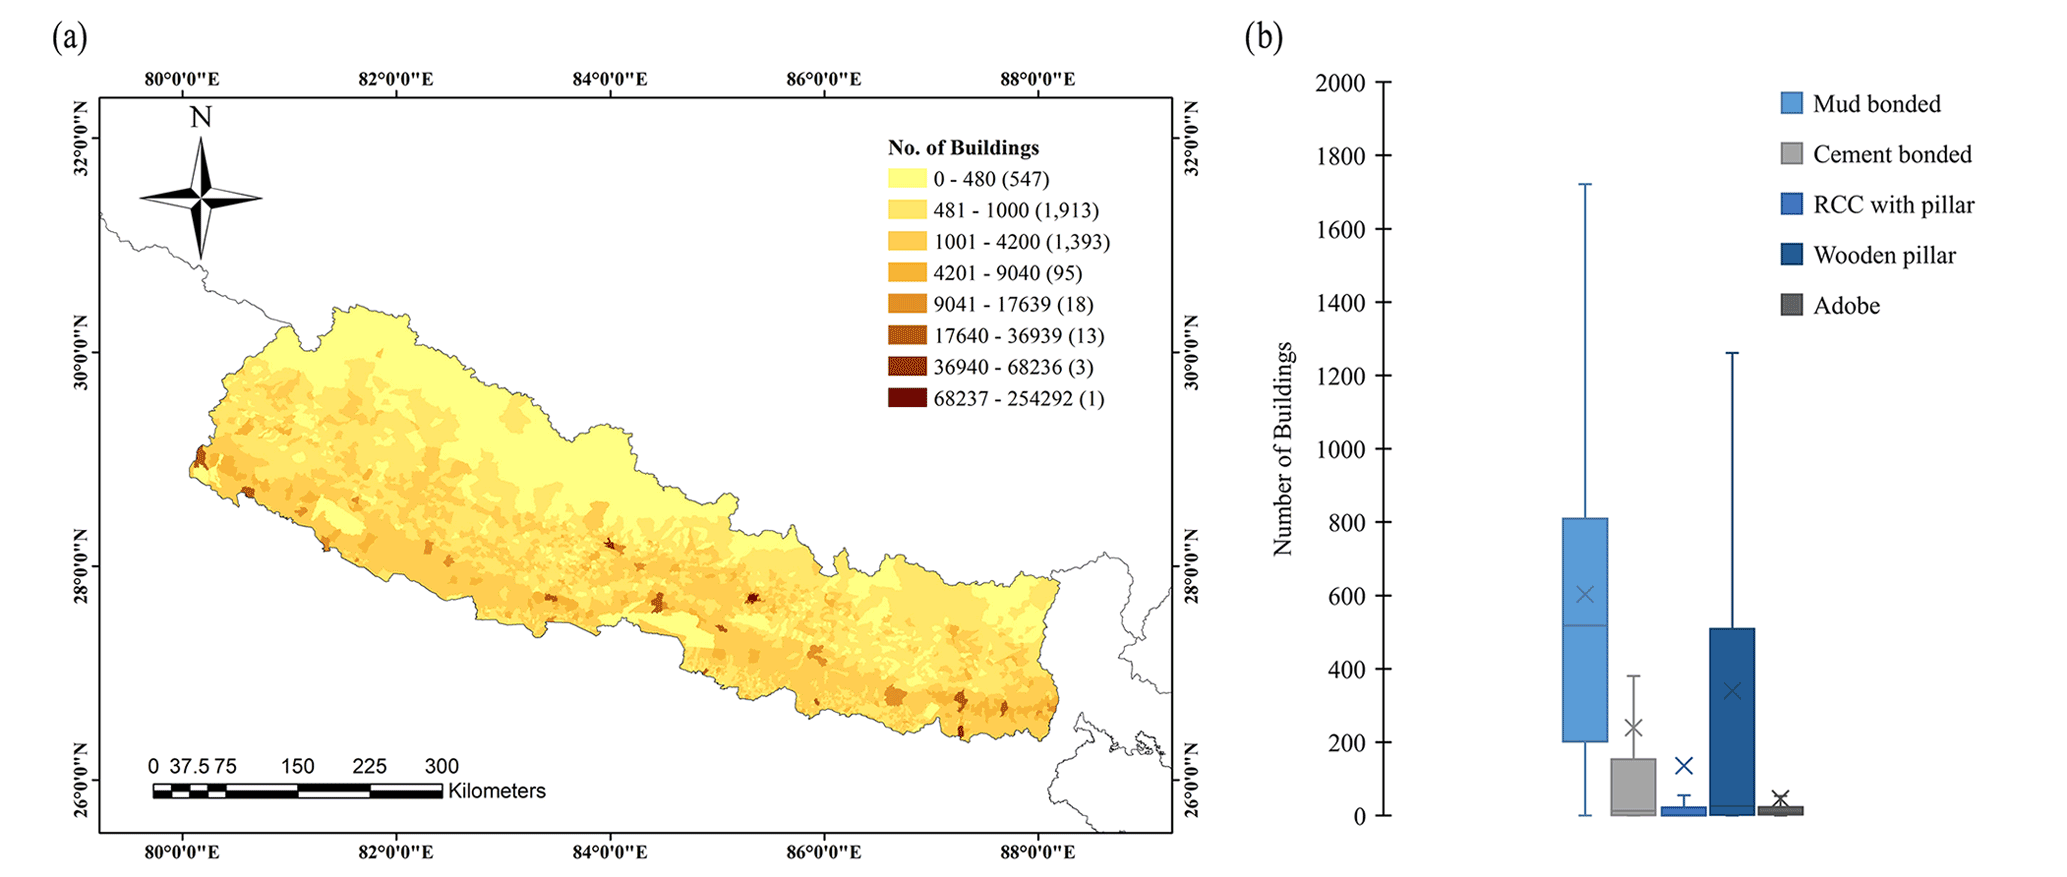
Figure 4(a) Spatial distribution of total buildings in Nepal and (b) box-and-whisker plot describing the distribution of each building type.

Figure 5Fragility curves for (a) adobe, (b) cement-bonded, (c) mud-mortar, and (d) wooden buildings.
Table 6Mean and standard deviation per damage state for each building type (Chaulagain et al., 2015).
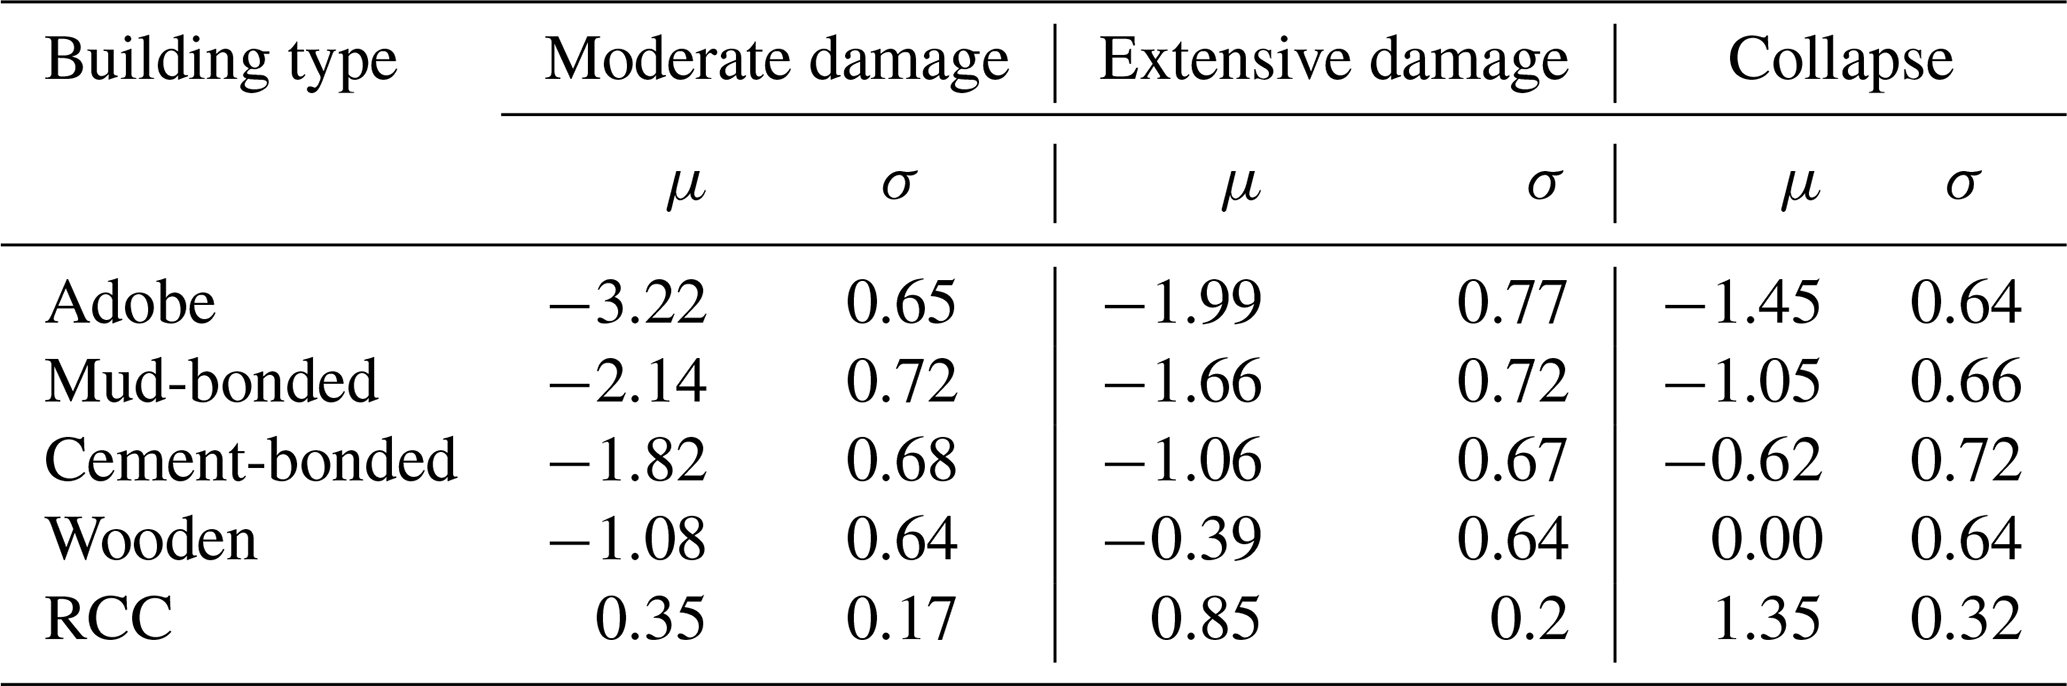
On the other hand, the average annual loss was evaluated using OpenQuake. In this study, the fragility model developed by Chaulagain et al. (2015) was adopted for different building types. To define fragility functions in a discrete manner, for each limit state, a list of intensity measure levels and their corresponding probabilities of exceedance must be provided. The intensity measure level in terms of peak ground acceleration (PGA in g) was used. The fragility curves for different building typologies at each limit state are shown in Figs. 5 and 6. After defining fragility functions, it is also important to assess the correlation between the logarithmic means and standard deviations of each limit state, which are represented by μ and σ, respectively, as shown in Table 6. Subsequently, the fragility curve was inputted in the Vulnerability Modeller's ToolKit (VMTK) developed by GEM OpenQuake to derive the physical vulnerability model. VMTK is a framework divided into six modules which can be used to derive the fragility function via nonlinear dynamic analysis and also the physical vulnerability function using the fragility model and consequence model (Martins et al., 2021). In this process, the fractions of buildings in each damage state were multiplied by the associated damage ratio (from the consequence model) in order to obtain a distribution of loss ratio for each intensity measure type (Pagani et al., 2014). The damage ratios 0.3, 0.6, and 1.0 were used for each damage type: moderate, extensive, and collapse, respectively, as per Chaulagain et al. (2015). The vulnerability curves for each building typology used in this study are shown in Fig. 7.

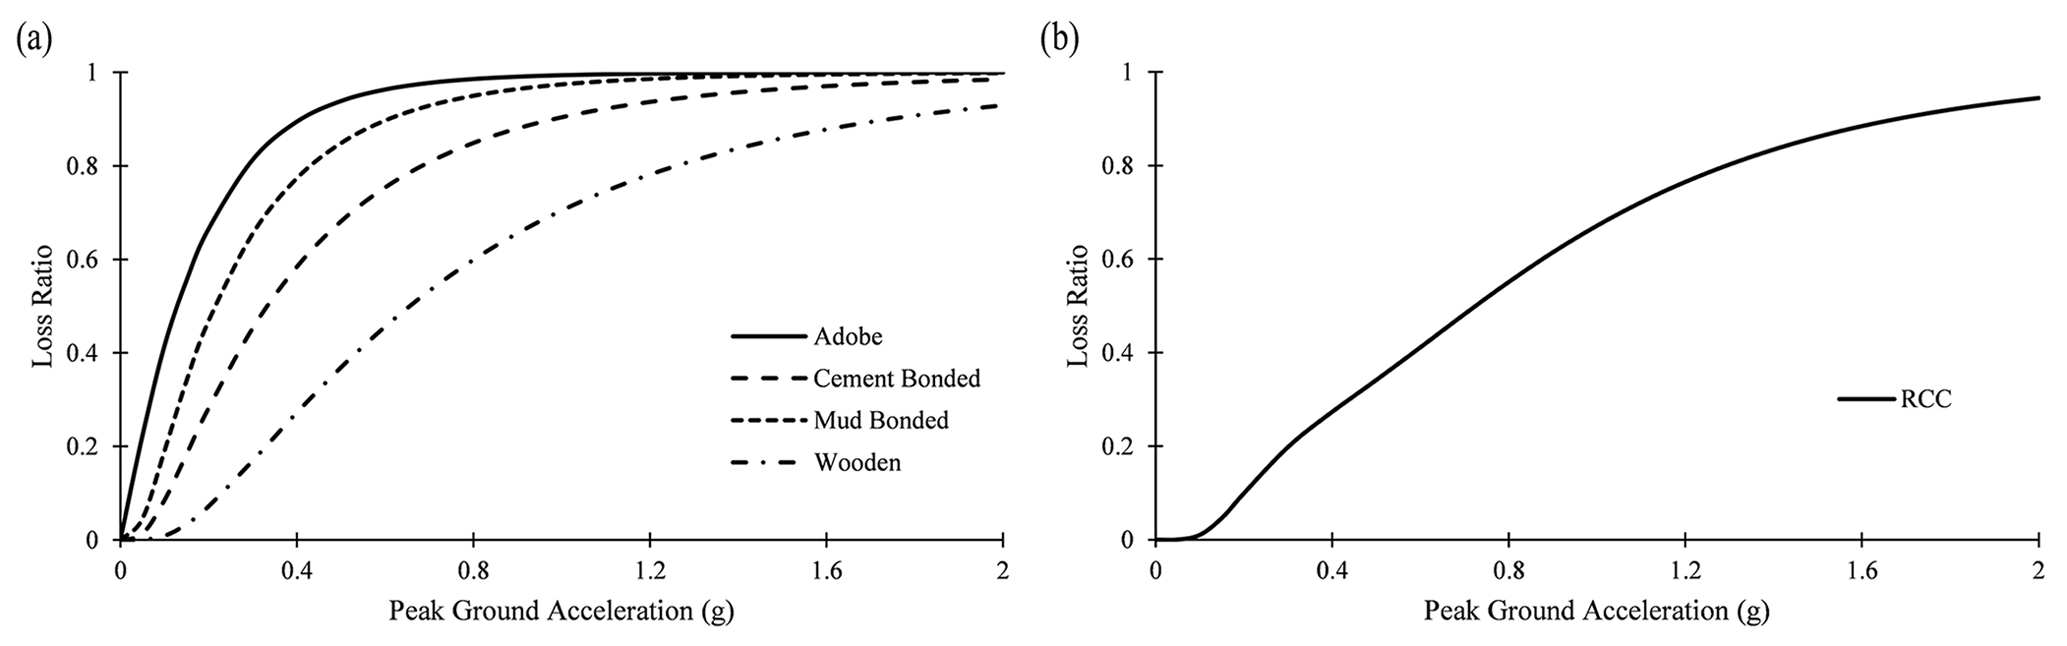
Figure 7Vulnerability curves for (a) adobe, cement-bonded, mud-bonded, and wooden buildings and (b) RCC (reinforced cement concrete) buildings.
3.3 Integrated risk assessment
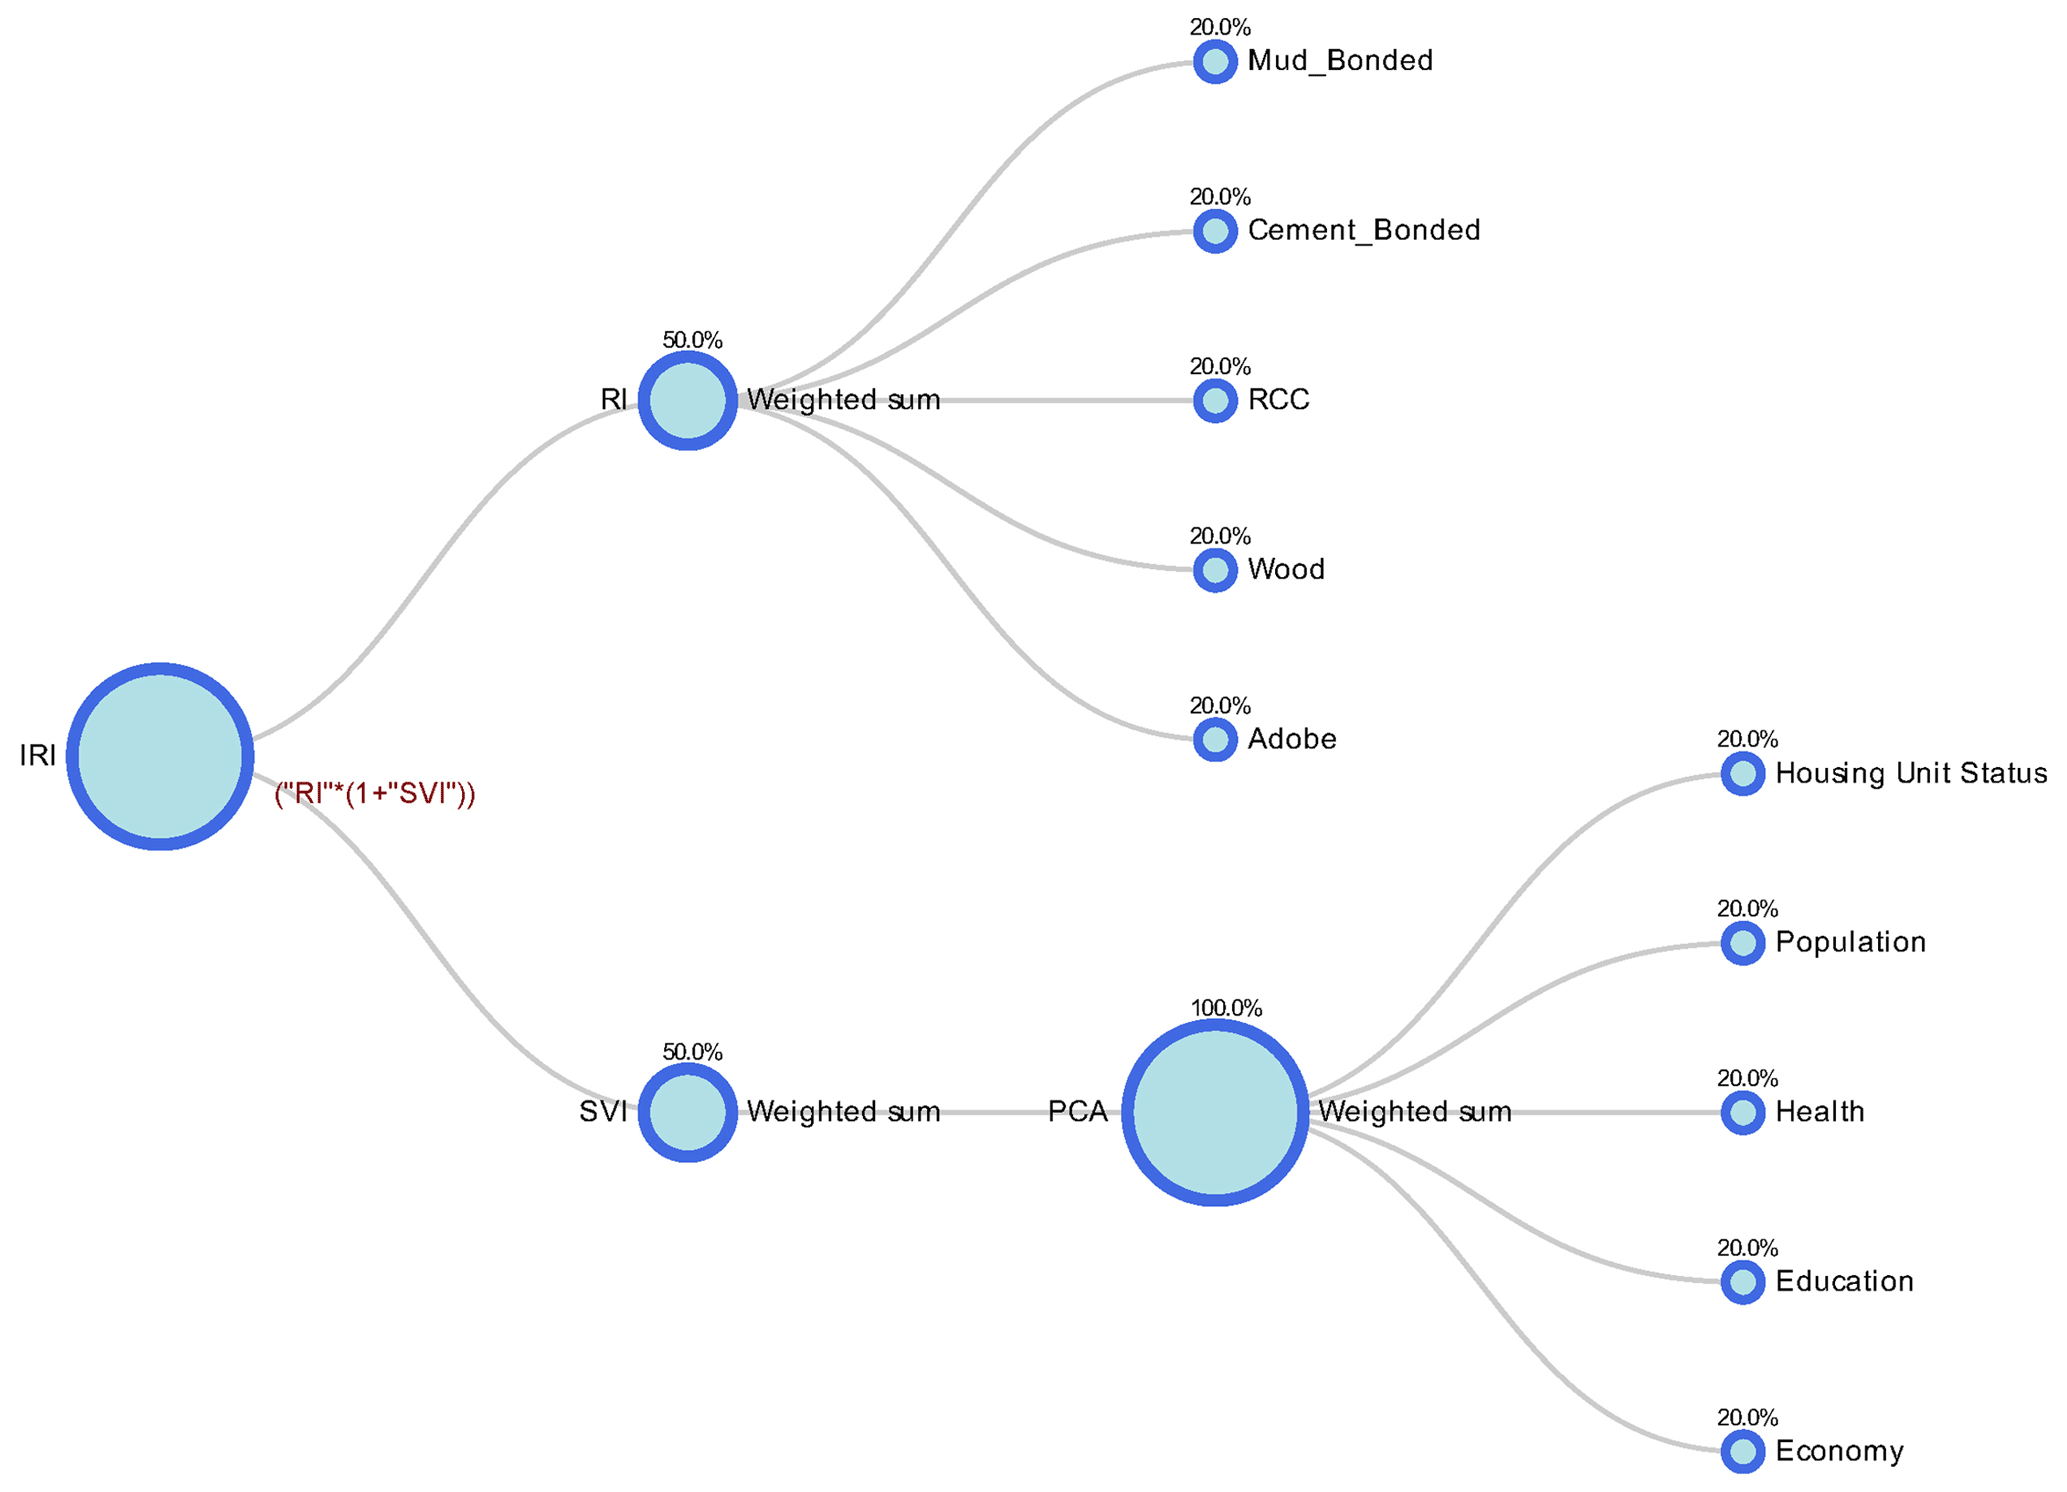
An integrated risk index was constructed by combining the social vulnerability index and estimates of average annual loss in rescaled metrics. The framework or workflow of the integrated risk assessment is shown in Fig. 8. The first step in Fig. 8, seismic hazard, was evaluated using the probabilistic approach. The geographic features represent exposure modeling for residential buildings and their physical vulnerability. By combining these parameters, seismic risks were evaluated in terms of average annual loss (AAL), which was further recomputed by using the min–max rescaling method. The physical vulnerability and exposure model interact with the social and economic parameters or overall capacity of the population to sustain hazards (Burton and Silva, 2016). The social features define socioeconomic parameters related to the demographic population to prepare for, react to, and recuperate from damaging events (Burton and Silva, 2016). The integrated risk is the combination of physical risk and a set of contextual and social vulnerability conditions (Carreño et al., 2012). In this regard, the integrated risk was evaluated based on direct factors or physical risk and socioeconomic factors. The integrated risk index (RT) was calculated using Eq. (3):
Moncho's equation (Eq. 3) was used to evaluate convoluted risk, where Rf is a physical risk index or average annual loss estimate, and F is a social fragility index or aggravating coefficient (Glorfeld, 1995). This technique and its successful application can be found in numerous studies due to its simplicity and successful applications (Burton and Silva, 2016; Carreño et al., 2012; Khazai et al., 2013; Fernandez et al., 2006). The calculated integrated risk was evaluated using the OpenQuake Integrated Risk Modeling Toolkit (IRMT). The IRMT is a plugin developed by the GEM Foundation and available in the QGIS open-source platform that allows a composite framework to be built to assess physical risk and social characteristics that affect the earthquake risk. The diagrammatic workflow of social and physical risk indicators developed by OpenQuake IRMT is shown in Fig. 9. The integrated toolkit involves details from the selection of indicators to the detailing and mapping of composite risk assessment.

Figure 8Framework for integrated risk approach (Burton and Silva, 2016).
4.1 Results of social vulnerability analysis
The results of social vulnerability analysis are shown in Fig. 10, which depicts the distribution of total SoVI scores across the country. SoVI scores for each district provide relative comparison within the districts' subdivision units. The districts mapped with darker red shades demonstrate higher rates of social vulnerability. It can be seen in Fig. 10 that there is a higher degree of risk in the far-western region hosting places like Godawari and Deukhuri. This region is one of the most rural areas of Nepal with nominal availability of infrastructure. The results also illustrate that the Terai region with cities like Janakpur and Biratnagar shows a higher level of social vulnerability. These cities may be at greater risk as a result of infrastructure exposure. On the other hand, the central and eastern regions of Nepal with the cities of Kathmandu, Pokhara, and Hetauda are comparatively at lower risk. The social vulnerability map of the country demonstrates higher levels of social vulnerability in rural areas with few exposed assets and industrial areas with exposure of infrastructure, whereas the lowest levels of social vulnerability are in urban and populated cities like Kathmandu, Pokhara, and Hetauda.
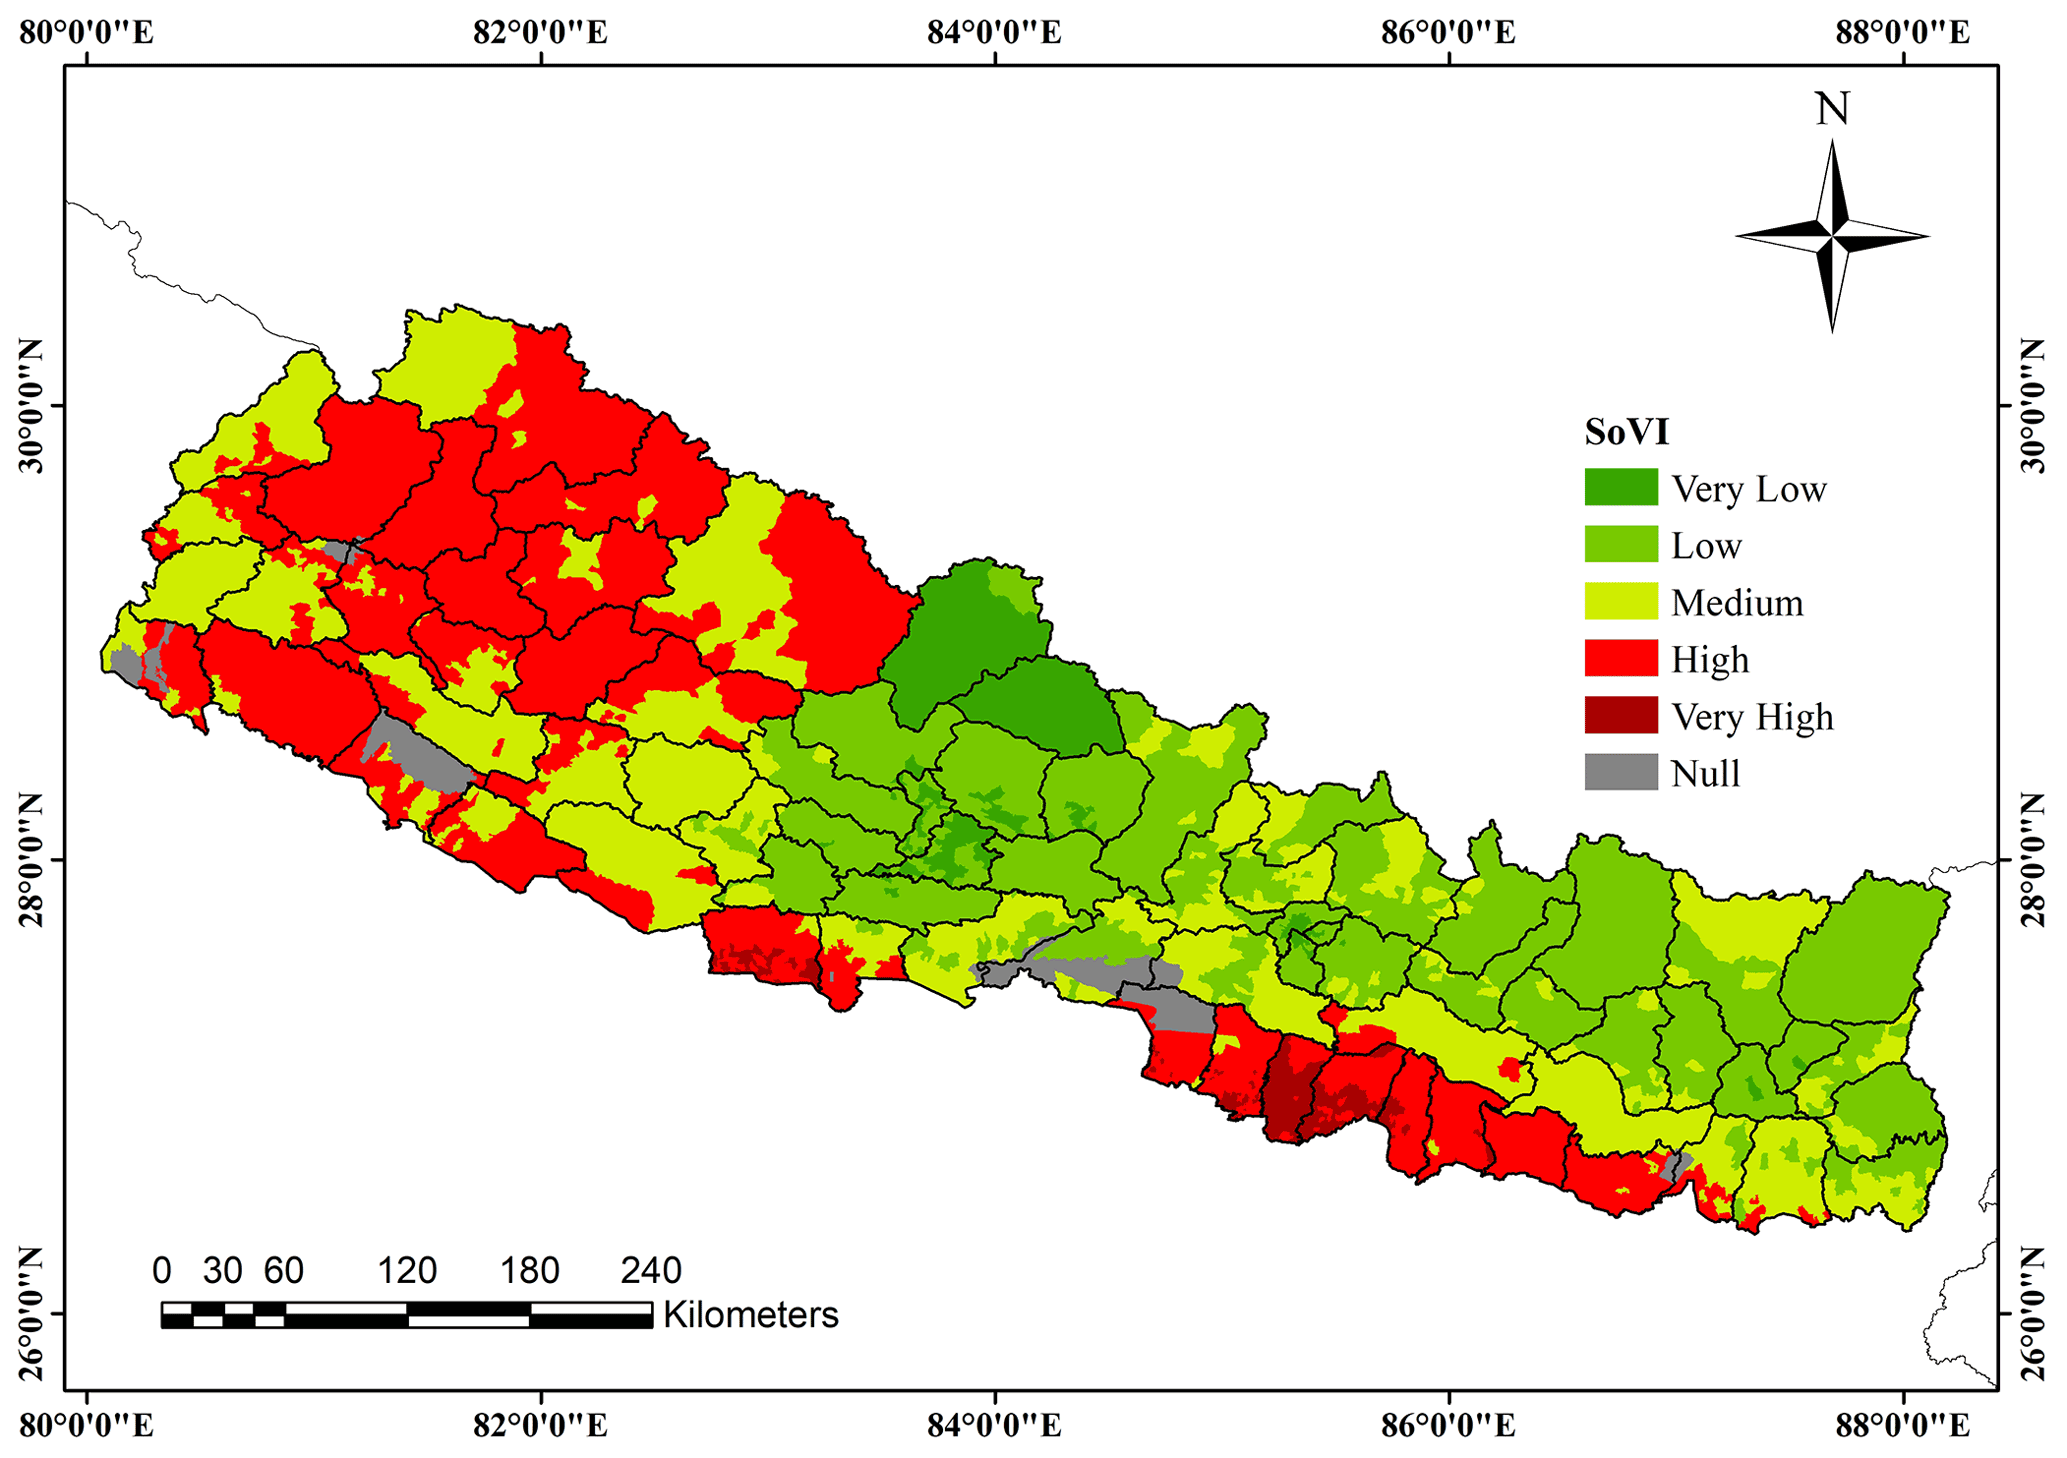
Figure 10Spatial distribution of social vulnerability index in districts of Nepal.
To further explore the overall social vulnerability observed in Fig. 10, we generated the maps of sub-components: housing unit, population, health, education, and the economy, as shown in Fig. 11. Figure 11a shows that highly vulnerable areas under the housing unit category are concentrated in the far-western hill and eastern Terai regions. The houses in rural areas are highly vulnerable due to their old age and lack of amenities like retrofitting and repairing. The population component (Fig. 11b) exhibits a high level of vulnerability in Kathmandu, Janakpur, and some parts of the far-western region. There is a dense population and unorganized urbanization in Kathmandu, whereas the far-western region hosts minorities and an old-age population. Under the health component (Fig. 11c), there is an intense degree of vulnerability in the Terai region and the hilly parts of the far-western region. These regions have the least access to health facilities. Similarly, the education component (Fig. 11d) reveals great vulnerability in the eastern Terai region. The economy component (Fig. 11e) shows a very high degree of vulnerability in the mid-part of the far-western region and the Terai region. There is a high level of vulnerability in the far-western region of the country due to the prevalence of a higher number of minorities, illiteracy rate, nominal infrastructural access, and poor economic status.
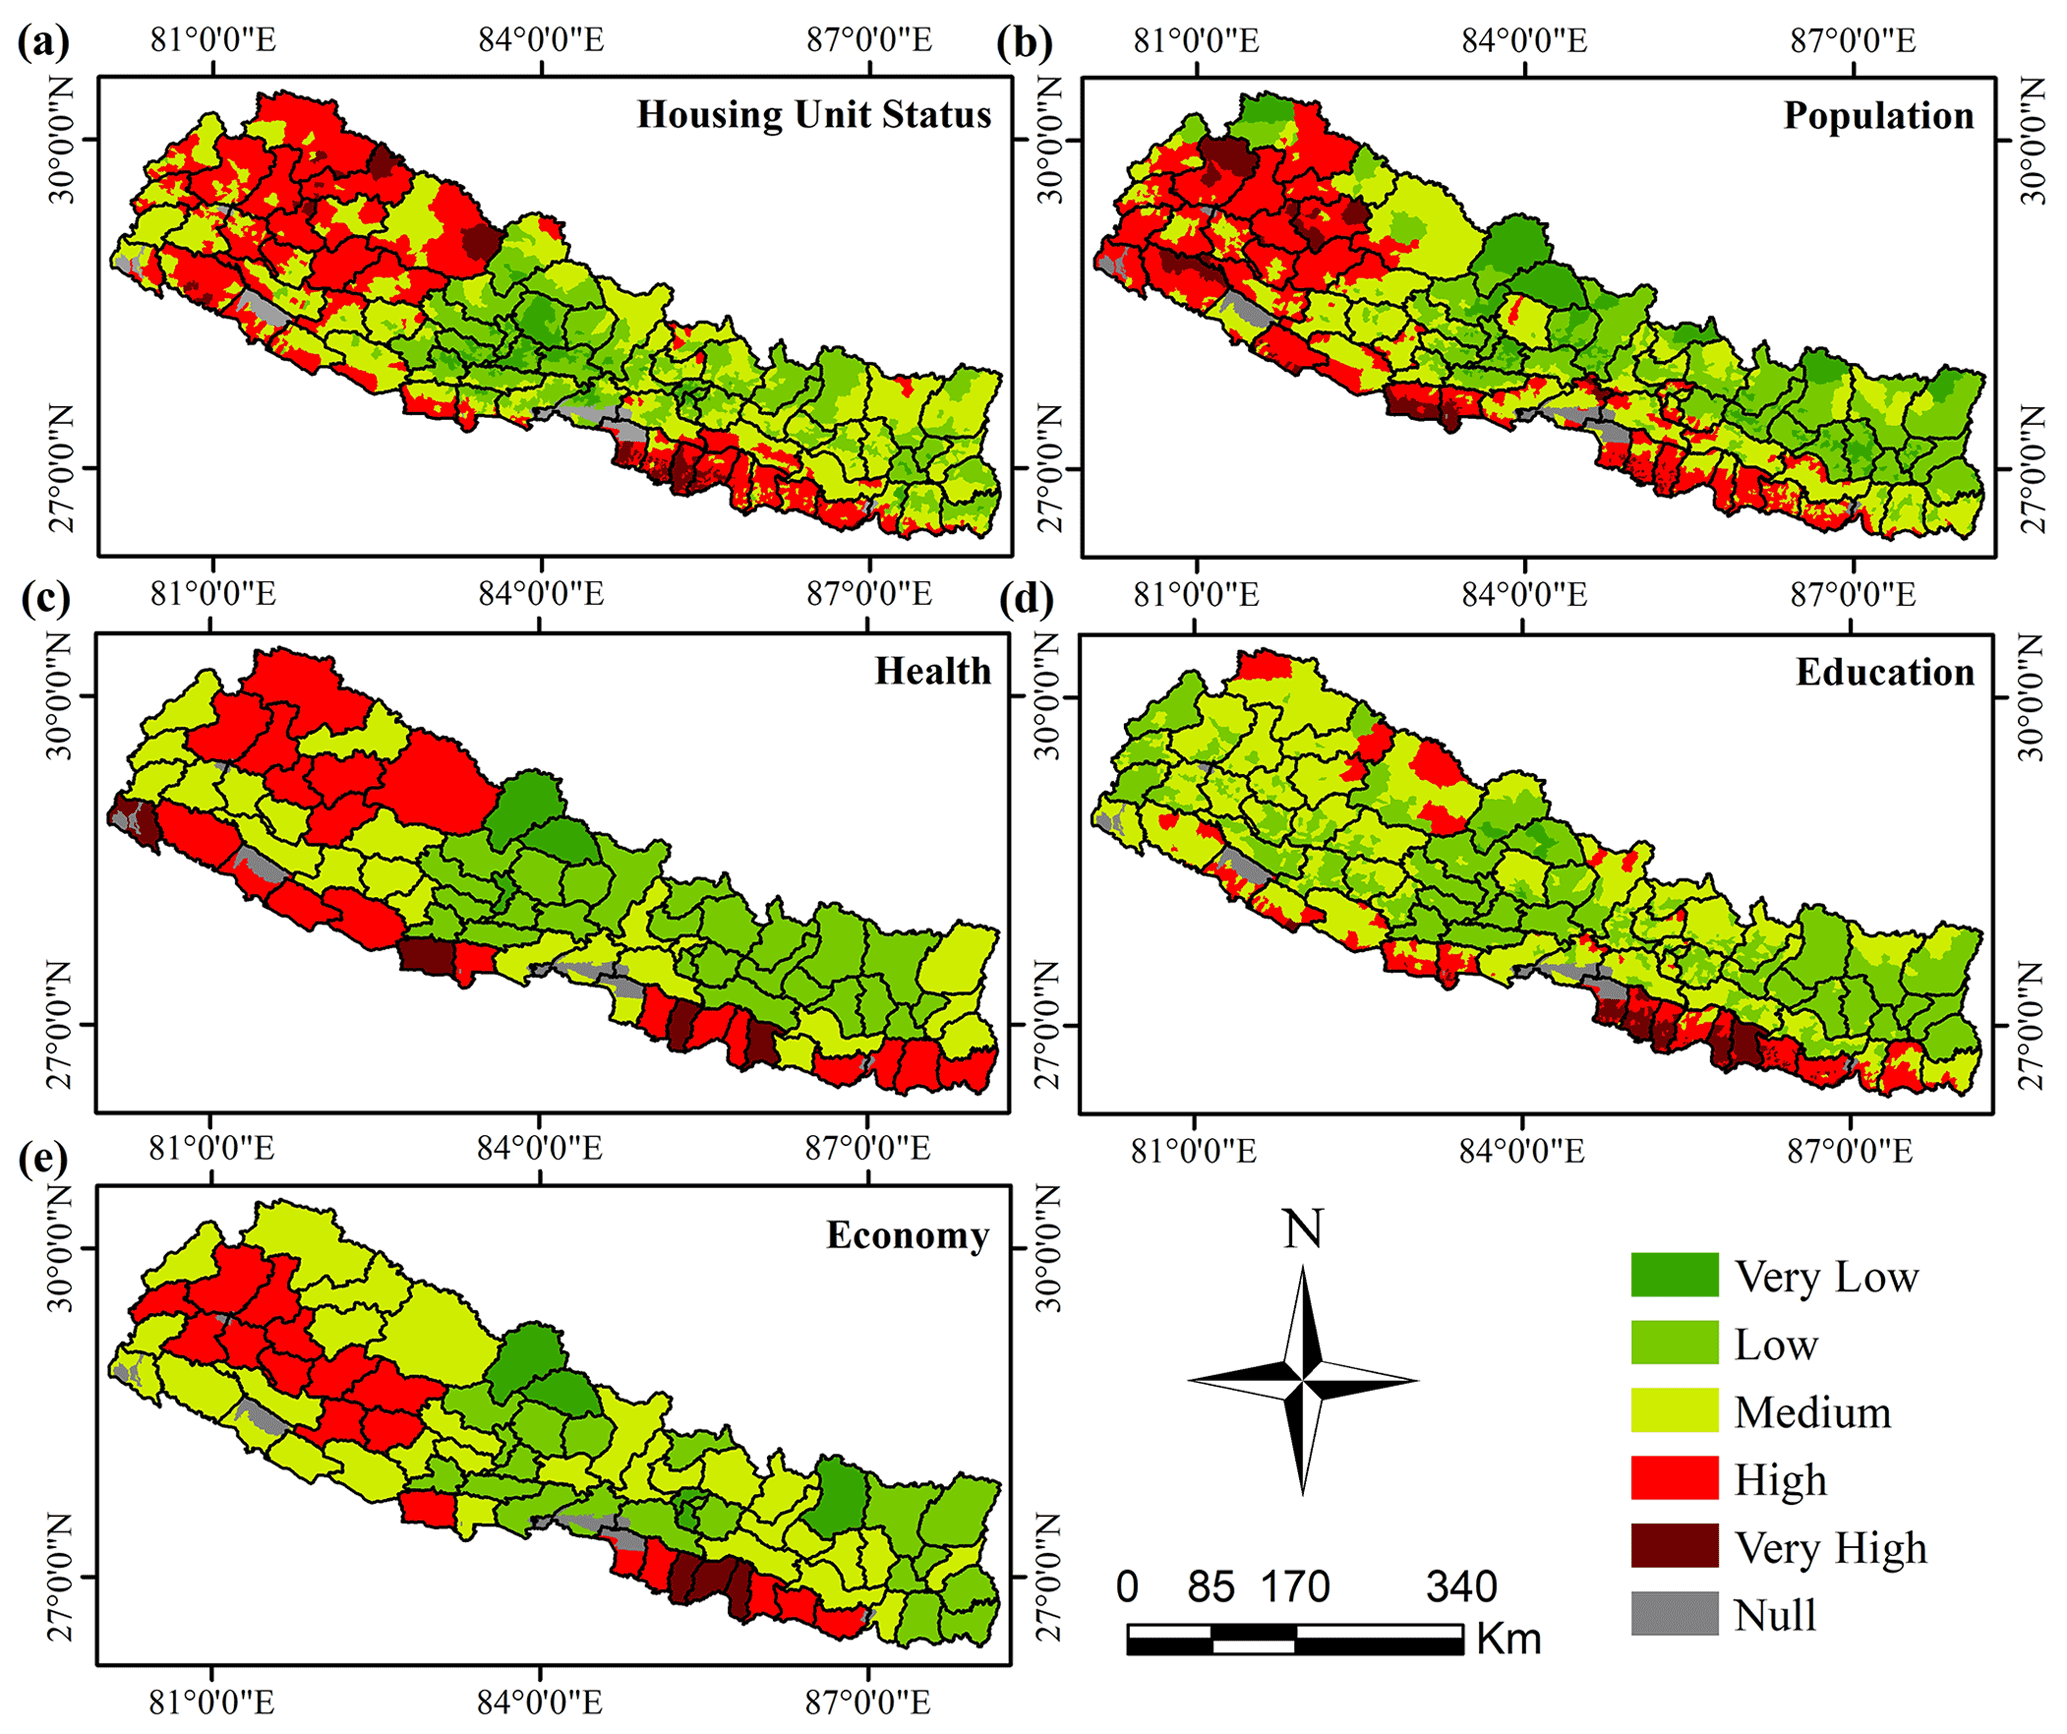
Figure 11Spatial distribution of social vulnerability by sub-category.
4.2 Results of seismic risk assessment
The probabilistic seismic hazard analysis was carried out, and then the physical risk estimations were made, as shown in Fig. 12. The physical risk in terms of average annual loss (AAL) index obtained from the risk analysis was classified into five quintiles from very low ( standard deviation) to very high (>1.5 standard deviations) vulnerability. Figure 12 shows the distribution of AAL per capita in monetary terms, and Fig. 13 shows the distribution of the seismic risk index across the country. The null regions in the maps represent the areas which are national parks and wildlife reserves with nominal population. From Fig. 13, it is observed that the Terai region, especially the eastern Terai and central Terai regions, lies in a higher seismic risk category. Kathmandu Valley also lies in a very high-risk category. Contrary to social vulnerability, the western part of Nepal lies in the lower AAL value region.
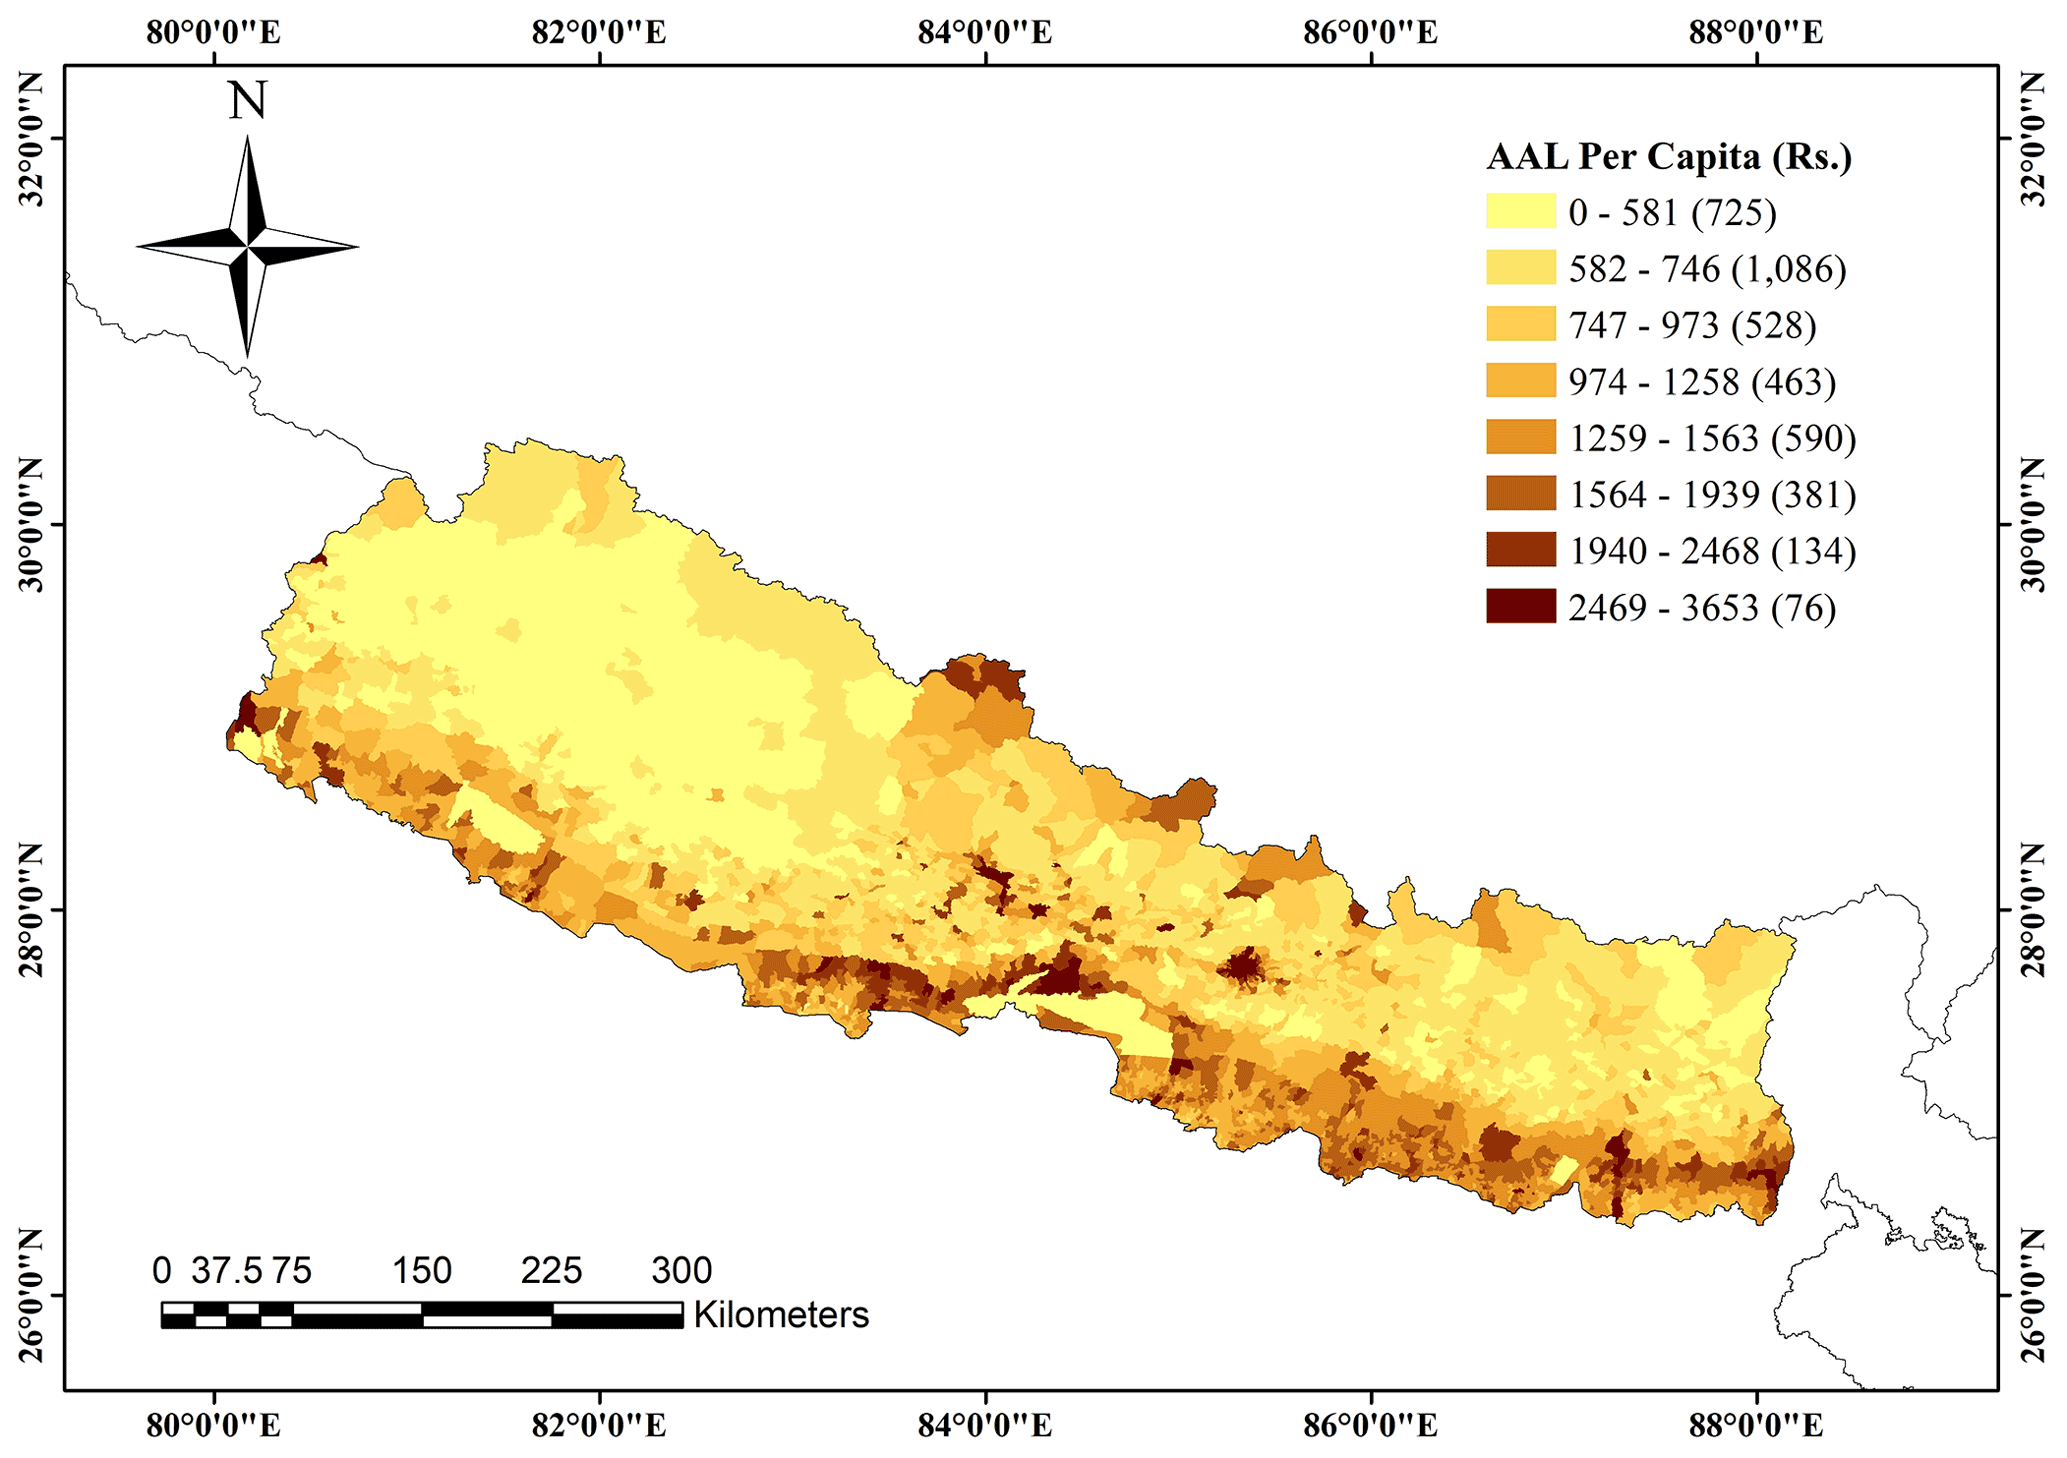
Figure 12Average annual loss per capita, as calculated from OpenQuake, for Nepal.
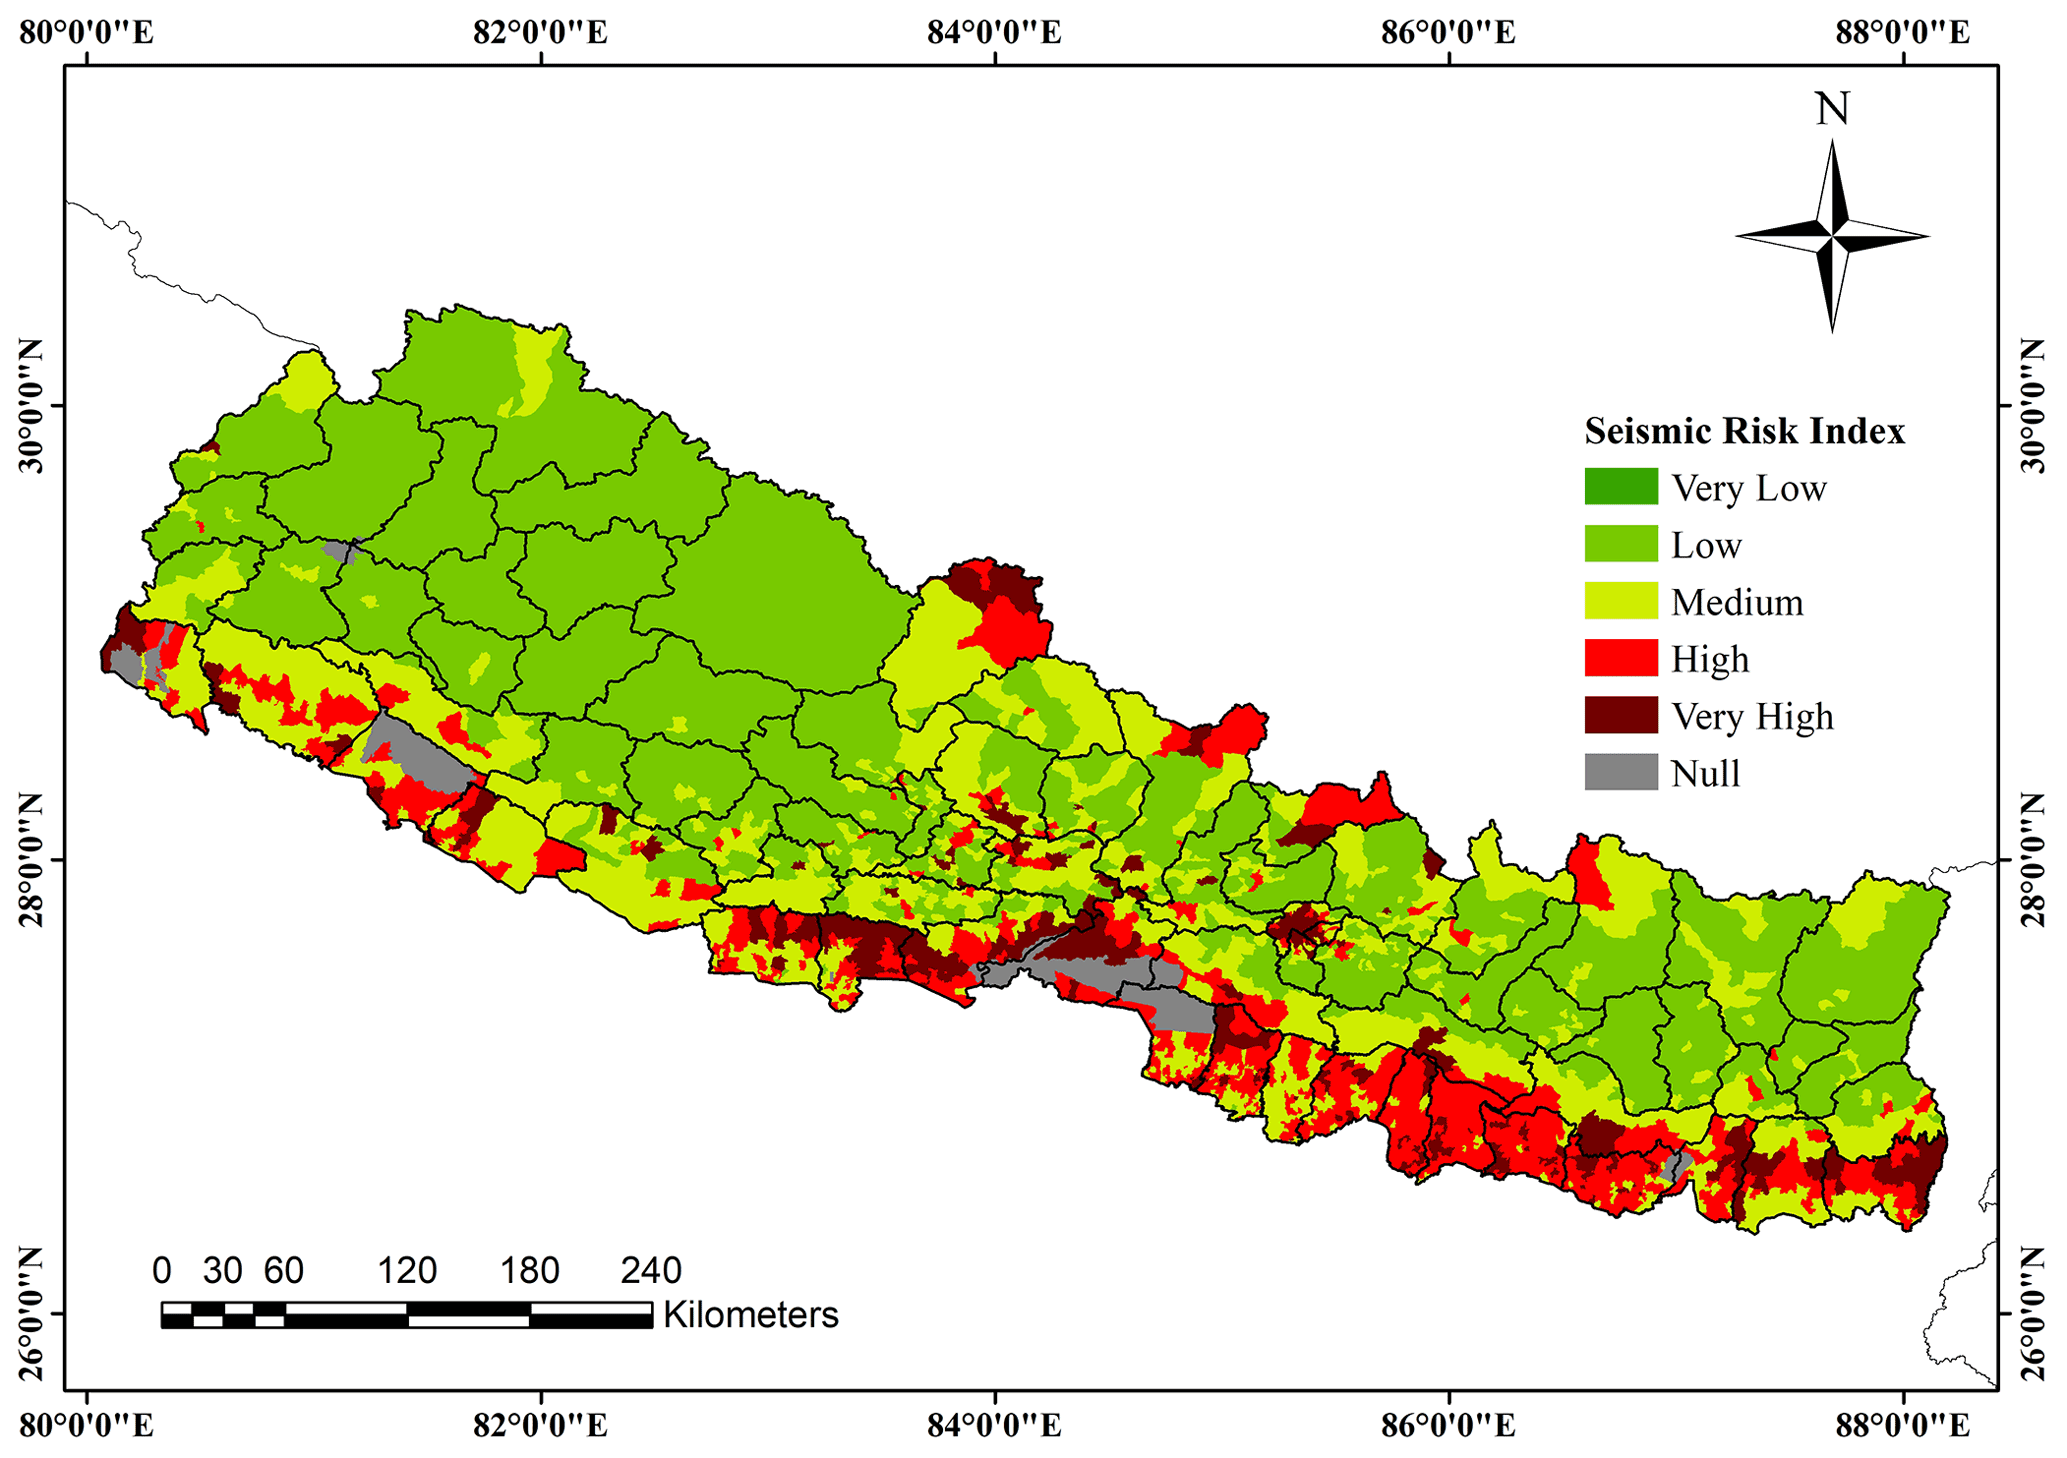
Figure 13Spatial distribution of the seismic risk index in Nepal.
4.3 Results of integrated risk assessment
Social vulnerability shows the intensity of the impact of any disaster. When combined with the impact of seismic action, the true nature of the distribution of seismic risk becomes evident. As shown in Fig. 14, the integrated risk is higher in the Terai region in cities like Janakpur and Biratnagar. Kathmandu region has a low SoVI index but a high integrated risk index. Similarly, the far-western hills and the mountain region are found to be low-risk regions even though they have a high SoVI index. However, due to their high social vulnerability, these regions should still be depicted as a concern. Despite having a low number of houses, the houses may be of lower quality, which are likely to suffer damage from even low-magnitude earthquakes, and these regions may not have enough resources for mitigation measures. On top of that, even though they are in low-seismic risk-regions, the respective population may be at high risk from other disasters like a landslide, flood, glacier, or other weather conditions.
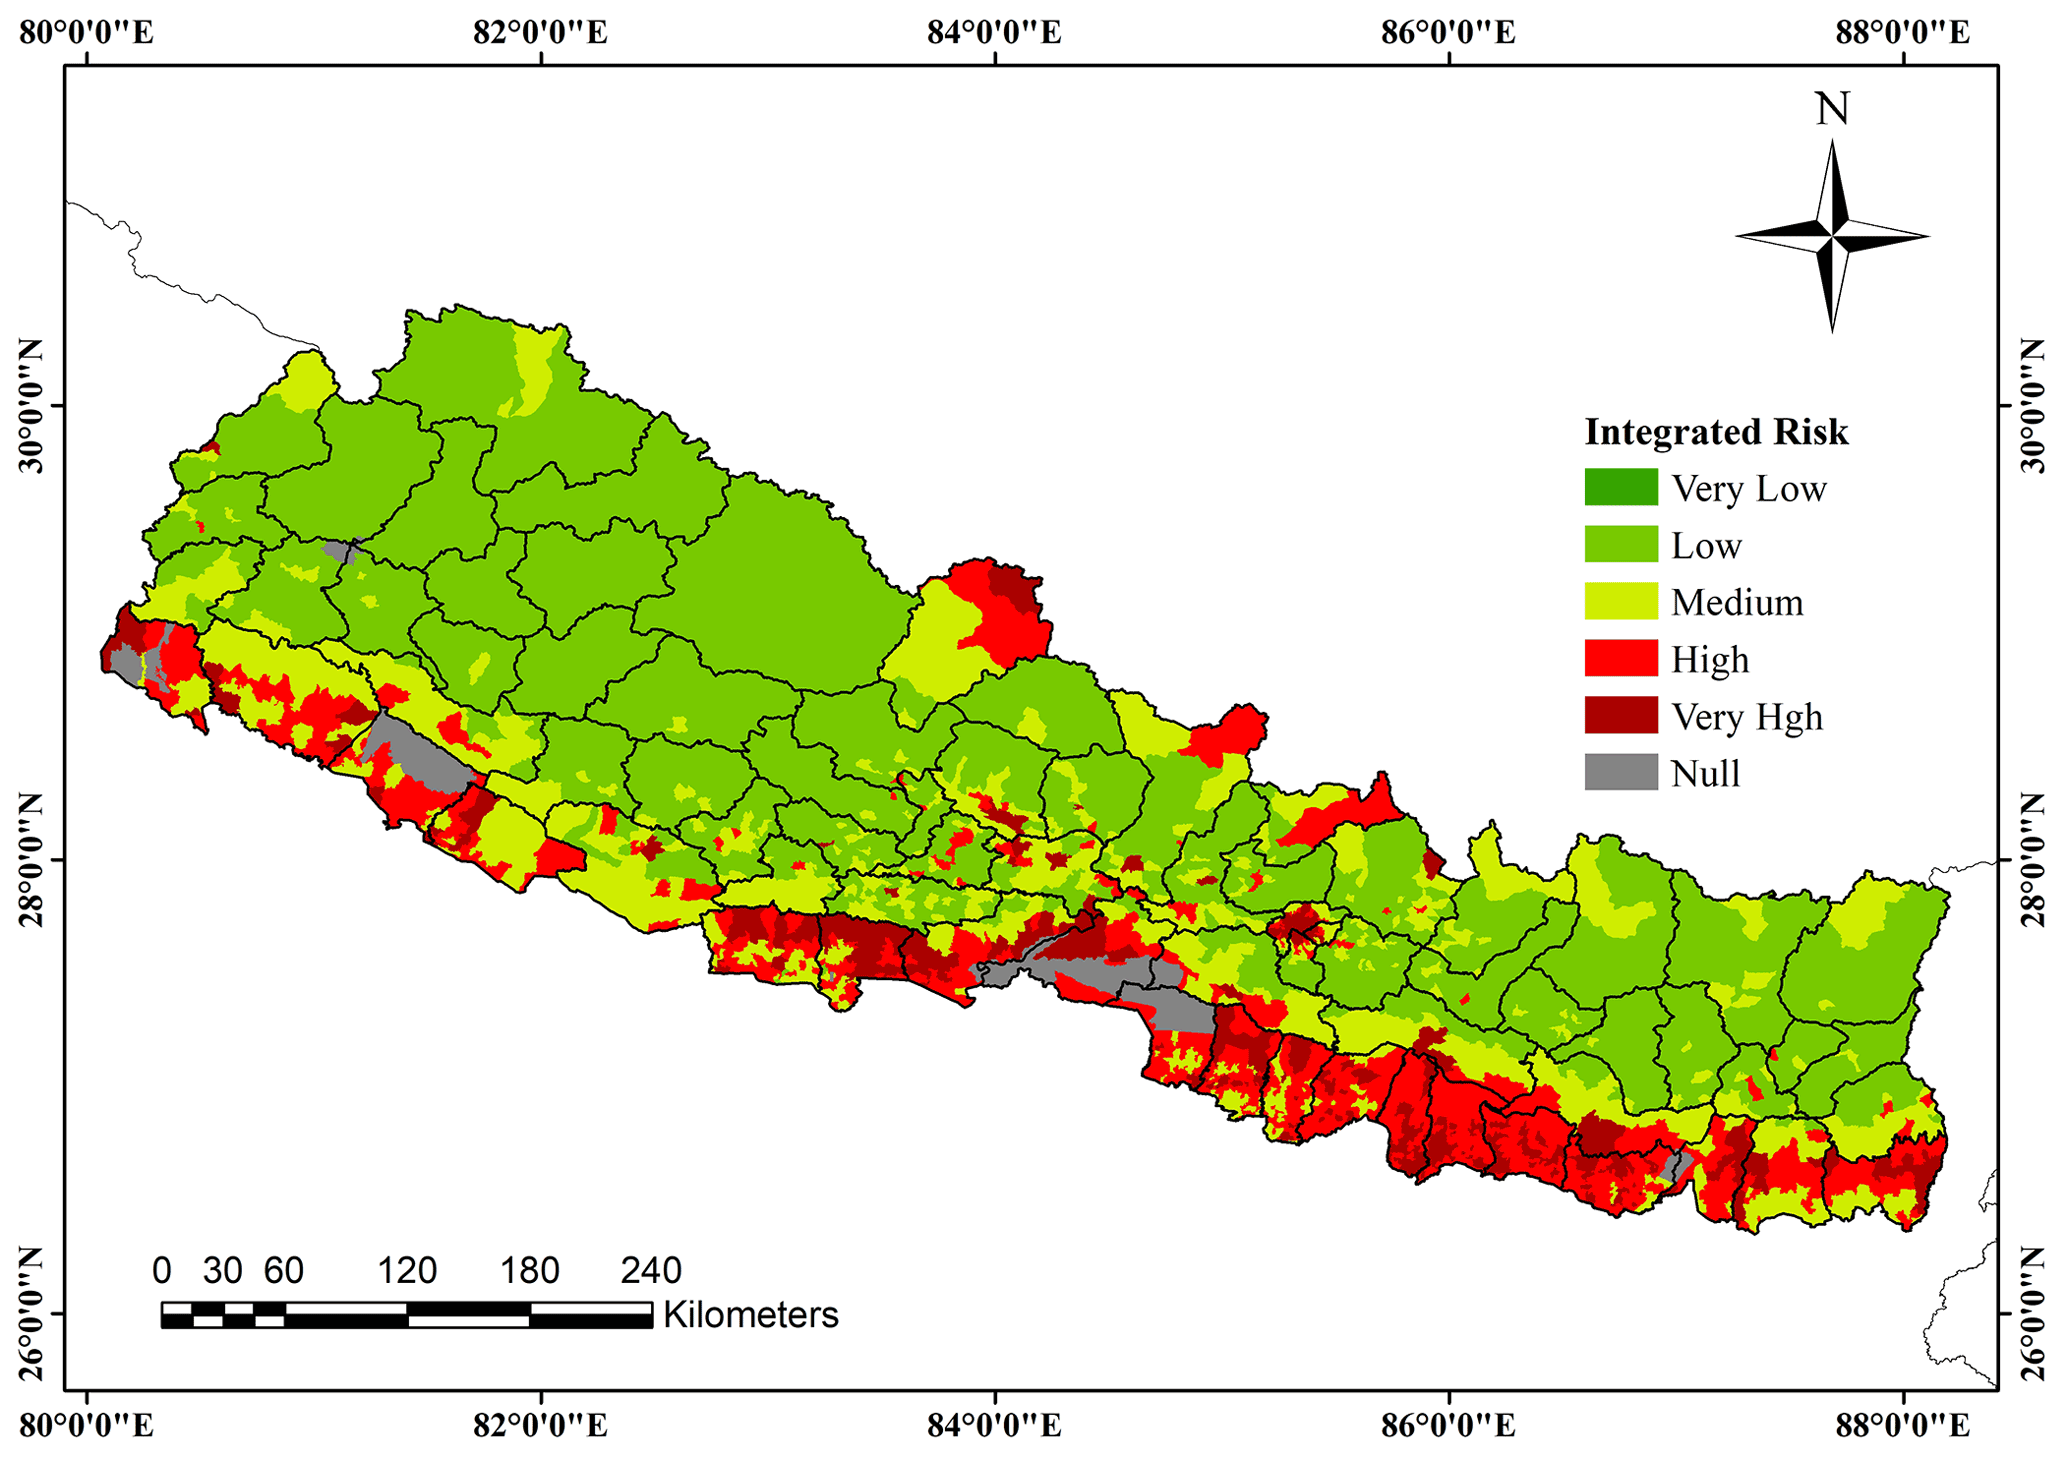
Figure 14Spatial distribution of the integrated risk index in districts of Nepal.
The main purpose of this study is to assess the integrated seismic risk by combining the socioeconomic parameters and physical risk. The methodology by Cutter et al. (2003) was used to compute social vulnerability components. The total SoVI scores were calculated by summing all principal components. On the other hand, the seismic source model, fragility curves, and consequence model given by Chaulagain et al. (2015) were used to evaluate the physical risk in OpenQuake. Similar to the study by Burton and Silva (2016), the integrated risk was evaluated using the IRMT. Further discussion on social vulnerability, physical risk, and integrated risk assessment are presented in the following sections.
5.1 Discussion on social vulnerability assessment
In this paper, the objective of the social vulnerability assessment was to quantify the vulnerability in Nepal considering socioeconomic parameters at the local level. The results of social vulnerability show that the most socially vulnerable places are located in the far-western, eastern Terai, and western Terai regions of Nepal. Our findings exhibit differences in social vulnerability in areas located in the same ecological region. The main reason behind this could be the pre-existing conditions like infrastructures, education, economy, etc. The population in the far-western region and the eastern Terai region are mostly minorities, Dalits, and marginalized groups who are educationally disadvantaged and developmentally challenged (Gautam, 2017). As for mountainous and hilly areas in the far-western region, the geographical terrain has affected the development path of these areas. Aksha et al. (2019) and Gautam (2017) also found a similar vulnerability in their respective studies. However, Aksha et al. (2019) classified Kathmandu Valley as a high-vulnerability class, while Gautam (2017) classified it as a very low-vulnerability class. Our social vulnerability result agreed with the latter case. This variability in the result is due to differences in variables and hazards considered during the analysis. Moreover, more recent data for SoVI will depict the more exact status of society and its vulnerability to disaster. This study uses census data from 2011. And, the census is done every 10 years in Nepal, and the most recent census was held in 2021. However, data from 2011 were considered due to the unavailability of recent comprehensive data. More recent data can be used in future studies once the 2021 Nepal census is published and made available.
5.2 Discussion on physical risk assessment
The objective of physical risk assessment in this study was to evaluate the physical risk index using a probabilistic approach. As in Burton and Silva (2016), the classical PSHA risk-based calculator was used to assess loss exceedance curves, risk maps, and average annual loss. In this study, a probabilistic approach and region-specific steps were used to evaluate the seismic hazard curves as in Chaulagian et al. (2015).
The probabilistic method of estimating seismic hazards used in the study utilizes the Poisson distribution model. Although earthquakes are assumed to occur randomly in space and time, the Poisson model assumes that earthquakes make a stochastically independent sequence of events in space and time (Anagnos and Kiremidjian, 1988). Despite such counterintuitive characteristics, the Poisson model is widely used due to its simplicity in the formulation and smaller range of parameters to be estimated. Moreover, recent research (Weatherill et al., 2015; Schiappapietra and Douglas, 2020) in seismic risk assessment has incorporated spatially correlated distribution not only to estimate simultaneous intensity measure levels at locations during a specific earthquake but also to quantify the correlation between locations. The present studies have suggested the modeling of the spatial correlation of earthquake ground motion since attenuation of ground motion is not only period-dependent but also regionally dependent. However, in our study, we have used the conventional method of probabilistic seismic risk assessment due to its simplicity. Nonetheless, a certain standard approach is necessary to evaluate comparable estimates of seismic hazards. Moreover, the authors are aware of the fact that numerous estimations such as casualties, non-structural damage, business interruption loss, and loss of critical infrastructure may improve the indicator of physical risk. However, only the economic losses of buildings were utilized in this study as an initiation for this type of research for Nepal. Similarly, the results of physical risk (average annual loss estimates) were rescaled using the min–max method as mentioned in previous sections. The rescaling is necessary to integrate social vulnerability with physical risk, although the rescaling of the estimates may have resulted in the loss of spatial information of physical damage results.
5.3 Discussion on integrated risk assessment
The integration and mapping of the spatial distribution of average annual losses and social vulnerability are very useful. However, the integrated maps do not reflect the true effect of components inducing seismic risk at a particular location. This can be due to the compounding nature of the spatial risk as the areas of medium to high levels of social vulnerability compound moderate levels of physical risk to generate high levels of integrated risk. The medium level of social vulnerability in the eastern Terai region is compounded with the high level of physical risk to create a higher level of integrated risk, which can be seen in Fig. 14. On the other hand, there is a higher degree of seismic risk and integrated risk in Kathmandu Valley, although the social vulnerability results depict a lower degree of vulnerability. In light of the limitations of this study, it is clear that robust procedures and methods should be used in future analyses of integrated risk assessment. Although this study has certain shortcomings, it is within the context that the inclusion of a higher number of factors that contribute to the mitigation of earthquake risk provides better approaches in the development of policy and plans to reduce overall seismic risk.
The impacts of earthquakes cannot be defined only from the potential damage from them. Such an effect also depends on the capacity of society to address and rebound from damage. The social vulnerability index depicts how society will prepare and respond to any disaster, while the seismic risk index (AAL) shows how society will be affected due to earthquakes. This paper presents an integrated study using SPSS and OpenQuake to delineate integrated seismic risk for Nepal. The integration of seismic risk with social characteristics gives a different outlook on seismic risk mitigation and planning. The major conclusions of this study are described below.
-
The far-western and eastern and western Terai regions of Nepal were determined to be highly vulnerable from social vulnerability analysis. The main reason behind the differences in social vulnerability within the same ecological region could be the pre-existing conditions like infrastructure, education, economy, etc. Moreover, the population residing in the far-western region and the eastern Terai region are mostly minorities, Dalits, and marginalized groups.
-
Integrated risk helps clear up the confusion on whether to focus on loss and damage or the population who are least likely to be able to recover from losses. For example, if only the social vulnerability index is considered, the western hills and the mountain region seem more vulnerable than Kathmandu Valley, while considering the seismic risk index, Kathmandu Valley is more vulnerable. Only by integrating can we confirm that Kathmandu Valley is more vulnerable to earthquakes and needs more attention than the western hills and the mountain region.
-
From the results of the seismic risk assessment, Kathmandu Valley and the eastern Terai region were determined to be high-seismic-risk areas. Similarly, the integrated risk results indicated the high vulnerability in Kathmandu Valley and the entire Terai region. The far-western hills and the mountain region were determined to be the low-vulnerability region as per integrated risk maps even though they have a high SoVI index. These regions (far-western hills and the mountain region) should still be depicted as a major concern. This is because these areas might have a smaller number of houses, but they can be of low quality, which could suffer damage from even low-magnitude earthquakes, and these regions are considered to be less developed areas of Nepal in terms of infrastructure and development activities.
-
The findings reinforce the concept in the hazard and vulnerability field that the analysis of socio-demographic characteristics, when considered along with the physical environment, brings a greater understanding of the potential impacts of hazards.
-
Additionally, this study provides a basis for local policymakers to integrate knowledge about the physical environment, social, and demographic composition of their region to assess their natural hazard mitigation using a standardized tool like OpenQuake before an event occurs.
In this study, we assess social vulnerability characteristics and potential risks from a large earthquake on seismically active zones across the country. Since local-level policymakers and municipalities have a big responsibility to minimize, prepare for, and respond to hazards and their impacts, a proper understanding of the social vulnerability is crucial to alleviate the risks caused by earthquakes. The distribution of potential seismic-hazard-related losses across the country can be partially explained by the region's ethnicity, income, and renter population. Although previous studies have also identified the integration or relationship between natural disasters and vulnerability features, this research extended the applicability of social vulnerability by integrating it with earthquake risk estimates.
The paper uses an open-source software, OpenQuake engine, to carry out physical risk analysis. It can be downloaded directly from https://github.com/gem/oq-engine (Simionato, 2022). Similarly, the paper uses Statistical Package for Social Science software (SPSS Version 21.0) to carry out principal component analysis.
The datasets used in the study were derived from the following resources available in the public domain: National Population and Housing Census 2011 (CBS, 2012), Population Monologue V01 (CBS, 2014a), Population Monologue V03 (CBS, 2014b), Nepal Human Development Report (Sharma et al., 2014), Department of Health Services (2013), budget report for year 2070–2071 BS (2013–2014 CE), and the Department of Education (2013–2014).
SB and RM initiated the research. SB gathered the data. SB and RM analyzed the data. SB plotted the maps and graphs. RM wrote the manuscript draft. SB and RM reviewed and edited the manuscript.
The contact author has declared that neither of the authors has any competing interests.
Publisher's note: Copernicus Publications remains neutral with regard to jurisdictional claims in published maps and institutional affiliations.
The authors would like to express special gratitude to the Department of Civil Engineering, Pulchowk Campus, for noteworthy support in this project. Also, the authors would like to thank Henri P. Gavin from the Civil Engineering Department, Duke University, for mentoring during the process of seismic hazard and risk analysis.
This paper was edited by Heidi Kreibich and reviewed by two anonymous referees.
Abdi, H. and Williams, L. J.: Principal component analysis, Wiley Interdisciplin. Rev. Comput. Stat., 2, 433–459, https://doi.org/10.1002/wics.101, 2010.
Aksha, S. K., Juran, L., Resler, L. M., and Zhang, Y.: An Analysis of Social Vulnerability to Natural Hazards in Nepal Using a Modified Social Vulnerability Index, Int. J. Disast. Risk Sci., 10, 103–116, https://doi.org/10.1007/s13753-018-0192-7, 2019.
Alizadeh, M., Alizadeh, E., Asadollahpour Kotenaee, S., Shahabi, H., Beiranvand Pour, A., Panahi, M., bin Ahmad, B., and Saro, L.: Social Vulnerability Assessment Using Artificial Neural Network (ANN) Model for Earthquake Hazard in Tabriz City, Iran, Sustainability, 10, 3376, https://doi.org/10.3390/su10103376, 2018.
Anagnos, T. and Kiremidjian, A. S.: A review of earthquake occurrence models for seismic hazard analysis, Probabil. Eng. Mech., 3, 3–11, https://doi.org/10.1016/0266-8920(88)90002-1, 1988.
Atkinson, G. M. and Boore, D. M.: Empirical Ground-Motion Relations for Subduction-Zone Earthquakes and Their Application to Cascadia and Other Regions, Bull. Seismol. Soc. Am., 93, 1703–1729, https://doi.org/10.1785/0120020156, 2003.
Bal, I. E., Bommer, J. J., Stafford, P. J., Crowley, H., and Pinho, R.: The Influence of Geographical Resolution of Urban Exposure Data in an Earthquake Loss Model for Istanbul, Earthq. Spectra, 26, 619–634, https://doi.org/10.1193/1.3459127, 2010.
Boore, D. M. and Atkinson, G. M.: Ground-Motion Prediction Equations for the Average Horizontal Component of PGA, PGV, and 5 %-Damped PSA at Spectral Periods between 0.01 s and 10.0 s, Earthq. Spectra, 24, 99–138, https://doi.org/10.1193/1.2830434, 2008.
Borden, K. A., Schmidtlein, M. C., Emrich, C. T., Piegorsch, W. W., and Cutter, S. L.: Vulnerability of U.S. Cities to Environmental Hazards, J. Homel. Secur. Emerg. Manage., 4, 5, https://doi.org/10.2202/1547-7355.1279, 2007.
Burby, R. J., Steinberg, L. J., and Basolo, V.: The tenure trap: The vulnerability of renters to joint natural and technological disasters, Urb. Affairs Rev., 39, 32–58, https://doi.org/10.1177/1078087403253053, 2003.
Burton, C. G. and Silva, V.: Assessing Integrated Earthquake Risk in OpenQuake with an Application to Mainland Portugal, Earthq. Spectra, 32, 1383–1403, https://doi.org/10.1193/120814EQS209M, 2016.
Campbell, K. W. and Bozorgnia, Y.: NGA Ground Motion Model for the Geometric Mean Horizontal Component of PGA, PGV, PGD and 5 % Damped Linear Elastic Response Spectra for Periods Ranging from 0.01 to 10 s, Earthq. Spectra, 24, 139–171, https://doi.org/10.1193/1.2857546, 2008.
Carreño, M. L., Cardona, O. D., and Barbat, A. H.: New methodology for urban seismic risk assessment from a holistic perspective, Bull. Earthq. Eng., 10, 547–565, https://doi.org/10.1007/s10518-011-9302-2, 2012.
Cattell, R. B.: The Scree Test For The Number Of Factors, Multivar. Behav. Res., 1, 245–276, https://doi.org/10.1207/s15327906mbr0102_10, 1966.
CBS – Central Bureau of Statistic: National Population and Housing Census 2011 (National Report), https://unstats.un.org/unsd/demographic-social/census/documents/Nepal/Nepal-Census-2011-Vol1.pdf (last access: 20 November 2021), 2012.
CBS – Central Bureau of Statistic: Population Monograph of Nepal, Vol. I (Population Dynamics), https://nepal.unfpa.org/sites/default/files/pub-pdf/PopulationMonograph2014Volume1.pdf (last access: 20 November 2021), 2014a.
CBS – Central Bureau of Statistic: Population Monograph of Nepal, Vol. III (Economical Demography), https://nepal.unfpa.org/sites/default/files/pub-pdf/Population Monograph V02.pdf (last access: 20 November 2021), 2014b.
Chaulagain, H., Rodrigues, H., Silva, V., Spacone, E., and Varum, H.: Seismic risk assessment and hazard mapping in Nepal, Nat. Hazards, 78, 583–602, https://doi.org/10.1007/s11069-015-1734-6, 2015.
Chaulagain, H., Rodrigues, H., Silva, V., Spacone, E., and Varum, H.: Earthquake loss estimation for the Kathmandu Valley, Bull. Earthq. Eng., 14, 59–88, https://doi.org/10.1007/s10518-015-9811-5, 2016.
Chaulagain, H., Gautam, D., and Rodrigues, H.: Revisiting Major Historical Earthquakes in Nepal, in: Impacts and Insights of Gorkha Earthquake in Nepal, Elsevier, 1–17, https://doi.org/10.1016/B978-0-12-812808-4.00001-8, 2018.
Chiou, B.-J. and Youngs, R. R.: An NGA Model for the Average Horizontal Component of Peak Ground Motion and Response Spectra, Earthq. Spectra, 24, 173–215, https://doi.org/10.1193/1.2894832, 2008.
Contreras, D., Chamorro, A., and Wilkinson, S.: Review article: The spatial dimension in the assessment of urban socio-economic vulnerability related to geohazards, Nat. Hazards Earth Syst. Sci., 20, 1663–1687, https://doi.org/10.5194/nhess-20-1663-2020, 2020.
Cornell, C. A.: Engineering seismic risk analysis, Bull. Seismol. Soc. Am., 58, 1583–1606, https://doi.org/10.1785/BSSA0580051583, 1968.
Cota, A. A., Longman, R. S., Holden, R. R., Fekken, G. C., and Xinaris, S.: Interpolating 95th Percentile Eigenvalues from Random Data: An Empirical Example, Educ. Psychol. Meas., 53, 585–596, https://doi.org/10.1177/0013164493053003001, 1993.
Cutter, S. L. and Finch, C.: Temporal and Spatial Changes in Social Vulnerability to Natural Hazards, in: Planning for Climate Change, vol. 105, Routledge, 129–137, https://doi.org/10.4324/9781351201117-16, 2018.
Cutter, S. L., Boruff, B. J., and Shirley, W. L.: Social Vulnerability to Environmental Hazards, 84, 242–261, Soc. Sci. Q., https://doi.org/10.1111/1540-6237.8402002, 2003.
Department of Health Services: Annual Report Department of Health Services 2070/71 (2013/2014), http://dohs.gov.np/publications/annual_report_2070_71/ (last access: 20 November 2021), 2013.
Dixit, A.: Floods and Vulnerability: Need to Rethink Flood Management, in: Flood Problem and Management in South Asia, Springer Netherlands, Dordrecht, 155–179, https://doi.org/10.1007/978-94-017-0137-2_8, 2003.
Douglas, J.: Physical vulnerability modelling in natural hazard risk assessment, Nat. Hazards Earth Syst. Sci., 7, 283–288, https://doi.org/10.5194/nhess-7-283-2007, 2007.
Fang, C., Spencer Jr., B. F., Xu, J., Tan, P., and Zhou, F.: Optimization of damped outrigger systems subject to stochastic excitation, Eng. Struct., 191, 280–291, 2019.
Fekete, A.: Validation of a social vulnerability index in context to river-floods in Germany, Nat. Hazards Earth Syst. Sci., 9, 393–403, https://doi.org/10.5194/nhess-9-393-2009, 2009.
Fernandez, J., Mattingly, S., Bendimerad, F., and Cardona, O. D.: Application of indicators in urban and megacities disaster risk management: a case study of metro Manila, Earthquakes and Megacities Initiative (EMI), https://www.preventionweb.net/files/1323_3cd2007MISReportTR0701.pdf (last access: 20 November 2021), 2006.
Franklin, S.: Science as Culture, Cultures of Science, Annu. Rev. Anthropol., 24, 163–184, https://doi.org/10.1146/annurev.an.24.100195.001115, 1995.
Frigerio, I., Ventura, S., Strigaro, D., Mattavelli, M., de Amicis, M., Mugnano, S., and Boffi, M.: A GIS-based approach to identify the spatial variability of social vulnerability to seismic hazard in Italy, Appl. Geogr., 74, 12–22, https://doi.org/10.1016/j.apgeog.2016.06.014, 2016.
Gautam, D.: Assessment of social vulnerability to natural hazards in Nepal, Nat. Hazards Earth Syst. Sci., 17, 2313–2320, https://doi.org/10.5194/nhess-17-2313-2017, 2017.
Glorfeld, L. W.: An Improvement on Horn's Parallel Analysis Methodology for Selecting the Correct Number of Factors to Retain, Educ. Psychol. Meas., 55, 377–393, https://doi.org/10.1177/0013164495055003002, 1995.
Gómez Zapata, J. C., Brinckmann, N., Harig, S., Zafrir, R., Pittore, M., Cotton, F., and Babeyko, A.: Variable-resolution building exposure modelling for earthquake and tsunami scenario-based risk assessment: an application case in Lima, Peru, Nat. Hazards Earth Syst. Sci., 21, 3599–3628, https://doi.org/10.5194/nhess-21-3599-2021, 2021.
Gómez Zapata, J. C., Pittore, M., Cotton, F., Lilienkamp, H., Shinde, S., Aguirre, P., and Santa María, H.: Epistemic uncertainty of probabilistic building exposure compositions in scenario-based earthquake loss models, Bull. Earthq. Eng., 20, 2401–2438, https://doi.org/10.1007/s10518-021-01312-9, 2022.
Guo, X. and Kapucu, N.: Assessing social vulnerability to earthquake disaster using rough analytic hierarchy process method: A case study of Hanzhong City, China, Safe. Sci., 125, 104625, https://doi.org/10.1016/j.ssci.2020.104625, 2020.
Hewitt, K.: Preventable disasters. Addressing social vulnerability, institutional risk and civil ethics, Geographische Rundschau, 3, 43–52, 2007.
Horn, J. L.: A rationale and test for the number of factors in factor analysis, Psychometrika, 30, 179–185, https://doi.org/10.1007/BF02289447, 1965.
Humphreys, L. G. and Montanelli Jr., R. G.: An Investigation of the Parallel Analysis Criterion for Determining the Number of Common Factors, Multivar. Behav. Res., 10, 193–205, https://doi.org/10.1207/s15327906mbr1002_5, 1975.
IBM Support: Kaiser-Meyer-Olkin measure for identity correlation matrix, https://www.ibm.com/support/pages/kaiser-meyer-olkin-measure-identity-correlation-matrix (last access: 20 November 2021), 2020.
Jolliffe, I. T.: Principal Component Analysis, 2nd Edn., Springer, https://doi.org/10.1007/b98835, 2002.
Kaiser, H. F.: The Application of Electronic Computers to Factor Analysis, Educ. Psychol. Meas., 20, 141–151, https://doi.org/10.1177/001316446002000116, 1960.
Kaiser, H. F.: A second generation little jiffy, Psychometrika, 35, 401–415, https://doi.org/10.1007/BF02291817, 1970.
Kalakonas, P., Silva, V., Mouyiannou, A., and Rao, A.: Exploring the impact of epistemic uncertainty on a regional probabilistic seismic risk assessment model, Nat. Hazards, 104, 997–1020, https://doi.org/10.1007/s11069-020-04201-7, 2020.
Khazai, B., Merz, M., Schulz, C., and Borst, D.: An integrated indicator framework for spatial assessment of industrial and social vulnerability to indirect disaster losses, Nat. Hazards, 67, 145–167, https://doi.org/10.1007/s11069-013-0551-z, 2013.
Mainali, J. and Pricope, N. G.: Mapping the need for adaptation: assessing drought vulnerability using the livelihood vulnerability index approach in a mid-hill region of Nepal, Clim. Dev., 11, 607–622, https://doi.org/10.1080/17565529.2018.1521329, 2019.
Malakar, Y.: Community-Based Rainfall Observation for Landslide Monitoring in Western Nepal, in: Landslide Science for a Safer Geoenvironment, Springer International Publishing, Cham, 757–763, https://doi.org/10.1007/978-3-319-05050-8_117, 2014.
Martins, L., Silva, V., Crowley, H., and Cavalieri, F.: Vulnerability modellers toolkit, an open-source platform for vulnerability analysis, Bull, Earthq, Eng,, 19, 5691–5709, https://doi.org/10.1007/s10518-021-01187-w, 2021.
Mileti, D.: Disasters by Design: A reassessment of natural hazards in the United States, Joseph Henry Press, https://doi.org/10.17226/5782, 1999.
Mishra, S. R., Khanal, P., Karki, D. K., Kallestrup, P., and Enemark, U.: National health insurance policy in Nepal: challenges for implementation, Glob. Health Action, 8, 28763, https://doi.org/10.3402/gha.v8.28763, 2015.
Mori, T., Shigefuji, M., Bijukchhen, S., Kanno, T., and Takai, N.: Ground motion prediction equation for the Kathmandu Valley, Nepal based on strong motion records during the 2015 Gorkha Nepal earthquake sequence, Soil Dynam. Earthq. Eng., 135, 106208, https://doi.org/10.1016/j.soildyn.2020.106208, 2020.
Pachauri, R. K., Allen, M. R., Barros, V. R., Broome, J., Cramer, W., Christ, R., Church, J. A., Clarke, L., Dahe, Q., and Dasgupta, P.: Climate change 2014: synthesis report. Contribution of Working Groups I, II and III to the fifth assessment report of the Intergovernmental Panel on Climate Change, IPCC, https://www.ipcc.ch/site/assets/uploads/2018/05/SYR_AR5_FINAL_full_wcover.pdf (last access: 20 November 2021), 2014.
Pagani, M., Monelli, D., Weatherill, G., Danciu, L., Crowley, H., Silva, V., Henshaw, P., Butler, L., Nastasi, M., Panzeri, L., Simionato, M., and Vigano, D.: OpenQuake Engine: An Open Hazard (and Risk) Software for the Global Earthquake Model, Seismol. Res. Lett., 85, 692–702, https://doi.org/10.1785/0220130087, 2014.
Pandey, M. R., Tandukar, R. P., Avouac, J. P., Vergne, J., and Héritier, T.: Seismotectonics of the Nepal Himalaya from a local seismic network, J. Asian Earth. Sci., 17, 703–712, https://doi.org/10.1016/S1367-9120(99)00034-6, 1999.
Pandey, M. R., Chitrakar, G. R., Kafle, B., Sapkota, S. N., Rajaure, S. N., and Gautam, U. P.: Seismic hazard map of Nepal, 2002.
Pherali, T.: Education: Cultural Reproduction, Revolution and Peacebuilding in Conflict-Affected Societies, in: The Palgrave Handbook of Disciplinary and Regional Approaches to Peace, Palgrave Macmillan UK, London, 193–205, https://doi.org/10.1007/978-1-137-40761-0_15, 2016.
Rahman, N., Ansary, M. A., and Islam, I.: GIS based mapping of vulnerability to earthquake and fire hazard in Dhaka city, Bangladesh, Int. J. Disast. Risk Reduct., 13, 291–300, https://doi.org/10.1016/j.ijdrr.2015.07.003, 2015.
Rao, A., Dutta, D., Kalita, P., Ackerley, N., Silva, V., Raghunandan, M., Ghosh, J., Ghosh, S., Brzev, S., and Dasgupta, K.: Probabilistic seismic risk assessment of India, Earthq. Spectra, 36, 345–371, https://doi.org/10.1177/8755293020957374, 2020.
Schiappapietra, E. and Douglas, J.: Modelling the spatial correlation of earthquake ground motion: Insights from the literature, data from the 2016–2017 Central Italy earthquake sequence and ground-motion simulations, Earth Sci. Rev., 203, 103139, https://doi.org/10.1016/j.earscirev.2020.103139, 2020.
Schmidtlein, M. C., Shafer, J. M., Berry, M., and Cutter, S. L.: Modeled earthquake losses and social vulnerability in Charleston, South Carolina, Appl. Geogr., 31, 269–281, https://doi.org/10.1016/j.apgeog.2010.06.001, 2011.
Sharma, P., Guha-Khasnobis, B., and Khanal, D. R.: Nepal human development report 2014, https://www.npc.gov.np/images/category/NHDR_Report_2014.pdf (last access: 20 November 2021), 2014.
Shrestha, A.: Vulnerability assessment of weather disasters in Syangja District, Nepal: A case study in Putalibazaar Municipality, https://www.researchgate.net/publication/255616385_Vulnerability_Assessment_of_Weather_Disasters_in_Syangja_District_Nepal_A_Case_Study_in_Putalibazaar_Municipality (last access: 20 November 2021), 2005.
Silva, V., Amo-Oduro, D., Calderon, A., Costa, C., Dabbeek, J., Despotaki, V., Martins, L., Pagani, M., Rao, A., Simionato, M., Viganò, D., Yepes-Estrada, C., Acevedo, A., Crowley, H., Horspool, N., Jaiswal, K., Journeay, M., and Pittore, M.: Development of a global seismic risk model, Earthq. Spectra, 36, 372–394, https://doi.org/10.1177/8755293019899953, 2020.
Simionato, M.: gem/oq-engine, GitHub [code], https://github.com/gem/oq-engine, last access: 5 October 2022.
Stevens, V. L., Shrestha, S. N., and Maharjan, D. K.: Probabilistic Seismic Hazard Assessment of Nepal, Bull. Seismol. Soc. Am., 108, 3488–3510, https://doi.org/10.1785/0120180022, 2018.
Tate, E.: Social vulnerability indices: a comparative assessment using uncertainty and sensitivity analysis, Nat. Hazards, 63, 325–347, https://doi.org/10.1007/s11069-012-0152-2, 2012.
Thapa, D. R. and Guoxin, W.: Probabilistic seismic hazard analysis in Nepal, Earthq. Eng. Eng. Vibrat., 12, 577–586, https://doi.org/10.1007/s11803-013-0191-z, 2013.
Thompson, B. and Daniel, L. G.: Factor Analytic Evidence for the Construct Validity of Scores: A Historical Overview and Some Guidelines, Educ. Psychol. Meas., 56, 197–208, https://doi.org/10.1177/0013164496056002001, 1996.
Ulak, N.: Nepal's Earthquake-2015: Its Impact on Various Sectors, Gaze, 7, 58–86, https://doi.org/10.3126/gaze.v7i0.15120, 2016.
UNISDR: Terminology on disaster risk reduction, https://www.preventionweb.net/files/7817_UNISDRTerminologyEnglish.pdf (last access: 20 November 2021), 2009.
Velicer, W. F., Eaton, C. A., and Fava, J. L.: Construct Explication through Factor or Component Analysis: A Review and Evaluation of Alternative Procedures for Determining the Number of Factors or Components, in: Problems and Solutions in Human Assessment, Springer US, Boston, MA, 41–71, https://doi.org/10.1007/978-1-4615-4397-8_3, 2000.
Vivek, P., Singh, S. N., Mishra, S., and Donavan, D. T.: Parallel Analysis Engine to Aid in Determining Number of Factors to Retain using R, https://analytics.gonzaga.edu/parallelengine/ (last access: 15 September 2021), 2017.
Weatherill, G. A., Silva, V., Crowley, H., and Bazzurro, P.: Exploring the impact of spatial correlations and uncertainties for portfolio analysis in probabilistic seismic loss estimation, Bull. Earthq. Eng., 13, 957–981, https://doi.org/10.1007/s10518-015-9730-5, 2015.
Youngs, R. R., Chiou, S.-J., Silva, W. J., and Humphrey, J. R.: Strong Ground Motion Attenuation Relationships for Subduction Zone Earthquakes, Seismol. Res. Lett., 68, 58–73, https://doi.org/10.1785/gssrl.68.1.58, 1997.
Zwick, W. R. and Velicer, W. F.: Comparison of five rules for determining the number of components to retain, Psychol. Bull., 99, 432–442, https://doi.org/10.1037/0033-2909.99.3.432, 1986.