the Creative Commons Attribution 4.0 License.
the Creative Commons Attribution 4.0 License.
 | 07 Apr 2022
Evaluating and ranking Southeast Asia's exposure to explosive volcanic hazards
Susanna F. Jenkins
George T. Williams
Josh L. Hayes
Eleanor Tennant
Qingyuan Yang
Vanesa Burgos
Elinor S. Meredith
Geoffrey A. Lerner
Magfira Syarifuddin
Andrea Verolino
Regional volcanic threat assessments provide a large-scale comparable vision of the threat posed by multiple volcanoes. They are useful for prioritising risk-mitigation actions and are required by local through international agencies, industries and governments to prioritise where further study and support could be focussed. Most regional volcanic threat studies have oversimplified volcanic hazards and their associated impacts by relying on concentric radii as proxies for hazard footprints and by focussing only on population exposure. We have developed and applied a new approach that quantifies and ranks exposure to multiple volcanic hazards for 40 high-threat volcanoes in Southeast Asia. For each of our 40 volcanoes, hazard spatial extent, and intensity where appropriate, was probabilistically modelled for four volcanic hazards across three eruption scenarios, giving 697 080 individual hazard footprints plus 15 240 probabilistic hazard outputs. These outputs were overlain with open-access datasets across five exposure categories using an open-source Python geographic information system (GIS) framework developed for this study (https://github.com/vharg/VolcGIS, last access: 5 April 2022). All study outputs – more than 6500 GeoTIFF files and 70 independent estimates of exposure to volcanic hazards across 40 volcanoes – are provided in the “Data availability” section in user-friendly format. Calculated exposure values were used to rank each of the 40 volcanoes in terms of the threat they pose to surrounding communities. Results highlight that the island of Java in Indonesia has the highest median exposure to volcanic hazards, with Merapi consistently ranking as the highest-threat volcano. Hazard seasonality, as a result of varying wind conditions affecting tephra dispersal, leads to increased exposure values during the peak rainy season (January, February) in Java but the dry season (January through April) in the Philippines. A key aim of our study was to highlight volcanoes that may have been overlooked perhaps because they have not been frequently or recently active but that have the potential to affect large numbers of people and assets. It is not intended to replace official hazard and risk information provided by the individual country or volcano organisations. Rather, this study and the tools developed provide a road map for future multi-source regional volcanic exposure assessments with the possibility to extend the assessment to other geographic regions and/or towards impact and loss.
- Article
(16489 KB) - Full-text XML
- BibTeX
- EndNote


Southeast Asia is one of the most densely populated regions on Earth; it is also home to over 12 % (n=173) of the world's Holocene volcanoes and around 15 % (n=1543) of Holocene eruptions (Global Volcanism Program, 2013). Of these recorded Southeast Asian eruptions, 93 % (n=1435) have occurred since 1500 CE, showing the dominance of historical records reflected in our knowledge of the previous eruptive activity. The relatively short timescale of written eruption records in the region makes capturing the past, and therefore the likely future, range of eruptive activity challenging. There is a need for detailed geological studies to supplement short eruptive records; however, such studies are lacking for many volcanoes around the world because they can be time-consuming, costly and suffer from a lack of deposit exposure, especially in tropical regions such as Southeast Asia (De Maisonneuve and Bergal-Kuvikas, 2020). In addition, the focus in volcanically active areas is often, justifiably, on monitoring and crisis management of frequently or currently active volcanoes; however, these are not necessarily the volcanoes whose eruptions will affect the most people in the future. For example, the first historical eruption of Galunggung, Indonesia, in 1822 – a Volcanic Explosivity Index (VEI) 5 event – killed >4000 people after a repose of ∼3000 years (Brown et al., 2017). Where geological studies can be carried out, priority must be given to those volcanoes that pose a major threat to communities because of the potential magnitude and intensity of the eruption and/or because of the exposure of communities and their assets to volcanic hazards.
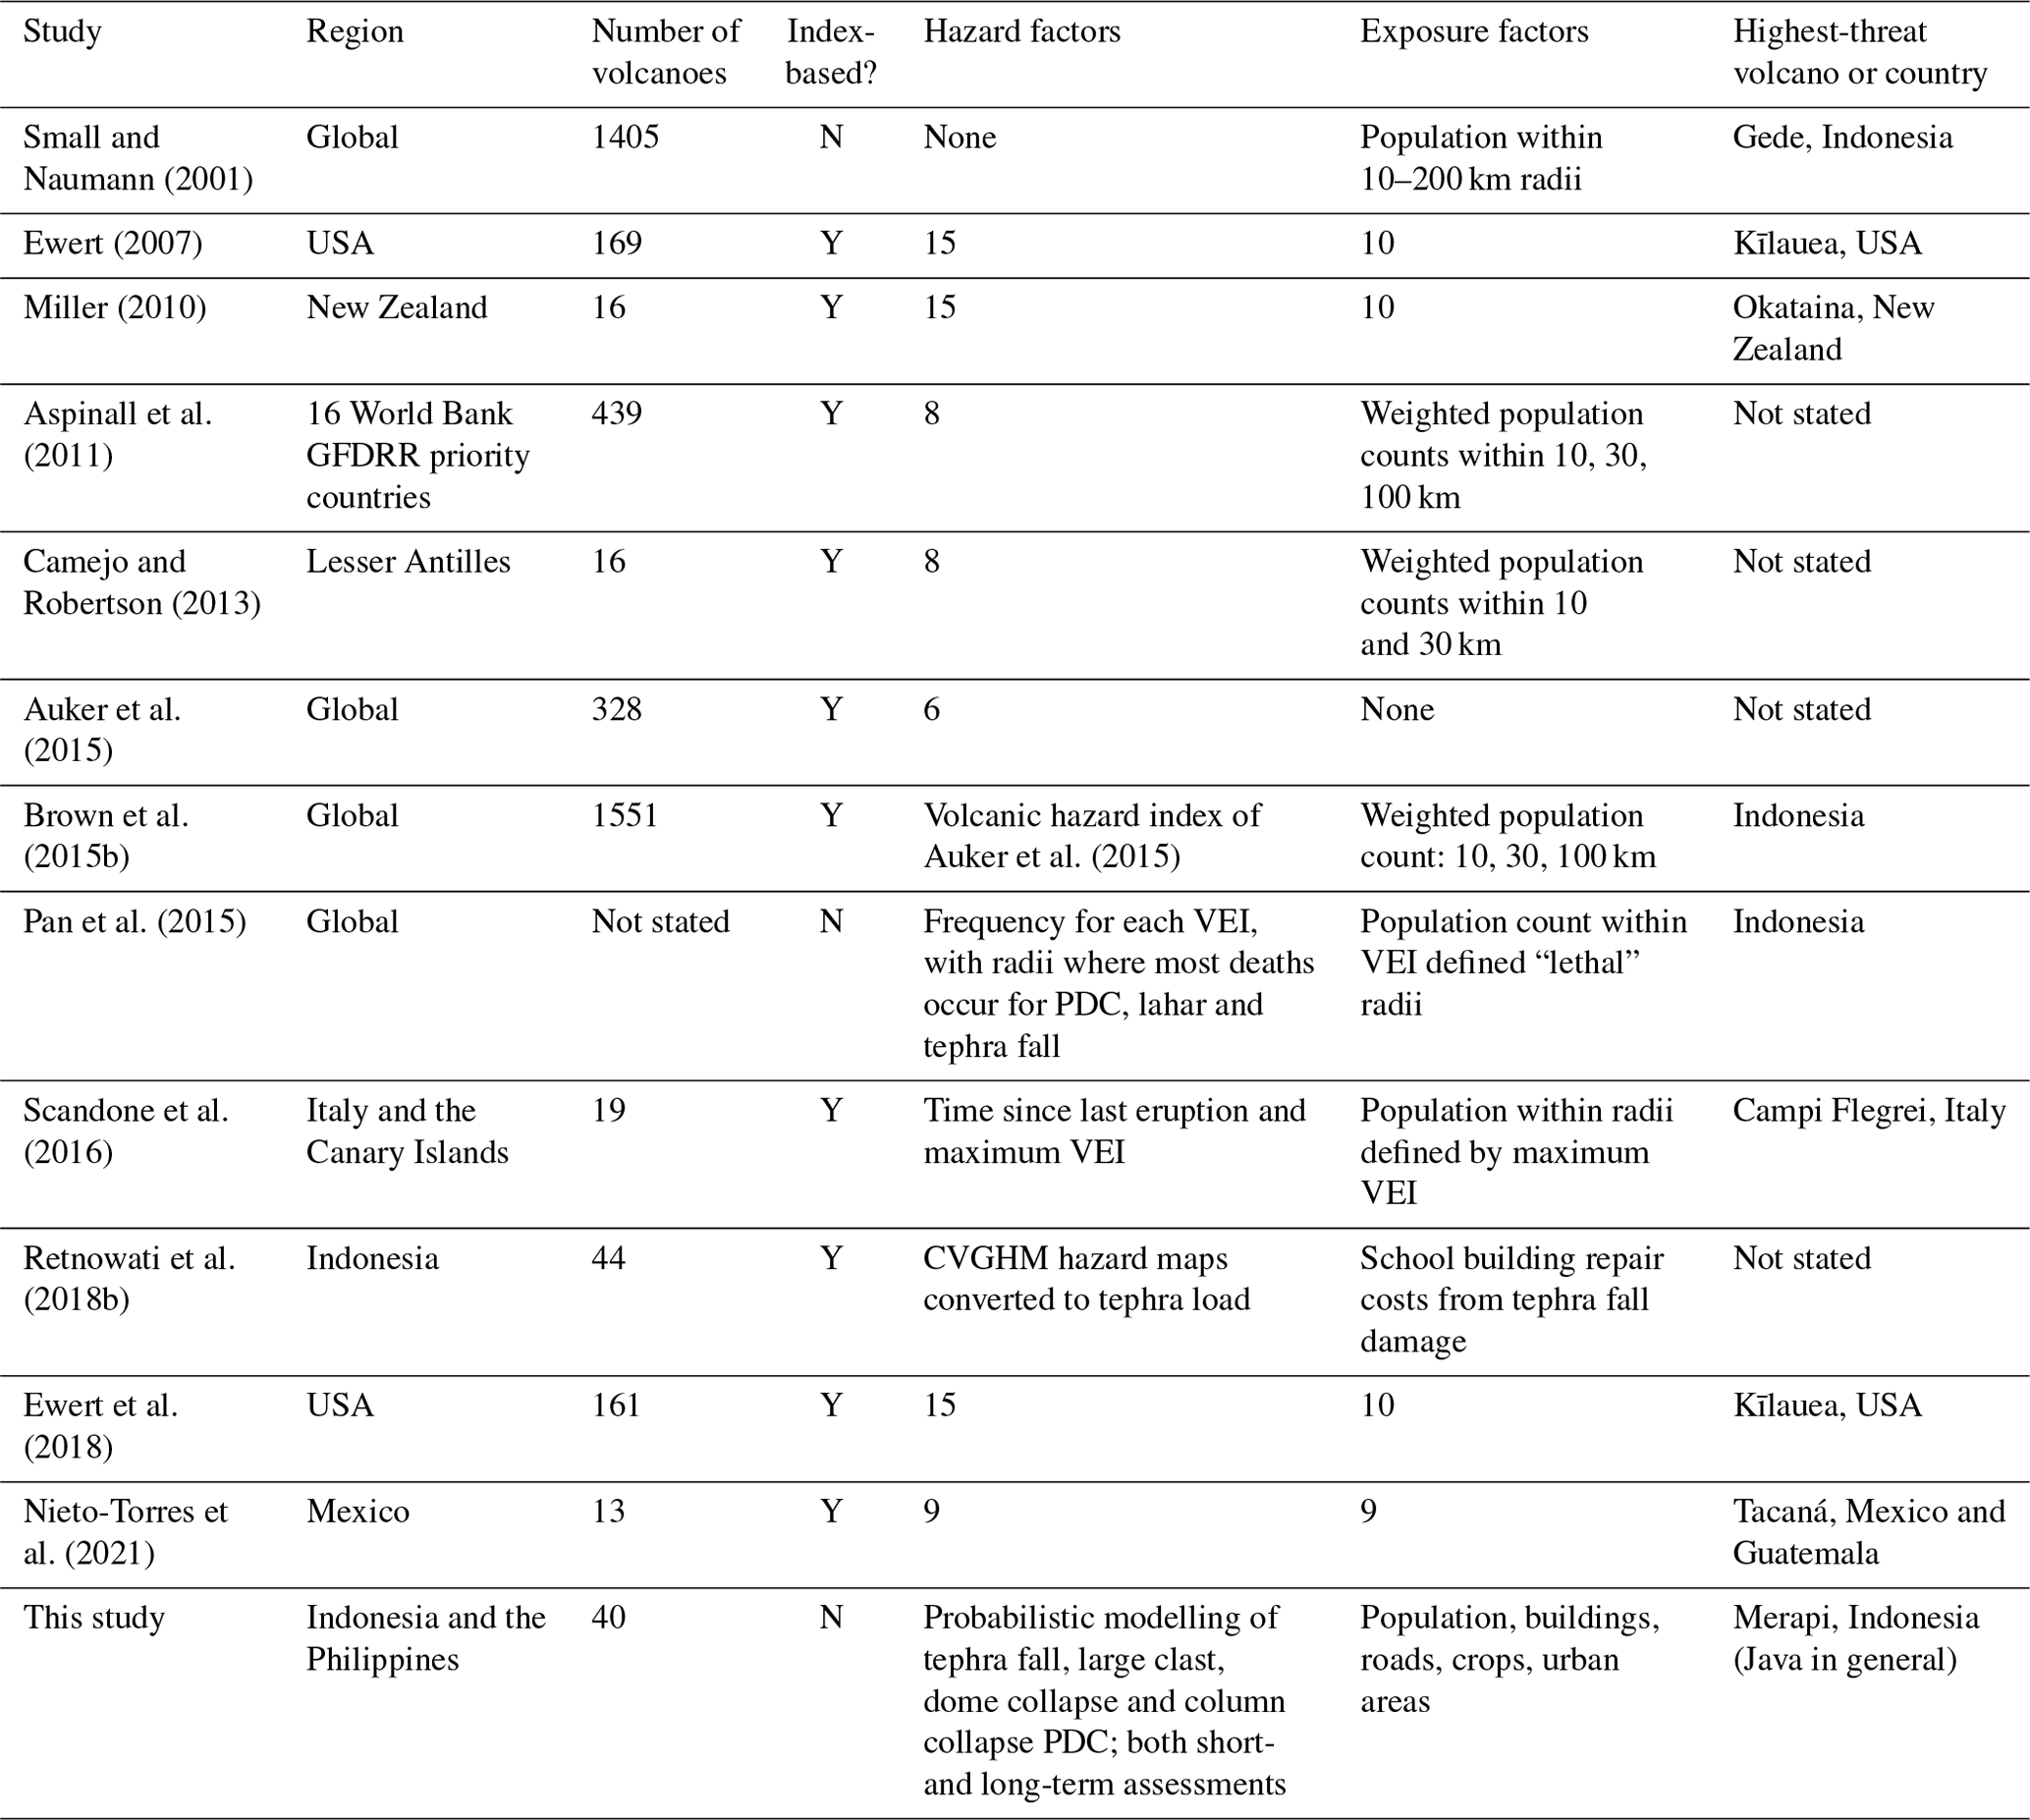
To identify volcanoes that pose a considerable threat to society, previous studies have applied consistent and transferable methodologies to rank multiple volcanoes according to their hazard (e.g. Aspinall et al., 2011; Auker et al., 2015) or their population exposure (e.g. Small and Naumann, 2001; Freire et al., 2019), with some studies combining the two to evaluate “threat” (e.g. Brown et al., 2015b; Ewert, 2007; Scandone et al., 2016) on a regional or global scale (Table 1). Such assessments are typically carried out on a volcano-by-volcano basis, making it difficult to compare threat across multiple volcanoes and communities.
Table 1Previous studies (in chronological order since 2000) that have compared volcanic hazard, exposure and/or a combination of the two (“threat”) across multiple individual volcanoes to provide a rank. Hazard or exposure factors are listed when there are three or fewer factors. Studies that ranked countries or regions rather than individual volcanoes (e.g. Dilley et al., 2005; Simpson et al., 2011; Freire et al., 2019) and studies that considered the hazard to a site such as a city or key infrastructure site rather than from a volcano (e.g. Jenkins et al., 2012a, b, 2018; Magill and Blong, 2005a, b) are not included here.
Of populations within 10 km of Holocene volcanoes, those in Southeast Asia are the largest and fastest-growing anywhere in the world (Freire et al., 2019). Indonesia and the Philippines alone have been estimated to contain more than 75 % of the global volcanic threat (in which threat is a product of an average volcanic hazard index, number of volcanoes and population within 30 km of volcanoes; Brown et al., 2015b). Exposure and threat estimates across multiple volcanoes typically rely on concentric radii around each volcano as a proxy for the spatial distribution of threat to life from volcanic hazards (Table 1). This approach, although facilitating regional and global exposure analyses, overlooks the complexity of hazardous volcanic phenomena and their interactions with external factors (e.g. wind, topography). In a volcanic context, regional assessments are complicated by the multi-hazard and spatially varying nature of eruption products, the wide range of hazard and impact mechanisms, and the variable knowledge of eruptive records across different volcanic systems. As a result, most existing regional estimates of population exposure to volcanic hazards rely on an overly simplified hazard footprint extent and intensity. A more robust estimate of exposure to volcanic hazards requires the use of numerical models able to describe the spatial distribution and intensity of volcanic hazards. Identifying reasonable and physically sound eruption source parameters (ESPs) for these models strongly depends on the knowledge of the volcanic system obtained from the geological mapping of past deposits. However, in areas like Southeast Asia, where studies, access and deposit preservation are limited, defining ESPs can be challenging. For this reason, numerical models are often coupled with probabilistic approaches in order to simulate ranges of credible potential future eruptions and environmental conditions and to quantify the likelihood of certain areas being affected by a given hazard. Several regional (multi-volcano) studies have used probabilistic hazard modelling to quantify hazard (Hoblitt et al., 1987; Hurst and Smith, 2004, 2010; Jenkins et al., 2012a; Biass et al., 2014) and threat (Jenkins et al., 2012b; Scaini et al., 2014), but they have all focussed on tephra hazard and were limited by computing power. As a result, no comprehensive regional, multi-volcano and multi-hazard exposure analysis has yet been achieved, which raises the question as to what extent current global volcanic exposure analyses based on concentric radii around volcanoes are valid.
To address these issues, we developed and applied a new framework to estimate the exposure to volcanic hazards on a volcano-by-volcano basis, with the aim of ranking volcanoes to identify those that pose the greatest threat. The approach couples probabilistically modelled footprints from four volcanic hazards: tephra fall, large clasts, dome collapse and column collapse pyroclastic density currents (PDCs) across three eruption scenarios (representing VEI 3, 4 and 5).
We recognise that rain-triggered and occasionally lake-breakout lahars are key hazards in Indonesia and the Philippines (Lavigne et al., 2007; Newhall and Punongbayan, 1996). However, they are not included in our assessment because (i) their runout and inundation area is directly controlled by the spatial distribution and characteristics of previously emplaced pyroclastic material; (ii) they can be produced independent of an eruption so that their impact over time and space is hard to capture without detailed volcano-specific study; (iii) localised variations in rainfall can strongly influence the probability of lahar occurrence; and (iv) empirical models that enable large numbers of simulations, like LAHARZ, have not been calibrated for lahars in Southeast Asia and do not capture the dynamics of debris and hyperconcentrated flows typical of this region (Lavigne and Thouret, 2003; Iverson et al., 1998).
The hazard data (probabilistic footprints across four hazards and three VEI scenarios) were then coupled with open-access geographic information system (GIS) data to quantify five categories of exposure (population, buildings, roads, crop and urban areas). A Python library named VolcGIS was developed to preprocess and perform all geospatial operations required to quantify exposure. We demonstrate the application of our framework on a selection of volcanoes in Southeast Asia that are considered high-threat. To support the differing requirements of volcanic risk management, we consider exposure with two different probability weightings: (i) conditional, when the assessment was conditional upon the considered eruption scenario occurring at that volcano: this can provide important values, maps and assessments in the event of unrest or crisis management; and (ii) absolute, when the assessment incorporated the annual probability of the eruption scenario occurring: this is valuable for comparing across multiple volcanoes on a like-for-like basis. Both methods can identify “hotspots”, allowing future, more targeted hazard and risk assessments to be prioritised. Using these complementary approaches, we ranked the volcanoes in terms of the nature of the volcanic hazard and the type of exposure.
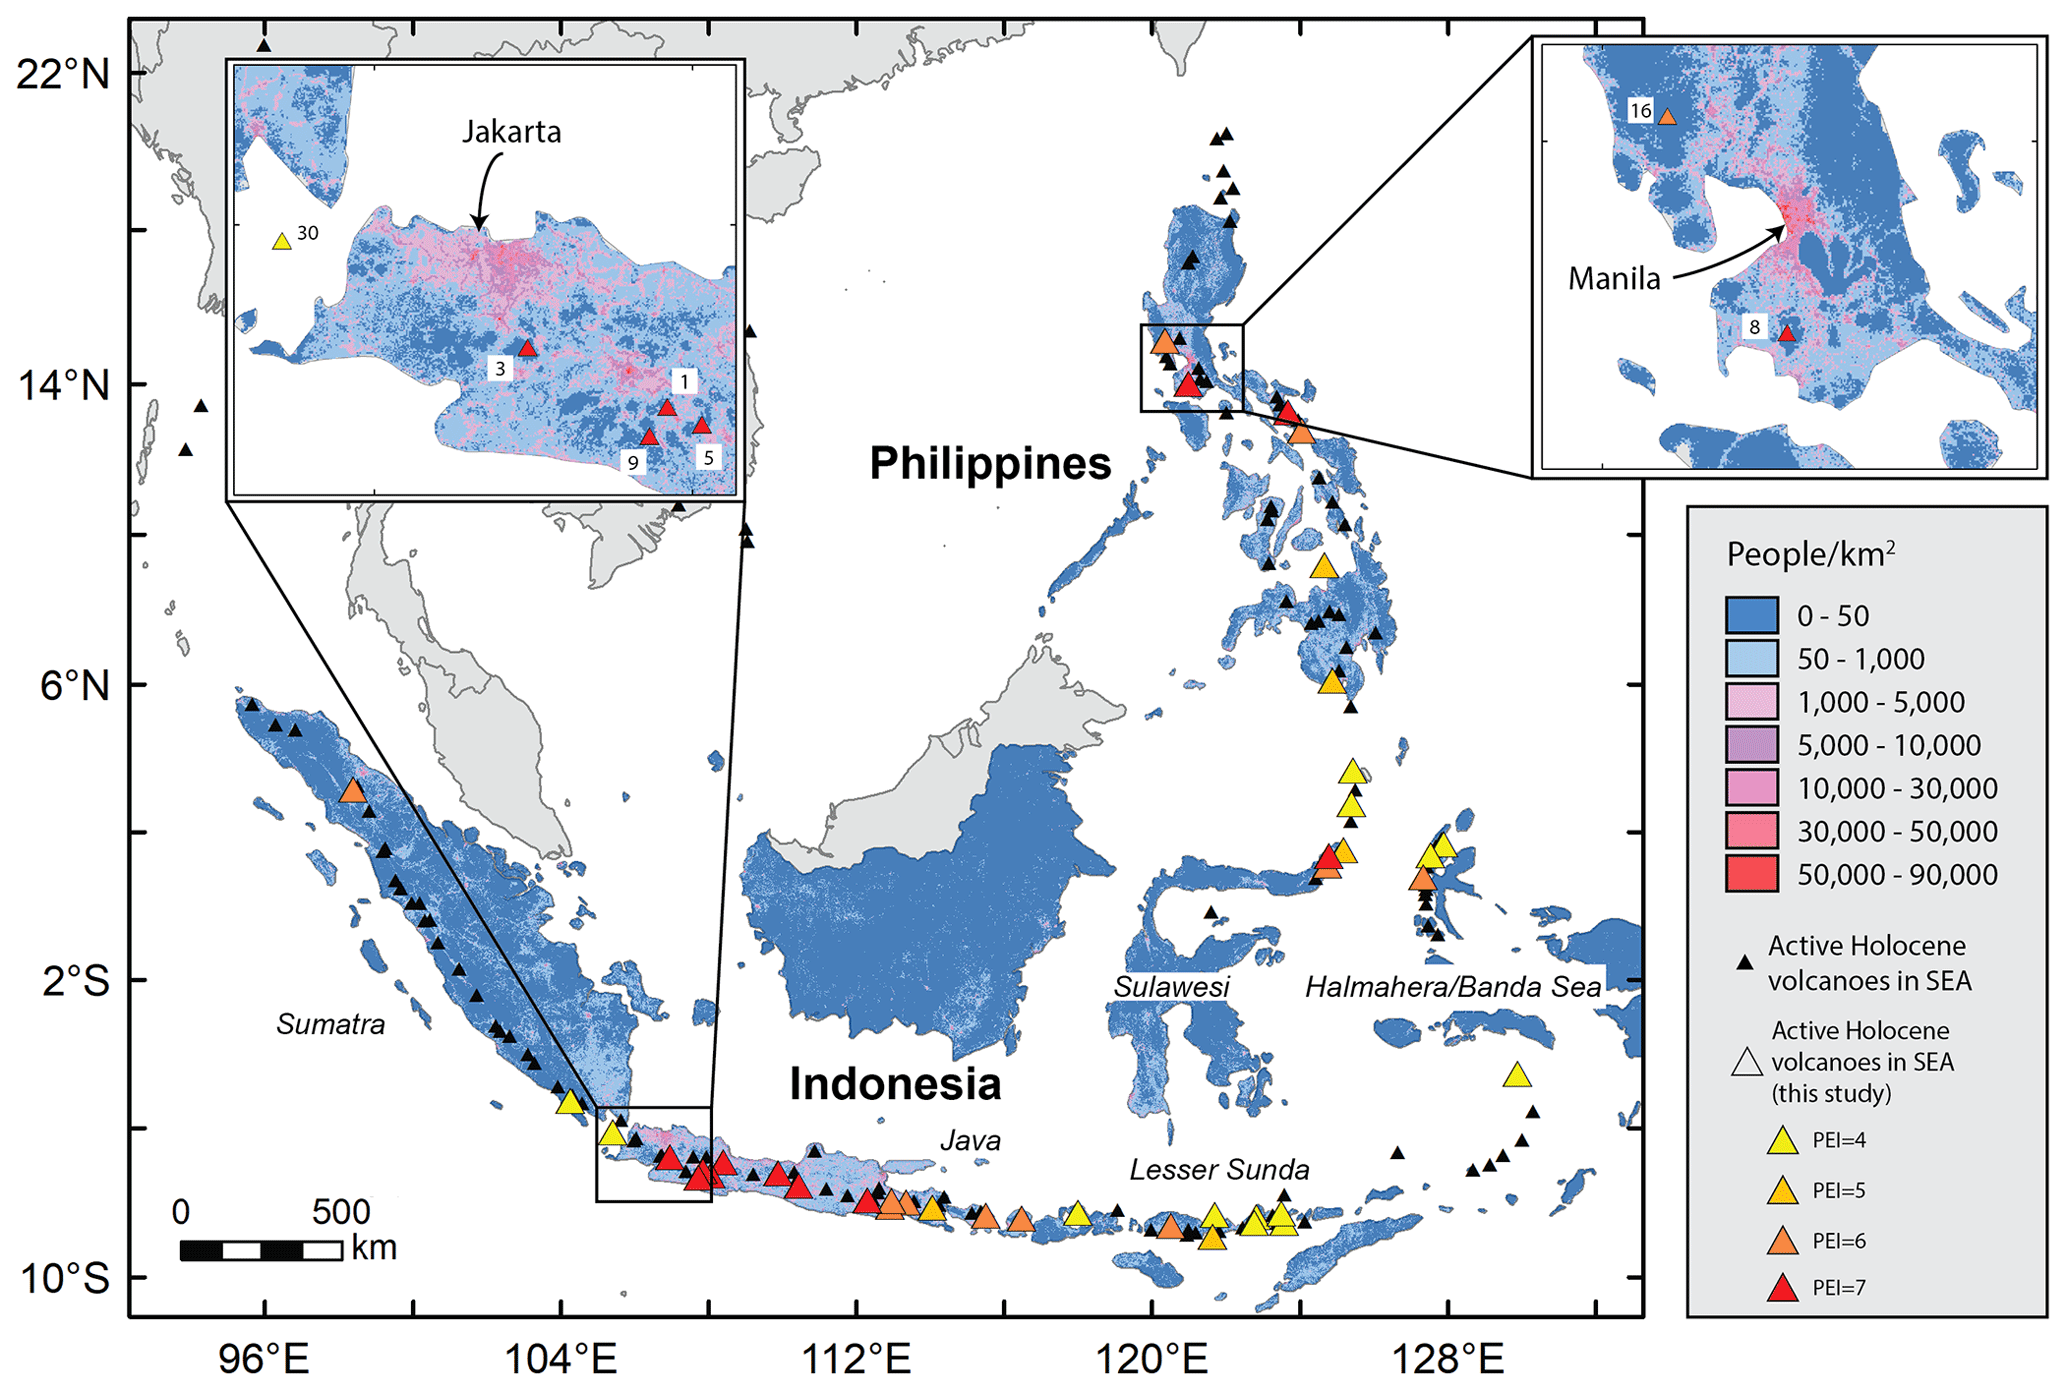
Figure 1Active Holocene volcanoes of Southeast Asia (black triangles, as defined in Global Volcanism Program, 2013) with the 40 volcanoes considered for analysis in this study highlighted as larger triangles, with their colour dictated by their PEI. Basemap is ambient population per 1 km2 (LandScan 2018; Rose et al., 2019). Numbers relate to the volcano name and PEI in Table 2.
In what follows, we outline our methods, framework and data sources before presenting and discussing our findings and limitations. The code is published in open source, and outputs are provided in the “Data availability” section, with the intention that they be used to further our understanding of exposure to volcanic hazards in this region. The proposed methodology provides a transferable and evidence-based approach for evaluating volcanic hazard, exposure and threat across a volcanic region. This study is not intended to replace official hazard and risk information provided by individual countries or volcano organisations (i.e. Indonesia's Centre for Volcanology and Geological Hazard Mitigation, CVGHM, and the Philippine's Institute of Volcanology and Seismology, PHIVOLCS). Instead, it is designed to address a need from international, regional and national agencies, industries, and governments for large-scale hazard and risk information to identify and prioritise volcanoes on which further study and support should be focussed.
Choosing volcanoes for analysis
Here, we consider Holocene volcanoes from the Smithsonian Institution's GVP (Global Volcanism Program, 2013) located in Southeast Asia and with at least one recorded VEI 3 or greater eruption (n=48). To further restrict the volcanoes to those that are more likely to pose a threat to society, we consider the Population Exposure Index (PEI) for each volcano, an index that accounts for the increased potential for loss of life with proximity to the volcano (Aspinall et al., 2011; Brown et al., 2015a). For our initial subset of 48 volcanoes, we update the PEI values of Brown et al. (2015a) by recalculating population counts within 10, 30 and 100 km radii using the LandScan 2018 (Rose et al., 2019), rather than 2011, population dataset and recalculating the fatality weightings within each radii using the updated fatality database of Brown et al. (2017) rather than Auker et al. (2013). The revised fatality weightings do not differ much from those of Brown et al. (2015a), remaining at 0.003 within the 100 km radius and incurring only small changes at the 30 km (0.03 to 0.07) and 10 km (0.93 to 0.97) radii. We use the updated PEI to further restrict our 48 volcanoes by considering only those with a PEI of 4 or above, indicating a fatality-weighted exposed population of 10 000 or more (Table 2). Of the remaining 40 volcanoes, 34 are in Indonesia and 6 are in the Philippines (Fig. 1). Given the relatively large number of volcanoes in Indonesia, and their geographic spread, we further subdivide the region geographically into the following (from west to east): Sumatra, Java, Lesser Sunda Islands, Sulawesi and Halmahera/Banda Sea. The updated PEI remained the same for 20 of our 40 volcanoes, increased for 17 and decreased for 3 (Table 2). The largest change in PEI is +2 for Paluweh volcano in the Lesser Sunda region of Indonesia due to an increase from ∼550 000 to more than 1 million people within 100 km following the establishment of the new administration regency of Nagekeo in 2007.
Table 2Volcanoes considered for analysis in this study, the exposed and weighted summed population within 100 km (LandScan 2018; Rose et al., 2019), and the updated PEI (and change in PEI from that calculated in Brown et al., 2015b). Those volcanoes with a change in PEI are shown in bold. See text for details on how the PEI was updated. Volcanoes are ordered by decreasing weighted summed population < 100 km from the volcano. Volcano IDs are used in Fig. 1.

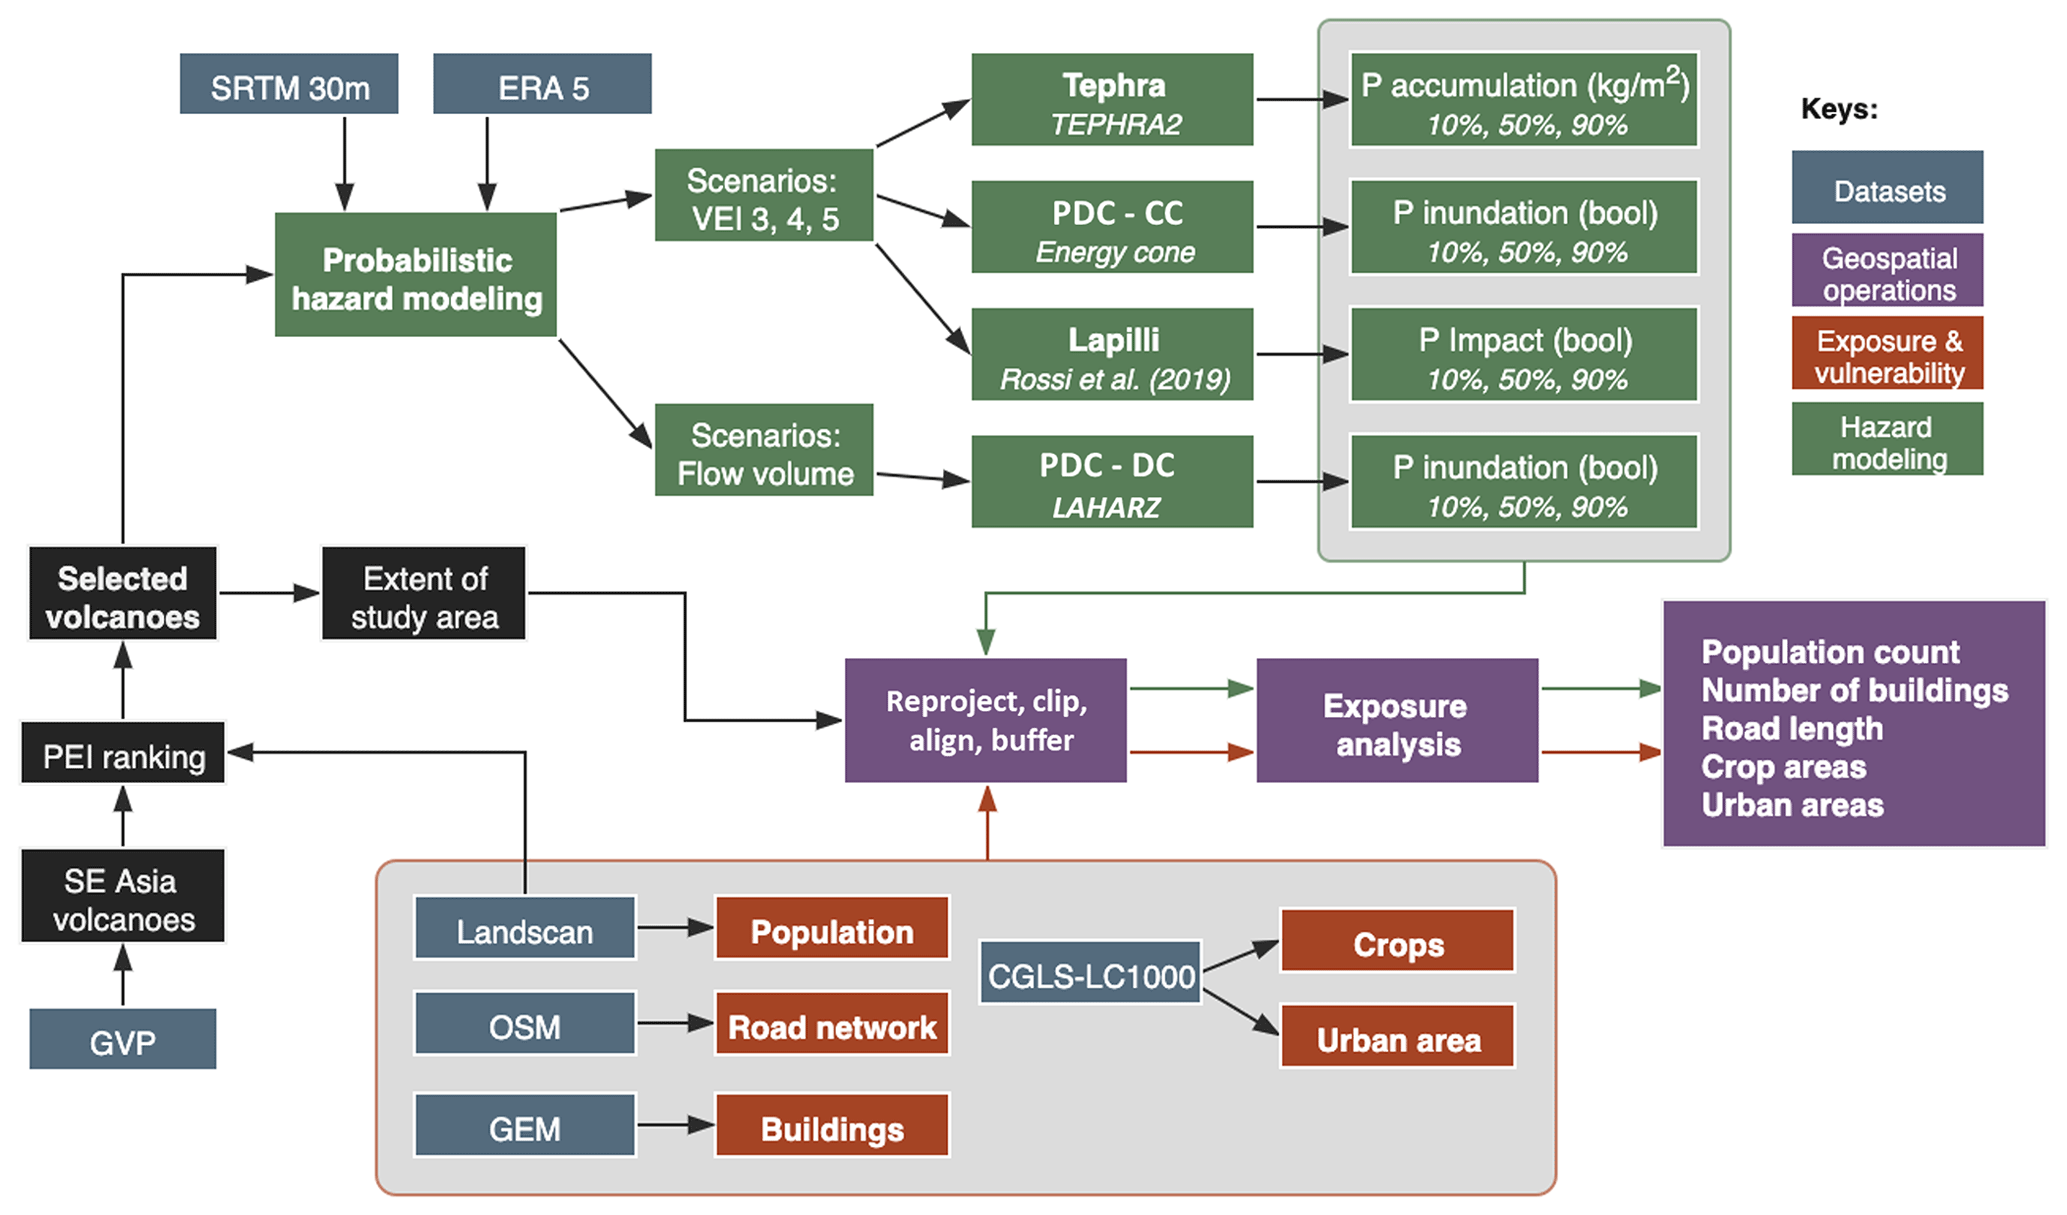
Figure 2Schematic outline of the study's methodology for exposure analysis. CGLS-LC: Copernicus Global Land Service-Land Cover; ERA 5: Reanalysis dataset from the European Centre for Medium-Range Weather Forecasts (ECMWF); GEM: Global Earthquake Model; GVP: Global Volcanism Program of the Smithsonian Institute; OSM: OpenStreetMap; PEI: Population Exposure Index; SRTM: Shuttle Radar Topography Mission; bool: Boolean workflow was made using draw.io.
This paper presents a methodology to (i) assess the probabilistic hazard associated with short-lived, explosive eruptions of VEI 3, 4 or 5 and (ii) estimate various aspects of exposure to these hazards (e.g. population, buildings, roads, urban areas and crops). We considered four hazards produced by explosive volcanic eruptions: (i) the static load caused by tephra accumulation, (ii) the kinetic impact associated with large clasts, and inundation from PDC generated from (iii) dome collapse and (iv) column collapse. A total of 697 080 individual model runs were carried out. For each hazard, the spatial extent, and where appropriate intensity, was modelled for the different eruption scenarios, with results analysed for three differing probabilities, 10 %, 50 % and 90 %, giving a total of 57 permutations of hazard and 285 estimates of exposure per volcano. For tephra fall, further aggregation was carried out per month to identify any seasonal variability in hazard footprints, producing 324 additional probability-aggregated hazard footprints per volcano. Hazard modelling outputs and their associated exposure estimates were coupled with eruption frequency–magnitude estimates to allow two separate rankings to be developed: conditional (assuming the eruption scenario had occurred) and absolute (weighted by the eruption scenario's probability of occurrence). Hazard and exposure were combined using the newly developed VolcGIS framework.
2.1 GIS framework
We have developed a geospatial python framework that can source multiple derived hazard and exposure datasets of varying resolution, unifying them in one consistent grid (Fig. 2). For each volcano, the extent of the study area was defined based on the bounds of the 1 kg m−2 tephra isomass occurring at a 10 % probability for a VEI 5 eruption (see Sect. 3.2.1). The GIS first applies preprocessing functions to both hazard model outputs and exposure datasets (i) to ensure that input files are projected onto the same WGS84 UTM zone as the target volcano, (ii) to either crop it to the extent of the study area or pad it with noData value depending on geographic extent of the input file, and (iii) to resample the input file to a specified spatial resolution. This preprocessing step produces a set of files with consistent geographic references (i.e. coordinate system, extent and pixel resolution) and equal numbers of pixels in the x and y directions. This step is critical to ensure that the spatial index of pixels is consistent amongst all files, after which exposure is estimated by translating each pixel's spatial index of hazard footprints into exposure datasets. Resampling of the rasters is achieved using a cubic interpolation for continuous hazard data and a nearest-neighbour interpolation for discrete exposure data. After resampling, population data are multiplied by the square of the ratio between the original and final resolutions in order to scale population counts to the new pixel surface area. Here, a pixel size of 90 m was adopted to keep computing and storage requirements reasonable while retaining a high enough resolution to allow detailed analysis of exposure. The source code of the GIS framework is available at https://github.com/vharg/VolcGIS (last access: 5 April 2022).
To support the re-application of our study over space and time, all hazard modelling and exposure assessments were carried out using only open-access datasets. Data descriptions and sources are described within each relevant subsection below.
2.2 Hazard modelling
For each of the 40 volcanoes chosen for hazard modelling, we used openly available hazard models (Appendix A), meteorological data and a digital elevation model (DEM) to probabilistically simulate potential hazard extent and, where possible, intensity from four explosive volcanic hazards (tephra fall, large clast, dome collapse and column collapse PDC) across three VEI scenarios (VEI 3, 4 and 5). Scenarios were tailored to be generic enough to be applied across all volcanoes whilst preserving the spatially varying nature of volcanic hazardous phenomena. VEI classes were chosen to span the range of impacts from explosive volcanic eruptions; VEI 2 eruptions were not simulated because of their limited spatial extent, and VEI 6+ eruptions were not simulated as they are of lower probability. However, we do recognise that these scenarios would also be important to consider for comprehensive impact assessments.
Estimating ESPs for regional hazard assessments, especially with such variable eruptive records as those presented by volcanoes in Southeast Asia, is always challenging. With sufficient and consistent knowledge of the eruptive history of selected volcanoes, it could be possible to tailor eruption scenarios to reflect specific types of activity and to use models of increasing complexity (e.g. using 3D numerical tephra dispersal models; Titos et al., 2022; Biass et al., 2014). In the face of these data and knowledge gaps, regional hazard assessments targeting volcanoes with differing eruptive histories and record completeness require the development of more generic eruption scenarios that are uniformly assigned to all sources. These eruption scenarios have dominantly been developed around VEI classes (e.g. Jenkins et al., 2012a), and, although bypassing the importance of some eruptive processes, they provide key, first-order insights into regional hazard and allow for comparison across multiple scenarios and volcanoes.
The spatial extent (and intensity where possible) of each of our four simulated hazards – tephra fall, large clasts, and dome collapse and column collapse PDCs – is quantified using a probabilistic approach designed to account for various sources of uncertainty. The probabilistic approach is implemented either within the model (e.g. column collapse PDC) or by the stochastic sampling of model inputs (e.g. tephra fall). For each hazard and scenario, a generic set of ESPs was developed from global datasets and analogous volcanoes, uniformly applied to all volcanoes used in the study and modelled with a dedicated method. More detail on our modelling approach is provided in the following subsections; we summarise the key ESPs across all hazards in Table 3, with full details and rationale available in Appendix A.
Table 3Key model input parameters used for the four hazards, with more details and rationale provided in the subsections below and Appendix A.
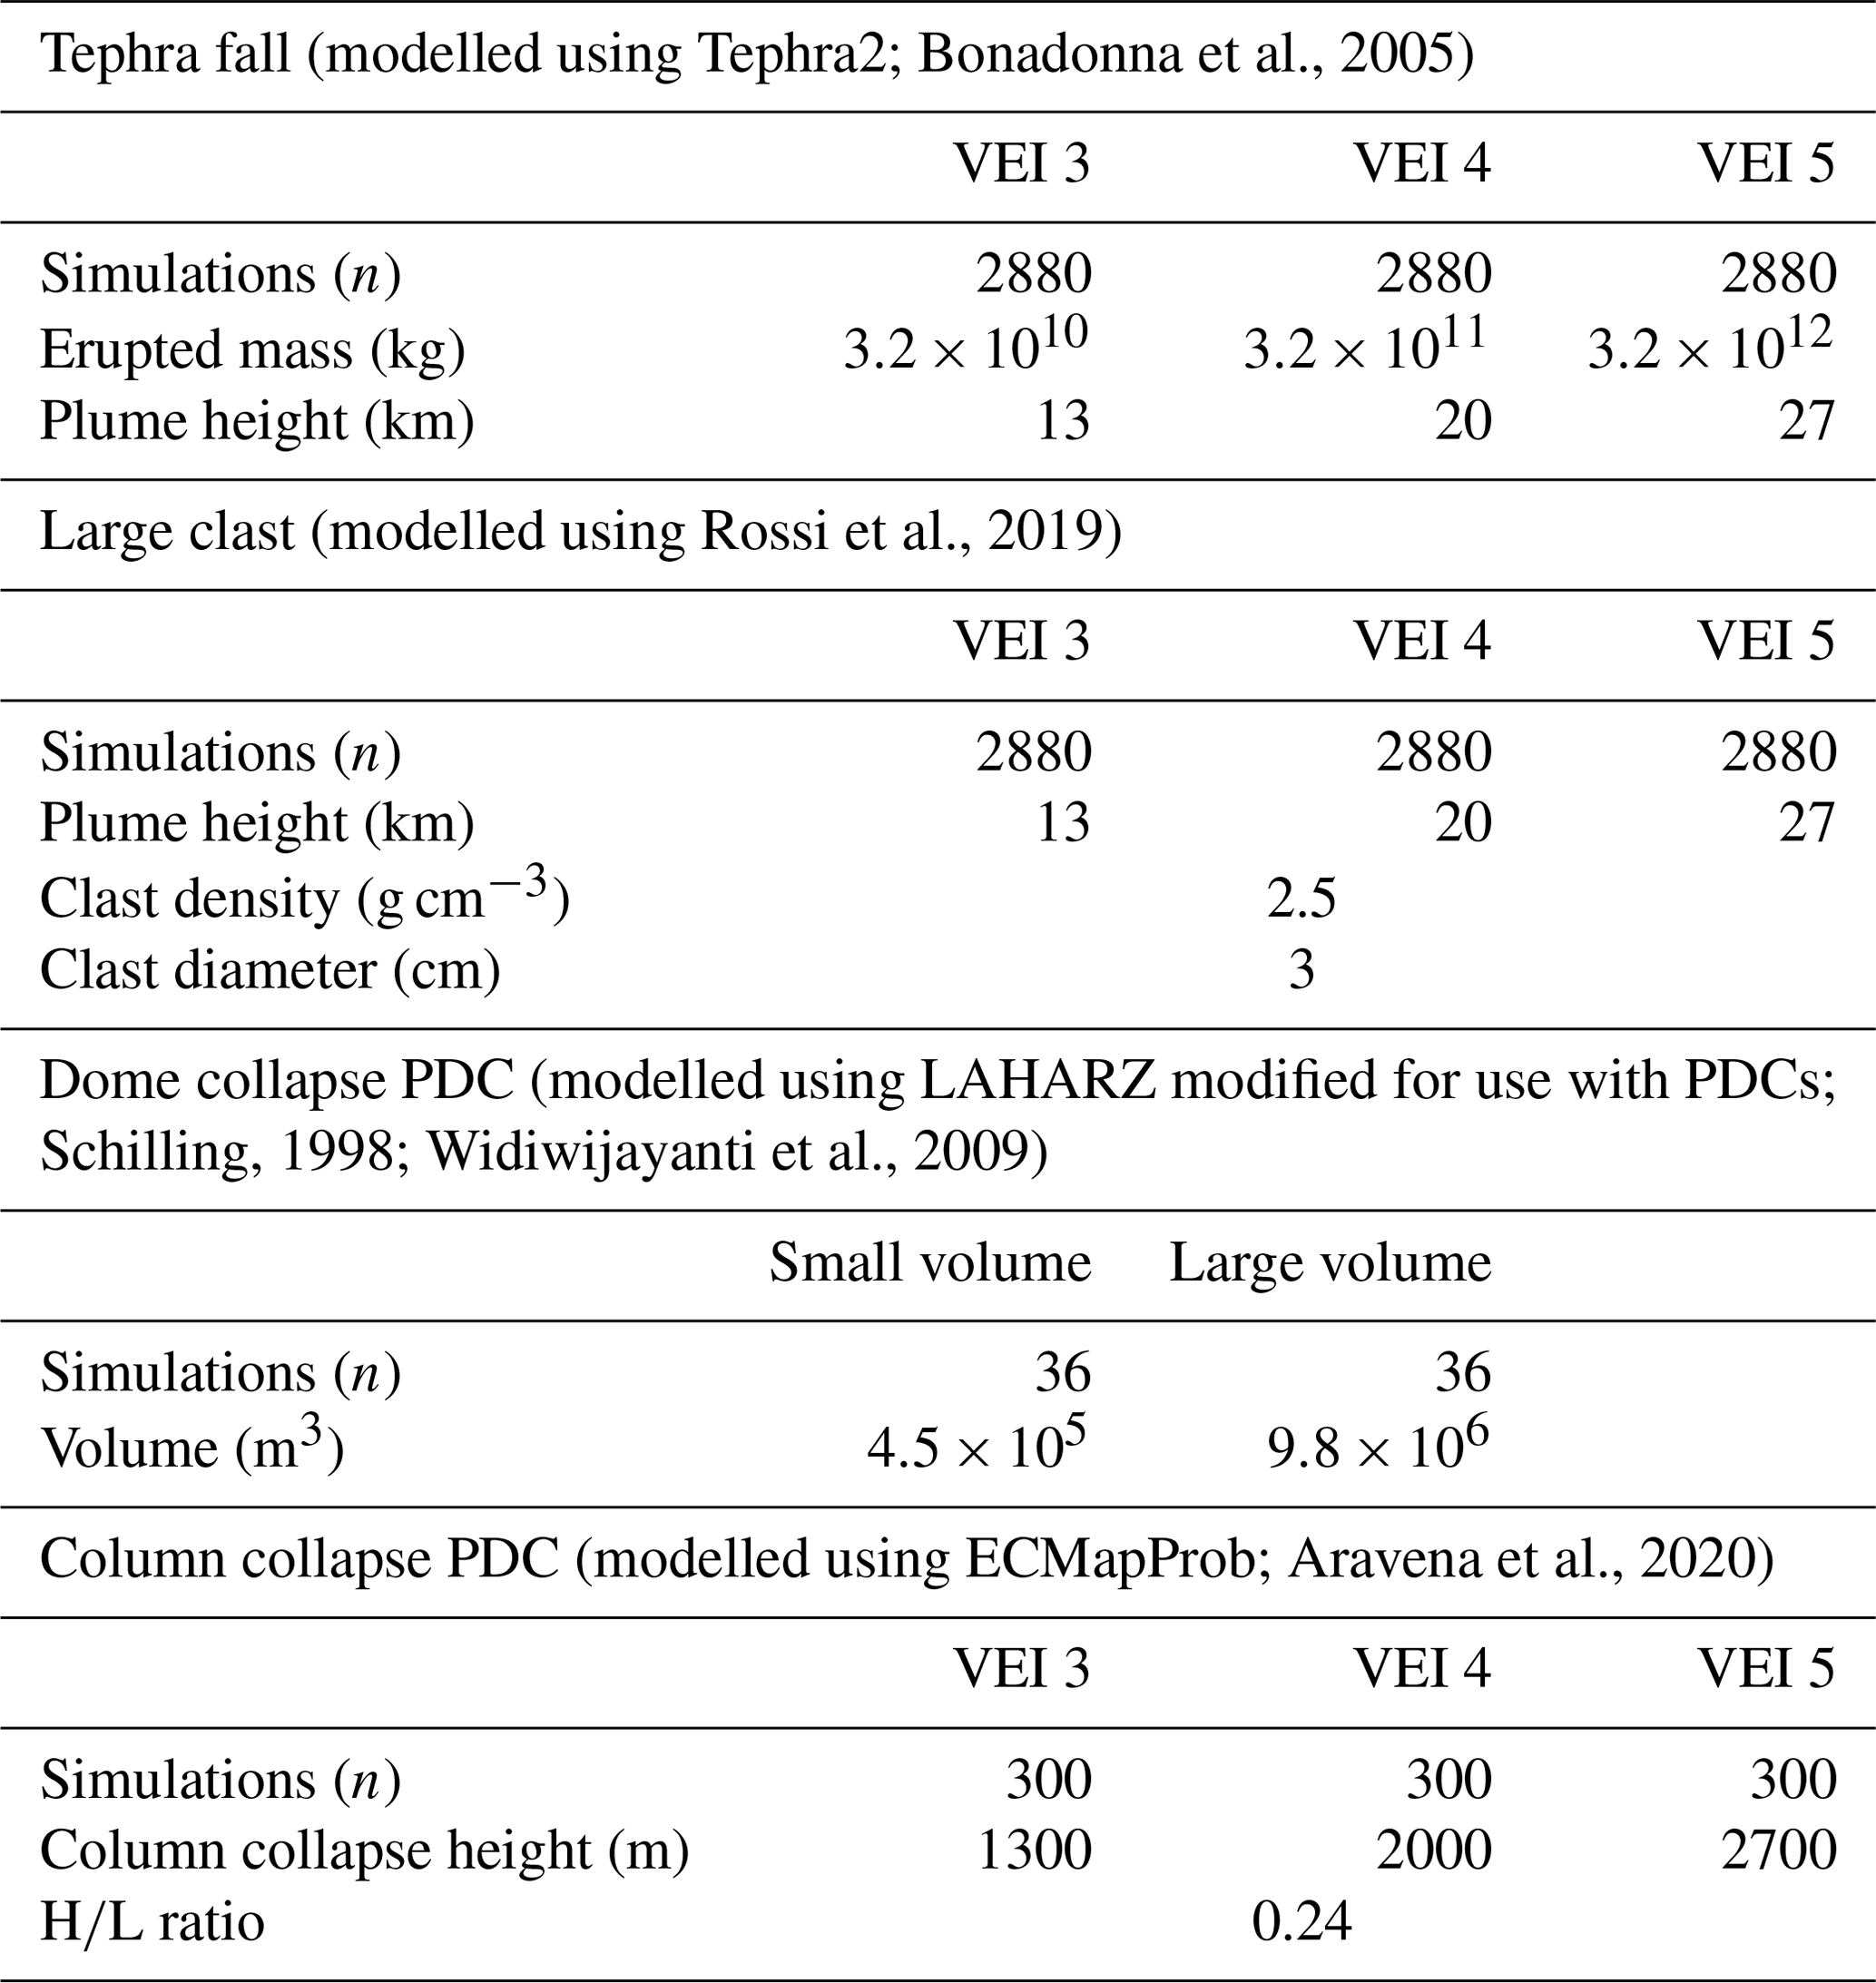
Here, we favour empirical and analytical models over more complex numerical models for two main reasons. Firstly, their relatively lower computing costs allows probabilistic hazard modelling to be run for all the scenarios and volcanoes, and, secondly, they typically require fewer and more generic ESPs. While these models are not necessarily the most physically accurate representation of eruptive processes, they have been shown in numerous circumstances to be acceptable for determining hazard extent and probability (e.g. Tephra2: Bonadonna et al., 2005; Large clasts: Rossi et al., 2019; PDCs: Ogburn and Calder, 2017; Tierz et al., 2016) and were suitable for creating probabilistic hazard inputs for our framework. The next sections describe in more detail the development and the modelling process of eruption scenarios for each hazard, with input parameters and rationalised data sources provided in Appendix A and all hazard outputs in (1) in the “Data availability” section.
2.2.1 Tephra fall
Tephra fall is one of the most widespread and frequently occurring volcanic hazards, and it can cause damage, disruption or other impacts to buildings, crops and infrastructure (Jenkins et al., 2015). Here, we simulated the spatial distribution of tephra fall using Tephra2 (Bonadonna et al., 2005), which solves the advection–diffusion–sedimentation equation using a semi-analytical approach. For each volcano, an eruption scenario was compiled for each of VEI 3, 4 and 5. For each VEI scenario, Tephra2 was run for each of the 2880 synoptic hourly wind profiles (across 10 years) for the wind record closest to the volcano using a single value of critical ESPs. The variability in the results for each VEI and each volcano is mostly due to the variability in specified wind profiles.
For each volcano and scenario (i.e. VEI), the 2880 simulations were post-processed to quantify the spatial distribution of probabilities for exceeding a given accumulation of tephra. We chose tephra accumulations that reflect key impacts for our different categories of exposure and follow those defined by Jenkins et al. (2015). A threshold of 1 kg m−2 (approximately equivalent to 1 mm thickness) was used to quantify exposure to people and roads (signifying potential health hazards and disruption to roads). Also, we considered a threshold of 5 kg m−2 (∼5 mm) to capture disruption or productivity loss for crops and clean-up and infrastructure disruption in urban areas. Building exposure was quantified using a 100 kg m−2 (∼100 mm) threshold, which is often considered as the hazard intensity marking the onset of damage to weak buildings (Jenkins et al., 2014; Blong, 1984). Based on remote damage surveys around Kelud volcano, Java, Williams et al. (2020) identified 100 kg m−2 as the median tephra load associated with moderate or worse damage to tiled or metal sheet roofs – roof types that are common across Indonesia and the Philippines.
Outputs use all 2880 simulations from the full 10-year record to identify the 10 %, 50 % and 90 % exceedance probability contours at each of the loading thresholds and VEI scenarios above (27 contours per volcano). Monthly subsets were also extracted to illustrate the variability in hazard as a function of seasonality (an additional 324 contours per volcano). In total, 345 600 individual tephra simulations were processed to produce 4680 probabilistic outputs across the 40 study volcanoes (i.e. 360 with aggregated wind conditions and 4320 for monthly subsets), with each probabilistic output containing the three probability contours.
2.2.2 Large clast
The kinetic energies of lapilli, or large clasts (i.e. particles with diameters of 2–64 mm), produce a dynamic hazard that can cause skull fracture and roof penetration (e.g. Etna 2013, Kelud 2014, Ontake 2014; G. T. Williams et al., 2019). As their behaviour is partway between wind-advected particles and ballistics and because they can be released from the plume margin, large clasts cannot be accurately modelled by models primarily designed for either ballistic trajectory particles or ash dispersal and sedimentation. Here, we used the model of Rossi et al. (2019) that accounts for limited gravitational spreading of the umbrella cloud and the influence of three-dimensional atmospheric conditions on the particles. This model was successfully validated and applied by Osman et al. (2019) to model the extent of coarse lapilli from the 23 November 2013 eruption of Etna.
Here, we considered the threat to human activity in the vicinity of the vent (e.g. hiking activity at the summit). A threshold of kinetic energies ≥ 30 J at impact was chosen as it represents a central estimate of the impact energy required to cause skull fracture (Yoganandan et al., 1995). This corresponds to a range of clast sizes, depending on density, from ≥3 cm (lithic clasts of 2.5 g cm−3 density) to ≥5.6 cm diameter (pumice clasts of 0.63 g cm−3 density). Thus, we only considered exposure within the extent of the 3 cm lithic isopleth, which is the same extent as a 5.6 cm pumice clast isopleth. The same probabilistic approach was applied for large clast as for tephra fall (i.e. 2880 wind profiles per volcano and fixed plume heights for each of VEI 3, 4 and 5) to quantify the spatial distribution of impact probabilities by a large clast with a kinetic energy exceeding 30 J. For each VEI, we extracted isopleth extents associated with 10 %, 50 % and 90 % probabilities (nine outputs in total per volcano). In total, 345 600 individual simulations were processed to produce 120 probabilistic outputs across the 40 study volcanoes, with each containing the three probability contours.
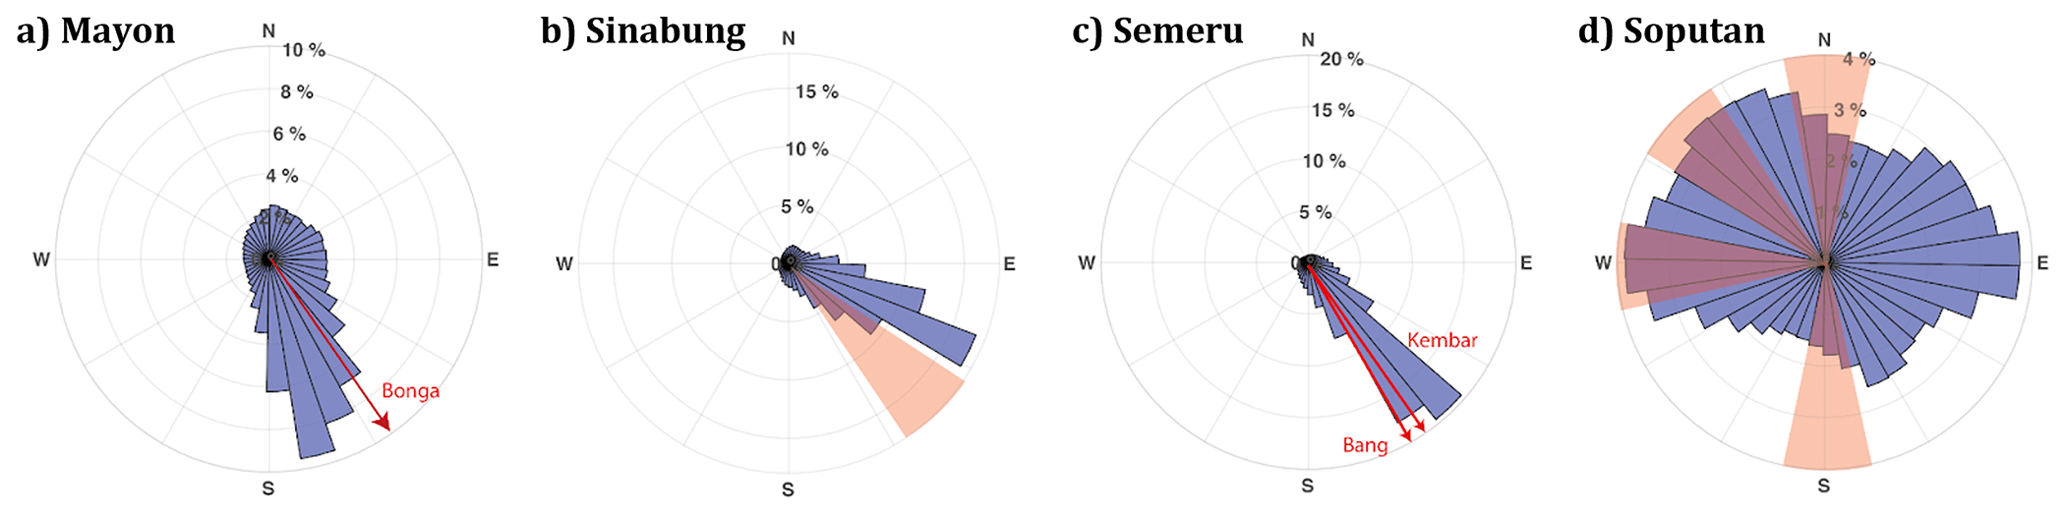
Figure 3Probabilistic forecasting of dome collapse PDC travel directions calculated using the SRTM DEM (details in Appendices A and B). Forecasts are shown in blue with actual dome collapse PDC travel directions shown in red for the following: (a) Mayon: one dome collapse PDC on 11 June 2001 (Global Volcanism Program, 2001); (b) Sinabung: more than 100 dome collapse PDCs between 30 December 2013 and 4 January 2014 (Global Volcanism Program, 2014); (c) Semeru: several dome collapse PDCs between 30 November and 30 December 2002 (Thouret et al., 2007; Solikhin et al., 2012); and (d) Soputan: several dome collapse PDCs on 1 August and 25 October 2007 (Pallister et al., 2012). When a single channel was reported, this is shown with an arrow accompanied by the channel name, while when only a general direction was reported, this is shown as a wedge.
2.2.3 Dome collapse PDC
PDCs cause more fatal events and fatalities than any other volcanic hazard (Brown et al., 2017). A common mechanism of PDC generation is the gravitational collapse of a lava dome (Cole et al., 2015). These PDCs are typically valley-confined, but the possible detachment of the dilute component can overspill and inundate populated areas (Lerner et al., 2022). We simulated the likely flow paths of dome collapse PDCs using a recalibrated version of the LAHARZ model (Iverson et al., 1998; Schilling, 1998), with empirical coefficients updated by Widiwijayanti et al. (2009) based on runout and area for dome collapse PDCs at Soufrière Hills, Merapi, Colima and Unzen volcanoes (see Appendix A for more detail). Since flow volumes are not correlated to VEI, scenarios for our simulations were taken as the volumes corresponding to the 50th (4.5×10⁵ m3) and 90th percentiles (9.8×10⁶ m3) obtained from the global dataset, FlowDat (Ogburn, 2016). We did not include the 10th percentile volume (1.1×10⁵ m3) as it usually results in flows restricted to the summit area. Since flow models generally do not capture PDC overspills or inundation area (as opposed to deposit area) accurately, we applied two buffers around each simulated volume: 300 and 990 m (1 km rounded to the nearest DEM cell). Buffer distances were chosen based on extents observed in previous unconfined PDCs (e.g. Merapi 2010, Fuego 2018: Lerner et al., 2022). For each simulated volume, we output the 10 %, 50 % and 90 % probabilities for each of the buffer extents. In total, 5760 individual simulations were processed to produce 160 probabilistic outputs, with each containing the three probability contours.
Although the PDC scenarios and their ESPs were deterministically chosen, we developed a stochastic approach to estimate the directionality of PDCs from dome collapse. Lava domes often exhibit preferential growth and collapse directions that consequently influence the direction of associated PDCs (Zorn et al., 2019). As factors controlling growth directionality are still debated (e.g. slope and morphology of the summit region; Voight, 2000; Walter et al., 2013), we developed a new method to automatically identify the travel direction probability for each direction around the crater based on the summit topography. Although this method is inherently linked to the accuracy of the DEM, it nonetheless provides a simple, consistent and replicable way to rapidly identify potential flow directions. The method considers all azimuths – here binned by 10∘ intervals – around a user-selected release point and cumulatively assesses the morphological properties of the crater along a radial distance to express a relative probability (more details on the method are provided in Appendix B; Tennant et al., 2022). For each volcano the crater radius was measured using Google Earth and was used as the starting point for the flows. Figure 3 compares the direction estimated using our method with the reported directions of dome collapse PDCs from four case study volcanoes and demonstrates how it successfully captures the dominant flow directions.
2.2.4 Column collapse PDC
Column collapse events typically produce highly mobile, radially distributed PDCs (Cole et al., 2015). These are particularly dangerous since they are not confined to topographic lows in the same way as other PDCs (e.g. those from dome collapse). Here, we modelled the PDC inundation using the probabilistic energy cone approach ECMapProb of Aravena et al. (2020). Following the original approach of Malin and Sheridan (1982), ECMapProb simulates PDC runouts by projecting a cone with a given height-over-length ratio () originating from a collapse height onto the topography, stochastically exploring the uncertainty on collapse height, ratio and vent location. This probabilistic approach allows a PDC's potential to overcome topographic barriers to be estimated. In doing so, ECMapProb is also able to redistribute the residual energy after the cone's initial intersection with topography to account for the frequent channelisation of PDCs (Aravena et al., 2020).
Scenarios for column collapse PDCs were defined based on the plume height identified for each VEI, with a collapse height estimated to be ∼10 % of the plume height (after Wilson et al., 1978). For each VEI scenario, spatial extents of the 10 %, 50 % and 90 % probability of inundation were produced (nine probabilistic outputs in total per volcano). More details on the inputs used are provided in Appendix A. In total, 120 sets of 300 simulations were performed (n=36 000 total), with each set producing a probabilistic output that contained the three probability contours.
2.3 Incorporating eruption frequency
The hazard modelling described thus far provides conditional outputs; i.e. they provide the spatial area affected by a given hazard assuming that an eruption of a given VEI or flow volume has occurred. This is valuable information for crisis planning in the event of unrest; however, comparing across volcanoes at the regional scale requires estimating exposure as a function of the eruption frequency or probability of occurrence. We achieved this by following the methodology of Hayes et al. (2022a), which uses a Bayesian update and model combination framework to estimate the annual probability of each VEI for each volcano, as well as the uncertainty around that value (VEI annual probabilities at the 10 %, 50 % and 90 % probability are provided for each volcano in (2) in the “Data availability” section). Analogue annual eruption probabilities were first calculated using two volcano analogue classification systems (Whelley et al., 2015; Jenkins et al., 2018). These probabilities are then updated separately using the volcano-specific eruption record sourced from GVP (version 4.8.5, https://volcano.si.edu/, downloaded 20 January 2020). This produces two separate frequency–magnitude probability distributions for each volcano based on the two analogue systems and incorporating volcano-specific eruption data. These two probability distributions are then combined using a model stacking approach to produce a single frequency–magnitude probability distribution for each volcano with uncertainty. The 50 % annual probabilities for each VEI were used in our study to weight the exposure calculated for each VEI scenario; i.e. each exposure value was multiplied by the annual probability of an eruption of that VEI occurring at that volcano, with the sum across them providing the absolute exposure value, which represents the averaged annual exposure across all eruption simulations and scenarios for that volcano and hazard. Incorporating eruption frequency allowed us to better assess the exposure over given timescales; for example, multiplying the absolute exposure values by 100 gives the averaged exposure over a 100-year timeframe. For dome collapse PDCs, in which flow volume cannot be linked to VEI, we do not incorporate eruption frequency, only providing conditional probabilities.
2.4 Exposure assessment
Exposure estimates were obtained by overlapping the extent of hazard footprints with exposure datasets within our GIS. We considered five distinct categories of exposure.
-
Population. The exposure of populations was estimated using Oak Ridge National Laboratory LandScan data for 2018. LandScan is a proxy for the ambient (i.e. 24 h average) population density at a resolution of ∼1 km (Rose et al., 2019).
-
Number of buildings. The location and number of buildings was modelled using the Global Earthquake Model (GEM) building exposure data described by Silva et al. (2020). Disaggregation of data from the regency level into built-up areas at a 36 m by 36 m resolution was achieved using the Pesaresi et al. (2015) Global Human Settlement Layer (GHSL). We considered only residential buildings.
-
Road lengths and hierarchies. To calculate the length of roads affected by each of our hazards, we used OpenStreetMap (OSM) data (downloaded from Geofrabrik.de on 26 November 2020), which provide the location of roads and their classification, e.g. motorway, primary and residential. We consolidated the 16 OSM road classifications into four distinct hierarchies – motorway (hierarchy 4), arterial (hierarchy 3), collector (hierarchy 2) and local (hierarchy 1) – on the basis that road hierarchy is an indicator of the scale of disruption experienced by the road network from hazardous impacts (Hayes et al., 2022b).
-
Area of crop land. Land cover is used as a proxy for estimating exposure of crops to volcanic hazards. Here we use the Copernicus Global Land Cover v3 at a 100 m resolution (CGLS-LC100; Buchhorn et al., 2020) for 2019 and extract the cultivated and managed vegetation classes from the discrete classification dataset.
-
Urban area. This is the same as for crops, with the urban/built-up class extracted.
All exposure data were interpolated from their original resolution to the 90×90 m grid used within our GIS framework, as described in Sect. 2.1.
The multi-hazard and multi-exposure analysis presented here required nearly 700 000 individual simulations and produced 26 640 probabilistic outputs, comprised of the following:
-
15 240 hazard estimates: 40 volcanoes × 3 probabilities × [(3 VEI scenarios for column collapse PDC) + (2 flow volumes × 2 buffers for dome collapse PDC) + (3 VEI scenarios for large clast) + (3 VEI scenarios × 3 thickness thresholds × (12 individual months + 1 whole-year average wind conditions))];
-
11 400 exposure estimates: 5 exposures × 40 volcanoes × 3 probabilities × [(3 VEI scenarios for column collapse PDC) + (2 flow volumes × 2 buffers for dome collapse PDC) + (3 VEI scenarios for large clast) + (3 VEI scenarios × 3 thickness thresholds × 1 whole-year average wind conditions)].
Such outputs can be useful at the individual volcano scale (e.g. maps of probabilistic dome collapse PDC inundation or the number of buildings exposed to a VEI 4 tephra fall ≥1 kg m−2 at the 10 %, 50 % and 90 % probabilities), as well as the regional scale. We provide all our hazard and exposure results in (1)–(3) in the “Data availability” section. Hazard outputs are provided per volcano and include processed wind direction and speed information and hazard model outputs. Exposure analysis results are provided as an excel file: these serve as the raw data for all figures and tables in this study. More information on data format for the hazard, frequency–magnitude and exposure data are provided in (1), (2) and (3) in the “Data availability” section. These files include all our data output files, available in user-friendly formats (tif, xlsx).
3.1 Case study examples
A total of 381 probabilistic hazard outputs were produced for each volcano (SM1), giving 15 240 in total. Figure 4 highlights three case study volcanoes, with the reason for choosing each described below. We use these as examples of our model outputs and calculated exposure, as well as the associated hazard and exposure insights that can be derived from our results. We do not compare our maps with official CVGHM or PHIVOLCS hazard maps where they are available for our study volcanoes for the following reasons: (i) comparison implies that one can be calibrated or validated by the other, but (ii) we use different methodologies (probabilistic vs. deterministic), (iii) our input data (i.e. analytical vs. geological) are different, and (iv) the purpose and expected end user are not the same.

Figure 4Results of hazard modelling for a VEI 4 scenario for (a) large clasts and dome collapse PDCs (9.8×10⁶ m3, 990 m buffer) at Merapi, with 2006 dome collapse PDC (Charbonnier and Gertisser, 2008) and 2010 large clast extents (Iguchi et al., 2011) shown by the hashed black areas and dashed red radii, respectively; (b) population exposure data at Merapi (LandScan 2018; Rose et al., 2019) combined with 50 % large clast hazard footprint and the outer limit of dome collapse PDC from (a); (c) column collapse PDC at Taal overlaying the roads, categorised by hierarchy; (d) tephra fall extent at 50 % probability for exceeding 1 kg m−2 for January, July and using whole-year conditions, overlaying roads, categorised by hierarchy (hierarchy legend same as for c); (e) crops and urban area exposure at Gede–Pangrango combined with tephra fall probability isopachs for an accumulation of 5 kg m−2 for whole-year wind conditions; and (f) number of buildings at Gede–Pangrango combined with tephra fall accumulation isopachs (50 % exceedance probability) for whole-year wind conditions. Satellite basemap © Google Maps.
Merapi volcano in central Java, Indonesia, is one of the most active and hazardous volcanoes in the world, with more than 20 million people living within 100 km (Table 2) and more than 20 000 within 10 km (SM3). Our modelling confirms that large clasts and dome collapse PDCs are primarily near-vent hazards, with a maximum radial extent of around 7 km to the west for large clasts and 10 km to the southeast through northwest for dome collapse PDC (Fig. 4a). These distances and directionality fit well with deposits produced during the last ca. 100 years (Jenkins et al., 2016; Voight et al., 2000; Charbonnier and Gertisser, 2008). Results suggest that large clasts and dome collapse PDCs do not affect heavily populated areas, although transient hiking populations at or near the summit and more heavily populated areas to the northwest (a low-probability impact area) are exposed (Fig. 4b). A comparison of our model outputs (simulated volume of 9.8×10⁶ m3 and buffer extent of 990 m) with mapped 2006 dome collapse PDCs – m3 to the southwest (Ratdomopurbo et al., 2013) and 6×10⁶ m3 to the south (Charbonnier and Gertisser, 2008) – shows reasonable similarity in runout extent, highlighting the south and southwest as particularly high hazard areas. The comparison also shows that a 30 m resolution DEM fails to capture the strong topographic controls evident in mapped PDCs. Note that PDCs during the 2010 eruption (not shown) extended beyond our simulated PDC footprints to the south by ∼5 to 7 km because they were generated by dome explosion and partial column collapse, both of which promote greater runout distances (Komorowski et al., 2013).
Taal volcano, ∼60 km to the south of Metro Manila in the Philippines, is a caldera-forming volcano with a history of explosive volcanism (Reyes et al., 2018). More than 25 million people live within 100 km (Table 2) and nearly 60 000 within 10 km (SM3). The strong topographic control of the caldera walls in limiting column collapse PDC runout and exposure at Taal is evident in Fig. 4c. Within the caldera scarp, roads are relatively sparse, except for the town of Taal in the southwest where gentler relief results in higher road and population density (Fig. 4c and d) and subsequently an increased exposure to topographically controlled hazards such as PDCs. For a VEI 4 scenario, 653 km of predominantly lower-hierarchy 1 and 2 roads are exposed to column collapse PDCs at the 10 % probability contour but only 98 km at the 50 % probability contour as PDC runout remains mostly confined to the lake and island. Figure 4d shows the influence of seasonality on the tephra fall impact area, discussed in more detail in Sect. 4.1. Regardless of season, our modelling shows that ∼50 to 60 km of the EH2 highway to the east of the volcano, which links the cities of Batangas and Manila, is likely to be impacted by a VEI 4 eruption from Taal.
Gede–Pangrango is an active, but recently quiet, volcano with a poorly known eruptive history that lies ∼60 km to the south of Jakarta in western Java (Tennant et al., 2021). This proximity to Jakarta leads to Gede–Pangrango having the greatest number of people living within 100 km (more than 41 million) of any volcano in our study (Table 2) or the world (Small and Naumann, 2001). Closer to the volcano, numbers are more modest, with ∼15 000 within 10 km (SM3). Figure 4e and f show (i) the probability of exceeding a certain tephra load (≥5 kg m−2 in Fig. 4e) and (ii) the tephra load expected at a given probability (50 % in Fig. 4f). Both approaches show that tephra falls are most likely to be dispersed towards the west, affecting only the southernmost parts of Jakarta with relatively low loads (≥1 kg m−2). Given a VEI 4 scenario, the city of Sukabumi to the south-southwest and communities to the west of Gede, along the highway leading into Bogor and Jakarta, are threatened by potentially damaging tephra fall loads (≥100 kg m−2; Fig. 4f); very atypical wind conditions blowing from the south are needed to result in such loads across the densely built areas of Jakarta. Considering the low exceedance probability scenario (10 %) from a VEI 4 eruption, most of the crops exposed to ≥5kg m−2 tephra fall accumulation are located to the east of Gede–Pangrango, while urban areas are to the northwest, specifically Bogor (Fig. 4e). For the high-probability scenario (90 %), exposed crops and urban areas are concentrated within ∼20 km to the west of Gede.

Figure 5Distribution of the population exposure for each volcano colour-coded by region. The horizontal bars and the coloured circles show the 95 % confidence interval and the median, respectively, whereas the small dark dots show the underlying data. Each column is a different eruption scenario (i.e. flow volume for dome collapse PDC and VEI otherwise). The hazard used here considers a conditional exceedance probability of occurrence of 50 %. The number of volcanoes in each region are as follows: Halmahera/Banda Sea (4), Java (13), Lesser Sunda (10), Sulawesi (5), Sumatra (2), and the Philippines (6).
3.2 Exposure assessment
Each probabilistic hazard output was combined with each of the five exposure datasets to produce 95 exposure estimates per volcano (3800 in total: SM3). For most hazards, the exposure increases significantly with increasing VEIs, reflecting the increased distance reached with greater eruption intensity and/or magnitude (Figs. 6–8). Column collapse PDC marks the exception, with a VEI 4 or 5 eruption not marking a significant increase in exposure compared to a VEI 3 eruption (Fig. 9). In general, the hazards resulting in the highest values of exposure are, in decreasing order, tephra fallout, PDC from column collapse, large clasts and PDC from dome collapse. Tephra fall yields a higher population exposure compared to column collapse PDCs up to accumulations of ∼5 kg m−2 for all VEIs. Above a tephra accumulation of 5 kg m−2, column collapse PDCs result in higher population exposure for a VEI of 3.
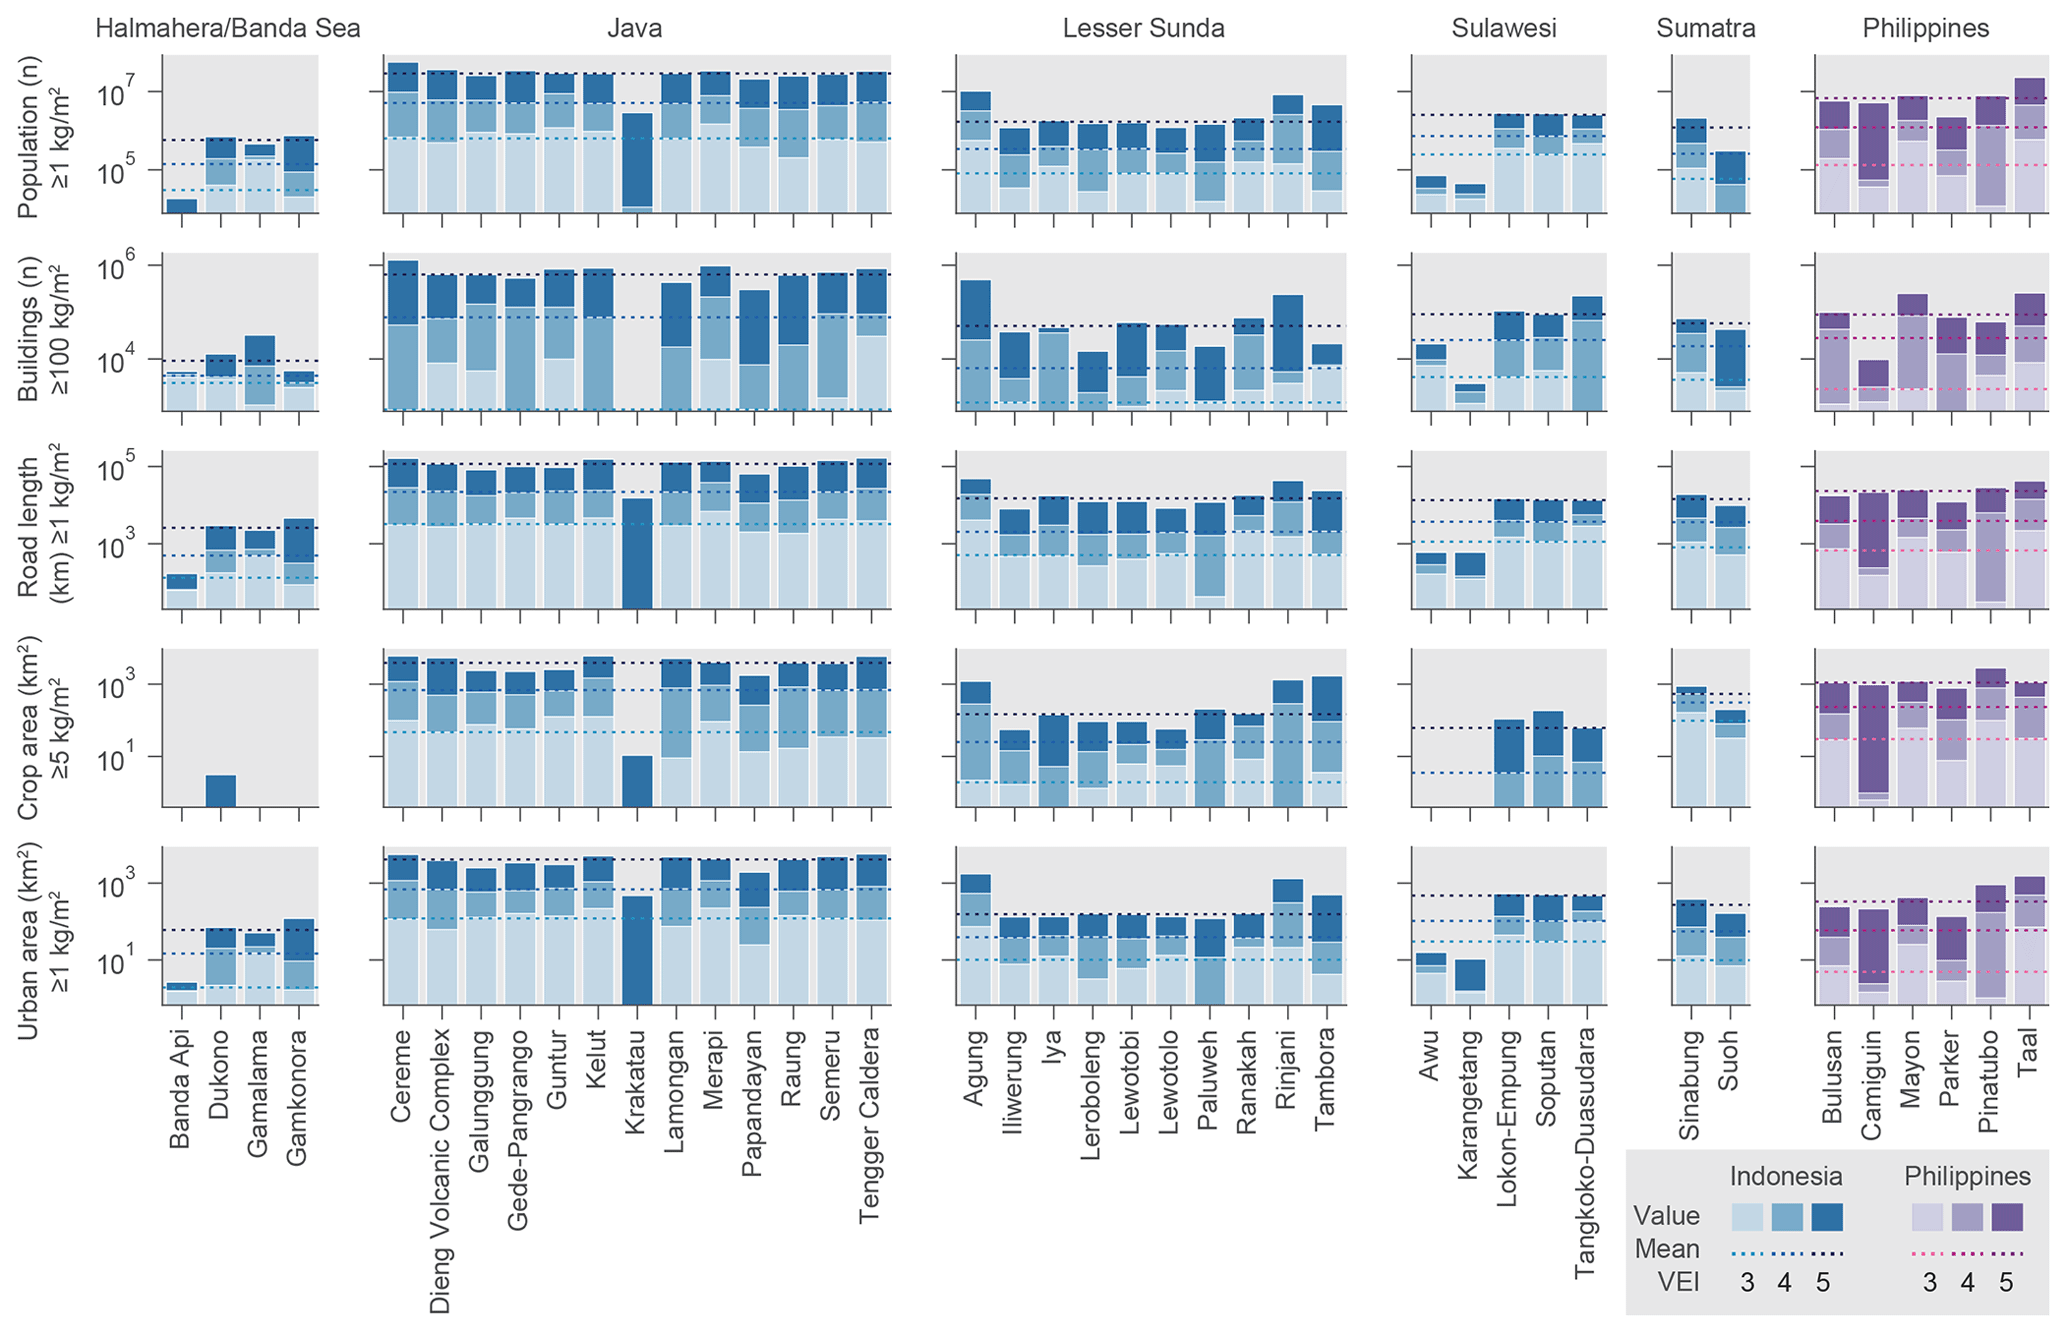
Figure 6Exposure to tephra fall accumulation summarised per region and exposure type for a conditional exceedance probability of occurrence of 50 %. Overlying (not stacked) bars illustrate the variability in exposure with VEI (with the top of the bar representing exposure for that VEI) and dotted lines the median for the region. Note that specific thresholds of tephra loads (as defined in Sect. 2.2.1) are used for various exposure types.
3.2.1 Population exposure
For all regions and all hazards, the distribution of population exposure across different volcanoes is often asymmetrical (positively skewed), with a long tail suggesting that a smaller number of volcanoes provide the very large exposure values (Fig. 5). For tephra fall, populations in Java are by far the most exposed to our study volcanoes (n=13) of any region (Figs. 5 and 6). As the dominantly east–west wind directions across Java coincide with the island's orientation, tephra is mostly deposited on land. For an eruption of VEI 5 at 50 % probability, 12 of the 13 volcanoes in Java result in >10 million people exposed to tephra falls ≥1 kg m−2 from the volcano; for a VEI 4 50 % scenario, with the exception of Krakatau (∼11 000 people), between 3.4 million (Raung) and 9.6 million (Cereme) are exposed to the same tephra fall threshold. Within Java, Krakatau volcano always shows a lower tephra fall exposure relative to other Javanese volcanoes, whilst Cereme, due to its upwind location to Jakarta, is consistently amongst the volcanoes resulting in higher exposure to tephra fall. Sulawesi is the region with the second highest median exposure to tephra fall from eruptions with VEI 3, but larger eruptions of VEI ≥ 4 see the Philippines ranked second (Fig. 5).
Exposure to large clasts is 3 to 4 orders of magnitude smaller than for tephra fall, as expected. Populations in Java and the Philippines have the greatest median exposure to eruptions of VEI 3 and 5, whereas populations in the Halmahera/Banda Sea region have the greatest median exposure to VEI 4 eruptions (Fig. 7). This indicates that our analysis accurately captures the distribution of population in the region, with fewer people on the flanks of the volcanoes and most settlements being 5–10 km away, often on the shores of volcanic islands.
For column collapse PDCs, with a maximum runout distance partway between the maximum extents of large clasts and tephra fall, populations in Java again have the greatest median exposure (Fig. 9). For dome collapse PDCs, which typically have a more directed and relatively short maximum extent compared to the other simulated hazards, median exposure numbers are relatively small but highlight volcanoes in Sumatra (n=2) as those with the greatest median exposure and Sulawesi (n=5) as those with the largest exposure values (Fig. 8). Lokon-Empung volcano in Sulawesi is driving the larger values in the region (>7000 people exposed) with the most likely flow direction being to the southeast, affecting communities along the Tomohon–Manado main road ∼5 km away. In Java, Guntur volcano provides the largest outlier exposure value for dome collapse PDCs, with more than 11 000 people exposed in communities ∼7 km southeast from the volcano on the outskirts of Garut.
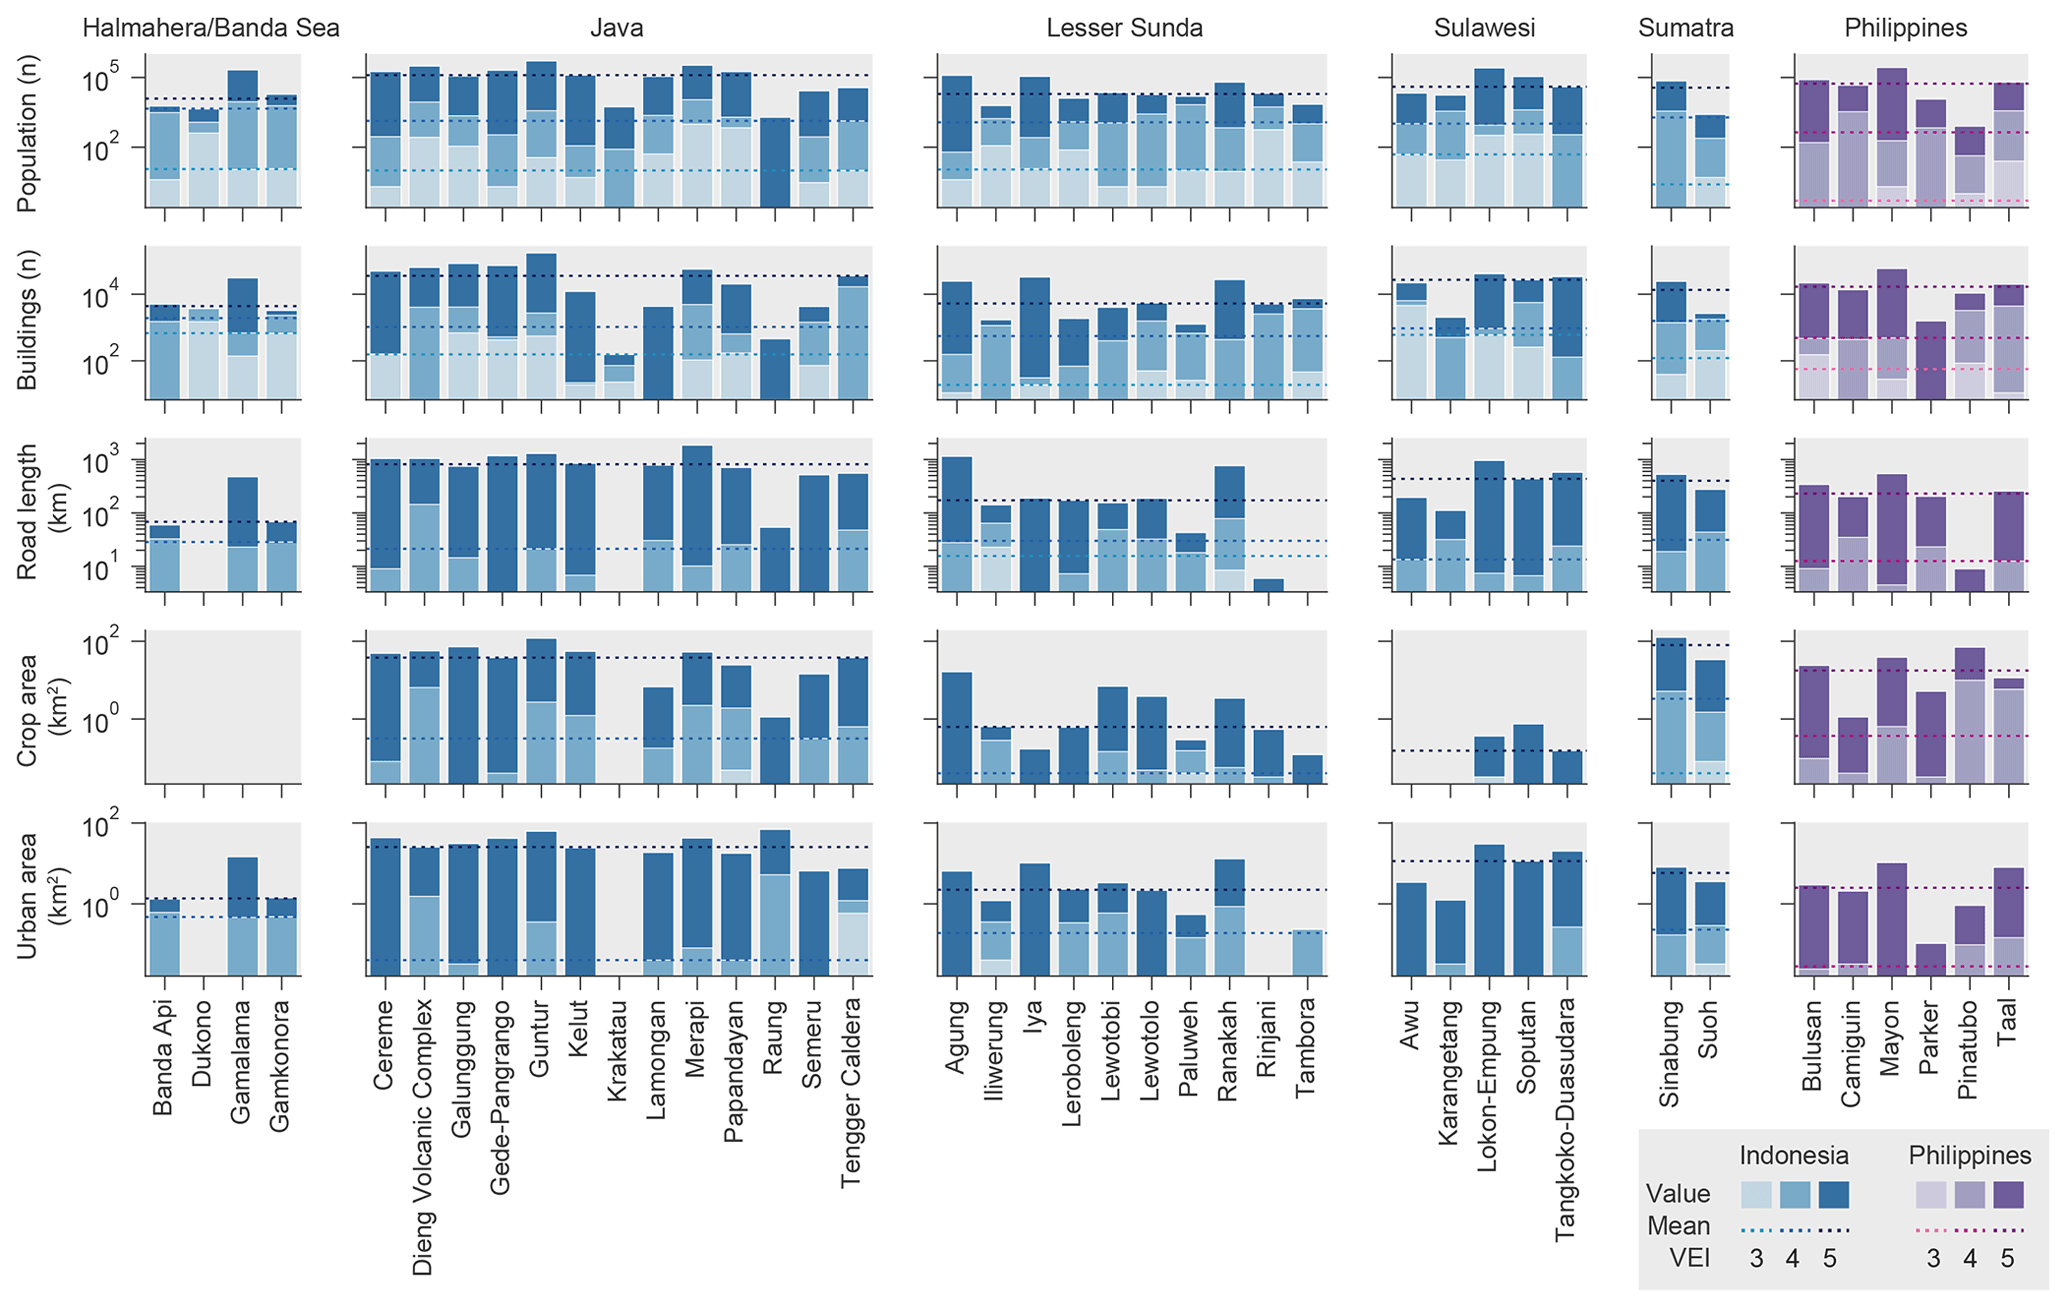
Figure 7Exposure to the large clast hazard (i.e. hazard caused by a kinetic impact ≥ 30 J) summarised per region and exposure type for a conditional exceedance probability of occurrence of 50 %. Overlying (not stacked) bars illustrate the variability in exposure with VEI (with the top of the bar representing exposure for that VEI) and dotted lines the median for the region.
3.2.2 Building exposure
For VEI 3, Sulawesi and Sumatra have the largest median number of buildings exposed to tephra accumulations ≥ 100 kg m−2 and Java has the smallest. For VEI ≥ 4, on average, Java becomes the most exposed region with Merapi (VEI 4) and Cereme (VEI 5) producing the largest numbers (Fig. 6). Sulawesi and the Philippines are the second two most exposed regions, on average. For large clasts, the regions that have, on average, the most buildings exposed to eruptions of VEI ≤ 4 are Halmahera/Banda Sea, Sulawesi and Sumatra. For VEI ≤ 4, our Javanese volcanoes have virtually no exposed buildings to large clasts, but the region climbs to first place for VEI 5. For column collapse PDCs, the regions with the greatest median exposure are, in decreasing order: Java, Sulawesi, Sumatra and the Philippines across all VEI classes. For dome collapse PDCs, Sulawesi and Sumatra have the highest median exposure, followed by Halmahera and Java (Fig. 8).
3.2.3 Road network
Due to the proximity to large and complex urban centres (e.g. Jakarta, Yogyakarta), on average Java has by far the greatest road network exposed to tephra accumulations of ≥1 kg m−2 over all VEIs (Fig. 6). For VEI ≥ 4, the region with the second greatest median exposure is the Philippines, with the notable case of Taal volcano that can affect metropolitan Manila. For VEI 3, only Sumatra and Lesser Sunda have some sections of road (i.e. <20 km) exposed to large clasts. For VEI 4 and 5, the regions with the greatest median exposure are Sumatra and Java, respectively. The pattern of exposure of the road network to column collapse PDC inundation is generally the same as for tephra fall, the only exception being significantly lower median exposure in the Philippines. Due to its location within a caldera lake, Taal volcano requires large eruptions to affect the road network. Interestingly, the case study of Mayon volcano illustrates the variability in exposure with VEI between tephra fall and PDC. For tephra fall, the main wind direction is westwards, and the urban centre of Legazpi, located ∼15 km south-southwest of the vent, becomes increasingly affected by larger eruptions that develop significant crosswind and downwind sedimentation patterns (Fig. 6). Conversely, column collapse PDCs are less directional, and the exposed road network varies little across VEIs (Fig. 9). Finally, only a limited length of roads (i.e. maximum of 50 km) is typically exposed to inundation from dome collapse PDCs. For the largest volume and buffer, Guntur and Merapi are the two volcanoes producing the largest road exposure values (Fig. 8).
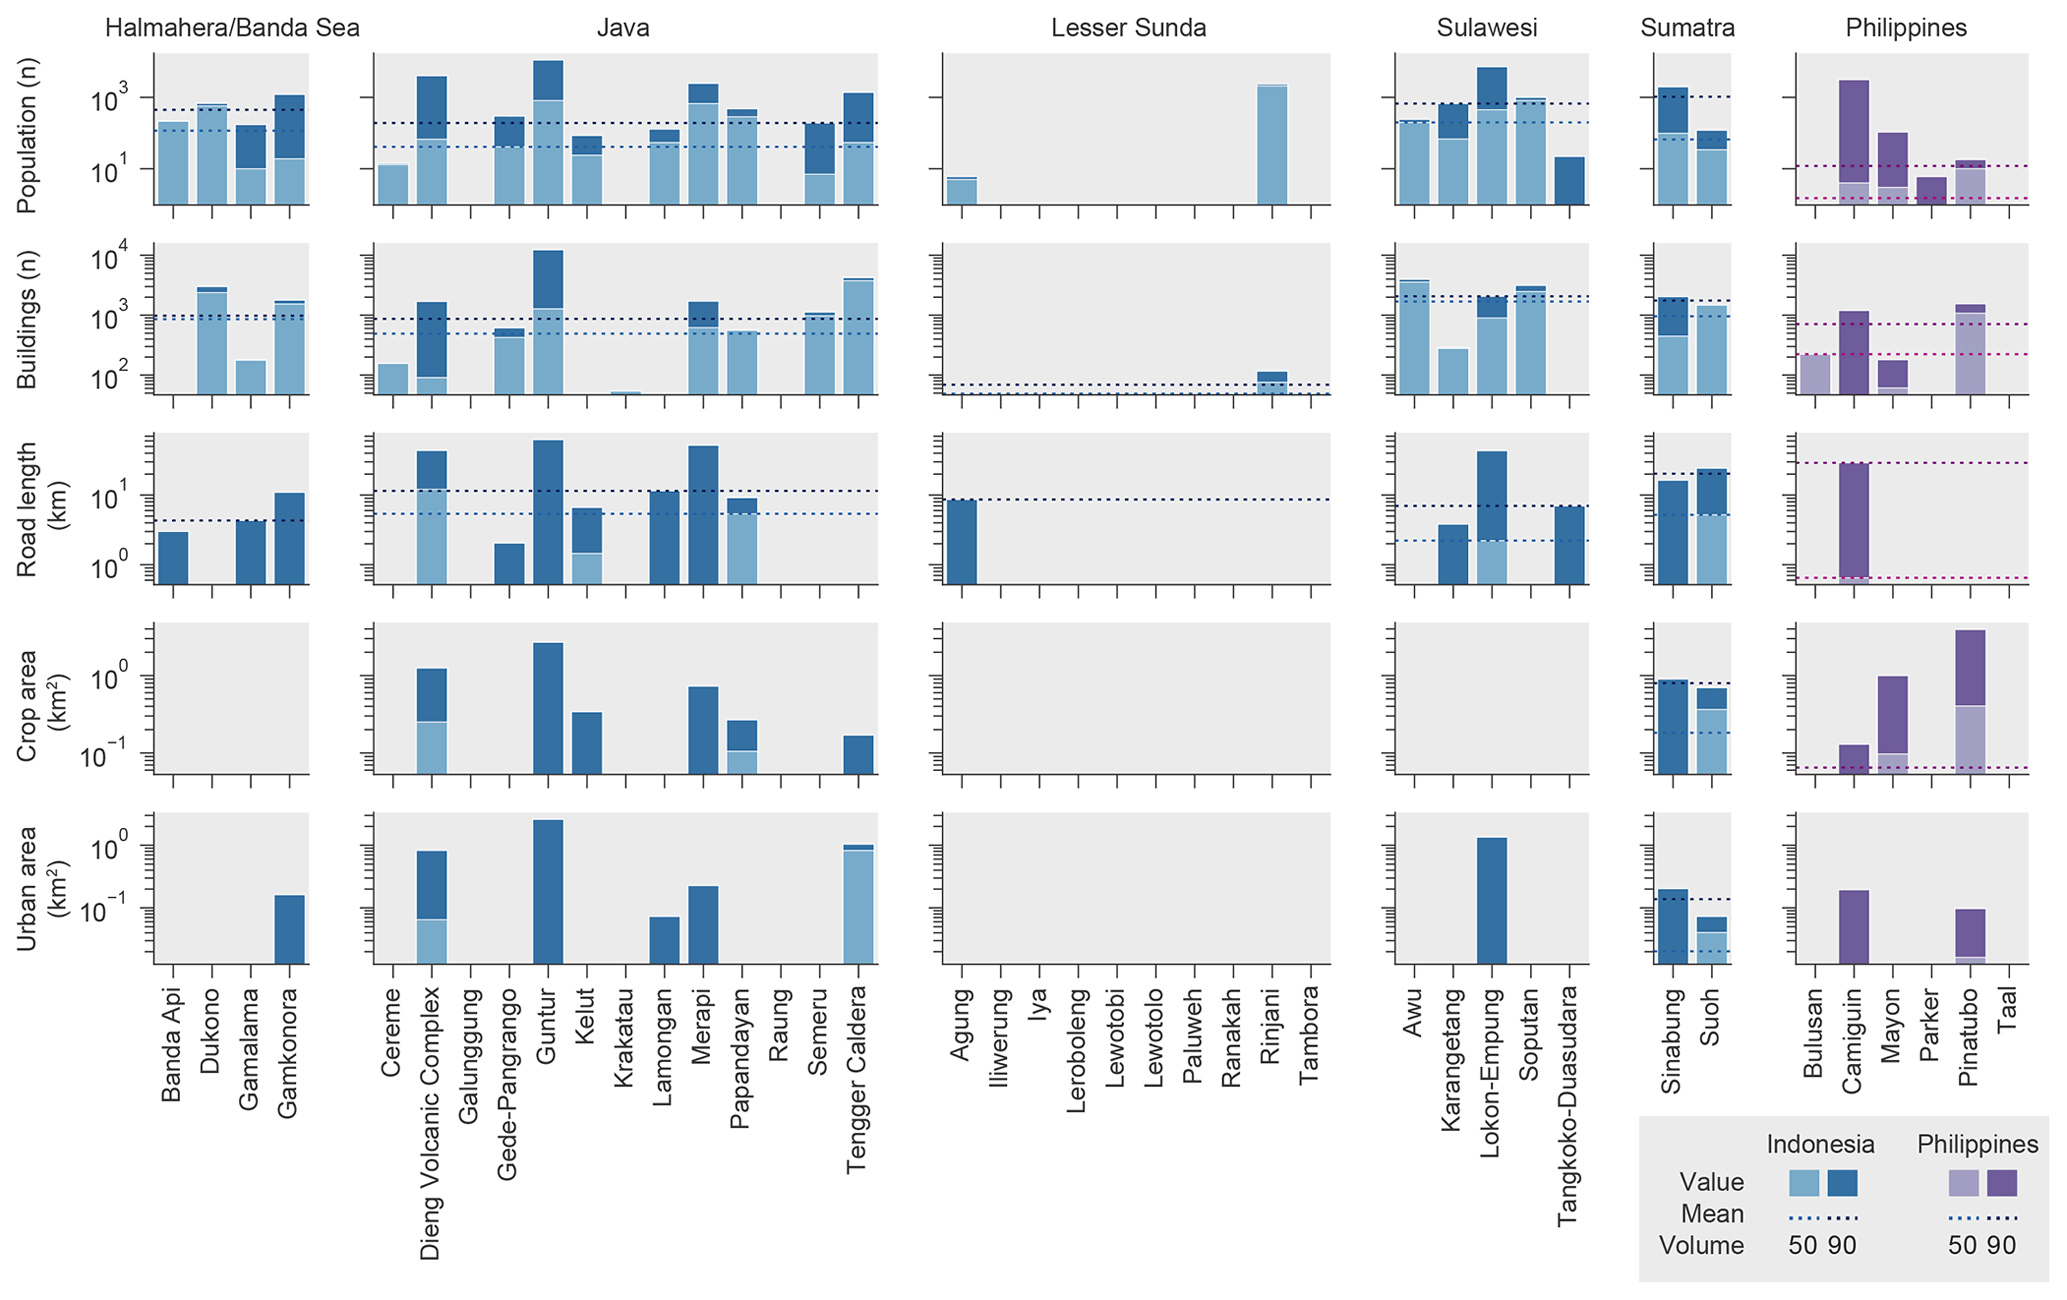
Figure 8Exposure to inundation from dome collapse PDCs summarised per region and exposure type. The hazard is extracted for a conditional exceedance probability of occurrence of 50 % and considers a 990 m buffer around the flow footprint. Overlying (not stacked) bars illustrate the variability in exposure with the initial flow volume (with the top of the bar representing exposure for that volume) and dotted lines the median for the region.
3.2.4 Crop area
Regions displaying the largest median exposure of crop land to all hazards are Sumatra and Java. For large clasts and dome collapse PDCs, Sumatra displays the largest median crop exposure across all eruption scenarios (Figs. 7 and 9). For large eruption scenarios (i.e. VEI ≥ 4 for tephra and VEI 5 for column collapse PDC), volcanoes in Java have the largest exposure, on average. The median exposure of crops to tephra accumulations ≥ 5 kg m−2 in Java varies by 2 orders of magnitude between VEI 3 (∼30 km2) and VEI 5 (∼1700 km2).
3.2.5 Urban area
Java and Sulawesi show the highest median exposure to both tephra accumulation ≥ 1 kg m−2 (Fig. 6) and column collapse PDCs (Fig. 9). The third most exposed region, on average, across our volcanoes is the Philippines for tephra and Sumatra for column collapse PDCs. Considering a VEI 4 eruption, <1 km2 of urban area is exposed, on average, to large clasts in these regions. This increases to 6, 11 and 25 km2 for Sumatra, Sulawesi and Java, respectively, for a VEI 5 scenario (Fig. 7). The median exposure of urban areas to dome collapse PDC is <2 km2 for all regions and scenarios and is virtually null for Lesser Sundra (Fig. 8).
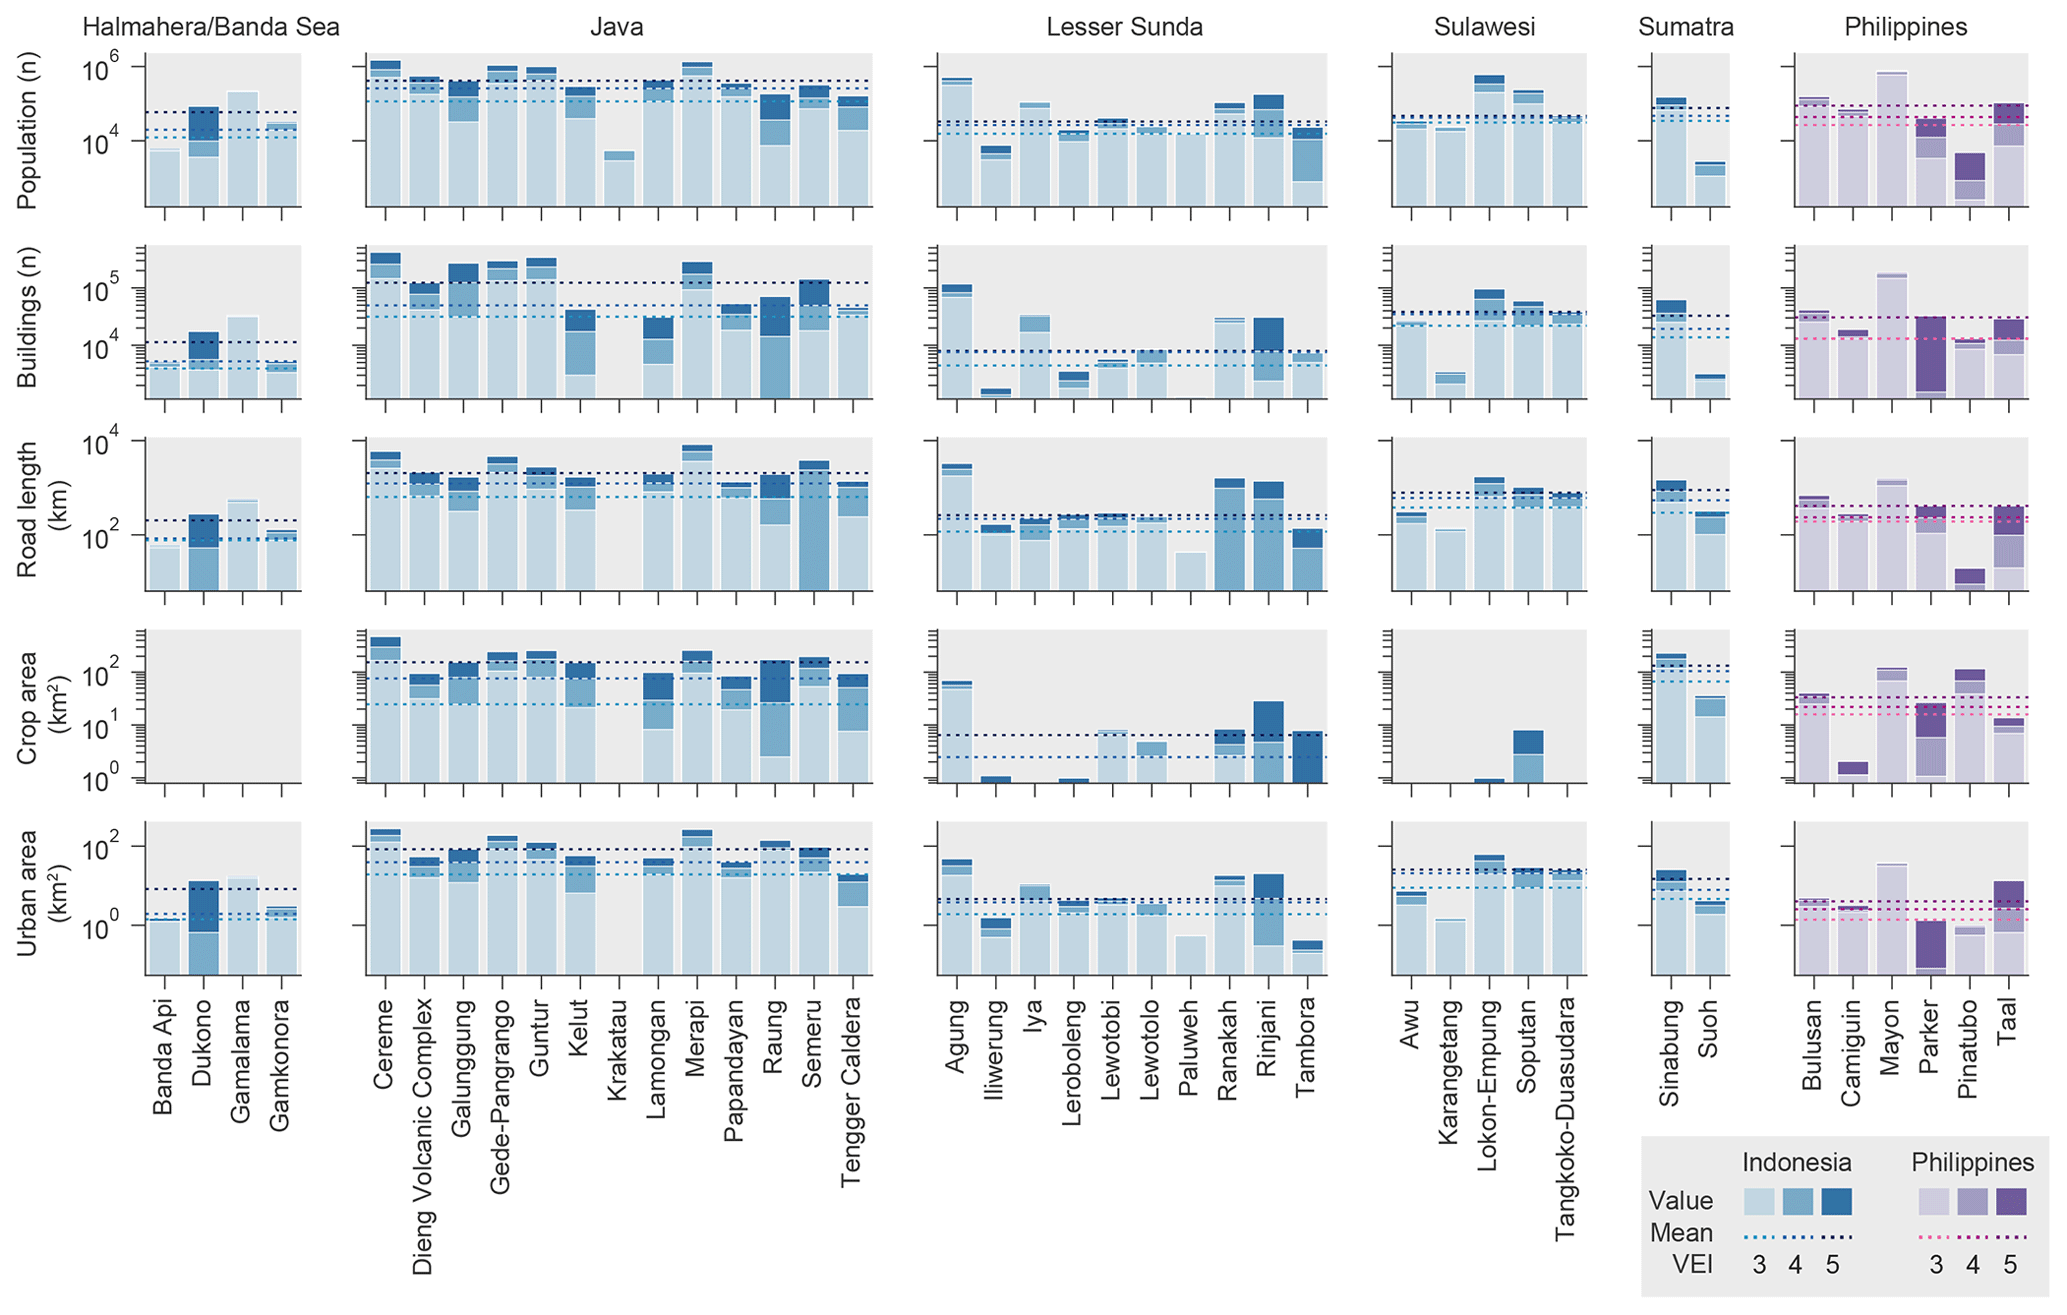
Figure 9Exposure to inundation from column collapse PDCs summarised per region and exposure type for a conditional exceedance probability of occurrence of 50 %. Bars illustrate the variability in exposure with VEI and dotted lines the median for the region.
3.3 Hazard seasonality
Tephra hazard, and related exposure, is strongly controlled by wind conditions at the time of the eruption, which vary across the region as a function of the season. Figure 10 shows the discrepancy between the values of population exposure presented above, which aggregate probabilities of tephra fallout over all months, and those calculated using wind conditions from each month separately. We acknowledge two limitations to quantifying our exposure estimates as a function of season. Firstly, the potential influence of increased rain on hazard modelling (e.g. aggregation increasing proximal sedimentation; Brown et al., 2012) and post-deposition hazard intensity estimates (e.g. increased load due to water-saturated deposits; Macedonio and Costa, 2012; Williams et al., 2021) is ignored here. Secondly, the population count provided by LandScan is an ambient averaged population which does not capture any demographical seasonal dynamics (seasonal workers, tourism, etc.).
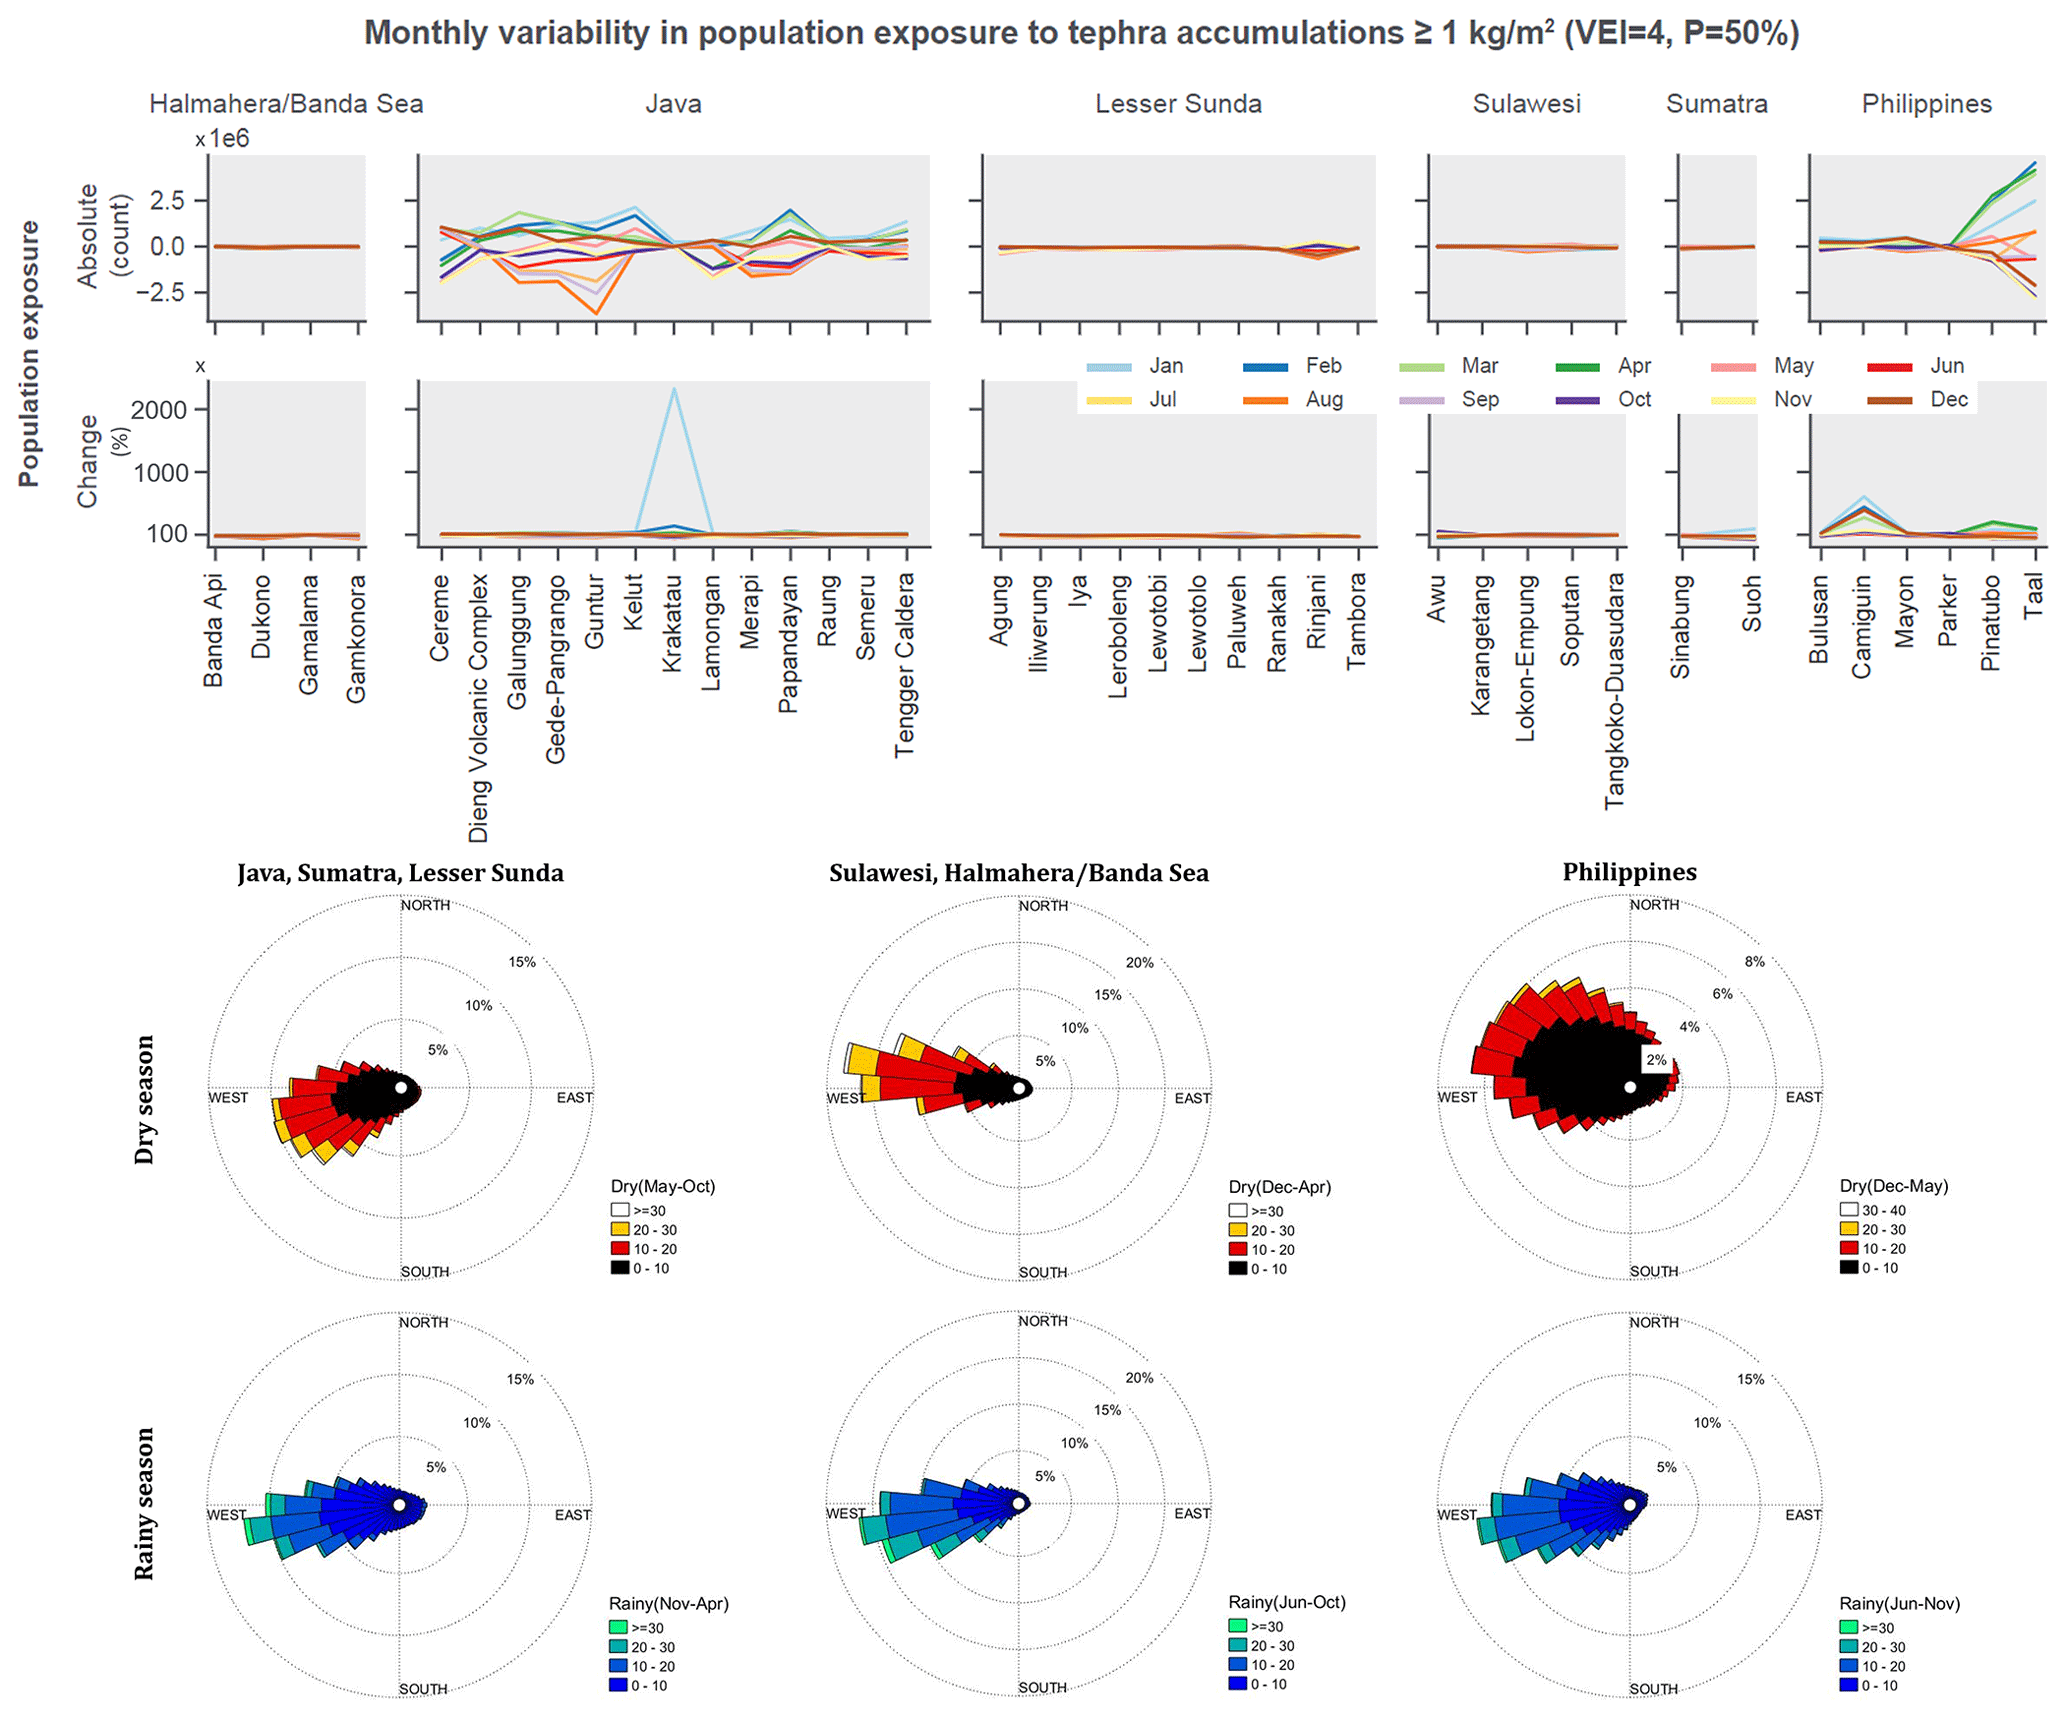
Figure 10Seasonality patterns in population exposure values (top row) and percent changes in population exposure (second row) from the 50% probability of ≥1 kg m−2 tephra fallout associated with a VEI 4 eruption. Values represent the difference in exposure value between the tephra hazard estimated from all 2880 hourly synoptic wind profiles across the whole 12 months of a year (normalised to the 0, or 100 %, line) and a subset of this total population of wind profiles extracted per month, in which each line represents a different month. A value lower than zero or 100 % represents a decreased exposure in that month and a value greater than zero or 100 % the opposite. Averaged wind conditions for the dry and rainy seasons for the three main climatic regions are shown in the next rows for altitudes of 5 to 15 km a.s.l. (above sea level).
Three dominant climatic regions exist across our study area (Aldrian and Dwi Susanto, 2003): (i) Sumatra, Java, and Lesser Sunda; (ii) Sulawesi and Halmahera/Banda Sea; and (iii) the Philippines. Population exposure values for tephra fall from our study volcanoes in Java generally increase during the peak rainy season (January, February) and decrease during the peak dry season (July, August, September). For the Philippines, the reverse is true with larger population exposure during the dry season (January through April). Across all study volcanoes, the percent changes to population exposure estimates as a result of seasonal variability are typically positive and within 150 % of the whole-year estimate across Indonesia (with the notable exception of Krakatau) but up to 600 % in the Philippines, with Camiguin and Pinatubo showing the largest percent changes (Fig. 10).
Three volcanoes in the region best illustrate changes in population exposure as a function of the month of the eruption. Firstly, an eruption at Krakatau volcano in January leads to a relatively drastic increase in population exposure compared to the rest of the year. Considering a VEI 4 eruption and a 50 % exceedance probability of occurrence, an eruption in January leaves ∼270 000 people exposed to an accumulation ≥ 1 kg m−2 compared to ∼11 000 (a 2350 % increase) when all months are aggregated. Population exposure throughout the year at Krakatau is typically low relative to the other volcanoes in our study as winds predominantly disperse tephra towards the west and over the sea. Wind conditions below ∼15 km in January blow mostly to the north or west-southwest, reducing the westward extent of the ≥1 kg m−2 isopach and extending it eastwards, affecting human settlements on the western parts of Java. A similar behaviour is observed at Guntur volcano; although the dominant wind direction is towards the southwest, winds during the rainy months (December–April) also display dispersal towards the north and the east, which increase the probability of Bandung (9 million people, northwest of Guntur) and Garut (100 000 people, southeast of Guntur) being affected by ≥1 kg m−2 of tephra, leading to a small percent increase from the whole-year value but a large number of people exposed. Finally, winds at Taal volcano show a strong northward component around the tropopause (∼8 to 15 km) during the peak dry season (e.g. January) compared to the rest of the year when winds at this height mostly blow towards the west. As a result, eruptions during the month of January increase the probability of tephra deposits affecting Metro Manila, as demonstrated by Taal's January 2020 eruption.
The multi-hazard and multi-exposure analysis presented here allows us to rank all 40 volcanoes according to their exposure to the four volcanic hazards simulated here (Fig. 11). The ranking is performed separately for each hazard and exposure type and simply reflects the relative rank of the computed exposure in decreasing order. Separate rankings are presented per VEI scenario, providing 55 “conditional” (i.e. conditional to the occurrence of the eruption scenario) estimates and 15 “absolute” scale (i.e. accounting for the probability of occurrence of the eruption scenarios; Sect. 3.2) insights for each volcano. Aggregated results are shown here for each hazard separately (Figs. 12 through 15), with individual volcano results provided in (3) in the “Data availability” section.
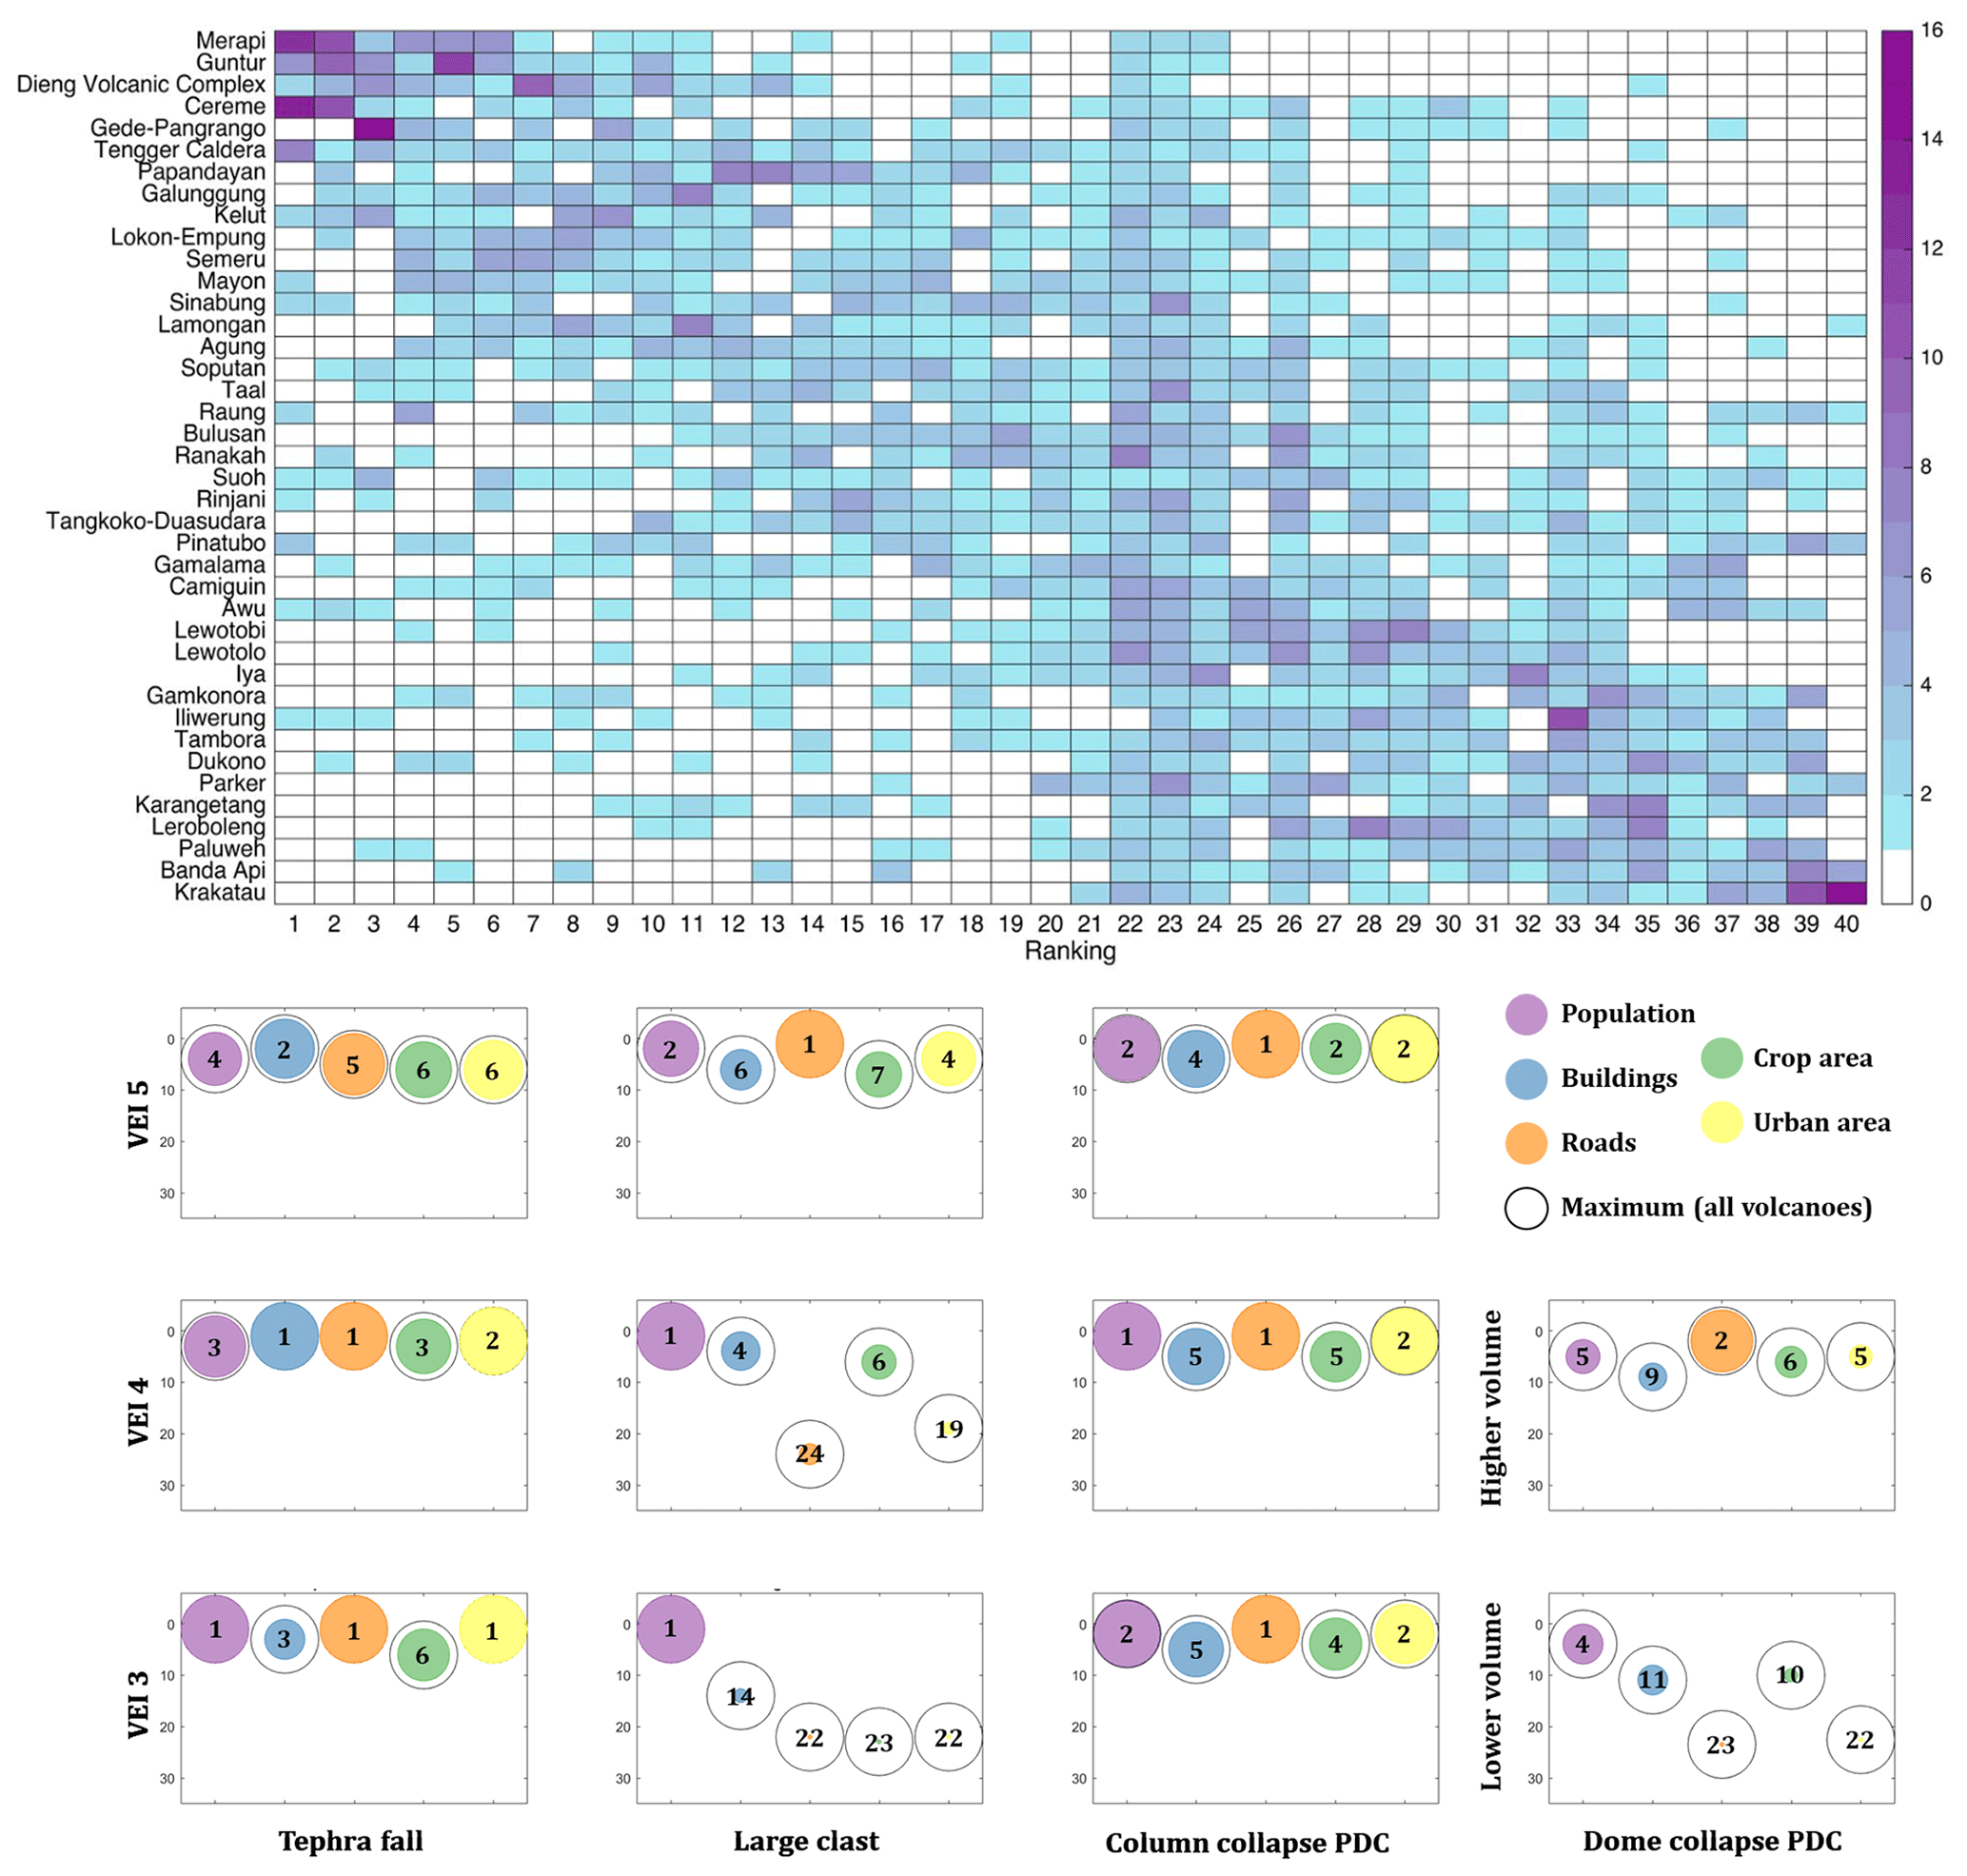
Figure 11Upper panel: heat map to show the number of times (cell colour) that a certain rank (x axis) is assigned for each volcano (y axis) for the 55 ranking permutations across hazard, VEI/volume, and exposure; lower panels: individual ranks and exposure estimates for our highest overall ranked volcano, Merapi. The y axis and text numbers show the rank for each combination of hazard (columns), VEI or volume (rows), and exposure (colour), with the size of the circle reflecting the exposure values normalised to the largest value for that combination from any of our 40 study volcanoes; the black circle represents this largest value. For example, for a VEI 3 tephra fall from Merapi, while buildings rank higher (3) than crop area (6), the exposure value for crop area is closer to the maximum calculated across all of our volcanoes than it is for buildings.
The five volcanoes that rank the highest overall (Merapi, Guntur, Dieng, Cereme, Gede–Pangrango; Fig. 11) include ranks that range between 1 and 38 (out of 40), showing the wide variability in exposure when multiple hazards, scenarios and exposure categories are considered. Raung, Suoh and Pinatubo exhibit ranks across the full range; for example, Pinatubo ranks as the volcano with the greatest exposure of crop areas to dome collapse PDCs and large clasts from a VEI 4 scenario and as the volcano with the smallest exposure of population to VEI 3 and 4 column collapse PDCs and VEI 5 large clasts, with other permutations falling between rank 4 and 39 (Fig. 11a).
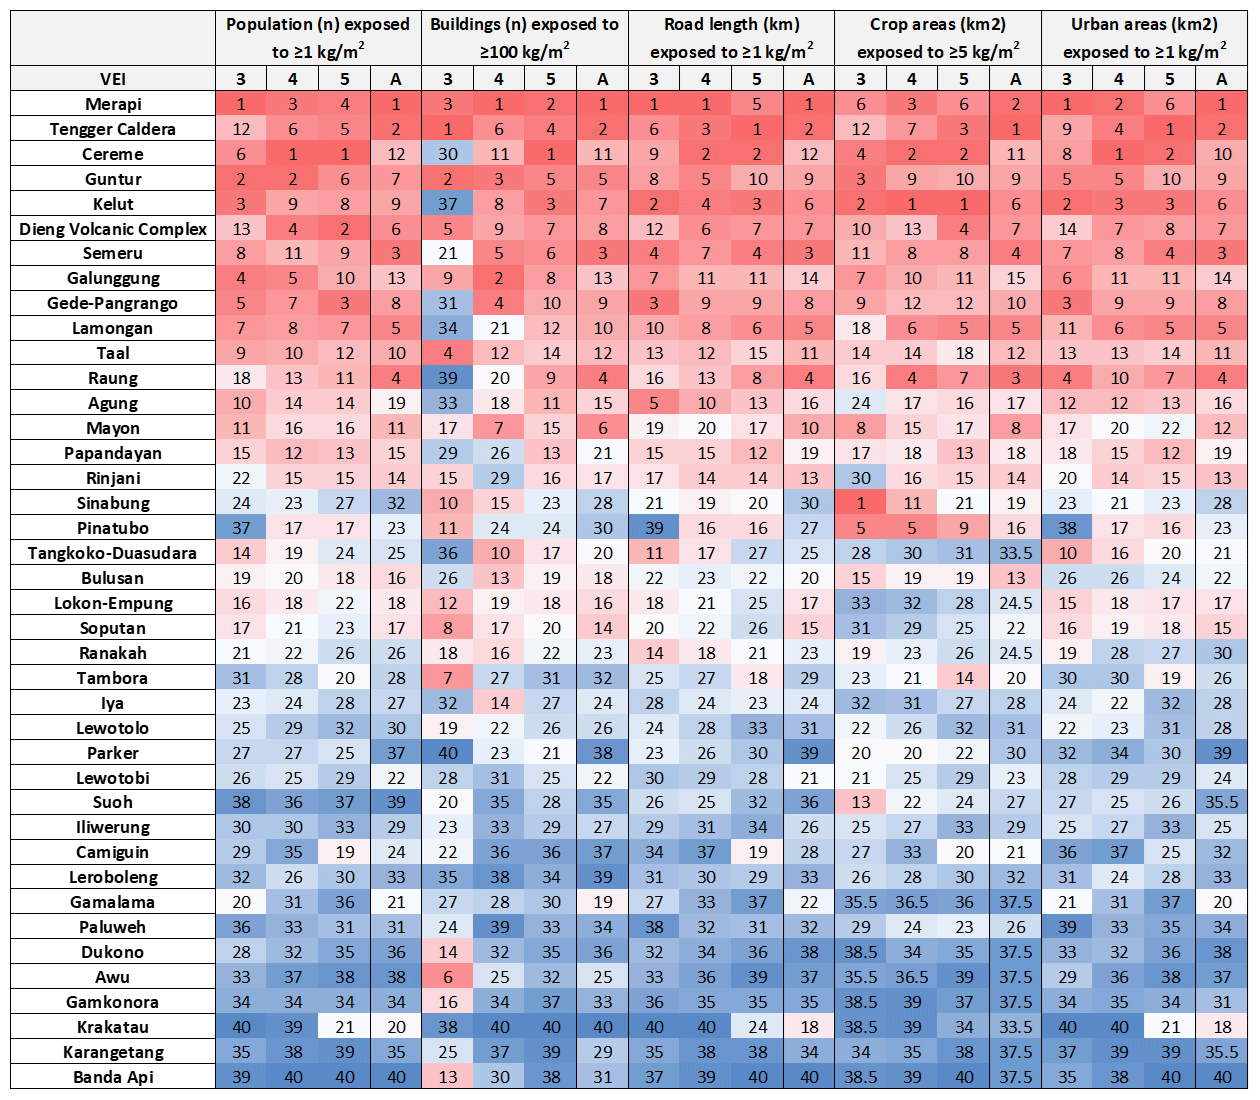
Figure 12Individual rankings for calculated exposure using the 50 % tephra fall hazard for all volcanoes across the five exposure categories. Columns “3”, “4” and “5” quantify the exposure to the conditional occurrence of VEI 3, 4 and 5 scenarios. Column “A” quantifies the absolute exposure using the sum of all scenarios, in which each scenario was weighted by its probability of occurrence. For each individual column, all volcanoes are attributed a rank between 1 and 40, where 1 is considered the highest (i.e. the largest exposure; dark red cells) and 40 the lowest (dark blue cells). Volcanoes are ordered from highest to lowest ranking across all conditional categories (equal weighting assumed). For instance, Raung volcano is the 11th ranked volcano for population exposure to ≥1 kg m−2 when considering a VEI 5 eruption (with the highest and lowest being Cereme and Banda Api, respectively) but is amongst the volcanoes with the lowest rank (39) for building exposure to 100 kg m−2 when considering a VEI 3 eruption.
Merapi is the only one of our 40 study volcanoes to remain within the top five ranked volcanoes for population exposure across all hazards, all VEI scenarios, and for both conditional probabilities and those incorporating eruption frequency (Fig. 11b; 3 in the “Data availability” section). For other exposure categories, Merapi remains within the top six of all volcanoes for the more distal tephra fall and column collapse PDC hazards. For the more proximal hazards of large clasts and dome collapse PDCs, there is large variation within the lower VEI and volume scenarios, while the higher VEI and volume scenarios all give ranks within the top nine. For example, building exposure to VEI 4 large clast and lower-volume dome collapse PDC scenarios gives ranks of 24 and 23, respectively, while the same exposure for VEI 5 large clast and upper-volume dome collapse PDC scenarios results in ranks of 1 and 2, respectively (Fig. 11b). This supports our earlier finding (Sect. 3.1) that large clasts and dome collapse PDCs are less likely to affect heavily populated areas unless the eruption is large, although exposure estimates are still higher than for most of our study volcanoes.
Gede–Pangrango, a stratovolcano ∼60 km to the south of Jakarta, ranks as having high population exposure when radii are assumed (Small and Naumann, 2001; Table 2). For the more distal hazards of relatively thin (≥1 or ≥5 kg m−2) tephra fall (Fig. 12) and column collapse PDC (Fig. 15a), this mostly holds true (ranked within the top 12 for all but building exposure to tephra falls ≥100 kg m−2 from a VEI 3 scenario, which is rank 31). For the more proximal large clast and dome collapse PDC hazards, Gede–Pangrango for the most part ranks relatively low for all exposure categories (14 to 37) with the exception of the VEI 5 large clast scenario (ranks 5 through 10). Large clasts typically fall within a 10 km radius for the VEI 5 scenario at Gede–Pangrango, meaning that they affect the outskirts of a number of towns, e.g. Cibodas to the northeast, and associated cropland that rises up in the valleys between the towns and the volcano (Fig. 4e). Ranks are generally lower for the absolute, rather than conditional, estimates, reflecting a relatively low eruption frequency compared to other case study volcanoes. These findings highlight that while Gede–Pangrango has previously been considered the volcano with the highest population exposure in the world (Table 2), this is not the case when likely hazard footprints and eruption probabilities are taken into account: while exposure remains high for the more distal hazards, for more proximal hazards, other volcanoes in our study pose a greater threat.
Closed-vent systems (sealed conduit), such as Gede–Pangrango, Guntur and Cereme, are more likely to produce large explosive eruptions (Bebbington, 2014), and these are exactly the volcanoes that we want to highlight with our approach: those that may be currently quiet but that have the potential to cause significant impact when they reawaken. This study provides a preliminary assessment of areas, populations and assets that may be affected in a future eruption from such volcanoes, highlighting hotspots where there could be a relatively large impact. Guntur is one such volcano as it lies ∼35 km southeast of the second largest metropolitan area in Indonesia, Bandung, and ∼10 km northwest of the town of Garut and hosts abundant crop areas on the plains around the volcano. Guntur is a complex of overlapping stratovolcanoes, with the youngest cone having produced frequent explosive eruptions (VEI 2–3) between 1800 and 1847 (n=21), making it one of the most active volcanoes in the study area during this time; however, there have been no eruptions since 1847 (Global Volcanism Program, 2013), suggesting that the eruptive regime has changed from that of an open-vent to a closed-vent system. Exposure around Guntur is particularly high for modelled dome collapse and column collapse PDCs and for VEI 5 large clast impact as hazard footprints reach the outskirts of Garut. For tephra fall, Guntur is ranked within the top 10 volcanoes for all exposure categories and VEI scenarios, with the rank typically decreasing with increasing VEI as volcanoes with larger distal downwind populations begin to dominate the rankings.
As we did not simulate all volcanic hazards, volcanoes at the lower end of the ranking cannot be assumed to pose low threat for all volcanic hazards. For example, Krakatau volcano ranks as our lowest-threat volcano (Fig. 11), but the 2018 tsunamigenic flank collapse, which killed more than 400 people (R. Williams et al., 2019), highlights the importance of considering other volcanic hazards and conducting volcano-specific field studies to determine a volcano's overall threat.
Overall, the consideration of eruption frequency into the rankings does not considerably change the overall trend across our volcanoes, scenarios, hazards or exposure categories (3 in the “Data availability” section). Disparity in rankings across the volcanoes is strongly driven by variability in location affected and thus exposure. There are nevertheless interesting case studies to be observed. Considering the population exposure to ≥1 kg m−2 of tephra fall (Fig. 12), Cereme ranks first when considering the conditional occurrence of eruptions of VEI ≥ 4 but ranks 12th when the absolute probabilistic hazard assessment is considered, i.e. when the probabilities associated with the three VEI scenarios are used to weight the exposure. In contrast, Raung volcano ranks between 11 and 18 when considering the conditional occurrence of VEI 3–5 separately but ranks 4th when considering absolute probabilities. These different behaviours lie in the eruptive histories of the individual volcanoes and the computation of the probabilities of occurrences for each VEI (Sect. 2.3). Raung is a more frequently erupting volcano, with 62 recorded eruptions since 1800, compared to just three at Cereme in the same time period. This translates into a higher annual probability of an explosive eruption for each VEI at Raung than Cereme, which considerably influences the exposure rankings for these two volcanoes. Although the occurrence of large eruptions at Cereme results in high exposure (Fig. 6), eruptions of VEI 3, 4 and 5 have annual probabilities of occurrence of 0.4 %, 0.2 % and 0.1 %, respectively. By contrast, simulated eruptions from Raung result in, on average, one third of the total exposure attributed to Cereme, but their annual probabilities are on average 1 order of magnitude higher (e.g. 3.6 %, 1.6 % and 0.6 % for VEI 3, 4 and 5, respectively). This observation highlights the benefits and pitfalls of conditional vs. absolute probabilistic hazard assessments, and their combined use and understanding are required to fully inform decision-making during various phases of volcanic crises.
As with any consistently applied regional approach to hazard or exposure assessment, there are limitations to using widely available data. We discuss these limitations in more detail over the next sections to highlight how our results may differ with further data and/or study.
5.1 Hazard approach
A regional approach to hazard simulation can omit local context (e.g. recent unrest crises) and data (e.g. unpublished eruption records) that could be included within a volcano-specific hazard assessment. By employing more generic inputs across all volcanoes, our results are relevant and comparable at a regional scale, but caution should be used in considering such assessments at the individual volcano scale. However, they do provide a solid foundation from which more detailed assessments can be applied. Specifically, the following factors could be improved in a local single volcano assessment.
-
By using global datasets for ESPs (e.g. GVP, VEI classification), datasets can be biased towards particular eruptions and more recent times.
-
We simulated with a continuous, rather than fixed, spectrum of ESPs for each VEI scenario. This is particularly important for capturing the larger exposure estimates as ESPs that represent the upper end of a VEI, while lower probability than the fixed ESPs we chose or those at the lower end of a VEI, are more likely to produce the larger footprints and thus the larger exposure values (Sandri et al., 2016).
-
Since we modelled hazard probabilistically across 40 volcanoes, we were constrained to using empirical models that do not fully capture the physical processes underpinning volcanic phenomena. This is an unavoidable consequence of the computational power required for physical models.
-
To constrain the scope of this study, other volcanic hazards such as lahars, lava, gases, volcanogenic tsunami and lightning were not included.
-
For tephra, we considered the hazard from both tephra fall and large clasts, and for PDC, we considered the hazard from both column collapse and dome collapse generation mechanisms. Not all volcanoes are likely to produce all hazard types, and we do not distinguish here; therefore overall rankings, i.e. the ordering of volcanoes in Figs. 12–15, may require further interpretation for certain volcanoes. However, individual values and rankings are still appropriate, and we provide all data so that the reader can choose certain assessments only if preferred.
-
Some of our case study volcanoes have produced PDCs that differ in their generation mechanism, and thus dynamics, from the dome and column collapse mechanisms simulated here. For example, the 2010 eruption of Merapi produced PDCs from boiling over, dome explosion/lateral blast, fountain collapse and dome collapse over the course of 11 d (Jenkins et al., 2016; Komorowski et al., 2013). In the case of repeated PDCs, our modelling does not capture modification of the subsurface topography or smoothness as a result of previous deposits, which would affect runout. Additionally, the use of the SRTM 2000 DEM for modelling could result in less reliable inundation areas where major topographic changes have occurred since its acquisition, although we did not observe this effect at Merapi (Fig. 4a and b).
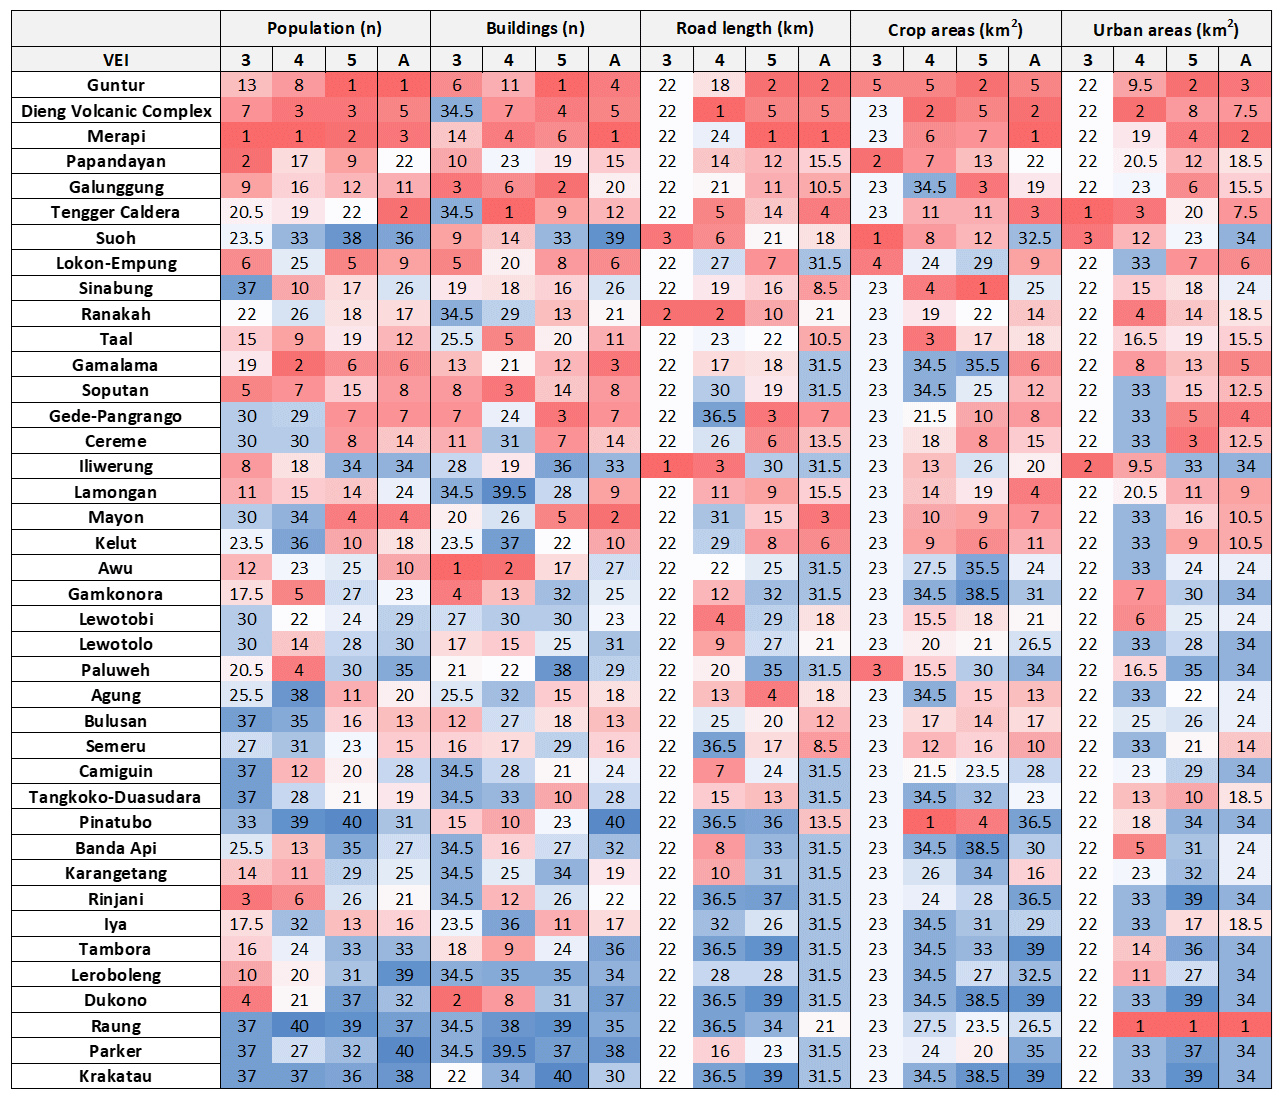
Figure 13Individual rankings for calculated exposure using the 50 % large clast hazard. Column names, volcano order and cell colour as for Fig. 12.
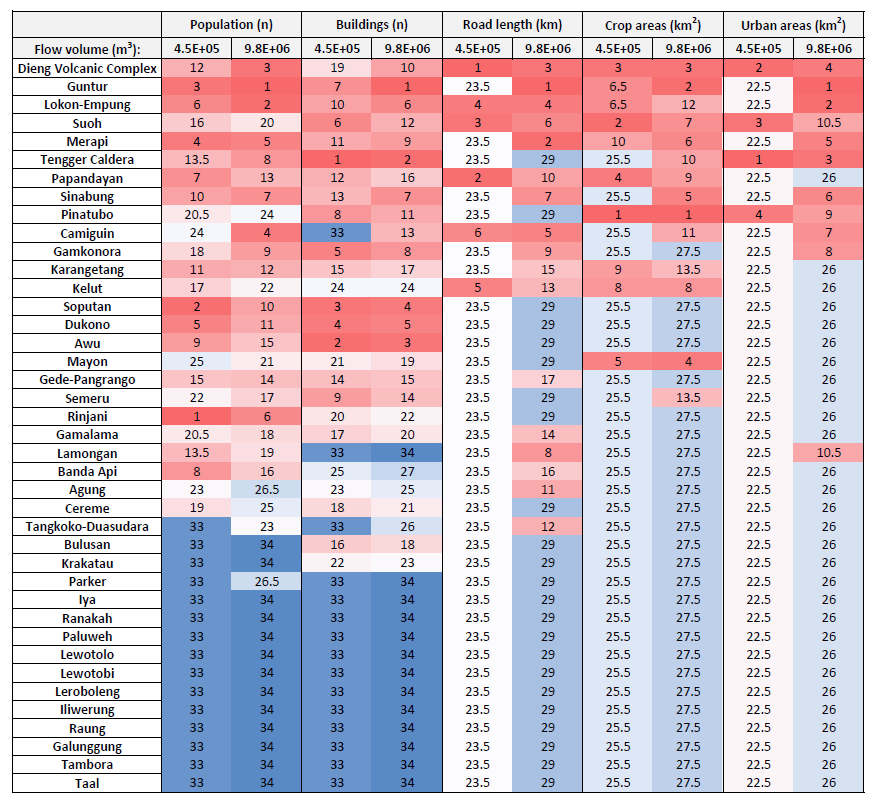
Figure 14Individual rankings for calculated population exposure for the 50 % dome collapse PDC hazard for all volcanoes across the five exposure categories. Exposure is provided for the smaller and larger volume scenarios using the 990 m buffer. Volcano order and cell colour same as for Fig. 12. Dome collapse PDCs are not VEI dependent, and so the absolute ranks are not calculated, and these results are therefore applicable to the conditional estimate.
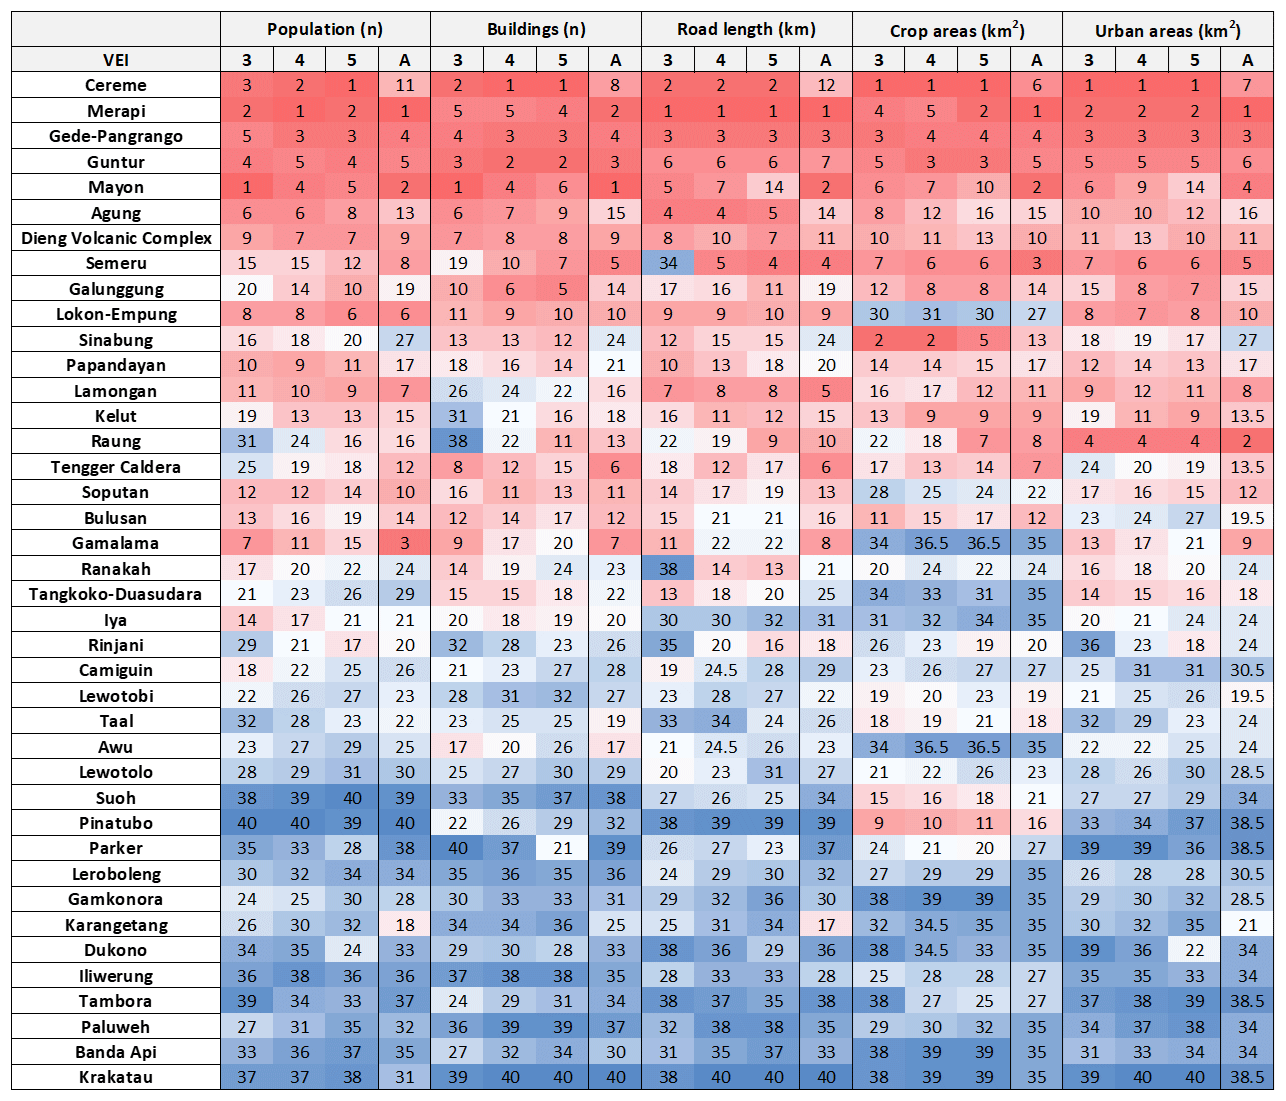
Figure 15Individual rankings for calculated exposure using the 50 % column collapse PDC hazard. Column names, volcano order and cell colour same as for Fig. 12.
5.2 Exposure data
The limitations and features of regionally applicable exposure data have been well detailed for our data sources (see references in Sect. 2.4), although the interpolation or extrapolation of our data to a consistent grid for calculation across different hazards and exposure categories inevitably meant that some resolution in data was lost. For example, we disaggregated the number of buildings and people within a grid cell and calculated exposure to a hazard as the proportion of each of our 90×90 m cells covered by the hazard so that any clustering of buildings at the original scale (∼1 km2 for people and 36 m2 for buildings) has been lost; we do not expect this to have a major effect on our overall results, but for detailed local inspection there may be some variation as a result. We also noticed a small number of irregularities in our building exposure results that unavoidably arose as a result of the dataset limitations, and we note them here; as with the interpolation, they do not have a major effect on results but would be worth investigating further if results are interpreted at the individual volcano scale.
-
The GHSL data used to spatially distribute buildings exhibit a 300 km long horizontal line through central Java that appears to overestimate built-up areas immediately to the south and underestimate built-up areas immediately to the north. This affects the distribution of our buildings, and the artefact comes within 30 km of several volcanoes in our analysis.
-
A second artefact in the GHSL is its interpretation of built-up areas using remote sensing. We found that in a small number of specific locations, bare rock areas such as riverbeds (e.g. to the northwest of Kelud) or volcanic craters (e.g. Gede–Pangrango) had been misinterpreted as built-up areas resulting in the disaggregation of buildings into areas where they are unlikely to exist.
With this study we have evaluated five categories of exposure to four volcanic hazards and three VEI scenarios to give probabilistic outputs for 40 high-threat volcanoes. Ranking was performed using both conditional probabilities, in which the exposure was conditional on the occurrence of the eruption scenario and absolute probabilities, which accounted for the probability of occurrence of the different eruption scenarios considered at each volcano. We explicitly list our simplifications and how different initial conditions were determined. This work expands significantly upon previous approaches to regional volcanic hazard and exposure assessment that considered concentric radii to reflect hazard extent and/or population exposure only. By probabilistically modelling multiple volcanic hazards and coupling them with open-access exposure data, our approach provides a consistent and transferable method for comparing hazard and exposure at a volcano and across multiple volcanoes, hazards and exposures. While the modelling provides valuable information that can act as a foundation to more detailed local assessments, especially for volcanoes that have limited or no hazard and exposure assessments already conducted, it is not intended to replace local assessments. Wherever possible, local context, data and knowledge should all be incorporated.
We found Merapi to pose the greatest threat when all hazards, exposures and VEI scenarios are considered with equal weighting. For a VEI 4 scenario, a ca. 1 in 100-year event at Merapi, approximately 7.8 million people, 210 000 buildings, 38 000 km of road, 930 km2 of crops and 1150 km2 of urban area have a 50 % probability of being affected by tephra fall accumulations ≥ 1 kg m−2. The threat that Merapi poses is well appreciated, and it is likely one of the most studied volcanoes in Indonesia. A key aim of our study was to highlight those volcanoes that may have been overlooked perhaps because they have not been frequently or recently active but that have the potential to affect large numbers of people and assets. Guntur volcano in Java fits that description well with comparable, and in some cases larger (e.g. Fig. 8), exposure than Merapi. Retnowati et al. (2018a) carried out a current and projected exposure estimate for concentric radii of lava flow and exponentially thinning tephra fall, extending it towards estimates of building damage and loss. A more detailed local hazard and risk assessment for Guntur would be of high value, especially as the volcano appears to be a closed system at present so that a future eruption may be larger than those experienced in the recent past.
The GIS framework developed for this work is modular with the code freely provided (https://github.com/vharg/VolcGIS, last access: 5 April 2022) so that future works can simply plug in updated or improved hazard or exposure data. For example, the key improvements that we anticipate will be most influential in improving our findings are as follows.
-
Field studies that improve our knowledge of the past behaviour at volcanoes in the region, and their likely ESPs, will help us refine our model outputs. The rankings provided by this method can support the prioritisation of the volcanoes on which risk reduction activities should be focussed.
-
The incorporation of more sophisticated hazard models can better describe the physical processes underpinning volcanic hazards; such models also require greater data and computing resources, which will hopefully improve over time.
-
The open-access data underpinning our hazard and exposure assessment, e.g. DEMs and OpenStreetMap, are expected to improve in quality and resolution going forward, and these can be used within the framework to provide updated, higher-resolution outputs.
-
For a robust and evidence-based method for aggregating exposure scores across multiple hazard and exposure categories, potentially multiple different aggregations are needed to cover diverse aspects such as life safety, loss of livelihoods or economic impacts.
We also identify further areas for study that could widen the assessment provided here.
-
The assessment should be extended to include all hazardous volcanic phenomena and all relevant exposure categories. These likely vary on a volcano-by-volcano basis; e.g. volcanogenic tsunami will not be applicable to all volcanoes nor will the exposure of fish farms.
-
This study is limited to the quantification of the exposure of populations and their assets to a range of volcanic hazards. Future efforts should contribute to the development of applicable – rather than theoretical – models to quantify critical aspects of vulnerability which, when incorporated into such GIS frameworks as the one proposed here, will allow measures of impact and risk to be estimates as a function of the spatial distribution of hazard intensities and exposed assets.
-
Efforts to better constrain the relationship between hazard intensity and impact have dominantly focused on the hazard caused by tephra fallout. In parallel, the impact of other hazards is often oversimplified. For instance, our method considers a binary impact from PDCs in which inundation implies impact. Recent studies have demonstrated that this assumption has been disproved by field observations (Jenkins et al., 2013; Lerner et al., 2022). Shifting from probabilistically estimating exposure to impact for flows requires advances in two directions. Firstly, there is a need for flow models compatible with probabilistic approaches that predict not only a binary inundation but also some measure of impact intensity metrics (e.g. flow depth, dynamic pressure) whilst requiring ESPs that can realistically be estimated for purposes of hazard assessments. We acknowledge that the complexity of the physical processes governing such flows makes this task challenging. Secondly, more research should be dedicated to investigate how, when and why flows can affect populations and their assets. Again, the diversity of flows (e.g. dense vs. dilute components for PDC) makes this task complex, but post-event impact assessments and experimental and theoretical studies all contribute to establishing the baseline for better vulnerability and impact models.
-
Finally, volcanic risk is intrinsically dynamic. On the one hand, hazards can interact in a nonlinear fashion. For instance, forecasting lahar triggering is challenging as it depends on the properties of the fresh pyroclastic deposit, the topography, and the rainfall magnitude and intensity. Similarly, large clasts can perforate roofs, but the presence of tephra might cushion the impact and reduce this hazard (G. T. Williams et al., 2019). On the other hand, exposure and vulnerability also vary in space and time. For instance, the risk to the tourist hikers in Southeast Asia varies as a function of the day and the season, exposing populations from various cultures and awareness of volcanic hazards. Here, we have explored the variability in population exposure as a function of hazard seasonality, and the proposed framework could also be applied to estimate the changes in exposure using yearly datasets of land cover and population. Future efforts should therefore aim at modelling the impact and risk from volcanic eruptions as a dynamic rather than static process.
Table A1Model input parameters and their rationale used for simulating tephra dispersion and fallout.
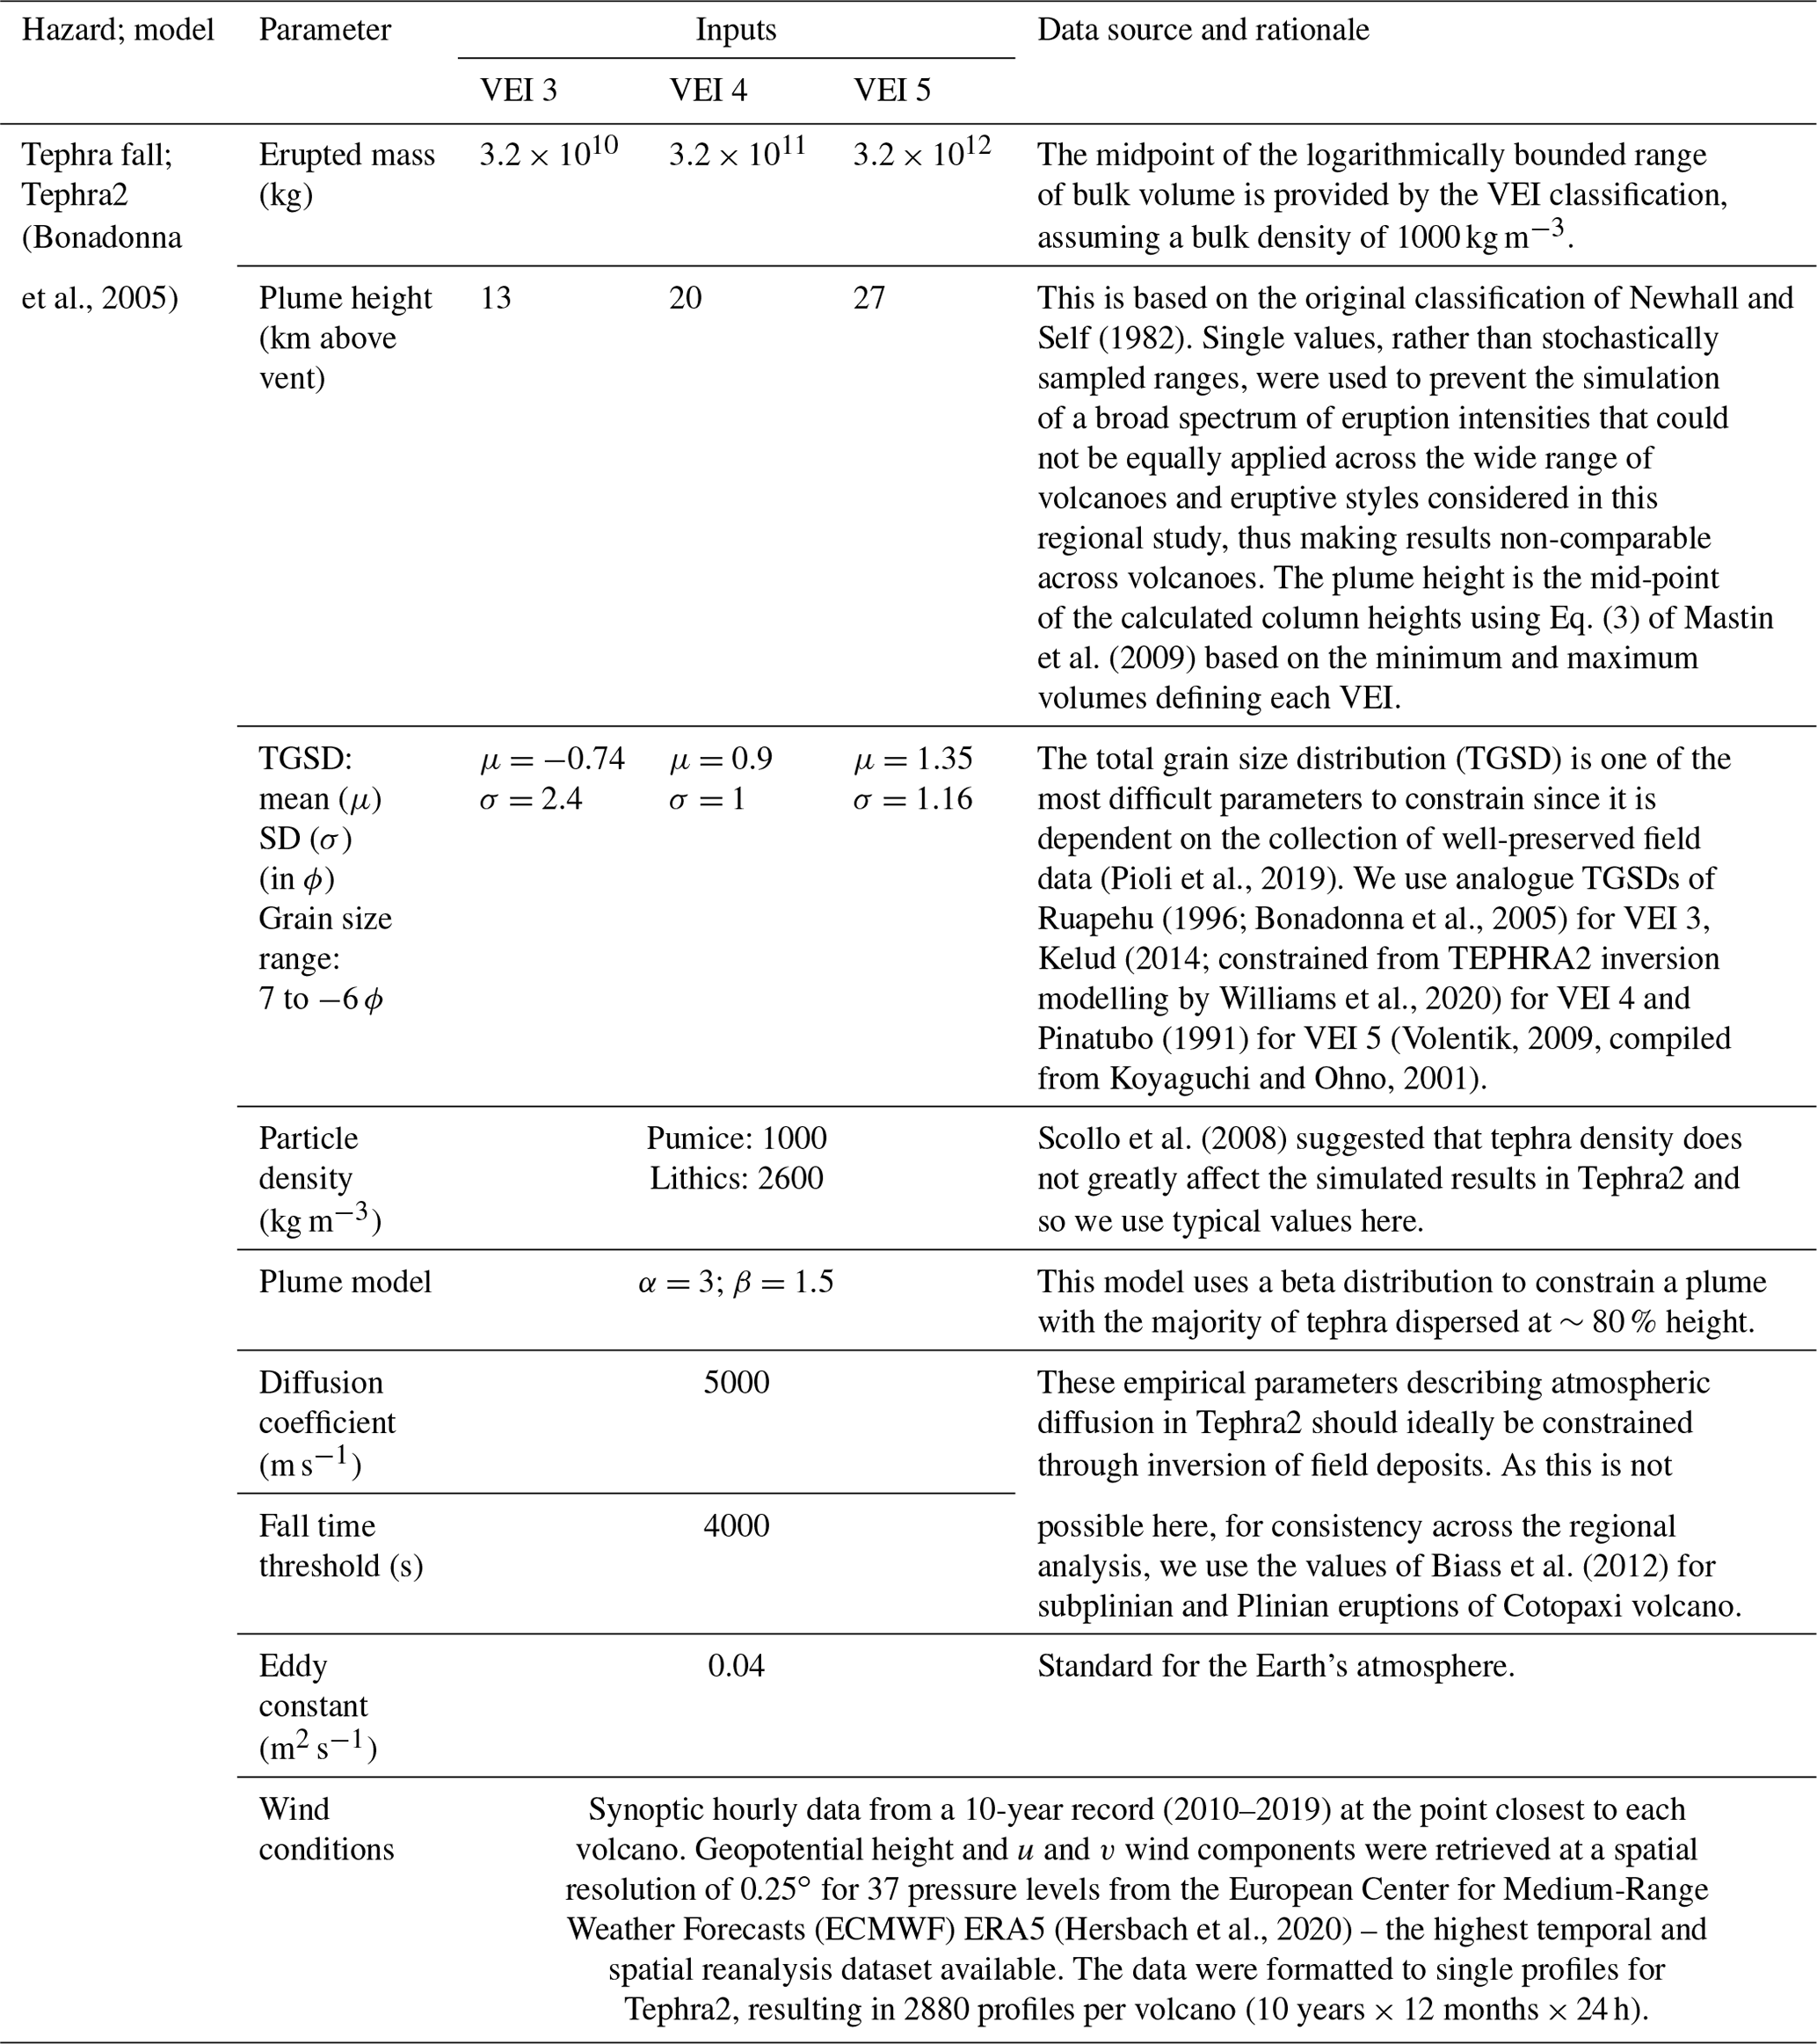
Table A2Model input parameters and their rationale used for simulating large clast emplacement.
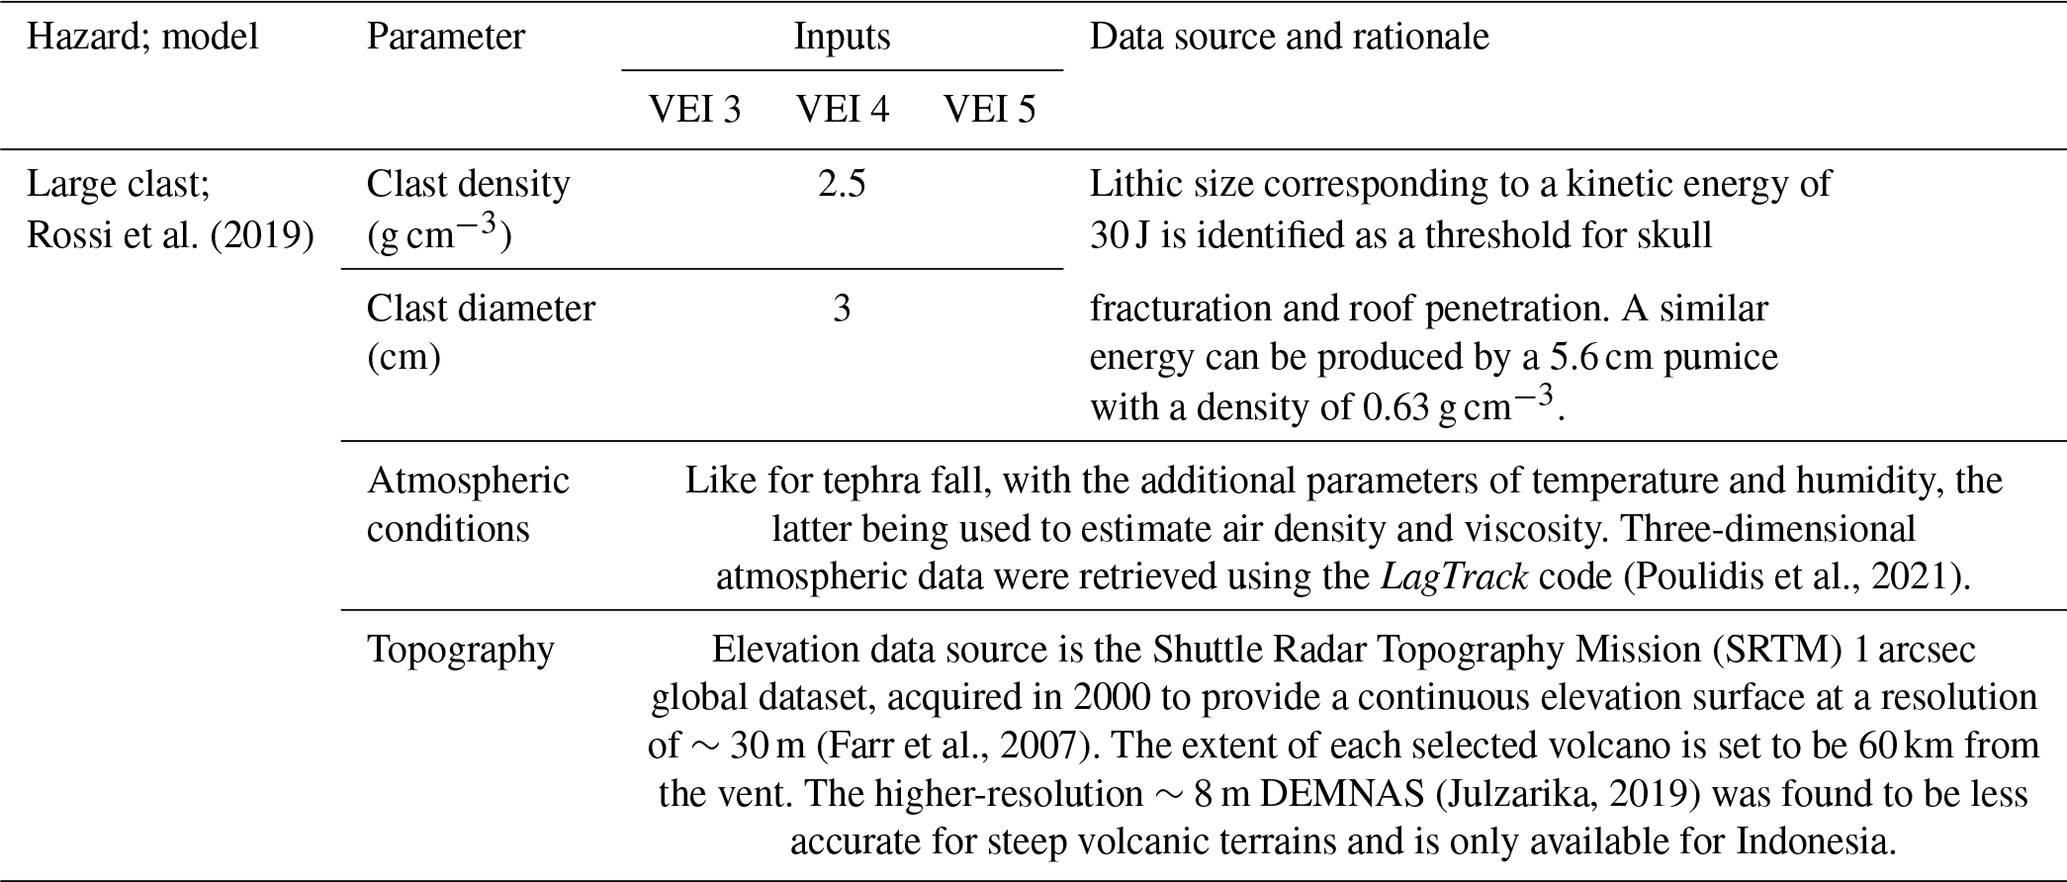
Table A3Model input parameters and their rationale used for simulating dome collapse PDCs.
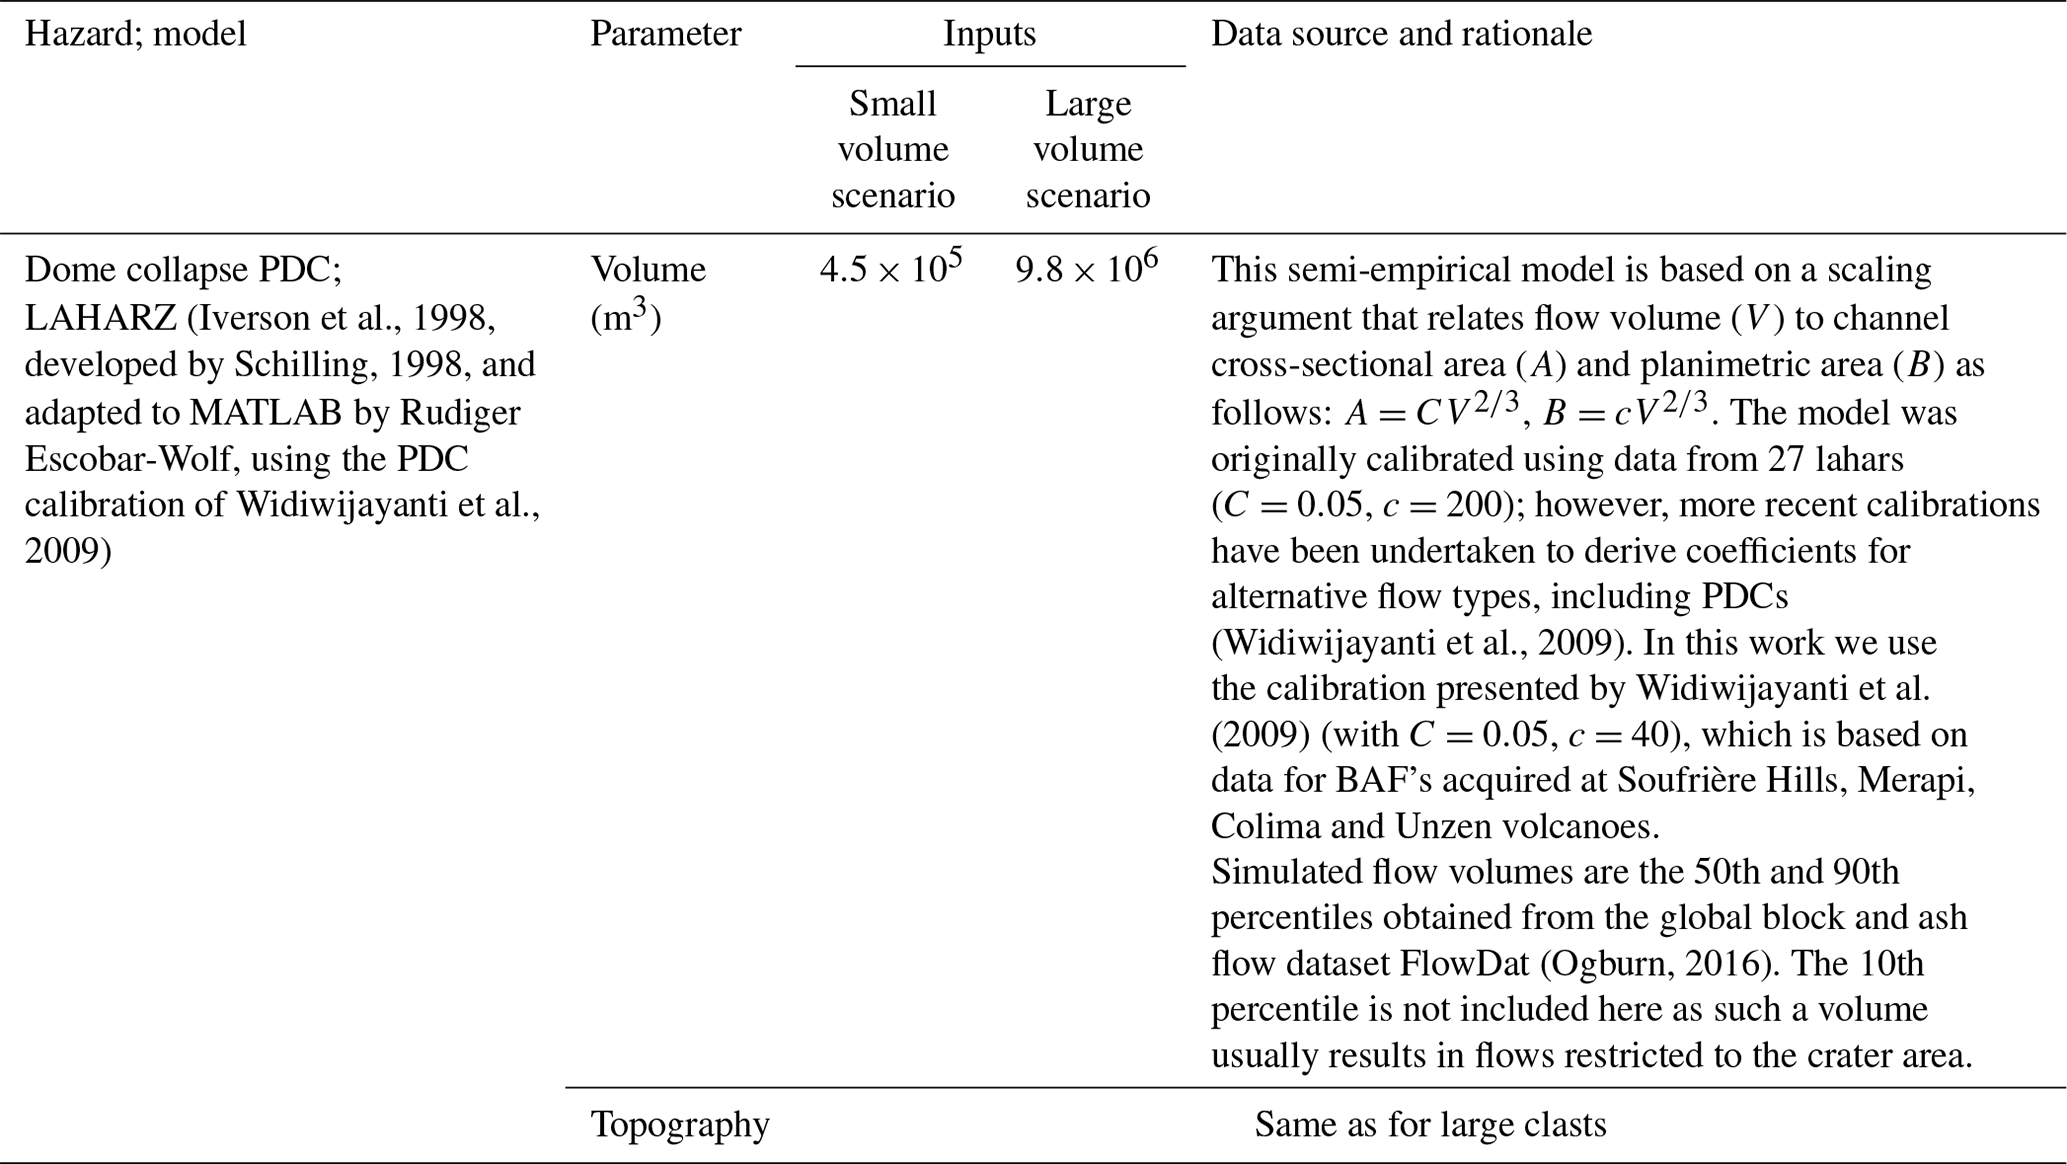
Table A4Model input parameters and their rationale used for simulating column collapse PDCs.

A MATLAB-implemented methodology was developed to rapidly analyse a volcano's summit topography, using this to assign probabilities to the travel directions of future effusive flows (here applied to dome collapse PDCs). Inputs to the code include a DEM, coordinates of the crater centre, the radius of the crater or summit region and the swath length. The swath length is the entire length from the start point over which topography is considered in the calculation; it should extend outside of the crater or summit region and include any localised topographic highs. For this study we have used the “summit width” parameter obtained from the global database of composite volcano morphology (Grosse et al., 2014) to identify swath lengths, with the addition of a 20 % buffer to ensure the full summit topography was included in the calculation. For volcanoes not present in the database, a default length of 1500 m is used. The procedure is as follows.
-
Upon acquisition of the swath length, 360 swath profiles (SW1:360) (each with a width of 50 m) are created radiating from the starting coordinate to the full swath length. Each swath consists of n cells from start to the full length (see Fig. B1).
-
At each cell along the length of the swath, elevation values (E) are compared with elevation values in the total population of swaths at position n by computing percentiles (P). In Fig. B1 cell populations are denoted by colour; for example, all E1 values are considered a population, as are all E2 … En. In this way elevation is analysed at each radial distance step from the start point to the full swath length. Elevation values E1:n are transformed into P1:n such that (Eq. B1)
-
Percentiles are summed down-swath to get a final (V) value that can be considered a proxy for the elevation. Values are inverted and interpolated to 10∘ intervals such that high (V) values are the more likely flow directions (Eq. B2):
-
To estimate probabilities (Pr) for each swath, we calculate the following (Eq. B3):
-
The tool outputs a table featuring thirty-six 10∘ azimuth bins, their associated probabilities and the XY coordinates for each start point. In this work output coordinates were fed into the dome collapse PDC-calibrated LAHARZ, and dome collapse PDCs were simulated in all directions. Binary LAHARZ output hazard footprints were multiplied by their travel direction probability and aggregated to produce a final conditional dome collapse PDC probability raster that quantifies both the probability of travel direction and the probability of inundation at each grid cell.
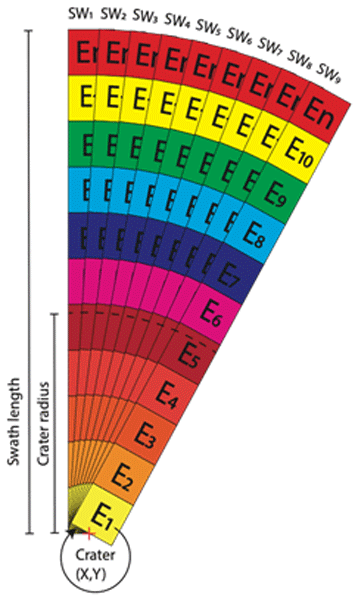
Figure B1A graphical representation of the methodology used to quantify dome collapse PDC travel direction probabilities. Radial swaths (SWi) are initiated from the crater start point (X,Y). For each distance step from the start to the full swath length, populations of elevation values Ei (represented by cells of the same colour) are compared and the percentile calculated.
The open-source Python code, VolcGIS, which implements all of the spatial operations required for our exposure analyses is freely available at https://doi.org/10.5281/zenodo.6416793 (Biass et al., 2022).
All hazard and exposure data, and associated format descriptions, are provided in user-friendly format and openly available at the NTU research data repository DR-NTU (Data), via the links below:
-
Hazard model outputs: https://doi.org/10.21979/N9/B80UMQ (Jenkins et al., 2022a);
-
Eruption frequency–magnitude estimates: https://doi.org/10.21979/N9/CGKS6C (Jenkins et al., 2022b);
-
Exposure results: https://doi.org/10.21979/N9/OUJPZQ (Jenkins et al., 2022c).
SFJ and SB conceived the project, co-ordinated group activities and oversaw hazard modelling. SFJ processed and analysed wind data and drafted the final manuscript. SB modelled large clast hazard, developed and wrote the GIS framework, and performed the exposure analysis. GTW carried out the building exposure modelling. JLH carried out the road exposure modelling and calculated frequency–magnitude relationships. EMT developed the dome collapse PDC travel directions methodology (Appendix B) and modelled dome collapse PDCs. QY modelled tephra fall hazard. VB performed the analysis for volcano selection. ESM carried out the population exposure analysis and calculating PEI. GAL modelled column collapse PDCs. MS retrieved and preprocessed all DEMs. AV developed key figures. All authors contributed to concept development and writing, reviewing and editing the manuscript.
The contact author has declared that neither they nor their co-authors have any competing interests.
Publisher' note: Copernicus Publications remains neutral with regard to jurisdictional claims in published maps and institutional affiliations.
The information set out in this publication reflect the author's views.
We are grateful to Laura Sandri and an anonymous reviewer for their thoughtful and constructive comments which improved the manuscript and to Giovanni Macedonio for his editorial handling of the manuscript. We would like to thank Eduardo Rossi for his support in implementing the large clast model, Álvaro Aravena Ponce for his support with ECMapProb and Rudiger Escobar-Wolf for providing the MATLAB implementation of LAHARZ. We are also indebted to Edwin Tan for his unending support in the use of the ASE/EOS High-Performance Computing Cluster, Gekko. The globally disruptive driver of this study was COVID-19 and the resulting lockdown(s), which spurred the need to come together (remotely) and work on a common research project.
This research was supported by the Earth Observatory of Singapore via its funding from the National Research Foundation Singapore and the Singapore Ministry of Education under the Research Centres of Excellence initiative and comprises EOS contribution number 412. Support was provided to Susanna F. Jenkins and Josh L. Hayes by the AXA Research Fund as part of a Joint Research Initiative on Volcanic Risk in Asia and to Susanna F. Jenkins, Qingyuan Yang and Geoffrey A. Lerner by Singapore's National Research Foundation (project number: NRF2018NRF-NSFC003ES-010).
This paper was edited by Giovanni Macedonio and reviewed by Laura Sandri and one anonymous referee.
Aldrian, E. and Dwi Susanto, R.: Identification of three dominant rainfall regions within Indonesia and their relationship to sea surface temperature, Int. J. Climatol., 23, 1435–1452, 2003.
Aravena, A., Cioni, R., Bevilacqua, A., de' Michieli Vitturi, M., Esposti Ongaro, T., and Neri, A.: Tree-branching-based enhancement of kinetic energy models for reproducing channelization processes of pyroclastic density currents, J. Geophys. Res.-Solid, 125, e2019JB019271, https://doi.org/10.1029/2019JB019271, 2020.
Aspinall, W. P., Auker, M. R., Hincks, T. K., Mahony, S. H., Pooley, J., Nadim, F., Syre, E., Sparks, R. S. J., and Bank, T. W.: Volcano Hazard and Exposure in Track II Countries and Risk Mitigation Measures – GFDRR Volcano Risk Study, The World Bank, 309 pp., 2011.
Auker, M., Sparks, R., Siebert, L., Crosweller, H., and Ewert, J.: A statistical analysis of the global historical volcanic fatalities record, J. Appl. Volcanol., 2, 1–24, 2013.
Auker, M. R., Sparks, R. S. J., Jenkins, S. F., Aspinall, W. P., Brown, S. K., Deligne, N. I., Jolly, G., Loughlin, S. C., Marzocchi, W., Newhall, C. G., and Palma, J. L.: Development of a new global Volcanic Hazard Index (VHI), in: Global Volcanic Hazards and Risk, edited by: Loughlin, S. C., Sparks, R. S. J., Brown, S. K., Jenkins, S. F., and Vye-Brown, C., Cambridge University Press, Cambridge, UK, https://www.cambridge.org/de/academic/subjects/earth-and-environmental-science/mineralogy-petrology-and-volcanology/global-volcanic-hazards-and-risk?format=HB&isbn=9781107111752 (last access: 6 April 2022), 2015.
Bebbington, M.: Long-term forecasting of volcanic explosivity, Geophys. J. Int., 197, 1500–1515, 2014.
Biass, S., Frischknecht, C., and Bonadonna, C.: A fast GIS-based risk assessment for tephra fallout: the example of Cotopaxi volcano, Ecuador – Part II: vulnerability and risk assessment, Nat. Hazards, 64, 615–639, 2012.
Biass, S., Scaini, C., Bonadonna, C., Folch, A., Smith, K., and Höskuldsson, A.: A multi-scale risk assessment for tephra fallout and airborne concentration from multiple Icelandic volcanoes – Part 1: Hazard assessment, Nat. Hazards Earth Syst. Sci., 14, 2265–2287, https://doi.org/10.5194/nhess-14-2265-2014, 2014.
Biass, S., Williams, G., Hayes, J., and Rui, J.: vharg/VolcGIS: VolcGIS (v1.0), Zenodo [code], https://doi.org/10.5281/zenodo.6416793, 2022.
Blong, R. J.: Volcanic hazards: a sourcebook on the effects of eruptions, Academic Press Australia, 424 pp., https://books.google.co.uk/books?hl=en&lr=&id=6kjgBAAAQBAJ&oi=fnd&pg=PP1&dq=blong+1984+sourcebook:&ots=ecdH9sE_YT&sig=ld0_EKlyRwhTQ0IGjsxveRivmA8#v=onepage&q=blong 1984 sourcebook:&f=false (last access: 6 April 2022), 1984.
Bonadonna, C., Connor, C. B., Houghton, B. F., Connor, L., Byrne, M., Laing, A., and Hincks, T. K.: Probabilistic modeling of tephra dispersal: Hazard assessment of a multiphase rhyolitic eruption at Tarawera, New Zealand, J. Geophys. Res., 110, 1–21, 2005.
Brown, R., Bonadonna, C., and Durant, A.: A review of volcanic ash aggregation, Phys. Chem. Earth Pt. A/B/C, 45, 65–78, 2012.
Brown, S. K., Auker, M. R., and Sparks, R. S. J.: Populations around Holocene volcanoes and development of a Population Exposure Index. Chapter 4, in: Global Volcanic Hazards and Risk, edited by: Loughlin, S. C., Sparks, R. S. J., Brown, S. K., Jenkins, S. F., and Vye-Brown, C., Cambridge University Press, Cambridge, UK, https://www.cambridge.org/de/academic/subjects/earth-and-environmental-science/mineralogy-petrology-and-volcanology/global-volcanic-hazards-and-risk?format=HB&isbn=9781107111752 (last access: 6 April 2022), 2015a.
Brown, S. K., Sparks, R., and Jenkins, S.: Global distribution of volcanic threat, Global Volcanic Hazards and Risk, Cambridge University Press, Cambridge, 349–358, https://doi.org/10.1017/CBO9781316276273.025, 2015b.
Brown, S. K., Jenkins, S. F., Sparks, R. S. J., Odbert, H., and Auker, M. R.: Volcanic fatalities database: analysis of volcanic threat with distance and victim classification, J. Appl. Volcanol., 6, 15, https://doi.org/10.1186/s13617-017-0067-4, 2017.
Buchhorn, M., Smets, B., Bertels, L., De Roo, B., Lesiv, M., Tsendbazar, N.-E., Herold, M., and Fritz, S.: Copernicus Global Land Service: Land Cover 100 m: Collection 3 Epoch 2015, Globe, Version V3. 0.1, Zenodo [data set], https://doi.org/10.5281/zenodo.3518038, 2020.
Camejo, M. and Robertson, R.: Estimating Volcanic Risk in the Lesser Antilles, SRC Open File Report 2013-1001, The University of the West Indies Seismic Research Centre, https://vhub.org/resources/2909 (last access: 6 April 2022), 2013.
Charbonnier, S. J. and Gertisser, R.: Field observations and surface characteristics of pristine block-and-ash flow deposits from the 2006 eruption of Merapi Volcano, Java, Indonesia, J. Volcanol. Geoth. Res., 177, 971–982, https://doi.org/10.1016/j.jvolgeores.2008.07.008, 2008.
Cole, P. D., Neri, A., and Baxter, P. J.: Hazards from pyroclastic density currents, in: The encyclopedia of volcanoes, Elsevier, 943–956, ISBN 978-0-12-385938-9, 2015.
De Maisonneuve, C. B. and Bergal-Kuvikas, O.: Timing, magnitude and geochemistry of major Southeast Asian volcanic eruptions: identifying tephrochronologic markers, J. Quaternary Sci., 35, 272–287, https://doi.org/10.1002/jqs.3181, 2020.
Dilley, M., Chen, R. S., Deichmann, U., Lerner-Lam, A. L., and Arnold, M.: Natural disaster hotspots: a global risk analysis, The World Bank Hazard Management Unit, 132 pp., https://openknowledge.worldbank.org/handle/10986/7376 License: CC BY 3.0 IGO (last access: 6 April 2022), 2005.
Ewert, J. W.: System for ranking relative threats of U.S. volcanoes, Nat. Hazards Rev., 8, 112–124, 2007.
Ewert, J. W., Diefenbach, A. K., and Ramsey, D. W.: 2018 update to the US Geological Survey national volcanic threat assessment, US Geological Survey 2328-0328, US Geological Survey, https://doi.org/10.3133/sir20185140, 2018.
Farr, T. G., Rosen, P. A., Caro, E., Crippen, R., Duren, R., Hensley, S., Kobrick, M., Paller, M., Rodriguez, E., and Roth, L.: The shuttle radar topography mission, Rev. Geophys., 45, RG2004, https://doi.org/10.1029/2005RG000183, 2007.
Freire, S., Florczyk, A. J., Pesaresi, M., and Sliuzas, R.: An Improved Global Analysis of Population Distribution in Proximity to Active Volcanoes, 1975–2015, ISPRS Int. J. Geo-Inform., 8, 341, https://doi.org/10.3390/ijgi8080341, 2019.
Global Volcanism Program: Report on Mayon (Philippines), in: Weekly Volcanic Activity Report, 6 June–12 June 2001, edited by: Mayberry, G., Smithsonian Institution and US Geological Survey, https://volcano.si.edu/showreport.cfm?doi=GVP.WVAR20010606-273030 (last access: 6 April 2022), 2001.
Global Volcanism Program: Volcanoes of the World, v. 4.8.6 (February 2020), edited by: Venzke, E., Smithsonian Institution, https://doi.org/10.5479/si.GVP.VOTW4-2013, 2013.
Global Volcanism Program: Report on Sinabung (Indonesia), in: Weekly Volcanic Activity Report, 1 January–7 January 2014, edited by: Sennert, S. K., Smithsonian Institution and US Geological Survey, 2014.
Grosse, P., Euillades, P. A., Euillades, L. D., and van Wyk de Vries, B.: A global database of composite volcano morphometry, Bull. Volcanol., 76, 1–16, 2014.
Hayes, J. L., Jenkins, S. F., and Joffrey, M.: Evaluating uncertainty in long-term frequency-magnitude relationships for volcanoes in Southeast Asia, Front. Geohazard. Georisk., in revision, 2022a.
Hayes, J. L., Biass, S., Jenkins, S. F., Meredith, E. S., and Williams, G. T.: Integrating criticality concepts into road network disruption exposure assessments, J. Appl. Volcanol., in review, 2022b.
Hersbach, H., Bell, B., Berrisford, P., Hirahara, S., Horányi, A., Muñoz-Sabater, J., Nicolas, J., Peubey, C., Radu, R., and Schepers, D.: The ERA5 global reanalysis, Q. J. Roy. Meteorol. Soc., 146, 1999–2049, 2020.
Hoblitt, R. P., Miller, C. D., and Scott, W. E.: Volcano hazards with regard to siting nuclear power-plants in the Pacific Northwest, United States Geological Survey Open-File Report 87-297, United States Geological Survey, 98–428, https://doi.org/10.3133/ofr87297, 1987.
Hurst, A. W. and Smith, W.: Volcanic ashfall in New Zealand – probabilistic hazard modelling for multiple sources, New Zeal. J. Geol. Geophys., 53, 1–14, 2010.
Hurst, T. and Smith, W.: A Monte Carlo methodology for modelling ashfall hazards, J. Volcanol. Geoth. Res., 138, 393–403, 2004.
Iguchi, M., Ishihara, K., and Hendrasto, M.: Learn from 2010 eruptions at Merapi and Sinabung volcanoes in Indonesia, Annuals of Disaster Prevention Research Institute, Kyoto University, 54, 185–194, 2011.
Iverson, R. M., Schilling, S. P., and Vallance, J. W.: Objective delineation of lahar-inundation hazard zones, Geol. Soc. Am. Bull., 110, 972–984, 1998.
Jenkins, S., Magill, C., McAneney, J., and Blong, R.: Regional ash fall hazard I: A probabilistic assessment methodology, Bull. Volcanol., 74, 1699–1712, https://doi.org/10.1007/s00445-012-0627-8, 2012a.
Jenkins, S., McAneney, J., Magill, C., and Blong, R.: Regional ash fall hazard II: Asia-Pacific modelling results and implications, Bull. Volcanol., 74, 1713–1727, https://doi.org/10.1007/s00445-012-0628-7, 2012b.
Jenkins, S., Komorowski, J. C., Baxter, P., Spence, R., Picquout, A., Lavigne, F., and Surono: The Merapi 2010 eruption: An interdisciplinary impact assessment methodology for studying pyroclastic density current dynamics, J. Volcanol. Geoth. Res., 261, 316–329, https://doi.org/10.1016/j.jvolgeores.2013.02.012, 2013.
Jenkins, S. F., Spence, R. J. S., Fonseca, J. F. B. D., Solidum, R. U., and Wilson, T. M.: Volcanic risk assessment: Quantifying physical vulnerability in the built environment, J. Volcanol. Geoth. Res., 276, 105–120, https://doi.org/10.1016/j.jvolgeores.2014.03.002, 2014.
Jenkins, S. F., Wilson, T. M., Magill, C. R., Miller, V., Stewart, C., Blong, R., Marzocchi, W., Boulton, M., Bonadonna, C., and Costa, A.: Volcanic ash fall hazard and risk. Chapter 3, in: Global Volcanic Hazards and Risk, edited by: Loughlin, S. C., Sparks, R. S. J., Brown, S. K., Jenkins, S. F., and Vye-Brown, C., Cambridge University Press, Cambridge, UK, https://www.cambridge.org/de/academic/subjects/earth-and-environmental-science/mineralogy-petrology-and-volcanology/global-volcanic-hazards-and-risk?format=HB&isbn=9781107111752 (last access: 6 April 2022), 2015.
Jenkins, S. F., Komorowski, J. C., Baxter, P. J., Charbonnier, S. J., and Surono, N.: The devastating impact of the 2010 eruption of Merapi Volcano, Indonesia, Plate boundaries and natural hazards, American Geophysical Union and John Wiley and Sons Inc., 259–269, ISBN 978-1-119-05397-2, 2016.
Jenkins, S. F., Magill, C. R., and Blong, R. J.: Evaluating relative tephra fall hazard and risk in the Asia-Pacific region, Geosphere, 14, 492–509, 2018.
Jenkins, S. F., Biass, S., Williams, G. T., Hayes, J. L., Tennant, E., Yang, Q., Burgos, V., Meredith, E. S., Lerner, G. A., Syarifuddin, M., and Verolino, A.: Supplementary Material 1: Hazard model outputs, for Evaluating and ranking Southeast Asia's exposure to explosive volcanic hazards, Dataverse [data set], https://doi.org/10.21979/N9/B80UMQ, 2022a.
Jenkins, S. F., Biass, S., Williams, G. T., Hayes, J. L., Tennant, E., Yang, Q., Burgos, V., Meredith, E. S., Lerner, G. A., Syarifuddin, M., and Verolino, A.: Supplementary Material 2: Eruption frequency-magnitude, for Evaluating and ranking Southeast Asia's exposure to explosive volcanic hazards, Dataverse [data set], https://doi.org/10.21979/N9/CGKS6C, 2022b.
Jenkins, S. F., Biass, S., Williams, G. T., Hayes, J. L., Tennant, E., Yang, Q., Burgos, V., Meredith, E. S., Lerner, G. A., Syarifuddin, M., and Verolino, A.: Supplementary Material 3: Exposure results, for Evaluating and ranking Southeast Asia's exposure to explosive volcanic hazards, Dataverse [data set], https://doi.org/10.21979/N9/OUJPZQ, 2022c.
Julzarika, A.: Harintaka. Indonesian DEMNAS: DSM or DTM, in: Proceedings of the 2019 IEEE Asia-Pacific Conference on Geoscience, Electronics and Remote Sensing Technology (AGERS), 26–27 August 2019, Jakarta, Indonesia, https://doi.org/10.1109/AGERS48446.2019.9034351, 2019.
Komorowski, J.-C., Jenkins, S., Baxter, P. J., Picquout, A., Lavigne, F., Charbonnier, S., Gertisser, R., Cholik, N., Budi-Santoso, A., and Surono: Paroxysmal dome explosion during the Merapi 2010 eruption: processes and facies relationships of associated high-energy pyroclastic density currents, J. Volcanol. Geoth. Res., 261, 260–294, 2013.
Koyaguchi, T. and Ohno, M.: Reconstruction of eruption column dynamics on the basis of grain size of tephra fall deposits: 2. Application to the Pinatubo 1991 eruption, J. Geophys. Res.-Solid, 106, 6513–6533, 2001.
Lavigne, F. and Thouret, J.-C.: Sediment transportation and deposition by rain-triggered lahars at Merapi Volcano, Central Java, Indonesia, Geomorphology, 49, 45–69, 2003.
Lavigne, F., Thouret, J.-C., Hadmoko, D. S., and Sukatja, C. B.: Lahars in Java: Initiations, dynamics, hazard assessment and deposition processes, Forum Geografi (Terbitan Berkala Ilmiah/Scientific Periodicals), Forum Geografi, 17–32, https://doi.org/10.23917/forgeo.v21i1.1822, 2007.
Lerner, G. A., Jenkins, S. F., Charbonnier, S. J., Komorowski, J.-C., and Baxter, P. J.: The hazards of unconfined pyroclastic density currents: A new synthesis and classification according to their deposits, dynamics, and thermal and impact characteristics, J. Volcanol. Geoth. Res., 421, 107429, https://doi.org/10.1016/j.jvolgeores.2021.107429, 2022.
Macedonio, G. and Costa, A.: Brief Communication “Rain effect on the load of tephra deposits”, Nat. Hazards Earth Syst. Sci., 12, 1229–1233, https://doi.org/10.5194/nhess-12-1229-2012, 2012.
Magill, C. and Blong, R.: Volcanic risk ranking for Auckland, New Zealand. I: Methodology and hazard investigation, Bull. Volcanol., 67, 331–339, 2005a.
Magill, C. and Blong, R.: Volcanic risk ranking for Auckland, New Zealand. II: Hazard consequences and risk calculation, Bull. Volcanol., 67, 340–349, 2005b.
Malin, M. C. and Sheridan, M. F.: Computer-assisted mapping of pyroclastic surges, Science, 217, 637–640, 1982.
Mastin, L., Guffanti, M., Servranckx, R., Webley, P., Barsotti, S., Dean, K., Durant, A., Ewert, J., Neri, A., Rose, W., Schneider, D., Siebert, L., Stunder, B., Swanson, G., Tupper, A., Volentik, A., and Waythomas, C.: A multidisciplinary effort to assign realistic source parameters to models of volcanic ash-cloud transport and dispersion during eruptions, J. Volcanol. Geoth. Res., 186, 10–21, 2009.
Miller, C. A.: Threat assessment of New Zealand's volcanoes and their current and future monitoring requirements, GNS Science Report 2010/55, 45 pp., https://shop.gns.cri.nz/sr_2010-055-pdf/ (last access: 4 March 2020), 2010.
Newhall, C. and Self, S.: The Volcanic Explosivity Index (VEI) – An estimate of explosive magnitude for historical volcanism, J. Geophys. Res.-Oceans, 87, 1231–1238, 1982.
Newhall, C. G. and Punongbayan, R. S.: Fire and mud: Eruptions and lahars of Mount Pinatubo, Philippines, Philippine Institute of Volcanology and Seismology and University of Washington Press, Quezon City, Seattle, London, 1126 pp., https://pubs.usgs.gov/pinatubo (last access: 6 April 2022), 1996.
Nieto-Torres, A., Guimarães, L. F., Bonadonna, C., and Frischknecht, C.: A New Inclusive Volcanic Risk Ranking, Part 1: Methodology, Front. Earth Sci., 9, 672, https://doi.org/10.3389/feart.2021.697451, 2021.
Ogburn, S. E.: Flowdat: Mass flow database v2.2, Hosted by VHub at https://vhub.org/groups/massflowdatabase (last access: 8 August 2021), 2016.
Ogburn, S. E. and Calder, E. S.: The relative effectiveness of empirical and physical models for simulating the dense undercurrent of pyroclastic flows under different emplacement conditions, Front. Earth Sci., 5, 83, https://doi.org/10.3389/feart.2017.00083, 2017.
Osman, S., Rossi, E., Bonadonna, C., Frischknecht, C., Andronico, D., Cioni, R., and Scollo, S.: Exposure-based risk assessment and emergency management associated with the fallout of large clasts at Mount Etna, Nat. Hazards Earth Syst. Sci., 19, 589–610, https://doi.org/10.5194/nhess-19-589-2019, 2019.
Pallister, J. S., Bina, F. R., McCausland, W., Carn, S., Haerani, N., Griswold, J., and Keeler, R.: Recent explosive eruptions and volcano hazards at Soputan volcano – a basalt stratovolcano in north Sulawesi, Indonesia, Bull. Volcanol., 74, 1581–1609, 2012.
Pan, H., Shi, P., Ye, T., Xu, W., and Wang, J. A.: Mapping the expected annual fatality risk of volcano on a global scale, Int. J. Disast. Risk Reduct., 13, 52–60, 2015.
Pesaresi, M., Ehrilch, D., Florczyk, A. J., Freire, S., Julea, A., Kemper, T., Soille, P., and Syrris, V.: GHS built-up grid, derived from Landsat, multitemporal (1975, 1990, 2000, 2014), JRC Data Catalogue, European Commission, Joint Research Centre, https://ghsl.jrc.ec.europa.eu/download.php (last access: 28 May 2020), 2015.
Pioli, L., Bonadonna, C., and Pistolesi, M.: Reliability of total grain-size distribution of tephra deposits, Scient. Rep., 9, 1–15, 2019.
Poulidis, A. P., Biass, S., Bagheri, G., Takemi, T., and Iguchi, M.: Atmospheric vertical velocity-a crucial component in understanding proximal deposition of volcanic ash, Earth Planet. Sc. Lett., 566, 116980, https://doi.org/10.1016/j.epsl.2021.116980, 2021.
Ratdomopurbo, A., Beauducel, F., Subandriyo, J., Nandaka, I. M. A., Newhall, C. G., Sayudi, D. S., and Suparwaka, H.: Overview of the 2006 eruption of Mt. Merapi, J. Volcanol. Geoth. Res., 261, 87–97, 2013.
Retnowati, D. A., Meilano, I., and Riqqi, A.: Modeling of Volcano Eruption Risk toward Building Damage and Affected Population in Guntur, Indonesia, in: 2018 IEEE Asia-Pacific Conference on Geoscience, Electronics and Remote Sensing Technology (AGERS), 18–19 September 2018, Jakarta, Indonesia, 1–7, https://doi.org/10.1109/AGERS.2018.8554097, 2018a.
Retnowati, D. A., Meilano, I., Virtriana, R., and Hanifa, N. R.: Volcanic eruption risk for school building in Indonesia, in: AIP Conference Proceedings, 20–21 November 2017, Bandung, Indonesia, https://doi.org/10.1063/1.5047382, 2018b.
Reyes, P. J. D., Bornas, M. A. V., Dominey-Howes, D., Pidlaoan, A. C., Magill, C. R., and Solidum Jr., R. U.: A synthesis and review of historical eruptions at Taal Volcano, Southern Luzon, Philippines, Earth-Sci. Rev., 177, 565–588, 2018.
Rose, A. N., McKee, J. J., Urban, M. L., Bright, E. A., and Sims, K. M.: LandScan 2018 (2018), Oak Ridge National Laboratory, https://landscan.ornl.gov/downloads/2018 (last access: 5 April 2022), 2019.
Rossi, E., Bonadonna, C., and Degruyter, W.: A new strategy for the estimation of plume height from clast dispersal in various atmospheric and eruptive conditions, Earth Planet. Sc. Lett., 505, 1–12, 2019.
Sandri, L., Costa, A., Selva, J., Tonini, R., Macedonio, G., Folch, A., and Sulpizio, R.: Beyond eruptive scenarios: assessing tephra fallout hazard from Neapolitan volcanoes, Scient. Rep., 6, 1–13, 2016.
Scaini, C., Felpeto, A., Marti, J., and Carniel, R.: A GIS-based methodology for the estimation of potential volcanic damage and its application to Tenerife Island, Spain, J. Volcanol. Geoth. Res., 278, 40–58, 2014.
Scandone, R., Bartolini, S., and Martí, J.: A scale for ranking volcanoes by risk, Bull. Volcanol., 78, 1–8, https://doi.org/10.1007/s00445-015-0995-y, 2016.
Schilling, S.: LAHARZ: GIS Programs for automated mapping of lahar-inundation hazard zones, US Geological Survey Open-File Report 98-638, US Geological Survey, https://doi.org/10.3133/ofr98638, 1998.
Scollo, S., Tarantola, S., Bonadonna, C., Coltelli, M., and Saltelli, A.: Sensitivity analysis and uncertainty estimation for tephra dispersal models, J. Geophys. Res.-Solid, 113, B06202, https://doi.org/10.1029/2006jb004864, 2008.
Silva, V., Amo-Oduro, D., Calderon, A., Costa, C., Dabbeek, J., Despotaki, V., Martins, L., Pagani, M., Rao, A., and Simionato, M.: Development of a global seismic risk model, Earthq. Spectra, 36, 372–394, 2020.
Simpson, A., Johnson, R. W., and Cummins, P.: Volcanic threat in developing countries of the Asia–Pacific region: probabilistic hazard assessment, population risks, and information gaps, Nat. Hazards, 57, 151–165, https://doi.org/10.1007/s11069-010-9601-y, 2011.
Small, C. and Naumann, T.: The global distribution of human population and recent volcanism, Environ. Hazards, 3, 93–109, 2001.
Solikhin, A., Thouret, J.-C., Gupta, A., Harris, A. J., and Liew, S. C.: Geology, tectonics, and the 2002–2003 eruption of the Semeru volcano, Indonesia: Interpreted from high-spatial resolution satellite imagery, Geomorphology, 138, 364–379, 2012.
Tennant, E., Jenkins, S. F., Winson, A., Widiwijayanti, C., Gunawan, H., Haerani, N., Kartadinata, N., Banggur, W., and Triastuti, H.: Reconstructing eruptions at a data limited volcano: A case study at Gede (West Java), J. Volcanol. Geoth. Res., 418, 107325, https://doi.org/10.1016/j.jvolgeores.2021.107325, 2021.
Tennant, E., Jenkins, S. F., and Biass, S.: FlowDIR: a MATLAB tool for rapidly and probabilistically forecasting the travel directions of volcanic flows, in preparation, 2022.
Thouret, J.-C., Lavigne, F., Suwa, H., and Sukatja, B.: Volcanic hazards at Mount Semeru, East Java (Indonesia), with emphasis on lahars, Bull. Volcanol., 70, 221–244, 2007.
Tierz, P., Sandri, L., Costa, A., Zaccarelli, L., Di Vito, M. A., Sulpizio, R., and Marzocchi, W.: Suitability of energy cone for probabilistic volcanic hazard assessment: validation tests at Somma-Vesuvius and Campi Flegrei (Italy), Bull. Volcanol., 78, 1–15, 2016.
Titos, M., Martínez Montesinos, B., Barsotti, S., Sandri, L., Folch, A., Mingari, L., Macedonio, G., and Costa, A.: Long-term hazard assessment of explosive eruptions at Jan Mayen (Norway) and implications for air traffic in the North Atlantic, Nat. Hazards Earth Syst. Sci., 22, 139–163, https://doi.org/10.5194/nhess-22-139-2022, 2022.
Voight, B.: Structural stability of andesite volcanoes and lava domes, Philos. T. Roy. Soc. Lond. A, 358, 1663–1703, 2000.
Voight, B., Constantine, E. K., Siswowidjoyo, S., and Torley, R.: Historical eruptions of Merapi Volcano, Central Java, Indonesia, 1768–1998, J. Volcanol. Geoth. Res., 100, 69–138, https://doi.org/10.1016/s0377-0273(00)00134-7, 2000.
Volentik, A.: Tephra transport, sedimentation and hazards, University of South Florida, ProQuest Dissertations & Theses Global, 304995972, https://remotexs.ntu.edu.sg/user/login?url=https://www.proquest.com/docview/304995972?accountid=12665 (last access: 5 April 2022), 2009.
Walter, T. R., Ratdomopurbo, A., Aisyah, N., Brotopuspito, K. S., Salzer, J., and Lühr, B.: Dome growth and coulée spreading controlled by surface morphology, as determined by pixel offsets in photographs of the 2006 Merapi eruption, J. Volcanol. Geoth. Res., 261, 121–129, 2013.
Whelley, P., Newhall, C., and Bradley, K.: The frequency of explosive volcanic eruptions in Southeast Asia, Bull. Volcanol., 77, 1–11, https://doi.org/10.1007/s00445-014-0893-8, 2015.
Widiwijayanti, C., Voight, B., Hidayat, D., and Schilling, S.: Objective rapid delineation of areas at risk from block-and-ash pyroclastic flows and surges, Bull. Volcanol., 71, 687–703, 2009.
Williams, G. T., Kennedy, B. M., Lallemant, D., Wilson, T. M., Allen, N., Scott, A., and Jenkins, S. F.: Tephra cushioning of ballistic impacts: Quantifying building vulnerability through pneumatic cannon experiments and multiple fragility curve fitting approaches, J. Volcanol. Geoth. Res., 388, 106711, https://doi.org/10.1016/j.jvolgeores.2019.106711, 2019.
Williams, G. T., Jenkins, S. F., Biass, S., Wibowo, H. E., and Harijoko, A.: Remotely assessing tephra fall building damage and vulnerability: Kelud Volcano, Indonesia, J. Appl. Volcanol., 9, 1–18, 2020.
Williams, G. T., Jenkins, S. F., Lee, D. W., and Wee, S. J.: How rainfall influences tephra fall loading – an experimental approach, Bull. Volcanol., 83, 1–13, 2021.
Williams, R., Rowley, P., and Garthwaite, M. C.: Reconstructing the Anak Krakatau flank collapse that caused the December 2018 Indonesian tsunami, Geology, 47, 973–976, 2019.
Wilson, L., Sparks, R. S. J., Huang, T. C., and Watkins, N. D.: The control of volcanic column heights by eruption energetics and dynamics, J. Geophys. Res., 83, 1829–1836, 1978.
Yoganandan, N., Pintar, F. A., Sances Jr, A., Walsh, P. R., Ewing, C. L., Thomas, D. J., and Snyder, R. G.: Biomechanics of skull fracture, J. Neurotrauma, 12, 659–668, 1995.
Zorn, E. U., Le Corvec, N., Varley, N. R., Salzer, J. T., Walter, T. R., Navarro-Ochoa, C., Vargas-Bracamontes, D. M., Thiele, S. T., and Arámbula Mendoza, R.: Load stress controls on directional lava dome growth at Volcán de Colima, Mexico, Front. Earth Sci., 7, 84, https://doi.org/10.3389/feart.2019.00084, 2019.
- Abstract
- Introduction
- Methodology
- Results
- Volcano ranking
- Limitations
- Discussion and conclusions
- Appendix A: Model input parameters
- Appendix B: Probabilistic forecasting of dome collapse PDC travel directions
- Code availability
- Data availability
- Author contributions
- Competing interests
- Disclaimer
- Acknowledgements
- Financial support
- Review statement
- References