the Creative Commons Attribution 4.0 License.
the Creative Commons Attribution 4.0 License.
 | 08 Jan 2021
Modelling a tropical-like cyclone in the Mediterranean Sea under present and warmer climate
Priscilla A. Mooney
William Cabos
Miguel Ángel Gaertner
Alba de la Vara
Juan Jesus González-Alemán
This study focuses on a single Mediterranean hurricane (hereafter medicane), to investigate its response to global warming during the middle of the 21st century and assesses the effects of a warmer ocean and a warmer atmosphere on its development. Our investigation uses the state-of-the-art regional climate model WRF to produce the six-member, multi-physics ensembles. Results show that our model setup simulates a realistic cyclone track and the transition from an initial disturbance to a tropical-like cyclone with a deep warm core. However, the simulated transition occurs earlier than for the observed medicane. The response of the medicane to future climate change is investigated with a pseudo global warming (PGW) approach. This is the first application of the PGW framework to medicanes. The PGW approach adds a climate change delta (defined as difference between future and present climate) to WRF's boundary conditions which is obtained for all prognostic variables using the mean change in an ensemble of CMIP5 simulations. A PGW simulation where the climate change delta is added to all prognostic variables (PGWALL) shows that most of the medicane characteristics moderately intensify, e.g. surface wind speed, uptake of water vapour, and precipitation. However, the minimum sea level pressure (SLP) is almost identical to that under present climate conditions. Two additional PGW simulations were undertaken; One simulation adds the projected change in sea surface and skin temperature only (PGWSST) while the second simulation adds the PGW changes to only atmospheric variables (PGWATMS); i.e. we use present-day sea surface temperatures. These simulations show opposing responses of the medicane. In PGWSST, the medicane is more intense than PGWALL as indicated by lower SLP values, the stronger surface wind, and the more intense evaporation and precipitation. In contrast, the medicane in PGWATMS still transitions into a tropical-like cyclone with a deep warm core, but the PGWATMS medicane weakens considerably (SLP, surface wind, and rainfall decrease). This difference can be explained by an increase in water vapour driven by the warmer ocean surface (favourable for cumulus convection). The warmer and drier atmosphere in PGWATMS tends to inhibit condensation (unfavourable for cumulus convection). The warmer ocean and warmer atmosphere have counteracting effects which leads to only a modest enhancement of the medicane by global warming. The novel approach in this study provides new insights into the different roles of warming of the ocean and atmosphere in medicane development.
- Article
(8898 KB) - Full-text XML
-
Supplement
(1054 KB) - BibTeX
- EndNote


It is well known that severe cyclonic storms occur in the Mediterranean Sea, in particular from September to March (e.g. Cavicchia et al., 2013). They generate large amounts of precipitation and intense winds that severely damage regional economies and infrastructure over the coastal areas in the Mediterranean (e.g. Bakkensen, 2017). A high number of cyclonic storms may occur during a year. However, it is only few of them that qualify as medicanes. This is mainly due to phenomenological criteria used to identify a cloud-free “eye”, which is just one of characteristics of tropical cyclones.
These tropical-like cyclones are called Mediterranean hurricanes or medicanes (this term is used hereafter). Although there are many similarities between medicanes and tropical cyclones, there are also clear differences between them. Firstly, the lifetime of medicanes is shorter than most tropical cyclones. Secondly, the development of tropical cyclones generally requires that sea surface temperatures (SSTs) exceed the empirical threshold of 26 ∘C. However, SSTs in the Mediterranean Sea are almost never this warm, with autumn and winter SSTs varying from around 18 to 23 ∘C in the current climate (e.g. Shaltout and Omstedt, 2014; Fig. 2a). This is much lower than the empirical threshold of 26 ∘C for tropical cyclone formation and the occurrence of tropical cyclones over such cold SSTs is very rare even in the tropics (cf. Pacific and Atlantic cold tongue; e.g. Jin, 1996; Caniaux et al., 2011). Another difference between medicanes and tropical cyclones is that the formation of medicanes is generally triggered by an intrusion of trough-like systems or cut-off lows over the Mediterranean (Fita et al., 2006; Chaboureau et al., 2012; Fita and Flaounas, 2018; Bouin and Lebeaupin Brossier, 2020). Notably, Fita and Flaounas (2018) suggested that some medicanes show hybrid features of tropical and extratropical cyclones, which is more similar to subtropical cyclones (cold core and shallow convection at the mature stage). Consequently, they are subjected to baroclinic forcing like extratropical cyclones (Fita et al., 2006; Chaboureau et al., 2012). As such, it is expected that the formation of medicanes is not different from other intense Mediterranean cyclones (Flaounas et al., 2015), and it should be noted that there is no physical criterion for classifying a Mediterranean cyclone as a tropical-like system.
The mechanism of medicane development has been investigated in previous studies. A cut-off low and a potential vorticity anomaly are pre-conditioning factors for medicane initiation (e.g. Miglietta et al., 2016). This triggers deep cumulus convection resulting in the formation of a deep warm core and consequently a tropical transition of the initial perturbation occurs (Mazza et al., 2017) due to the warm seclusion. Miglietta and Rotunno (2019) investigated two medicanes and showed that each had a different development mechanism. Air–sea interactions were important for one medicane but not for the other, which was maintained mainly by a mid-latitude baroclinic environment (air–sea fluxes and latent heat flux still help to develop the medicane). This development mechanism is also suggested by Carrió et al. (2017).
While the mechanism of medicanes differs to a large extent from that of tropical cyclones, understanding the response of the medicane features to anthropogenic global climate change is important for mitigating future risks associated with natural hazards. According to Shaltout and Omdtedt (2014), the Mediterranean SST is expected to increase by 2.6 ∘C per century. This warming in the ocean can be a potential source of enhanced moisture to the atmosphere. In fact, significant changes in medicanes, e.g. frequency and intensity, associated with global warming have been reported in previous studies. Cavicchia et al. (2014) used coupled global climate models to show that medicanes can moderately intensify but their frequency tends to decrease. Tous et al. (2016) also suggested similar future changes in frequency and intensity of medicanes. Their study also revealed that the location of medicane formation is expected to change (more frequent over the Gulf of Lion–Genoa and south of Sicily). González-Alemán et al. (2019) concluded that associated with medicane intensification, the structure of tropical-like cyclones is more robust and their lifetime as tropical-like cyclones is longer-lasting compared to medicanes under the current climate. Consequently, this leads to more hazardous situations in the projected future.
Most of the aforementioned studies on the future climate of medicanes are based on results obtained from global coupled models (CGCMs). However, in long climatic simulations performed with CGCMs, the typical grid spacing varies between 100 and 25 km. Even simulations at 25 km still have an insufficient resolution to resolve the fine-scale structure of medicanes, e.g. the cyclone core and the associated rain bands. Consequently, the intensity of medicanes is underestimated in most coupled regional models (Gaertner et al., 2018). Therefore, it is most likely that CGCMs also underestimate future changes in medicanes. One possible solution to this problem is to dynamically downscale the global models with a regional climate model (RCM) at finer resolutions (e.g. Cavicchia and von Storch, 2012; Cavicchia et al., 2014). Alternatively, a pseudo global warming method (PGW; e.g. Schär et al., 1996; Rasmussen et al., 2011; Parker et al., 2018; Mooney et al., 2020) can be used to more explicitly assess the impacts of future climate change on medicanes. PGW is an advantageous method for characterizing the response of a given medicane to climate change by imposing the future changes in atmospheric and ocean variables estimated by CGCMs to boundary conditions of a high-resolution RCM (see details in Sect. 2). This approach permits a more direct assessment of the impacts of future climate change on an extreme weather event (e.g. Parker et al., 2018). Additionally, the PGW method enables investigations of the relative roles of a warmer atmosphere and a warmer ocean in the response of medicanes to climate change.
In this study, we use a PGW framework to investigate the impacts of global warming on the development and intensity of medicane Rolf (Miglietta et al., 2013; Ricchi et al., 2017; Dafis et al., 2018). Rolf occurred from 6 to 9 November 2011 and affected the Balearic Islands, Italy, and southern France due to longer persistence of tropical-cyclonic features. Since Rolf was a highly destructive medicane for coastal communities in many Mediterranean countries and is one of the most intense medicanes (e.g. Dafis et al., 2018), it is important to assess how these types of medicanes will respond to climate change in the near future. Medicane Rolf generated deep cumulus convection and persisted with tropical-cyclone-like characteristics (deep warm core) longer than other Mediterranean storms and vortices (e.g. Miglietta et al., 2013). Moreover, according to Miglietta et al. (2013), Rolf occurred around the Balearic Islands, which is a hot spot of medicane genesis. Therefore, it is interesting and important to investigate the impacts of climate change on this type of Mediterranean storm. We perform additional idealized experiments in which only the atmosphere or the ocean experience global warming to elucidate the roles of a warmer atmosphere and a warmer ocean on the medicane. This study is structured as follows. In Sect. 2, details of the reanalysis data, RCM, and experimental designs are provided. An evaluation and assessment of the simulation of medicane Rolf under current climate conditions with respect to a state-of-the-art reanalysis is presented in Sect. 3. The results of the PGW experiments are given in Sect. 4. Additionally, we analyse the possible future changes of the medicane. A more insightful discussion on the competing roles of a warmer atmosphere and ocean in the medicane is examined in Sect. 5. Finally, the concluding remarks of this study are provided in Sect. 6.
2.1 WRF Simulation of Rolf under present climate
The model setup consists of two nested domains as shown in Fig. 1. Both domains have 52 vertical layers and the horizontal grid spacing is 15 and 5 km for the outer and inner domains, respectively. The Weather Research and Forecasting (WRF; Skamarock et al., 2008) model version 3.9.1 is used to simulate a six-member ensemble for Rolf. Ensemble members are created using different combinations of physical parameterizations in the WRF model. Previous studies (e.g. Miglietta et al., 2015; Ricchi et al., 2017; Mooney et al., 2018) have shown that simulated medicanes and tropical cyclones are highly sensitive to different combinations of physical schemes.
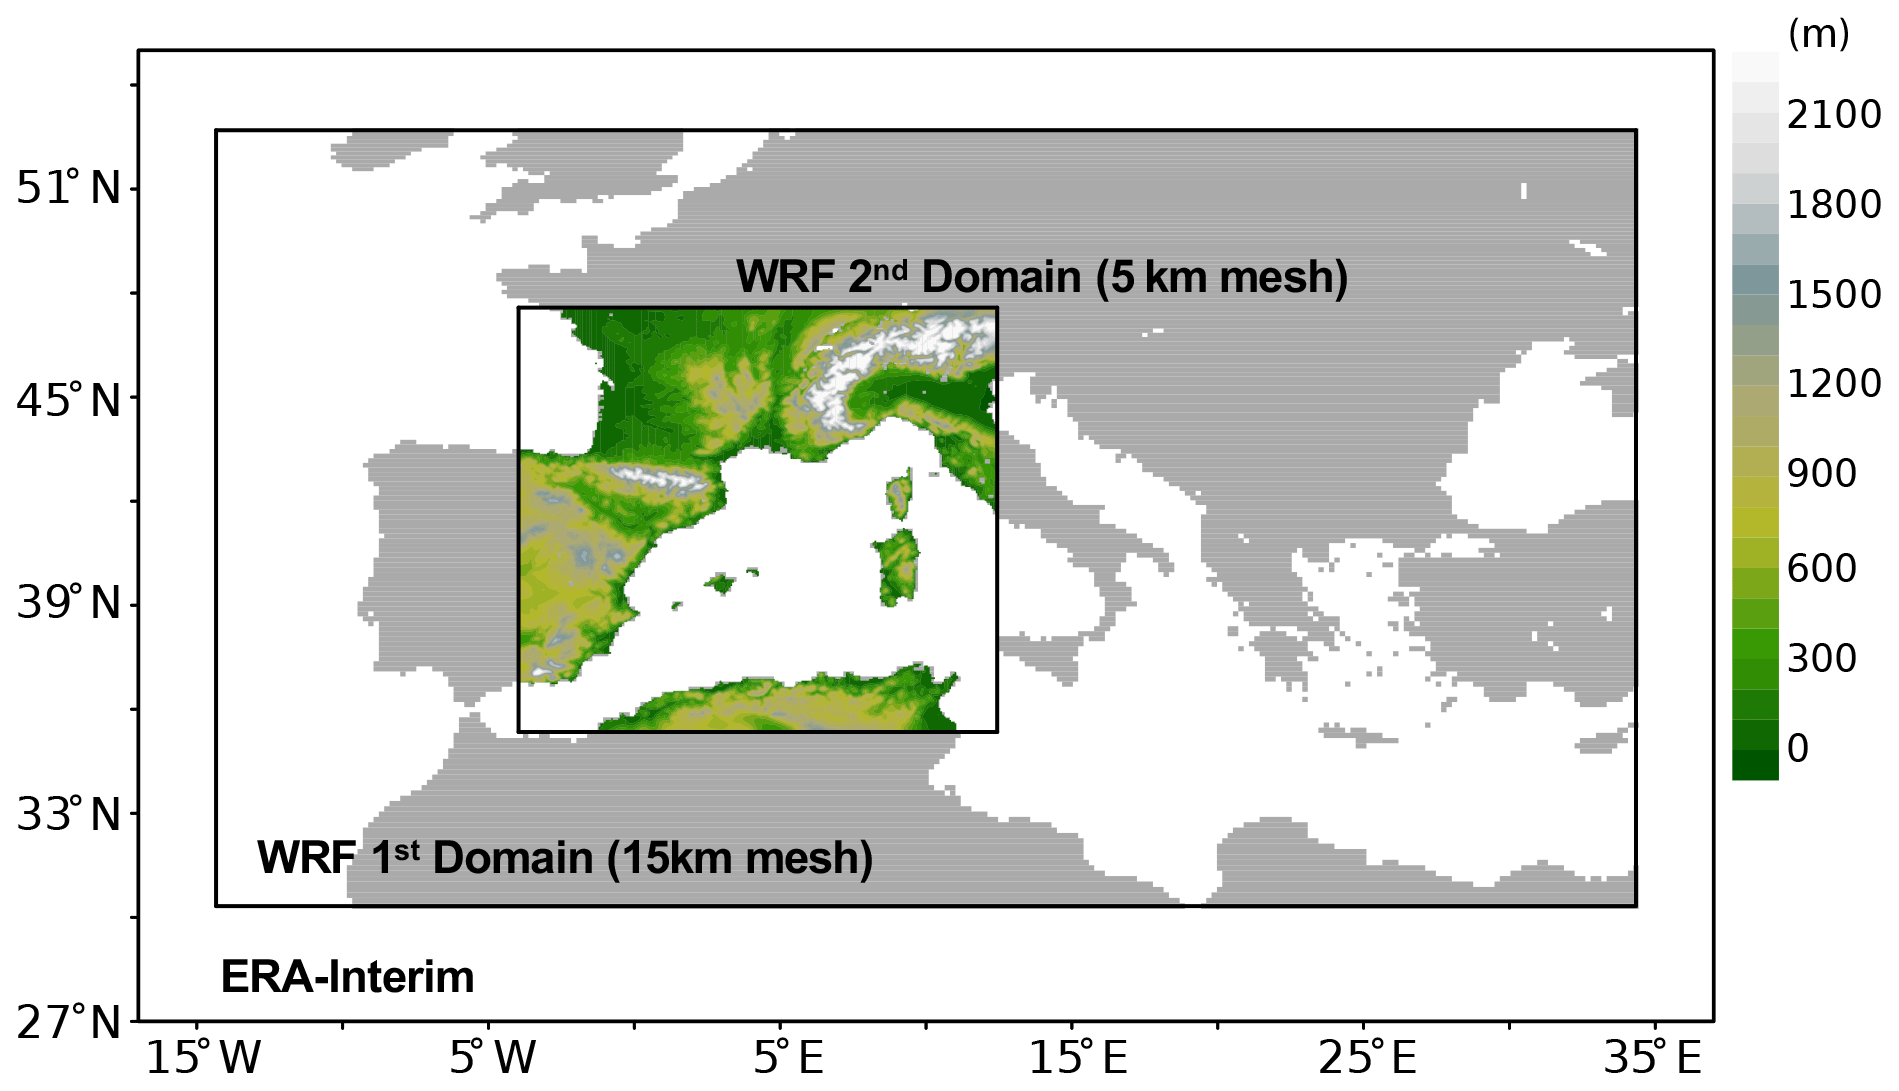
Figure 1Domains for WRF simulations for medicane Rolf. Shading in WRF second domain is topography height from MODIS.
Based on their results, we form our ensemble by varying the microphysical and planetary boundary layer (PBL) parameterizations. The microphysics selected were (1) WSM5 (Hong et al., 2004), (2) WSM6 (Hong and Lim, 2006), and (3) Thompson (Thompson et al., 2008). The PBL schemes used were (1) Mellor–Yamada–Janjíc (MYJ; Janjíc, 1994) and (2) Mellor–Yamada–Nakanishi–Niino (MYNN; Nakanishi and Niino, 2006; Nakanishi and Niino, 2009; Olson et al., 2019). In order to choose a convective scheme, we simulated Rolf with three commonly used convective schemes: Kain–Fritsch (Kain, 2004), Betts–Miller–Janjíc (Janjíc, 1994), and Tiedtke (Tiedtke, 1989; Zhang et al., 2011). The assessment study used a single WRF domain with 10 km grid spacing forced by ERA-Interim (Dee et al., 2011) reanalysis data (, 6 hourly). Each simulation has different combinations of microphysics, (WSM5, WSM6, and Thompson) and PBL (MYJ and MYNN). According to this assessment simulation, most of simulations with the Tiedtke scheme tend to produce more realistic medicane tracks, making landfall over southern France while simulations with the other two convection schemes fail to make a landfall over southern France, make an incorrect landfall over Sardinia, or decay over the Mediterranean Sea without landfall (not shown). Based on the results of this assessment, we performed WRF simulations with the Tiedke convection scheme. Table 2 lists the combinations of parameterization schemes and the name of each simulation or ensemble member. The purpose of this ensemble is to increase the robustness of our results. This is important as a single tropical cyclone simulation contains substantial uncertainty in its intensity and development (e.g. Torn, 2016). All simulations use the longwave and shortwave radiative schemes of the Rapid Radiative Transfer Model (Mlawer et al., 1997) and the NOAH four-layer land surface model (Chen and Dudhia, 2001a, b). Initialization and lateral boundary conditions are taken from ERA-Interim 6-hourly reanalysis data (). The lower boundary condition of sea surface temperature (SST) is obtained from daily OISST data with horizontal resolution. The simulations are integrated from 00:00 UTC on 5 November 2011 to 00:00 UTC on 10 November 2011. Hereafter, these simulations are referred to as PRS, which stands for present-day climate condition. ERA-Interim is selected as the driving data for our WRF simulations to maintain consistency between the spatial resolutions of the PGW delta calculated from the CMIP5 ensemble and the reanalysis data used for the initial and boundary conditions (in particular for atmospheric variables). We also investigated the representation of the medicane Rolf in ERA-Interim and found a cyclone track similar to ERA5 (see Sect. 3 and Fig. S1 in the Supplement for details).
In this study, ERA5 reanalysis data (Copernicus Climate Change Service, 2017) are used to benchmark the simulation of medicane Rolf. ERA5 is a state-of-the-art reanalysis system with a high spatio-temporal resolution ( and 1 hourly). The trajectory of Rolf was estimated from ERA5 by identifying the location of the minimum SLP value at 3-hourly intervals. This track is regarded as the reference track in this study (see Fig. S1). Additionally, we use observational data of the cyclone track produced by the US National Oceanic and Atmospheric Administration (NOAA) using the Dvorak technique (see Fig. S1). These data are available only from 12:00 UTC on 7 November 2011 to 12:00 UTC on 9 November 2011 (https://www.ssd.noaa.gov/PS/TROP/DATA/2011/tdata/med/01M.html, last access: 15 October 2019).
2.2 WRF simulation of Rolf under warmer climate
To investigate how future global climate change influences the medicane, a pseudo global warming (PGW; e.g. Parker et al., 2018; Mooney et al., 2020) experiment is employed. In the PGW framework, boundary conditions of WRF are perturbed by the monthly-mean values of global climate change (Δ). This is estimated by simulations of climate projections from CGCMs. In other words, we can simulate the medicane Rolf under a virtually warmed climate. In this study, we obtain the PGWΔ from the ensemble mean (see Table 1) of 19 simulations used in the Coupled Model Inter-comparison Project 5 (CMIP5; Taylor et al., 2012) between 2036–2065 and 1976–2005. These periods were chosen on the basis of data availability for CMIP5 CGCMs and to represent 1.5 ∘C of global warming in the middle of this century. The advantage of using an ensemble mean of 19 CGCM realizations over a single CGCM realization is that it minimizes the influence of unforced natural climate variations and model errors in quantifying the forced climate response to future greenhouse gas (GHG) warming (Xu and Xu, 2012). The PGWΔ contains perturbed values for zonal and meridional winds, temperature, relative humidity, geopotential, SLP, SST, and skin temperature. The new boundary conditions including the global warming can be expressed as
where BCPGW represents future boundary conditions and BCPRS represents present-day boundary conditions from ERA-Interim. Both BCPGW and BCPRS are 6-hourly values, while Δ is a monthly mean value for November. Δ is defined as follows:
These equations are applied to each of the following variables: zonal and meridional winds (U and V), temperature (T), relative humidity (RH), geopotential (z), SLP, SST, and skin temperature (TSK). In the PGW experiments, we perform three different simulations where the perturbation Δ is added to (1) all variables at the boundary conditions (PGWALL), (2) only SST and skin temperature (PGWSST), and (3) only the atmospheric variables (PGWATMS). This enables an investigation of the relative roles of projected future changes in the atmosphere and ocean in the development and modification of the medicane. Other experimental configurations of PGWs are the same as those in PRS (see Sect. 2.1). Figure 2b and c provide the PGWΔ for SSTs and a vertical profile of atmospheric temperature and relative humidity (averaged over the 5 km mesh domain in Fig. 1) for the PGW experiments in this study. In the Mediterranean Sea, the PGW delta increases SSTs by approximately 2 ∘C (see Fig. 2b and also shown by Somot et al., 2006), and the troposphere is warmed by 2 to 3 ∘C (Fig. 2c). In contrast, projections of the relative humidity in the troposphere tend to be reduced under global warming. This projected thermodynamical response to global warming can lead the Mediterranean climate to be warmer and drier (e.g. Giorgi and Lionello, 2008). To the best of our knowledge, the present study is the first investigation to employ the PGW method to a tropical-like cyclone in the Mediterranean Sea.
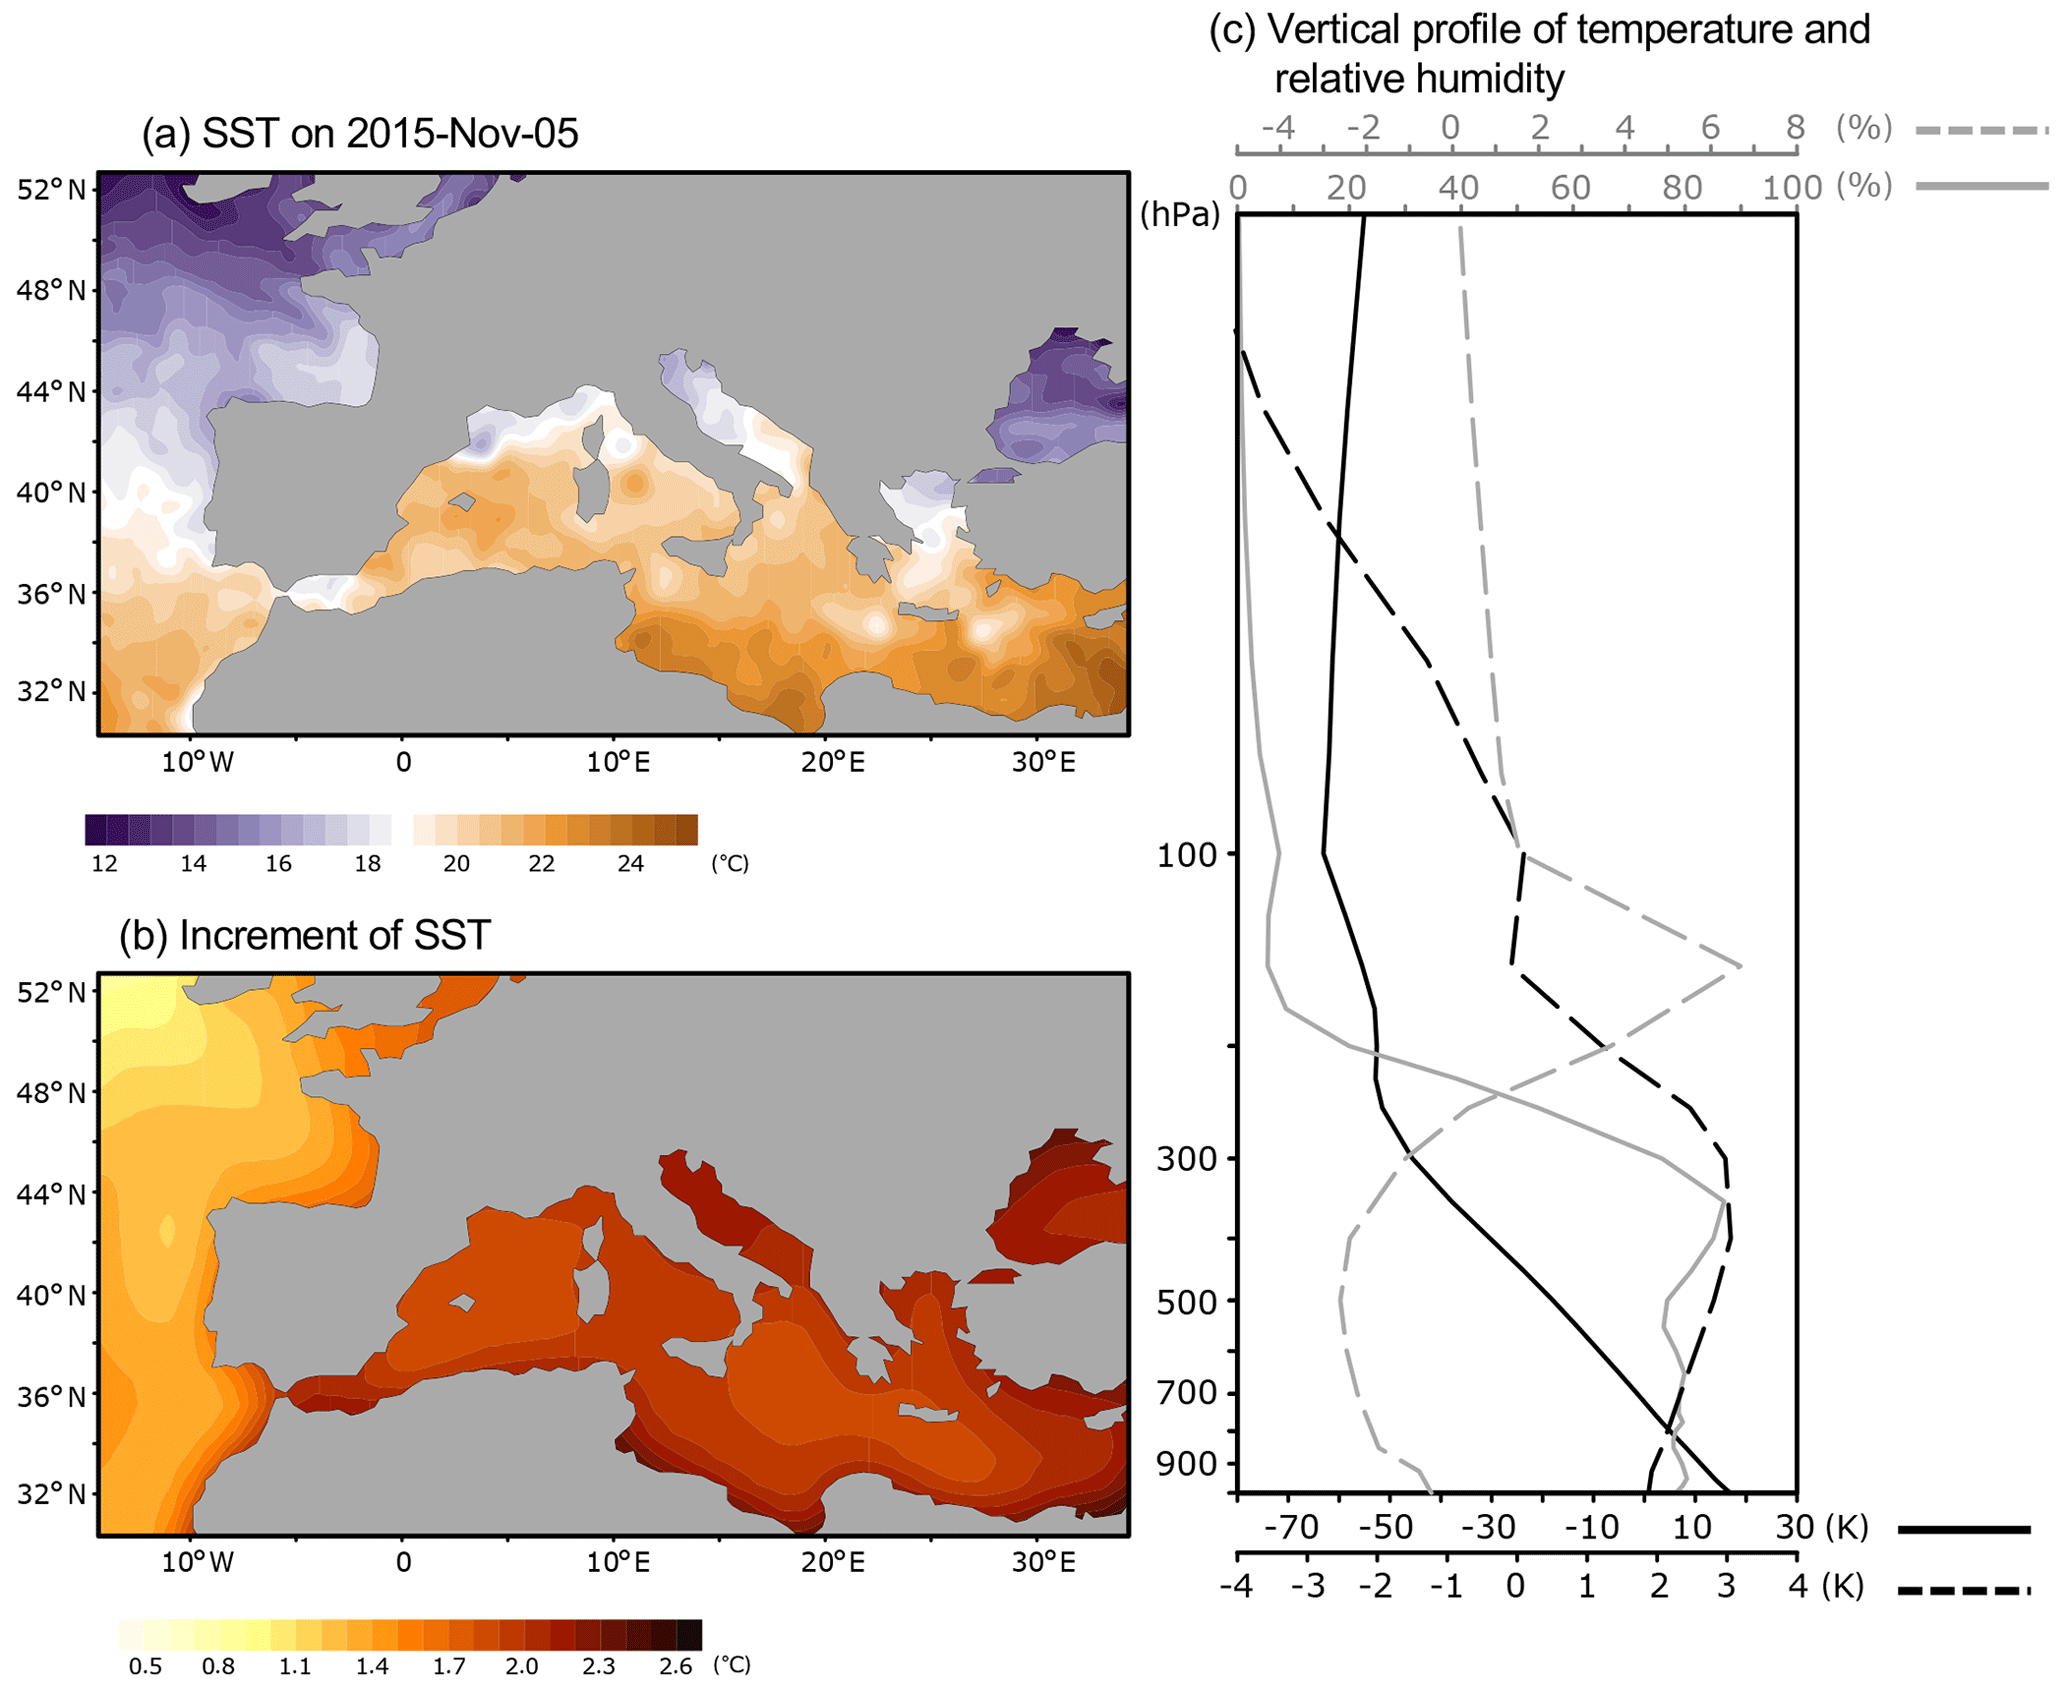
Figure 2(a) Sea surface temperature (SST) at 00:00 UTC on 5 November 2011 in OISST in WRF first domain. Increment projected by 18 CMIP5 CGCMs (b) SST in the WRF first domain and (c) vertical profiles of increments of air temperature and relative humidity averaged over WRF's second domain between 2035–2065 and 1975–2006.
Table 1CMIP5 GCMs used for deriving the climate perturbations for the PGW simulations.

Table 2Physical scheme combination for six ensemble simulations of WRF and acronyms for each simulation.
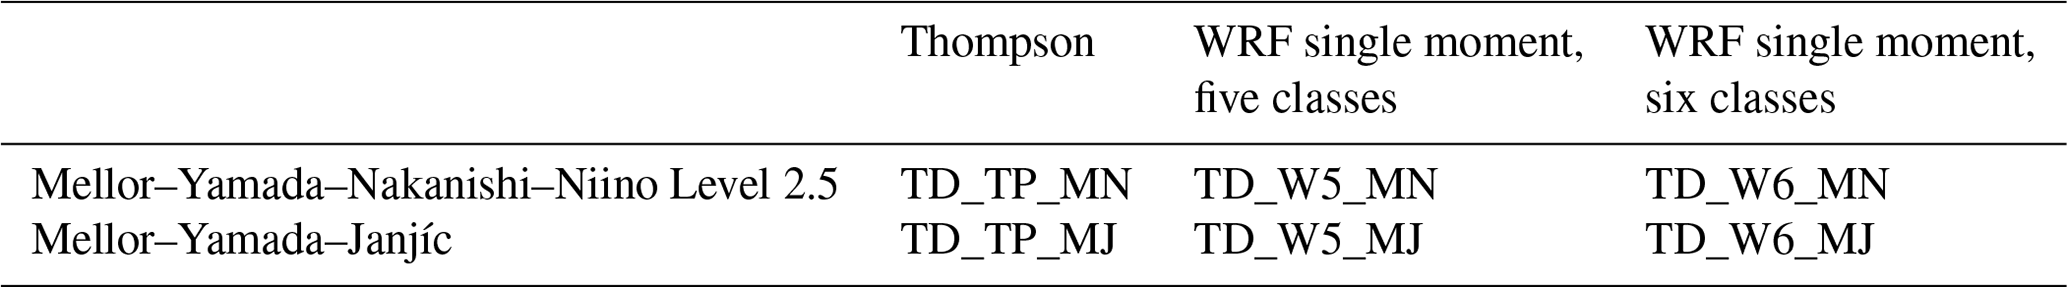
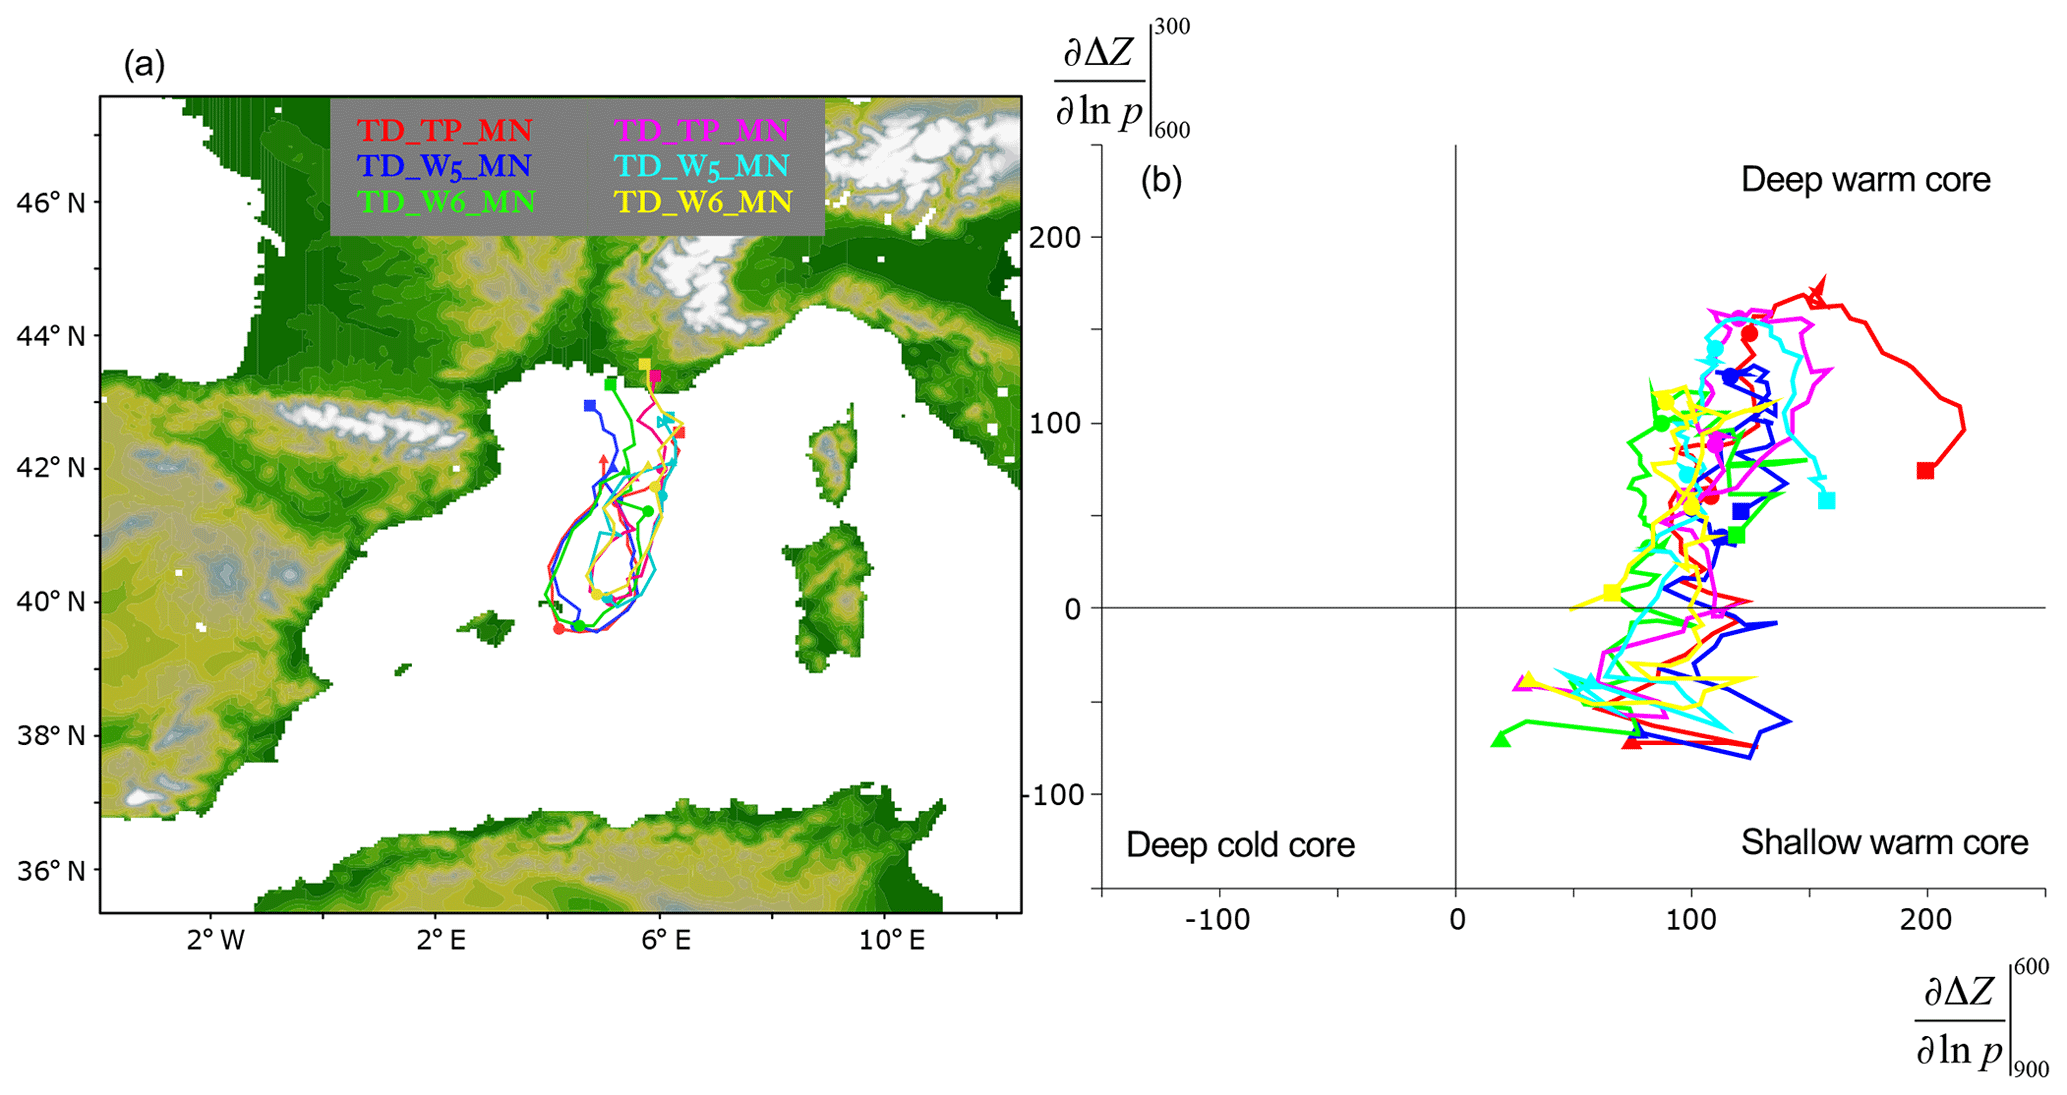
Figure 3(a) Trajectory of six ensembles of medicane Rolf PRS, from 00:00 UTC, 6 November 2011 to 00:00 UTC, 9 November. The tracking is based on the lowest sea level pressure. The colours of red, blue, green, magenta, light blue, and yellow are for TD_TP_MN, TD_W5_MN, TD_W6_MN, TD_TP_MJ, TD_W5_MJ, and TD_W6_MJ, respectively. Note that the track of TD_W6_MJ (orange) terminates at 22:00–08:00 UTC due to the extinction of the simulated medicane. (b) Cyclone phase space of PRS ensemble. The markers of ▴, •, and ▪ denote 00:00–06:00 UTC, 00:00–07:00/00:00–08:00 UTC, and end of tracking, respectively.
2.3 Estimation of the cyclone phase space (CPS)
For a trajectory of observed and simulated medicanes, the minimum SLP is tracked from 00:00 UTC on 6 November 2011 until 12:00 UTC on 9 November 2011. If the medicane makes landfall before 12:00 UTC on 9 November 2011, the tracking is ceased. While not all Mediterranean storms with a warm core undergo a tropical transition (e.g. Fita and Flaounas, 2018), one remarkable characteristic of many medicanes is the transition of the cyclonic system transitions from extratropical to tropical (e.g. Gaertner et al., 2018). Hart (2003) proposes an objective measurement of cyclone phase space defined as
where
Zmax and Zmin denote the maximum and minimum geopotential height at a pressure level within 2.5∘ (for ERA5) and 250 km (for WRF simulations) radius around the medicane centre. The upper- and lower-tropospheric thermal wind relation is estimated by Eqs. (2) and (3), respectively. As shown by Hart (2003), in the extratropical phase, the cyclone has a deep cold core and the values of Eqs. (2) and (3) are negative. In addition, the tropical cyclone has a deep warm core with positive values for Eqs. (2) and (3). In this study, the thermal wind relation is estimated every 50 hPa from 900 to 300 hPa and the cyclone phase indices of Eqs. (2) and (3) are defined as the mean of the values every 50 hPa between 600 and 300 hP and between 600 and 900 hPa.
In this section we examine the results of PRS to assess the ability of our WRF setup to simulate Rolf. The cyclone track of PRS is given in Fig. 3a. In the PRS ensemble simulation, the medicanes have very similar tracks from 00:00 UTC on 6 November 2011 to 00:00 UTC on 9 November 2011 shown in Fig. 3a even though there is a spread in the track: firstly, the medicane moves southward and crosses around Menorca. After that, it turns northward and finally makes landfall around southern France. This cyclone track reproduces the observed track well (Fig. S1a). The phase shift of the cyclone of the PRS ensemble is shown in Fig. 3b using cyclone phase space defined by Hart (2003) (see the details of definition in Sect. 2.3). In the beginning, the cyclones of all ensemble members already develop with a shallow warm core (Fig. 3b). This shallow warm core develops into a deep warm core at 00:00 UTC on 7 November 2011 (that is earlier than ERA5 in Fig. S1b). At 00:00 UTC on 8 November 2011, the simulated cyclone forms a completely deep structure of a warm core. After that, the structure of the deep warm core gradually weakens in all ensemble members. This shift of cyclone phase is approximately consistent with that from ERA5. Thus, PRS can reproduce Rolf in a way that cyclone phase matches accordingly with the one by ERA5 (Figs. 3 and S1).
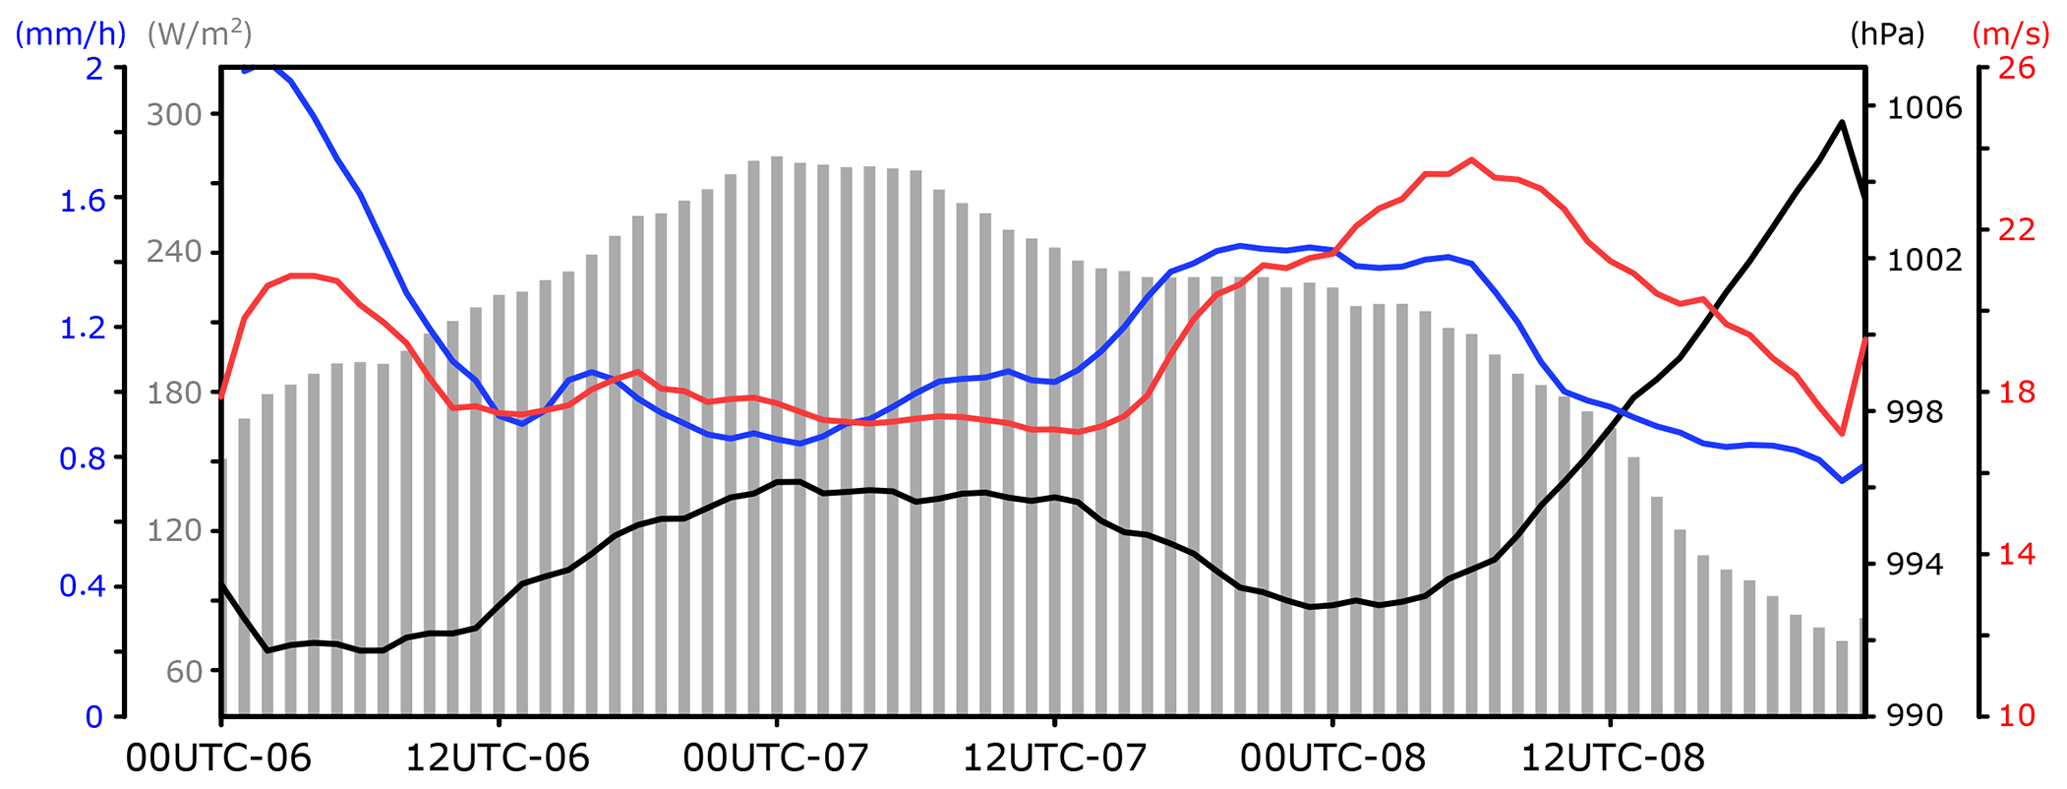
Figure 4Time series of sea level pressure (SLP) at grid of cyclone centre (black line), latent heat flux (grey bar), and precipitation (blue line), and averaged wind speed exceeding the 95th percentile (red line) within the 250 km radius of the simulated medicane averaged within a radius of 250 km. Note that the TD_W6_MJ (orange) terminates at 23:00–08:00 UTC due to the extinction of the simulated medicane, and the values of TD_W6_MJ are excluded from the ensemble mean at 23:00–08:00 UTC.
Along this cyclone track, a time sequence of SLP of the ensemble-mean cyclone centre is given in Fig. 4. The SLP drops down to 992 hPa at 06:00 UTC on 6 November 2011 during the preconditioning period of the tropical-like cyclone. Similar to ERA5 (see Fig. S1c), the SLP of the cyclone increases to 996 hPa until 00:00 UTC on 7 November 2011 and decreases again. Consequently the deepening of the low pressure reaches 992 to 993 hPa between 00:00 and 03:00 UTC on 8 November 2011 (Fig. 4). After this peak, the cyclone's ensemble-mean SLP increases rapidly as it approaches southern France (the depression is weakened to 1006 hPa after 22:00 UTC on 8 November 2011). The development of the cyclone can be partially linked with the water vapour gained by the cyclone as shown in Fig. 4. The latent heat flux gained by the cyclone increases from the beginning until 06:00 UTC on 7 November 2011 (from 160 to 280 W m−2) even though this is stronger than in ERA5 (Fig. S1). After this peak, the latent heat flux begins to decrease and is slightly enhanced at 00:00 UTC on 8 November 2011. The latent heat flux drops again until the landfall over southern France. Surface flux and the diabatic heating are partially responsible for transition tropical-like cyclones (e.g. Emanuel, 2005; Quitián-Hernández et al., 2020). Rolf also obtains a large amount of water vapour from the underlying sea surface during its phase transition and development. The maximum value of latent heat flux reaches 740 W m−2 in one grid cell at the cyclone peak, while this value is less than two cases of Mediterranean storms (Miglietta and Rotunno, 2018). In that study, the two Mediterranean storms were closer to the African continent than Rolf, and therefore, dry air from the African continent and warmer SST could enhance evaporation compared to the case of Rolf. In the PRS simulations, the precipitation associated with the cyclone is intense at 00:00 UTC on 6 November 2011 and decreases until 12:00 UTC on 6 November 2011 in Fig. 4. That can be associated with deep cumulus convection due to the initial disturbance (not shown). After 12:00 UTC on 6 November 2011, the precipitation remains at a relatively small amount with some fluctuations before increasing again at 12:00 UTC on 7 November 2011, reaching a peak around 20:00 to 21:00 UTC on 7 November 2011, which is somewhat earlier than the peak of SLP depression. Coinciding with the reduction in the SLP depression, the precipitation decreases again after the peak. The red contour shows an averaged wind speed exceeding the 95th percentile (referred to as maximum wind speed, MWS, hereafter) within a 250 km radius around the cyclone in each simulation. The MWS is defined as an averaged value of 10 m wind speed at a grid box where the wind speed exceeds the 95th percentile every hour within 250 km radius of the cyclone. In PRS, from 00:00 UTC on 6 November 2011 until 12:00 UTC on 7 November 2011, the MWS does not show a clear variation (18 to 21 m s−1). After that, MWS increases until 08:00 UTC on 8 November 2011, reaching 24 m s−1. This variation is roughly consistent with that in the SLP (Fig. 4) even though the timing is relatively delayed in the MWS compared to SLP.
The difference in intensity and transition timing between ERA5 and PRS may be caused by the difference in evaporation and condensation gained by the cyclone. Nonetheless, PRS is able to realistically reproduce the medicane Rolf, and the impact of climate change on Rolf will be described in the next section.
As explained in Sect. 2, we explore how Rolf is affected by future climate change (middle of the 21st century), which corresponds to global warming of 1.5 ∘C using the pseudo global warming (PGW; e.g. Schär et al., 1996; Rasmussen et al., 2011; Parker et al., 2018) technique. In addition to the effects of climate change, the relative roles of the atmosphere and the ocean in the modulations of medicane Rolf are also investigated separately in this section. Note that we omit the number of years for describing the time and date in this section.
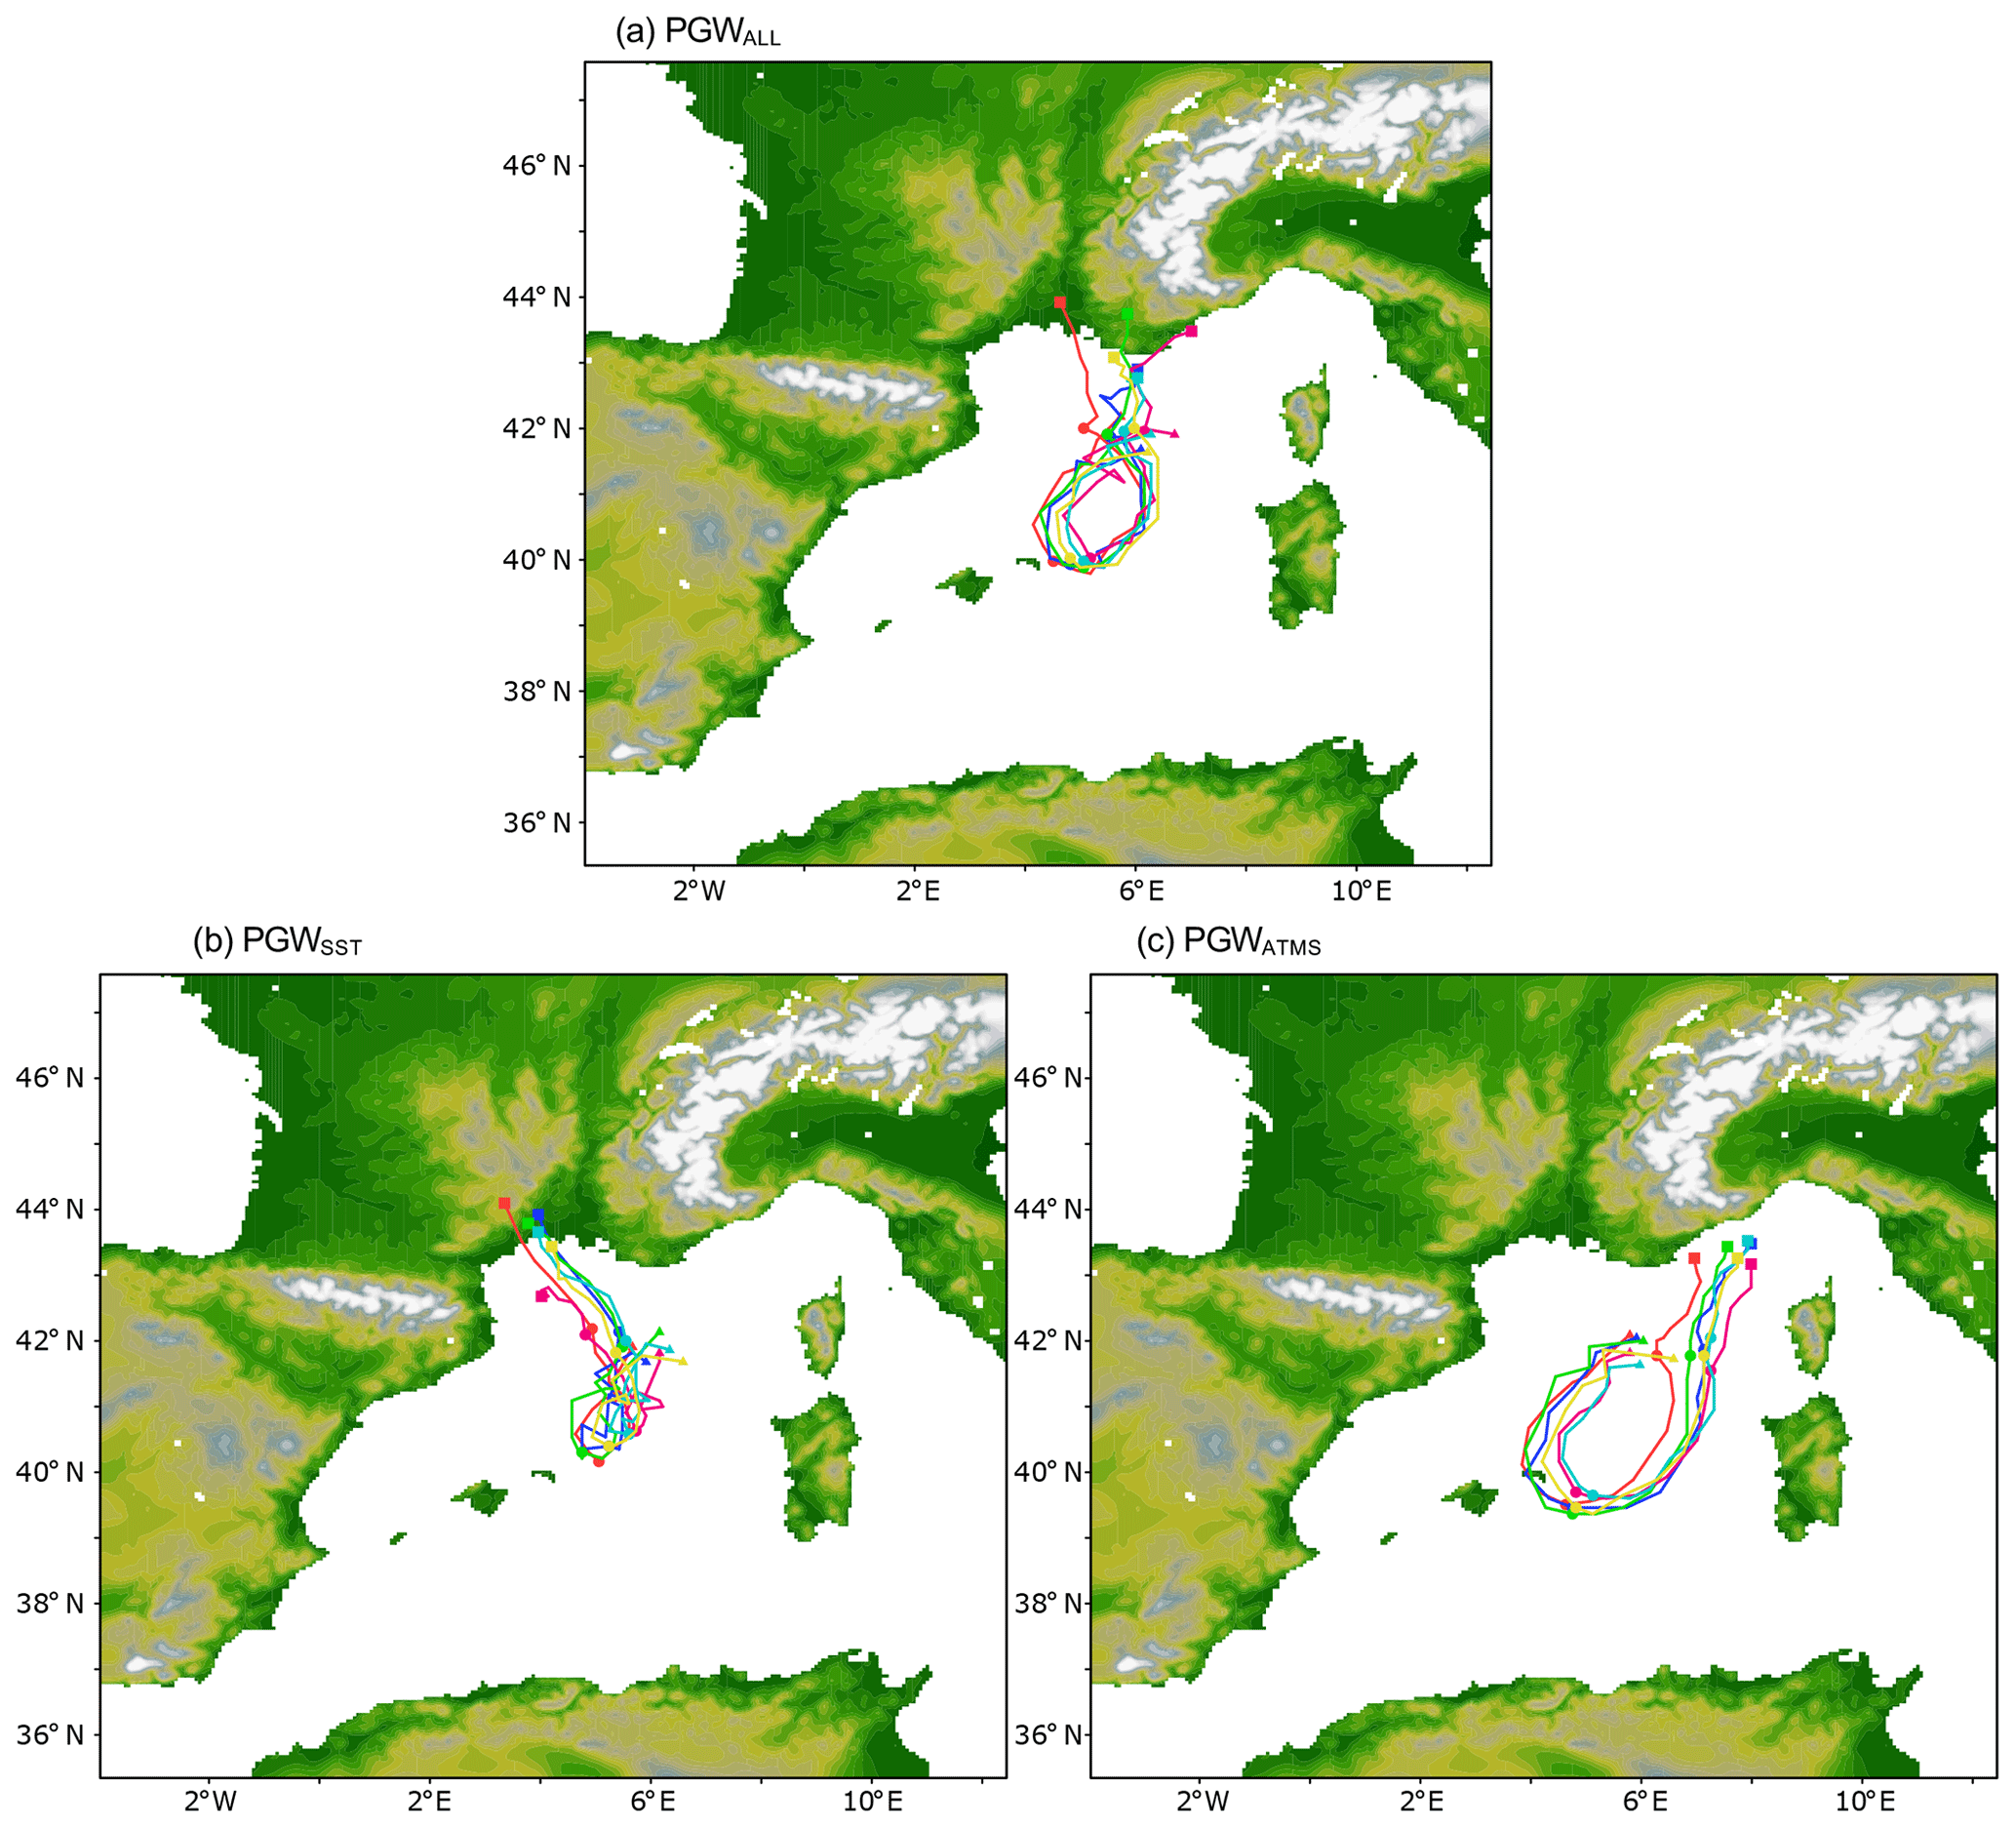
Figure 5Same as Fig. 3, but for (a) PGWALL, (b) PGWSST, and (c) PGWATMS. Note that the track of TD_TP_MN (red), TD_W5_MN (blue), and TD_W6_MN (green) in PGWSST terminates at 15:00–08:00 UTC due to the early landfall.
Figure 5 shows the simulated cyclone tracks of Rolf in the PGW experiments for a six-member multi-physics ensemble. PGWALL reproduces a very similar cyclone track to that in PRS (Fig. 3a). From the beginning, the cyclone moves southward approaching the Balearic Islands. After that, the cyclone progresses northward and makes landfall over southern France. While this behaviour is not considerably different from that in PRS, a few other differences can be detected. Under the future climate change, no simulated Rolf makes landfall over Menorca while some PRS medicanes hit Menorca (Fig. 3a). This indicates that the latitude where the cyclone shifts its direction from south to north tends to be relatively higher than that in PRS (Figs. 3a and 5a). Some of the ensemble members make landfall slightly earlier than PRS. These modifications in the cyclone track are more remarkable in PGWSST shown (Fig. 5b). The simulated medicanes change their marching direction to the north at a much higher latitude (higher than 40∘ N) in all ensemble members, far from the Balearic Islands, at 00:00 UTC on 7 November. After this shift, the cyclone moves northward similar to PRS and PGWALL, but its direction shifts more westward than PRS and PGWALL. Due to those modifications, the simulated medicanes make landfall (one medicane of TD_TP_MJ disappears over the Mediterranean Sea) over southern France at 3.8∘ E, which is more western than PRS and PGWALL, and the landfall is much earlier than PRS and PGWALL, which is at 12:00 to 18:00 UTC on 8 November. Interestingly the PGWATMS simulations of Rolf exhibit a response that contrasts to PGWALL and PGWSST in Fig. 5c. Many ensemble members have a cyclone that strikes Menorca like PRS, but afterwards the cyclones in PGWATMS progress more southward while the cyclone in PRS moves eastward after this landfall on Menorca (Fig. 5c). The cyclones in PGWATMS continue eastward after 00:00 UTC on 7 November and finally change its direction to north around 12:00 UTC on 7 November, which is later by 6 and 12 h than PRS or PGWALL and PGWSST. Instead of moving westward, the cyclone in PGWATMS orientates to the northeast and approaches southern France around 7∘ E at 00:00 UTC on 9 November shown in Fig. 5c. The response of the cyclone tracks to climate change seems different between PGWALL∕PGWSST and PGWATMS and we examine the response of other cyclone features in the PGW experiments.

Figure 6Time series of ensemble of (a) SLP at grid of cyclone centre, (b) latent heat flux, (c) precipitation averaged, and (d) averaged wind speed exceeding the 95th percentile within the 250 km radius of the simulated medicane. Panels (b) and (c) are averaged values within a 250 km radius. The grey bar and red lines denote the variables of PRS and PGWs (with different markers), respectively. All variables are the ensemble mean. Note that the values of TD_TP_MN and TD_W5_MN in PGWSST are excluded from the ensemble mean from 20:00–08:00 and 21:00–08:00 UTC, respectively, due to the extinction of simulated medicanes.
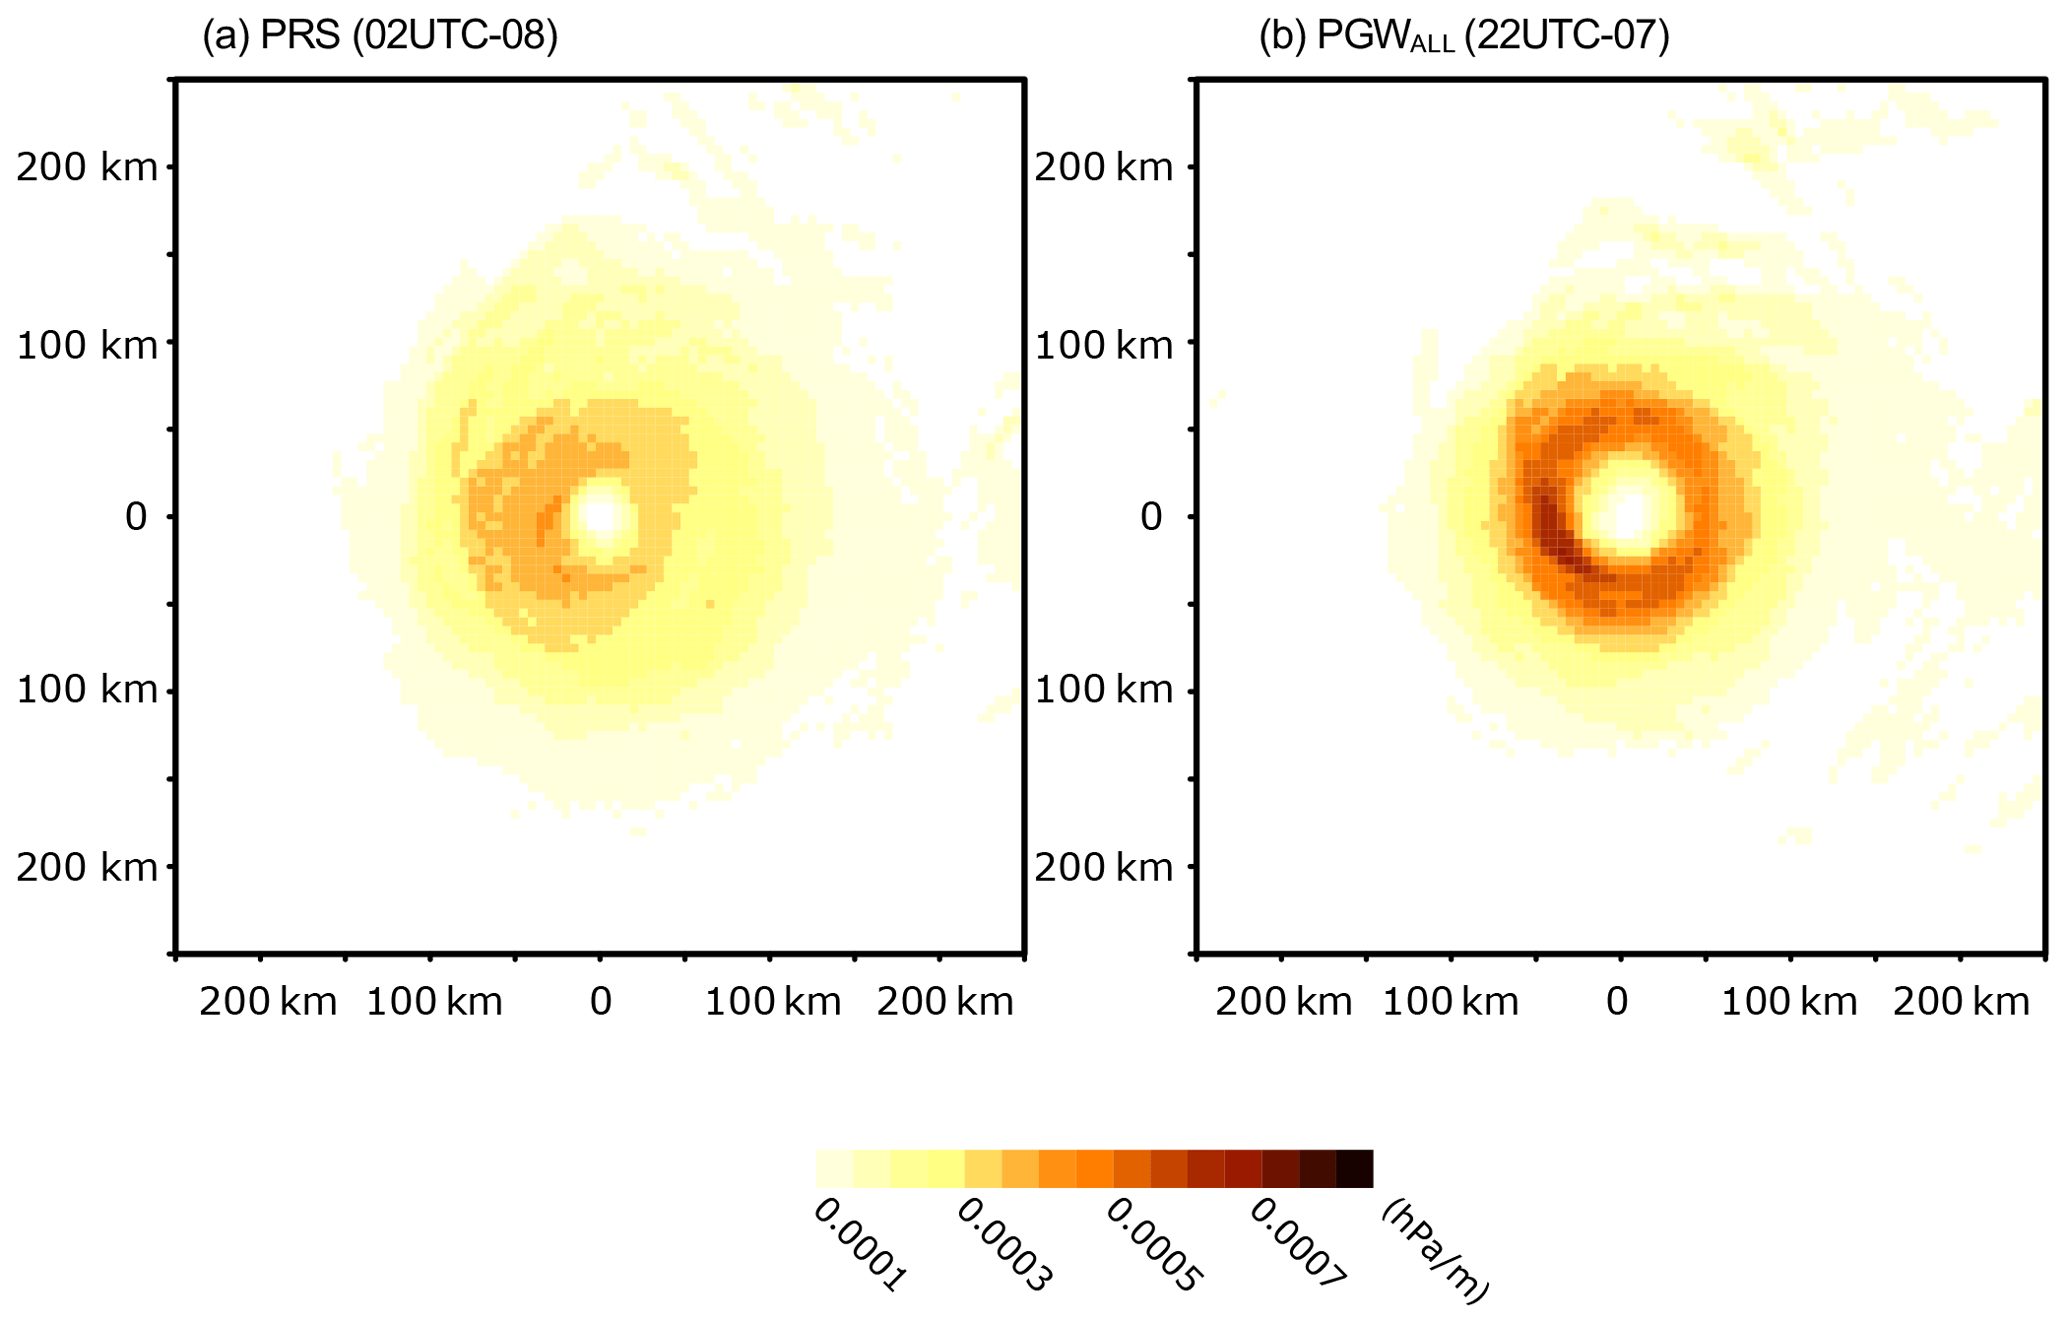
Figure 7Scalar of SLP gradient for (a) PRS and (b) PGWALL around the cyclone centre at SLP minimum (referring to Fig. 6a).
Figure 6a gives a time series of the ensemble-mean SLP in the cyclone centre of PGWs along the cyclone tracks in Fig. 5. Rolf in PGWALL develops the SLP centre in quite a similar way to Rolf in PRS. In the beginning, the SLP decreases once to 991 hPa at 07:00 UTC on 6 November and once again increases until 00:00 UTC on 7 November before decreasing again to 991 hPa between 22:00 UTC on 7 November and 00:00 UTC on 8 November. This SLP depression is slightly lower in PGWALL than in PRS. While the difference of SLP depression between PRS and PGWALL is small, the SLP gradient around the centre is different. Figure 7 shows the scalar of SLP gradient for PRS and PGWALL at the maximum of SLP depression. It is obvious that the SLP gradient is much stronger in the PGWALL than in the PRS around the peak time (PRS is 0.0004 hPa m−1 and PGWALL is 0.0007 hPa m−1), indicating that the warmer climate induces the stronger wind in the centre, which could be linked to changes in precipitation (this aspect is described later). Compared to PRS, the cyclone in PGWALL decays relatively rapidly after the peak at 06:00 UTC on 8 November, in particular, after 12:00 UTC on 8 November. This is likely to be due to the earlier time of landfall of some of the PGWALL cyclones over southern France (Figs. 3b and 5a). Inversely, the SLP of the PGWSST cyclone drops down intensively to 987 hPa from 00:00 to 10:00 UTC on 6 November. The SLP centre in the PGWSST generally continues to decrease until 21:00 UTC on 7 November, reaching 982 hPa. This is a slightly earlier peak time and much lower SLP in the cyclone centre than those in PRS and PGWALL. After this peak, the cyclone in the PGWSST decays quite rapidly (approximately 20 hPa per 24 h between 21:00 UTC on 7 November and 21:00 UTC on 8 November). This is associated with the earlier landfall time compared to PRS and PGWALL (Figs. 3b and 5a, b). It is noteworthy that in the PGWATMS, the SLP generally increases throughout cyclone tracking. While initially the ensemble-mean SLP of the PGWATMS cyclone centre is almost identical to those of PRS and PGWALL, the second depression of the cyclone centre after 0000UTC on 7 November is much weaker than PRS and PGWALL. The second reduction in SLP is detected at 21:00 UTC on 7 November (slightly earlier than PRS), but it reduces only to 997 hPa. The cyclone begins to decay gradually after this. Interestingly, this result suggests that the role of future climate change in the atmospheric and oceanic background has competing effects on medicane development.
Figure 6b shows a time series of latent heat flux gained (averaged) by the simulated cyclone within a radius of 250 km. The evaporation in PGWALL is marginally larger than that in PRS, especially from the beginning at 00:00 UTC on 6 November to 12:00 UTC on 7 November (approximately 50 W m−2 higher at largest). During this period, the temporal variation in evaporation along the cyclone track is almost identical between PRS and PGWALL. In PGWSST, the simulated cyclones obtain much more water vapour from the underlying warmer SST. Initially, the latent heat flux is about 1.5 times more in PGWSST than that in PRS and increases up to 450 W m−2 until 12:00 UTC on 7 November. The uptake of water vapour drops suddenly after 20:00 UTC on 7 November and becomes less than that in PRS at 07:00 UTC on 8 November and is diminished to a few tens of watts per square metre after the earlier landfall. Inversely, the evaporation in PGWATMS is less than that in PRS during the entire period of cyclone tracking. However, the temporal variation in evaporation is quite similar to that in PRS having a peak between 00:00 and 06:00 UTC on 7 November. The decreasing rate of the evaporation after the peak in PGWATMS is relatively more moderate than those in PGWALL and PGWSST probably due to the later time of the landfall (Fig. 5c). While the uptake of water vapour differs among PGWs, its peak leads the maximum of the medicane similarly by 6 to 12 h (Fig. 6a and b).

The precipitation in PGWALL shows a similar variation to that in PRS until 09:00 UTC on 7 November (see Fig. 6c), although the precipitation is slightly stronger. While the precipitation in PGWALL increases at almost the same time as PRS, its maximum value around 19:00 UTC on 7 November is larger than that in PRS (PGWALL is 1.8 mm h−1 and PRS is 1.4 mm h−1). This implies that the simulated cyclone in PGWALL can obtain more energy from diabatic heating than PRS, which could result in a stronger SLP gradient shown in Fig. 7. This stronger precipitation can be associated with an enhanced uptake of the water vapour in PGWALL as shown in Fig. 6b. In PGWSST, the precipitation is very similar to that in PRS and PGWALL at the beginning. However, the precipitation keeps its relatively strong intensity, and consequently, the difference from PGWALL and PRS is large during the cyclone lifetime. After 00:00 UTC on 7 November, precipitation increases and its peak increases and peaks at 2.6 mm h−1 before 21:00 UTC on 7 November. This value is 31.2 mm every 12 h of PGWSST (within 250 km radius) that can be classified as the extremely intense precipitation event in the Mediterranean Sea according to Fig. 8 of Flaounas et al. (2019). After this, the precipitation is abruptly reduced due to the earlier timing of the landfall (Fig. 5b). This intense rainfall can be associated with the increased water vapour available in PGWSST (Fig. 6b). The precipitation of PGWATMS also shows an identical variation with PRS in the beginning of the track. Associated with the moderate latent heat flux in Fig. 6b, the precipitation is less during the whole life cycle of the cyclone and does not show a clear peak (two small peaks at 17:00 UTC on 7 November and 06:00 UTC on 8 November) with a smaller amount than those in PRS and other PGWs.
Figure 6d illustrates a time series of MWS for the PGW experiments. In PGWALL, the hourly changes in MWS are similar to those in PRS, but they are stronger than in PRS through most of its life cycle (at largest, 6 m s−1 higher in PGWALL). The maximum value of MWS reaches 26 m s−1 at 00:00 UTC on 8 November. After 06:00 UTC on 8 November, the MWS in PGWALL gradually reduces, and eventually its value becomes smaller than that of PRS. This could be caused by the slightly earlier landfall in PGWALL than PRS (Fig. 5a). In PGWSST, the MWS is almost identical to that in PGWALL until 00:00 UTC on 7 November. After this time, the MWS in PGWSST gets stronger than that in PGWALL and an increase rate of in MWS is about 8 m s−1 between 12:00 UTC on 7 November and 00:00 UTC on 8 November, reaching 30 m s−1 at 00:00 UTC on 8 November. The MWS decreases rapidly (from 28 to 12 m s−1 every 14 h) after 05:00 UTC on 8 November probably due to the earlier landfall (Fig. 5b). In PGWATMS, on 6 and 7 November, the MWS is stronger than that in PRS. However, after 00:00 UTC on 8 November, the MWS in PGWATMS is weaker than that in PRS, resulting in a smaller maximum amplitude of MWS during the cyclone tracking in PGWATMS being smaller than in PRS (21 m s−1 for PGWATMS and 24 m s−1 for PRS). In addition, as seen in Fig. S2, the ratio of grid boxes with weaker wind speeds (category of 5 to 10 m s−1) is larger in PGWATMS than in PRS (in particular, 12:00 UTC on 7 November and 08:00 UTC on 8 November). That is, the area of strong winds is much smaller in PGWATMS than in PRS (the horizontal distribution of winds will be given in Fig. 9).
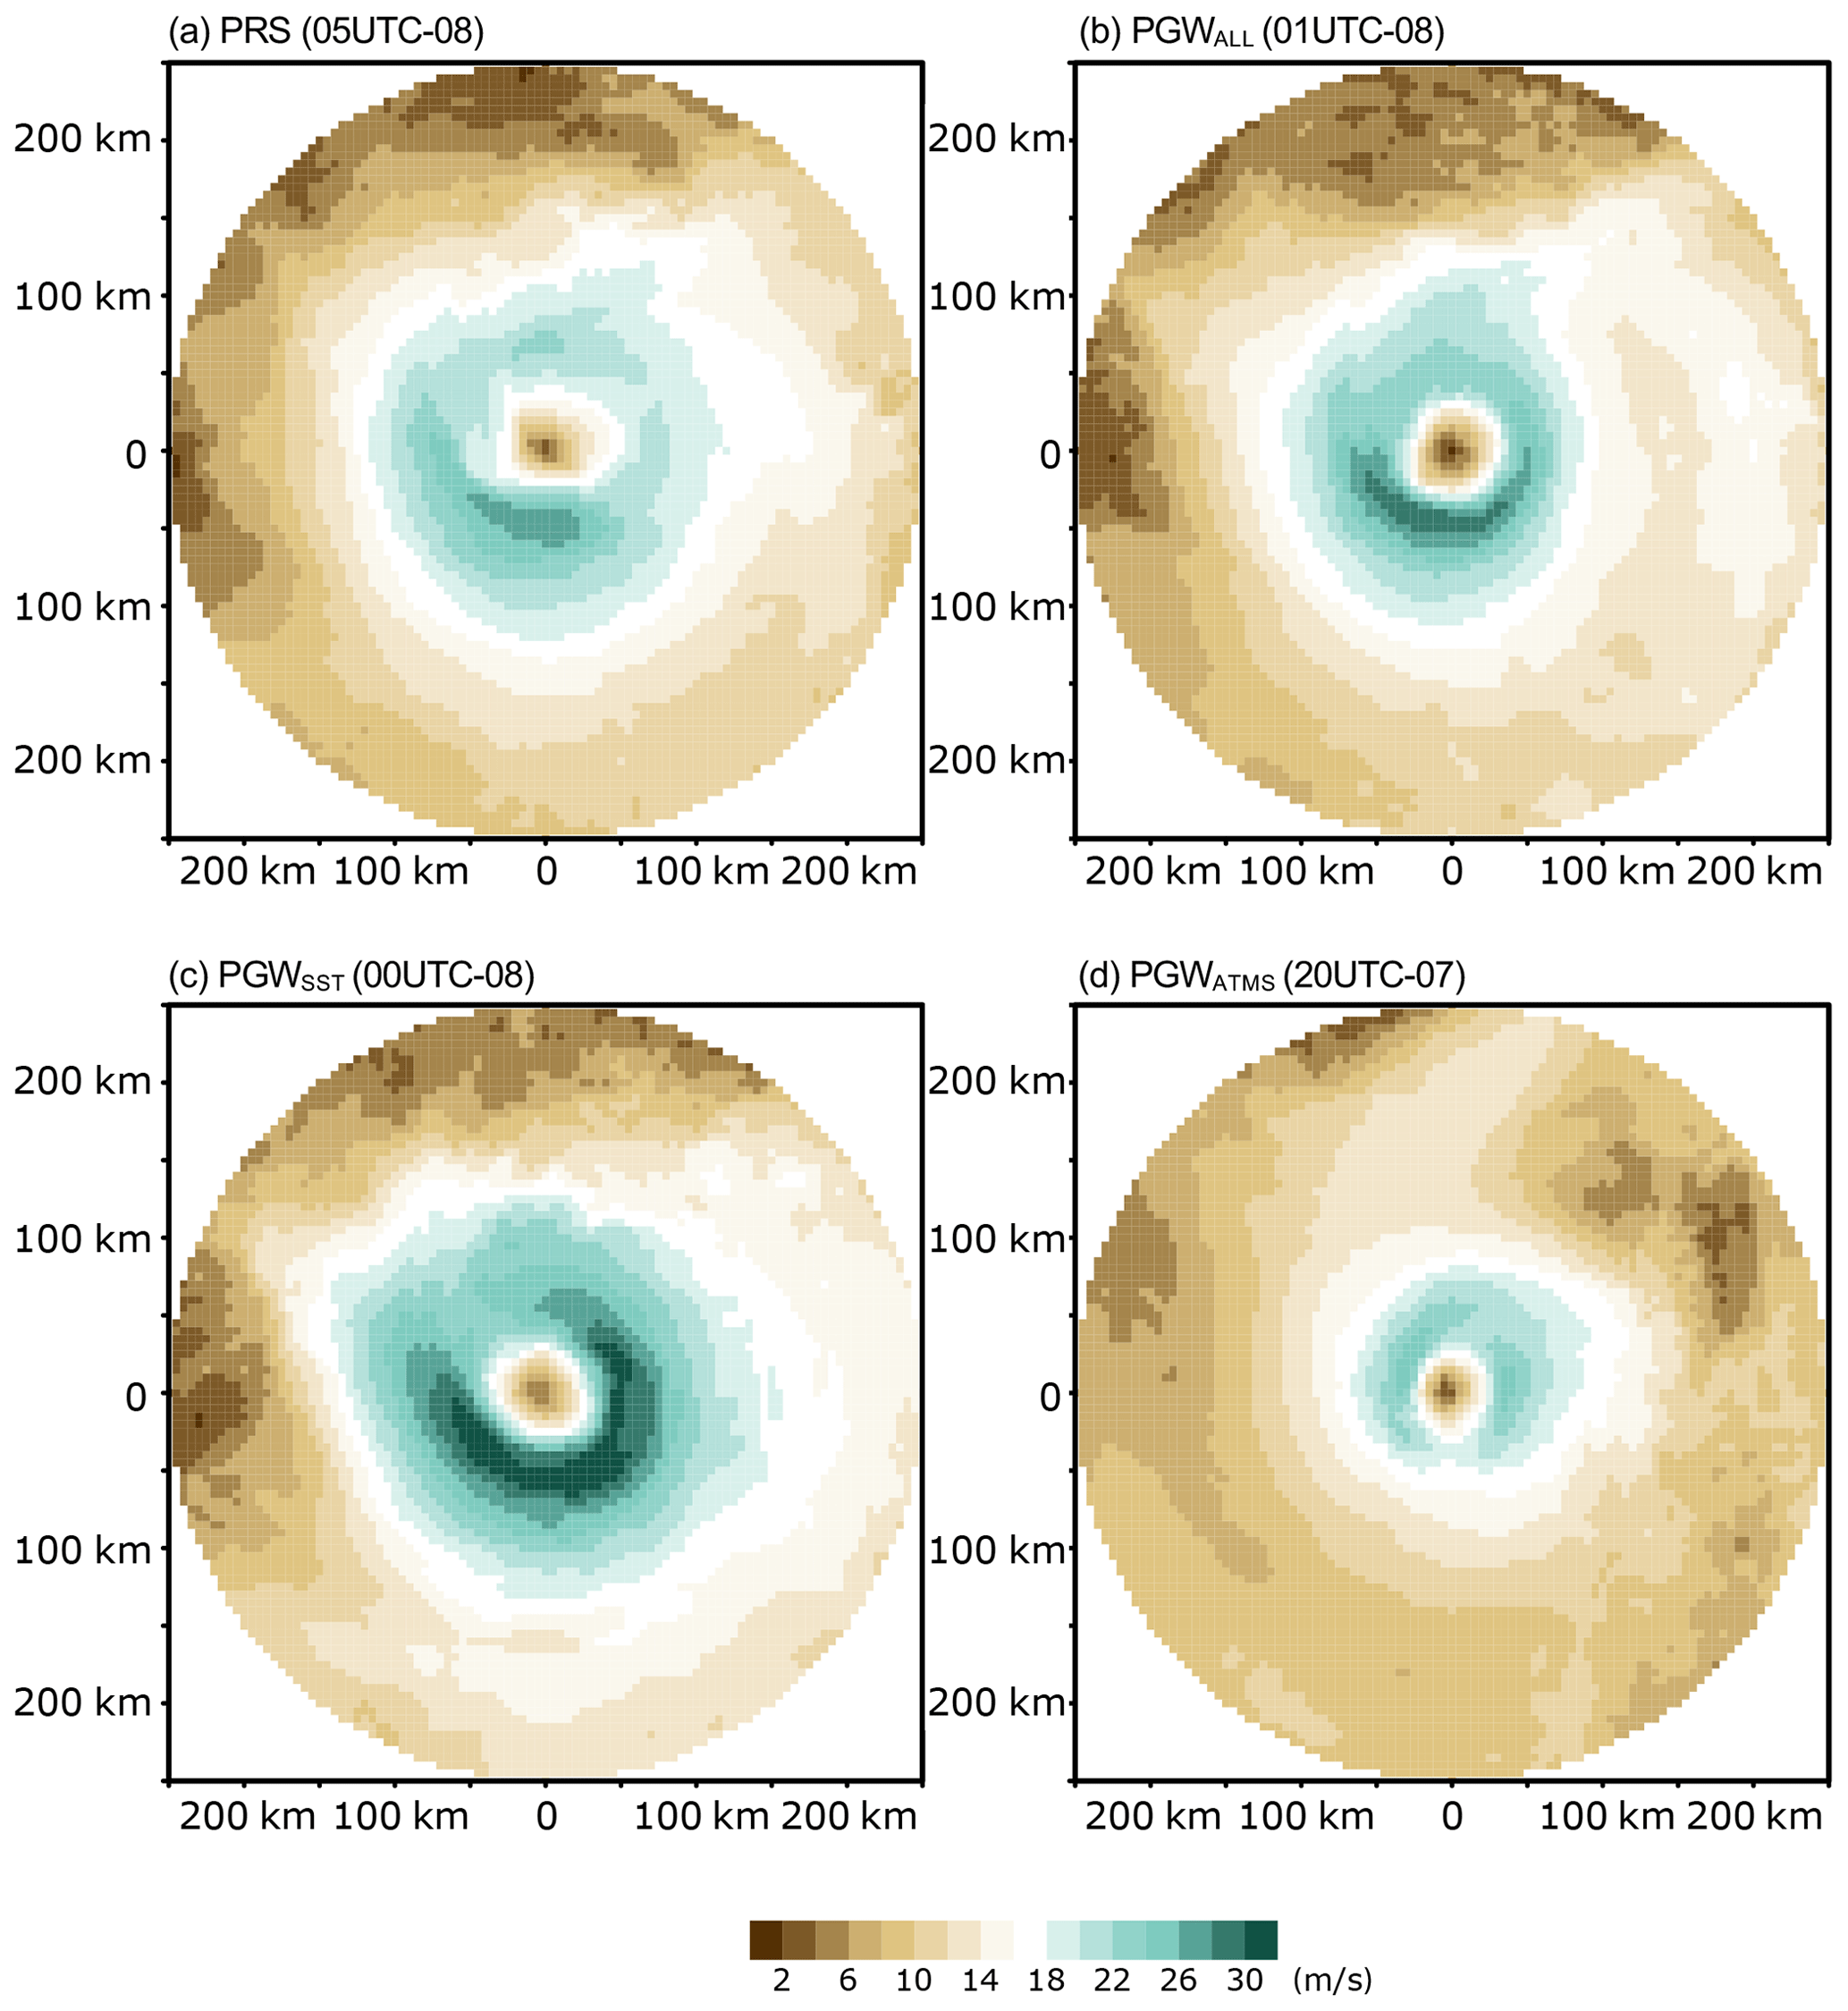
Figure 9Surface wind speed during maximum wind speed (referring to Fig. 6d) for (a) PRS, (b) PGWALL, (c) PGWSST, and (d) PGWATMS around the cyclone centre.
Figure 8 illustrates a diagram of the cyclone phase space in PGWs. Whilst the phase shift from a shallow to a deep warm core is almost identical in the PRS and PGWALL, the warm core of the PGWALL simulated cyclone is relatively stronger, especially in the lower troposphere (Fig. 8a). Towards the end of tracks, the structure of the deep warm core in some members of the PGWALL (TD_W6_MN and TD_TP_MJ) are diminished substantially and this is due to the earlier landfall than PRS. In PGWSST, the simulated cyclones change their phase from shallow to deep warm core in a similar way to PRS and PGWALL (Fig. 8b). However, once the cyclone shifts to a deep warm core, the structure of the deep warm core is strengthened, and consequently, some ensembles of simulated cyclones reach much larger values of deep warm core (the values in both troposphere reach more than 200) than PRS and PGWALL. Due to the much earlier landfall, the structure of the deep warm core of some ensemble members shrinks abruptly after its mature state, and eventually the cyclone is reduced to one with a cold core at the end of track. The phase shift of the cyclone in PGWATMS is also similar to those in PRS and PGWALL in Fig. 8c. In contrast, after the cyclone is converted into a tropical-like cyclone, the maximum value of the deep warm core phase is smaller than those of PRS and other PGWs. There is no rapid reduction of warm core in PGWATMS since the cyclone achieves landfall later than other PGW simulations (Fig. 5c).
Under global warming, the development of the medicane is modified with respect to that of the present climate (in particular, a moderate intensification as aforementioned from Figs. 6 to 8). Here, we explore the horizontal structure of the medicane. The wind speed of PRS exceeds 24 m s−1 at the peak of SLP depression (based on Fig. 5a) in Fig. 9a. Within a 100 km radius, the wind speeds are 20 m s−1. In PGWALL, while the radius of high wind speeds appears to be slightly smaller, the wind speed is 24 m s−1 over a large part within the radius of 100 km (see Fig. 9b), and the maximum value (faster than 26 m s−1) is larger than that of PRS. This result is consistent with the stronger SLP gradient around the cyclone centre in PGWALL as shown in Fig. 7. Regarding the intensification in the SLP depression, the surface wind speed is much stronger in PGWSST than PRS and PGWALL in Fig. 9c. The wind speed exceeds 30 m s−1 in most areas within the radius of 100 km (except for the centre). In contrast, wind speeds for the cyclone in PGWATMS are substantially lower. Its MWS is 22 to 24 m s−1, which is equivalent to that in PRS (as shown Fig. 7d, the hourly MWS in PGWATMS is larger than that in PRS), but the area of high-speed winds is obviously diminished in Fig. 9d, and the strong wind speed is limited only in the northern sector around the centre.

Figure 10Precipitation during its maximum (referring to Fig. 6c) for (a) PRS, (b) PGWALL, (c) PGWSST, and (d) PGWATMS around the cyclone centre.
Figure 10 illustrates the rainband structure of each simulated cyclone during the precipitation peak given in Fig. 6c. In PRS, the cyclone has a spiral band of precipitation around the centre (Fig. 10a). In particular, the precipitation is active (up to 9–10 mm h−1) in the northern sector of the cyclone, and the strong rainfall extends to the northeast direction within a radius of 150 km. There is little rainfall in the centre area, which could be the cloud-free “eye”; this can be easily detected, and it is also a key feature of tropical-like cyclones. As seen in Fig. 6c the precipitation of PGWALL intensifies during its peak in Fig. 10b. Whereas the spiral band of precipitation is likely to be similar to that in PRS in the northern sector, the precipitation is more intense than PRS around the centre (reaches 16 mm h−1) and the southern sector. It seems that the spiral rainband of the medicane is reinforced due to projected global warming. The eye of the medicane is larger than that in PRS. The warmer SST enhances the spiral band more effectively in Fig. 10c as shown in Fig. 6c. The precipitation around the centre exceeds 16 mm h−1 in the southern sector and the northeastward rainband is elongated with intense rainfall. In the far side of the southern sector, the rainband is more activated (up to 8 mm h−1) compared to PGWALL. This is associated with the much deeper depression of SLP and stronger wind in PGWSST (Figs. 5a and 9c). Corresponding to the deactivated precipitation due only to the warmer atmosphere (Fig. 7c), the rainband around the cyclone centre in PGWATMS is reduced significantly as shown in Fig. 10d. While the maximum rainfall is still more than 14 mm h−1 near the centre, the rainband almost loses its spiral structure, and the area of intense rainfall is limited only around the cyclone centre.
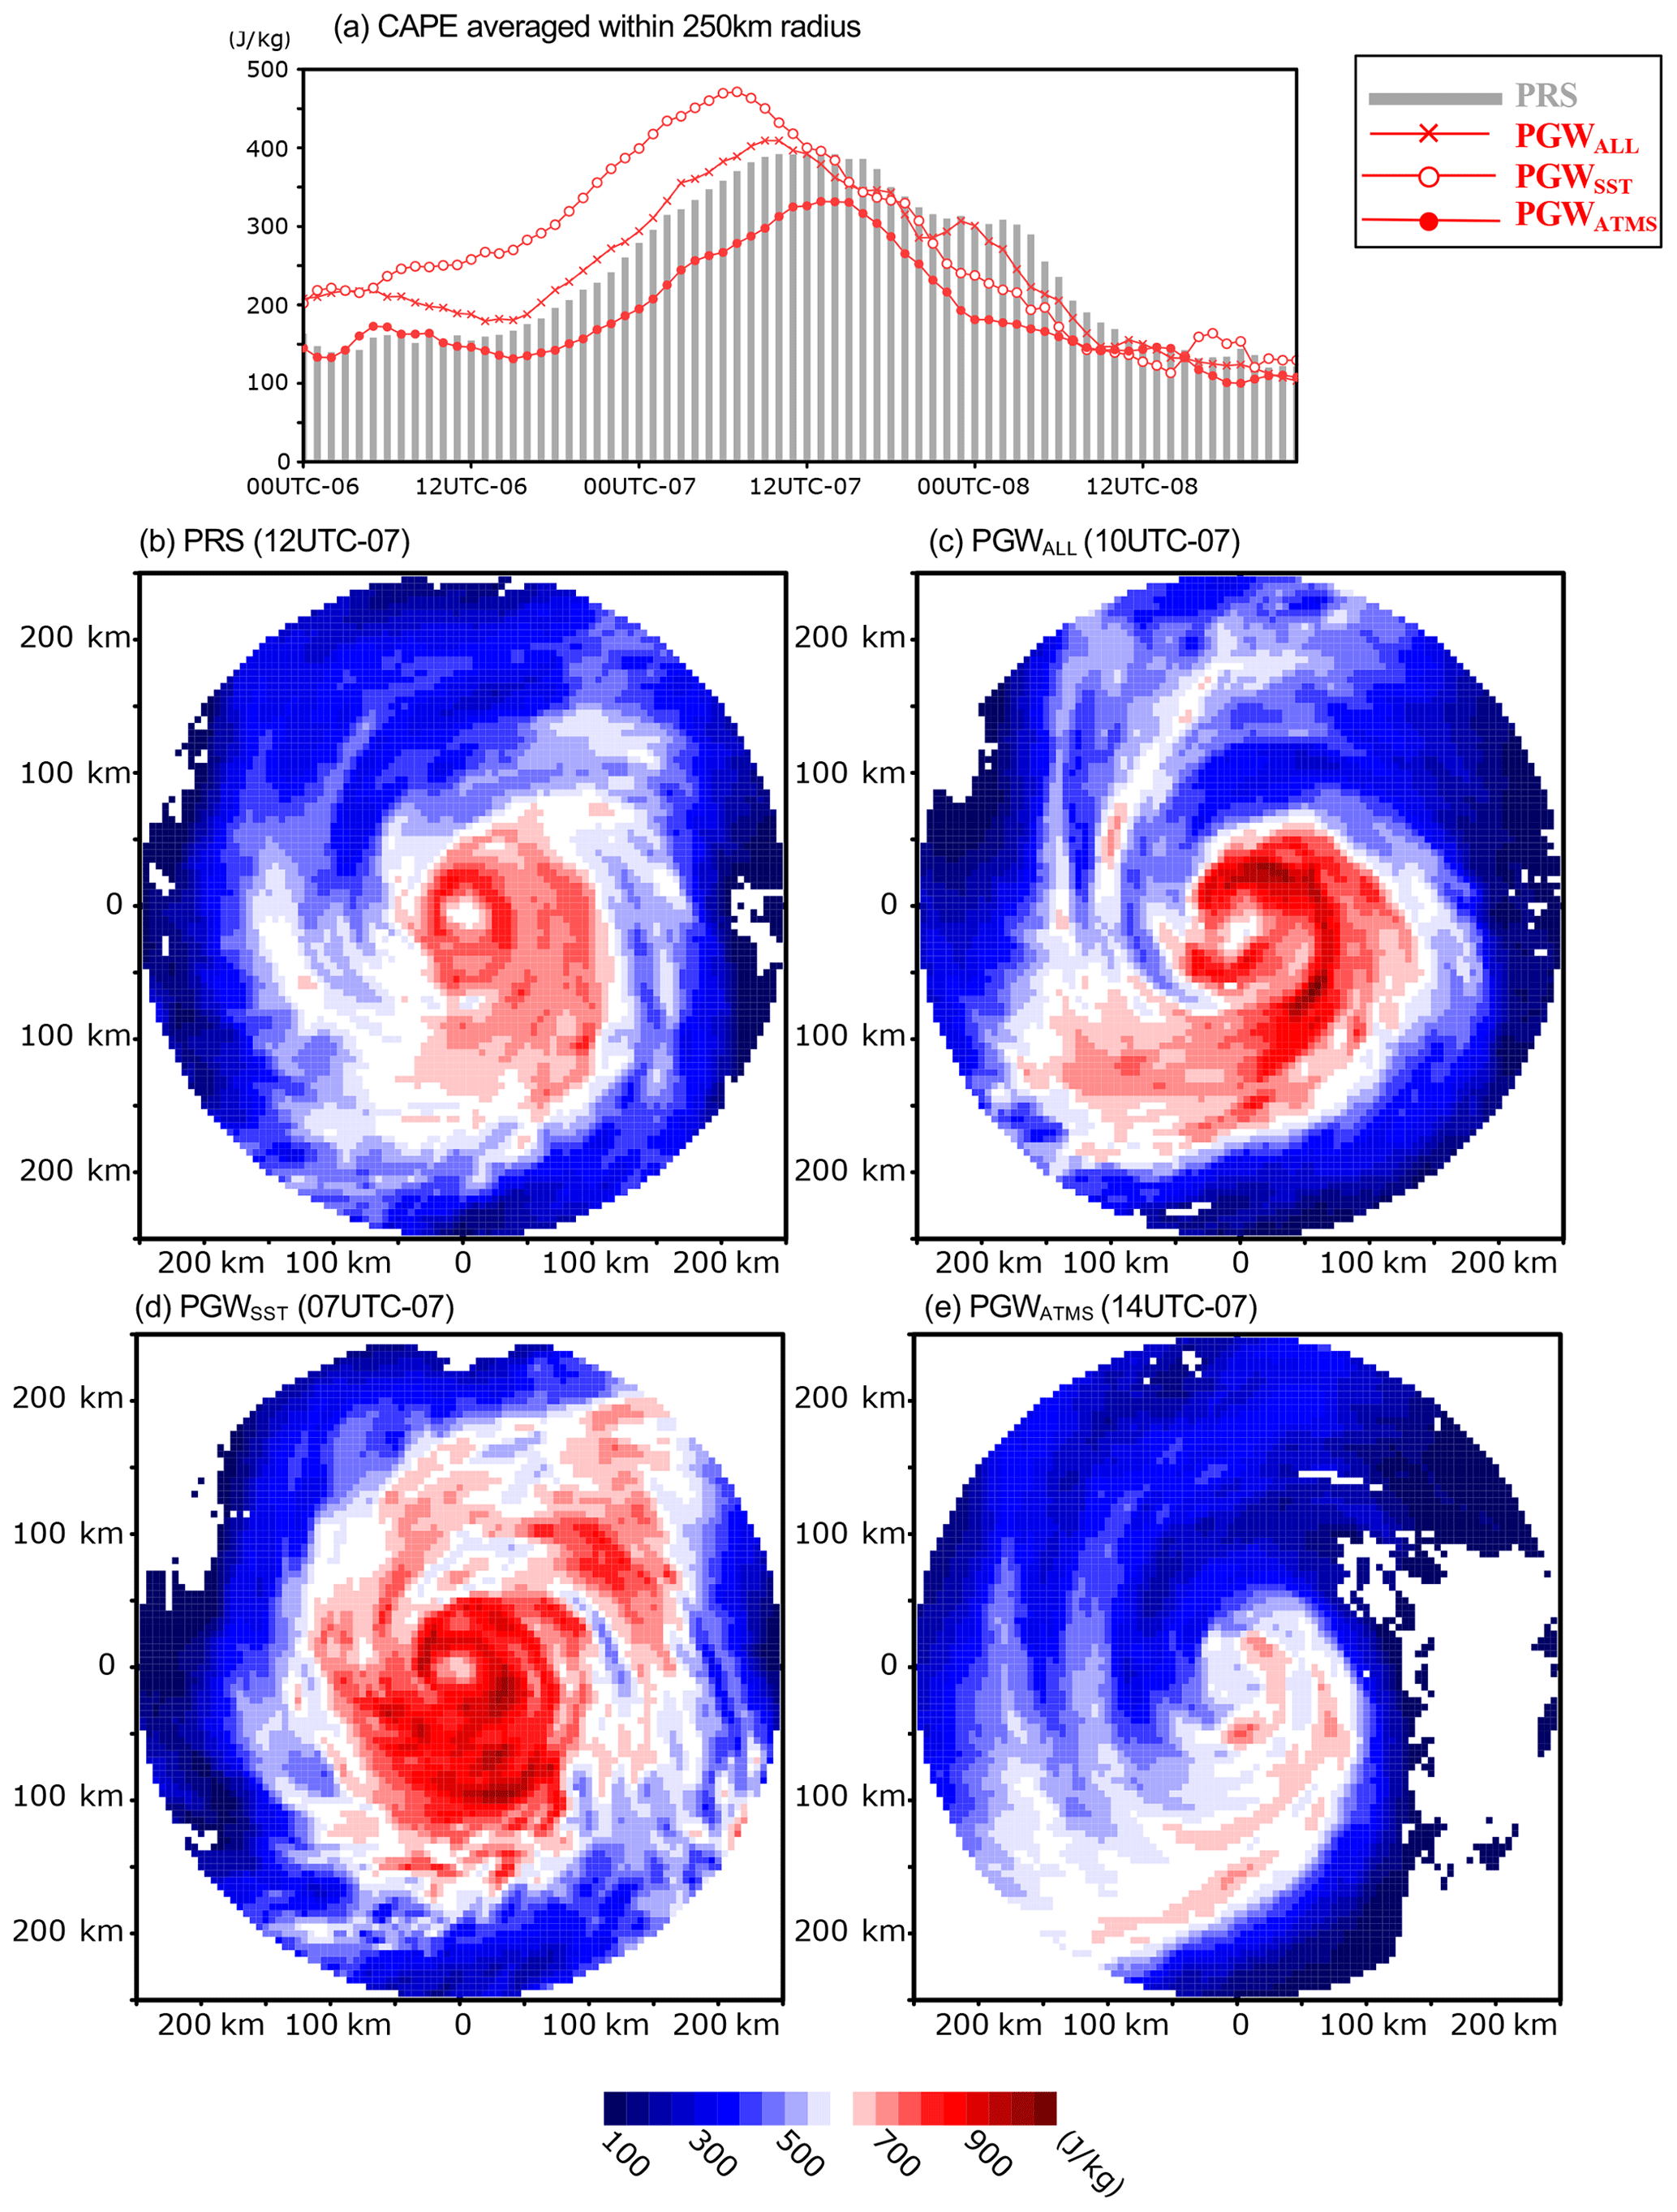
Figure 11(a) Same as Fig. 6b, but for convective available potential energy (CAPE) and CAPE at its minimum (referring to Fig. 10a) for (b) PRS, (c) PGWALL, (d) PGWSST, and (e) PGWATMS around the cyclone centre.
In the previous section we showed that the warmer climate leads to a moderate medicane intensification in agreement with previous studies (e.g. Cavicchia et al., 2014; Tous et al., 2016; González-Alemán et al., 2019). The results also showed more enhanced precipitation, surface wind speed, and a SLP deepening around the medicane. Interestingly though, the warmer atmosphere inhibits the medicane development substantially, while the warmer ocean enhances the medicane considerably. In this section, we discuss the roles of the atmosphere and the ocean in the medicane's response to future warming.
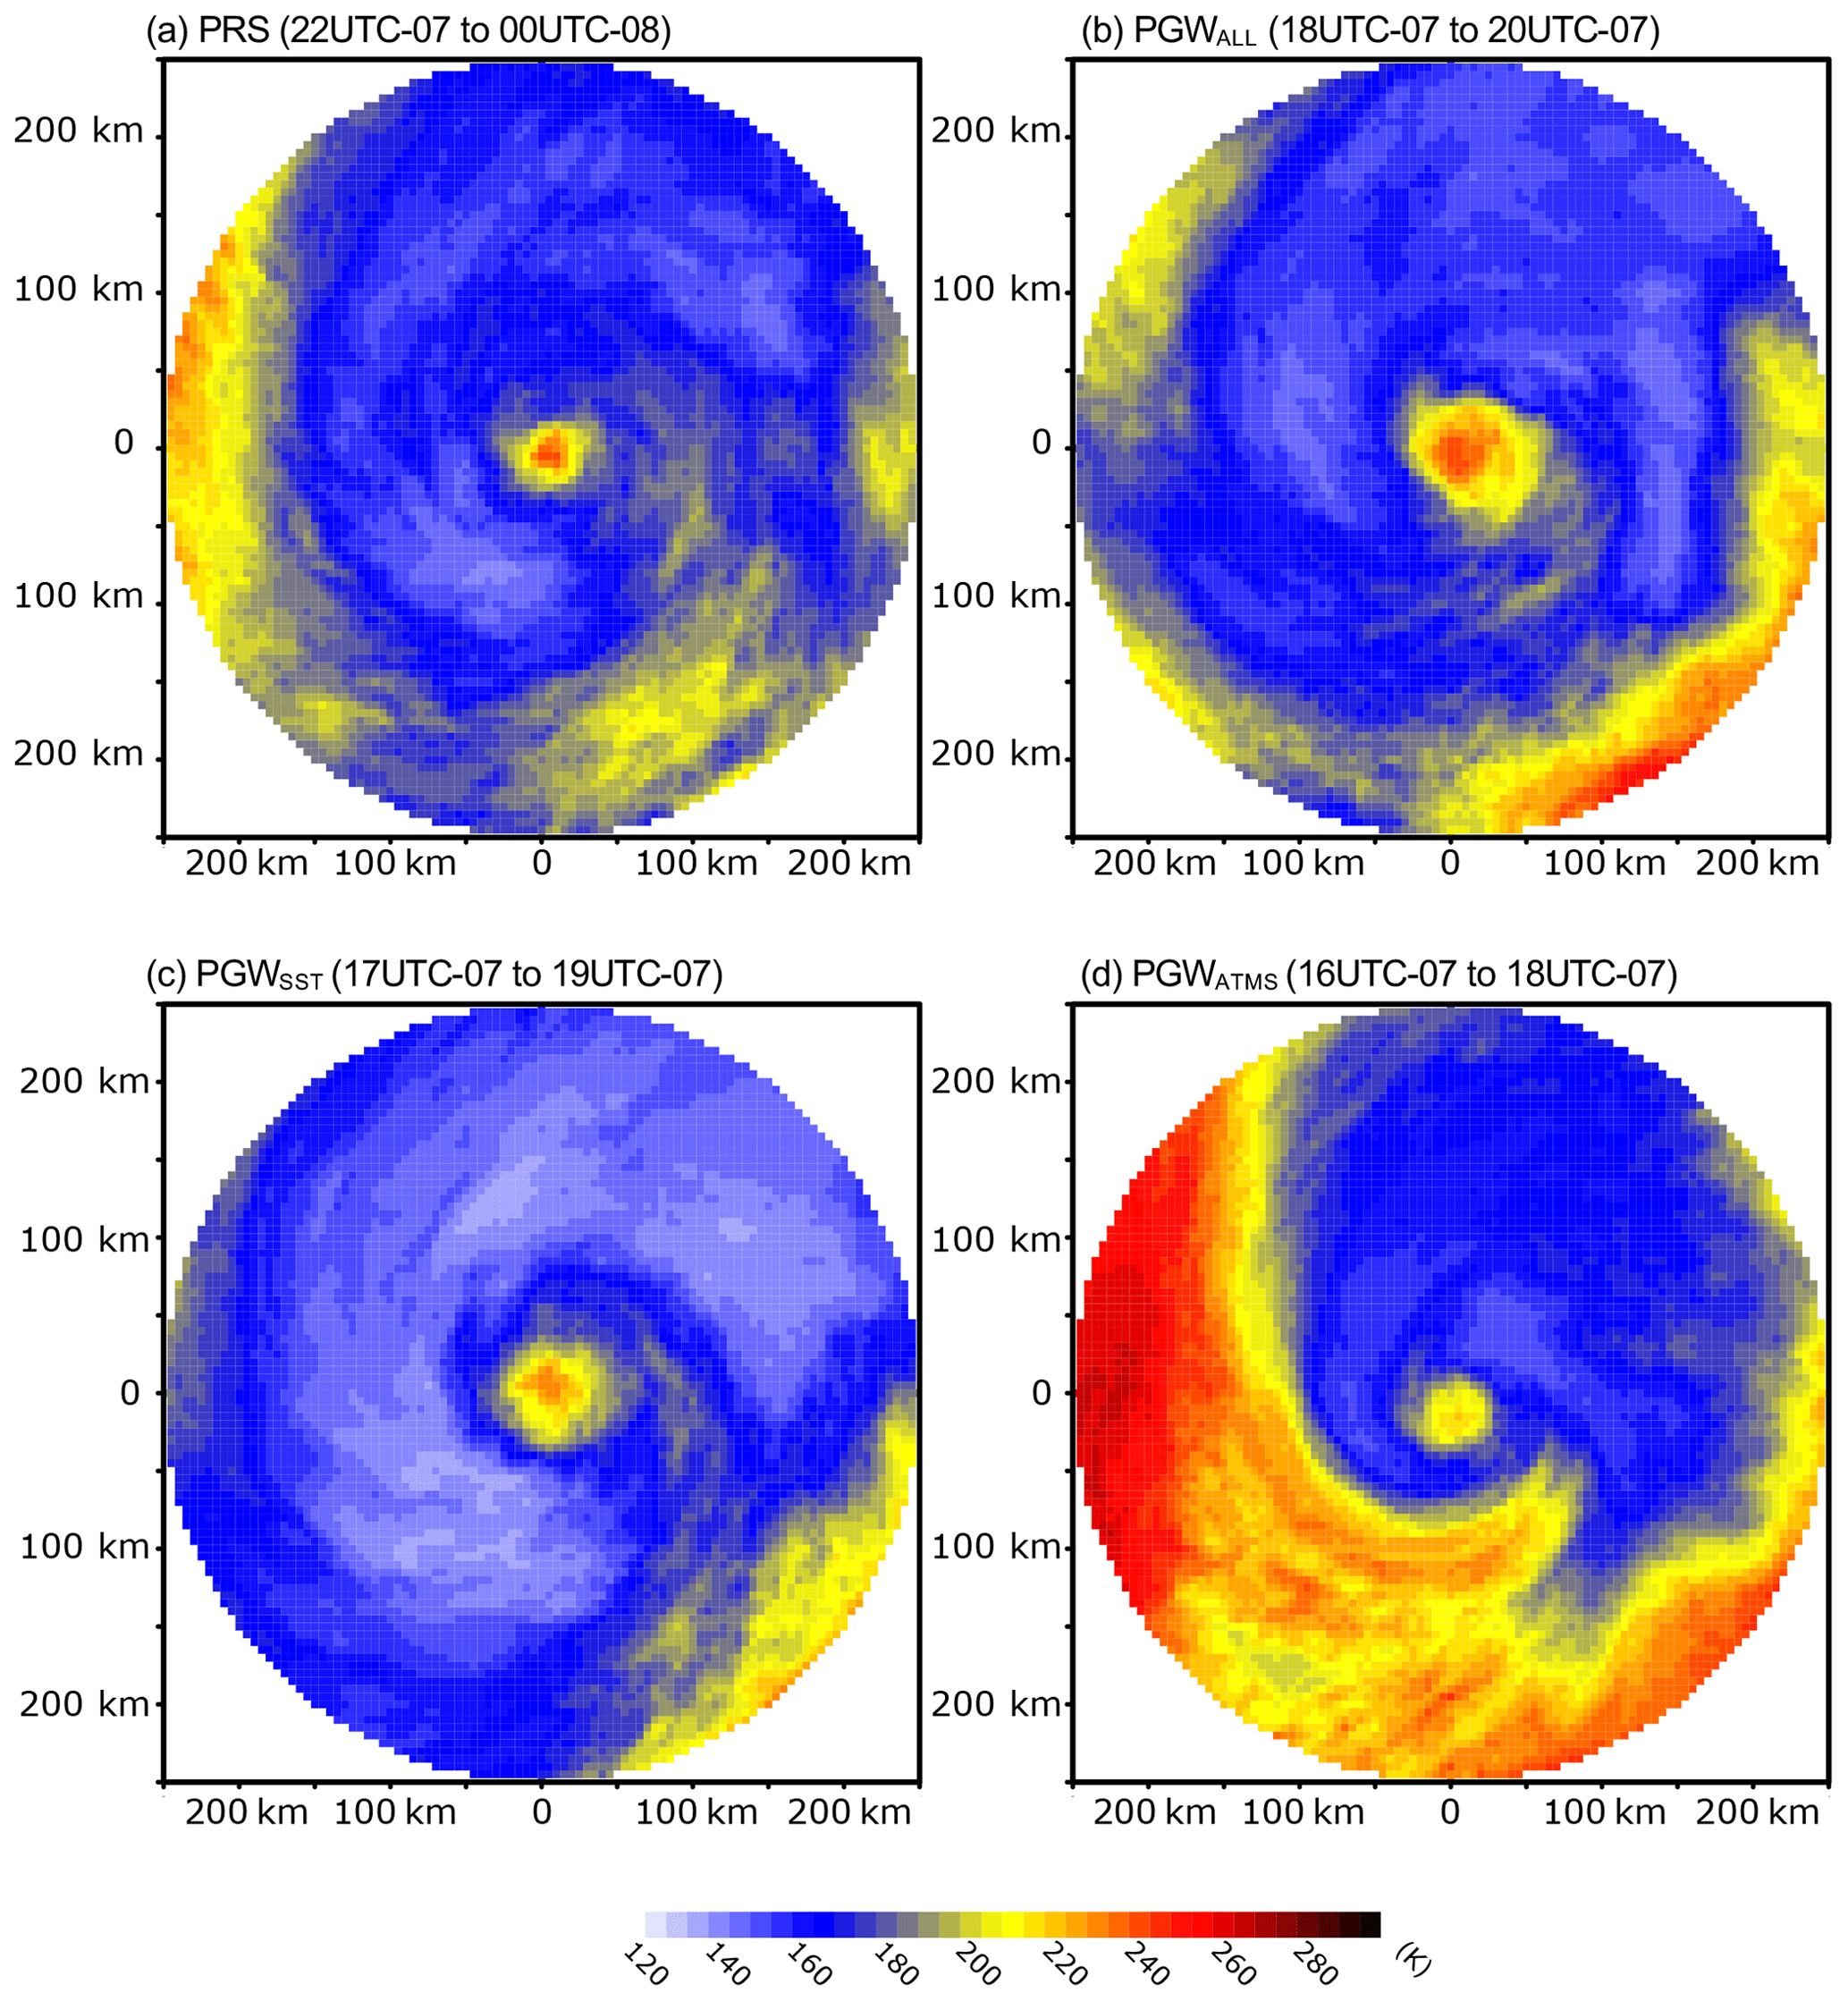
Figure 12Same as for Fig. 10, but for outgoing longwave radiation (OLR) during intense rainfall in Fig. 6c.
Figure 11a gives a time function of convective available potential energy (CAPE) averaged within the 250 km radius around the cyclone centre. CAPE in PRS increases from the beginning and reaches its peak (400 J kg−1) around 10:00 UTC on 7 November. This peak occurs earlier than the maximum of precipitation as shown in Fig. 6c. In the remaining time, CAPE decreases corresponding to the decay of the cyclone. PGWALL has a slightly larger CAPE than PRS. CAPE becomes smaller in PGWALL than PRS after the peak, probably because the cyclones in PGWALL tend to make a slightly earlier landfall. Such a difference is most obvious in PGWSST. CAPE in PGWSST becomes much larger at 12:00 UTC on 6 November (250 J kg−1) and the timing of its peaks is at 07:00 UTC on 7 November, which is relatively earlier than PRS. After the peak, CAPE decreases much more abruptly than PGWALL partially due to the earliest time of landfall. Inversely, CAPE in PGWATMS is smaller than PRS during almost the entire cyclone track. Figure 11b–e give CAPE of each WRF simulation at its maximum in Fig. 11a. Between PRS and PGWALL, the simulated cyclones gain more energy in PGWALL (at maximum, 800 J kg−1 for PRS and more than 1000 J kg−1 for PGWALL, Fig. 11b and c), resulting in the enhanced precipitation. In PGWSST, the simulated medicanes also obtain a lot of energy like PGWALL and the area of large CAPE (more than 1000 J kg−1) spreads more widely around the cyclone centre than PRS and PGWALL (Fig. 11d). In addition, the CAPE is larger in the northern sector of the PGWSST medicane than other simulated medicanes (800 to 900 J kg−1). This wider area of high CAPE is consistent with the larger area of intense precipitation (Fig. 10c). Contrastingly, CAPE in PGWATMS shrinks extensively, and its size of high CAPE is much smaller than PRS.
Figure 12 gives the outgoing longwave radiation (OLR) as a proxy of cumulus convection during the time of maximum rainfall (see Fig. 6c) in each experiment. In PRS, the deep cumulus convection is well developed (the OLR is 140–150 W m−2) around the medicane centre during the rainfall peak (Fig. 12a). Inversely, the high OLR (240–260 W m−2) is detected in the centre, which could be a cloud-free area. In PGWALL, the low OLR (140–160 W m−2) is extended more to the northern sector of the simulated medicane than PRS (Fig. 12b). The cloud-free area in the centre seems to be larger than PRS. Due to the warmer SST, the deep cumulus convection is reinforced, indicated by the much lower OLR around the medicane centre in PGWSST (130–140 W m−2, Fig. 12c). The cloud-free area is quite similar to that in PGWALL. In PGWATMS, contrastingly, the low-OLR area decreases considerably, and the southern sector of the medicane is covered with high OLR (240 W m−2). While the cloud-free area in the centre has the same size as that of PRS, the OLR is relatively lower than that of PRS (210 W m−2), indicating that the tropical-like cyclone is weakened in PGWATMS. These CAPE and OLR differences are consistent with the results of precipitation differences (Figs. 5c and 10).
In PGWSST, the warmer underlying SST enhances the latent heat flux and the atmospheric conditions are more favourable for cumulus convection. In addition to the evaporation, surface wind associated with the medicane is also substantially enhanced during the cyclone's lifetime (especially before and at the peak). This possibly indicates that the wind-induced surface heat exchange (WISHE) mechanism is enhanced in PGWSST. Conversely, in PGWATMS, the background troposphere is warmed and drier through the entire troposphere compared to PRS (Fig. 2c). Even though the ocean forcing is similar in PRS and PGWATMS (since the SST boundary condition does not differ), the warmer temperature and the lower relative humidity due to global warming (Fig. 2c) are unfavourable for condensation. This means that CAPE is reduced, resulting in reduction in deep cumulus convection (Fig. 12d). That is, the diabatic heating is less effectively generated and the WISHE mechanism and SLP depression are also reduced in PGWATMS. The moderate intensification of the medicane in PGWALL is a consequence of the competition between enhancement due to the warmer SST and suppression due to the warmer–drier atmosphere.
However, we need to consider the role of SST change due to surface wind and evaporation. When evaporation is more effective in PGWSST and less effective in PGWATMS, the underlying SST can be cooled down and warmed up. Due to the regional climate model used in this study, our result does not consider the two-way interactions between the atmosphere and ocean and how this impacts the response of medicane characteristics in a warmer climate. Future work will investigate these impacts on the medicane with a coupled atmosphere–ocean regional climate model (e.g. Akhtar et al., 2014; Mooney et al., 2016; Ricchi et al., 2019) to increase robustness of our results in this study.
In this study we investigated the impacts of future climate change on a tropical-like cyclone (medicane) formed in the Mediterranean Sea in a PGW framework with the WRF regional climate model. The main novelty of this work is the investigation of the relative roles of the atmosphere and ocean in the medicane's response to projected global warming.
We performed six physical ensemble simulations of the medicane Rolf under present (PRS) and future warming conditions of 1.5 ∘C by applying the PGW method for RCP8.5 according to the middle of the 21st century (e.g. Parker et al., 2018; Mooney et al., 2020). Compared to the reference track of ERA5 reanalysis, PRS of WRF simulates Rolf realistically making a landfall over southern France. While the SLP depression of Rolf is stronger in PRS than in ERA5 partially because of difference in grid size, the SLP deepening decreases to 992 hPa in PRS, which is consistent with previous studies (e.g. Miglietta et al., 2013). PRS also represents the phase transition to a tropical-like cyclone with a deep warm core well.
The PGW experiments revealed obvious changes in medicane structure associated with global warming. Firstly, there are clear impacts on the cyclone track: in PGWALL and PGWSST, the medicane tends to move into more northern and western pathways, and its timing of landfall becomes earlier than that of PRS (in particular in PGWSST). Conversely, the medicane in PGWATMS shifts more southward and eastward. This difference in cyclone track might not be a random response, but it seems to be associated with changes in the intensity of the medicane. In PGWALL and PGWSST, the medicane is more enhanced in terms of surface wind and precipitation around the cyclone centre (e.g. Cavicchia et al., 2014; González-Alemán et al., 2019), and the degree of intensification is much stronger in PGWSST and PGWALL (e.g. the hourly maximum wind speed reaches 30 m s−1 in PGWSST in Fig. 6d). The cyclone track of the stronger medicane in PGWSST is more to the north and, consequently, makes an earlier landfall than in PGWALL. Inversely, the medicane in PGWATMS reduces its intensity to a large extent with a smaller size of region with high wind speed. The northward shift in position of the maximum wind speed associated with the medicane is also detected in a climate projection by Tous et al. (2016). The changes in cyclone track shown in this study might be indicative for the results of Tous et al. (2016). However, since our simulations address only one medicane with six-member multi-physical ensembles, we will need to investigate the changes in cyclone track due to global warming in other case studies, so that the implication for medicanes more generally becomes more robust.
Our PGW simulations elucidated the counteracting individual contributions of a warmer atmosphere and a warmer ocean to the development of medicanes associated with global warming. Since the warmer and drier atmosphere reduces cumulus convection indicated by weaker CAPE and larger OLR, the energy due to diabatic heating is not sufficient. This situation can be ineffective to drive the WISHE mechanism (hourly maximum wind speed is approximately equivalent between PRS and PGWATMS, but the area of high wind speed is much smaller in PGWATMS than in PRS). Consequently, the transition from a cut-off low into a tropical-like cyclone tends to be degraded. Conversely, the warmer ocean surface enriches the medicane with moisture, which allows cumulus convection to develop more effectively (Figs. 11c and 12c). With a more efficient energy gain, the medicane growth is enhanced and WISHE (e.g. Eamanuel, 1986) can be also activated, as indicated by the results of PGWSST. Consolidating these reversal effects of warmer (and drier) atmosphere and ocean (through nonlinear processes), the medicane intensifies to a moderate extent by global warming. While the medicane under global warming shows a modest intensification (e.g. Cavicchia et al., 2014) in terms of wind speed and SLP deepening, precipitation presents radical changes during the peak of intensity. This suggests that the medicane could be more hazardous due to global warming as concluded by González-Alemán et al. (2019).
The PGW technique is a powerful tool to investigate the impacts of climate change on the weather systems in the future. However, our results in this paper include only the climate changes in background such as temperature, relative humidity, SST, etc. In this framework, any changes in extratropical dynamics like wave breaking and large-scale circulation that are an initial disturbance for medicanes are not directly considered. Additionally, as Flaounas et al. (2019) suggest, the water transport from the North Atlantic sector will be modified and significantly influences the medicane frequency and intensity. The PGW approach does not directly reflect such future change in water vapour transport. Nonetheless, we can conclude that the background change associated with global warming will have a moderate impact on medicane development.
In this study we have presented novel findings regarding the relative roles of atmosphere and ocean in the modulation of medicane development under global warming. It would be interesting to see whether other cases of medicanes show a similar response to the warmer atmosphere and ocean. For a better quantification of changes, the simulation and investigation with a regional coupled model for several cases will be desired in the future.
The data of WRF simulations are available from the authors on request. ERA-Interim reanalysis can be downloaded from https://www.ecmwf.int/en/forecasts/datasets/reanalysis-datasets/era-interim (last access: 15 January 2019) (ECMWF, 2019) (need to create an account). ERA5 reanalysis data can be downloaded from https://cds.climate.copernicus.eu/#!/search?text=ERA5&type=dataset (last access: 15 January 2019) (Copernicus Climate Change Service, 2017) (need to create an account). The best track for the medicane is available at https://www.ssd.noaa.gov/PS/TROP/DATA/2011/tdata/med/01M.html (last access: 15 October 2019) (NOAA, 2019).
The supplement related to this article is available online at: https://doi.org/10.5194/nhess-21-53-2021-supplement.
SK made a plan of this work with WC. SK and PAM contributed to designing the numerical simulations of WRF, and PAM set the post-processing of boundary conditions for PGW experiments. SK performed the experiments and analysed the outputs. All the co-authors contributed to interpreting the results, write the manuscript, and revise the manuscript.
The authors declare that they have no conflict of interest.
We would like to express our grateful appreciation to Emmanouil Flaounas and the one anonymous reviewer for their very constructive and helpful comments and suggestions so that our manuscript was improved substantially. This study has been carried out under the IBERTROPIC project (grant agreement no. CGL2017-89583-R), funded by the Spanish Ministry of Science, Innovation and Universities, the Spanish State Research Agency, and the European Regional Development Fund. Shunya Koseki is supported by Giner de los Ríos 2018/2019 and 2019/2020, which is a scholarship grant by la Universidad de Alcalá. Juan Jesus González Alemán has been funded through grants BES_2014-067905 and FJC2018-035821-I by the Spanish State Research Agency. The computational resources come from the Norwegian High-Performance Computing Program (NS9039K).
This study has been supported by IBERTROPIC project (grant agreement no. CGL2017-89583-R), Giner de los Ríos 2018/2019 and 2019/2020, and BES_2014-067905 and FJC2018-035821-I. The computational resources come from the Norwegian High-Performance Computing Program (NS9039K).
This paper was edited by Joaquim G. Pinto and reviewed by Emmanouil Flaounas and one anonymous referee.
Akhtar, N., Brauch, J., Dobler, A., Béranger, K., and Ahrens, B.: Medicanes in an ocean-atmosphere coupled regional climate model, Nat. Hazards Earth Syst. Sci., 14, 2189–2201, https://doi.org/10.5194/nhess-14-2189-2014, 2014.
Bakkensen, L. A.: Mediterranean Hurricanes and Associated Damages Estimates, J. Ext. Events, 4, 1750008, https://doi.org/10.1142/S2345737617500087, 2017.
Bouin, M.-N. and Lebeaupin Brossier, C.: Surface processes in the 7 November 2014 medicane from air-sea coupled high resolution numerical modeling, Atmos. Chem. Phys., 20, 6861–6881, https://doi.org/10.5194/acp-20-6861-2020, 2020.
Caniaux, G., Giordani, H., Redelsperger, J.-L., Guichard, F., Key, E., and Wade, M.: Coupling between the Atlantic cold tongue and the West African monsoon in boreal spring and summer, J. Geophys. Res.-Oceans, 116, C04003, https://doi.org/10.1029/2010JC006570, 2011.
Carrió, D. S., Homar, V., Jansa, A., Romero, R., and Picornell, M. A.: Tropicalization process of the 7 November 2014 Mediterranean cyclone: Numerical sensitivity study, Atmos. Res., 197, 300–312, https://doi.org/10.1016/j.atmosres.2017.07.018, 2017.
Cavicchia, L. and von Storch, H.: The simulation of medicanes in a high-resolution regional climate model, Clim. Dynam., 39, 2273–2290, https://doi.org/10.1007/s00382-011-1220-0, 2012.
Cavicchia, L., von Storch, H., and Gualdi, S.: A long-term climatology of medicanes, Clim. Dynam., 43, 1183–1195, https://doi.org/10.1007/s00382-013-1893-7, 2013.
Cavicchia, L., von Storch, H., and Gualdi, S.: Mediterranean Tropical-Like Cyclones n Present and Future Climate, J. Climate, 27, 7493–7501, https://doi.org/10.1175/JCLI-D-14-00339.1, 2014.
Chaboureau, J. P., Pantillon, F., Lambert, D., Richard, E., and Claud, C.: Tropical transition of a Mediterranean strom by jet corssing, Q. J. Roy. Meteorol. Soc., 138, 596–611, https://doi.org/10.1002/qj.960, 2012.
Chen, F. and Dudhia, J.: Coupling an advanced land-surface/hydrology model with the Pen State/NCAR MM5 modeling system. Part I: model description and implementation, Mon. Weather Rev., 129, 569–585, 2001a.
Chen, F. and Dudhia, J.: Coupling an advanced land-surface/hydrology model with the Pen State/NCAR MM5 modeling system. Part II: model validation, Mon. Weather Rev., 129, 587–604, 2001b.
Copernicus Climate Change Service: ERA5: First generation of ECMWF atmospheric reanalyses of the global climate. Copernicus Climate Change Service Data Store (CDS), data of access, available at: http://cds.climate.copernicus.eu/cdsapp#!/home (last access: 20 October 2018), 2017.
Dafis, S., Rysman, J.-F., Claud, C., and Flaounas, E.: Remote sensing of deep convection within a tropical-like cyclone over the Mediterranean Sea, Atmos. Sci., Lett., 19, e823, https://doi.org/10.1002/asl.823, 2018.
Dee, D. P., Uppala, S. M., Simmons, A. J., Berrisford, P., Poli, P., Kobayashi, S., Andre, U., Balmaseda, M. A., Balsamo, G., Bauer, P., Bechtold, P., Beljaars, A. C. M., van de Berg, L., Bidlot, J., Bormann, N., Delsol, C., Dragani, R., Fuentes, M., Geer, A. J., Haimberger, L., Healy, S. B., Hersbach, H., Hóml, E. V., Isaksen, L., Kåkkberg, P., Köhler, M., Matricardi, M., McNally, A. P., Monge-Sanz, B. M., Morcrette, J.-J., Park, B.-K., Peubey, C., de Rosnay, P., Tavolato, C., Thépaut, J.-N., and Vitart, F.: The ERA-Interim reanalysis: configuration and performance of the data assimilation system, Q. J. Roy. Meteorol. Soc., 137, 553–597, https://doi.org/10.1002/qj.828, 2011.
ECMWF: ERA-Interim, available at: https://www.ecmwf.int/en/forecasts/datasets/reanalysis-datasets/era-interim, last access: 15 January 2019.
Emanuel, K.: Genesis and maintenance of “Mediterranean hurricanes”, Adv. Geosci., 2, 217–220, https://doi.org/10.5194/adgeo-2-217-2005, 2005.
Emanuel, K. A.: An air-sea interaction theory for tropical cyclones. Part I: Steady-state maintenance, J. Atmos. Sci., 43, 585–604, 1986.
Fita, L. and Flaounas, E.: Medicanes as subtropical cyclones: the December 2005 case from the perspective of surface pressure tendency diagnostic and atmospheric water budget, Q. J. Roy. Meteorol. Soc., 144, 1028–1044, https://doi.org/10.1002/qj.3273, 2018.
Fita, L., Romero, R., and Ramis, C.: Intercomparison of intense cyclogenesis events over the Mediterranean basin based on baroclinic and diabatic influences, Adv. Geosci., 7, 333–342, https://doi.org/10.5194/adgeo-7-333-2006, 2006.
Flaounas, E., Raveh-Rubin, S., Wernil, H., Drobinski, P., and Bastin, S.: The dynamical structure of intense Mediterranean cyclones, Clim. Dynam., 44, 2411–2427, https://doi.org/10.1007/s00382-014-2330-2, 2015.
Flaounas, E., Fita, L., Lagouvardos, C., and Kotroni, V.: Heavy rainfall in Mediterranean cyclones, Part II: Water budget, precipitation efficiency and remote water sources, Clim. Dynam., 53, 2539–2555, https://doi.org/10.1007/s00382-019-04639-x, 2019.
Gaertner, M. Á., González-Alemán, J. J., Romera, R., Domínguez, M., Gil, V., Sánchez, E., Gallardo, C., Miglietta, M. M., Walsh, K. J. E., Sein, D. V., Somot, S., Dell'Aquila A., Teichmann, C., Ahrens, B., Buonomo, E., Colette, A., Bastin, S., van Meijgaar, E., and Nikulin, G.: Simulation of medicanes over the Mediterranean Sea in a regional climate model ensemble: impact of ocean-atmosphere coupling and increased resolution, Clim. Dynam., 51, 1041–1057, https://doi.org/10.1007/s00382-016-3456-1, 2018.
Giorgi, F. and Lionello, P.: Climate change projections for the Mediterranean region, Glob. Planet. Change, 63, 90–104, https://doi.org/10.1016/j.gloplacha.2007.09.005, 2008.
González-Alemán, J. J., Pascale, S., Gutierrez-Fernandez, J., Murakami, H., Gaertner, M. A., and Vecchi, G. A.: Potential Increase in Hazard From Mediterranean Huriicane Activity With Global Warming, Geophys. Res. Lett., 46, 1754–1764, https://doi.org/10.1029/2018GL081253, 2019.
Hart, R. E.: A Cyclone Phase Space Derived from Thermal Wind and Thermal Asymmetry, Mon. Weather Rev., 131, 585–616, 2003.
Hong, S.-Y. and Lim, J.–O. J.: The WRF single–moment 6 – class microphysics scheme (WSM6), J. Korean Meteor. Soc., 42, 129–151, 2006.
Hong, S.-Y., Dudhia, J., and Chen, S.-H.: A revised approach to ice microphysical processes for the bulk parameterization of clouds and precipitation, Mon. Weather Rev., 132, 103–120, 2004.
Janjíc, Z. I.: The Step–Mountain Eta Coordinate Model: Further developments of the convection, viscous sublayer, and turbulence closure schemes, Mon. Weather Rev., 122, 927–945, 1994.
Jin, F.-F.: Tropical Ocean-Atmosphere Interaction, the Pacific Cold Tongue, and the El Niño-Southern Oscillation, Science, 274, 76–78, https://doi.org/10.1126/science.274.5284.76, 1996.
Kain, J. S.: The Kain–Fritsch convective parameterization: An update, J. Appl. Meteor., 43, 170–181, 2004.
Mazza, E., Ulbrich, U., and Klein, R.: The Tropical Transition of the October 1996 Medicane in the Western Mediterranean Sea: A Warm Seclusion Event, Mon. Weather Rev., 145, 2575–2595, 2017.
Miglietta, M. M., and Rotunno, R.: Development mechanisms for Mediterranean tropical-like cyclones (medicanes), Q. J. Roy. Meteorol. Soc., 145, 1444–1460, https://doi.org/10.1002/qj.3503, 2019.
Miglietta, M. M., Laviola, S., Malvaldi, A., Conte, D., Levizzani, V., and Price, C.: Analysis of tropical-like cyclones over the Mediterranean Sea through a combined modeling and satellite approach, Geophys. Res. Lett., 40, 2400–2405, https://doi.org/10.1002/grl.50432, 2013.
Miglietta, M. M., Mastrangelo, D., and Conte, D.: Influence of physics parametrization schemes on the simulation of a tropical-like cyclone in the Mediterranean Sea, Atmos. Res., 153, 360–375, https://doi.org/10.1016/j.atmosres.2014.09.008, 2015.
Miglietta, M. M., Cerrai, D., Laviola, S., Cattani, E., and Levizzani, V.: Potential vorticity patterns in Mediterranean “huricanes”, Geophys. Res. Lett., 44, 2537–2545, https://doi.org/10.1002/2017GL072670, 2016.
Mlawer, E. J., Taubman, S. J., Brown, P. D., Iacono, M. J., and Clough, S. A.: Radiative transfer for inhomogeneous atmospheres: RRTM, a validated correlated-k model for the longwave, J. Geophys. Res., 102, 16663–16682, https://doi.org/10.1029/97JD00237, 1997.
Mooney, P. A., Gill, D. O., Mulligan, F. J., and Bruyère, C. L.: Hurricane simulation using different representations of atmosphere-ocean interaction: the case of Irene (2011), Atmos. Sci. Lett., 17, 415–421, https://doi.org/10.1002/asl.673, 2016.
Mooney, P. A., Mulligan, F. J., Bruyère, C. J., Parker, C. L., and Gill, D. O.: Investigating the performance of coupled WRF-ROMS simulations of Hurricane Irene (2011) in a regional climate modeling framework, Atmos. Res., 215, 57–74, https://doi.org/10.1016/j.atmosres.2018.08.017, 2018.
Mooney, P. M., Sobolowski, S. P., and Lee, H.: Designing and evaluating regional climate simulations for land use land cover change studies at high latitudes, Tellus A, https://doi.org/10.1080/16000870.2020.1853437, in press, 2020.
Nakanishi, M. and Niino, H.: An improved Mellor–Yamada level 3 model: its numerical stability and application to a regional prediction of advecting fog, Bound.-Lay. Meteorol., 119, 397–407, https://doi.org/10.1007/s10546-005-9030-8, 2006.
Nakanishi, M. and Niino, H.: Development of an improved turbulence closure model for the atmospheric boundary layer, J. Meteorol. Soc. Jpn., 87, 895–912, https://doi.org/10.2151/jmsj.87.895, 2009.
NOAA: Observed cyclone track data, available at: https://www.ssd.noaa.gov/PS/TROP/DATA/2011/tdata/med/01M.html, last access: 15 October 2019.
Olson, J. B., Kenyon, J. S., Angevine, W. M., Brown, J. M., Pagowski, M., and Sušelj, K.: A Description of the MYNN-EDMF Scheme and the Coupling to Other Components in WRF–ARW, NOAA Technical Memorandum OAR GSD, 61, 37 pp., https://doi.org/10.25923/n9wm-be49, 2019.
Parker, C. L., Bruyère, C. L., Mooney, P. A., and Lynch, A. H.: The response of land-falling tropical cyclone characteristics to projected climate change in northeast Australia, Clim. Dynam., 51, 3467–3485, https://doi.org/10.1007/s00382-018-4091-9, 2018.
Quitián-Hernández, L., González-Alemán, J. J., Santos-Muñoz, D., Fernández-González, S., Valero, F., and Martín, M. L.: Subtropical cyclone formation via warm seclusion development: The importance of surface fluxes, J. Geophys. Res.-Atmos., 125, e2019JD031526, https://doi.org/10.1029/2019JD031526, 2020.
Rasmussen, R., Liu, C., Ikeda, K., Gochis, D., Yates, D., Chen, F., Tewari, M., Barlage, M., Dudhia, J., Yu, W., and Miller, K.: High-Resolution Coupled Climate Runoff Simulations of Seasonal Snowfall over Colorado: A Process Study of Current and Warmer Climate, J. Climate, 24, 3015–3048, 2011.
Ricchi, A., Miglietta, M. M., Barbariol, F., Benetazzo, A., Bergamasco, A., Bonaldo, D., Cassardo, C., Falcieri, F. M., Modugno, G., Russo, A., Sclavo, M., and Carniel, S.: Sensitivity of a Mediterranean Tropical-Like Cyclone to Different Model Configurations and Coupling Strategies, Atmosphere, 8, 92, https://doi.org/10.3390/atmos8050092, 2017.
Ricchi, A., Miglietta, M. M., Bonaldo, D., Cioni, G., Rizza, U., and Carniel, S.: Multi-Physics Ensemble versus Atmosphere-Ocean Coupled Model Simulations for a Tropical-Like Cyclone in the Mediterranean Sea, 2019, Atmosphere, 10, 202, https://doi.org/10.3390/atmos10040202, 2019.
Schär, C., Frei, C., Lüthi, D., and Davies, H. C.: Surrogate climate-change scenarios for regional climate models, Geophys. Res. Lett., 23, 669–672, 1996.
Shaltout, M. and Omstedt, A.: Recent sea surface temperature trends and future scenarios for the Mediterranean Sea, Oceanologia, 56, 411–443, https://doi.org/10.5697/oc.56-3.411, 2014.
Skamarock, W. C., Klemp, J. B., Dudhia, J., Gill, D. O., Barker, D. M., Duda, M., Huang, X. Y., Wang, W., and Powers, J. G.: A description of the advanced research WRF version 3, NCAR technical note, NCAR/TN/u201345?STR, NCAR, 123 pp., 2008.
Somot, S., Sevault, F., and Déqué, M.: Transient climate change scenario simulation of the Mediterranean Sea for the twenty-first century using a high-resolution ocean circulation model, Clim. Dynam., 27, 851–879, https://doi.org/10.1007/s00382-006-0167-z, 2006.
Taylor, K. E., Stouffer, R. J., and Meehl, G. A.: An Overview of CMIP5 and the experiment design, B. Am. Meteorol. Soc., 93, 485–498, https://doi.org/10.1175/BAMS-D-11-00094.1, 2012.
Thompson, G., Field, P. R., Rasmussen, R. M., and Hall, W. D.: Explicit Forecasts of Winter Precipitation Using an Improved Bulk Microphysics Scheme. Part II: Implementation of a New Snow Parameterization, Mon. Weather Rev., 136, 5095–5115, https://doi.org/10.1175/2008MWR2387.1, 2008.
Tiedtke, M.: A comprehensive mass flux scheme for cumulus parameterization in large–scale models, Mon. Wea. Rev., 117, 1779–1800, 1989.
Torn, R. D.: Evaluations of Atmosphere and Ocean Initial Condition Uncertainty and Stochastic Exchange Coefficients on Ensemble Tropical Intensity Forecasts, Mon. Weather Rev., 144, 3487–3506, https://doi.org/10.1175/MWR-D-16-0108.1, 2016.
Tous, M., Zappa, G., Romero, R., Shaffrey, L., and Vidale, P. L.: Projected changes in medicanes in the HadGEM3 N512 high-resolution global climate model, Clim. Dynam., 47, 1913–1924, https://doi.org/10.1007/s00382-015-2941-2, 2016.
Xu, C.-H. and Xu, Y.: The projection of Temperature and Precipitation over China under RCP Scenarios using a CMIP5 Multi-Model Ensemble, Atmos. Oceanic Sci. Lett., 5, 527–533, https://doi.org/10.1080/16742834.2012.11447042, 2012.
Zhang, C., Wang, Y., and Hamilton, K.: Improved representation of boundary layer clouds over the southeast pacific in ARW–WRF using a modified Tiedtke cumulus parameterization scheme, Mon. Weather Rev., 139, 3489–3513, 2011.
- Abstract
- Introduction
- Model and methodology
- Simulation of medicane Rolf under present climate
- Simulation of medicane Rolf under 1.5 ∘C global warming
- Discussion on different roles of warmer atmosphere and ocean in medicane development
- Concluding remarks
- Data availability
- Author contributions
- Competing interests
- Acknowledgements
- Financial support
- Review statement
- References
- Supplement