the Creative Commons Attribution 4.0 License.
the Creative Commons Attribution 4.0 License.
 | 03 Dec 2021
Data-based wildfire risk model for Mediterranean ecosystems – case study of the Concepción metropolitan area in central Chile
Edilia Jaque Castillo
Rodrigo Fuentes Robles
Carolina G. Ojeda
Wildfire risk is latent in Chilean metropolitan areas characterized by the strong presence of wildland–urban interfaces (WUIs). The Concepción metropolitan area (CMA) constitutes one of the most representative samples of that dynamic. The wildfire risk in the CMA was addressed by establishing a model of five categories (near zero, low, moderate, high, and very high) that represent discernible thresholds in fire occurrence, using geospatial data and satellite images describing anthropic–biophysical factors that trigger fires. Those were used to deliver a model of fire hazard using machine learning algorithms, including principal component analysis and Kohonen self-organizing maps in two experimental scenarios: only native forest and only forestry plantation. The model was validated using fire hotspots obtained from the forestry government organization. The results indicated that 12.3 % of the CMA's surface area has a high and very high risk of a forest fire, 29.4 % has a moderate risk, and 58.3 % has a low and very low risk. Lastly, the observed main drivers that have deepened this risk were discussed: first, the evident proximity between the increasing urban areas with exotic forestry plantations and, second, climate change that threatens triggering more severe and large wildfires because of human activities.
- Article
(2236 KB) - Full-text XML
-
Supplement
(193 KB) - BibTeX
- EndNote


In the last few decades, the world has seen an increasing trend in wildfires affecting large populations (Moritz et al., 2012), generally being attributed to atmospheric warming fueled by anthropogenic climate change (Spies et al., 2014) and extreme weather events (Stott, 2016) creating a riskier environment. However, wildfire hazard is a product of interlinked socio-environmental processes including the proximity between wildland–urban interfaces (WUIs) and urban areas (Kumagai et al., 2004; Kolden and Henson, 2019; Goldman, 2018; Sarricolea et al., 2016); unregulated extractive economic activities in fire-prone landscapes (Castree, 2008; Spies et al., 2014; Freudenburg, 1992; Gago and Mezzadra, 2017); traditional cultural practices which increase the availability of flammable material – in construction, forestry, or agriculture (Harari, 2013; Frene and Nuñez, 2010); and the traditional practice of clearing land called “slash and burn” (Shahriar et al., 2019, p. 1). The analysis of this hazard must consider biophysical factors such as altitude, slope, climate conditions, solar radiation, and vegetation cover (Chuvieco et al., 2004, 2011). For example, windy and dry conditions with steep slopes rapidly lead to quick fire spread and burn large areas of forest within a short time (Shahriar et al., 2019, p. 2).
Identifying and managing fire hazards is part of a political agenda rather than a solely biophysical concern (Pyne, 2009; Doerr and Santin, 2016; Change, 2017). Experiences with fire in underdeveloped countries are radically different from those in developed countries, which have controlled burns, a strict forestry policy, and solid territorial planning and usually take advantage of the ecological benefits of the fire for ecosystems and livelihoods (Hutto, 2008; González, 2005; González-Mathiesen and March, 2018; Adams, 2013).
Risk and vulnerability mapping usually identifies the categories of wildfire likelihood that correspond to one of the most used tools in research. The use of risk categories is considered a useful method to provide understandable information for policymaking and decision-making as attested by the style of the “Summary for Policymakers”, a document regularly delivered during the publication of the IPCC (Intergovernmental Panel on Climate Change) assessment reports and that contains many examples of categorically organized information (IPCC, 2014, 2019). However, feeding the predictive models with precise data of land cover changes, accurate meteorological data, and human activities that could start a wildfire in real time remains a challenge, mainly because data are sparse or outdated and sometimes stored in multiple agencies (Dapeng et al., 2019; Otero and Nielsen, 2017; Knowles et al., 2015).
To diminish the exposure of the population to wildfire hazard, a steady provision of tools that support landscape planning to minimize wildfire occurrence (González-Mathiesen and March, 2018) and manage the social impacts after the disturbance (Paveglio et al., 2015) is required. This approach is essential in highly fragile regions such as Mediterranean ecosystems (Turco et al., 2016; Pausas et al., 2008; Darques, 2015; Diffenbaugh, 2007) existing in Spain (Vilar del Hoyo et al., 2011), Italy (Terranova et al., 2009), Australia (McGee and Russell, 2003), Portugal (Gómez-González et al., 2018), California (Koltunov et al., 2012), and Chile (de la Barrera et al., 2017).
Chile's central-south region (∼ 35 to ∼ 40∘ S) (Fig. 1) is one of the most transformed in the country, with a long history of mining, industrialization, and forest exploitation (Bustamante and Varela, 2007; Aguayo et al., 2009). Here, intensive land use changes interact with the replacement of native land cover by plantations, urban sprawl, and socio-environmental conflicts associated with forest property (Andersson et al., 2016; Nahuelhual et al., 2012; Altamirano et al., 2013; Heilmayr et al., 2016; McWethy et al., 2018; Cid, 2015; Schulz et al., 2010) that lead to a characteristic environment prone to wildfire occurrence.
The Concepción metropolitan area (CMA) is a conspicuous example of wildfire activity in this region of Chile. Available studies suggest that wildfires will become more frequent and aggressive, given the changing climate conditions in the CMA (Castillo et al., 2003; CONAF, 2017, 2018; Sarricolea et al., 2020; CR2, 2020) following global trends (Moritz et al., 2012). One of those changes is related to more frequent droughts (Fernández et al., 2018), which are coincident with recent findings that attribute part of precipitation decrease to anthropogenic sources (Boisier et al., 2016), impacting the lives, crops, and neighborhoods of more than a million people (Gómez-González et al., 2018; de la Barrera et al., 2018; CONAF, 2018; Araya-Muñoz et al., 2017; Cid, 2015).
In this work, a model for wildfire risk mapping in the CMA (∼ 36∘42′ S, ∼ 73∘3′ W; Fig. 1) was applied and validated. An updated categorical map at a relatively high spatial resolution was delivered. This model aims to support urban planning for and further studies of wildfire hazards. The paper is organized as follows: Sect. 2 describes the study area, materials, and methods; Sect. 3 presents and analyzes the results; Sect. 4 corresponds to the discussion, and in Sect. 5 we conclude while suggesting avenues of future work.
Located in Chile's Biobío administrative region, the CMA (∼ 36∘42′ S, ∼ 73∘3′ W; Fig. 1) is the third-largest urban area with a total population of over 1 million (INE, 2021). CMA has many interconnected small urban centers (Rojas Quezada et al., 2009), which are expanding rapidly, mostly for housing development and industry (Rojas Quezada et al., 2013). Also, the region contains a variety of important biodiversity hotspots (Smith-Ramírez, 2004) and wetlands (Martínez Poblete, 2014).
A Mediterranean climate with warm, dry summers and cold, wet winters characterizes this region (Sarricolea et al., 2020), with an average temperature of 12.4 ∘C and annual rainfall of 1332 mm, of which 70 % is concentrated between May and August (BCN, 2021). The CMA has one of the largest wildland–urban interfaces (WUIs) in the country (Ruiz et al., 2017).
Several economic activities have been developed in the CMA and its surroundings since its foundation in the 18th century. However, today the region is mainly known for timber production and export from plantations of exotic fast-growing species (Torres et al., 2015), maintaining a steady number of forestry plantations despite urban growth since 1974 when there was 44 123 ha of forestry plantations compared to more than 46 697 ha in 2016 (INFOR, 2017).
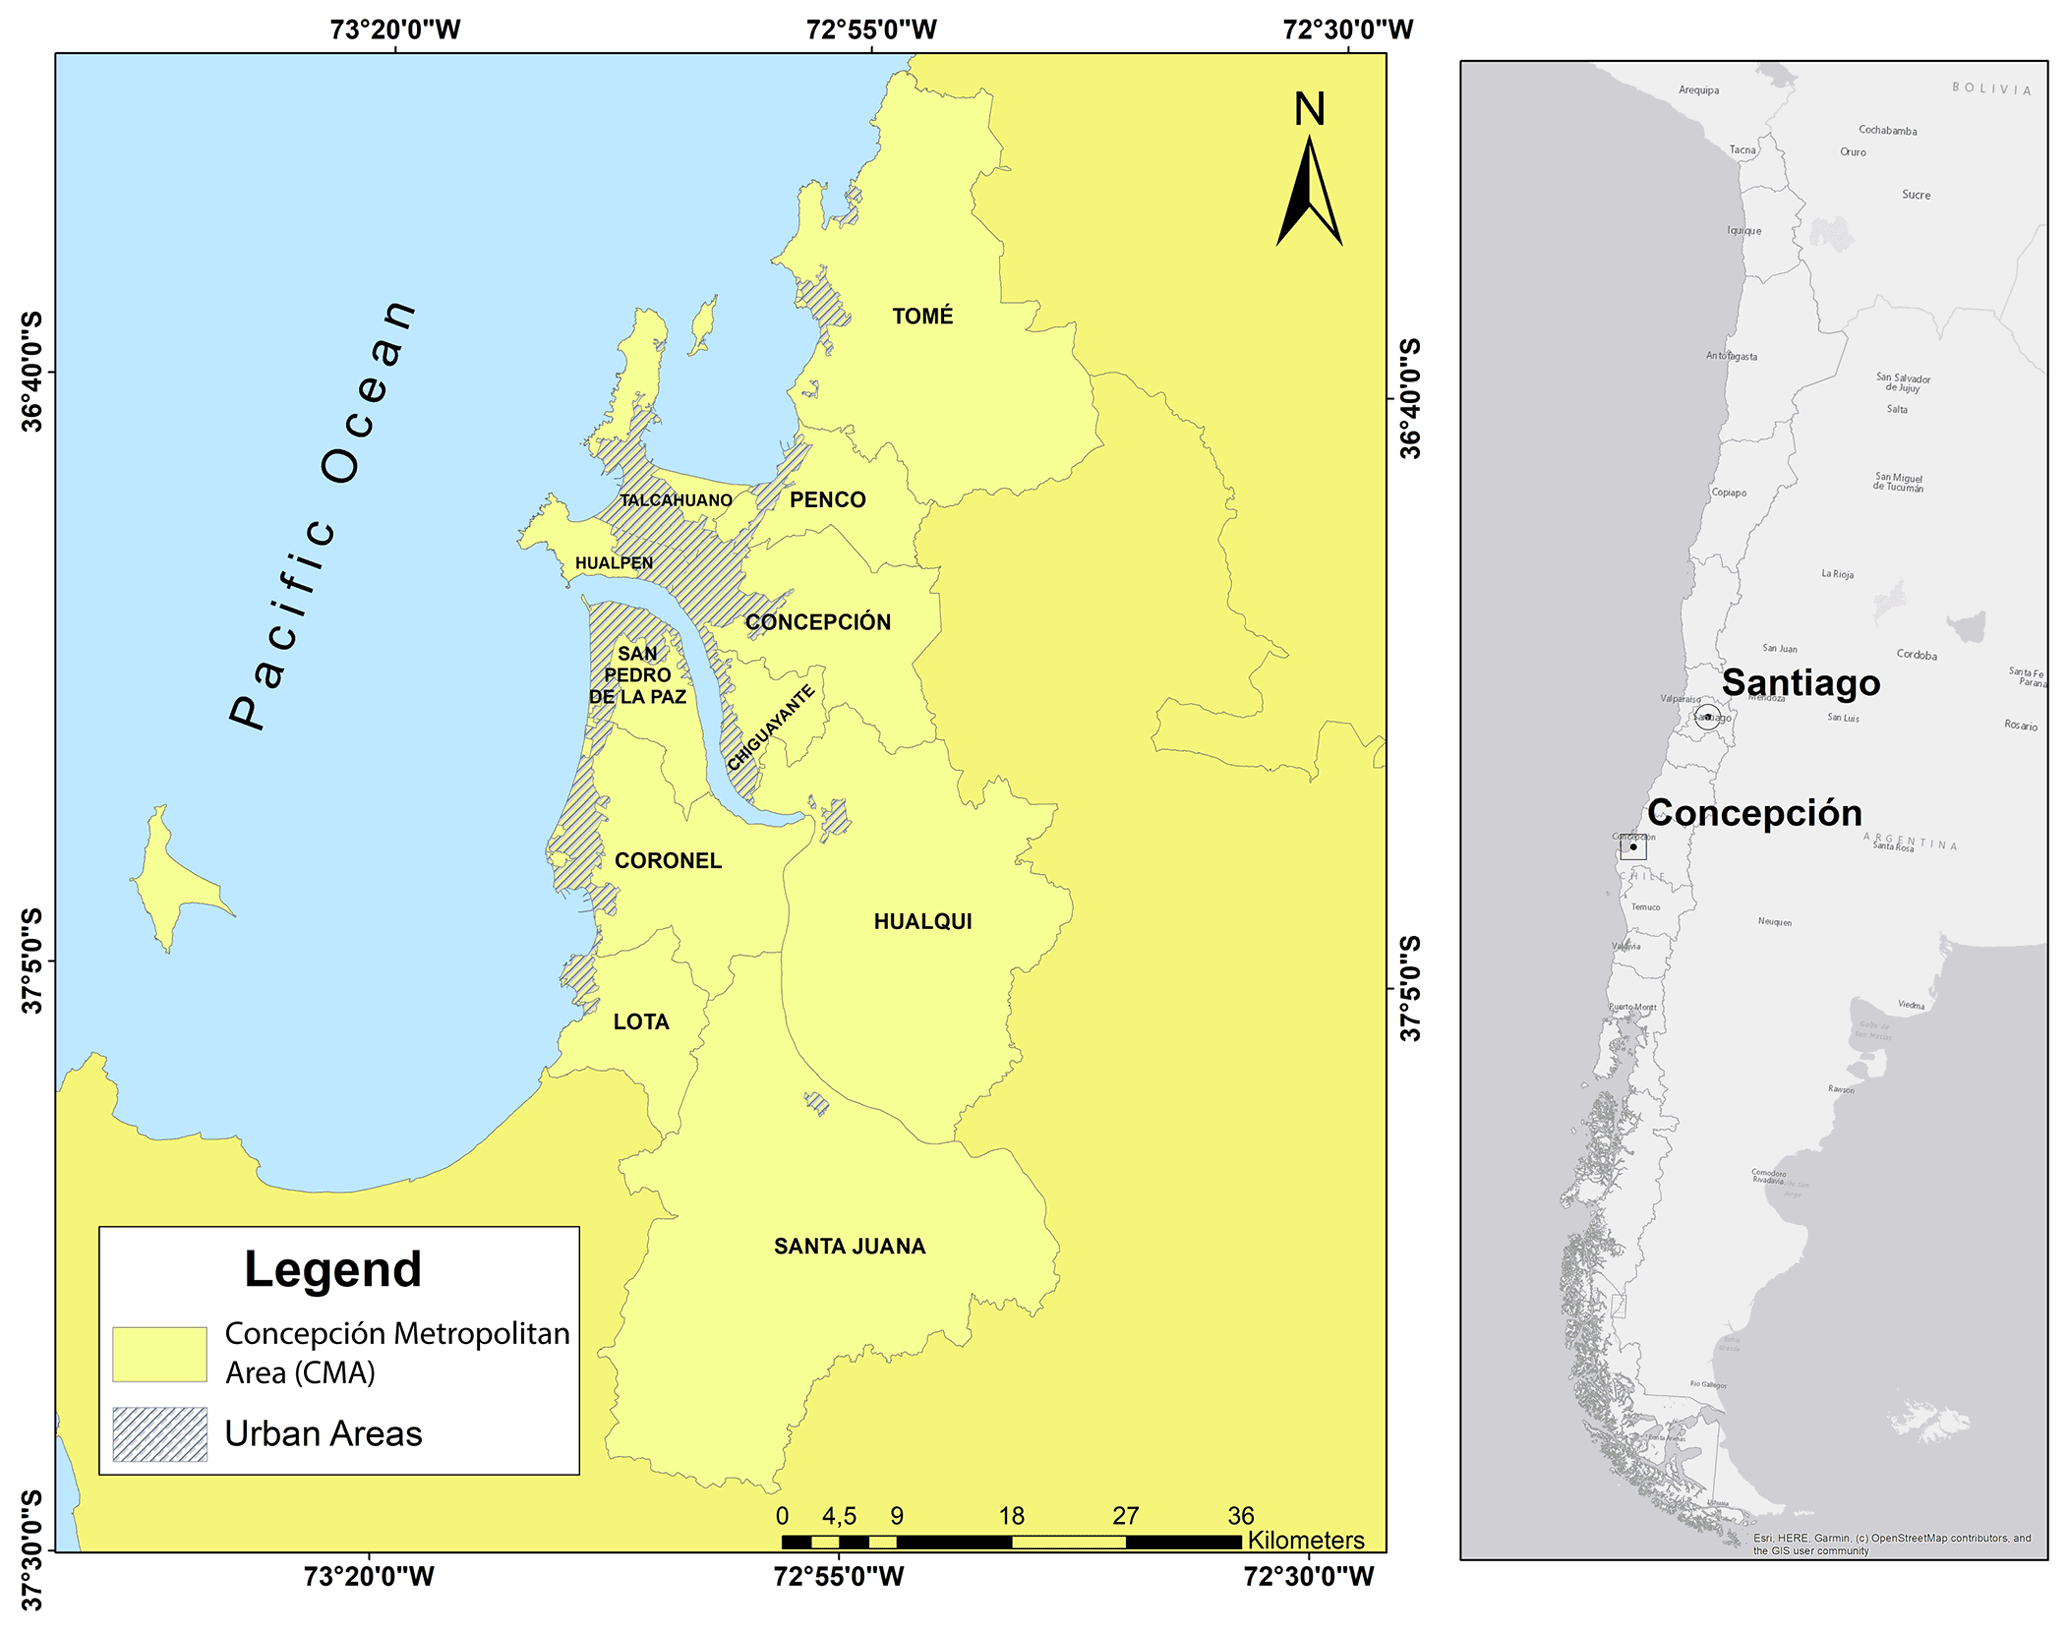
Figure 1Map of the study area. The right map highlights Chile's Biobío region in a continental context, and the CMA is shown on the left map. Source: CEDEUS (2016). © OpenStreetMap contributors 2021. Distributed under the Open Data Commons Open Database License (ODbL) v1.0.
Previous work on wildfire hazard mapping indicates the need to include a number of spatially distributed factors that contribute to the susceptibility of the landscape, such as slopes, orientation, and the effect of insolation (You et al., 2017), and these types of models organize space into categories as a result of weighted sums of contribution factors. In this case, available research portrays wildfires as products of human activities, topographic characteristics, land cover, and climate (CONAF, 2017; de la Barrera et al., 2018; Ubeda and Sarricolea, 2016). While most approaches to mapping wildfire hazards have been based upon frameworks tested in other regions, data-driven approaches are still under-utilized. This hazard modeling takes advantage of available national databases and satellite products, which are included in machine learning algorithms to produce maps that allow the spatially distributed identification and assessment of wildfire hazards. The model combines principal component analysis (PCA) and Kohonen self-organizing maps (SOMs) to determine locations classified into five categories: near zero, low, moderate, high, and very high. The following subsections present the steps to compile the analyzed database, the model development, and the experiments performed.
2.1 Geodatabase compilation
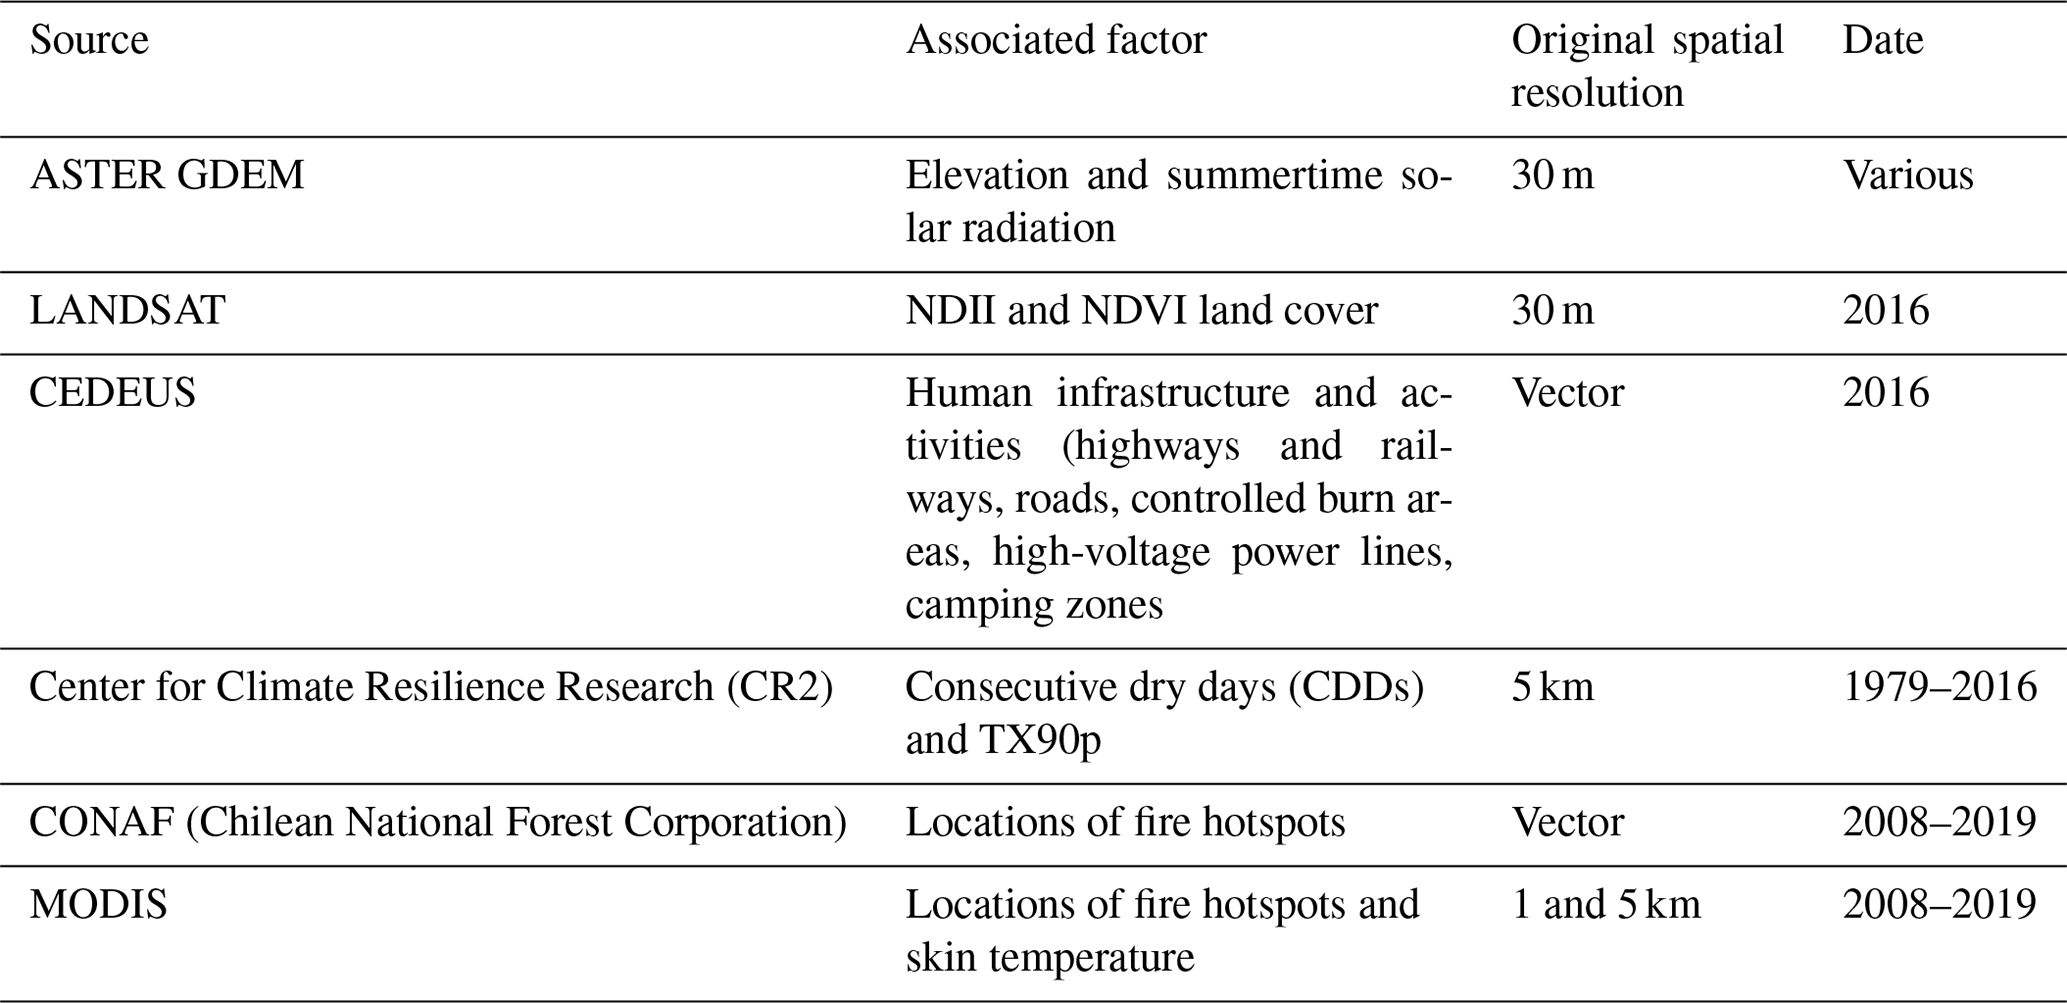
Input data for the modeling corresponded to a 12-variable geodatabase that included several descriptors related to fire hotspot recurrence, such as topographic features, land cover characteristics, built environment descriptors, and climatic indices (Table 1). Fire hotspot locations were utilized as reference coordinates to produce a raster that counted the number of spots within a 900 m pixel size. Center coordinates of each pixel are the locations utilized in the compiled geodatabase. The 900 m spatial resolution corresponds to a trade-off between the representations of the different input databases, which range from 30 m to 5 km. Locations of fire hotspots used for the geodatabase correspond to the period 2008–2019, available from the Chilean National Forest Corporation (CONAF, Corporación Nacional Forestal). The forest fire database is constructed from information collected by brigades and private forestry companies at wildland–urban interfaces and in rural (forestry) areas. Forest fire detection is carried out in three ways: (a) fixed terrestrial (observation towers), (b) mobile terrestrial (surveillance), and (c) aerial detection (Tapia and Castillo, 2014). Fixed ground detection makes it possible to reach extensions of up to 20 km of vision and monitoring since it uses large structures (greater than 20 m high) in which a person is constantly watching with the help of binoculars. The mobile terrestrial detection only covers a predial scale (generally carried out by private companies) and is performed in sectors of better accessibility for different types of motorized vehicles. Aerial detection allows for reaching a large area per unit of time since small airplanes are used to detect forest fires at a great distance. Detected fires are then GPS georeferenced and subsequently added to a geographic information system (GIS) using a predefined grid in which each cell represents 4 km2 (2×2 km). The minimum area for a forest fire to be mapped is 10 m2. These data thus correspond to a spatially explicit database where each cell centroid represents burned and/or burning areas. The databases with which the country's forestry services work are becoming more and more accurate and are continually being revalidated and refined. In recent years, the minimum unit of detection of forest fires by private companies has reached thresholds below the millimeter scale and the public forestry service (CONAF) reaches 0.001 m.
Spot locations were also used to determine their distances to the closest streams, urban centers, and major roads and then were averaged at the 900 m pixel size to be assigned to the corresponding location in the geodatabase. These vector data, including the stream network, were retrieved from the map portal (publicly available at http://datos.cedeus.cl/, last access: 29 November 2021) of the Centre for Sustainable Urban Development (CEDEUS). Elevations of the study area were retrieved from the ASTER GDEM version 2, which is a digital elevation model produced at a 30 m pixel size using stereo-correlation techniques applied to scenes from the ASTER sensor of the Terra satellite (Abrams et al., 2010). Three land cover characteristics were included in the database: a raster land cover map, a normalized difference infrared index (NDII), and a normalized difference vegetation index (NDVI). The land cover map was derived from two Landsat images obtained from the platform Earth Explorer (https://earthexplorer.usgs.gov, last access: 29 November 2021). The images were corrected geometrically, radiometrically, and atmospherically (Chuvieco, 2002; Heilmayr et al., 2016). A maximum likelihood statistic of the supervised classification method (Chuvieco, 2002) was used to classify native forest, scrub, pasture and/or cropland, urban areas, exotic plantations, water bodies, bare soil, and burned areas. We used approximately 700 training points for each classified image, acquired through two sources, (a) a cadastre of the native plant resources of Chile (CONAF-BIRF, 1999) and (b) Google Earth (specifically its “time slider”), to obtain input to classify images.
The NDII and NDVI data that were entered into the geodatabase correspond to a pixel-wise linear-trend map for each index. All these raster maps were aggregated by simple averaging into a 900 m pixel size and assigned to the nearest center coordinate in the geodatabase.
Climatic descriptors included average summertime potential solar radiation, a temperature index, and a precipitation index. The ASTER GDEM was used to compute average summertime potential direct solar radiation employing the insol package within the R programming language, a package that implements algorithms presented by Corripio (2003, and references therein). The same procedure described for elevations was implemented to add these data into the geodatabase.
For temperatures, the value employed for each location was the linear trend in the number of summer (December, January, and February) days in which maximum temperatures were larger than the 90th percentile for all summers during the period 1980–2016, i.e., the linear trend in the TX90p climate index (Klein Tank et al., 2009). For precipitation, the linear trend included in the geodatabase is from the number of consecutive dry days (CCDs) in summer for the period 1980–2016 and an index used in fire risk analysis (da Silva et al., 2020). The climatic data utilized for these calculations were from the CR2MET product, a gridded climatology at a 5 km pixel size at daily to monthly frequency produced by the Chilean Center for Climate Resilience Research (CR2, 2020) covering the period 1979–2016 (available at http://www.cr2.cl/datos-productos-grillados/, last access: 29 November 2021). CR2MET was produced using a statistical downscaling of the ERA-Interim reanalysis supplemented by topographic data, land surface temperatures retrieved from satellites, and instrumental observations (Alvarez-Garreton et al., 2018). The database also included linear trends of skin temperatures retrieved from the 0.05∘ (∼ 5 km) daytime monthly land surface temperature product MOD11C3, version 6, derived from the Moderate Resolution Imaging Spectroradiometer (MODIS) aboard the Terra satellite (Wan et al., 2015), accessed from the Giovanni tool (Geospatial Interactive Online Visualization and Analysis Infrastructure) at NASA's Goddard Earth Sciences Data and Information Services Center (Acker and Leptoukh, 2007). Within the geodatabase, trends in TX90p, CDDs, and skin temperatures were added to the closest location falling within the respective 5 km pixel.
2.2 Category development
Implementing a data-driven approach allows for determination of discernible susceptibility thresholds according to the records available, which here are derived from observed spot recurrence. Thus, one of the first tasks in this research was the study of the 900 m pixel map to determine whether there were detectable differences in spot recurrence. The categories were defined using a geometric sequence of the following form:
The five categories (C) were then computed by grouping recurrences (i.e., fires per year in each pixel) within the 2008–2019 period. R100 % represents the maximum value in the study area, assumed to have 100 % recurrence. Thus, according to Eq. (1) the very high (VH) category considered recurrences from the maximum to half that recurrence, while near zero (NZ) included the minimum of 0 % recurrence (r=0). Thresholds for the intermediate categories high (H), moderate (M), and low (L) recurrence are calculated using a ratio r= {0.5, 0.25,0.125}, applied to R100 %, respectively.
2.3 Model implementation, validation, and experiments
Based upon the known locations showing different recurrence categories, the modeling involved the development of a supervised classification scheme meant to determine the recurrence probability in the whole study area. To do so, two procedures were applied to the compiled geodatabase: first, a principal component analysis (PCA) to reduce dimensionality from the 11 descriptors (excluding spot recurrence) to a new set of uncorrelated variables, called principal components or PCs, which maximize the explained variance while reducing redundancy among similar variables from the original database (Demšar et al., 2013). In this procedure, land cover classes were included using binary encoding, effectively enlarging the database to 18 descriptors. Afterwards, the PCs explaining most of the variance were used as input to a supervised classification using a Kohonen self-organizing map (SOM) algorithm (Kohonen, 1990). A SOM is a class of neural networks that reveals the structure of a dataset by competitive learning. The supervised classification was implemented as an iterative process where a random selection of locations from the recurrence categories were presented to the SOM, using the corresponding PCA output as descriptors. During a given iteration the algorithm selected 50 locations per category, classified by comparing those locations with the rest of the study area. With the output of all iterations, the model calculates a simple probability of determining into which category a certain location falls more often, assigning the respective value. Computation of the SOM's network size and iteration number was determined following recommendations by Kohonen (1990) and Vesanto (2000). Evaluation and validation of model output included using the MCD14ML product, a MODIS standard-quality thermal anomalies/fire locations database, accessed through NASA's Fire Information for Resource Management System (FIRMS).
A long-standing debate exists on whether forestry plantations enhance wildfire occurrence in this region (Úbeda and Sarricolea, 2016a; Urrutia-Jalabert et al., 2018; de la Barrera et al., 2018). This presented model allows testing the sensitivity of the study area to different scenarios, and thus two extreme situations were compared. A first model configuration assumed all non-urban areas were covered by native vegetation, while a second scenario considered all non-urban areas plantation. Inclusion of these two scenarios into the SOM model was through using the corresponding weights of the PCA to recalculate the score of each location relative to the selected PCs.
3.1 Analysis of geodatabase components
From the 5404 fires recorded in the database, spatial patterns of recurrence during the period under study were associated with wildland–urban interface areas of the CMA, since the quadrants with a recurrence of more than 20 fires were found at less than 650 m from urban centers and highways. In fact, the pixel with the maximum number of fires between 2008 and 2019, 154 or 14 per year, is located at the middle of the study area near the city of Lota (∼ 37.10∘ S, 73.13∘ W) and is surrounded by a number of locations with high recurrence, above 25 % (see Supplement Fig. S1). This suggests that the causes of these forest fires are mostly anthropogenic. On the contrary, the areas that did not record fire outbreaks during the study period were associated with remote locations with an average elevation of 250 m, 8.1 km distant from urban centers and 1.5 km from highways.
As presented in Table 2, climatic descriptors show a general increase of 0.59 ∘C/yr for TX90p and 0.51 d/yr in CDDs, with a decrease of −0.52∘/yr in skin temperature. TX90p shows a range of 1.8∘/yr and a standard deviation of 0.4∘/yr, indicating that most locations have been undergoing an increase in maximum temperatures. In fact, only 7 % of the pixels present negative linear trends, with most of them located on a buffer of about 5 to 7 km from the southeast of the main urban area of Concepción. The distribution of CDD trends, on the other hand, is completely positive, with a minimum value of 0.26 d/yr and maximum of 0.8 d/yr. Skin temperature is the only variable with a relatively clear spatial differentiation; while 62 % of the region records a decreasing trend, the 38 % of the study area that shows the opposite behavior is in or near urban sectors of the CMA. This satellite dataset indicates cooling of as low as −4.2∘/yr and warming of 4.6∘/yr, with a standard deviation of 4.02∘/yr.
The comparison of CONAF hotspot distances to streams, roads, and urban areas suggests a significant impact of roads on fire occurrence since on average hotspots are mapped at about 1.3 km from roads. In turn, streams and urban areas are at 5.5 and 6.6 km, respectively. Despite this pattern, the large corresponding standard deviations of 1.1, 5.9, and 6.3 km indicate a significant spread.
The values of the NDVI, which is associated with vegetation composition and structure, range from −0.2312 to 0.4460. Negative values of this indicator are related to non-vegetation land covers/uses such as water bodies, urban areas, or bare soils. On the other hand, the positive values are related to coverages from low vegetation such as pastures or scrub (values close to zero) to dense vegetation such as arborescent scrub, forest plantations, or native forest (NDVI > 0.25). Within the study area, 9.1 % of the pixels presented negative NDVI values (no vegetation), 35.7 % corresponded to positive intermediate NDVI values (grasslands, scrublands, young forest plantations), and 55.2 % corresponded to high NDVI values (adult forest plantations, native forest). The values of the NDII, which is associated with the moisture content of the vegetation, range from −0.154 to 0.450. The negative values of this index are related to cover/uses without vegetation such as water bodies or urban areas. Positive values are associated with water content in the vegetation; the value of the index increases with increasing water content in the vegetation. Within the study area, 7.4 % of the pixels presented negative NDII values and 42.8 % corresponded to positive NDII values (but close to zero), mainly associated with shrublands and grasslands. Finally, 64.7 % corresponded to medium–high NDII values, which are associated with adult forest plantations and native forest.
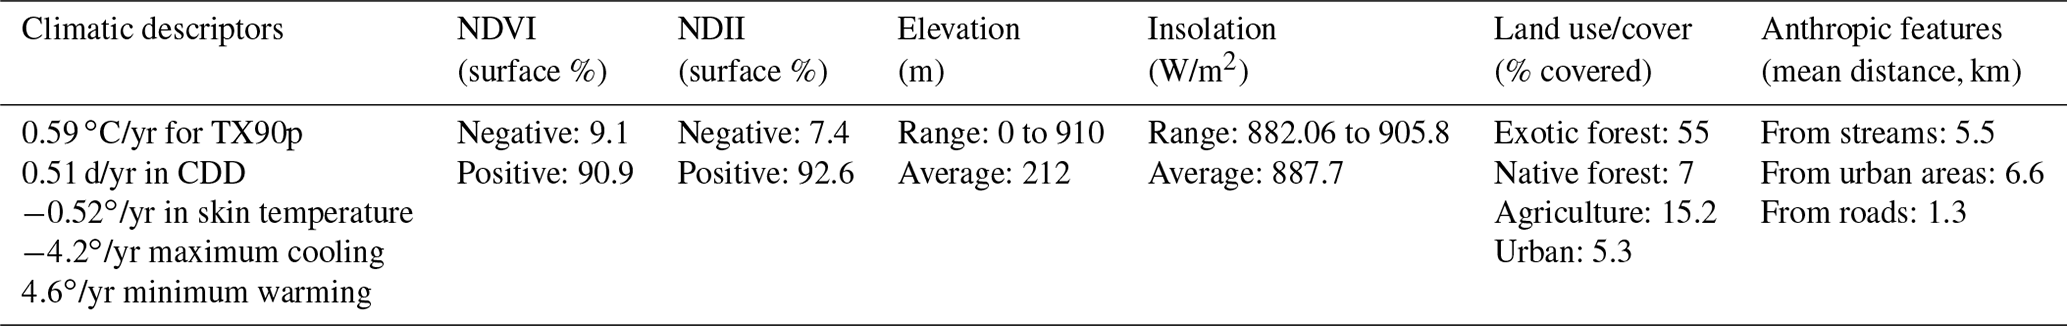
The elevation ranges in the study area fluctuated between 0 and 910 m, with an average elevation of 212 m. The highest elevations are found in the southern part of the study area and are mostly associated with the presence of forest plantations and small fragments of native forest. The western area presents the lowest terrain elevations, presenting itself as a coastal plateau where the urban areas of the CMA are present. The insolation on the ground, which directly influences the formation of fuel for the formation of forest fires, reached mean values of 887.7 W/m2, with insolation ranging from 882.06 to 905.8 W/m2. The highest insolation values are associated with higher-elevation sectors with a north-facing terrain aspect. Insolation on the ground showed little variation due to the low variability in elevation gradients in the study area. Finally, with respect to the land use/cover present in the study area, 55 % of the surface corresponded to exotic forest plantations of Pinus radiata and Eucalyptus globulus species, which are associated with the highest elevation of the study area. A further 7 % corresponds to native forests of Nothofagus sp., which are present in areas of high slopes (> 30 %). On the other hand, 15.2 % corresponds to agricultural zones, which are associated with low sectors in the eastern part of the study area. Finally, urban areas represent 5.3 % of the total surface area and are found mainly in the coastal zone (west) of the study area.
When the data of the geodatabase are inspected according to the categories determined from spot recurrence (Eq. 1), several patterns emerge (Fig. 2). A first finding is that the moderate (M) to very high (VH) categories tend to present much less spread, with almost no outliers. It is also noticeable that the near zero (NZ) and low (L) categories spread to about the same range, suggesting that low recurrences do not conform to a distinguishable pattern of recurrence and that instead they correspond to random events. Variables associated with vegetation characteristics, i.e., trends in NDII (t-NDII) and in NDVI (t-NDVI), tend to show that the VH category is mostly associated with negative trends, deepening the decreasing tendency of H.
As expected from the method utilized to calculate insolation, that variable and elevation show a similar pattern, where M, H, and VH fall in regions of progressively higher values. Spot distances to urban centers (d-Urban) appear to be within a narrow range for M, H, and VH relative to L. Although with absolute values lower than d-Urban, distances to roads (d-Road) are largely shorter than 2 km for the three highest categories, with the moderate values for VH being marginally shifted towards 2 km relative to H and M. For the distance relative to streams (d-Stream), spot recurrence tends to be higher at a separation below 2.5 km for H and VH.
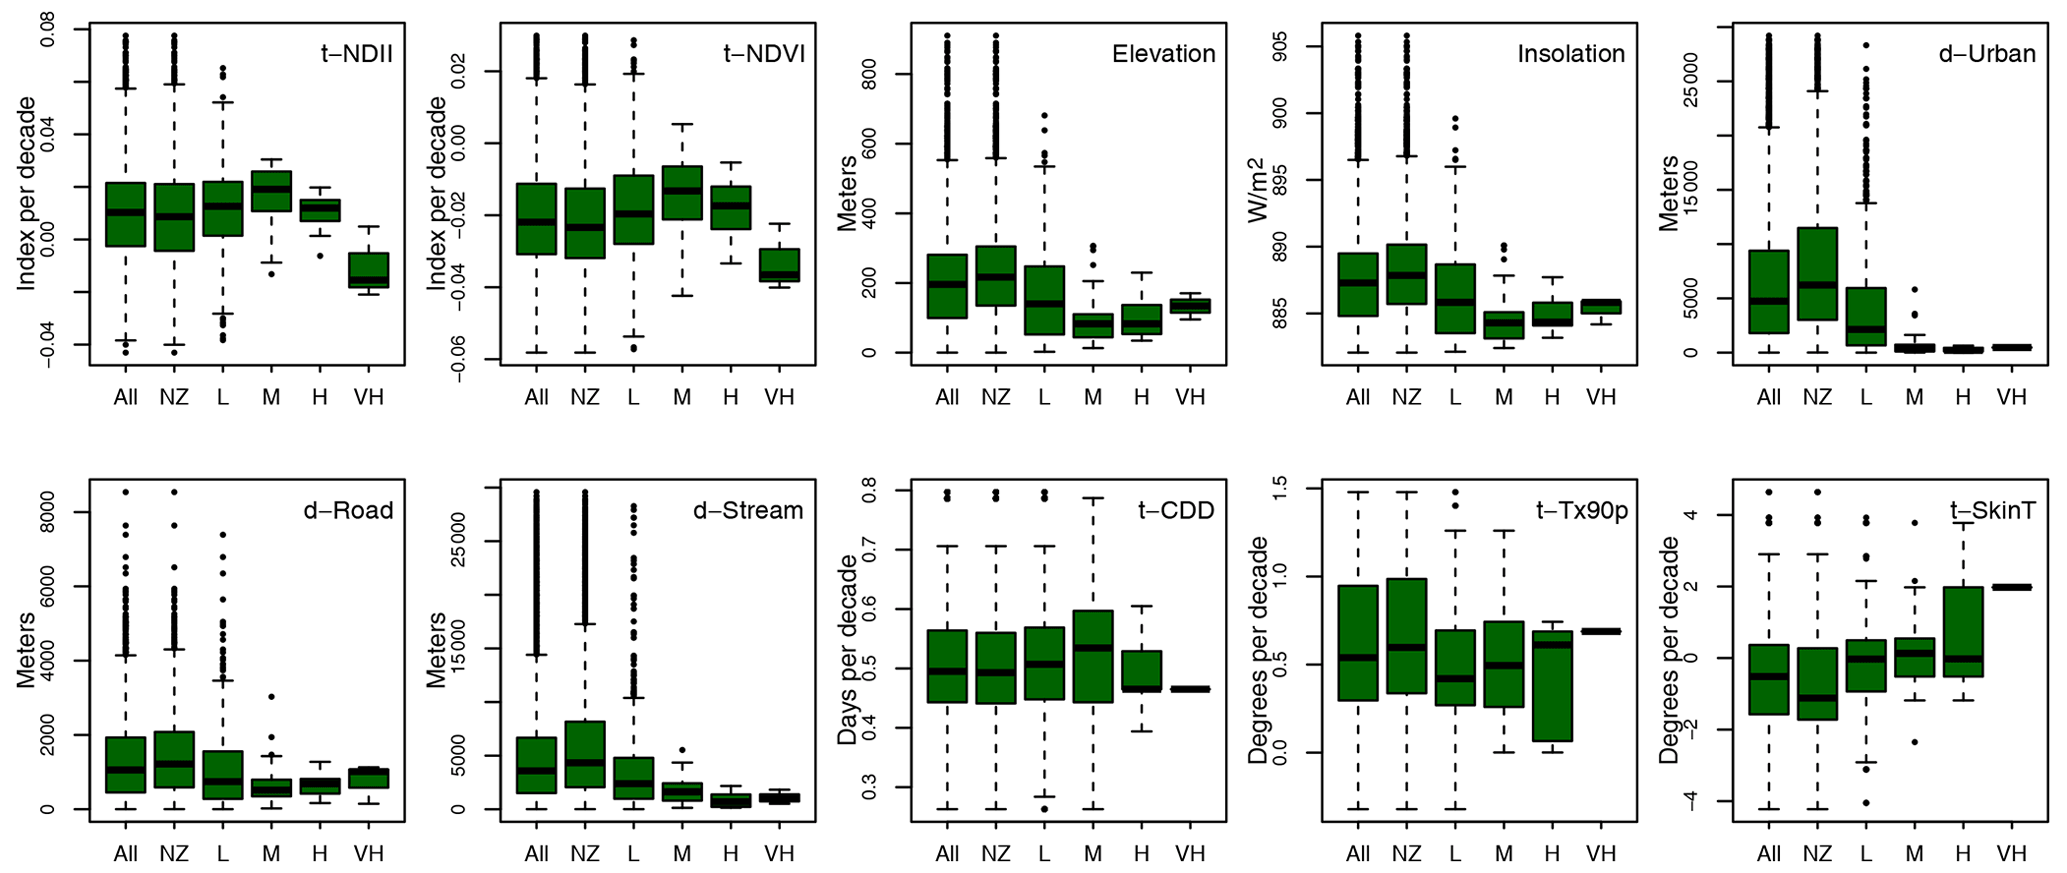
Figure 2The main features of the variables in the geodatabase, grouped according to the wildfire categories: near zero (NZ), low (L), moderate (M), high (H), and very high (VH). Units of temperature are degrees Celsius.
The distribution of climatic variables according to categories shows a clear concentration within a narrow range for VH. As previously detected, the trend in CDDs (t-CDD) for the CMA is completely positive, although for VH it is concentrated just below 0.5 d/yr. In the case of TX90p (t-TX90p), results indicate that M, H, and VH spot recurrence has only occurred in areas with positive change, with H showing the largest interquartile range. For skin temperature trends (t-SkinT), most locations with positive trends coincide with high and very high recurrence. Figure 3 shows the land use data pertaining to each category. The most striking pattern is that 100 % of VH occurs over plantations, with about 70 % for H and nearly 45 % for M.

Figure 3Land use (%) classified for the CMA according to the following wildfire categories: near zero (NZ), low (L), moderate (M), high (H), very high (VH), and all. All represents the distribution of the land cover along the whole study area.
In addition, the progressive importance of urban land use connected with plantations as the recurrence increases suggests that the connection between these two land uses explains most of the damaging effects of wildfires in the CMA. As already seen in the distribution of other variables, L and NZ present a similar partitioning to the whole study area (“All” in Figs. 2 and 3), further attesting to a random pattern of low recurrence. This way, the analysis of input variables tends to indicate that there is a relatively consistent pattern of landscape conditions that allow for certain locations to record fires more frequently than others.
3.2 PCA and SOM model output
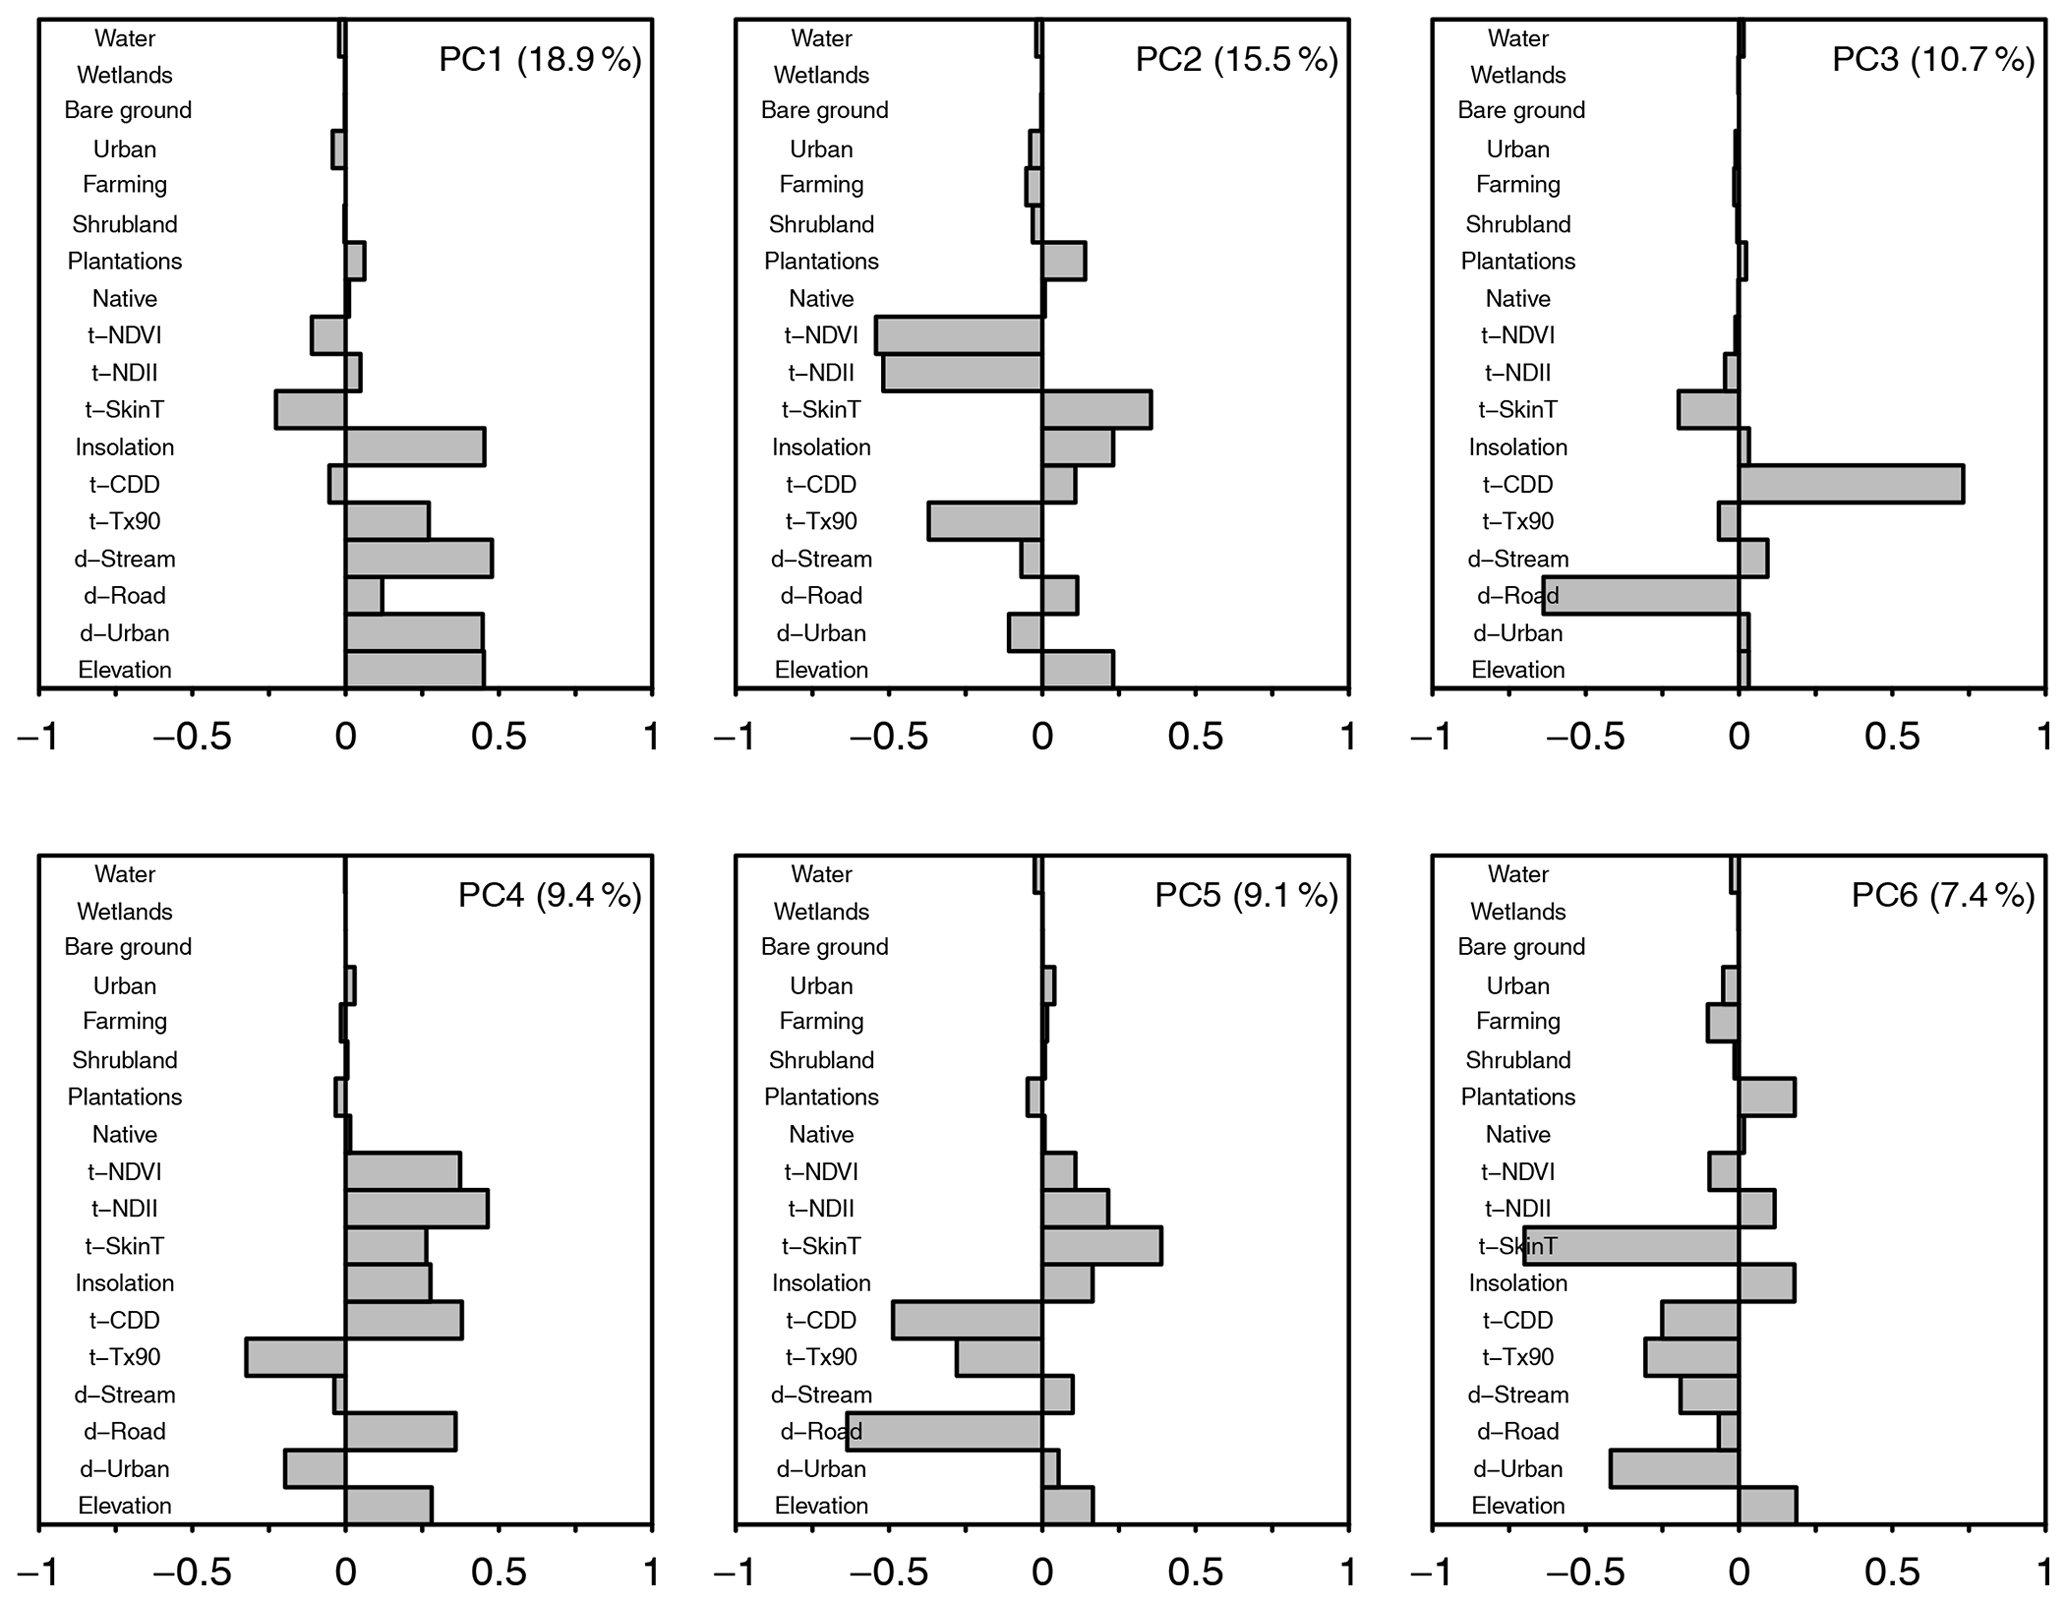
Six principal components (PCs, labeled PC1–PC6) explain about 71 % of the geodatabase variance within the study area. Since the PCA was applied to the whole CMA, these results represent the relationships including zones with zero fire hotspots. Although no PC within these six accounts for more than 20 %, certain patterns emerge that suggest the procedure has been able to suppress redundancies in the database (Fig. 4). PC1 reaffirms the relationship between elevation and insolation and the similar behavior of d-Stream and d-Urban. TX90p tends to be important in both PC1 and PC2, while in the latter t-NDVI and t-NDII show the highest weights, indicating important correlations between them. In turn, d-Road and t-CDD are largely influential mostly in PC3. A remarkable finding is that this PCA standardization does not show land use as a prominent variable, as plantations appear to be somewhat key in PC6 only.
The analysis of the PCA partitioned by recurrence categories reveals that only certain PCs – M, H, and VH – develop distinct signatures (Fig. 5). These results also reaffirm the similarity of L with a situation of nearly zero spots. Although in almost all PCs the increase in recurrence shows a trend of a narrow range relative to the immediately previous category, there are certain remarkable exceptions, such as the slight reverse trend of VH relative to H in PC1 and the significant interquartile range for H in PC6. A noticeable finding is that VH's interquartile range seems different from the rest of the categories for PC1, PC2, and PC4.

Figure 5Boxplots showing the distribution of PC weights according to the recurrence categories. All represents the distribution of each PC throughout the whole study area.
SOM output compared with CONAF and MODIS data indicates that this data-driven model is skilled in predicting an increase in spot density according to the corresponding category (Table 3). Given that the model was trained with CONAF data, it is expected that a better match is found in that comparison. In effect, the model predicts increasing density according to the recurrence category. The VH's 10.98 spots per pixel is 3 times denser than that of H's and about 5 times denser relative to M. For the case of MODIS data, the model also finds a significant increase in density for VH, almost 4 times higher than for M and H; however, it does not predict density differences between M and H and records a slightly larger density for L. The NZ category is well predicted by the model compared to both sources of fire hotspot activity: ∼ 6 times smaller for CONAF and about half for MODIS.
According to the model, 55.8 % of the CMA presents conditions for low recurrence of fire hotspots, with about one-third for M and just 12.3 % for high and very high recurrence. The model also predicts that spot recurrence is a phenomenon that may affect almost the whole study area (Fig. 6a).
Table 3Comparison of SOM model output versus CONAF and MODIS fire hotspot density. Density is calculated as the number of CONAF or MODIS spots that fall within a given CMA model category divided by the number of pixels corresponding to that category.
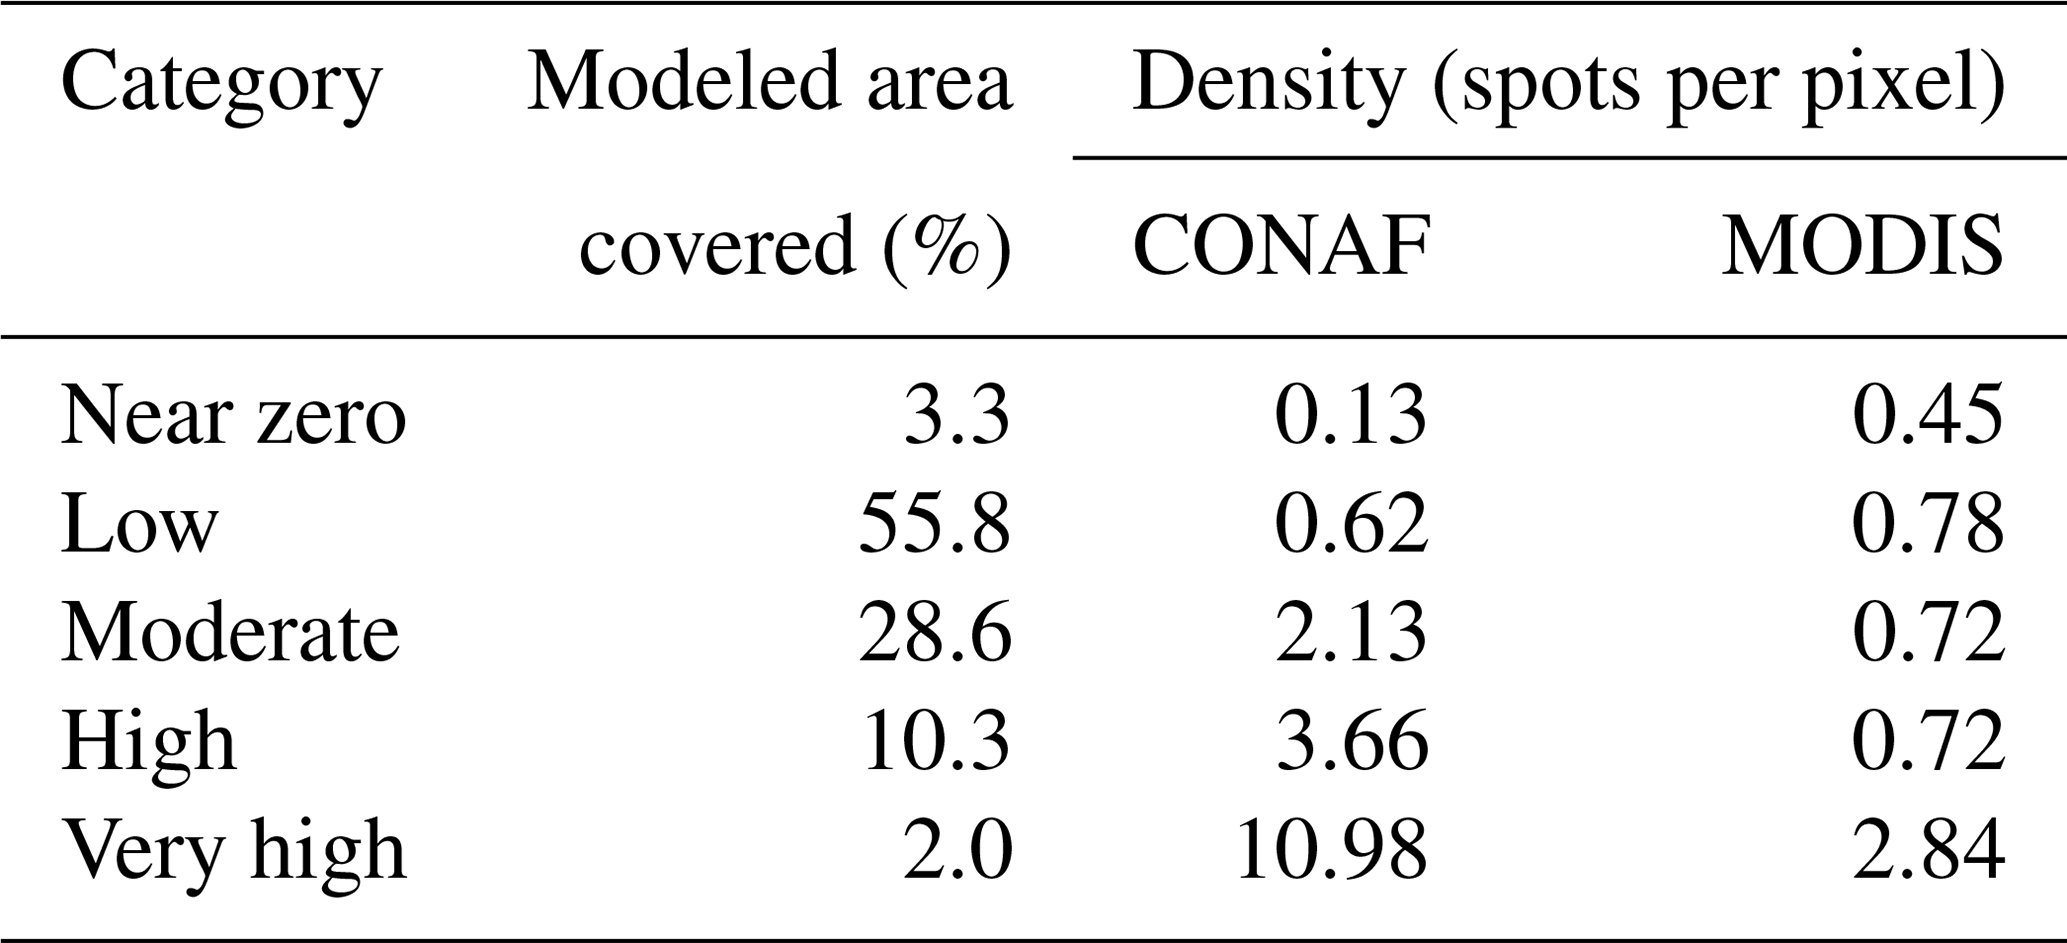
Note that MODIS reports 50.04 % fewer hotspots than CONAF.
The native scenario tends to show more pixels in the moderate category than the plantation scenario (Table 4). Also, the native scenario sees an increase in the VH category. On the other hand, plantations tend to show an increase in the L and H categories while reducing NZ. Although these differences are not extreme, they attest to a different dynamic depending on the prevalent land cover. Both models show clustering patterns in which very low and low values are associated with higher-elevation sectors within the CMA, which in turn have the lowest insolation values. On the other hand, the high and very high values are associated with low elevations near the roads and urban areas of the CMA (Fig. 6b and c).
Table 4Modeled proportion of spot recurrence within the CMA (%) according to the five categories, considering the scenarios in which the whole study area is assumed to be covered by native vegetation (native experiment) and exotic plantations (exotic plantation experiment). The lower section of the table compares spot counts and the surface area per category relative to the full model using the original database and to the experiments.
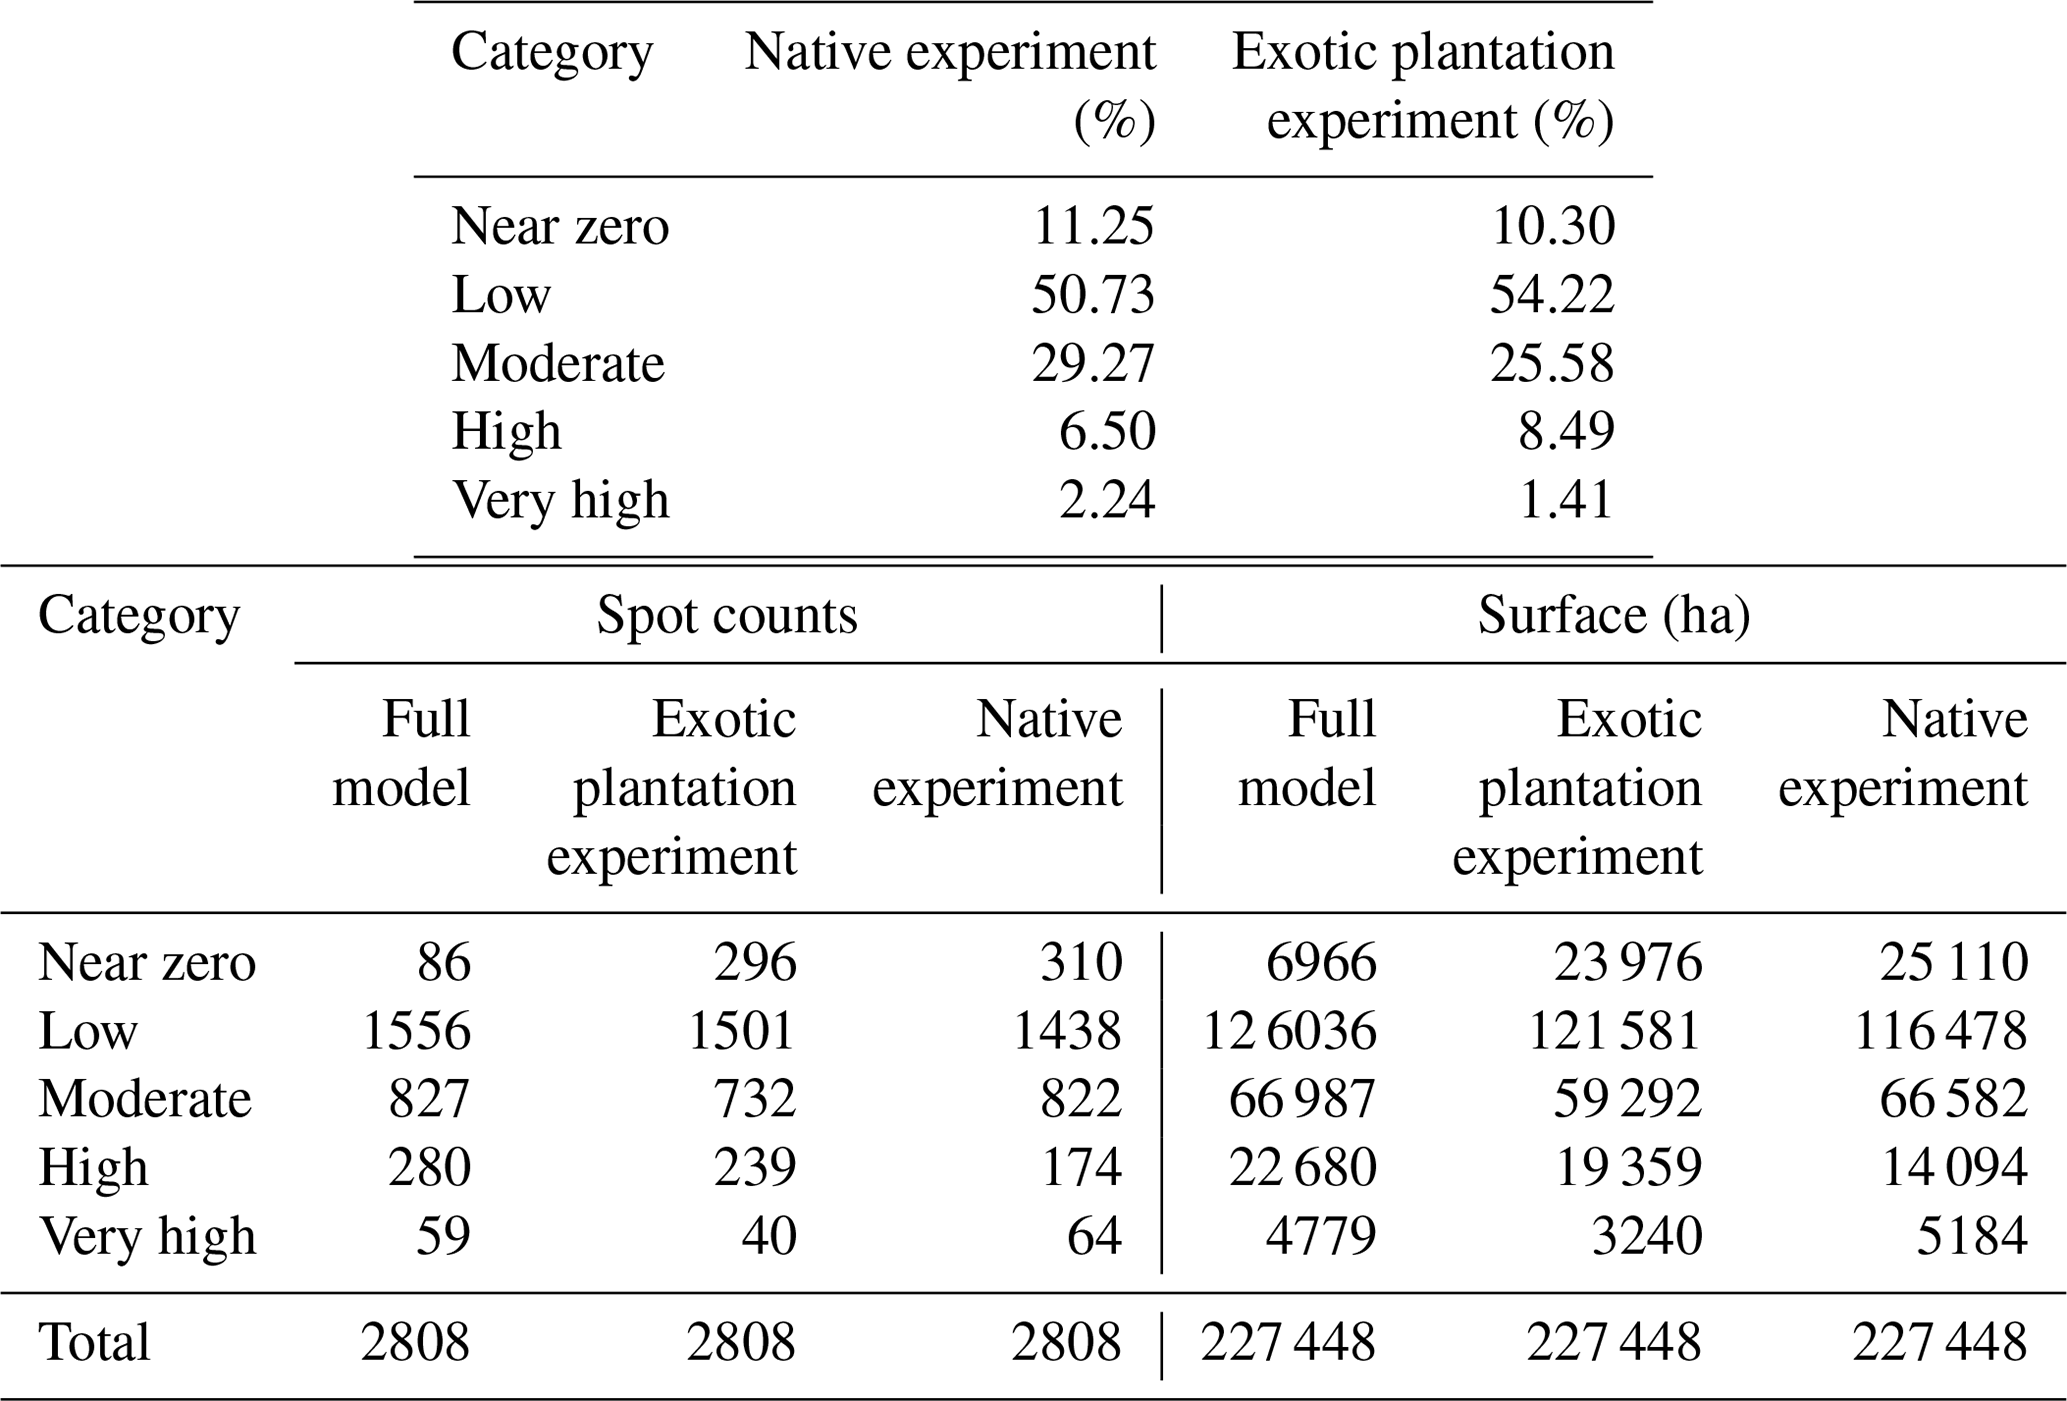
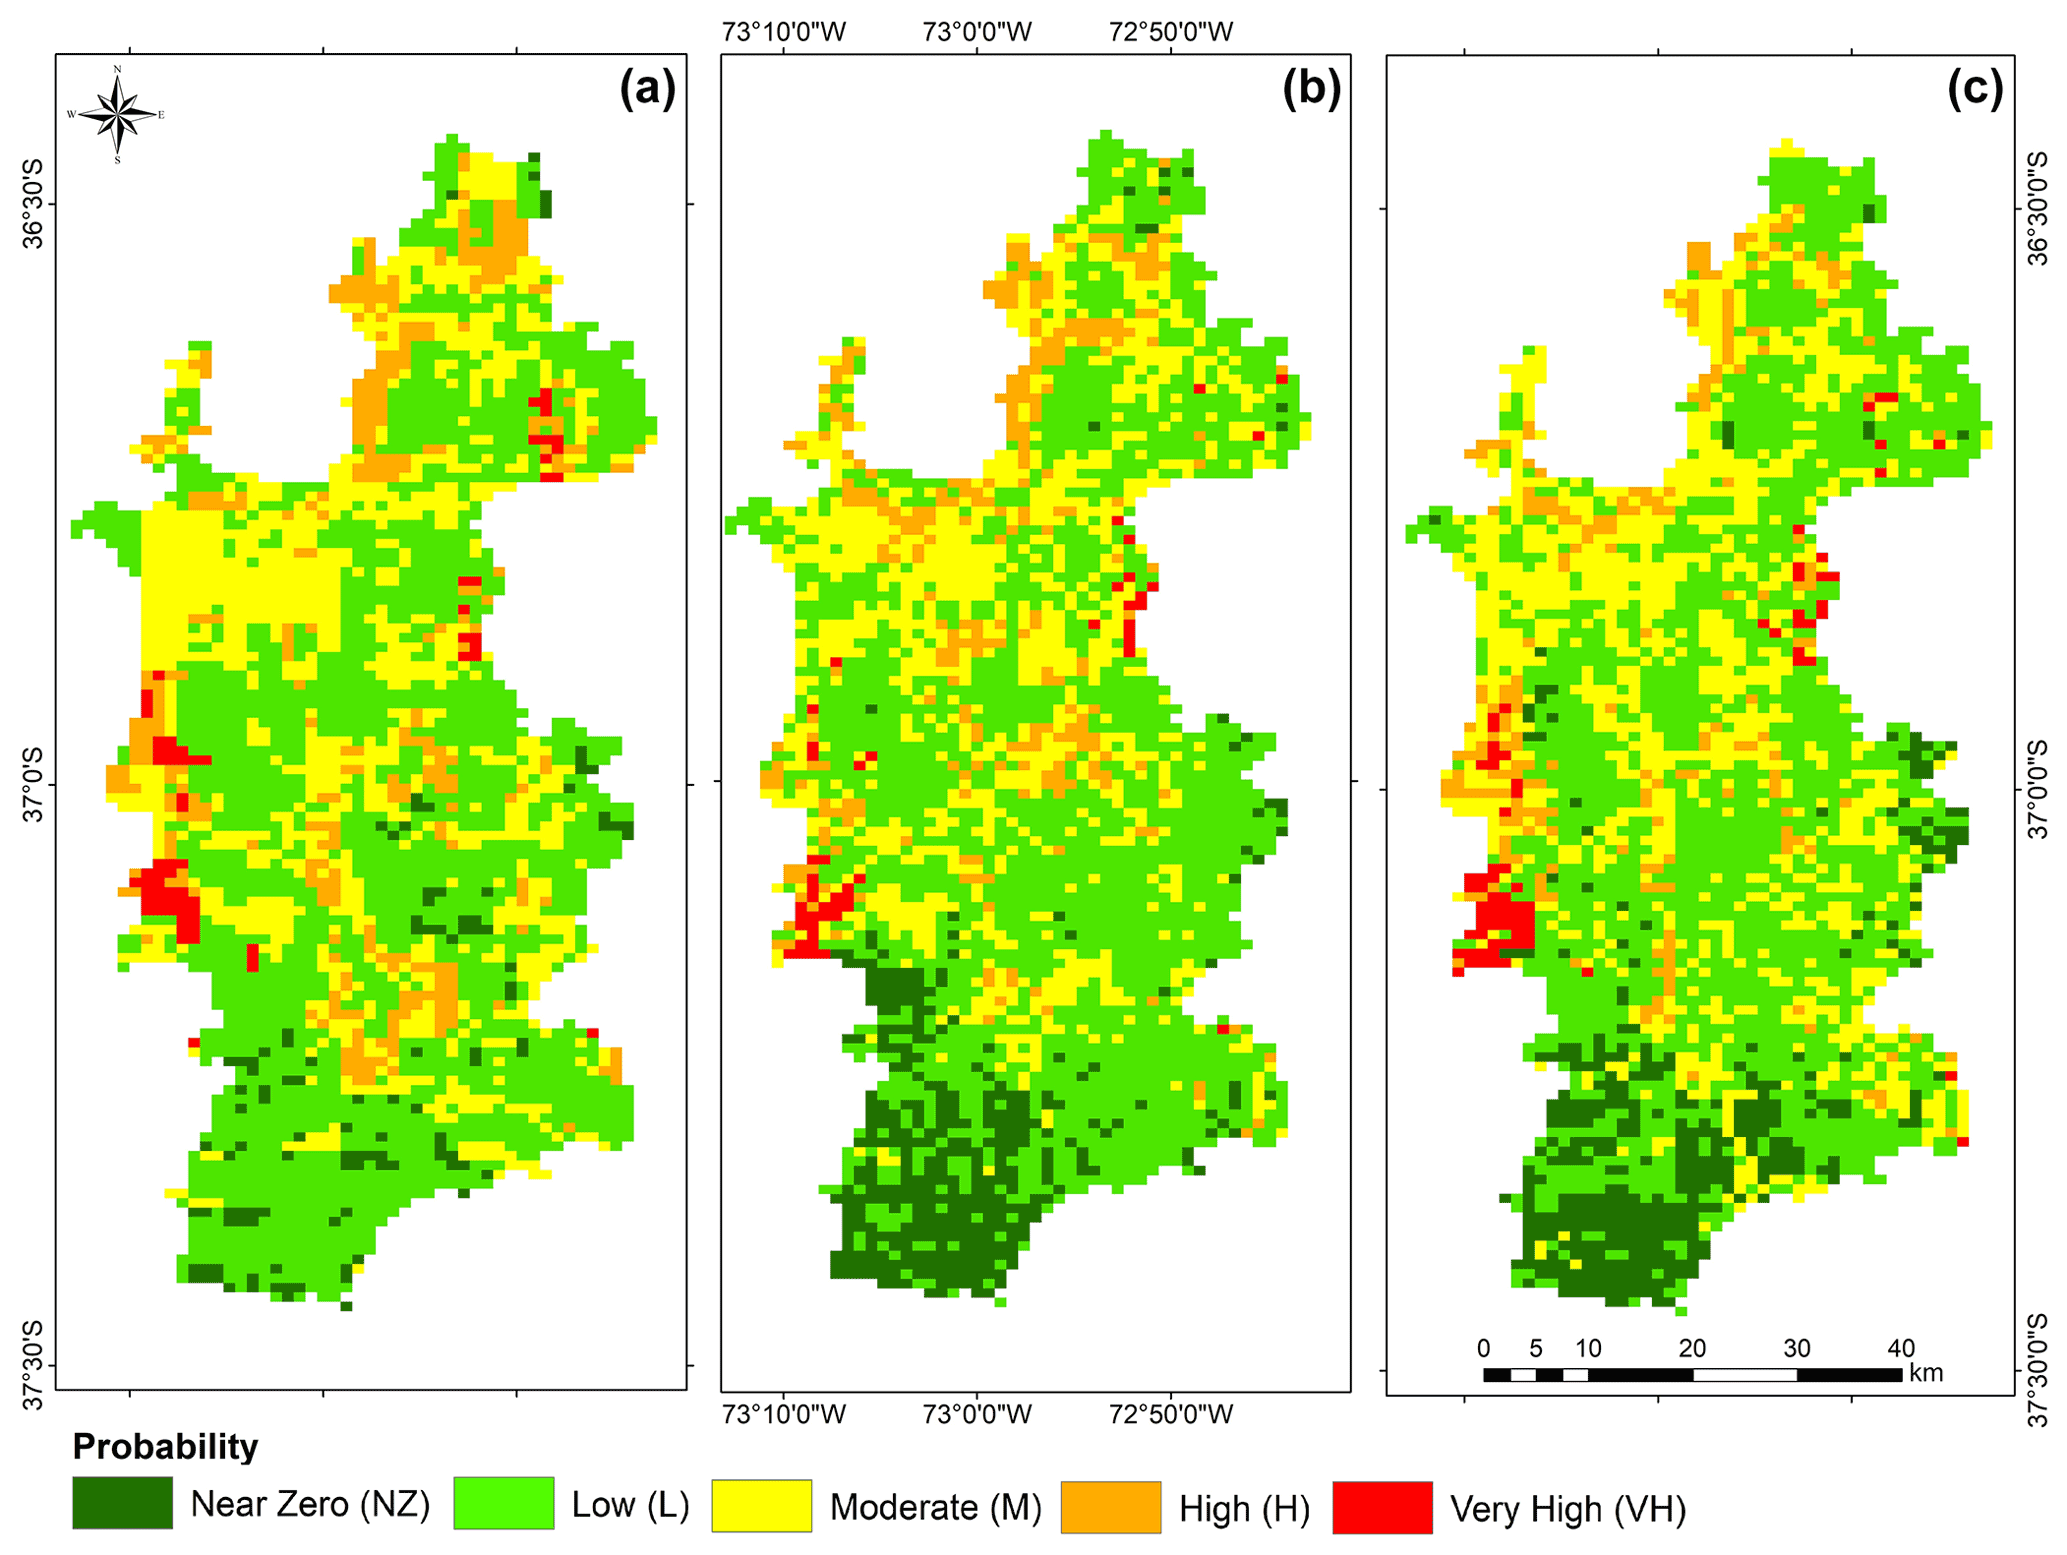
Figure 6Model results of wildfire recurrence in the CMA. (a) Model results using the original geodatabase. (b) The scenario of only exotic plantations. (c) The native forest experiment.
In Mediterranean central Chile, land cover changes that characterize current landscape organization resulted mostly from the application of the government subsidies granted by Decree Law 701 for forestry development (DL 701) in 1974 (Nahuelhual et al., 2012; INFOR, 2017, p. 25). This policy favored plantations of exotic fast-growing species across the region, with staggering consequences: in 1974, the surface area of forestry plantations was 480 000 ha, and during the 1990s it was close to 2×10⁶ ha (Aguayo et al., 2009), reaching nearly 5×10⁶ ha in 2015 (INFOR, 2017, p. 49). This 10-fold increase in plantations motivated by public policy contrasts with the little attention paid to restoring native forests, which have historically contributed to the local population's livelihoods (Reyes and Nelson, 2014; Frene and Núñez, 2010), requiring that the rural and indigenous communities must compete for the use of the land against the plantations and inciting environmental conflicts (INDH, 2015).
Concomitant with the plantation spread throughout the region, an increase in the recurrence and magnitude of fire disturbances in WUIs has been observed, due to the blurred border between land covers or the substitution of certain land use for others (Goldman, 2018; Ruiz et al., 2017). According to CONAF, over 35×106 ha of vegetation is vulnerable to fires, including grasslands and shrubland (20×106 ha), native forest (13×106 ha), and exotic plantations (2.1×10⁶ ha) (Castillo et al., 2003; CONAF, 2018). Of this vegetation, over 50 000 ha is burned annually in approximately 5900 wildfires. Under these political and economic conditions, the land change cover seems to be a critical factor that contributes to the wildfire risk and whose conflictive evolution has built a double-pressure scenario that shows no sign of changing (Ubeda and Sarricolea, 2016a; Andersson et al., 2016). Likewise, the urban expansion fomented by the National Policy of Urban Development (NPUD) from 1979 has been deregulating the land use market (Brites, 2017), fomenting the urbanization of agricultural lands, wetlands, or forests (IDB-ECLAC, 2007; Vilar del Hoyo et al., 2011; Hidalgo et al., 2018).
The machine learning model developed in this work shows that about 40 % of the CMA has at least a moderate probability of fire recurrence. Wildfire hotspot density is well represented by the model, which suggests this tool could be a powerful decision-making tool for the public sector (i.e., national government, municipalities) and the private sector (universities, timber companies, real estate developers). Hotspot density is concentrated on roads (1.3 km), leaving the water streams (5.5 km) and urban areas (6.6 km) far behind, consistent with the literature that assigns the major responsibility of the fire recurrence to the presence of human infrastructure and human activities (Harari, 2013; Doerr and Santin, 2016) and with CONAF's previous reports (CONAF, 2017, 2018). However, the anthropic factor is not the only one to count, as Barbati et al. (2013) said, the distance from the nearest water body is determinant for short-term fire recurrence in Mediterranean countries, along with other landscape factors (slope roughness, exposure, pre-fire dominant forest type). Additionally, the proximity to roads and maximum temperature dynamics, both variables severely altered by human activities, tend to organize the randomness observed in this model. This high random component in the occurrence of events is associated with a lower wildfire hazard, which reveals that after a random appearance, the recurrence increases according to the conditions of each zone. This last idea of random distribution of low and almost zero recurrences has been around for a long time, and the literature reports similar results from GIS models in Sardinia, Italy (Ricotta and Di Vito, 2014); California, USA (Minnich and Chou, 1997); and Spain (Chuvieco et al., 2011, p. 49; Vilar del Hoyo et al., 2011). Nevertheless, it is contradictory to the official data from CONAF, which established that “a high occurrence was recorded in the interface areas of the region, because of the repeated occurrence of forest fires during the 2015-2016 season” (CONAF, 2020), and the study of central Chile from McWethy et al. (2018), which stated that “fire activity was highly variable in any given year, with no statistically significant trend in the number of fires or mean annual area burned”.
Experiments comparing total plantation and total native scenarios, while not generating a significant change in categories, suggest that there are more areas that will be subject to fires (fewer near-zero areas) when there are more plantations. The fact that the low category tends to increase, even if it is marginal, perhaps indicates that the probability of prediction is reduced when coverage is mostly plantation as the system tends to become more random. Also, it is relevant that the model does detect a difference between scenarios of total plantation and native forest cover, indicating that the changes in fire regime and fire occurrence rely heavily on the vegetal cover for central Chile, which is consistent with the literature (McWethy et al., 2018; de la Barrera et al., 2018; Úbeda and Sarricolea, 2016), press reports (CIPER, 2018), and official reports (CONAF, 2017, 2018). Other studies suggest the same relevance of landscape drivers for Mediterranean countries (Darques, 2015; Pausas et al., 2008; Turco et al., 2016). By examining the features of the model presented here, it is possible to propose two, not necessarily exclusive, possibilities that may explain the relatively weak contribution of forest plantations to fire risk. The first is that anthropogenic activities may become more important at the local rather than the regional scale. For instance, whereas the model shows that the urban boundary is overwhelmingly associated with categories M to VH, if one zooms out to the whole of Mediterranean central Chile, cities become small spots. The second possibility may be a “saturation effect” in the sense that plantations now occupy such a significant surface area within the CMA that the influence is already permanent in the current regime of fires, meaning that any data-driven treatment sees plantations as a constant and thus attributes a small contribution. That is the reason why the native-vs.-plantation experiments are important: they indicate that the plantations tend to reduce the areas with near-zero recurrence relative to the native scenario, although the difference is marginal, likely associated with the saturation effect.
Results of the model are thus relevant as they serve to accumulate and analyze historical, cartographical, and other types of data, leading to a better understanding of controls on and drivers of fire activity in the CMA at a high resolution. However, the model can be substantially improved with near-real-time (NRT) information from terrestrial platforms (e.g., vehicles, towers, cranes), airborne platforms (e.g., aircraft, unmanned aerial vehicles (UAVs), helicopters), or space-borne platforms (e.g., satellites) using electromagnetic sensors (Van Ackere et al., 2019) and leading us to a truly smart metropolitan area (Costa et al., 2020). In that sense, it becomes necessary to put in more effort in the future to extending the timeframe of the present study, as Chuvieco et al. (2011, p. 54) accurately said, “Since fire occurrence changes in space and time, the validation of integrated indices should be done with long time series, because short periods may bias some of the theoretical assumptions that are required to build the model”.
Future scenarios for the CMA are filled with uncertainty, especially for climate change and associated impacts. Projections from the work of Araya-Muñoz et al. (2017) indicated that the most relevant hazards for the CMA will be wildfires, water scarcity, and heat stress. Likewise, droughts are becoming more recurrent (Garreaud et al., 2020; Fernández et al., 2018). As the model suggests, climatic indicators play a role in fire recurrence, which allows us to infer that changes in those will lead to increases in wildfire hazard for the CMA. What is changing fast is the climate conditions, creating riskier scenarios globally. Therefore, there is an opportunity to improve nature-based solutions or make them mandatory: controlled burns for a social–ecological transformation (Otero and Nielsen, 2017); the ecological restoration of soils, wetlands, and forests; REDD; Initiative 20×20; and promoting the carbon emission market for carbon sequestration (Wright et al., 2000). For example, the Pinus radiata plantations in Chile and Australia have a potential average net annual rate of CO2 accumulation of 4.5 t (IPCC, 1996), sequestering greenhouse gas emissions faster at a lower cost, returning the investments quickly, and mitigating some of the impacts of climate change (Pawson et al., 2013).
This study aimed to develop, implement, and test a model of fire risk by combining natural and human factors that are associated with wildfires' generation and spread. The combination of data using PCA and SOM allowed us to ponder the relative importance of each factor, interpret how interweaved they are, and study the impact of land cover. Despite observed moderate to very high recurrence tending to cluster near urban areas and on plantations, the model presents a more complex interaction among factors, where climate (e.g., t-TX90p), elevation, and human aspects (d-Urban and d-Roads, for instance) are able to predict observed hotspot densities, leaving land cover as a minor component. However, the comparison of the different land cover scenarios points to a detectable influence of plantations in increasing fire risk and the spatial distribution of recurrence.
Results indicated that 12.3 % of the CMA's surface area has a high and very high risk of a forest fire, 29.4 % a moderate risk, and only 58.3 % a low and very low risk. This calls for reflection on the importance of spatial planning with a resilient focus on wildfires according to the recurrence of these phenomena in these settings as they are increasingly more forced in WUIs, urban residential areas, and industrial or port areas. These maps and this model are of vital importance for the Chilean government emergency agencies as well as for the city governments within the CMA. They are also relevant for understanding how these phenomena affect the Mediterranean ecosystems to which the CMA belongs, and they therefore should be beneficial for researchers in other latitudes working on similar ecosystems.
Computer code for the model is available on request.
All databases used in this research are free to access from the links included in the paper.
The supplement related to this article is available online at: https://doi.org/10.5194/nhess-21-3663-2021-supplement.
EJC designed the study in consultation with RFR and CGO. AF developed, coded, and ran the model aided by all co-authors. RFR processed and analyzed remote sensing data. All co-authors participated in statistical analyses, discussion of results, and writing.
The contact author has declared that neither they nor their co-authors have any competing interests.
Publisher’s note: Copernicus Publications remains neutral with regard to jurisdictional claims in published maps and institutional affiliations.
We acknowledge our translator Karen Ojeda and the reviews of Paul Santi and Damiano Vacha.
This research was conducted with the support of the FONDECYT program, Chilean Science Bureau (ANID) (grant no. 1171065).
This paper was edited by Mario Parise and reviewed by Paul Santi and Damiano Vacha.
Abrams, M., Bailey, B., Tsu, H., and Hato, M.: The ASTER Global DEM, Photogramm. Eng. Rem. Se., 76, 344–348, 2010.
Acker, J. G. and Leptoukh, G.: Online analysis enhances use of NASA Earth science data, EOS T. Am. Geophys. Un., 88, 14–17, https://doi.org/10.1029/2007EO020003, 2007.
Adams, M.: Mega-fires, tipping points and ecosystem services: Managing forests and woodlands in an uncertain future, Forest Ecol. Manag., 294, 250–261, https://doi.org/10.1016/j.foreco.2012.11.039, 2013.
Aguayo, M., Pauchard, A., Azócar, G., and Parra, O.: Cambio del uso del suelo en el centro sur de Chile a fines del siglo XX: Entendiendo la dinámica espacial y temporal del paisaje, Revista Chilena de Historia Natural, 82, 361–374, https://doi.org/10.4067/S0716-078X2009000300004, 2009.
Altamirano, A., Salas, C., Yaitul, V., Smith-Ramirez, C., and Ávila, A.: Influencia de la heterogeneidad del paisaje en la ocurrencia de incendios forestales en Chile Central, Revista de Geografía Norte Grande, 55, 157–170, 2013.
Alvarez-Garreton, C., Mendoza, P. A., Boisier, J. P., Addor, N., Galleguillos, M., Zambrano-Bigiarini, M., Lara, A., Puelma, C., Cortes, G., Garreaud, R., McPhee, J., and Ayala, A.: The CAMELS-CL dataset: catchment attributes and meteorology for large sample studies – Chile dataset, Hydrol. Earth Syst. Sci., 22, 5817–5846, https://doi.org/10.5194/hess-22-5817-2018, 2018.
Andersson, K., Lawrence, D., Zavaleta, J., and Guariguata, M.R.: More trees, more poverty? The socioeconomic effects of tree plantations in Chile 2001–2011, Environ. Manage., 57, 123–136, https://doi.org/10.1007/s00267-015-0594-x, 2016.
Araya-Muñoz, D., Metzger, M. J., Stuart, N., Meriwether, A., Wilson, W., and Carvajal, D.: A spatial fuzzy logic approach to urban multi-hazard impact assessment in Concepción, Chile, Sci. Total Environ., 576, 508–519, https://doi.org/10.1016/j.scitotenv.2016.10.077, 2017.
Barbati, A., Corona, P., D'amato, E., and Cartisano, R.: Is landscape a driver of short-term wildfire recurrence?, Landscape Res., 40, 99–108, https://doi.org/10.1080/01426397.2012.761681, 2013.
Biblioteca del Congreso Nacional (BCN): Reportes Comunales, available at: https://www.bcn.cl/siit/reportescomunales/comunal.html?unidad=Comunales&anno=2015, last access: 29 November 2021.
Boisier, J. P., Rondanelli, R., Garreaud, R. D., and Muñoz, F.: Anthropogenic and natural contributions to the Southeast Pacific precipitation decline and recent megadrought in central Chile, Geophys. Res. Lett., 43, 413–421, https://doi.org/10.1002/2015GL067265, 2016.
Brites, W. F.: La ciudad en la encrucijada neoliberal. Urbanismo mercado-céntrico y desigualdad socio espacial en América Latina, Urbe Revista Brasileira de Gestão Urbana, 9, 573–586, https://doi.org/10.1590/2175-3369.009.003.ao14, 2017.
Bustamante, L. P. and Varela, E. S.: Crecimiento urbano y globalización: transformaciones del Área Metropolitana de Concepción, Chile, 1992–2002, Scripta Nova, Revista Electrónica de Geografía y Ciencias Sociales, 11, available at: http://www.ub.edu/geocrit/sn/sn-251.htm (last access: 29 November 2021), 2007.
Castillo, M., Pedernera, P., and Peña, E.: Incendios forestales y medio ambiente: una síntesis global, Revista Ambiente y Desarrollo de CIPMA, XIX, 44–53, available at: http://www.keneamazon.net/Documents/Publications/Virtual-Library/Economia-Desarrollo/29.pdf (last access: 29 November 2021), 2003.
Castree, N.: Neoliberalising nature: the logics of deregulation and reregulation, Environ. Plann. A, 40, 131–152, https://doi.org/10.1068/a39100, 2008.
CEDEUS: Geonode CEDEUS, available at: http://cedeusdata.geosteiniger.cl (last access: 1 December 2021), 2016.
Cid, B.: Peasant economies, forestry industry and fires: socio-natural instabilities and agriculture as means of resistance, Ambiente & Sociedade, XVII, 93–114, https://doi.org/10.1590/1809-4422ASOC720V1812015esp, 2015.
Center for Climate and Resilience (CR2): CR2MET Climate data from Chile [data set], available at: http://www.cr2.cl/ (last access: 29 November 2021), 2020.
CENTRO INVESTIGACIONES PERIODÍSTICAS (CIPER Chile): Alertas que anunciaban la catástrofe se arrastran desde 2012. Mega incendios: el historial de omisiones de las autoridades que abonó la tragedia, available at: https://ciperchile.cl/2017/02/01/mega-incendios-el-historial-de-omisiones-de-las-autoridades-que-abono-la-tragedia/, last access: 25 October 2018.
CONAF-BIRF: Catastro y evaluación de los recursos vegetacionales nativos de Chile. Informe nacional con variables ambientales, Publicaciones de CONAF/CONAMA/BIRF, Santiago, 1999.
Corporación Nacional Forestal (CONAF): Análisis de la afectación y severidad de los incendios forestales ocurridos en enero y febrero de 2017 sobre los usos de suelo y los ecosistemas naturales presentes entre las regiones de Coquimbo y La Araucanía de Chile, CONAF, Santiago de Chile, http://www.conaf.cl/tormenta_de_fuego-2017/INFORME-AFECTACION-Y_SEVERIDAD-DE-INCENDIOS-FORESTALES-VERANO-2017-SOBRE-ECOSISTEMAS-VEGETACIONALES-CONAF.pdf (last access: 29 November 2021), 2017.
Corporación Nacional Forestal (CONAF): Estadísticas de incendios forestales en Chile, available at: http://www.conaf.cl/incendios-forestales/incendios-forestales-en-chile/ (last access: 29 November 2021), 2018.
Corporación Nacional Forestal (CONAF): Prevención de Incendios Forestales en Zonas de Interfaz de la Región del Biobío, available at: https://www.conaf.cl/incendios-forestales/prevencion/yo-tambien-soy-forestin-campana-de-prevencion-de-incendios-forestales-2020/prevencion-de-incendios-forestales-en-zonas-de-interfaz-de-la-region-del-biobio/ (last access: 29 November 2021), 2020.
Corripio, J. G.: Vectorial algebra algorithms for calculating terrain parameters from DEMs and the position of the sun for solar radiation modelling in mountainous terrain, Int. J. Geogr. Inf. Sci., 17, 1–23, https://doi.org/10.1080/713811744, 2003.
Costa, D. G., Vasques, F., Portugal, P., and Aguiar, A.: A Distributed Multi-Tier Emergency Alerting System Exploiting Sensors-Based Event Detection to Support Smart City Applications, Sensors, 20, 170, https://doi.org/10.3390/s20010170, 2020.
Change, N. C.: Spreading like wildfire, Nature Climate Change, 7, 755, https://doi.org/10.1038/nclimate3432, 2017.
Chuvieco, E.: Teledetección ambiental, La observación de la tierra desde el espacio, Ariel, Barcelona, 2002.
Chuvieco, E., Salas, J., De la Riva, J., Pérez, F., and Lana-Renault, N. Métodos para la integración de variables de riesgo: el papel de los sistemas de información geográfica, Nuevas tecnologías para la estimación del riesgo de incendios forestales, CSIC-Instituto de Economía y Geografía, Madrid, 2004.
Chuvieco, E., Aguado, I., Yebra, M., Nieto, H., Salas, J., Martín, M. P., and De La Riva, J.: Development of a framework for fire risk assessment using remote sensing and geographic information system technologies, Ecol. Model., 221, 46–58, https://doi.org/10.1016/j.ecolmodel.2008.11.017, 2011.
Dapeng, L., Cova, T. J., Dennison, P. E., Wan, N., Nguyen, Q. C., and Siebeneck, L. K.: Why do we need a national address point database to improve wildfire public safety in the US?, Int. J. Disast. Risk Re., 39, 101237, https://doi.org/10.1016/j.ijdrr.2019.101237, 2019.
Darques, R.: Mediterranean cities under fire. A critical approach to the wildland–urban interface, Appl. Geogr., 59, 10–21, https://doi.org/10.1016/j.apgeog.2015.02.008, 2015.
da Silva, A. S., Justino, F., Setzer, A. W., and Ávila-Díaz, A.: Vegetation fire activity and the Potential Fire Index (PFIv2) performance in the last two decades (2001–2016), Int. J. Climatol., 77, 1–15, https://doi.org/10.1002/joc.6648, 2020.
de la Barrera, F. and Henríquez, C.: Vegetation covers change in growing urban agglomerations in Chile, Ecol. Indic., 81, 265–273, https://doi.org/10.1016/j.ecolind.2017.05.067, 2017.
de la Barrera, F., Barraza, F., Philomène, F., Ruíz, V., and Quense, J.: Megafires in Chile 2017: Monitoring multiscale environmental impacts of burned ecosystems, Sci. Total Environ., 637–638, 1526–1536, https://doi.org/10.1016/j.scitotenv.2018.05.119, 2018.
Demšar, U., Harris, P., and Brunsdon, C.: Principal Component Analysis on Spatial Data: An Overview, Ann. Assoc. Am. Geogr., 103, 106–128, https://doi.org/10.1080/00045608.2012.689236, 2013.
Diffenbaugh, N. S., Pal, J. S., Giorgi, F., and Gao, X.: Heat stress intensification in the Mediterranean climate change hotspot, Geophys. Res. Lett., 34, L11706, https://doi.org/10.1029/2006GL025734, 2007.
Doerr, S. H. and Santin, C.: Global trends in wildfire and its impacts: perceptions versus realities in a changing world, Philos. T. R. Soc. B, 371, 1–10, https://doi.org/10.1098/rstb.2015.0345, 2016.
Fernández, A., Muñoz, A., González-Reyes, Á., Aguilera-Betti, I., Toledo, I., Puchi, P., Sauchyn, D., Crespo, S., Frene, C., Mundo, I., González, M., and Vignola, R.: Dendrohydrology and water resources management in south-central Chile: lessons from the Río Imperial streamflow reconstruction, Hydrol. Earth Syst. Sci., 22, 2921–2935, https://doi.org/10.5194/hess-22-2921-2018, 2018.
Frene, C. and Núñez, M., Hacia un nuevo Modelo Forestal en Chile, Revista Bosque Nativo, 47, 25–35, available at: http://www.sendadarwin.cl/espanol/wp-content/uploads/2011/06/frene-y-nunez.pdf (last access: 29 November 2021), 2010.
Freudenburg, W. R.: Addictive economies: Extractive industries and vulnerable localities in a changing world economy, Rural Sociol., 57, 305–332, https://doi.org/10.1111/j.1549-0831.1992.tb00467.x, 1992.
Gago, V. and Mezzadra, S.: A critique of the extractive operations of capital: Toward an expanded concept of extractivism, Rethinking Marxism, 29, 574–591, https://doi.org/10.1080/08935696.2017.1417087, 2017.
Garreaud, R. D., Boisier, J. P., Rondanelli, R., Montecinos, A., Sepúlveda, H. H., and Veloso – Águila, D.: The Central Chile Mega Drought (2010–2018): A climate dynamics perspective, Int. J. Climatol., 40, 421–439, https://doi.org/10.1002/joc.6219, 2020.
Goldman, J. G.: Living on the edge: Wildfires pose a growing risk to homes built near wilderness areas. Building houses at the edge of the wilderness increases the danger of catastrophic blazes, Sci. Am., 318, 12–15, available at: https://www.scientificamerican.com/article/living-on-the-edge-wildfires-pose-a-growing-risk-to-homes-built-near-wilderness-areas/ (last access: 29 November 2021), 2018.
Gómez-González, S., Ojeda, F., and Fernandes, P.M.: Portugal and Chile: Longing for sustainable forestry while rising from the ashes, Environ. Sci. Policy, 81, 104–107, https://doi.org/10.1016/j.envsci.2017.11.006, 2018.
González, M. E.: Fire history data as reference information in ecological restoration, Dendrochronology, 22, 149–154, https://doi.org/10.1016/j.dendro.2005.04.001, 2005.
González-Mathiesen, C. and March, A.: Establishing design principles for wildfire resilient urban planning, Planning Practice & Research, Volume 33, 97–119, https://doi.org/10.1080/02697459.2018.1429787, 2018.
Harari, Y.: From Animals into Gods: A brief history of Humankind, Penguin Random House, New York, 2013.
Heilmayr, R., Echeverría, C., Fuentes, R., and Lambin, E. F.: A plantation-dominated forest transition in Chile, Appl. Geogr., 75, 71–82, https://doi.org/10.1016/j.apgeog.2016.07.014, 2016.
Hidalgo, R., Rodríguez, L., and Alvarado, V.: Up the hill or over the wetland: production of nature and expanding real estate in marine and fluvial cities. The case of Valparaiso and Valdivia, Chile, Diálogo Andino, 56, 87–100, https://doi.org/10.4067/S0719-26812018000200087, 2018.
Hutto, R. L.: The ecological importance of severe wildfires: Some like it hot, Ecol. Appl., 18, 1827–1834, https://doi.org/10.1890/08-0895.1, 2008.
Instituto Forestal (INFOR): Anuario forestal 2017, Santiago de Chile, INFOR, available at: http://wef.infor.cl/publicaciones/anuario/2017/Anuario2017.pdf (last access: 29 November 2021), 2017.
Instituto Forestal (INFOR): Anuario forestal 2017, INFOR, Santiago de Chile, available at: http://wef.infor.cl/publicaciones/anuario/2017/Anuario2017.pdf (last access: 29 November 2021), 2017.
Instituto Nacional de Derechos Humanos (INDH), Mapa de conflictos socioambientales en Chile, Santiago de Chile, INDH, available at: https://mapaconflictos.indh.cl/#/ (last access: 29 November 2021), 2015.
Instituto Nacional De Estadísticas (INE): Censo 2017, Santiago de Chile, Ministerio de Economía, Fomento y Reconstrucción, available at: http://www.censo2017.cl, last access: 3 November 2021.
Inter-American Development Bank (IDB) – Economic Commission for Latin American and the Caribbean (ECLAC): Information on disaster risk management, Case study of five countries, Main technical report, Mexico City, IDB-ECLAC, available at: https://www.cepal.org/en/publications/25845-information-disaster-risk-management-case-study-five-countries-main-technical (last access: 29 November 2021), 2007.
Intergovernmental Panel on Climate Change (IPCC): Guidelines for national greenhouse gas inventories, and good practice guidance reports, Cambridge, USA, Cambridge University Press, 1996a.
IPCC: Climate Change 2014: Impacts, Adaptation, and Vulnerability. Part A: Global and sectoral aspects. Contribution of Working Group II to the Fifth Assessment Report of the IPCC, Cambridge, USA, Cambridge University Press, 1–32, available at: https://www.ipcc.ch/site/assets/uploads/2018/02/ar5_wgII_spm_en.pdf (last access: 29 November 2021), 2014.
IPCC: Special Report on the Ocean and Cryosphere in a Changing Climate, Cambridge, USA, Cambridge University Press, available at: https://www.ipcc.ch/srocc/chapter/summary-for-policymakers/ (last access: 29 November 2021), 2019.
Klein Tank, A., Zwiers, F., and Zhang, X.: Guidelines on analysis of extremes in a changing climate in support of informed decisions for adaptation, Climate Data and Monitoring WCDMP 72 and WMO-TD 1500, available at: https://library.wmo.int/index.php?lvl=notice_display&id=138#.YaTmzC-B1QI (last access: 29 November 2021), 2009.
Knowles, A. K., Westerveld, L., and Strom, L.: Inductive visualization: A humanistic alternative to GIS, GeoHumanities, 1, 233–265, https://doi.org/10.1080/2373566X.2015.1108831, 2015.
Kohonen, T.: The Self-Organizing Map, P. IEEE, 78, 1464–80, https://doi.org/10.1109/5.58325, 1990.
Kolden, C. A. and Henson, C.: A Socio-Ecological approach to mitigating wildfire vulnerability in the Wildland Urban Interface: A case study from the 2017 Thomas fire, Fire, 2, 2–19, https://doi.org/10.3390/fire2010009, 2019.
Koltunov, A., Ustin, S. L., and Prins, E. M.: On timeliness and accuracy of wildfire detection by the GOES WF-ABBA algorithm over California during the 2006 fire season, Remote Sens. Environ., 127, 194–209, https://doi.org/10.1016/j.rse.2012.09.001, 2012.
Kumagai, Y., Carroll, M. S., and Cohn, P.: Coping with interface wildfire as a human event: lessons from the disaster/hazard's literature, J. Forest., 102, 28–32, 2004.
Martínez Poblete, J.: Land registry and condition of conservation of the wetlands coastal/marines in the region of the Biobío, Tiempo y Espacio, 33, 104–130, 2014.
McGee, T. K. and Russell, S.: “It's just a natural way of life …” An investigation of wildfire preparedness in rural Australia, Environ. Hazards, 5, 1–12, https://doi.org/10.1016/j.hazards.2003.04.001, 2003.
McWethy, D. B., Pauchard, A., García, R. A., Holz, A., González, M. E., and Veblen, T. T.: Landscape drivers of recent fire activity (2001–2017) in south-central Chile, PLoS ONE, 13, e0201195, https://doi.org/10.1371/journal.pone.0201195, 2018.
Minnich, R. A. and Chou, Y. H.: Wildland Fire Patch Dynamics in the Chaparral of Southern California and Northern Baja California, International Journal of Wildland Fire, 7, 221-248, https://doi.org/10.1071/WF9970221, 1997.
Moritz, M. A., Parisien, M.-A., Batllori, E., Krawchuk, M. A., Van Dorn, J., Ganz, D. J., and Hayhoe, K.: Climate change and disruptions to global fire activity, Ecosphere, 3, 49, https://doi.org/10.1890/ES11-00345.1, 2012.
Nahuelhual, L., Carmona, A., and Lara, A.: Landscape and urban planning land cover change to forest plantations: Proximate causes and implications for the landscape in south-central Chile, Landscape Urban Plan., 107, 12–20, https://doi.org/10.1016/j.landurbplan.2012.04.006, 2012.
Otero, I. and Nielsen, J.: Coexisting with wildfire? Achievements and challenges for a radical social-ecological transformation in Catalonia (Spain), Geoforum, 85, 234–246, https://doi.org/10.1016/j.geoforum.2017.07.020, 2017.
Pausas, J. G., Llovet, J., Rodrigo, A., and Vallejo, R.: Are wildfires a disaster in the Mediterranean basin? – A review, Int. J. Wildland Fire, 17, 713–723, https://doi.org/10.1071/WF07151, 2008.
Paveglio, T., Brenkert-Smith, H., Hall, T. E., and Smith, A.: Understanding social impact from wildfires: advancing means for assessment, Int. J. Wildland Fire, 24, 212–224, https://doi.org/10.1071/WF14091, 2015.
Pawson, S. M., Brin, A., Brockerhoff, E. G., Lamb, D., Payn, T. W., Paquette, A., and Parrotta, J. A.: Plantation forests, climate change and biodiversity, Biodiversity Conservation, 22, 1203–1227, https://doi.org/10.1007/s10531-013-0458-8, 2013.
Pyne, S. J.: The human geography of fire: a research agenda, Prog. Hum. Geog., 33, 443–446, https://doi.org/10.1177/0309132508101598, 2009.
Reyes, R. and Nelson, H.: A tale of two forests: why forests and forest conflicts are both growing in Chile, Int. For. Rev., 16, 379–388, https://doi.org/10.1505/146554814813484121, 2014.
Ricotta, C. and Di Vito, S.: Modeling the landscape drivers of fire recurrence in Sardinia (Italy), Environ. Manage., 53, 1077–1084, https://doi.org/10.1007/s00267-014-0269-z, 2014.
Rojas Quezada, C. A., Muñiz Olivera, I., and García-López, M.Á.: Estructura urbana y policentrismo en el Área Metropolitana de Concepción, Revista Eure, 35, 47–70, https://doi.org/10.4067/S0250-71612009000200003, 2009.
Rojas Quezada, C., Pino, J., and Jaque, E.: Strategic Environmental Assessment in Latin America: A methodological proposal for urban planning in the Metropolitan Area of Concepción (Chile), Land Use Policy, 30, 519–527, https://doi.org/10.1016/j.landusepol.2012.04.018, 2013.
Ruiz, V., Munizaga, J., and Burrows, A.S.: Plantaciones forestales y su extensión hacia áreas urbanas en el área metropolitana de Valparaíso y su relación con el aumento de incendios forestales, Investigaciones Geográficas, 54, 23–40, https://doi.org/10.5354/0719-5370.2017.48040, 2017.
Sarricolea, P., Herrera, M. J., and Meseguer-Ruíz, O.: Climatic regionalization of continental Chile, J. Maps, 13, 66–73, https://doi.org/10.1080/17445647.2016.1259592, 2016.
Sarricolea, P., Serrano-Notivoli, R., Fuentealba, M., Hernández-Mora, M., de la Barrera, F., Smith, P., and Meseguer-Ruiz, O.: Recent wildfires in Central Chile: Detecting links between burned areas and population exposure in the wildland urban interface, Sci. Total Environ., 706, 135894, https://doi.org/10.1016/j.scitotenv.2019.135894, 2020.
Schulz, J. J., Cayuela, L., Echeverría, C., Salas, J., and Rey Benayas, J. M.: Monitoring land cover change of the dryland forest landscape of Central Chile (1975–2008), Appl. Geogr., 30, 436–447, https://doi.org/10.1016/j.apgeog.2009.12.003, 2010.
Shahriar, S., Zahran El-Said, M. M., Said Safwanah, N. M., Hui Kho, J., Naderah, N. D., Lee, H. M. F., and Hasim, N. H. H.: Risk assessment for forest fire in Brunei Darussalam, MATEC Web Conf., 258 05033, https://doi.org/10.1051/matecconf/201925805033, 2019.
Smith-Ramírez, C.: The Chilean coastal range: a vanishing center of biodiversity and endemism in South American temperate rainforests, Biodivers. Conserv., 13, 373–393, 2004.
Spies, T. A., White, E. M., Kline, J. D., Fischer, A. P., Ager, A., Bailey, J., Bolte, J., Koch, J., Platt, E., Olsen, C. S., Jacobs, D., Shindler, B., Steen-Adams, M. M., and Hammer R.: Examining fire-prone forest landscapes as coupled human and natural systems, Ecol. Soc., 19, 9, https://doi.org/10.5751/ES-06584-190309, 2014.
Stott, P.: How climate change affects extreme weather events, Science, 352, 1517–1518, available at: https://science.sciencemag.org/content/352/6293/1517 (last access: 29 November 2021), 2016.
Tapia, G. and Castillo, M.: Propuesta de diseño de un sistema de torres de detección de incendios forestales: aplicación a la Región Metropolitana de Chile Central, Bosque, 35, 399–412, https://doi.org/10.4067/S0717-92002014000300014, 2014.
Terranova, O., Antronico, L., Coscarelli, R., and Iaquinta, P.: Soil erosion risk scenarios in the Mediterranean environment using RUSLE and GIS: an application model for Calabria (southern Italy), Geomorphology, 112, 228–245, https://doi.org/10.1016/j.geomorph.2009.06.009, 2009.
Torres, R., Azócar, G., Rojas, J., Montecinos, A., and Paredes, P.: Vulnerability and resistance to neoliberal environmental changes: An assessment of agriculture and forestry in the Biobio region of Chile (1974–2014), Geoforum, 60, 107–122, https://doi.org/10.1016/j.geoforum.2014.12.013, 2015.
Turco, M., Bedia, J., Di Liberto, F., Fiorucci, P., Von Hardenberg, J., and Koutsias, N.: Decreasing fires in Mediterranean Europe, PLoS ONE, 11, e0150663, https://doi.org/10.1371/journal.pone.0150663, 2016.
Úbeda, X. and Sarricolea, P.: Wildfires in Chile: A review, Global Planet. Change, 146, 152–161, https://doi.org/10.1016/j.gloplacha.2016.10.004, 2016.
Urrutia-Jalabert, R., Gonzalez, M. E., Gonzalez-Reyes, A., Lara, A., and Garreaud, R.: Climate variability and forest fires in central and south-central Chile, Ecosphere, 9, e02171, https://doi.org/10.1002/ecs2.2171, 2018.
Van Ackere, S., Verbeurgt, J., De Sloover, L., Gautama, S., De Wulf, A., and De Maeyer, P.: A Review of the Internet of Floods: Near Real-Time Detection of a flood event and its impact, Water, 11, 2275, https://doi.org/10.3390/w11112275, 2019.
Vesanto, J.: Neural network tool for data mining: SOM toolbox, in: Proceedings of Symposium on Tool Environments and Development Methods for Intelligent Systems (TOOLMET2000), Oulu, Finland, 3–8 September 2001, 184–962000, 2000.
Vilar del Hoyo, L., Martín Isabel, M. P., and Martínez Vega, F. J.: Logistic regression models for human-caused wildfire risk estimation: analyzing the effect of the spatial accuracy in fire occurrence data, European Journal of Forestry Research, 130, 983–996, https://doi.org/10.1007/s10342-011-0488-2, 2011.
Wan, Z., Hook, S., and Hulley, G.: MOD11C3 MODIS/Terra Land Surface Temperature/Emissivity Monthly L3 Global 0.05Deg CMG V006, NASA EOSDIS Land Processes DAAC [data set], https://doi.org/10.5067/MODIS/MOD11C3.006, 2015.
Wright, J. A., Di Nicola, A., and Gaitan, E.: Latin American forest plantations. Opportunities for carbon sequestration, economic development, and financial returns, J. Forest., 12, 20–23, 2000.
You, W., Li, L., Wu, L., Ji, Z., Yu, J., Zhu, J., Fan, Y., and He, D.: Geographical information system-based forest fire risk assessment integrating national forest inventory data and analysis of its spatiotemporal variability, Ecol. Indic., 77, 176–184, https://doi.org/10.1016/j.ecolind.2017.01.042, 2017.
- Abstract
- Introduction
- Materials and methods
- Results – fire hazard in a metropolitan area, analysis of factor maps and model output
- Discussion
- Conclusions
- Code availability
- Data availability
- Author contributions
- Competing interests
- Disclaimer
- Acknowledgements
- Financial support
- Review statement
- References
- Supplement