the Creative Commons Attribution 4.0 License.
the Creative Commons Attribution 4.0 License.
 | 02 Mar 2020
Global-scale drought risk assessment for agricultural systems
Stefan Siebert
Petra Döll
Jürgen Kusche
Claudia Herbert
Ehsan Eyshi Rezaei
Hamideh Nouri
Helena Gerdener
Eklavyya Popat
Janna Frischen
Gustavo Naumann
Jürgen V. Vogt
Yvonne Walz
Zita Sebesvari
Michael Hagenlocher
Droughts continue to affect ecosystems, communities and entire economies. Agriculture bears much of the impact, and in many countries it is the most heavily affected sector. Over the past decades, efforts have been made to assess drought risk at different spatial scales. Here, we present for the first time an integrated assessment of drought risk for both irrigated and rainfed agricultural systems at the global scale. Composite hazard indicators were calculated for irrigated and rainfed systems separately using different drought indices based on historical climate conditions (1980–2016). Exposure was analyzed for irrigated and non-irrigated crops. Vulnerability was assessed through a socioecological-system (SES) perspective, using socioecological susceptibility and lack of coping-capacity indicators that were weighted by drought experts from around the world. The analysis shows that drought risk of rainfed and irrigated agricultural systems displays a heterogeneous pattern at the global level, with higher risk for southeastern Europe as well as northern and southern Africa. By providing information on the drivers and spatial patterns of drought risk in all dimensions of hazard, exposure and vulnerability, the presented analysis can support the identification of tailored measures to reduce drought risk and increase the resilience of agricultural systems.
- Article
(4109 KB) - Full-text XML
-
Supplement
(960 KB) - BibTeX
- EndNote


Droughts exceed all other natural hazards in terms of the number of people affected and have contributed to some of the world's most severe famines (FAO, 2018; CRED and UNISDR, 2018). Drought is conceived as an exceptional and sustained lack of water caused by a deviation from normal conditions over a certain region (Tallaksen and Van Lanen, 2004; Van Loon et al., 2016). It can have manifold impacts on social, ecological and economic systems, for instance agricultural losses, public water shortages, reduced hydropower supply, and reduced labor or productivity. While many sectors are affected by drought, agriculture's high dependency on water means it is often the first of the most heavily affected sectors (Dilley et al., 2005; UNDRR, 2019). With nearly 1.4 billion people (18 % of the global population) employed in agriculture, droughts threaten the livelihoods of many and hamper the achievement of the Sustainable Development Goals (SDGs) – notably SDG 1 (no poverty), SDG 2 (zero hunger), SDG 3 (good health and well-being) and SDG 15 (life on land). While there is ambiguity regarding global drought trends over the past century (Sheffield et al., 2012; Trenberth et al., 2013; McCabe and Wolock, 2015), drought hazards will likely increase in many regions in the coming decades (Sheffield and Wood, 2008; Dai, 2011; Trenberth et al., 2013; Spinoni et al., 2017, 2019b; UNDRR, 2019). Identifying pathways towards more drought resilient societies therefore remains a global priority.
Recent severe droughts in southeastern Brazil (2014–2017), California (2011–2017), the Caribbean (2013–2016), northern China (2010–2011), Europe (2011, 2015, 2018), India (2016, 2019), the Horn of Africa (2011–2012), South Africa (2015–2016, 2018) and Vietnam (2016) have clearly shown that the risk of negative impacts associated with droughts is not only linked to the severity, frequency and duration of drought events but also to the degree of exposure, susceptibility and lack of coping capacity of a given socioecological system (SES). Despite this, proactive management of drought risk is still not a reality in many regions across the world. Droughts and their impacts are still mostly addressed through reactive crisis management approaches, for example, by providing relief measures (Rojas, 2018). To improve the monitoring, assessment, understanding and ultimately proactive management of drought risk effectively, we need to acknowledge that the root causes, patterns and dynamics of exposure and vulnerability need to be considered alongside climate variability in an integrated manner (Spinoni et al., 2019a; Hagenlocher et al., 2019).
Over the past decades, major efforts have been made to improve natural hazard risk assessments and their methodologies across scales, ranging from global risk assessments to local-level assessments. At the global scale several studies have been published in recent years, focusing on the assessment of flood risk (Hirabayashi et al., 2013; Ward et al., 2013, 2014), seismic risk (Silva et al., 2018), cyclone risk (Peduzzi et al., 2012) or multi-hazard risk (e.g., Dilley et al., 2005; Peduzzi et al., 2009; Welle and Birkmann, 2015; Garschagen et al., 2016; INFORM, 2019; Koks et al., 2019; UNDRR, 2019). While major progress has been made regarding the mapping, prediction and monitoring of drought events at the global scale (e.g., Yuan and Wood, 2013; Geng et al., 2013; Spinoni et al., 2013, 2019b; Damberg and AghaKouchak, 2014; Hao et al., 2014; Carrão et al., 2017), very few studies have assessed either exposure to drought hazards (Güneralp et al., 2015) or drought risk at the global level (Carrão et al., 2016; Dilley et al., 2005; Li et al., 2009). The study by Carrão et al. (2016) presents the first attempt to map drought risk at the global scale while considering drought hazard (based on precipitation deficits), exposure (population, livestock, crops, water stress) and societal vulnerability (based on social, economic and infrastructural indicators). While generic drought risk assessments are useful for establishing an overview of the key patterns and hotspots of drought risk, it is increasingly acknowledged that drought risk assessment should be tailored to the needs of specific users so that management plans can be developed to reduce impacts (Vogt et al., 2018; UNDRR, 2019). Impact or sector-specific assessments of who (e.g., farmers) and what (e.g., crops) are at risk as well as what they are at risk of (e.g., abnormally low soil moisture, deficit in rainfall, below average streamflow), where they are at risk and why are needed to inform targeted drought risk reduction, resilience and adaptation strategies (IPCC, 2014). Such analyses are currently lacking. Furthermore, in their exposure analysis, Carrão et al. (2016) do not distinguish between rainfed and irrigated agriculture, although different hazard indicators are relevant when assessing drought risk for these systems. In addition, the vulnerability analysis presented by Carrão et al. (2016) is based on a reduced set of social, economic and infrastructure-related indicators and does not account for the role of ecosystem-related indicators as a driver of drought risk – a gap that was recently highlighted in a systematic review of existing drought risk assessments across the globe (Hagenlocher et al., 2019). A socioecological-system perspective, especially when assessing drought risk in the context of agricultural systems, where livelihoods depend on ecosystems and their services, can help to better understand the role of ecosystems and their services not only as a driver of drought risk but also as an opportunity for drought risk reduction (Kloos and Renaud, 2016).
This paper addresses some of the above gaps by presenting, for the first time, an integrated drought risk assessment that brings together data from different sources and disciplines for rainfed and irrigated agricultural systems considering relevant drought hazard indicators, exposure and vulnerability at the global scale. The spatial variability in drought risk on global and regional scales might help to identify leverage points for reducing impacts and properly anticipate, adapt and move towards resilient agricultural systems.
Today, it is widely acknowledged that risk associated with natural hazards, climate variability and change is a function of hazard, exposure and vulnerability (IPCC, 2014; UNDRR, 2019). Following that logic, Fig. 1 shows the overall workflow of the assessment, while the subsequent sections describe in detail how drought risk for agricultural systems, including both irrigated and rainfed systems, was assessed at the global scale.
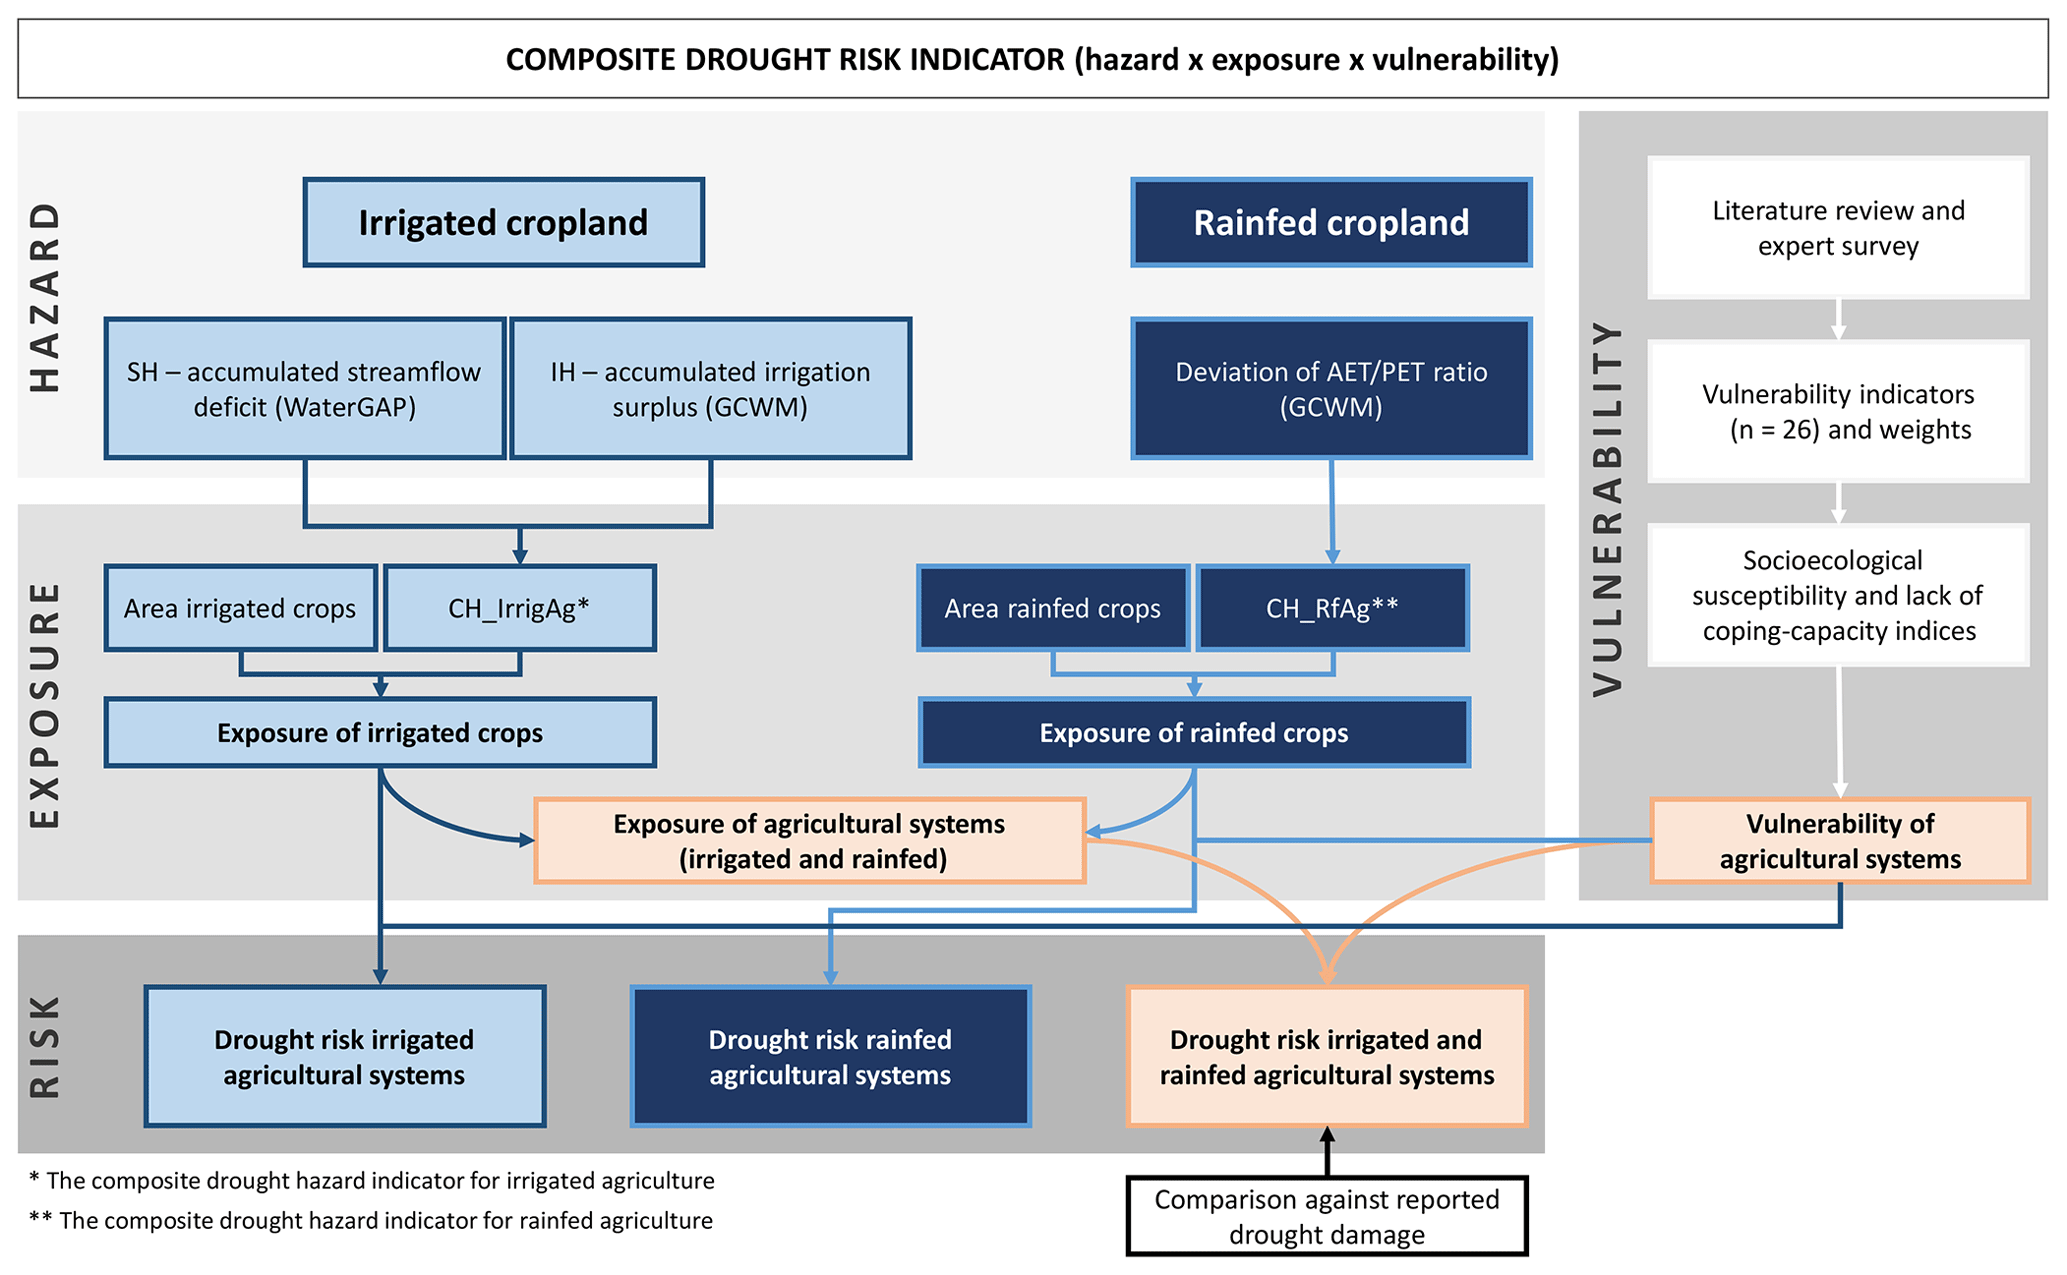
Figure 1Workflow for the overall global drought risk assessment for agricultural systems (including irrigated and rainfed systems).
The composite drought hazard indicators were calculated for irrigated and rainfed systems separately using drought indices based on historical climate conditions (1980–2016), which resulted in integrated hazard maps for both rainfed and irrigated agricultural systems, respectively. The different irrigated and non-irrigated crops by country were considered to be the exposed element. Due to the lack of high-resolution gridded data on an agricultural-dependent population at the global scale, this exposure indicator was not considered. The vulnerability component was assessed through a SES lens, where socioecological susceptibility and a lack of coping-capacity indicators were weighted by drought experts around the world.
2.1 Drought hazard and exposure indicators
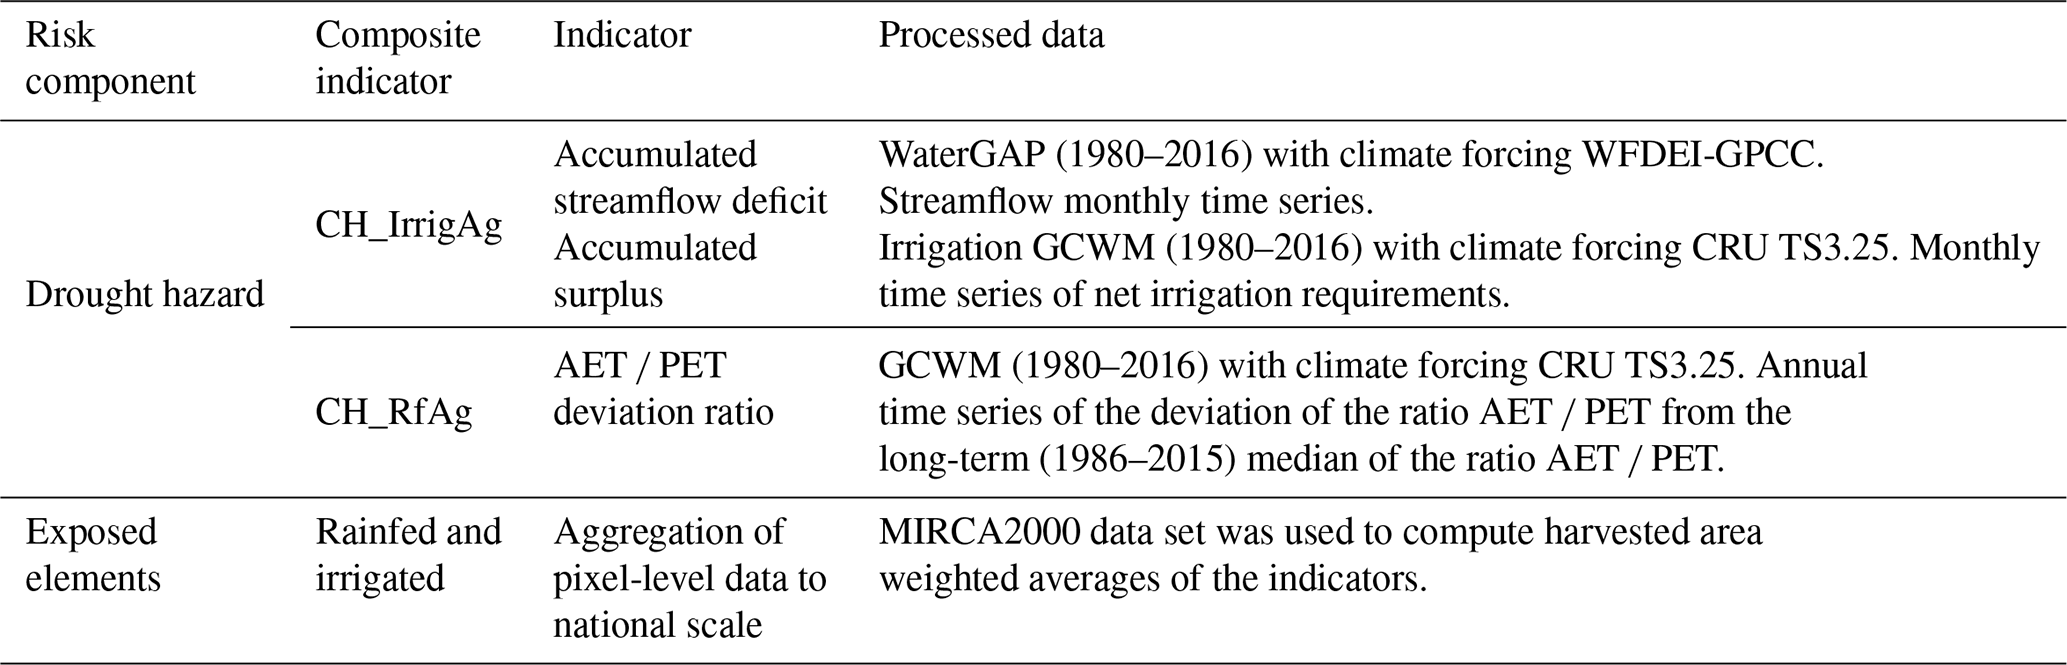
The drought hazard indicators considered here represent the average drought hazard during the period 1980 to 2016 in each spatial unit for which it is computed. Drought hazard is defined as a deviation of the situation in a specific year or month from long-term mean conditions in the 30-year reference period from 1986 to 2015. To quantify drought hazard for such a long period, we used the global water resources and water use model WaterGAP (Müller Schmied et al., 2014) and the global crop water model (GCWM; Siebert and Döll, 2010). The models simulate terrestrial hydrology (WaterGAP) and crop water use (GCWM) for daily time steps on a spatial resolution of 30 arcmin (WaterGAP) or 5 arcmin (GCWM). The most recent version, WaterGAP 2.2d, was forced by the WFDEI-GPCC climate data set (Weedon et al., 2014), which was developed by applying the forcing data methodology developed in the EU project WATCH on ERA-Interim reanalysis data (Table 1). The GCWM used the CRU-TS 3.25 climate data set (Harris et al., 2014) as input. CRU-TS 3.25 was developed by the Climate Research Unit of the University of East Anglia by interpolation of weather station observations and is provided as a time series of monthly values. Pseudo-daily climate was generated by the GCWM as described in Siebert and Döll (2010). Following the definitions of the Intergovernmental Panel on Climate Change put forward in their Fifth Assessment Report (IPCC, 2014), exposure is defined as the elements located in areas that could be adversely affected by drought hazard. The distinct exposure of irrigated and rainfed agricultural systems to drought was considered by weighting grid-cell-specific hazards with the harvested area of irrigated and rainfed crops according to the monthly irrigated and rainfed crop areas' (MIRCA2000) data set (Portmann et al., 2010) when aggregating grid-cell-specific hazards to exposure at a national scale. MIRCA2000 was also used to inform the models used in the hazard calculations about growing areas and growing periods of irrigated and rainfed crops. The data set refers to the period centered around the year 2000; time series information is not available at the global scale. To maximize the representativeness of the land use, the reference period and evaluation period used in this study were centered around the year 2000.
Table 1Hazard and exposure indicators used in the analysis and their processed data.
2.1.1 Irrigated agricultural systems
The composite drought hazard indicator is defined as the product of mean severity and frequency of drought events. For irrigated agriculture (CH_IrrigAg) it combines an indicator for streamflow drought hazard (SH), i.e., for abnormally low streamflow in rivers, with an indicator of an abnormally high irrigation water requirement (IH; Fig. 1). It thus considers the deviations of both demand and supply of water from normal conditions. SH and IH are computed with a spatial resolution of 0.5∘ by 0.5∘ (55 km by 55 km at the Equator). Greenland and Antarctica are excluded. As IH is not meaningful in grid cells without irrigation, CH_IrrigAg is only computed for grid cells in which irrigated crops are grown according to MIRCA2000 (Portmann et al., 2010).
IH was calculated by using the GCWM based on a monthly time series of net irrigation requirements from 1980 to 2016. The net irrigation requirement is the volume of water needed to ensure that the AET of irrigated crops is similar to their PET (Fig. 1). The calculations were performed for 487 121 grid cells with a resolution of 5 arcmin, containing irrigated crop areas, and then aggregated to 26 478 grid cells with a 30 arcmin resolution to be consistent with the resolution used by WaterGAP. SH was calculated by using WaterGAP based on a monthly time series of streamflow from 1980 to 2016 in 66 896 grid cells with a ∘ resolution worldwide.
For both IH and SH, drought hazard per grid cell was quantified as the product of the (scaled or transformed) mean severity of all drought events during the evaluation period 1980–2016 and the frequency of drought events during this period. Drought events for IH and SH were determined independently. In the case of IH computation, a drought event starts as soon as the monthly irrigation requirement exceeds the irrigation requirement threshold and ends when the surplus reaches zero. In the case of SH computation, a drought starts if the monthly streamflow drops below the streamflow threshold and ends as soon as the deficit reaches zero. For each grid cell and each of the 12 calendar months, a drought threshold was defined as the median of the variable values in the respective calendar month during the reference period 1986–2015. To avoid spurious short droughts and drought interruptions, it was defined that a drought event starts (1) with at least 2 consecutive months with an IH surplus or a SH deficit and (2) 1 month without an IH surplus or if a SH deficit does not break the event (Spinoni et al., 2019a). The accumulated surplus (IH) divided by the deficit (SH) during each drought event is the severity of the drought event. Mean severity is computed as the arithmetic average of the severity of all drought events during the evaluation period. As in the case of SH, the deficit and thus the severity of streamflow drought are strongly correlated with the mean annual streamflow; mean severity is therefore scaled by dividing the accumulated streamflow deficit by mean annual streamflow. In this way scaled mean streamflow drought severity is expressed as the fraction of the mean annual flow volume that is on average missing during drought events. In the case of IH, mean severity is transformed logarithmically before computation of IH, as in most grid cells the volume of irrigation water needed additionally in drought periods is relatively small (volume in 569 out of the 26 478 irrigated grid cells is lower than 100 m3; in 1450 grids it is lower than 1000 m3). However, there are also some grids with extremely high values (95 grids where the additional irrigation water requirement per drought event is larger than 100 000 000 m3). The logarithmic transformation accounted for the specific value distribution.
CH_IrrigAg was then calculated for each grid cell by combining SH and IH. To ensure that both indicators are weighted equally, their native values were first scaled to a range between 0 and 1 by dividing SH and IH in each grid cell by the maximum SH or IH detected globally. The frequency distribution of the SH values calculated that way was shifted to the left, with a mean of 0.244, while the frequency distribution of IH was shifted to the right, with a mean of 0.664. Therefore, CH_IrrigAg was calculated for each grid cell as
with SH being the grid-cell-specific streamflow hazard, IH being the grid-cell-specific irrigation requirement hazard, and and being the mean of SH or IH calculated across all grid cells.
The exposure of irrigated agricultural systems to drought at the national scale was derived as the harvested-area weighted mean of the CH_IrrigAg across all grid cells belonging to the respective aggregation units.
2.1.2 Rainfed agricultural systems
The composite drought hazard indicator for rainfed agriculture (CH_RfAg) was quantified based on the ratio of actual crop evapotranspiration (AET in m3 d−1) to potential crop evapotranspiration (PET in m3 d−1), calculated for the evaluation period 1980–2016 and compared to the reference period 1986–2015 (Fig. 1). PET quantifies the water requirement of the crop without water limitation, while AET refers to the evapotranspiration under actual soil moisture conditions.
The GCWM was applied for 24 specific rainfed crops and the two groups “others, annual” and “others, perennial” to calculate crop-specific AET and PET on a daily time step. Together, the 24 crops and two crop groups cover all crop species distinguished by FAO in their database FAOSTAT. The sum of daily crop-specific AET and PET was calculated for all crops and for each year in the period 1980–2016 for 927 857 grid cells containing rainfed cropland and aggregated to 37 265 grid cells with the resolution ∘.
The mean ratio between AET and PET ( for the reference period 1986–2015 was then calculated for each grid cell. reflects long-term water limitations for the geographic unit, with low values representing high aridity and high values for low aridity. CH_RfAg was then determined by calculating the ratio AET ∕ PET for each year from 1980–2016 and by deriving the percentile of a relative difference of 10 % to the long-term mean ratio from the time series. Consequently, CH_RfAg reflects the probability of occurrence of a drought year in which the ratio between total AET and total PET across all rainfed crops is 10 % lower than the long-term mean ratio . We also tested other percentage thresholds (20 %, 30 %, 50 %), but for many parts of the world we never computed reductions of the ratio AET ∕ PET by more than 10 % of the long-term mean ratio (Table S5). Therefore, it was decided to use the 10 % threshold consistently.
2.1.3 Integration of drought exposure of irrigated and rainfed cropping systems
The combined drought exposure of rainfed and irrigated cropping systems was evaluated at the country level by averaging the harvested-area weighted drought exposure of irrigated and rainfed cropping systems. As described before, distinct methods were used to calculate hazard and exposure of irrigated and rainfed systems so that a direct comparison of the exposure values is not meaningful. In addition, the frequency distributions differed considerably, with a harvested-area weighted global mean of the drought exposure of 0.455 for irrigated systems and 0.189 for rainfed systems. To ensure a more similar weight of rainfed and irrigated drought exposure, country-specific exposures were divided by the global mean, and then the integrated exposure was calculated as harvested-area weighted mean:
with Exptot, Exprf and Expirr being the exposure of the whole, rainfed and irrigated cropping systems to drought and AHtot, AHrf and AHirr being the harvested area of all crops, rainfed crops and irrigated crops.
2.2 Vulnerability and risk assessment
According to the Intergovernmental Panel on Climate Change (IPCC, 2014), vulnerability is the predisposition to be adversely affected as a result of the sensitivity or susceptibility of a system and its elements to harm, coupled with a lack of coping and adaptive capacity. The assessment of drought vulnerability is complex because it depends on both biophysical and socioeconomic drivers (Naumann et al., 2014). Due to this complexity, the most common method to assess vulnerability in the context of natural hazards and climate change is using composite indicators or index-based approaches (Beccari, 2016; de Sherbinin et al., 2019). Although their usefulness for policy support has also been subject to criticism (Hinkel, 2011; Beccari, 2016), it is widely acknowledged that composite indicators can identify generic leverage points for reducing impacts at the regional to global scale (De Sherbinin et al., 2017, 2019; UNDRR, 2019).
Following the workflow to calculate composite indicators proposed by the Organisation for Economic Co-operation and Development (OECD, 2008) and Hagenlocher et al. (2018), the methodological key steps on which the vulnerability assessment is based are (1) the definition of the conceptual framework, (2) identification of valid indicators, (3) data acquisition and preprocessing, (4) analysis and imputation of missing data, (5) detection and treatment of outliers, (6) assessment of multicollinearities, (7) normalization, (8) weighted aggregation, and (9) visualization.
Table 2Vulnerability indicators used in the analysis and their related expert weights.
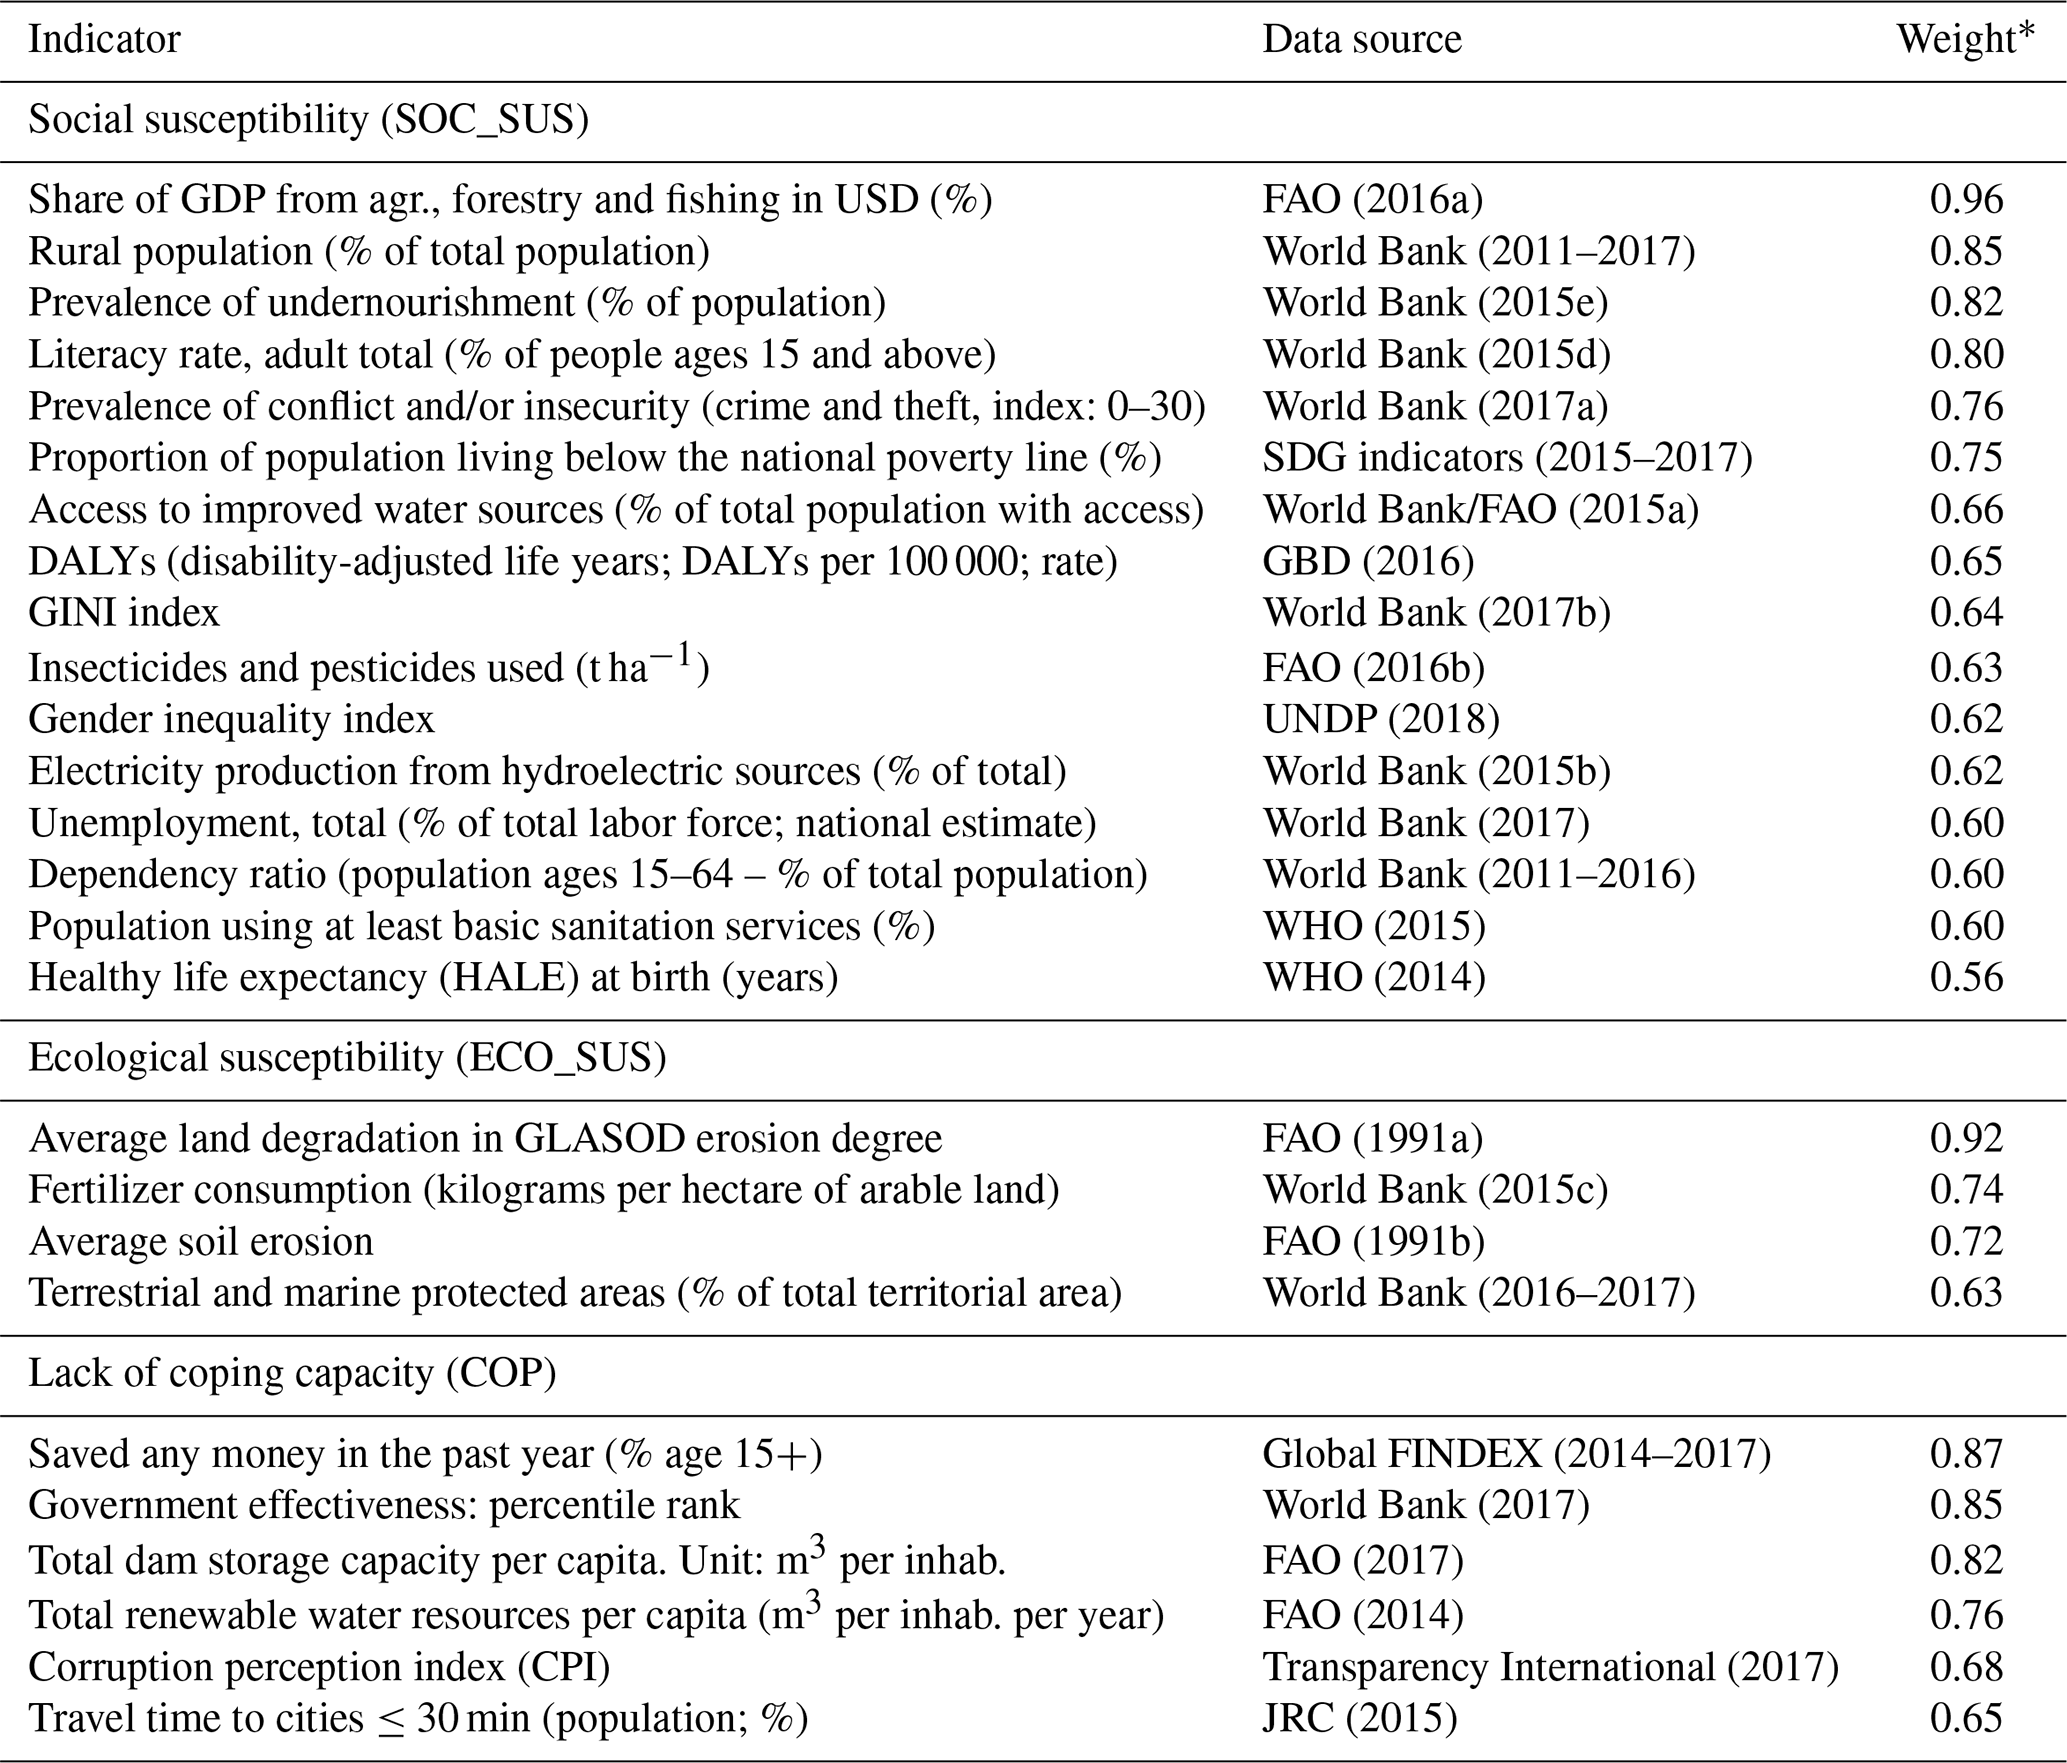
* Derived from a global expert survey (Meza et al., 2019).
An initial set of vulnerability indicators for agricultural systems was identified based on a recent review of existing drought risk assessments (Hagenlocher et al., 2019). In total 64 vulnerability indicators, including social, economic and physical indicators; farming practices; and environmental, governance, and crime and conflict factors, were selected and classified by socioecological susceptibility (SOC_SUS, ENV_SUS), a lack of coping capacity (COP) and a lack of adaptive capacity (AC) following the risk framework of the IPCC (IPCC, 2014). Indicator weights, which express the relevance of the identified indicators to characterizing and assessing the vulnerability of agricultural systems to droughts, were identified through a global survey of relevant experts (n=78), the majority of whom have worked in academia and for governmental organizations with more than 5 years of work experience (Meza et al., 2019). In total, 46 of the 64 indicators were considered relevant by the experts, comprising susceptibility, coping- and adaptive-capacity indicators. However, since adaptive capacity is only relevant when assessing future risk scenarios and less relevant to current risk, indicators related to adaptive capacity and indicators that could be measured with the same data source due to the similarity in what they represent were removed. For instance agriculture (% of GDP) and dependency on agriculture for livelihood (%) were averaged into one income indicator, and the variables GDP per capita (PPP – purchasing-power parity) and population below the national poverty line (%) both refer to poverty and therefore were also averaged to a combined indicator. This resulted in a set of 26 indicators as part of the vulnerability assessment (Table 2).
Following data acquisition, the data were preprocessed by transforming absolute to relative values and standardized when necessary (e.g., travel time to cities ≤ 30 min – population, divided by the total population). Descriptive statistics were used to evaluate the degree of missing data. The imputation of missing values was done with data from previous years and using secondary sources following Naumann et al. (2014) in cases where the r value lay between −1.0 and −0.9 or 1.0 and 0.9 using a Spearman correlation matrix and scatter diagram for visual interpretation. Following suggestions by Roth et al. (1999), Peng et al. (2006) and Enders (2003), listwise and pairwise deletion thresholds were selected when >30 % of data were missing on a country level and when >20 % of data were missing on the indicator level. After the deletion, 168 countries and 26 indicators were considered for the final analysis. To detect potential outliers, scatter plots and box plots for each indicator were created. Potential outliers were further examined using triangulation with other sources and past years. On this basis, outliers were identified in only one indicator (i.e., fertilizer consumption – kg ha−1 of arable land) and treated using winsorization following Field (2013). Multicollinearities were identified using a Spearman correlation matrix for the different vulnerability components (social susceptibility, environmental susceptibility and a lack of coping capacity). Following the rule proposed by Hinkle et al. (2003), any values higher than r>0.9 or smaller than were considered very highly correlated. The correlation was considered only if it was significant at the 0.05 level (two-tailed). Two indicators for the lack of a coping-capacity component and two from social susceptibility (e.g., healthy life expectancy at birth – years – and disability-adjusted life) showed high and significant correlations. However, no indicators were excluded on this basis due to the difference in concepts they represented and their relevance at the global level. In order to render the indicators comparable, the final selected indicators were normalized to a range from 0 to 1 using min–max normalization (Naumann et al., 2014; Carrão et al., 2016):
where Zi is the normalized score for each indicator score Xi. For variables with negative cardinality to the overall vulnerability the normalization was defined as
Finally, the normalized indicator scores were aggregated into vulnerability components (SOC_SUS, ENV_SUS, COP) using weighted arithmetic aggregation based on (using the example of SOC_SUS)
where Wi is the weights for each normalized data set, and Zi is the weights as obtained from the global expert survey. Therefore, weights were normalized to add up to 1. The final indicators and their respective weights are listed in Table 2. The vulnerability components of socioecological susceptibility (SE_SUS) were combined using an average, which was then combined with COP to obtain a final vulnerability index (VI) score:
The final drought risk index (DRI; Fig. 1) was calculated by multiplying the indices for drought hazard and exposure by vulnerability. At the pixel level, the presence of hazard and vulnerability point to a certain drought risk, independent of how much crop area is contained in the specific pixel. At the aggregated level, the different crop areas in the specific pixels must be considered; therefore exposure was calculated as harvested-area weighted mean of the pixel-level hazard and then multiplied by vulnerability to calculate drought risk at the country level.
The total drought risk score for irrigated and rainfed systems combined (DRItot) is derived by multiplying the exposure of the whole cropping system Exptot (Eq. 2) by the VI.
2.3 Comparison against drought impact data
The outcomes of the risk assessment for irrigated and rainfed systems combined (DRItot) were compared against impact data from the international Emergency Events Database (EM-DAT) of the Centre for Research on the Epidemiology of Disasters (CRED) using visual correlation (Fig. 6). EM-DAT systematically collects reports of drought events and drought impacts from various sources, including UN agencies, NGOs, insurance companies, research institutes and press agencies. Here, the number of drought events within the period 1980–2016 was used as an input for the comparison. Therefore, a drought event is registered in EM-DAT when at least one of the following criteria applies: 10 or more people are dead, 100 or more people are affected, or a declaration of a state of emergency or a call for international assistance is made.
This section presents the results of the global drought risk assessment for agricultural systems (irrigated and rainfed) at the pixel level (Figs. 2 and 3) and for the total risk of both systems combined at national resolution (Fig. 4). The dark-red patterns show high levels of the different risk components, while dark blue reflects low scores of the different risk components.
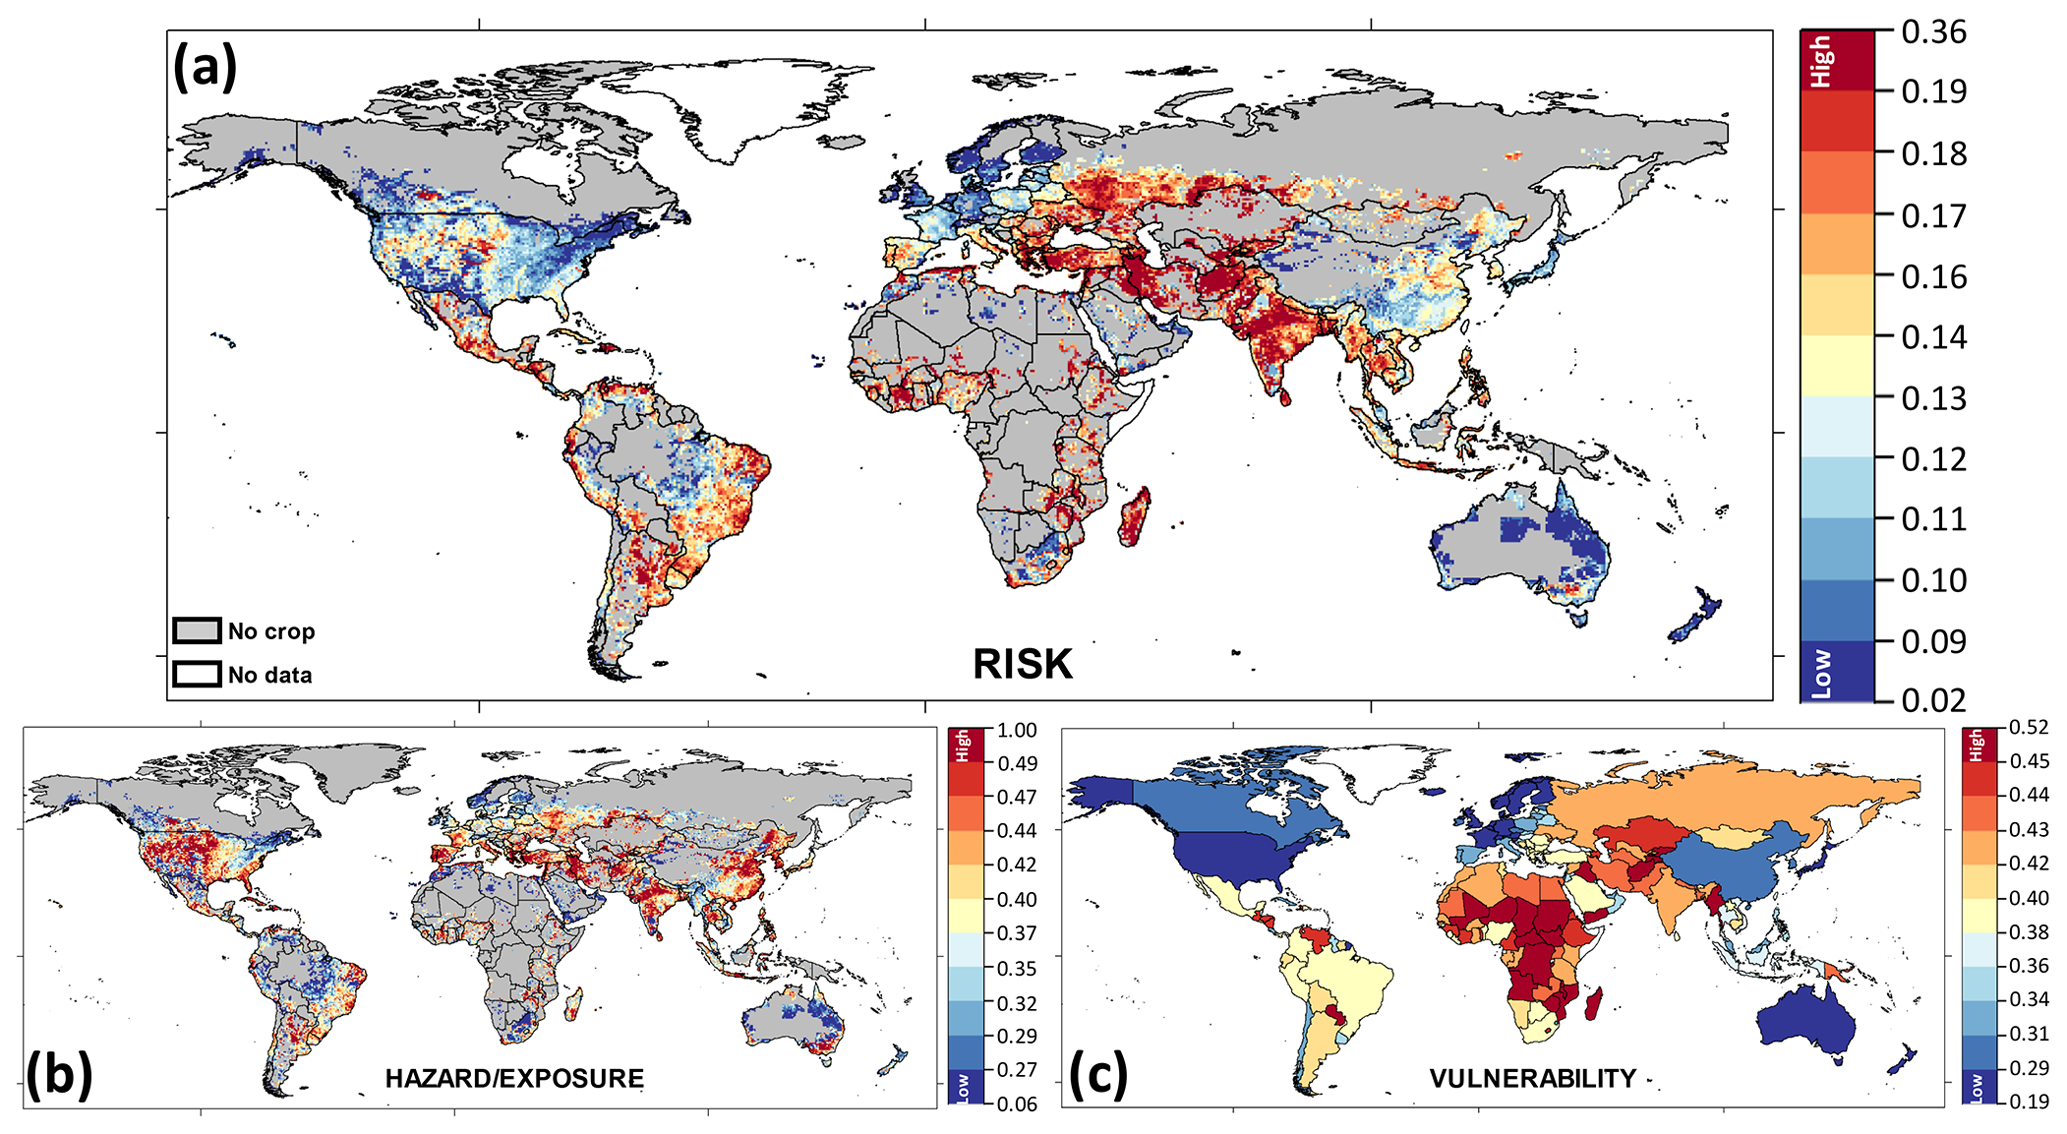
Figure 2Drought risk (a), hazard and exposure (b), and vulnerability (c) for irrigated agricultural systems. The legends were defined by assigning the median of the value distribution to the yellow color in the center, the 90th percentile to the deepest red color and the 10th percentile to the deepest blue color and by determining the class ranges of the other colors by linear interpolation. Risk was directly calculated by multiplying hazard and exposure by vulnerability (pixel-level analysis).
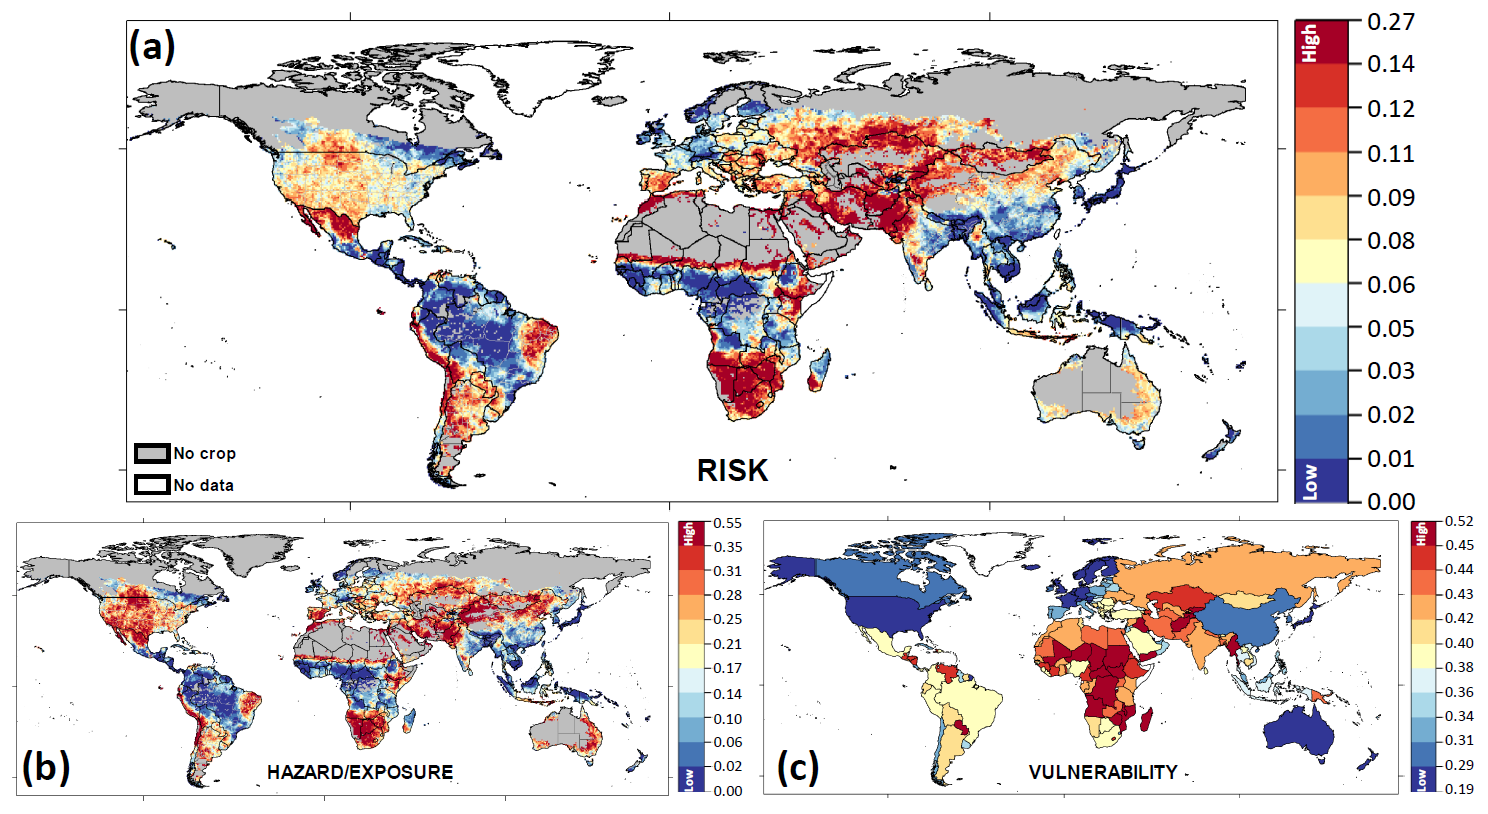
Figure 3Drought risk (a), hazard and exposure (b), and vulnerability (c) for rainfed agricultural systems. The legends were defined by assigning the median of the value distribution to the yellow color in the center, the 90th percentile to the deepest red color and the 10th percentile to the deepest blue color and by determining the class ranges of the other colors by linear interpolation. Risk was calculated by multiplying hazard and exposure by vulnerability (pixel-level analysis).

Figure 4Drought risk (a), hazard and exposure of irrigated crops (b), rainfed crops (c) and the whole crop production sector (d). The legends were defined by assigning the median of the value distribution to the yellow color in the center, the 90th percentile to the deepest red color and the 10th percentile to the deepest blue color and by determining the class ranges of the other colors by linear interpolation. Risk was calculated by multiplying hazard and exposure by vulnerability, as shown in Figs. 2c and 3c.
3.1 Drought risk for irrigated agricultural systems
The drought risk for irrigated agricultural systems varies significantly among continents and countries. Especially large countries such as the USA, Brazil, China and Australia show a high variation at the country level due to varying climatic conditions. Drought hazard and exposure was highest in regions with a high density of irrigated land and high irrigation water requirements such as the western part of the USA, central Asia, northern India, northern China and southern Australia. Vulnerability was high particularly in sub-Saharan Africa but also in some countries in central Asia and the Middle East and low in general for industrialized and high-income countries. The combination of hazard and vulnerability to risk resulted in the highest values for large parts of western, central and southern Asia; eastern Africa; and the eastern part of Brazil. Low-risk areas include western Europe, the USA, Australia and most parts of China (Fig. 2).
3.2 Drought risk for rainfed agricultural systems
High levels of risk (dark yellow to red color scheme) for rainfed agricultural systems are observed in southern Africa, in southeastern Europe, in northern Mexico, in northeastern Brazil, at the western coast of South America, in southern Russia and in western Asia. The vulnerability to drought highlights the relevance to increasing the coping capacity of the countries in order to reduce their overall drought risk. For instance, Australia, despite being highly exposed to drought hazard, has low socio-ecological susceptibility and high enough coping capacities to considerably reduce the overall drought risk.
3.3 Drought risk for agricultural systems (irrigated and rainfed combined)
The hazard and exposure maps shown in Fig. 4 are slightly different to the ones shown in Figs. 2 and 3 due to the aggregation at the country level. The analysis shows that regions with low hazard and exposure of rainfed and irrigated crops to drought tend to be tropical and subarctic regions following the Köppen–Geiger climate classification (1980–2016; Beck et al., 2018). There are significant regional differences when comparing irrigated and rainfed drought hazard and exposure. For instance, the northern parts of Latin America and central Africa have low hazard and exposure levels, given the humid climate conditions resulting in a low total risk, even though those regions are characterized by high vulnerability levels. Southern Africa, however, has a high amount of drought-exposed rainfed crops but lower vulnerability compared to other African countries. Despite this, risk scores in that region are very high. Very high drought hazard and exposure and vulnerability levels can be found in the Middle East and northern Africa.
Although the drought hazard was computed differently for the different agricultural systems, the countries with high risk of drought to both farming systems are Botswana, Namibia and Zimbabwe (Figs. 2 and 3). These countries share the same relevant indicators that define their high vulnerability: a high soil and land degradation rate, a low literacy rate and low total renewable water (Fig. S3). Table 3 shows the top and bottom 10 countries with the highest and lowest total drought risk (DRItot) as well as their hazard and exposure and vulnerability scores.
Table 3Rank of countries with the highest and lowest risk of drought for combined agricultural systems (rainfed and irrigated).
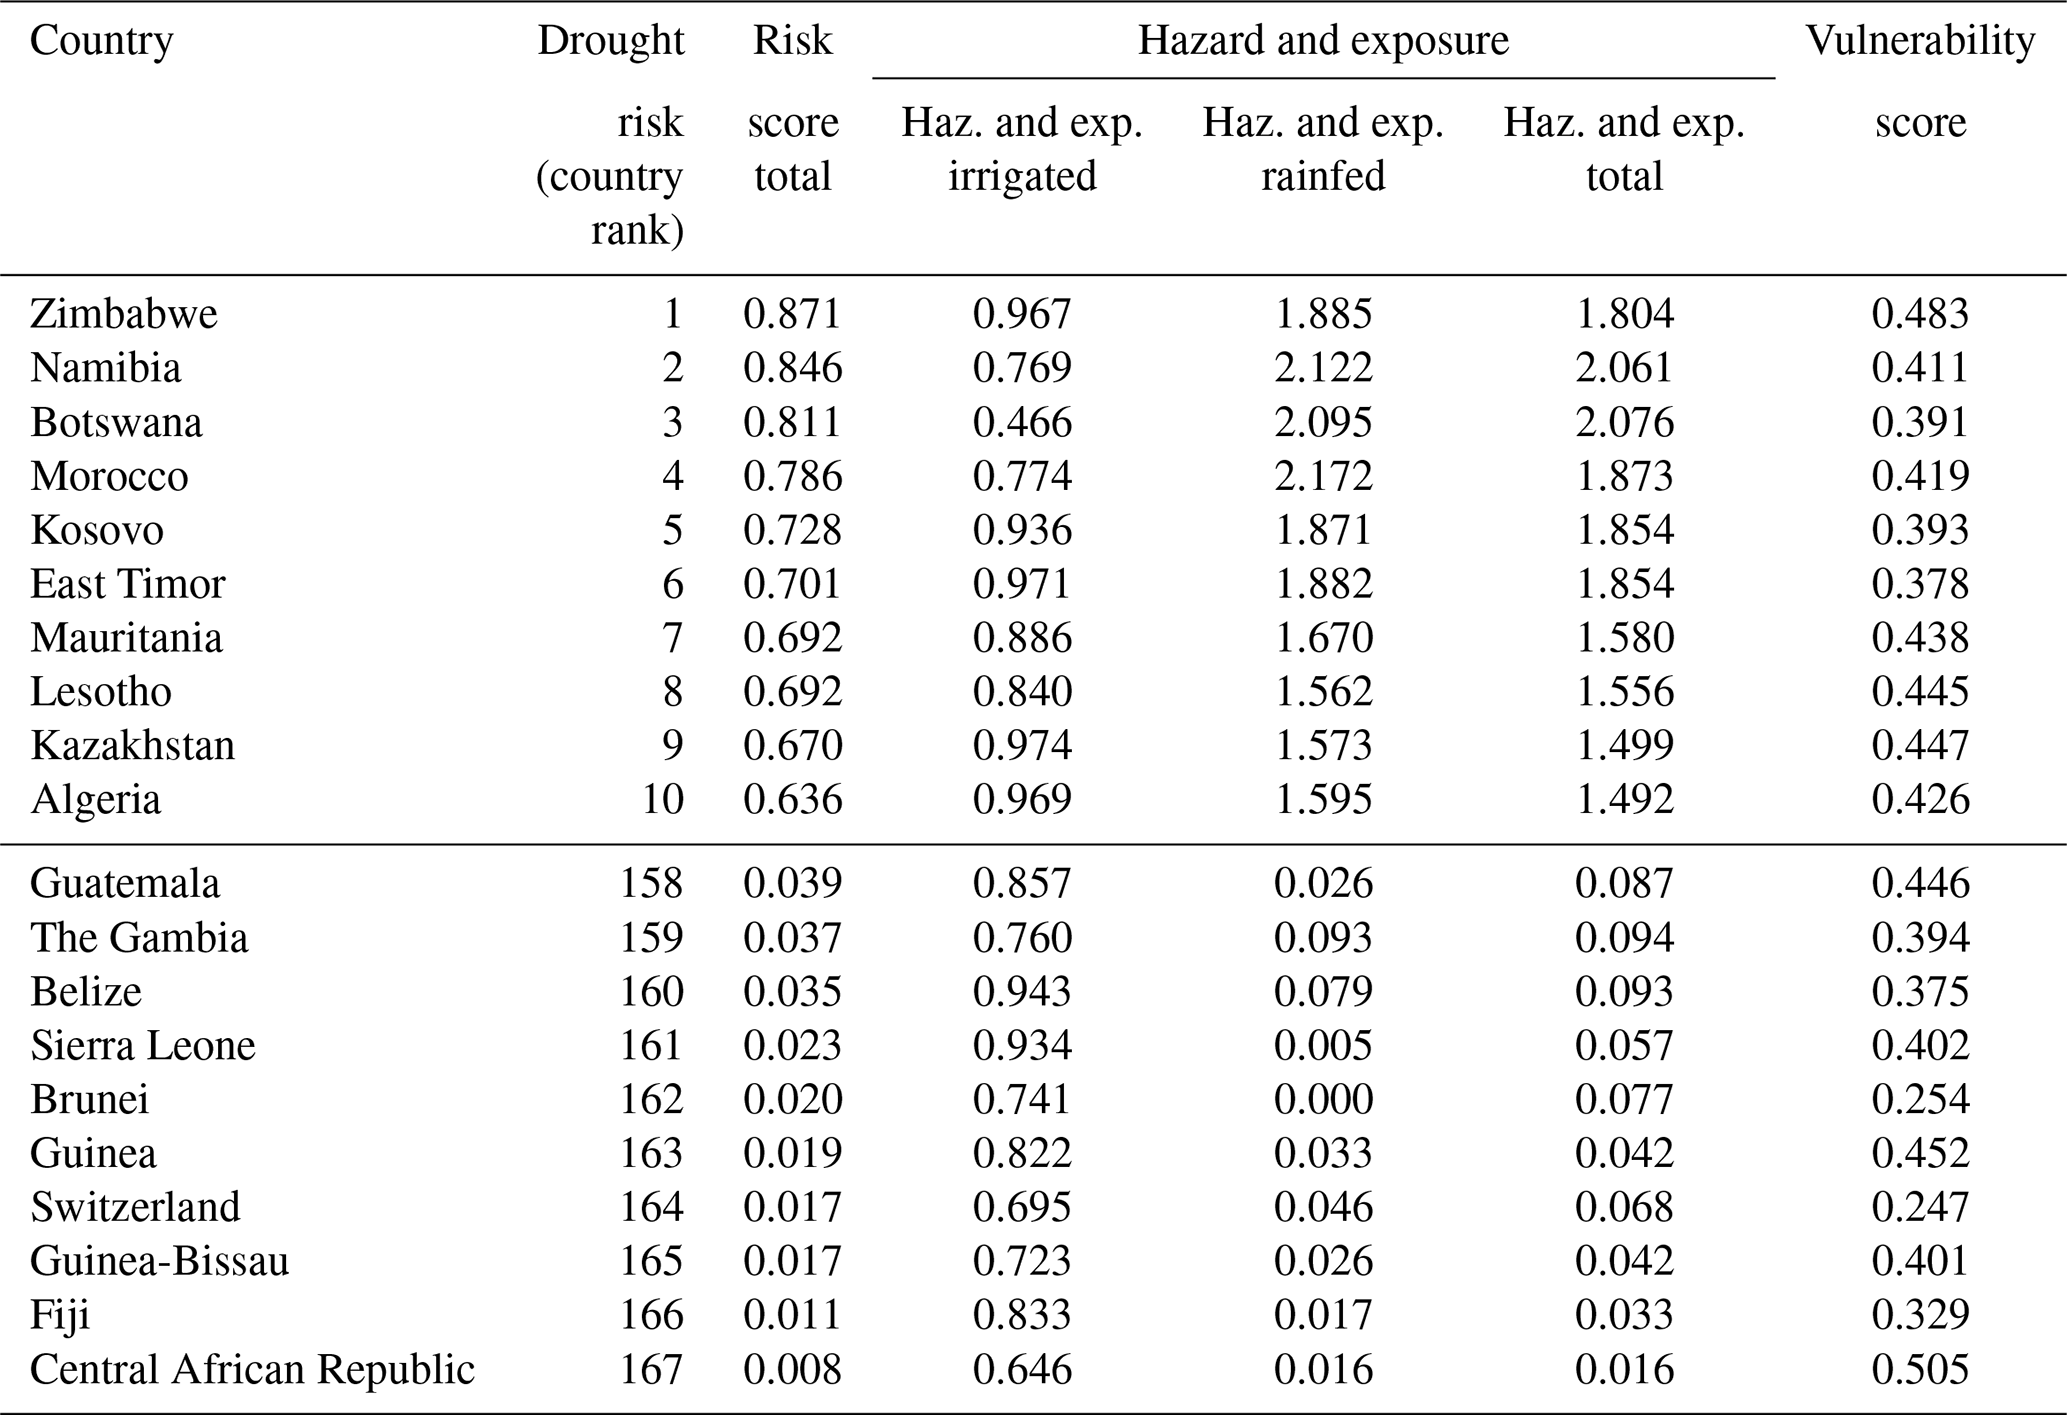
Seven out of the 10 countries with the highest overall drought risk are located on the African continent. However, Kosovo, East Timor and Kazakhstan also possess high risk levels (Table 3). Zimbabwe ranks as the country with the highest drought risk, mainly due to its high exposure combined with its high vulnerability (Fig. S1 in the Supplement).
In general, the countries that present higher drought risk have a high amount of exposed crops. Vulnerability varies among them, with Zimbabwe being the country with the highest vulnerability. The lack of coping capacity and socioecological susceptibility were determinant factors for countries like Botswana and Zimbabwe (Fig. S1). There were cases where countries such as Namibia presented high socio-ecological susceptibility in contrast with high coping capacity, reducing its overall vulnerability. The drought risk in countries such as Lesotho and Mauritania that have, in contrast, limited coping capacities is notably higher (Fig. S1). The analysis also reveals that, although risk is currently close to zero in several countries (e.g., Fiji, Central African Republic, Guinea-Bissau, etc.), this could rapidly change once these countries are affected by droughts given their very high vulnerability.
The comparison of the drought risks of rainfed and irrigated cropping systems (Fig. 5) shows that several countries such as Zimbabwe, Iraq and Algeria are exposed to high risk for both cropping systems. These countries are frequently hit by drought and similarly have a high vulnerability to drought (Figs. 2 and 3). In contrast, countries such as Switzerland, Finland and New Zealand are characterized by low drought hazard and exposure of irrigated and rainfed systems and low vulnerability to drought (Figs. 2 and 3). In countries such as Botswana, Oman and the United Arab Emirates, drought risk is high for rainfed cropping systems but low for irrigated cropping systems (Fig. 5). These countries are defined by arid climate conditions, exposing rainfed crops to high risk, while the drought risk for irrigated cropping systems is low because of relatively low interannual variability in climatic conditions resulting in low variability in the irrigation water requirement and streamflow. Their risk is also determined by their different vulnerability dynamics (e.g., hydroelectric sources, retaining renewable water). In contrast, drought risk for irrigated cropping systems is high and drought risk of rainfed cropping systems is small in countries such as Burkina Faso, Madagascar and Côte d'Ivoire (Fig. 5). In these three countries, there is a big variability in climatic conditions, with irrigated crops being cultivated in the more arid parts of the country and rainfed crops being cultivated in more humid parts. In addition, aquatic crops with high water demand, such as rice and sugarcane, are the most commonly cultivated irrigated crops in these countries (Frenken, 2005).
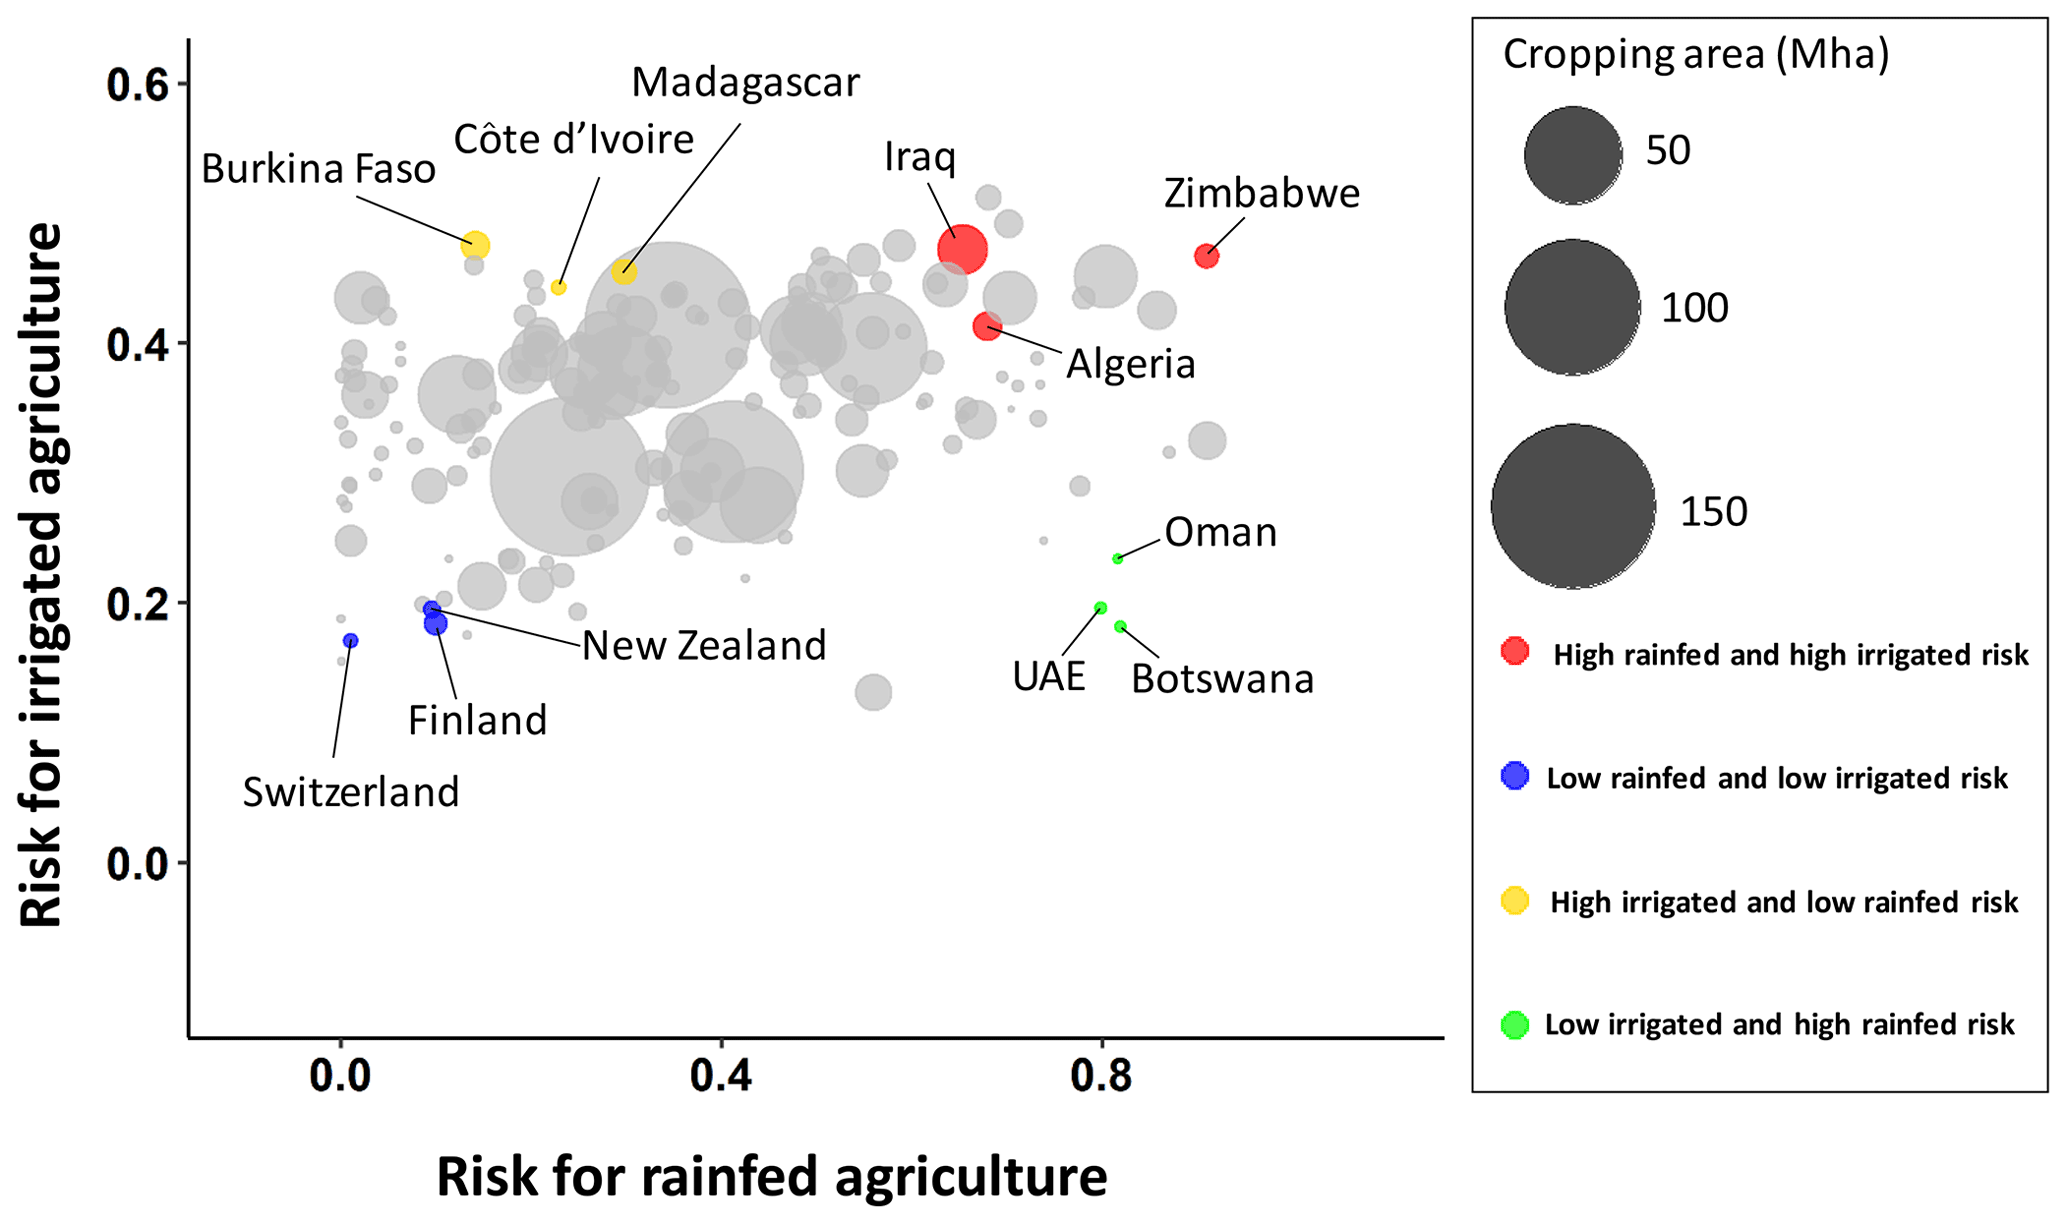
Figure 5Country profiles contrasting the drought risk of irrigated and rainfed agricultural systems. The size of the bubbles indicates the crop growing area (sum of rainfed and irrigated areas per country in Mha.
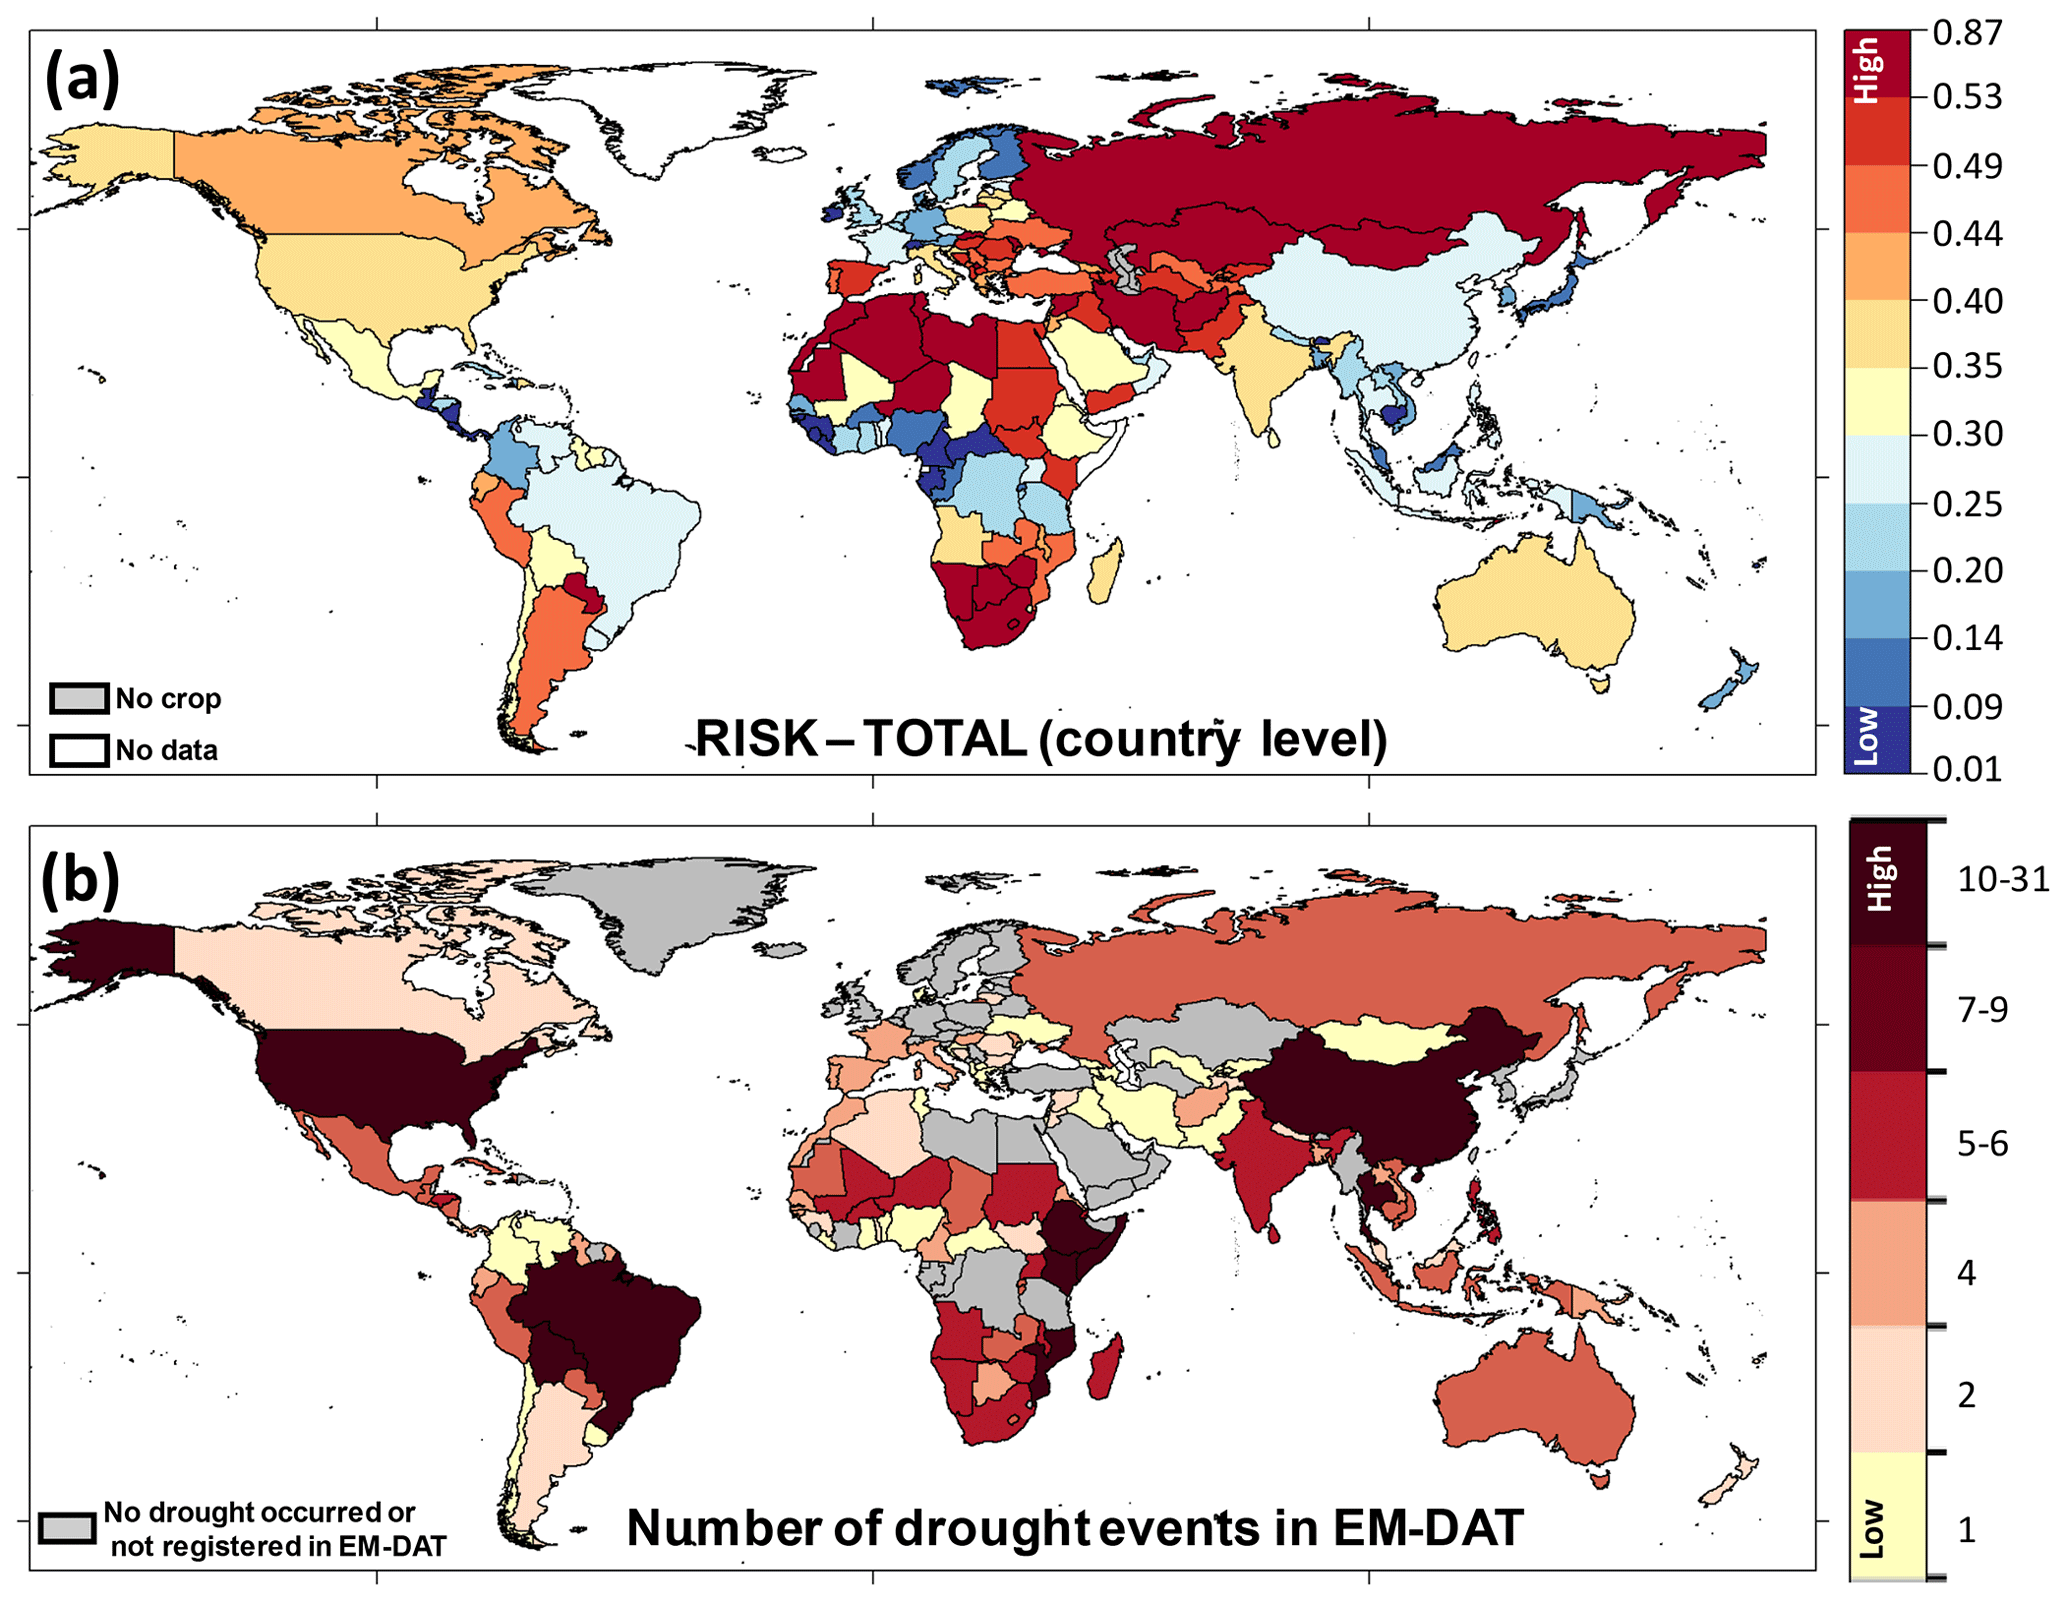
Figure 6Comparison of total risk against drought impact data.
3.4 Comparison
The comparison of drought risk (DRItot) with drought events registered in EM-DAT shows good agreement in many countries. For countries which have low drought risk, such as the countries in tropical Africa, northern and western Europe, or the northern part of South America, there are either no droughts or just one drought registered in EM-DAT (Fig. 6a and b). There is also good agreement for countries in southern Africa and some countries in the African transition zone with very high drought risk and many registered drought events and for countries with intermediate drought risk, such as Canada, Australia or Italy. However, some disagreement between calculated risk and the number of reported drought events is acknowledged. For instance, Brazil does not show high agreement between EM-DAT and the country risk level, even though the eastern part of the country presents a high risk for irrigated and rainfed systems (Figs. 2 and 3), and the total drought risk level is affected by the other regions with lower risk in the country. The same occurs in other large countries such as the USA, Russia, China and India, where the calculated drought risk is low or intermediate, although a large number of drought events have been registered in EM-DAT. The reason for this disagreement is that the risk shown in Fig. 6a is representative of the whole country, while drought events which only have local or regional impacts are also registered in EM-DAT (see Sect. 2.3). For all these big countries, we detected considerable spatial heterogeneity with regard to drought risk, where regions with high drought risk such as the central part of the USA, northeastern Brazil, northern China and northwestern India are complemented by other regions of low drought risk (Fig. 6a). Therefore, the high number of registered drought events in EM-DAT is corroborated by the presence of high regional drought risk (Figs. 2 and 3).
The present study performs, for the first time, a separate global drought risk analysis for irrigated and rainfed cropping systems, including regions that indicate a high vulnerability to droughts and are particularly exposed. In previous assessments, the share of irrigated cropland was either ignored or considered to be a vulnerability indicator (Carrão et al., 2016). The drought hazard analysis is based on three indicators: SH, IH and CH_RfAg, which quantify drought as a deviation from normal conditions consistent with common definitions. In agreement with the results for drought hazard obtained by Carrão et al. (2016), the largest drought hazard is obtained for arid and semi-arid regions such as northern and southern Africa, northern Mexico, along the coastline of Peru and Chile, the Arabian Peninsula, and Mongolia for rainfed systems; Italy, Turkey and western Mexico for irrigated systems; and the western USA, northeastern Brazil, western Argentina, central Asia, the Middle East, western India, northern China and southern Australia for both irrigated and rainfed systems. In contrast, previous studies based on standardized indices such as the standardized precipitation index (SPI) have detected the highest drought hazard mainly in humid regions such as central Europe, southeastern Asia, southern Brazil and tropical Africa (Geng et al., 2016). The reason for this difference could be that deviations from normal conditions should not be treated similarly for arid and humid regions, as not every precipitation or streamflow deficit in humid regions will automatically become a hazard for cropping systems. In fact, in humid regions, crops often perform better in relatively dry years (Holzkamper et al., 2015). We account for these effects by normalizing streamflow deficits with long-term mean annual river discharge (SH) or by calculating the probability of reductions in the AET ∕ PET ratio of rainfed crops in relative terms (CH_RfAg).
In the present study, the rainfed hazard is computed as the probability of a 10 % decline in the AET ∕ PET ratio compared to long-term mean conditions, whereas the irrigated drought hazard represents the combination of severity and frequency values derived from the streamflow or irrigation water requirement (see Sect. 2). While the methodology reflects the common understanding of the factors most influential for drought hazard in the two cropping systems well, a direct numerical comparison of the calculated hazard for rainfed and irrigated systems is not meaningful. The hazards and exposure calculated in this study should be used to rank or compare countries within the rainfed or irrigated domain but not in between. The reasoning for the calculation of the total exposure and risk in this study was less to support comparisons across countries but more to account for the different extent of irrigated and rainfed systems within the specific countries. There are countries in which crop production is completely rainfed and countries in which all crops are irrigated so that only the risk for the rainfed or irrigated systems is relevant. Aside from these extremes, crop production in most countries is either predominantly irrigated or predominantly rainfed. We account for this by calculating total crop exposure to drought (Fig. 4d) as the harvested-area weighted mean of the exposures of irrigated crops (Fig. 4b) and of the rainfed crops (Fig. 4c). Our attempt to calculate hazard, exposure and risk for the whole crop production sector by assigning a similar weight to the hazard exposures for rainfed and irrigated systems must be viewed critically, and results should be analyzed with care. A potential way to derive specific weights for rainfed and irrigated exposure could be validating not only calculated hazard and exposure but also vulnerability and risk, with information about drought impacts separately, for both irrigated and rainfed systems. A lack of data for drought impacts distinguishing rainfed and irrigated systems was the main reason why this approach was not implemented for the current study.
The calculation of the drought hazard of irrigated cropping systems in this study is based on the two components SH and irrigation IH reflecting the water supply and water demand, respectively, of irrigated systems. Therefore we do not consider specifically in our approach the availability and use of groundwater resources for irrigation. It is well known that dynamics in streamflow are usually larger than dynamics in groundwater storage so that groundwater is used by many farmers to substitute temporary deficits in surface water supply for irrigation systems. In general, access to groundwater should therefore be considered to reduce drought hazard and vulnerability of irrigated cropping systems. Consideration of groundwater resources would, however, require dynamic quantification of groundwater storage and groundwater levels, which is challenging for global-scale analyses and not possible with the models applied in this study. In addition, more conceptual work is needed to decide which degree of temporal variability in groundwater levels constitutes a hazard and how to treat long-term depletion of groundwater resources (negative trends) in drought risk studies.
The multi-dimensional nature of vulnerability of agricultural systems is represented by a set of 26 expert-weighted indicators. One of the major limitations of this data-driven approach is the spatial detail information for computing the model; however, at a global level it is not feasible to get a harmonized data set of all the proxy variables, but some caution must be advised when zooming in at the subnational level (Naumann et al., 2018). When interpreting the results, it is necessary to consider that some highly correlated indicators were maintained in the analysis, as they present different drivers of vulnerability and hence different entry points for vulnerability reduction. The selected indicators comprise social, economic, environmental, physical and governance-related factors contributing to socioecological susceptibility and the lack of coping capacity. In doing so, the present study goes beyond existing global drought risk assessments (Carrão et al., 2016), which are based on equal weights and do not consider relevant environmental vulnerability indicators to be a driver of drought risk. The latter, however, is relevant when assessing drought risk for agricultural systems, where factors such as land degradation and soil erosion are shown to exacerbate drought risk (Hagenlocher et al., 2019). In future assessments an alternative to the expert-based weighting of vulnerability indicators chosen here could be the use of statistical approaches (e.g., principal component analysis – PCA) to identify relevant indicators. However, given the high number of experts who participated in the weighting exercise (n=78) the expert-based approach seems more suitable for identifying relevant indicators when compared to an approach that builds on statistical significance only. Further, Hagenlocher et al. (2013) evaluated the outcomes of PCA-based and expert-based indicator choice on a composite vulnerability index and did not find major differences.
The findings of the drought risk assessment presented here correspond to a certain degree to the findings of Carrão et al. (2016). Although the focus of the current paper is more explicitly on agriculture, both studies present methodological similarities. In Carrão et al. (2016) the percentage of crop land per grid cell is one factor in the exposure analysis, and the percentage of irrigated agricultural land is one of the vulnerability factors. Although Carrão et al. (2016) include other factors such as population density, livestock density and baseline water stress in the analysis, the results give a high weight to the risk for agriculture. In both studies the regions less affected by droughts correspond to the regions with little or no exposure of agriculture and population (e.g., deserts and tropical forests). This is mainly the case in Amazonia and central Africa. Also, similarities between areas of high levels of risk are evident, including southern and eastern Europe, the Eurasian steppe, northern Africa and the Middle East, northeastern Brazil, and southeastern South America.
Similarities are also found for the risk of irrigated agricultural systems. Examples are irrigated croplands in India, the US and Australia. Differences in the overall patterns are due to the separation of irrigated and non-irrigated agriculture in the current study and the aggregated exposure information in Carrão et al. (2016). In an updated version of the risk map from Carrão et al. (2016), using a higher-resolution population database and grid-level exposure information, as shown in Vogt et al. (2018, Fig. 7), similarities are even more evident.
However, the present study includes a spatially explicit model of AET for the main crop types of two different agricultural systems (irrigated and rainfed agriculture) and includes a specialized vulnerability index for this sector according to expert judgment. These differences revealed the importance of focusing more clearly on distinct impacts (e.g., on irrigated vs. rainfed systems) when conducting drought risk assessments, even within the same sector. For instance, irrigated agricultural systems in Latin America are highly exposed to droughts, whereas the probability of droughts occurring in rainfed agricultural systems in that region is comparably low.
Despite these advancements, the presented analysis does have limitations. First, due to the lack of up-to-date land use data on irrigated vs. rainfed agriculture at the global scale, the exposure analysis is based on MIRCA data from the year 2000 (Portmann et al., 2010). Given that cropping systems are subject to change, this adds uncertainty to the results. Second, data used for the vulnerability analysis stem from different sources, which makes it difficult to evaluate the inherent uncertainties in the data. Third, the data are not consistently available for all countries for the same years (Table 2). Fourth, the vulnerability analysis is based on nation–state-resolution data, which do not allow for mapping spatial variability in vulnerability at the subnational level. Fifth, applying expert opinions to weight drought vulnerability indicators according to their relevance brings subjectivity to the assessment, which necessitates a strong network of relevant experts. Sixth, preventive or adaptive planning requires going beyond evaluating drivers of risk and mapping current patterns of risk. Future scenarios of drought risk, considering both changing environmental and climate conditions as well as possible future socioeconomic development pathways, are needed in order to anticipate future challenges.
Future research should address these challenges by also investigating subnational patterns in vulnerability and developing future drought risk scenarios in all dimensions of drought hazards, exposure and vulnerability. In addition, attempts to investigate changes and trends in drought risk and risk components are highly needed to better understand trajectories of drought risk in different countries and for the whole world. Further, inherent uncertainties, as well as the sensitivity of the risk assessment outcomes towards changes in the input parameters (e.g., indicator choice and weighting), should be investigated and validated statistically. This gap has also been highlighted in a recent review of climate vulnerability assessments (de Sherbinin et al., 2019) in general as well as in a recent review of drought risk assessments (Hagenlocher et al., 2019) in particular.
The comparison conducted in this study has shown that there are limited data available on agricultural losses and impacts caused by droughts at the global level. Furthermore, impacts are not always direct, as droughts can have cascading indirect impacts (Freire-Gonzáles et al., 2017; Van Lanen et al., 2017) which are difficult to assess. In addition, for countries where we find high drought risk (e.g., Mongolia, Iran, Kazakhstan and the countries in southeastern Europe), no or very few drought events are registered in EM-DAT. The reason for this mismatch could be that drought events in these countries were not registered in EM-DAT. For example, in Romania, EM-DAT reports two drought events, while according to other reports, 12 years between 1980 and 2012 were classified as drought years, with 48 % of the agricultural land affected (Lupu et al., 2010; Mateescu et al., 2013). On top of this, in Iran, EM-DAT reports one drought event while other sources recounted several droughts during 1980–2005, with the most extreme drought lasting for 4 years, from 1999 to 2002 (Javanmard et al., 2017; Zoljoodi and Didevarasl, 2013). These examples suggest that it cannot be concluded from missing drought records in EM-DAT that specific countries were not affected by drought. Once improved and reliable impact data are available at the global scale, future research should also focus on the statistical validation of drought risk assessments with drought events and impact data. Ongoing efforts of countries to report their losses and impacts due to natural hazards (e.g., as part of the Sendai monitoring) are considered to be a first important step towards that direction.
Lastly, while this study presents the first attempt to assess drought risk for agricultural systems, more work is needed to analyze drought risk for other sectors, such as public water supply, tourism, energy production and waterborne transport, among others.
This paper presents, for the first time, a global-scale drought risk assessment for both irrigated and rainfed agricultural systems from a socioecological perspective by integrating drought indicators for hazard, exposure and vulnerability. It goes beyond previous studies by including a separated and spatially explicit analysis of the drought hazard and exposure of irrigated and rainfed agricultural systems as well as an empirically based weighting of vulnerability indicators. The latter is based on the judgment of drought experts around the globe. The presented methodology can serve as a blueprint for the analysis of other affected sectors, such as water or energy. Findings from this study underscore the relevance of analyzing drought risk from a holistic perspective (i.e., including the sector-specific hazard, exposure and vulnerability) and are based on a spatially explicit approach. By providing information on high-risk areas and underlying drivers, this approach helps to identify priority regions as well as entry points for targeted drought risk reduction and adaptation options. While this first attempt provides valuable information at the global level, improvements could be achieved with the availability of more spatially explicit vulnerability information (i.e., at subnational levels) and the availability of standardized drought impact information that can serve as a quantitative validation of risk levels.
Data can be accessed under the following link: https://grow-globedrought.net/data/global-scale-drought-risk-assessment-for-agricultural-systems/ (last access: 27 February 2020) (Meza et al., 2020).
The supplement related to this article is available online at: https://doi.org/10.5194/nhess-20-695-2020-supplement.
IM conducted the risk assessment with the support of SS, EER under the supervision of MH. SS, PD, JK, HG, CH, EP, EER and HN developed the hazard indicators and SS conducted the exposure analysis. IM, MH, GN, and JVV conducted the global expert survey. IM, GN, JVV and MH were responsible for the vulnerability assessment. All authors have contributed to drafting the manuscript, the interpretation of the results, and approved the final manuscript.
The authors declare that they have no conflict of interest.
This article is part of the special issue “Global- and continental-scale risk assessment for natural hazards: methods and practice”. It is a result of the European Geosciences Union General Assembly 2018, Vienna, Austria, 8–13 April 2018.
The authors would like to thank the 78 experts for their participation in the global expert survey, the two reviewers for their valuable comments and Harrhy James for proofreading the revised paper.
This research is part of the project GlobeDrought and has been supported by the German Federal Ministry of Education and Research (BMBF; grant no. 02WGR1457A-F) through its Global Resource Water (GRoW) funding initiative.
This paper was edited by Philip Ward and reviewed by Veit Blauhut and one anonymous referee.
Beccari, B.: A Comparative Analysis of Disaster Risk, Vulnerability and Resilience Composite Indicators, Plos Currents, 8, https://doi.org/10.1371/currents.dis.453df025e34b682e9737f95, 2016.
Beck, H. E., Zimmermann, N. E., McVicar, T. R., Vergopolan, N., Berg, A., and Wood, E. F.: Present and future Köppen–Geiger climate classification maps at 1-km resolution, Scient. Data, 5, 180214, https://doi.org/10.1007/s00382-018-4128-0, 2018.
Carrão, H., Naumann, G., and Barbosa, P.: Mapping global patterns of drought risk: An empirical framework based on sub-national estimates of hazard, exposure and vulnerability, Global Environ. Change, 39, 108–124, https://doi.org/10.1016/j.gloenvcha.2016.04.012, 2016.
Carrão, H., Naumann, G., and Barbosa, P.: Global projections of drought hazard in a warming climate: a prime for disaster risk management, Clim. Dynam., 50, 2137–2155, https://doi.org/10.1007/s00382-017-3740-8, 2017.
CRED and UNISDR: Economic losses, poverty & disasters: 1998–2017, available at: https://www.unisdr.org/files/61119_credeconomiclosses.pdf (last access: 13 May 2019), 2018.
Dai, A.: Drought under global warming: a review, Wiley Interdisciplin. Rev.: Clim. Change, 2, 45–65, https://doi.org/10.1002/wcc.81, 2011.
Damberg, L. and AghaKouchak, A.: Global trends and patterns of drought from space, Theor. Appl. Climatol., 117, 441–448, https://doi.org/10.1002/wcc.81, 2014.
De Sherbinin, A., Apotsos, A., and Chevrier, J.: Mapping the future: policy applications of climate vulnerability mapping in West Africa, Geogr. J., 183, 414–425, https://doi.org/10.1111/geoj.12226, 2017.
de Sherbinin, A., Bukvic, A., Rohat, G., Gall, M., McCusker, B., Preston, B., Apotsos, A., Fish, C., Kienberger, S., Muhonda, P., Wilhelmi, O., Macharia, D., Shubert, W., Sliuzas, R., Tomaszewski, B., and Zhang, S.: Climate vulnerability mapping: A systematic review and future prospects, Wiley Interdisciplin. Rev.: Climate Change, 10, e600, https://doi.org/10.1002/wcc.600, 2019.
Dilley, M., Chen, R. S., Deichmann, U., Lerner-Lam, A. L, Arnold, M., Agew, J., Buys, P., Kjevstad, O., Lyon, B., and Yetman, G.: Natural Disaster Hotspots: a Global Risk Analysis, World Bank Publications, Washington, D.C., 2005.
Enders, C. K.: Using the Expectation Maximization Algorithm to Estimate Coefficient Alpha for Scales With Item-Level Missing Data, Psychol Meth., 8, 322–337, https://doi.org/10.1037/1082-989X.8.3.322, 2003.
FAO: FAOSTAT Statistical Database: Average land degradation in GLASOD erosion degree, available at: http://www.fao.org/faostat/en/#data/ES (last access: 25 March 2019), 1991a.
FAO: FAOSTAT Statistical Database: Average soil erosion, available at: http://www.fao.org/faostat/en/#data/ES (last access: 25 March 2019), 1991b.
FAO: FAOSTAT Statistical Database: Agriculture, forestry, and fishing, value added (% of GDP), available at: http://www.fao.org/faostat/en/#data/MK (last access: 15 May 2019), 2016a.
FAO: FAOSTAT Statistical Database: Pesticides and insecticides (total), available at: http://www.fao.org/faostat/en/#data/RP (last access: 12 April 2019), 2016b.
FAO: The impact of disasters and crises on agriculture and food security, available at: http://www.fao.org/3/I8656EN/i8656en.pdf (last access: 1 July 2019), 2018.
FAO: Main Database: Total dam storage capacity per capita, available at: http://www.fao.org/nr/water/aquastat/data/query/index.html?lang=en (last access: 16 April 2019), 2017.
FAO AQUASTAT: Main Database: Total renewable water resources per capita, available at: http://www.fao.org/nr/water/aquastat/data/query/index.html?lang=en (last access: 16 April 2019), 2014.
Field, A.: Discovering statistics using IBM SPSS statistics, 4th Edn., Sage, London, 2013.
Freire-González, J., Decker, C., and Hall, J. W.: The Economic Impacts of Droughts: A Framework for Analysis, Ecol. Econ., 132, 196–204, https://doi.org/10.1016/j.ecolecon.2016.11.005, 2017.
Frenken, K.: Irrigation in Africa in figures, AQUASTAT Survey – 2005, FAO Water Reports 29, FAO, Rome, Italy, available at: http://www.fao.org/3/A0232E/a0232e.pdf (last access: 14 June 2019), 2005.
Garschagen, M., Hagenlocher, M., Comes, M., Dubbert, M., Sabelfeld, R., Lee, Y. J., Grunewald, L., Lanzendörfer, M., Mucke, P., Neuschäfer, O., Pott, S., Post, J., Schramm, S., Schumann-Bölsche, D., Vandemeulebroecke, B., Welle, T., and Birkmann, J.: World Risk Report 2016, Bündnis Entwicklung Hilft and UNU-EHS, ISBN 9783946785026, 2016.
GBD: Compare, Institute for Health Metrics and Evaluation (IHME): DALYs (Disability-Adjusted Life Years) – All causes – Sex: Both – Age: Age-standardized (Rate) (DALYs per 100 000), available at: http://vizhub.healthdata.org/gbd-compare (last access: 28 April 2019), 2016.
Geng, G., Wu, J., Wang, Q., Lei, T., He, B., Li, X., Mo, X., Luo, H., Zhou, H., and Liu, D.: Agricultural drought hazard analysis during 1980–2008: a global perspective, Int. J. Climatol., 36, 389–399, https://doi.org/10.1002/joc.4356, 2013.
Geng, G., Wu, J., Wang, Q., Lei, T., He, B., Li, X., Mo, X., Luo, H., Zhou, H., and Liu, D.: Agricultural drought hazard analysis during 1980–2008: A global perspective, Int. J. Climatol., 36, 389–399, https://doi.org/10.1002/joc.4356, 2016.
Global FINDEX, World Bank: Saved any money in the past year (% age 15+), available at: https://globalfindex.worldbank.org/ (last access: 28 April 2019), 2014–2017.
Güneralp, B., Güneralp, I., and Liu, Y.: Changing global patterns of urban exposure to flood and drought hazards, Global Environ. Change, 31, 217–225, https://doi.org/10.1016/j.gloenvcha.2015.01.002, 2015.
Hagenlocher, M., Delmelle, E., Casas, I., and Kienberger, S.: Assessing socioeconomic vulnerability to dengue fever in Cali, Colombia: Statistical vs expert-based modeling, Int. J. Health Geogr., 12, 36, https://doi.org/10.1186/1476-072X-12-36, 2013.
Hagenlocher, M., Renaud, F. G., Haas, S., and Sebesvari, Z.: Vulnerability and risk of deltaic social-ecological systems exposed to multiple hazards, Sci. Total Environ., 631–632, 71–80 https://doi.org/10.1016/j.scitotenv.2018.03.013, 2018.
Hagenlocher, M., Meza, I., Anderson, C., Min, A., Renaud, F. G., Walz, Y., and Sebesvari, Z.: Drought vulnerability and risk assessments: state of the art, persistent gaps, and research agenda, Environ. Res. Lett., 14, 083002, https://doi.org/10.1088/1748-9326/ab225d, 2019.
Hao, Z., AghaKouchak, A., Nakhjiri, N., and Farahmand, A.: Global integrated drought monitoring and prediction system, Scient. Data, 1, 1–10, https://doi.org/10.1038/sdata.2014.1, 2014.
Harris, I., Jones, P. D., Osborn, T. J., and Lister, D. H.: Updated high-resolution grids of monthly climatic observations – the CRU TS3.10 Dataset, Int. J. Climatol., 34, 623–642, https://doi.org/10.1002/joc.3711, 2014.
Hinkel, J.: Indicators of vulnerability and adaptive capacity: Towards a clarification of the science-policy interface, Global Environ. Change, 21, 198–208, https://doi.org/10.1016/j.gloenvcha.2010.08.002, 2011.
Hinkle, D. E., Wiersma, W., and Jurs, S. G.: Applied statistics for the behavioral sciences, 5th Edn., Houghton Mifflin College Division, 2003.
Hirabayashi, Y., Roobavannan, M., Sujan, K., Lisako, K., Dai, Y., Satoshi, W., Hyungjun, K., and Shinjiro, K.: Global flood risk under climate change, Nat. Clim. Change, 3, 816–821, https://doi.org/10.1038/nclimate1911, 2013.
Holzkamper, A., Fossati, D., Hiltbrunner, J., and Fuhrer, J.,: Spatial and temporal trends in agro-climatic limitations to production potentials for grain maize and winter wheat in Switzerland, Reg. Environ. Change, 15, 109–122, https://doi.org/10.1007/s10113-014-0627-7, 2015.
INFORM: INFORM report 2019, Shared evidence for managing crises and disasters, available at: http://www.inform-index.org, last access: 1 July 2019.
IPCC: Climate Change (2014) Synthesis Report. Contribution of Working Groups I, II and III to the Fifth Assessment Report of the Intergovernmental Panel on Climate Change, edited by: Core Writing Team, Pachauri, R. K., and Meyer, L. A., IPCC, Geneva, Switzerland, 151 pp., 2014.
Javanmard, S., Emamhadi, M., BodaghJamali, J., and Didehvarasl, A.: Spatial-Temporal Analysis of Drought in Iran Using SPI During a Long-Term Period, Earth Sci., 6, 15–29, https://doi.org/10.11648/j.earth.20170602.12, 2017.
JRC: Global accessibility map: Travel time to mahor cities: A global map of Accessibility, available at: https://forobs.jrc.ec.europa.eu/products/gam/ (last access: 10 April 2019), 2015.
Kloos, J. and Renaud, F. G.: Overview of ecosystem-based approaches to drought risk reduction targeting small-scale farmers in Sub-Saharan Africa, in: Ecosystem-Based Disaster Risk Reduction and Adaptation in Practice, Series: Advances in natural and technological hazards research, edited by: Renaud, F. G., Sudmeier-Rieux, K., Estrella, M., and Nehren, U., Springer, Cham, 199–226, 2016.
Koks, E. E., Rozenberg, J., Zorn, C., Tariverdi, M., Vousdoukas, M., Fraser, S .A., Hall, J. W., and Hallegatte, S.: A global multi-hazard risk analysis of road and railway infrastructure assets, Nat. Commun., 10, 1–11, https://doi.org/10.1038/s41467-019-10442-3, 2019.
Li, Y., Ye, W., Wang, M., and Yan, X.: Climate change and drought: A risk assessment of crop-yield impacts, Clim. Res., 39, 31–46, https://doi.org/10.3354/cr00797, 2009.
Lupu, A. B., Ionescu, F. C., and Borza, I.: The phenomenon of drought and it's effects within Romania, Res. J. Agricult. Sci., 42, 102–109, 2010.
Mateescu, E., Smarandache, M., Jeler, N., and Apostol, V.: Drought conditions and management strategies in Romania. Initiative on “Capacity Development to support National Drought Management Policy” (WMO, UNCCD, FAO and UNW-DPC) – Country Report, available at: http://www.droughtmanagement.info/literature/UNW-DPC_NDMP_Country_Report_Romania_2013.pdf (last access: 17 June 2019), 2013.
Meza, I., Hagenlocher, M., Naumann, G., Vogt, J., and Frischen, J.: Drought vulnerability indicators for global-scale drought risk assessments, EUR 29824 EN, Publications Office of the European Union, Luxembourg, JRC117546, ISBN 978-92-76-09210-0, https://doi.org/10.2760/73844, 2019.
Meza, I., Siebert, S., Döll, P., Kusche, J., Herbert, C., Rezaei, E. E., Nouri, H., Gerdener, H., Popat, E., Frischen, J. Naumann, G., Vogt, J., Hagenlocher, M.: Global drought risk for agricultural systems – Data and Metadata, available at: https://grow-globedrought.net/data/global-scale-drought-risk-assessment-for-agricultural-systems/, last access: 27 February 2020.
McCabe, G. J. and Wolock, D. M.: Variability and trends in global drought, Earth Space Sci., 2, 223–228, https://doi.org/10.1002/2015EA000100, 2015.
Müller Schmied, H., Eisner, S., Franz, D., Wattenbach, M., Portmann, F. T., Flörke, M., and Döll, P.: Sensitivity of simulated global-scale freshwater fluxes and storages to input data, hydrological model structure, human water use and calibration, Hydrol. Earth Syst. Sci., 18, 3511–3538, https://doi.org/10.5194/hess-18-3511-2014, 2014.
Naumann, G., Barbosa, P., Garrote, L., Iglesias, A., and Vogt, J.: Exploring drought vulnerability in Africa: an indicator based analysis to be used in early warning systems, Hydrol. Earth Syst. Sci., 18, 1591–1604, https://doi.org/10.5194/hess-18-1591-2014, 2014.
Naumann, G., Carrao, H., and Barbosa, P.: Indicators of social vulnerability to drought, in: chap. 6 in Wiley Book on Drought: Science and Policy, Part II: Vulnerability, risk and policy, Wiley-Blackwell, Chichester, WS, 2018.
OECD: Handbook on Constructing Composite Indicators: Methodology and UserGuide, available at: https://www.oecd.org/std/42495745.pdf (last access: 12 September 2017), 2008.
Peduzzi, P., Dao, H., Herold, C., and Mouton, F.: Assessing global exposure and vulnerability towards natural hazards: the Disaster Risk Index, Nat. Hazards Earth Syst. Sci., 9, 1149–1159, https://doi.org/10.5194/nhess-9-1149-2009, 2009.
Peduzzi, P., Chatenoux, B., Dao, H., De Bono, A., Herold, C., Kossin, J., Mouton, F., and Nordbeck, O.: Global trends in tropical cyclone risk, Nat. Clim. Change, 2, 289–294, https://doi.org/10.1038/nclimate1410, 2012.
Peng, C.-Y. J., Harwell, M., Liou, S.-M., and Ehman, L. H.: Advances in missing data methods and implications for educational research, in: Real data analysis, edited by: Sawilowsky, S., Information Age, Greenwich, CT, 31–37, 2006.
Portmann, F. T., Siebert, S., and Döll, P.: MIRCA2000-Global monthly irrigated and rain-fed crop areas around the year 2000: A new high-resolution data set for agricultural and hydrological modeling, Global Biogeochem. Cy., 24, Gb1011, https://doi.org/10.1029/2008gb003435, 2010.
Rojas, O.: Agricultural extreme drought assessment at global level using the FAO-Agricultural Stress Index System (ASIS), Weather Clim. Extr., 100184, https://doi.org/10.1016/j.wace.2018.09.001, 2018.
Roth, P. L., Switzer III, F. S., and Switzer, D. M.: Missing data in multiple item scales: A Monte Carlo analysis of missing data techniques, Organiz. Res. Meth., 2, 211–232, https://doi.org/10.1177/109442819923001, 1999.
SDG indicators: Global SDG Indicators Database (database): Proportion of population below international poverty line (%), available at: https://unstats.un.org/sdgs/indicators/database/ (last access: 9 April 2019), 2015–2017.
Sheffield, J. and Wood, E. F.: Projected changes in drought occurrence under future global warming 16 from multi-model, multi-scenario, IPCC AR4 simulations, Clim. Dynam., 31, 79–105, https://doi.org/10.1007/s00382-007-0340-z, 2008.
Sheffield, J., Wood, E. F., and Roderick, M. L.: Little change in global drought over the past 60 years, Nature, 491, 435–440, https://doi.org/10.1038/nature11575, 2012.
Siebert, S. and Döll, P.: Quantifying blue and green virtual water contents in global crop production as well as potential production losses without irrigation, J. Hydrol., 384, 198–217, https://doi.org/10.1016/j.jhydrol.2009.07.031, 2010.
Silva, V., Amo-Oduro, D., Calderon, A., Dabbeek, J., Despotaki, V., Martins, L., Rao, A., Simionato, M., Viganò, D., Yepes, C., Acevedo, A., Horspool, N., Crowley, H., Jaiswal, K., Journeay, M., and Pittore, M.: Global Earthquake Model (GEM) Seismic Risk Map (version 2018.1), https://doi.org/10.13117/GEM-GLOBAL-SEISMIC-RISK-MAP-2018, 2018.
Spinoni, J., Naumann, G., Carrão, H., Barbosa, P., and Vogt, J.: World drought frequency, duration, and severity for 1951–2010, Int. J. Climatol., 34, 2792–2804, https://doi.org/10.1002/joc.3875, 2013.
Spinoni, J., Naumann, G., and Vogt, J. V.: Pan-European seasonal trends and recent changes of drought frequency and severity, Global Planet. Change, 148, 113–130, https://doi.org/10.1016/j.gloplacha.2016.11.013, 2017.
Spinoni, J. Barbosa, P., De Jager, A., McCormick, N., Naumann, G., Vogt, J. V., Magni, D., Masante, D., and Mazzeschi, M.: A new global database of meteorological drought events from 1951 to 2016, J. Hydrol.: Reg. Stud., 22, 2793–2804, https://doi.org/10.1016/j.ejrh.2019.100593, 2019a.
Spinoni, J., Barbosa, P., Bucchignani, E., Cassano, J., Cavazos, T., Christensen, J. H., Christensen, O. B., Coppola, E., Evans, J., Geyer, B., Giorgi, F., Hadjinicolaou, P., Jacob, D., Katzfey, J., Koenigk, T., Laprise, R., Lennard, C. H., Levent Kurnaz, M., Li, D., Llopart, M., McCormick, N., Naumann, G., Nikulin, G., Ozturk, T., Panitz, H.-J., Porfirio da Rocha, R., Rockel, B., Solman, S. A., Syktus, J., Tangang, F., Teichmann, C., Vautard, R., Vogt, J. V., Winger, K., Zittis, G., and Dosio, A.: Future global meteorological drought hotspots. A study based on CORDEX data, J. Climate, https://doi.org/10.1175/JCLI-D-19-0084.1, in press, 2019b.
Tallaksen, L. M. and Van Lanen, H. A. (Eds.): Hydrological drought: processes and estimation methods for streamflow and groundwater, Elsevier, Amsterdam, 2004.
Transparency International: Corruption perceptions index 2017, available at: https://www.transparency.org/news/feature/corruption_perceptions_index_2017#table (last access: 3 May 2019), 2017.
Trenberth, K. E., Dai, A., van der Schrier, G. , Jones, P. D., Barichivich, J., Briffa, K. R., and Sheffield, J.: Global warming and changes in drought, Nat. Clim. Change, 4, 17–22, https://doi.org/10.1038/nclimate2067, 2013.
UNDP: Human Development Reports: Gender Inequality Index, available at: http://hdr.undp.org/en/composite/GII (last access: 15 April 2019), 2018.
UNDRR: Global Assessment Report on Disaster Risk Reduction, Geneva, Switzerland, available at: https://gar.unisdr.org, last access: 17 June 2019.
Van Lanen, H. A. J., Vogt, J. V., Andreu, J., Carrão, H., De Stefano, L., Dutra, E., Feyen, L., Forzieri, G., Hayes, M., Iglesias, A., Lavaysse, C., Naumann, G., Pulwarty, R., Spinoni, J., Stahl, K., Stefanski, R., Stilianakis, N., Svoboda, M., and Tallaksen, L. M.: Climatological risk: droughts, in: Science for disaster risk management (2017). Knowing better and losing less, chap. 3.9, EUR 28034 EN, edited by: Poljanšek, K., Marín Ferrer, M., De Groeve, T., and Clark, I., Publications Office of the European Union, Luxembourg, https://doi.org/10.2788/688605, 2017.
Van Loon, A. F., Gleeson, T., Clark, J., Van Dijk, A. I. J. M., Stahl, K., Hannaford, J., Di Baldassarre, G., Teuling, A. J., Tallaksen, L. M., Uijlenhoet, R., Hannah, D. M., Sheffield, J., Svoboda, M., Verbeiren, B., Wagener, T., Rangecroft, S., Wanders, N., and Van Lanen, H. A. J.: Drought in the Anthropocene, Nat. Geosci., 9, 89–91, 2016.
Vogt, J. V., Naumann, G., Masante, D., Spinoni, J., Cammalleri, C., Erian, W., Pischke, F., Pulwarty, R., and Barbosa, P.: Drought Risk Assessment. A conceptual Framework, EUR 29464 EN, Publications Office of the European Union, Luxembourg, JRC113937, https://doi.org/10.2760/057223, 2018.
Ward, P. J., Jongman, B., Sperna Weiland, F., Bouwman, A., van Beek, R., Bierkens, M. F. P., Ligtvoet, W., and Winsemius, H. C.: Assessing flood risk at the global scale: model setup, results, and sensitivity, Environ. Res. Lett., 8, 4, https://doi.org/10.1088/1748-9326/8/4/044019, 2013.
Ward, P. J., Jongman, B., Kummu, M., Dettinger, M. D., Sperna Weiland, F. C., and Winsemius, H. C.: Strong influence of El Niño Southern Oscillation on flood risk around the world, P. Natl. Acad. Sci. USA, 111, 15659–15664, https://doi.org/10.1073/pnas.1409822111, 2014.
Weedon, G. P., Balsamo, G., Bellouin, N., Gomes, S., Best, M. J., and Viterbo, P.: The WFDEI meteorological forcing data set: WATCH forcing data methodology applied to ERA-Interim reanalysis data, Water Resour. Res., 50, 7505–7514, https://doi.org/10.1002/2014WR015638, 2014.
Welle, T. and Birkmann, J.: The World Risk Index – An Approach to Assess Risk and Vulnerability on a Global Scale, J. Extr. Events, 2, 155003, https://doi.org/10.1142/S2345737615500025, 2015.
WHO: Global Health Observatory data repository: Healthy life expectancy (HALE), available at: http://apps.who.int/gho/data/view.main.HALEXv (last access: 15 April 2019), 2014.
WHO: Global Health Observatory data repository: Basic and safely managed sanitation services, available at: http://apps.who.int/gho/data/view.main.WSHSANITATIONv?lang=en, (last access: 15 April 2019), 2015.
World Bank: World Development Indicators: Age dependency ratio (% of working-age population), available at: https://databank.worldbank.org/reports.aspx?source=2&series=SP.POP.DPND&country= (last access: 11 April 2019), 2011–2016.
World Bank: World Development Indicators: Rural population, available at: https://databank.worldbank.org/reports.aspx?source=2&series=SP.RUR.TOTL&country= (last access: 10 April 2019), 2011–2017.
World Bank: World Development Indicators: Improved water source (% of population with access), available at: https://databank.worldbank.org/source/world-development-indicators (last access: 27 March 2019), 2015a.
World Bank: World Development Indicators: Electricity production from hydroelectric sources (% of total), available at: https://databank.worldbank.org/reports.aspx?source=2&series=EG.ELC.HYRO.ZS&country= (last access: 25 April 2019), 2015b.
World Bank: World Development Indicators: Fertilizer consumption (kilograms per hectare of arable land), available at: https://databank.worldbank.org/reports.aspx?source=2&series=AG.CON.FERT.ZS&country= (last access: 20 April 2019), 2015c.
World Bank: World Development Indicators: Literacy rate, adult total (% of people ages 15 and above), available at: https://databank.worldbank.org/reports.aspx?source=2&series=SE.ADT.LITR.ZS&country= (last access: 8 April 2019), 2015d.
World Bank: World Development Indicators: Prevalence of undernourishment (% of population), available at: https://databank.worldbank.org/reports.aspx?source=2&series=SN.ITK.DEFC.ZS&country= (last access: 10 April 2019), 2015e.
World Bank: World Development Indicators: Terrestrial and marine protected areas (% of total territorial area), available at: https://databank.worldbank.org/reports.aspx?source=2&series=ER.PTD.TOTL.ZS&country= (last access: 14 April 2019), 2016–2017.
World Bank: TCdata360: Crime and Theft, available at: https://tcdata360.worldbank.org/indicators/mpf.cri.the?country=BRA&indicator=3284&viz=line_chart&years=2008,2017#table-link (last access: 7 April 2019), 2017a.
World Bank: World Development Indicators: GINI index (World Bank estimate), available at: https://databank.worldbank.org/reports.aspx?source=2&series=SI.POV.GINI&country= (last access: 9 April 2019), 2017b.
Yuan, X. and Wood, E. F.: Multimodel seasonal forecasting of global drought onset, Geophys. Res. Lett., 40, 4900–4905, https://doi.org/10.1002/grl.50949, 2013.
Zoljoodi, M. and Didevarasl, A.: Evaluation of Spatial-Temporal Variability of Drought Events in Iran Using Palmer Drought Severity Index and Its Principal Factors (through 1951–2005), Atmos. Clim. Sci., 3, 193–207, https://doi.org/10.4236/acs.2013.32021, 2013.