the Creative Commons Attribution 4.0 License.
the Creative Commons Attribution 4.0 License.
 | 27 Nov 2020
Semi-empirical prediction of dam height and stability of dams formed by rock slope failures in Norway
Thierry Oppikofer
Reginald L. Hermanns
Vegard U. Jakobsen
Martina Böhme
Pierrick Nicolet
Ivanna Penna
Based on an inventory of 69 dams formed by rock slope failures in southwestern Norway and published inventories from other parts of the world, we developed semi-empirical relationships linking the maximum dam height (HD.max in metres) to dam volume (VD in 106 m3) and other relevant parameters such as valley width (WV in metres) or dam area (AD in square kilometres). Power laws are obtained for and , WV), while a linear relationship links HD.max to the ratio VD∕AD. For dams in southwestern Norway, the linear relationship has the least uncertainties and provides the best results when comparing predicted dam heights with a validation dataset composed of existing dams in northern Norway and numerically modelled dams for possible rock slope failures. To assess the stability of future dams, we use the predicted dam heights in the dimensionless blockage index (DBI) and relating this index to the probability of dam failure derived from our dataset and other published databases on landslide dams. This study underlines the potential of semi-empirical relationships for assessing dam height and stability that needs to be included in preliminary hazard and risk assessment for unstable rock slopes, because damming of a river is an important secondary effect of landslides due to upstream flooding and possible outburst floods in the case of dam failure.
- Article
(8394 KB) - Full-text XML
- BibTeX
- EndNote


Landslides, and more particularly large rockslides and rock avalanches, have formed natural dams in many mountainous regions (Korup, 2002; Casagli et al., 2003; Evans et al., 2011; Hermanns et al., 2011a; Weidinger, 2011; Dufresne et al., 2018). Even large dams several millions of cubic metres in volume may be unstable and breach (Hewitt, 1998; Dai et al., 2005; Plaza et al., 2011). Many historic events of landslide dam failures are reported to have occurred within a few days to years after a landslide event, causing catastrophic outburst floods in the valley downstream of the dam (Groeber, 1916; Hewitt, 1982; Costa and Schuster, 1988; Evans, 2006) and leading to major destruction and loss of life (Evans et al., 2011).
The national landslide database of Norway (NVE, 2020) includes at least 181 historical landslides that caused damming of rivers. Most of them were earth and debris slides (153) and only 22 events were rockslides or rock avalanches. Many of those events created only minor damming of rivers without significant consequences. Yet, there were several major events with significant consequences in terms of loss of life or long-lasting landscape changes: the worst natural disaster in Norway's history occurred on 21 September 1345 when the Gaula River was dammed by a massive debris slide that created a 14 km long lake. After only 2–3 d the dam breached, leading to a huge outburst flood in the Gaula Valley, burying 48 farms and killing at least 500 persons (Furseth, 2006). In 1823, a rock avalanche dammed the Frondøla River and formed the Lintuvatnet Lake (NVE, 2020). The lake still exists today, even though the dam partially breached, leading to an outburst flood in the uninhabited valley. On 26 May 1908, a 1.1 million cubic metre rock avalanche from the mountain Keipen in the Norang Valley formed a more than 20 m high dam (Fig. 1a, b). The impounded lake Lyngstøylvatnet submerged the road and several mountain farms, whose remains are still visible close to the shoreline (Furseth, 2006; Hermanns et al., 2013b).
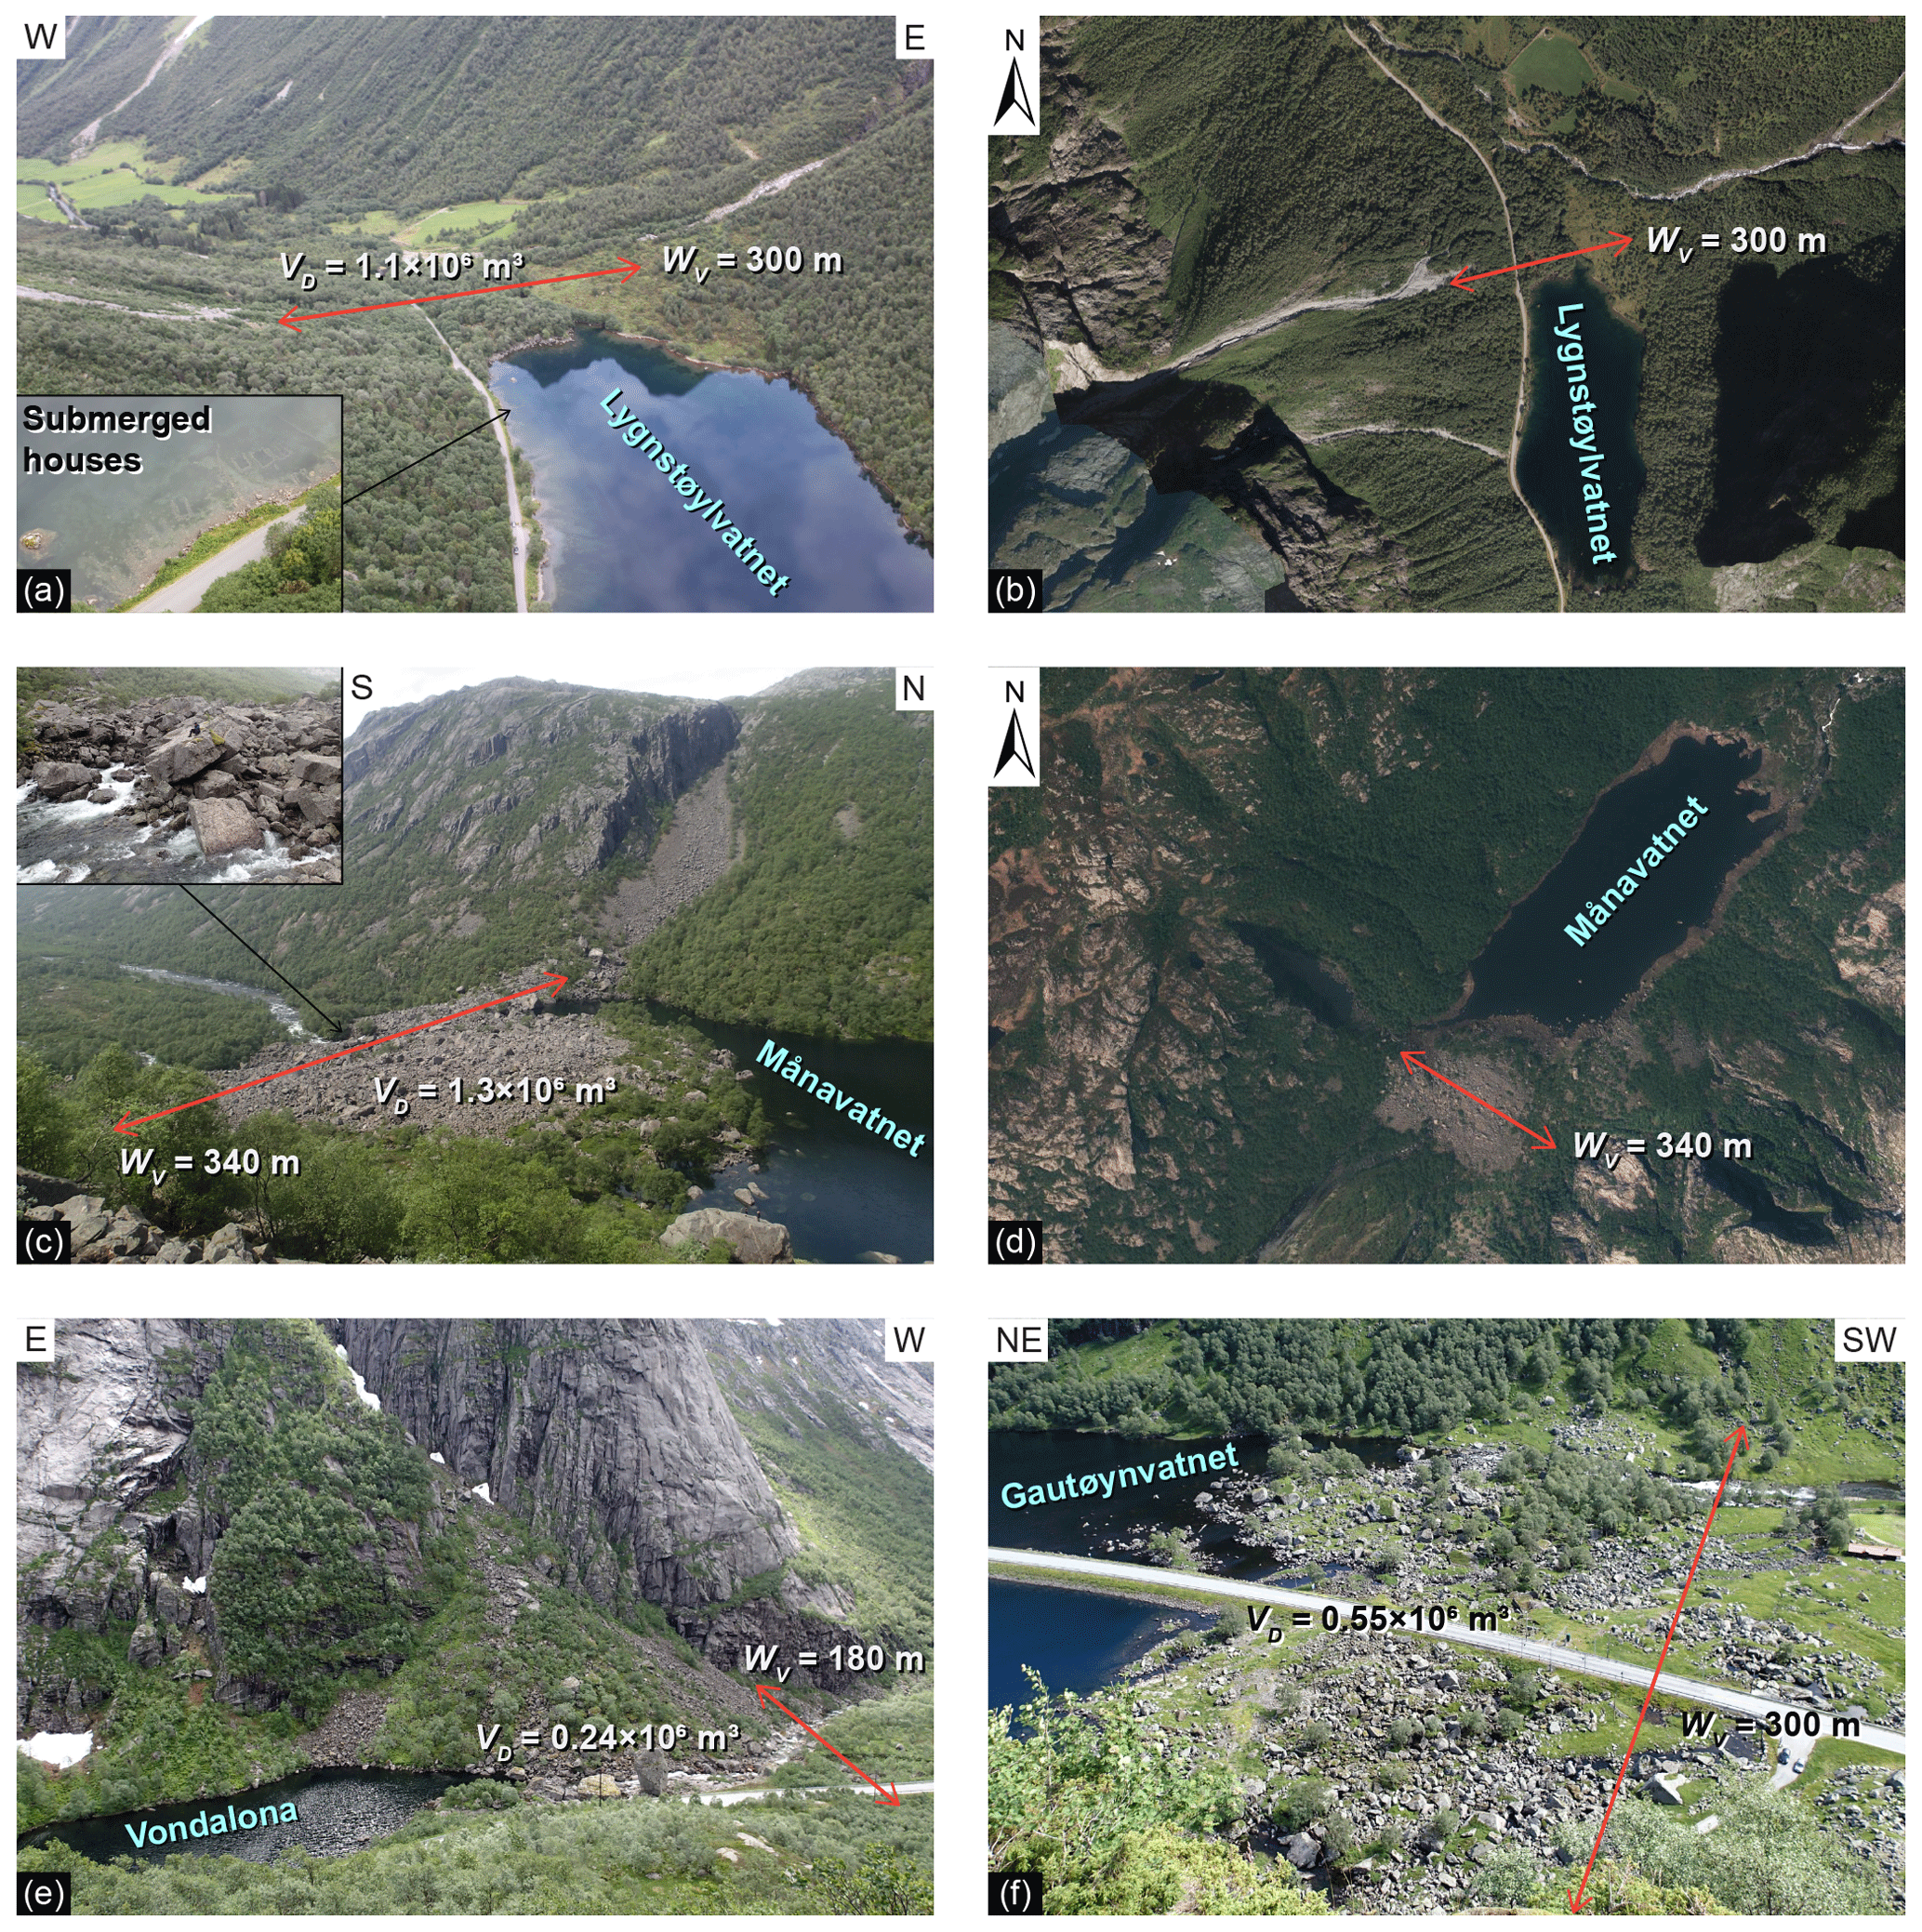
Figure 1Photographs of RSF dams in southwestern Norway with dam volume VD and valley width WV. (a) The lake Lyngstøylvatnet was created by the 1908 rock avalanche from the mountain Keipen in the west. The rock avalanche went over an existing debris cone and abutted against a debris cone on the opposite valley side, leading to a type IIb dam that is intact (dam classification by Hermanns et al., 2011b). The remains of submerged houses are visible in Lyngstøylvatnet (inset). (b) Orthophoto of Lyngstøylvatnet (Norwegian Mapping Authority, 2020b). (c) The lake Månavatnet was dammed by a 1.3×10⁶ m3 rock avalanche coming from the northwest. The type IIa dam has been stable until now with drainage through the rock avalanche deposits (inset). (d) Orthophoto of Månavatnet (Norwegian Mapping Authority, 2020b). (e) The lake Vondalona was created by a small rock avalanche in the narrow valley and the type IIc dam is partly eroded by the river. (f) The lake Gautøynvatnet is located only 3.7 km downstream of lake Vondalona and was dammed by a 0.55×10⁶ m3 rock avalanche that completely crossed the valley. The type IIa dam is partly eroded by the river.
These historic events emphasize the need of addressing the landslide damming of rivers in landslide risk analyses, including upriver and potential downriver flooding as well as landslide dam stability assessments (Hermanns et al., 2013b). Massive rock slope failures (RSFs) may generate dams tens of metres high with long-lasting and potentially catastrophic consequences. The Geological Survey of Norway systematically maps, investigates, and analyses fractured bedrock slopes that might fail catastrophically in the future (Hermanns et al., 2013a). More than 80 unstable rock slopes that during a catastrophic failure will impact and possibly dam rivers have so far been discovered in Norway (NGU, 2020) (Fig. 2b). These high numbers set the necessity for cost-effective tools to assess dam heights and dam stability for preliminary risk analyses.

Figure 2Inventory maps of dams from rock slope failures and unstable rock slopes in Norway: (a) dam inventory of southwestern Norway classified according to dam stability (modified from Jakobsen, 2015) underlain by the landform classification by Etzelmüller et al. (2007); (b) overview map of unstable rock slopes in Norway (per December 2019) that may lead to a rockslide dam in the case of catastrophic failure (data from NGU, 2020), along with the location of existing dams in northern Norway used as a validation dataset; (c) zoom on the rockslide dam clusters in Rogaland County. Rock avalanche dams discussed in the text are as follows (in blue font). Ke: Keipen; Li: Lintuvatnet; Mv: Månavatnet; Vo: Vondalona; Gv: Gautøynvatnet; La: Langfjordura; Gr: Grøtnesura; Kv: Kvarteurda; St: Steinura. Unstable rock slopes mentioned in the text are as follows (in red font). Ga: Gamanjunni; Iv: Ivasnasen; Kl: Klingråket; Ma: Mannen; Sv: Svarttinden.
The most common tool to assess landslide damming in prospective landslide hazard and risk assessments is likely numerical simulations of the landslide propagation (Hungr, 2011). Examples of such numerical models are the DAN3D code (McDougall and Hungr, 2004; Sosio et al., 2008; Hungr and McDougall, 2009; Schleier et al., 2015, 2017), the Tochnog finite-element code (Crosta et al., 2009; Tochnog Professional, 2020), or the RAMMS software suite (Christen et al., 2012). However, these models require numerous input parameters and extensive calibration to obtain reliable results, which precludes their cost-efficient use for characterization of many sites, as is required in regional studies.
Here we establish semi-empirical relationships for the rapid assessment of the maximum dam height, comparable to those developed for landslide run-out (e.g. Scheidegger, 1973; Corominas, 1996) or landslide-generated displacement waves (Oppikofer et al., 2019). We use an inventory of dams formed by rock slope failures (RSF dams) in southwestern Norway (Fig. 2a) along with other published databases on landslide dams (Ermini and Casagli, 2003; Hermanns et al., 2011a; Tacconi Stefanelli et al., 2015) to evaluate the dam height as a function of landslide volume, valley width, and dam area. This approach addresses the need for a fast assessment of possible dam formation and stability for potential future RSF, as a part of the systematic hazard and risk analysis of unstable rock slopes in Norway (Hermanns et al., 2012; Oppikofer et al., 2016a, b).
2.1 Inventory and characteristics of landslide dams
Systematic mapping of RSF dams in southwestern Norway (approximately 120 000 km2 in surface) was carried out by Jakobsen (2015) using the online orthophoto map service “Norge i bilder” (Norwegian Mapping Authority, 2020b) and its associated web map service (WMS) in a geographical information system (GIS) (Fig. 1b). This aerial photo analysis focused on present-day lakes as an indicator for possible dams, with the aim of identifying lakes that were impounded by RSF. The analysis therefore investigated the immediate downstream surroundings of lakes, looking for deposits, debris, and scars of RSF, but also debris from a possible downstream flooding due to dam breach. It must be noted that dams without a remaining lake are therefore not included in the present inventory.
The detected dams were mapped and registered in a geospatial database, and their geomorphologic characteristics were determined based on orthophotos and the national 10 m digital elevation model (DEM) (Norwegian Mapping Authority, 2020a). These dam characteristics include
-
the type of landslide that formed the dam, chiefly rock avalanches (massive RSF with several hundred thousand to millions of cubic metres in volume and high mobility) and rockslides/rockfalls (RSF with several thousand to hundred thousand of cubic metres in volume, but without high mobility) or other landslide types;
-
the morphologic dam classifications in plan view and in across-valley and along-valley profiles according to Hermanns et al. (2011b) (Fig. 3);
-
the dam dimensions including valley width WV, dam width WD, dam length LD, dam area AD, mean dam height HD.mean, maximum dam height HD.max, and dam volume VD (Fig. 4);
-
the upstream catchment area AC and the resulting dimensionless blockage index (DBI) value (Ermini and Casagli, 2003);
-
an assessment of the dam stability, i.e. whether the dam was unstable and has breached or was (partially) eroded or whether it was stable and is intact or infilled;
-
an assessment of any glacial influence on the dam, especially the initial landslide run-out onto a glacier.
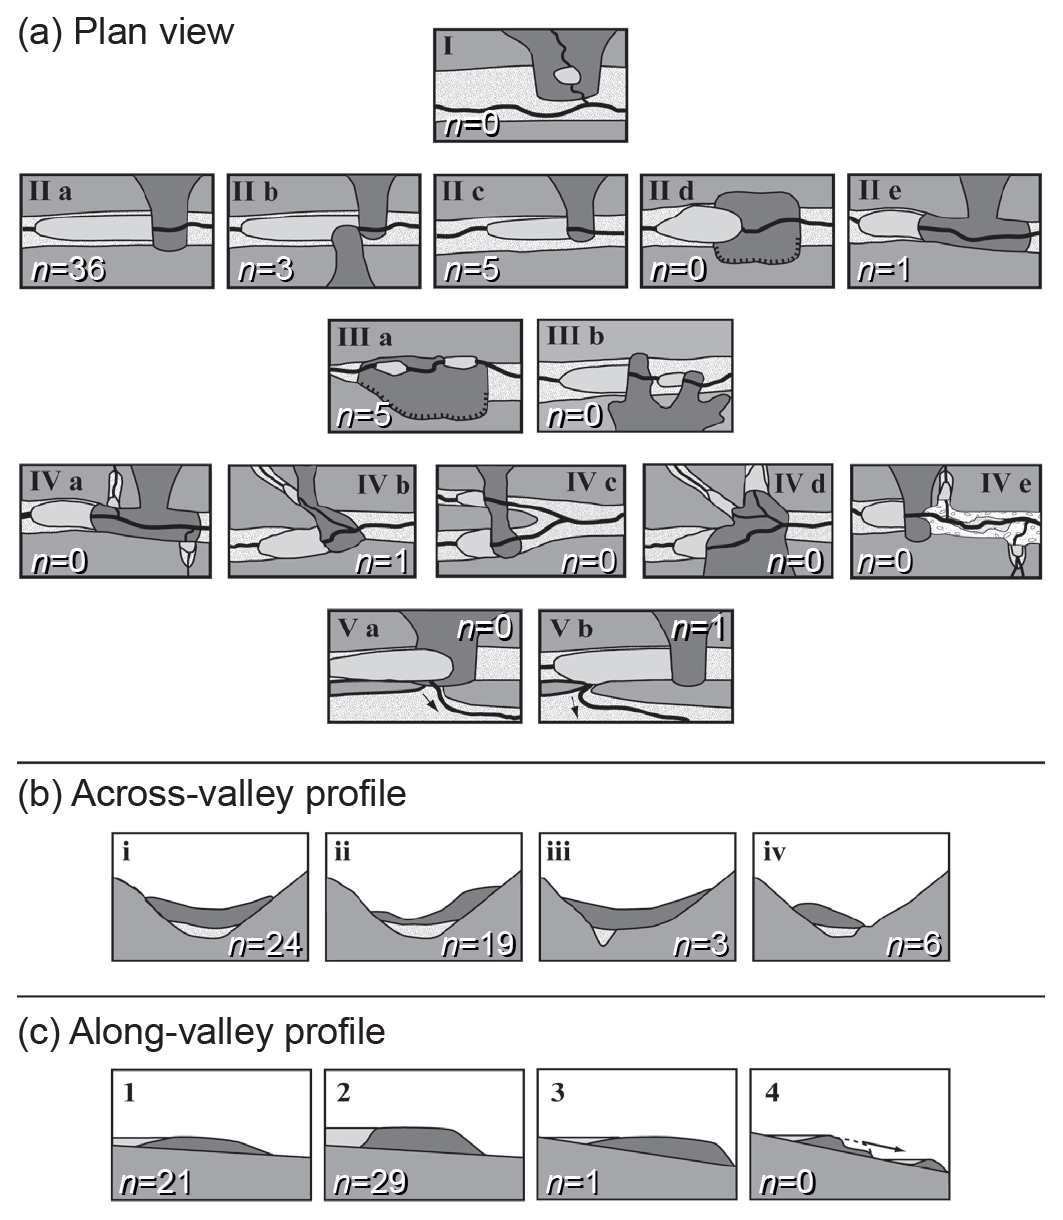
Figure 3Morphologic classification of landslide dams (modified from Hermanns et al., 2011b) with count of landslide dams in southwestern Norway: (a) in plan view, dams formed by a landslide completely crossing the valley (type IIa) are most common, followed by partial damming of the valley (type IIc) and landslide dams having multiple lakes (type IIIa); (b) in the across-valley profile, most dams are symmetrical deposits in a symmetrical valley (type i) or asymmetrical with the thickest deposits in the distal part (type ii); (c) in the along-valley profile, dams with low thickness and gentle slopes (type 1) and dams with high thickness and steep slope (type 2) are most abundant.
The dimensions of the dams were directly mapped in the GIS for valley width WV, dam width WD, dam length LD, and dam area AD (Fig. 4a), and the upstream catchment area AC was calculated using a “flow accumulation” function in GIS based on the 10 m DEM. The mean and maximum dam heights HD.mean and HD.max were estimated based on across-valley and along-valley profiles through the dam (Fig. 4b, c). On those profiles, the possible pre-event topography was extrapolated from the surrounding valley morphology, notably the steepness of the valley flanks and the valley width (Fig. 4b). In along-valley profiles the morphology prior to the dam was based on a linear interpolation between the beginning of the impounded lake and the foot of the dam (Fig. 4c).
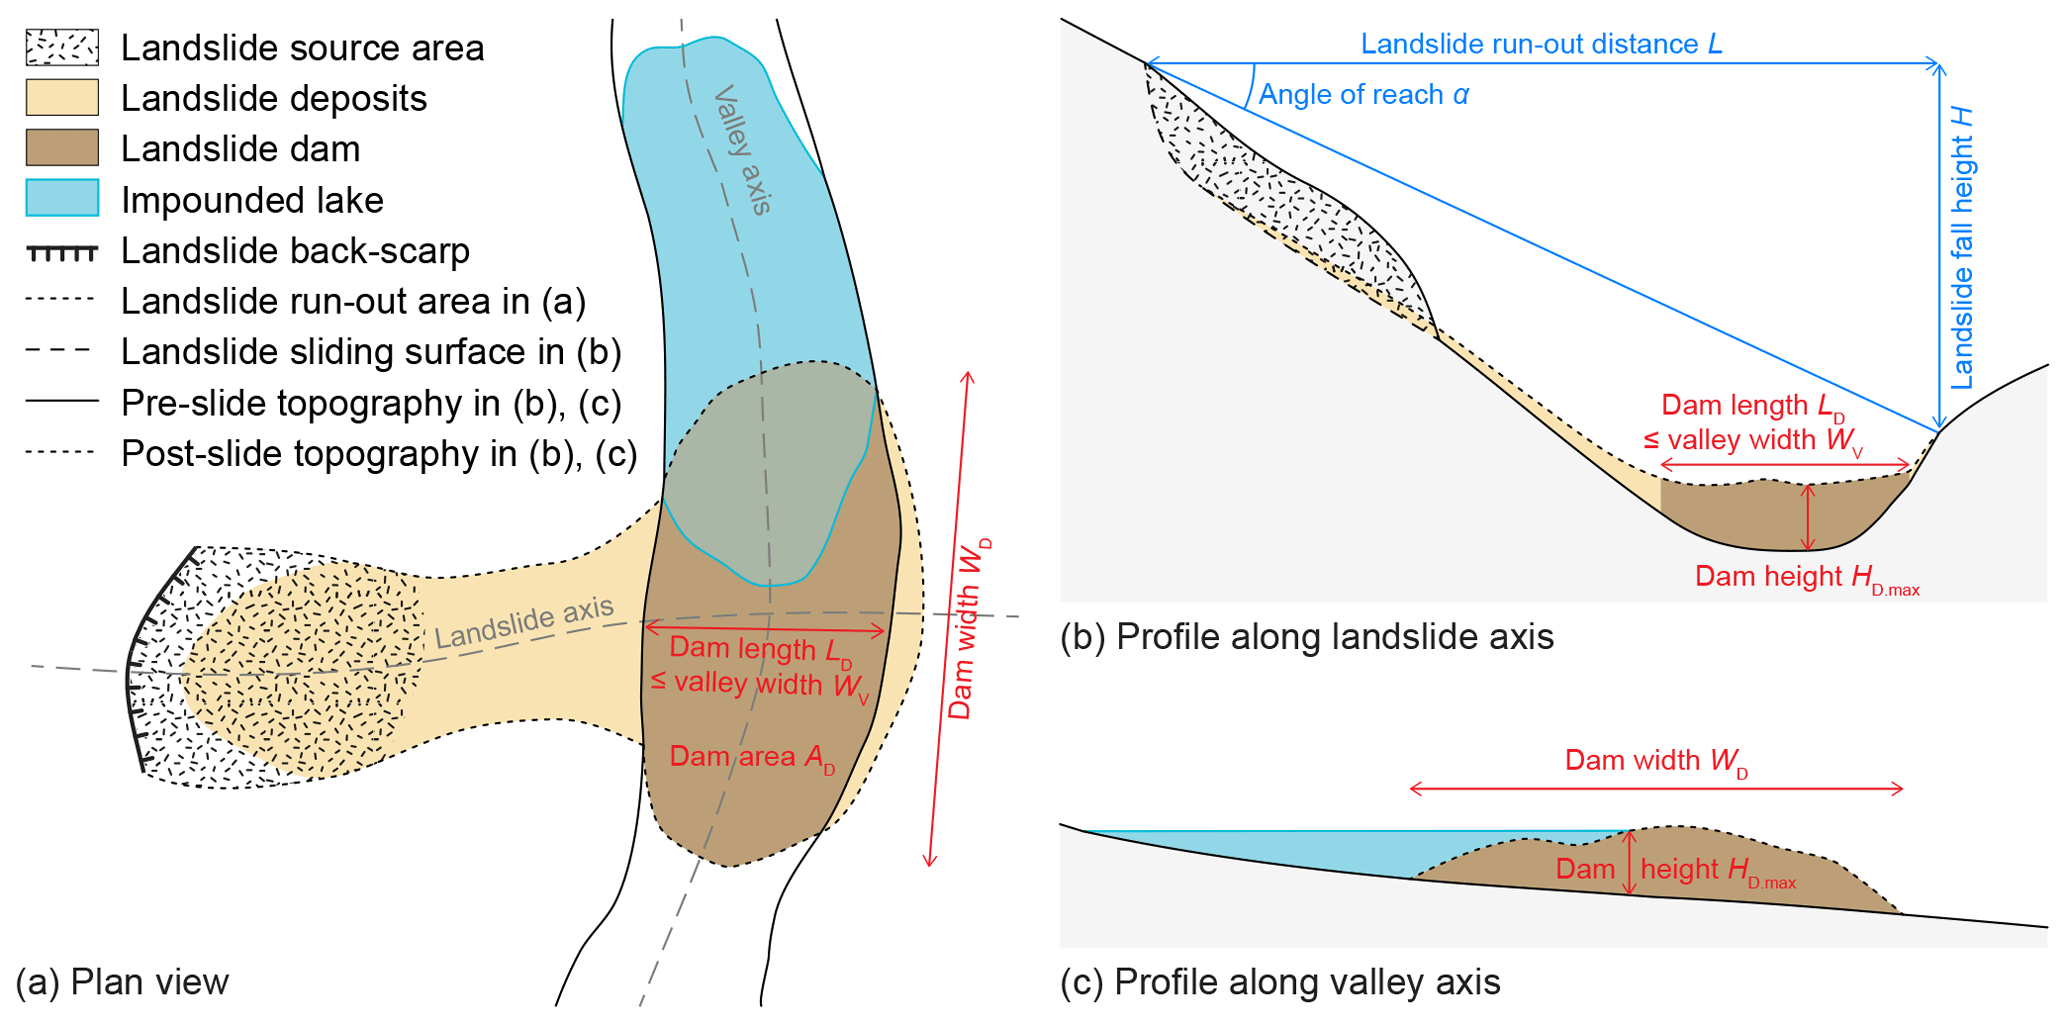
Figure 4Sketches of a landslide dam with the measured dimensions (adapted from Toccani Stefanelli et al., 2018): (a) plan view for measuring dam area AD, dam width WD, dam length LD, and valley width WV (LD=WV in case of complete damming of the valley, LD<WV in case of partial damming of the valley); (b) across-valley profile for measuring valley width WV and dam length LD and estimating maximum dam height HD.max, along with landslide fall height H, landslide run-out distance L, and angle of reach α; (c) along-valley profile for measuring dam width WD and estimating maximum dam height HD.max. The pre-landslide topography is estimated on both profiles by considering the local valley morphology.
2.2 Creation of semi-empirical relationships
We establish semi-empirical relationships by plotting the maximum dam height relative to various dam characteristics and least-square fitting of functions linking the parameters. The different units of the dam characteristics are accounted for using dimensional analysis. The dam volume VD, dam area AD, and valley width WV were revealed to be the most relevant dam parameters influencing the maximum dam height HD.max, whereas no meaningful correlations were found for other dam characteristics.
We assess the inherent uncertainties in the obtained relationships by computing the ratio (ρ) between the measured and predicted maximum dam heights. We then fit cumulative frequency distributions of these ratios using lognormal functions to determine the 95th percentile (ρ95). The ratio ρ95 yields the upper bound of the 90 % prediction interval, meaning that approximately 5 % of the measured maximum dam heights exceed the predicted values by a factor of ρ95 or more.
The dam morphology certainly influences HD.max; it is however difficult to predict without detailed modelling studies (see Sect. 2.3), which are beyond the scope of regional studies, for which these semi-empirical relationships are intended. Furthermore, detailed modelling studies most often also include detailed numerical run-out modelling. These run-out models generally provide the thickness of deposits and thus the expected maximum dam height, making the semi-empirical relationships superfluous for detailed local studies.
2.3 Numerical run-out modelling of rock slope failures
As mentioned in Sect. 2.2, detailed numerical run-out modelling is beyond the scope of regional studies. For this study, however, we used numerical run-out modelling of RSF as a validation dataset of our semi-empirical relationships. The Tochnog finite-element code was used to model the potential run-out of the unstable rock slope Mannen (Dahle et al., 2011), whereas DAN3D was applied at Ivasnasen, Klingråket, Svarttinden, and Gamanjunni (Böhme et al., 2016) (Fig. 2b). The reader is referred to the above-mentioned publications for complete descriptions of the modelling approach, underlying equations, required input data, and parameters.
A range of parameters is tested in prospective studies of run-out modelling of RSF: Böhme et al. (2016), for example, modelled the run-out of the Gamanjunni rockslide in DAN3D using a Voellmy rheology for the slide mass with various friction coefficients (ranging between 0.05 and 0.10) and turbulence coefficients (from 500 to 800 ms−2). Depending on the chosen parameters, the slide mass spreads differently over the valley bottom, giving a range of possible run-out areas and associated thickness of deposits. Plausible models are chosen by expert knowledge and then combined into a final model of the deposit thickness, using for example the maximum of thickness of all retained model runs. The maximum dam height HD.max, which is used for comparison with empirically predicted ones, corresponds to the deposit thickness at the location where dam overtopping might occur. That location is computed in a GIS using a “fill” function based on the computed post-slide DEM.
2.4 Prediction of dam height and stability
The semi-empirical relationships linking HD.max to relevant parameters are used to predict the dam height for future RSF that could dam a river. The dam height HD.max gets added to the elevation of the riverbed to find the possible elevation of the dammed lake. The extent of the impounded lake is obtained by computing the contour line of the lake elevation in the area upstream to the landslide dam.
We use the dimensionless blockage index DBI (Ermini and Casagli, 2003) as a proxy to estimate the likelihood of a dam breach. Low DBI values depict landslide dams that are most likely stable, whereas a high DBI indicates probably unstable dams. We divide the inventory of RSF dams in southwestern Norway and other inventories (Ermini and Casagli, 2003; Hermanns et al., 2011a; Tacconi Stefanelli et al., 2015) into bins of DBI values containing 10–12 dams each and calculate the proportion of unstable dams for each bin. We then use these proportions to fit a linear function between the lower limit DBIlower below which dams are considered stable and the upper limit DBIupper above which dams are deemed unstable. In the transition zone between the lower and upper limits, the likelihood of a dam failure pf increases linearly (Eq. 1).
A total of 69 landslide dams are mapped in southwestern Norway (Fig. 2a). Thirty-eight dams were formed by rock avalanches, 29 by rockslides, and 2 by debris flows. We discarded those generated by debris flows from further analyses because the aim of these empirical relationships is to determine the maximum dam height of future RSF.
The frequency of rock avalanches in Norway was highest shortly after the last deglaciation, i.e. between 14 000 and 10 000 years BP depending on the location (e.g. Böhme et al., 2015; Hermanns et al., 2017). We therefore assume that most of the RSF dams in southwestern Norway were also formed shortly after the retreat of the Scandinavian ice sheet. However, three dams are most likely influenced by glaciers, notably by depositing on decaying glaciers or on dead-ice bodies in the valley. For 10 other dams such a glacial influence is possible. We excluded these 13 dams from further analyses because their dimensions may have been altered by glaciers and are thus not representative for the present-day situation.
According to the landform classification by Etzelmüller et al. (2007), most of the 54 remaining dams are in regions with “extreme alpine relief with over-deepened glacial valleys” or in “high palaeic mountain regions with glacial incisions” (Fig. 2a). In Rogaland County in southern Norway several clusters of RSF dams are observed in the landform types “glacially scoured low mountains and valleys” and “mountain plateaus” (Fig. 2c). These clusters are closely related to WSW–ENE-trending faults (Gabrielsen et al., 2002), forming escarpments that are prone to RSF. Twenty-one dams are intact with a dammed lake and 10 other dams are filled by sediments except a small residual lake. On the side of unstable dams, 16 dams are classified as eroded because no deposits of an outburst flood are visible, and seven dams have failed and likely led to an outburst flood as suggested by related deposits downriver.
The morphologic dam classification in plan view according to Hermanns et al. (2011b) reveals that most dams are formed by a RSF completely crossing the valley (type IIa, n=36) (Fig. 3a). Partial damming of the valley by a RSF occurred in five cases (type IIc), and five dams have multiple lakes (type IIIa). The across-valley profiles can be classified as symmetrical deposits in a symmetrical valley in 24 cases (type i) and as asymmetrical with the thickest deposits in the distal part in 19 cases (type ii) (Fig. 3b). The classification of the along-valley profiles reveals 21 dams with low thickness and gentle slopes (type 1) due to the absence of constraints in the valley morphology (Hermanns et al., 2011b) and 29 dams with high thickness and steep slope (type 2) in a confined valley setting (Fig. 3c).
Table 1 summarizes the dimensions of the RSF dams in the inventory. The dam length LD ranges from 45 to 1600 m with a median length of 200 m, whereas the dam width WD tends to be larger by a factor of 1.7 (median of ratio WD∕LD) and ranges from 45 to 2800 m with a median width of 330 m. The dam area covers 3 orders of magnitude with values between 5000 m2 and 2.7 km2 with a median of 53 000 m2 . The maximum dam heights HD.max vary between 5 and 210 m, whereas the mean dam heights HD.mean vary between 2 and 113 m. The median dam heights are 21 and 12 m for HD.max and HD.mean, respectively. The dam volume VD computed as the product of AD and HD.mean, spans 5 orders of magnitude (12 000 m3 to 135×106 m3 ). The median dam volume is approximately 1.0×10⁶ m3 . The cumulative distributions of these dam dimensions can all be fitted by lognormal distributions with very high correlation coefficients (r2>0.95 except for WD) (Table 1).
Table 1Descriptive statistics of RSF dam dimensions in southwestern Norway and lognormal distributions matching the cumulative frequency distributions of the dimensions.

We created semi-empirical relationships for the 54 RSF dams in southwestern Norway that were not influenced by glaciers. First, we linked the maximum dam height HD.max (in metres) to the dam volume VD (in 106 m3 ) (Fig. 5) by fitting a power-law function (Eq. 2):
The exponent of 1∕3 is given by dimensional analysis, whereas the scale factor of 24.5 was fitted with a high correlation coefficient r2 of 0.73. The ratio ρ between the measured and predicted maximum dam heights ranges from 0.46 to 1.94, and its cumulative frequency distribution can be fitted by a lognormal distribution. The 95th percentile of this distribution (ρ95=1.81) yields the upper bound of the 90 % prediction interval of Eq. (2). This implies that approximately 5 % of RSF dams in southwestern Norway have a maximum height exceeding the predicted value by 81 % or more.
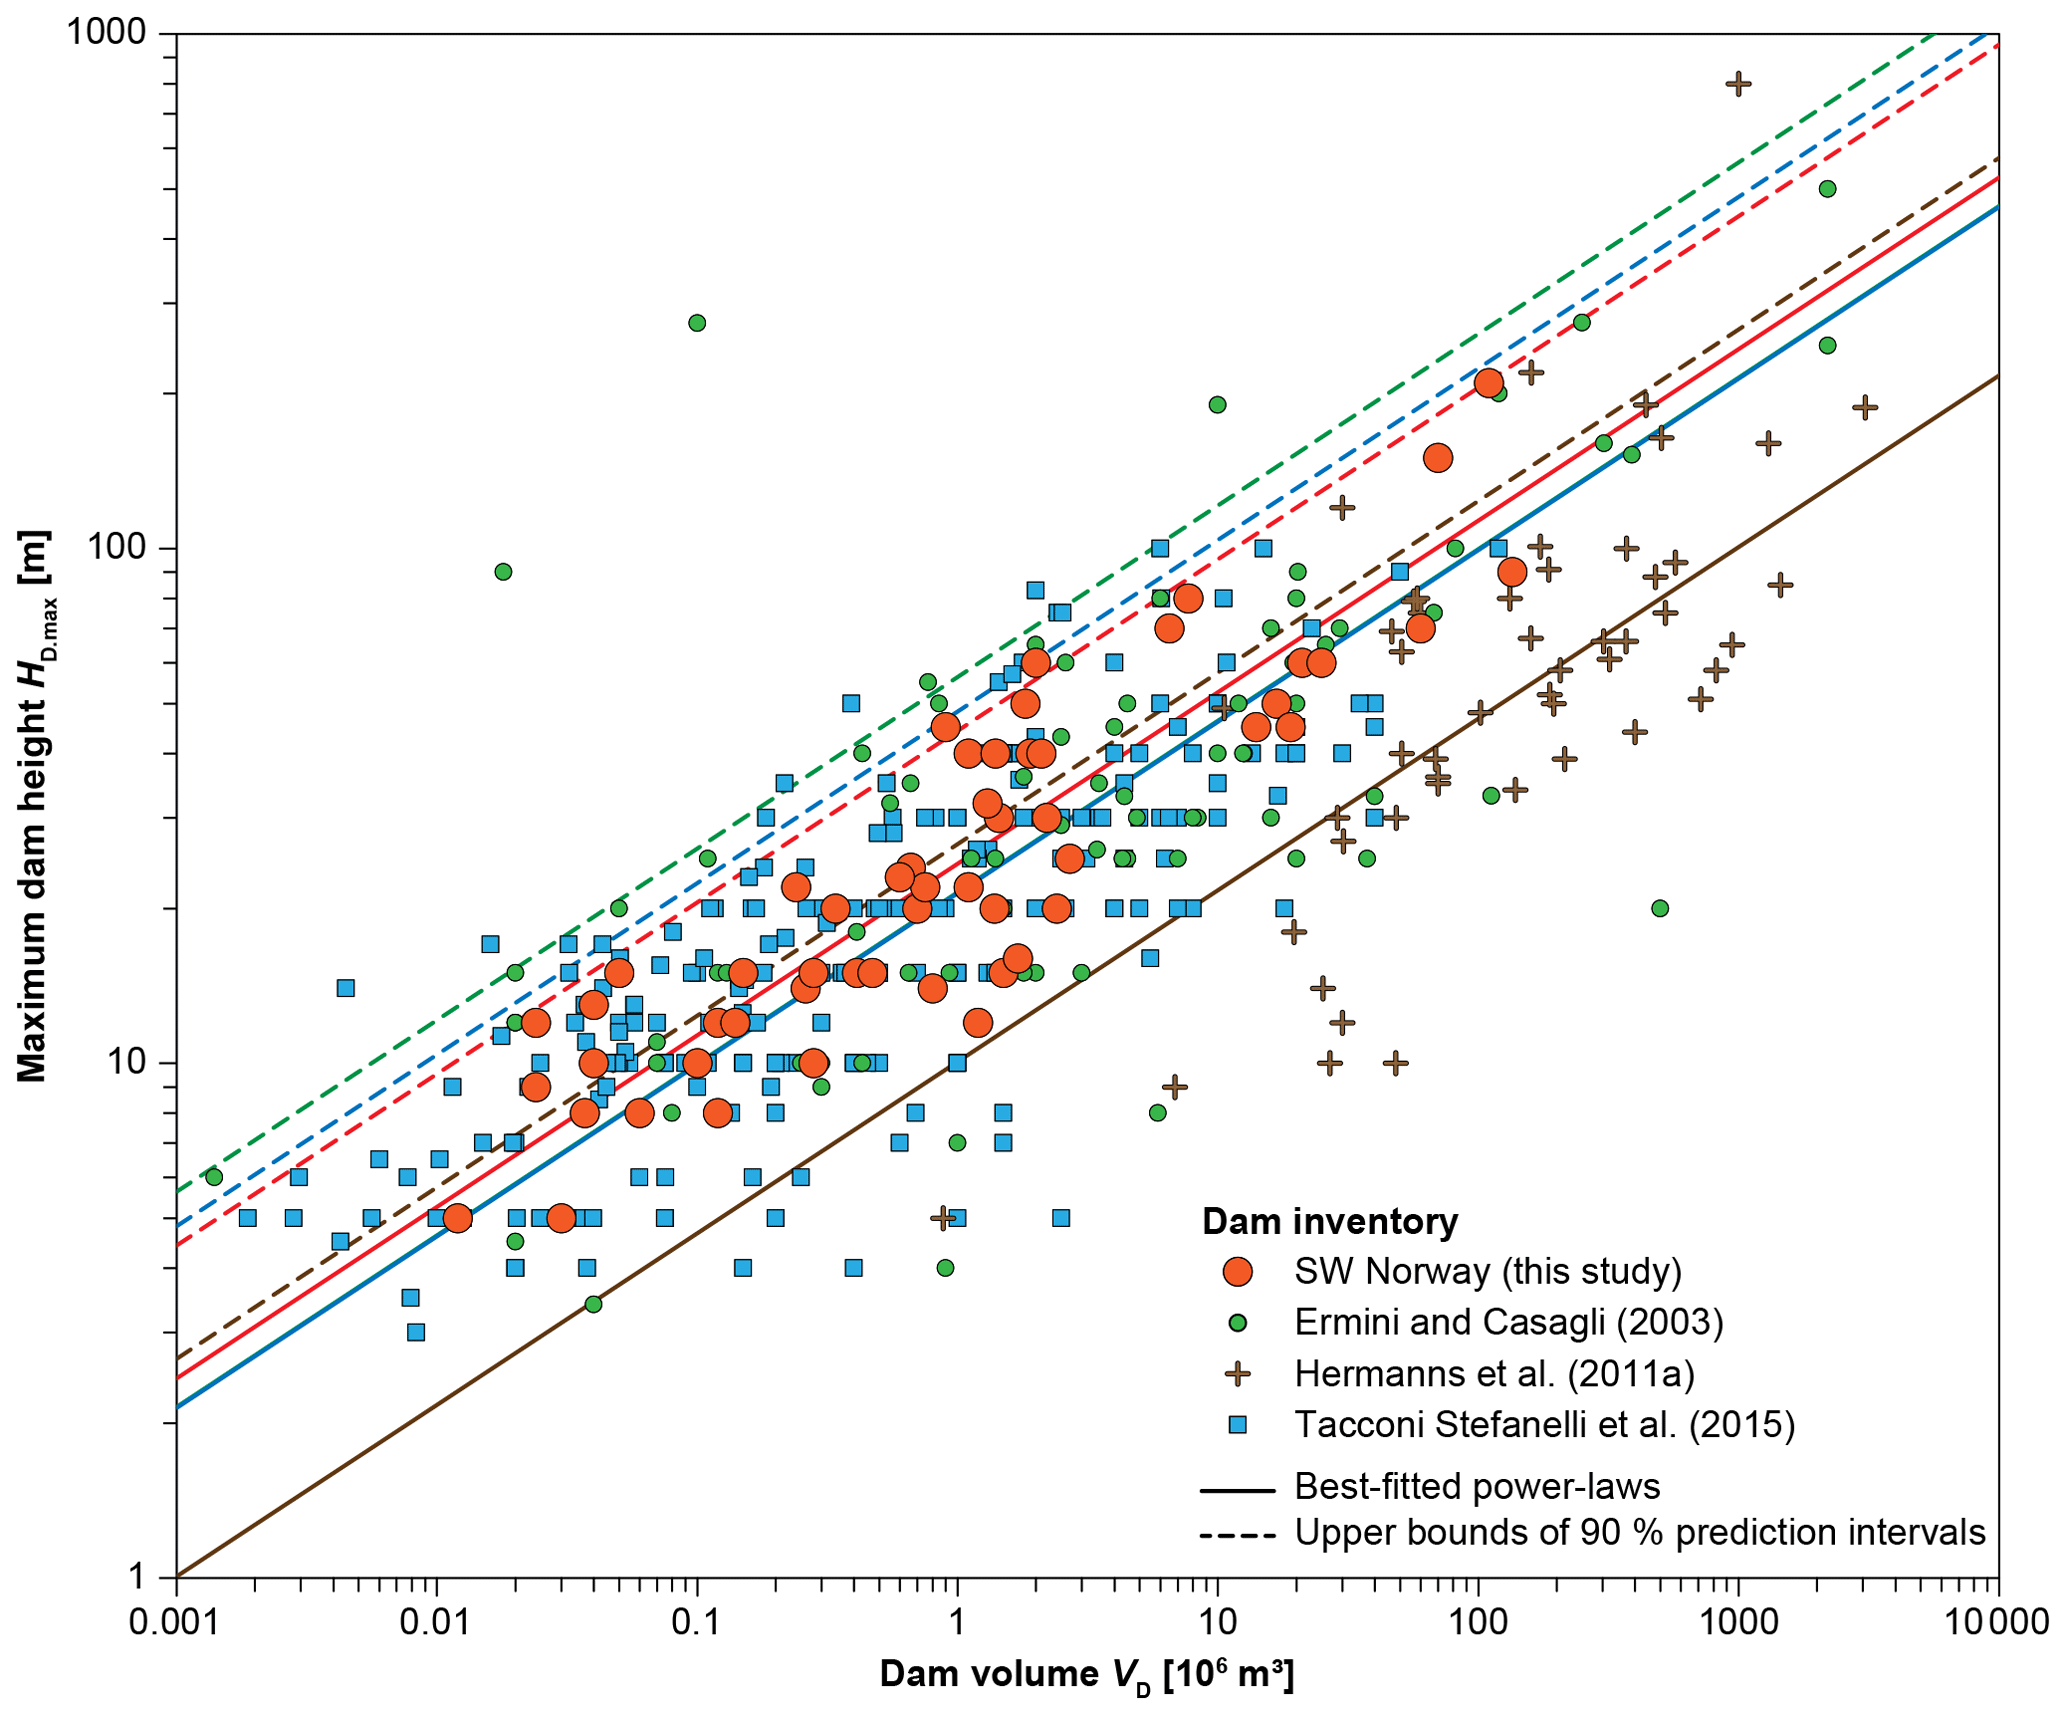
Figure 5Relationship between maximum dam height HD.max and dam volume VD (106 m3) for RSF dams in southwestern Norway (data from Jakobsen, 2015), compared to datasets from Ermini and Casagli (2003), Hermanns et al. (2011a), and Tacconi Stefanelli et al. (2015). The maximum dam heights increase with dam volume according to power-law distributions as in Eq. (2) with scale factors as in Table 2 (with colours matching the point symbols).
Table 2Fitting parameters of the semi-empirical relations for different studies.
Similar power-law functions can be derived from datasets from other studies (Ermini and Casagli, 2003; Hermanns et al., 2011a; Tacconi Stefanelli et al., 2015), with different scale factors, however (Table 2). The scale factor of landslide dams in the Andes (Hermanns et al., 2011a) is much lower than those from other studies (10.1 vs. 21.5 to 24.5). Compared to our inventory, other databases have a larger spread of the data indicated by higher ρ95 values (Table 2).
Power-law functions are commonly used in landslide studies to relate the landslide volume to landslide frequency (e.g. Dussauge et al., 2003; Guzzetti et al., 2003), but also other landslide characteristics, such as landslide area (e.g. Hovius, 1997). Similarly, the relationship between landslide volume and Fahrböschung, i.e. the ratio between the landslide fall height and travel distance, can be fitted by power-law functions (e.g. Scheidegger, 1973; Nicoletti and Sorriso-Valvo, 1991; Erismann and Abele, 2001; De Blasio, 2011). Furthermore, Oppikofer et al. (2019) found a power-law function linking the run-up height of landslide-generated displacement waves to the landslide volume and distance from impact.
Regarding the influence of the morphologic dam classification on the dam height (Table 2), dams classified as asymmetrical with the thickest deposits in the distal part (type ii in across-valley profile) are higher than dams with symmetrical deposits in a symmetrical valley (type i) but smaller than those partially blocking a valley (type iv). In along-valley profiles, type 2 dams with high thickness and steep slope are higher than type 1 dams with low thickness and gentle slopes. Too few data are available for the other dam types in along- or across-valley profiles and in plan view.
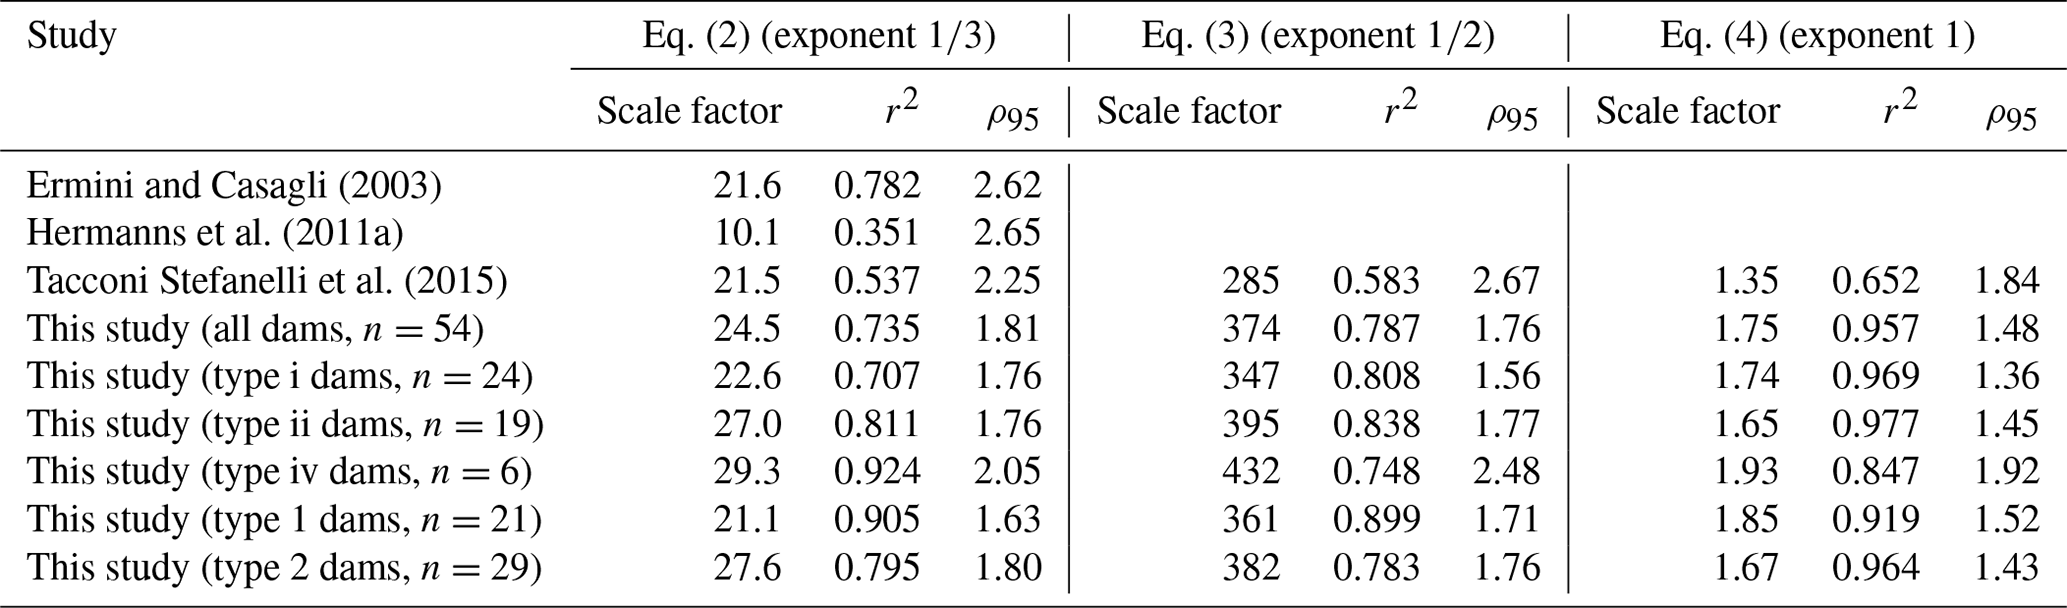
In narrow valleys the RSF deposits are more confined, leading to thicker deposits and thus to a higher dam compared to wide valleys where the deposits are unconfined and spread out over a larger surface. We therefore calculated ratio VD (in 106 m3) over valley width WV (in metres) and fitted the following power law with the exponent given by dimensional analysis (Fig. 6, Eq. 3):
The ratio ρ between the measured and predicted maximum dam heights ranges from 0.52 to 2.36. The 95th percentile of the lognormal distribution fitted to the cumulative frequency distribution of ρ equals 1.76 (ρ95). This value is slightly smaller than for Eq. (2) (ρ95=1.81). Amongst the other landslide dam inventories, only Tacconi Stefanelli et al. (2015) state WV. Fitting that dataset with Eq. (3) yields a lower scale factor of 285 and a much higher spread in values testified by lower r2 and higher ρ95 values (Fig. 6, Table 2).
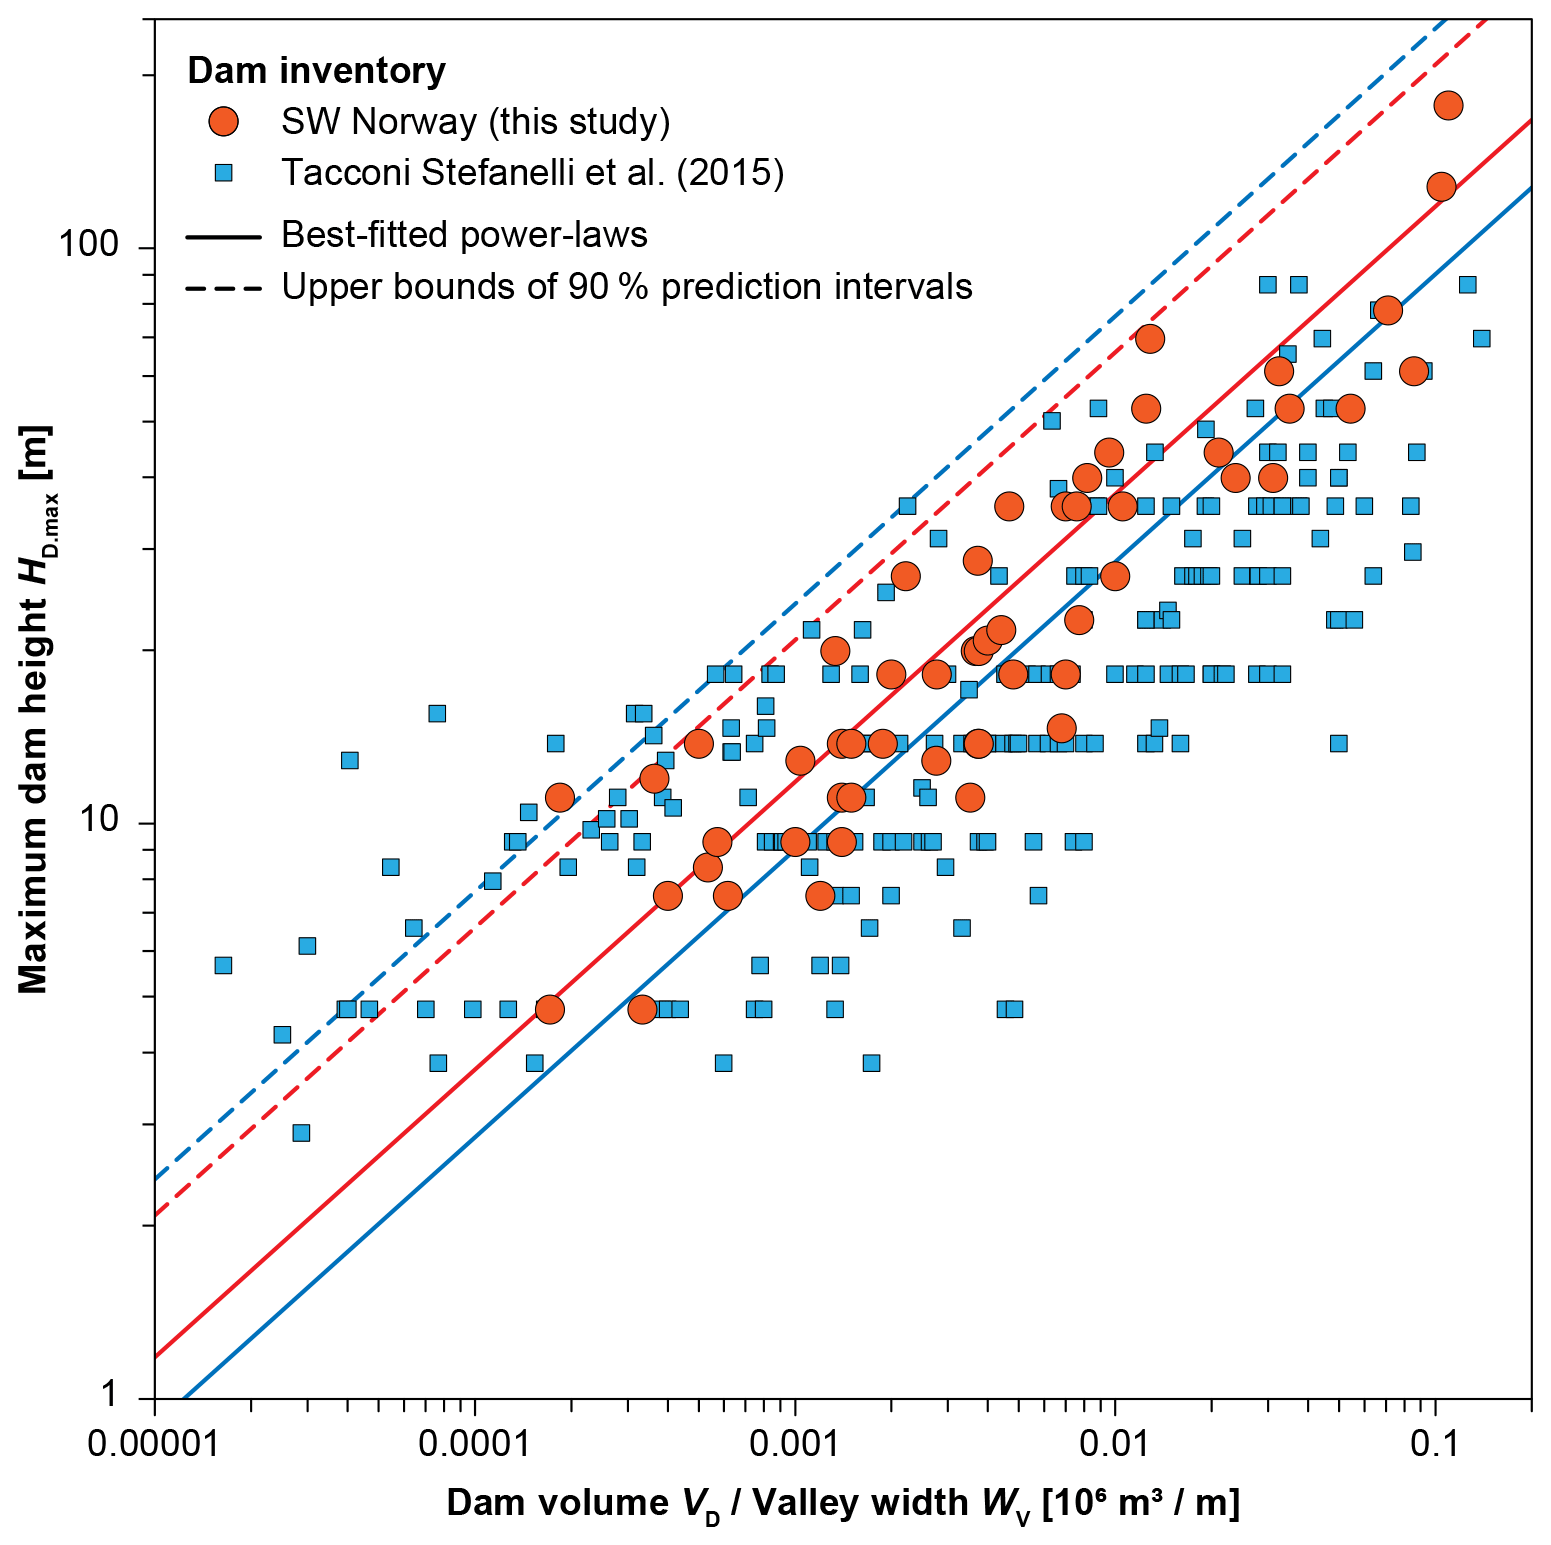
Figure 6Relationship between maximum dam height HD.max and the ratio between dam volume VD (in 106 m3) and valley width WV (in metres) for RSF dams in southwestern Norway (data from Jakobsen, 2015), compared to the dataset from Tacconi Stefanelli et al. (2015). HD.max increases with VD∕WV according to power-law distributions as in Eq. (3) with scale factors as in Table 2 (with colours matching the point symbols).
Equation (3) has the expected behaviour with an increase in HD.max for higher volumes and a decrease for wider valleys. The lateral spreading of the landslide deposits in the valley is, however, not accounted for. This could be achieved by including the dam width WD as an additional parameter in a semi-empirical relationship. However, WD is not independent from VD and is not easily predictable when using the semi-empirical equations to forecast the dam height for future landslides, except if the run-out area is known. In that case, the dam area AD (in square kilometres) can be assessed, and the average dam height HD.mean (in metres) can be computed as the ratio VD∕AD as an alternative proxy. For the RSF dams in southwestern Norway, HD.max (in metres) increases linearly with HD.mean (Fig. 7, Eq. 4):
The ratio ρ ranges from 0.57 to 1.72 with a value of ρ95 of 1.48 (lognormal distribution). This implies that approximately 5 % of landslide dams in southwestern Norway have a maximum height exceeding the predicted value by 48 % or more. Both the range of ρ and its 95th percentile are significantly smaller than for the other semi-empirical relationships. Again, only the database by Tacconi Stefanelli et al. (2015) contains AD for few dams. However, we calculated AD from the published dam width WD and dam length LD assuming an elliptic shape of the landslide dam. Using those calculated dam areas in Eq. (4) provides a scale factor of 1.35 (Fig. 7, Table 2). Lower r2 and higher ρ95 values (0.65 and 1.84, respectively) indicate again a larger spread of the data compared to the inventory of RSF dams in southwestern Norway.
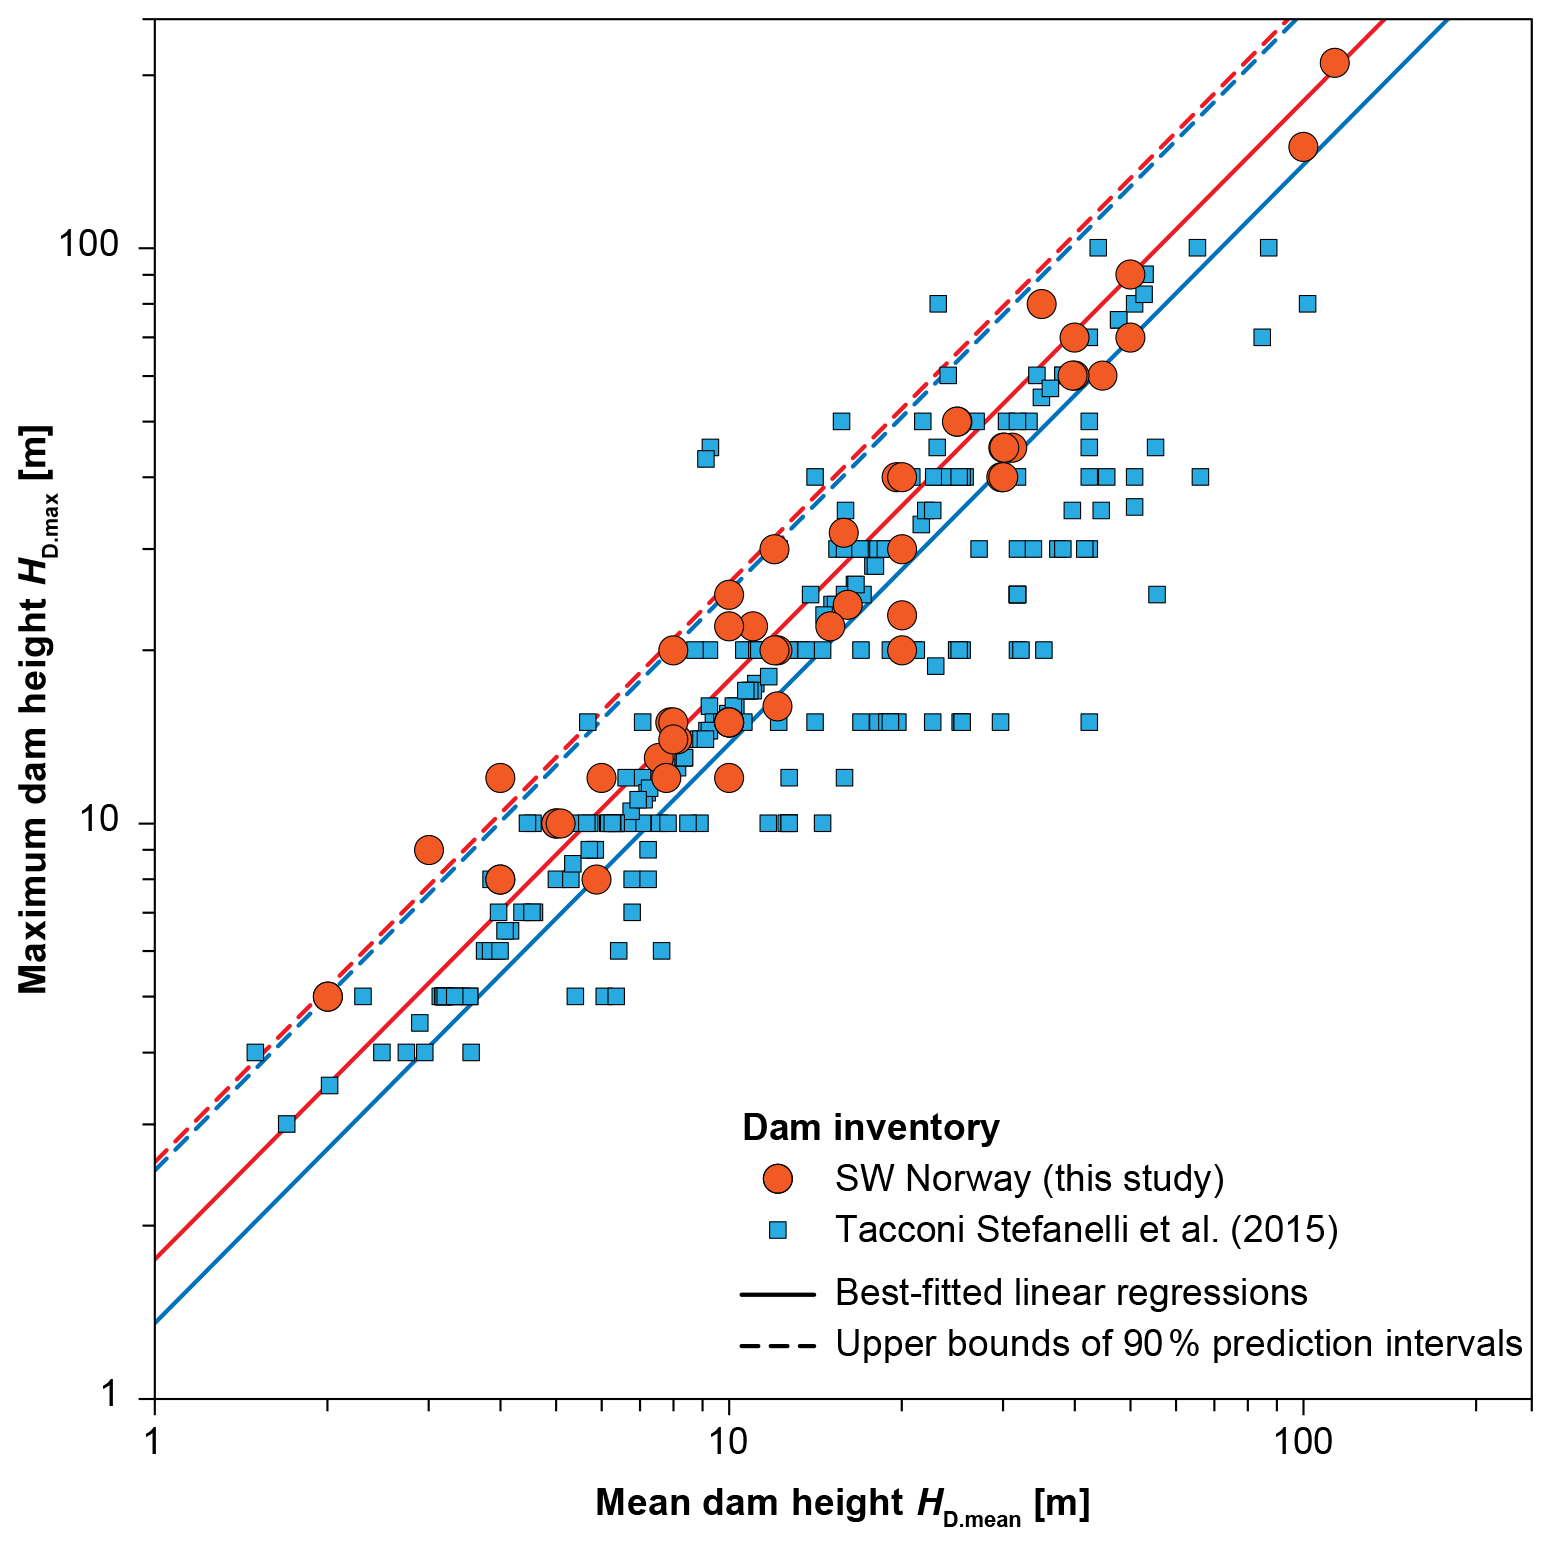
Figure 7Linear relationship between maximum dam height HD.max and mean dam height HD.mean for RSF dams in southwestern Norway (data from Jakobsen, 2015), compared to the dataset from Tacconi Stefanelli et al. (2015). Linear regressions are as in Eq. (4) with scale factors as in Table 2, and the upper bounds of the 90 % prediction intervals are shown with colours matching the point symbols.
Figure 8The dimensionless blockage index (DBI) for RSF dams in southwestern Norway: (a) the ratio dam volume VD∕ maximum dam height HD.max is plotted against the upstream catchment area AC for stable and unstable dams, along with the lower and upper DBI limits from Ermini and Casagli (2003), Tacconi Stefanelli et al. (2015), and this study separating the stability domain from the instability domain with a transition zone in between; (b) proportions of unstable dams for bins of DBI values (each containing 10–12 landslide dams) for different inventories along with their DBI limits (see legend in a); (c) for the combined inventory of landslide dams (Ermini and Casagli, 2003; Tacconi Stefanelli et al., 2015, and our dataset) the proportion of unstable dams increases with DBI. A linear function is used between DBI values of 1.2 and 5.0 to assess the likelihood of a dam failure pf.
Ermini and Casagli (2003) created the DBI as a proxy to assess the stability of landslide dams (Eq. 5):
with the upstream catchment area AC in square kilometres, the dam volume VD in 106 m3, and the maximum dam height HD.max in metres. Ermini and Casagli (2003) found a lower DBI limit (DBIlower) of 2.75 below which most landslide dams in their inventory are stable and an upper DBI limit (DBIupper) of 3.08 above which most dams are unstable. A similar assessment of RSF dams in southwestern Norway (Fig. 8a) leads to the following observations: (a) one dam with a DBI of 2.33 has failed, but there is also an eroded dam with a DBI of 2.17; (b) there are several stable dams with a DBI >3.95, yet most dams with a DBI >3.38 have failed or were eroded; (c) the proportion of unstable dams increases with the DBI (Fig. 8b) with however a significant drop for high DBI values in our inventory. Other inventories (Ermini and Casagli, 2003; Hermanns et al., 2011a; Tacconi Stefanelli et al., 2015) show the same tendency with similar proportions of unstable dams for similar bins of DBI values. Landslide dams in the Andes (Hermanns et al., 2011a) have, however, higher proportions of unstable dams for given DBI values compared to landslide dams in other regions (Fig. 8b). We have therefore not considered the Andean inventory in the joint analysis of dam stability for which we combined the different inventories and divided the dataset again in bins of DBI values containing 20 dams each (Fig. 8c). This histogram can be fitted by a linear regression to obtain DBIlower=1.2 and DBIupper=5.0 used in Eq. (1) to assess the likelihood of a dam failure pf.
6.1 Prediction of maximum dam height
We use the semi-empirical relationships (Eqs. 2, 3, and 4) to predict the maximum dam height generated by a future rock slope failure damming a valley. We thereby use the following assumptions and methods.
-
The dam volume VD is equal to the slide volume VS times a bulking factor of 1.25 (25 % volume increase due to fracturing of the rock mass and porosity of the deposits) (Hungr and Evans, 2004). This implies that the entire volume reaches the valley and forms the dam. This is obviously the worst-case scenario as shown by Ermini and Casagli (2003) with an average ratio VD∕VS of 40 % for rainfall-triggered landslides and 57 % for earthquake-triggered landslides. In Norway, however, numerical run-out modelling for the six unstable rock slopes used for the validation of the semi-empirical relationships (see Table 3) shows that in general ca. 90 % of VS reaches the valley bottom to form a dam.
-
The valley width WV used in Eq. (3) is measured on a cross section along the centre line of the run-out area and roughly perpendicular to the valley axis restricted to the flat valley bottom, i.e. slope angles smaller than 10∘.
-
The dam area AD used in Eq. (4) is assessed iteratively based on the run-out area, which can be assessed using simple modelling tools, such as the Fahrböschung or angle of reach (Scheidegger, 1973; Corominas, 1996) implemented in the software CONEFALL (Jaboyedoff and Labiouse, 2011) or the software Flow-R (Horton et al., 2013; Oppikofer et al., 2016a, b) (Fig. 9): (a) as a first approximation of AD we use the run-out area in the flat valley bottom to compute HD.max; (b) we then clip the run-out area to this first approximation of the dam elevation (elevation of the valley floor plus HD.max) to obtain a new approximation of AD, which in turn is used in Eq. (4) for a new estimation of HD.max; (c) this procedure is repeated until the difference between successive estimations of HD.max is smaller than a threshold of 1 m.
The area of the impounded lake corresponds to the contour line of the estimated dam elevation (elevation of the valley floor plus HD.max) (Fig. 9a).
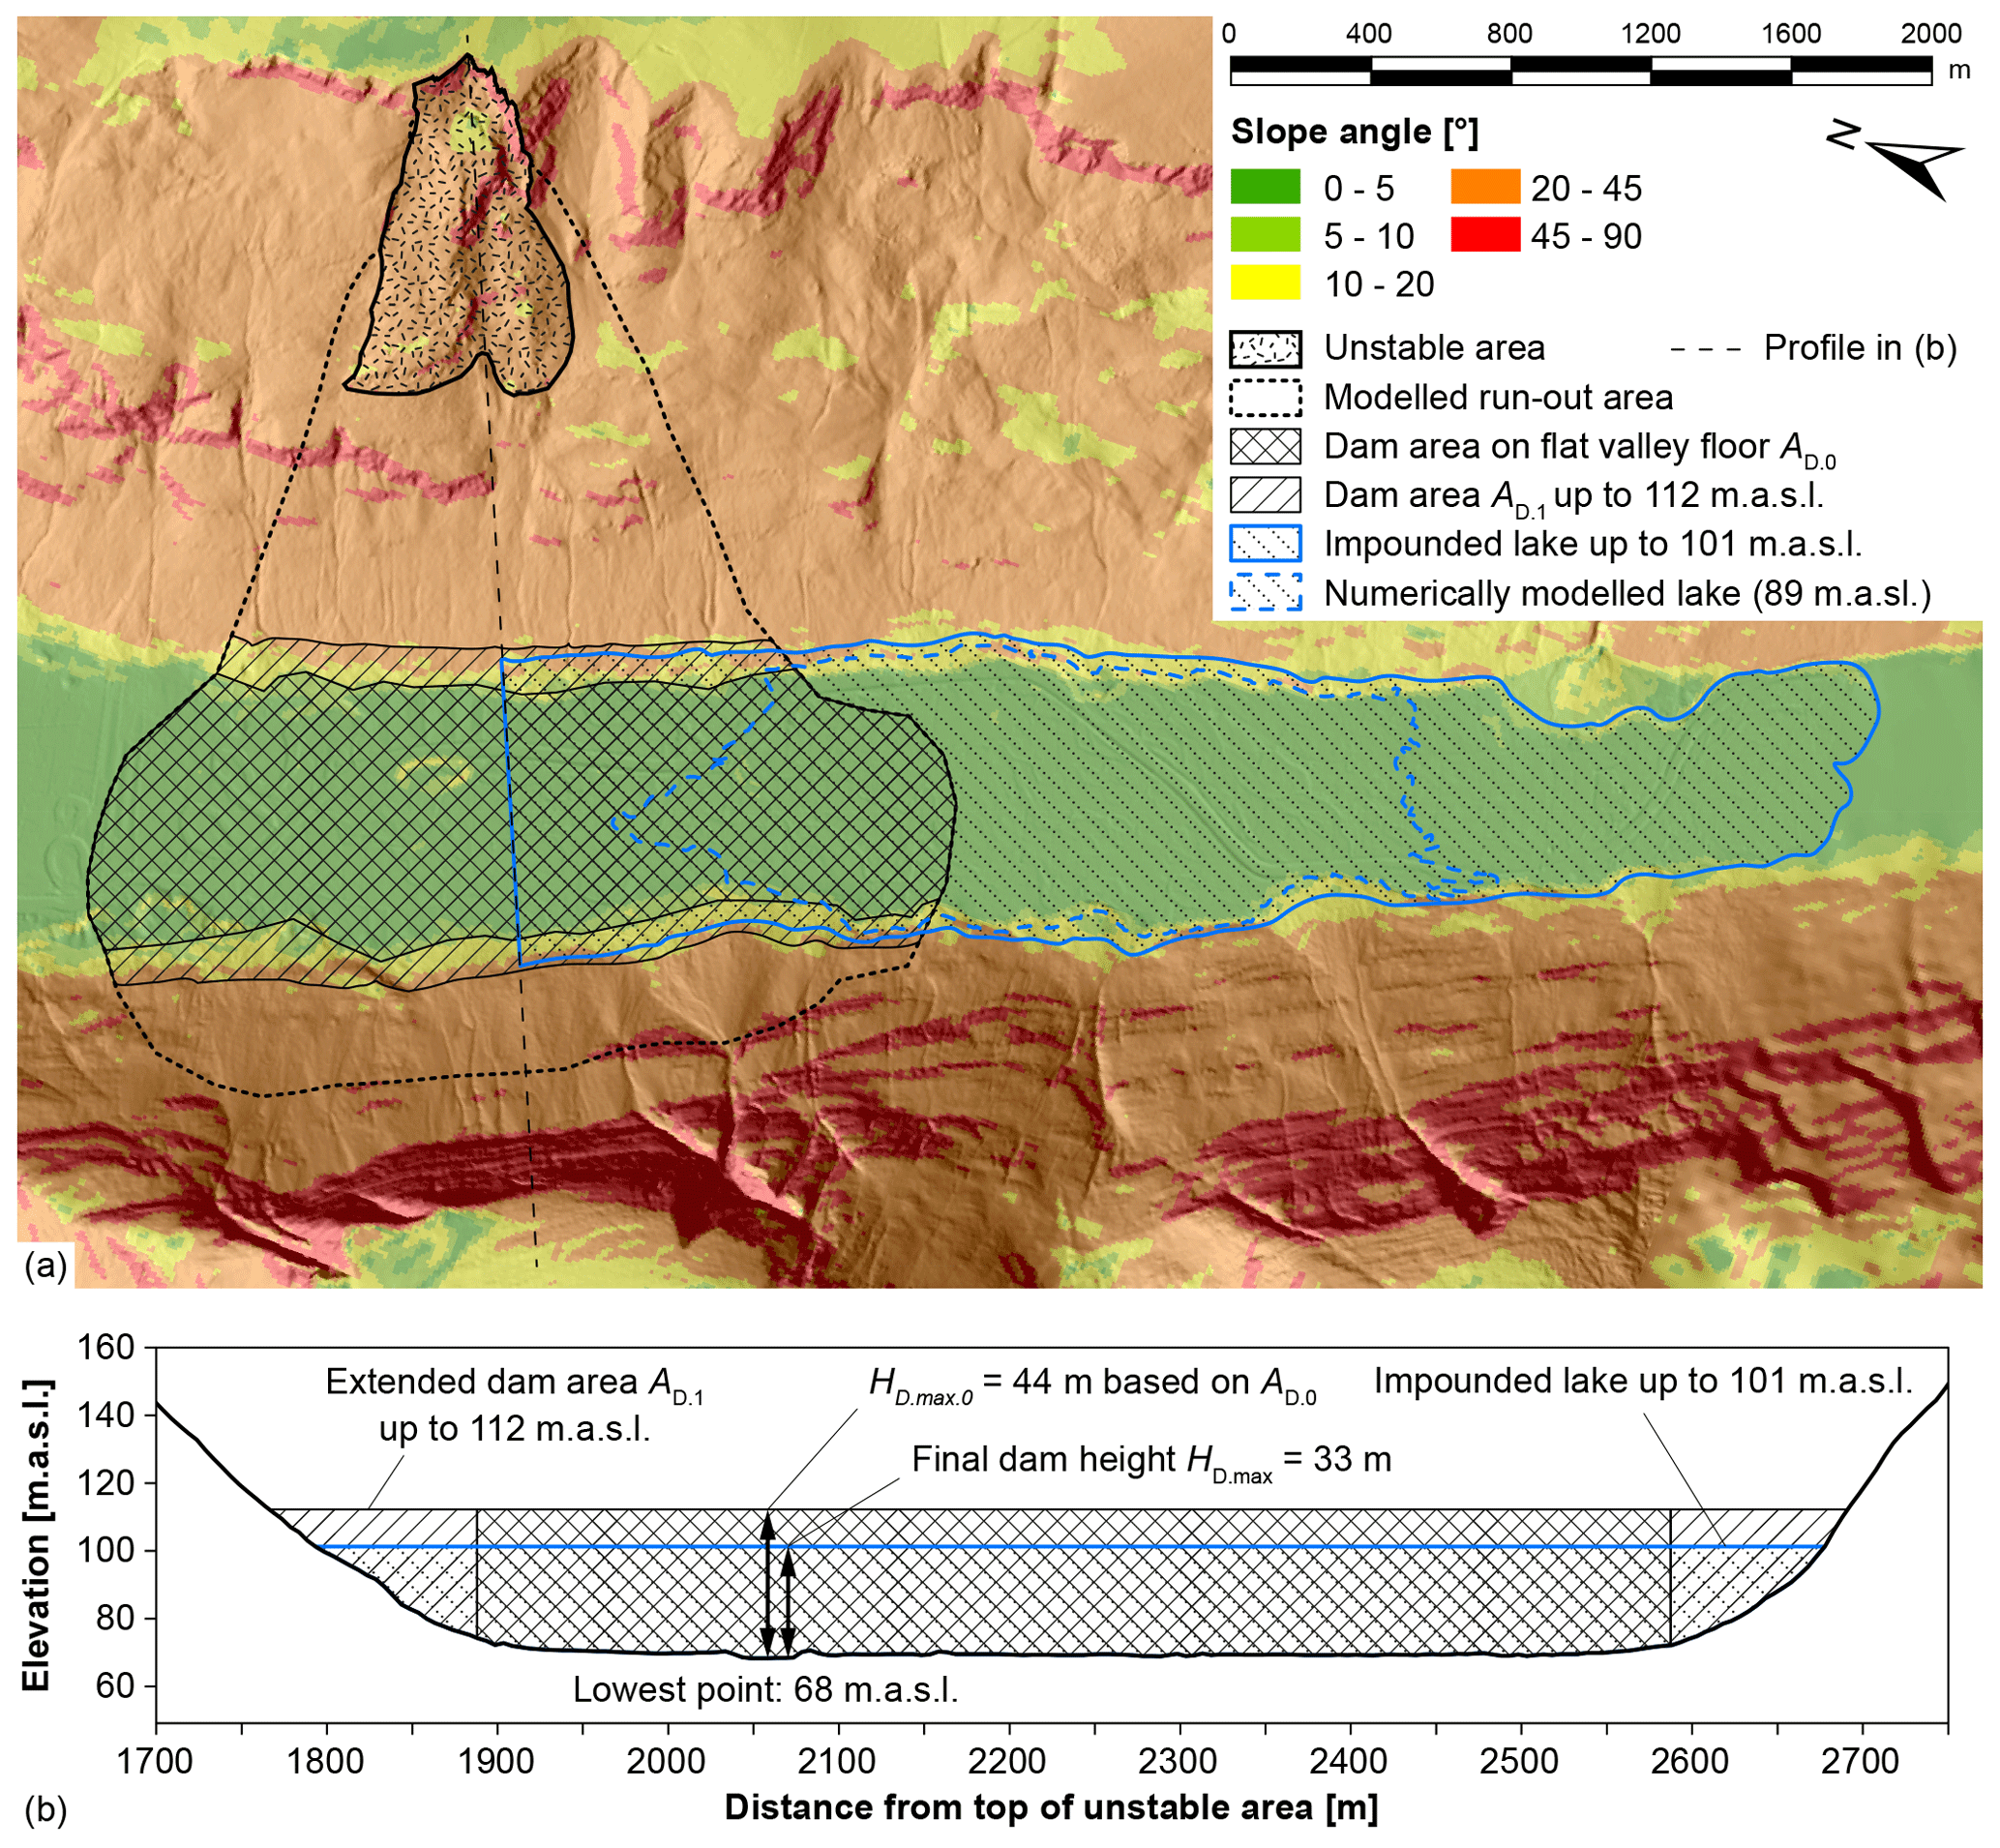
Figure 9Iterative procedure to estimate the maximum dam height HD.max using the modelled run-out area to estimate the dam area AD. The example shown is the 21×106 m3 rockslide of Gamanjunni 3 in northern Norway (Böhme et al., 2016), which might lead to a 33 m high landslide dam using Eq. (4) with the iterative procedure to assess the possible dam area AD.
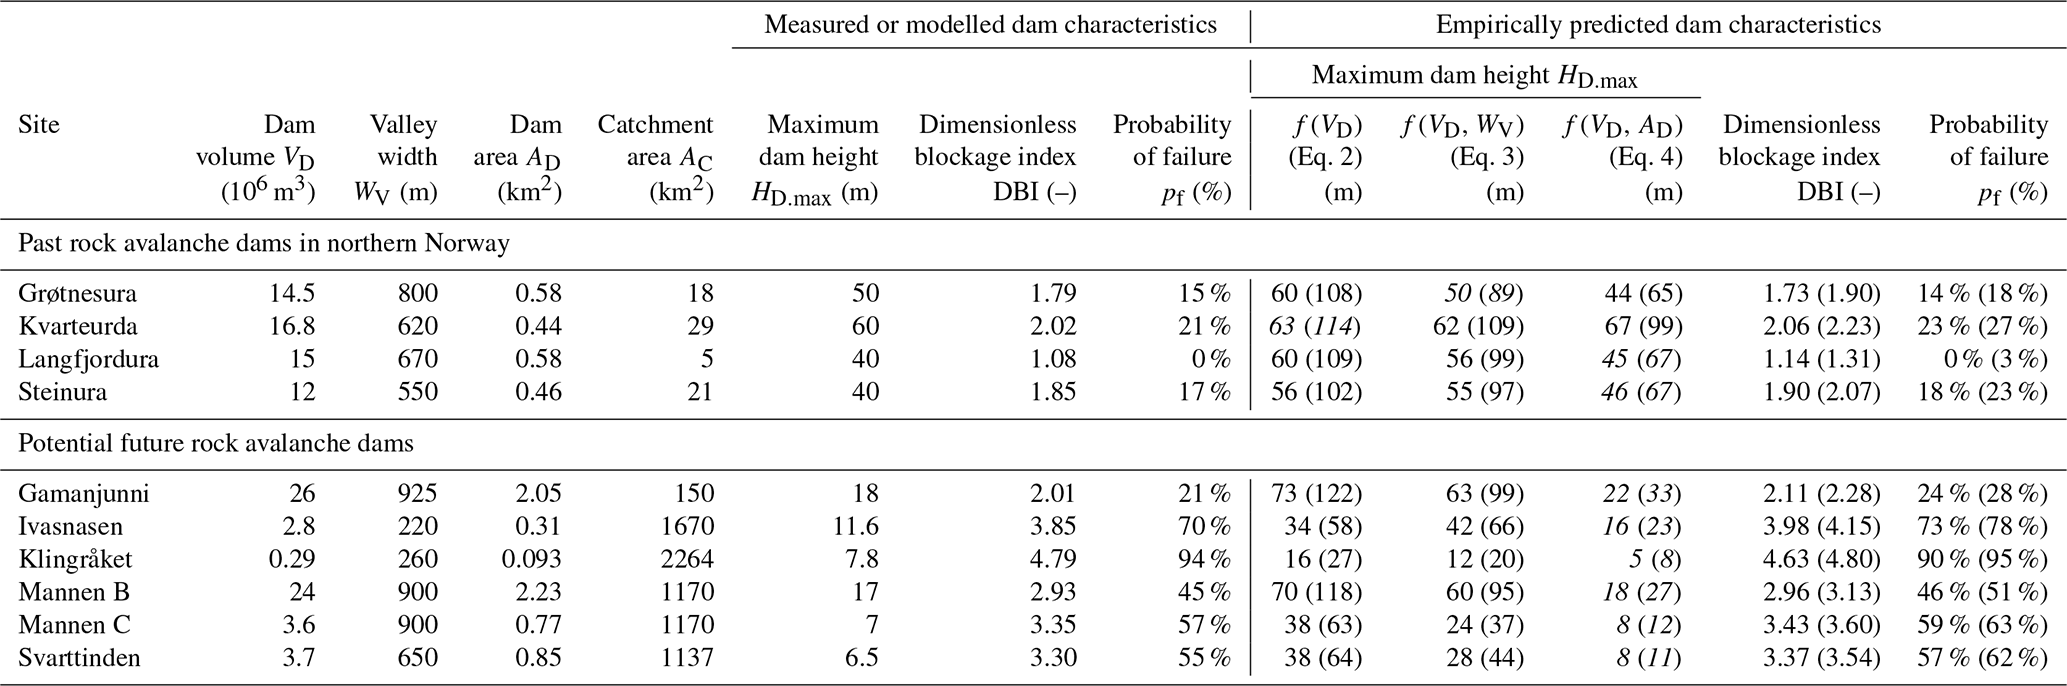
Table 3Dam characteristics for past rock avalanche dams or modelled potential future rock avalanche dams in comparison with predicted dam characteristics from semi-empirical relationships. Predicted DBI values and probability of dam failure pf are indicated for predicted HD.max using Eq. (4). The predicted HD.max, DBI, and pf values are shown for the best-fitted equation, and in parentheses are the values obtained from the upper bound of the 90 % prediction interval (ρ95). The best match between measured or modelled and empirically predicted maximum dam heights is highlighted in italics. For future landslide dams the dam volume VD equals the landslide volume VS times a bulking factor of 1.25 (Hungr and Evans, 2004).
6.2 Prediction of dam stability
The maximum dam height HD.max predicted by the semi-empirical relationships can then be used to assess the dam stability using the DBI (Ermini and Casagli, 2003) (Eq. 5). The catchment area AC upstream of the dam can be easily assessed with a flow accumulation GIS function provided that the DEM covers the entire upstream catchment area. The resulting DBI values are in turn used in Eq. (1) to assess the probability of failure pf.
6.3 Validation of semi-empirical relationships
To test the semi-empirical relationships for RSF dams in southwestern Norway, we analysed four RSF dams in northern Norway as validation dataset. Those dams are presently stable or infilled (Fig. 2b). In addition, the relationships were validated by comparing predicted dam heights with results from detailed numerical run-out modelling for six unstable rock slopes (see Böhme et al., 2016, for an example; NGU, 2020).
Table 3 shows the measured or modelled dam characteristics (VD, WV, AD, AC, HD.max) and the predicted maximum dam heights HD.max using the semi-empirical relationships in Eqs. (2), (3), and (4). This comparison shows that Eq. (4) provides the best match with measured or modelled dam heights in 8∕10 cases, including all six potential future rock slope failures. For Eq. (4) the average relative error is ±13 %, which is very small considering the relatively large uncertainties on the semi-empirical relationship itself with a ρ95 of 1.48 (see above). For Eqs. (2) and (3) the average relative errors are also acceptable when considering only the four existing RSF dams in northern Norway (±29 % and ±20 %, respectively). Regarding the six future RSF dams however, the average relative errors become unacceptable (±267 % and ±202 %, respectively). Possible reasons for this huge discrepancy are discussed below. Based on this validation dataset we consider Eq. (4) to be the best possible semi-empirical relationship to predict the maximum dam height HD.max.
7.1 Differences between landslide dam inventories
The inventory of landslide dams in southwestern Norway and other inventories used in this study (Ermini and Casagli, 2003; Hermanns et al., 2011a; Tacconi Stefanelli et al., 2015) contain significant differences, notably the landslide processes considered, the geological settings, and the volume estimations.
Our inventory of landslide dams in SW Norway and the Andean inventory by Hermanns et al. (2011a) focus on rock slope failures (rock avalanches and rockfalls) and not on other landslide processes (two dams generated by debris flows were discarded from analyses). Conversely, the worldwide inventory of Ermini and Casagli (2003) and the Italian dataset by Tacconi Stefanelli et al. (2015) contain various landslide types (rock avalanches, rockfalls, debris flows, translational and rotation slides, etc.). Based on the published information, it is unfortunately impossible to extract only dams generated by rock slope failures from those inventories. Yet, such a separation into landslide types would likely improve the comparability between the different inventories and the ensuing differences related to the geological settings.
The relationship between the maximum dam height and dam volume (Fig. 5) shows a wide spread in values; i.e. a RSF dam with a volume of 1×10⁶ m3 can lead to a dam height ranging from 4 to 55 m. However, there is no significant difference between our inventory and the datasets by Ermini and Casagli (2003) and Tacconi Stefanelli et al. (2015), which is reflected in the power-law distributions fitted to the different inventories (Table 2). The Andean inventory (Hermanns et al., 2011a) shows, however, significantly lower dam heights for a given volume compared to the other datasets (Fig. 5, Table 2). This is related to the different geomorphic and tectonic settings of the Andean inventory with valleys often tens of kilometres wide, compared to more alpine settings used in our and other inventories.
Finally, the assessment of the dam volume is a crucial parameter for all semi-empirical relationships established in this study. The approach chosen here follows the method by Hermanns et al. (2011a), i.e. the extrapolation of the topography prior to the landslide dam formation using across-valley and along-valley profiles (Fig. 4b, c) to assess HD.mean and HD.max. Multiplying the HD.mean with the dam area AD yields the dam volume VD. The method used to estimate VD is not specified for the other inventories (Ermini and Casagli, 2003; Tacconi Stefanelli et al., 2015) as they are collections of several other datasets. In the inventory by Tacconi Stefanelli et al. (2015) many volumes appear to be computed as the product of dam width, dam length, and dam height (in 11 % of the cases or as the same product divided by a factor of 2 in 35 % of the cases). This emphasizes the uncertainties linked to the volume estimates. A thorough reanalysis of the different landslide dam inventories using a common approach would likely improve the reliability of the semi-empirical relationships proposed in this study. A promising technique to assess the volume of landslide deposits is the sloping local base level technique (Jaboyedoff et al., 2004, 2020) that uses a digital elevation model and the extent of the landslide deposits to compute the possible pre-landslide topography. Jaboyedoff et al. (2020) review different techniques that can be useful to assess volumes of landslides and their deposits.
7.2 Dam stability assessment
The dimensionless blockage index (DBI; Ermini and Casagli, 2003) is widely accepted in the assessment of landslide dam stability (e.g. Tacconi Stefanelli et al., 2016, 2018; Dufresne et al., 2018). Other geomorphic analyses were proposed (e.g. Korup, 2004, Dong et al., 2009), but the extraction of the required parameters is more laborious and often even not feasible for palaeo-dams, or the approach was only tested on a local inventory.
The DBI values for landslide dams in southwestern Norway cover a similar range as those from other inventories (Fig. 8). It is however surprising to have several stable landslide dams with DBI values significantly higher than the “unstable limits” defined in other studies, i.e. 3.08 in Ermini and Casagli (2003) or 3.57 in Tacconi Stefanelli et al. (2015). Our inventory contains 16 landslide dams with a DBI >3.57, whereof only eight were eroded or breached and eight are still intact. The proportion of unstable dams in the bin with the highest DBI values is indeed significantly lower (4 unstable dams out of 10 dams) than in the bin with second-highest DBI values (9 out of 11) (Fig. 8b). Possible reasons for this difference with other inventories are as follows.
-
In the creation of our inventory, we focused on existing lakes impounded by landslide deposits as identification criteria. Landslide dams without a remaining lake are thus not included, yet many of those dams were likely unstable. Extending the inventory to all RSF dams might thus increase the overall proportion of unstable dams (23 out of 54), especially also for higher DBI values.
-
Most dams in our inventory formed in prehistoric times, and the stability assessment of these palaeo-dams is solely based on geomorphologic observations. In other datasets (Ermini and Casagli, 2003; Tacconi Stefanelli et al., 2015) most landslide events occurred in historic times, and available historical records help distinguish between intact, eroded, and breached dams.
-
The RSF deposits impounding the lakes in southwestern Norway often have a large grain size (Fig. 1c, e, f). Grain size analysis of RSF dams shows a median diameter of 0.6 to 0.9 m, and boulders of more than 2 m in diameter form up to 15 % of the deposits (Jakobsen, 2016). In comparison, Casagli et al. (2003) obtained median grain sizes ranging from 0.0044 mm to 0.32 m for landslide dams in the northern Apennines. The large grain size of RSF dams in southwestern Norway could explain the relatively higher stability compared to (possibly) finer-grained deposits in other parts of the world. Deposits with a larger grain size are more resistant to erosion and favour drainage through the rock avalanche deposits (Casagli et al., 2003; Dunning, 2006; Weidinger, 2011) (Fig. 1c).
Using the proportion of unstable dams in bins of DBI values for the combined inventory (Ermini and Casagli, 2003; Tacconi Stefanelli et al., 2015, and our dataset) yields a much broader range for the transition zone between the “stable domain” and “unstable domain” than in previous studies (Fig. 8). This reanalysis of the joint dataset is robust as it considers possible outliers and it is less dependent on single values. One could for example argue to set the upper limit DBIupper to the highest DBI value of all stable dams (4.37 instead of 5.0). This would imply that DBIupper is solely depending on a single landslide dam, which is not appropriate given the complexity of the phenomena and the uncertainties in the inventories. We did not include the dataset by Hermanns et al. (2011a) in the combined inventory due to the significantly higher proportion of unstable dams for given DBI classes (Fig. 8a, b). A possible reason is the relatively lower dam heights in the Andes compared to other datasets (see discussion above), which leads to lower DBI values. Other causes for this difference could be the grain size of deposits, climatic conditions, and age of the Andean dams, which are up to 60 kyr old (Hermanns et al., 2004, 2011a; Costa and González Díaz, 2007).
It would be interesting to perform this stability assessment for different geological, geomorphological, and climatic environments, in order to obtain lower and upper DBI limits for different conditions. This requires however more complete inventories, as at least 100 or 150 landslide dams are required to obtain a sufficient number of bins (10 to 15 bins) each containing a sufficient number of dams (≥10).
7.3 Prediction of dam height using semi-empirical relations or numerical modelling
Two of the proposed semi-empirical relationships rely only on the dam volume VD (Eq. 2) or on the ratio VD over valley width WV (Eq. 3). These equations are thus a quick tool to assess the dam height, yet comparison with numerical modelling shows that these relationships overestimate the maximum dam height (Table 3). The third proposed semi-empirical relationship using the ratio of VD over dam area AD (Eq. 4) provides a better match with numerical modelling results. It requires however a simple run-out analysis to assess the run-out area and estimate AD (Fig. 9). A first assessment of the landslide run-out area can be achieved by calculating the landslide run-out length L as a function of the landslide fall height H and the volume-dependent angle of reach α (e.g. Scheidegger, 1973; Nicoletti and Sorriso-Valvo, 1991; Erismann and Abele, 2001; De Blasio, 2011) (Fig. 4b). The angle of reach α is also used in more advanced computer programs, such as CONEFALL (Jaboyedoff and Labiouse, 2011) or Flow-R (Horton et al., 2013), which require little to no calibration and can thus be quickly applied to assess the run-out area. Yet, these tools do not provide the thickness of deposits and thus the dam height. The third semi-empirical relationship (Eq. 4) yields the maximum dam height based on the landslide run-out area and dam area.
Using detailed numerical simulations of the landslide propagation and run-out, such as the DAN3D code (McDougall and Hungr, 2004) or the RAMMS software suite (Christen et al., 2012), directly provides the thickness of landslide deposits and allows us to find the lowest elevation of the post-slide topography up to which a lake can form (see Oppikofer et al., 2016a, Fig. 9). However, these simulations require many input parameters and extensive calibration in order to obtain reliable results. These requirements impede their cost-efficient use in regional studies, where a large number of potential landslide dams need to be assessed.
The proposed semi-empirical relationships are a conservative method because they assess the maximum dam height and thus not the lowest elevation where dam overtopping may occur. Numerical simulations on the other hand provide the dam height and elevation where overtopping would occur. This difference partly explains the discrepancy between numerically modelled and empirically predicted dam heights (Table 3). Another possible reason for this discrepancy is the difference between observed and modelled run-out areas. The effective run-out area of a landslide can be significantly smaller than numerically simulated ones: the latter generally cover the entire area potentially affected by a landslide, while the real run-out area of a landslide event may only cover parts of the total area. As the landslide volume in reality may spread over a smaller area than simulated, the average and maximum dam heights obtained by numerical simulations or by Eq. (4) may be too small. Yet, the possible overestimation of AD is counterbalanced by a conservative estimate of VD being the entire landslide volume VS times a bulking factor of 1.25. More back analyses of landslide-generated dams are required to ascertain these possible differences between modelled and real run-out areas. In turn, this could lead to an improved workflow for assessing the dam height and reducing uncertainties.
These considerations highlight the necessity to assess uncertainties on dam height and stability by using various approaches, including different semi-empirical relationships, but also numerical simulations for critical areas. To assess uncertainties, we calculate for example the DBI and pf using HD.max for the potential RSF dams of the validation dataset (see Table 3). Compared to the results from numerical simulations, the DBI increases on average by 0.64 and 0.56 for Eqs. (2) and (3), respectively. This leads in turn to an average increase in pf of +16 % and +14 %, respectively. This comparison highlights that despite large uncertainties, the influence on dam stability and thus on the consequence assessment is relatively moderate.
The semi-empirical relations presented here provide a rapid approach for predicting the maximum dam height of dams that might result from the future failure of an unstable rock slope. All relations require only limited input parameters, chiefly the slide volume, the valley width, and the dam area based on simple run-out assessments. These semi-empirical relationships are established from an inventory of 54 RSF dams in southwestern Norway with dam volumes ranging from 12 000 m3 to 135×106 m3. Only dams generated by catastrophic rockslides or rock avalanches and without any glacial influence were included in the analyses. Consequently, the semi-empirical relations presented here may be less or not applicable for other landslide types (e.g. debris flows, shallow landslides) and other volume classes. The upper bounds of the 90 % prediction intervals of these semi-empirical relationships range from 1.48 to 1.81, meaning that approximately 5 % of the actual maximum dam heights exceed the predicted value by 48 % to 81 % or more.
Validation of the semi-empirical relationships was performed using four RSF dams in northern Norway but also results from detailed numerical run-out simulations for six unstable rock slopes. The maximum dam heights predicted by the semi-empirical relations are generally in good agreement with the measured or modelled dam heights from the validation dataset. The best validation results are obtained for the relationship linking maximum dam height to landslide volume and dam area with only a modest overestimation of the maximum dam heights (average relative error of 18 %). This semi-empirical relationship thus provides an appropriate tool for the first-order assessment of dams generated by rock slope failures at a local to regional scale. Using limited input parameters, this relationship allows the prediction of the maximum dam height and thus the upstream inundation area. It also allows quick forecast of the dam stability using the dimensionless blockage index.
Possible improvements of these semi-empirical relationships are the inclusion of additional datasets, notably existing landslide dams from other regions in Norway. Similar datasets could be collected for other mountainous regions in the world, possibly leading to semi-empirical relationships with different parameters than those presented here for dams from rock slope failures in southwestern Norway. Another possible major improvement consists in the addition of those dams that do not possess a lake or residual lake at present. This requires however very time-intensive screening over large regions to detect the landslide deposits that might have blocked a river in the past. Furthermore, the presented semi-empirical relationships are only valid for rockslides and rock avalanches. Similar semi-empirical relationships can be imagined for other landslide types, but more complete datasets on those landslide dams are required first. We strongly suggest using the predictive tools developed here to assess landslide dam formation and stability, which should be an integral part of risk assessment for future landslide events.
Data used for this study are available on DataverseNO: https://doi.org/10.18710/47DXWT (Oppikofer et al., 2020).
RH and TO conceptualized and supervised the study; VJ created the landslide dam inventory; TO analysed the study data with support from MB, PN, IP, and RH; TO prepared the manuscript with contributions from all co-authors.
The authors declare that they have no conflict of interest.
We are grateful to the Norwegian Water Resources and Energy Directorate for funding this project through the national mapping programme for unstable rock slopes in Norway.
This paper was edited by Thomas Glade and reviewed by two anonymous referees.
Böhme, M., Oppikofer, T., Longva, O., Jaboyedoff, M., Hermanns, R. L., and Derron, M.-H.: Analyses of past and present rock slope instabilities in a fjord valley: implications for hazard assessment, Geomorphology, 248, 464–474, https://doi.org/10.1016/j.geomorph.2015.06.045, 2015.
Böhme, M., Bunkholt, H., Dehls, J. F., Oppikofer, T., Hermanns, R. L., Dalsegg, E., Kristensen, L., Lauknes, T. R., and Eriksen, H. Ø.: Geologisk modell og fare- og risikoklassifisering av det ustabile fjellpartiet Gamanjunni 3 i Manndalen, Troms, Geol. Surv. Norw., Trondheim, Norway, NGU report 2016.031, 63 pp., 2016 (in Norwegian).
Casagli, N., Ermini, L., and Rosati, G.: Determining grain size distribution of the material composing landslide dams in the Northern Apennines: sampling and processing methods, Eng. Geol., 69, 83–97, https://doi.org/10.1016/S0013-7952(02)00249-1, 2003.
Christen, M., Bühler, Y., Bartelt, P., Leine, R., Glover, J., Schweizer, A., Graf, C., McArdell, B. W., Gerber, W., Deubelbeiss, Y., Feistl, T., and Volkwein, A.: Integral hazard management using a unified software environment: numerical simulation tool ”RAMMS” for gravitational natural hazards, in: Proceedings of the 12424 Congress INTERPRAEVENT, Grenoble, France, 23–26 April 2012, 77–86, 2012.
Corominas, J.: The angle of reach as a mobility index for small and large landslides, Can. Geotech. J., 33, 260–271, 1996.
Costa, C. H. and González Día, E. F.: Age constraints and paleoseismic implication of rock avalanches in the northern Patagonian Andes, Argentina, J. S. Am. Earth Sci., 24, 48–57, 2007.
Costa, J. E. and Schuster, R. L.: The formation and failure of natural dams, B. Geol. Soc. Am., 100, 1054–1068, https://doi.org/10.3133/ofr87392, 1988.
Crosta, G. B., Imposimato, S., and Roddeman, D.: Numerical modelling of entrainment/deposition in rock and debris-avalanches, Eng. Geol., 109, 135–145, https://doi.org/10.1016/j.enggeo.2008.10.004, 2009.
Dai, F. C., Lee, C. F., Deng, J. H., and Tham, L. G.: The 1786 earthquake-triggered landslide dam and subsequent dam-break flood on the Dadu River, southwestern China, Geomorphology, 65, 205–221, https://doi.org/10.1016/j.geomorph.2004.08.011, 2005.
Dahle, H., Bjerke, P. L., Crosta, G. B., Hermanns, R. L., Anda, E., and Saintot, A.: Faresoner for utløp, oppdemming og flom som følge av fjellskredfare ved Mannen, Geol. Surv. Norw., Trondheim, Norway, NGU report 2011.058, 41 pp., 2011 (in Norwegian).
De Blasio, F. V.: Introduction to the physics of landslides, Springer Science & Business Media, Dordrecht, the Netherlands, 2011.
Dong, J. J., Tung, Y. H., Chen, C. C., Liao, J. J., and Pan, Y. W.: Discriminant analysis of the geomorphic characteristics and stability of landslide dams, Geomorphology, 110, 162–171, https://doi.org/10.1016/j.geomorph.2009.04.004, 2009.
Dufresne, A., Ostermann, M., and Preusser, F.: River-damming, late-Quaternary rockslides in the Ötz Valley region (Tyrol, Austria), Geomorphology, 310, 153–167, 2018.
Dunning, S. A.: The grain size distribution of rock-avalanche deposits in valley confined settings, Ital. J. Eng. Geol. Environ, Special issue 1, 117–121, https://doi.org/10.4408/IJEGE.2006-01.S-15, 2006.
Dussauge, C., Grasso, J.-R., and Helmstetter, A.: Statistical analysis of rockfall volume distributions: Implications for rockfall dynamics. J. Geophys. Res.-Earth, 108, 2286, https://doi.org/10.1029/2001JB000650, 2003.
Erismann, T. H. and Abele, G.: Dynamics of rockslides and rockfalls, Springer, Berlin, 2001.
Ermini, L. and Casagli, N.: Prediction of the behaviour of landslide dams using a geomorphological dimensionless index, Earth Surf. Proc. Land, 28, 31–47, 2003.
Etzelmüller, B., Romstad, B., and Fjellanger, J.: Automatic regional classification of topography in Norway, Norw. J. Geol., 87, 167–180, 2007.
Evans, S. G.: The formation and failure of landslide dams: an approach to risk assessment, Ital. J. Eng. Geol. Environ., Special issue 2016, 15–20, https://doi.org/10.4408/IJEGE.2006-01.S-02, 2006.
Evans, S. G., Delaney, K. B., Hermanns, R. L., Strom, A., and Scarascia-Mugnozza, G.: The formation and behaviour of natural and artificial rockslide dams; implications for engineering performance and hazard management, in: Natural and Artificial Rockslide Dams, edited by: Evans, S. G., Hermanns, R. L., Strom, A., and Scarascia-Mugnozza, G., Springer, Berlin, Heidelberg, Germany, 1–75, 2011.
Furseth, A.: Skredulykker i Norge. Tun Forlag, Oslo, Norway, 2006 (in Norwegian).
Gabrielsen, R. H,, Braathen, A., Dehls, J., and Roberts, D.: Tectonic lineaments of Norway, Norw. J. Geol., 82, 153–174, 2002.
Groeber, P.: Informe sobre las causas que han producido las crecientes del río Colorado (Territorios del Neuquén y La Pampa) en 1914, Ministerio de Agricultura de la Nacíon (Argentina), Dirección General de Minas, Buenos Aires, Geología e Hidrogeología, Serie B (Geología), 11, 1–29, 1916 (in Spanish).
Guzzetti, F., Reichenbach, P., and Wieczorek, G. F.: Rockfall hazard and risk assessment in the Yosemite Valley, California, USA, Nat. Haz. Earth Syst. Sci., 3, 491–503, 2003.
Hermanns, R. L., Niedermann, S., Ivy-Ochs, S., and Kubik, P.: Rock avalanching into a landslide-dammed lake causing multiple dam failure in Las Conchas valley (NW Argentina) – evidence from surface exposure dating and stratigraphic analyses, Landslides, 1, 113–122, 2004.
Hermanns, R. L., Folguera, A., Penna, I., Fauqué, L., and Niedermann, S.: Landslide Dams in the Central Andes of Argentina (Northern Patagonia and the Argentine Northwest), in: Natural and Artificial Rockslide Dams, edited by: Evans, S. G., Hermanns, R. L., Strom, A., and Scarascia-Mugnozza, G., Springer, Berlin, Heidelberg, Germany, 147–176, 2011a.
Hermanns, R. L., Hewitt, K., Strom, A., Evans, S. G., Dunning, S. A., and Scarascia-Mugnozza, G.: The Classification of Rockslide Dams, in: Natural and Artificial Rockslide Dams, edited by: Evans, S. G., Hermanns, R. L., Strom, A., and Scarascia-Mugnozza, G., Springer, Berlin, Heidelberg, Germany, 581–593, 2011b.
Hermanns, R. L., Oppikofer, T., Anda, E., Blikra, L. H., Böhme, M., Bunkholt, H., Crosta, G. B., Dahle, H., Devoli, G., Fischer, L., Jaboyedoff, M., Loew, S., Sætre, S., and Yugsi Molina, F. X.: Recommended hazard and risk classification system for large unstable rock slopes in Norway, Geol. Surv. Norw., Trondheim, Norway, NGU report 2012.029, 52 pp., 2012.
Hermanns, R. L., Blikra, L. H., Anda, E., Saintot, A., Dahle, H., Oppikofer, T., Fischer, L., Bunkholt, H., Böhme, M., Dehls, J. F., Lauknes, T. R., Redfield, T. F., Osmundsen, P. T., and Eiken, T.: Systematic Mapping of Large Unstable Rock Slopes in Norway, in: Landslide Science and Practice, edited by: Margottini, C., Canuti, P., and Sassa, K., Springer, Berlin, Heidelberg, Germany, 29–34, 2013a.
Hermanns, R. L., Dahle, H., Bjerke, P. L., Crosta, G. B., Anda, E., Blikra, L. H., Saintot, A., and Longva, O.: Rockslide Dams in Møre og Romsdal County, Norway, in: Landslide Science and Practice, edited by: Margottini, C., Canuti, P., and Sassa, K., Springer, Berlin, Heidelberg, Germany, 3–12, 2013b.
Hermanns, R. L., Schleier, M., Böhme, M., Blikra, L. H., Gosse, J. C., Ivy-Ochs, S., and Hilger, P.: Rock-Avalanche Activity in W and S Norway Peaks After the Retreat of the Scandinavian Ice Sheet, in: WLF 2017: Advancing Culture of Living with Landslides, edited by: Mikoš, M., Vilímek, V., Yin, Y., and Sassa, K., Springer, Cham, Switzerland, 331–338, 2017.
Hewitt, K.: Natural Dams and Outburst Floods in the Karakoram Himalaya, in: Hydrological Aspects of Alpine and High Mountain Areas, in: Proceedings of the Exeter Symposium, 19–30 July 1982, Intern. Ass. Hydrol. Sci., Wallingford, UK, 259–269, 1982.
Hewitt, K.: Catastrophic landslides and their effects on the Upper Indus streams, Karakoram Himalaya, northern Pakistan, Geomorphology, 26, 47–80, 1998.
Horton, P., Jaboyedoff, M., Rudaz, B., and Zimmermann, M.: Flow-R, a model for susceptibility mapping of debris flows and other gravitational hazards at a regional scale, Nat. Hazards Earth Syst. Sci., 13, 869–885, https://doi.org/10.5194/nhess-13-869-2013, 2013.
Hovius, N.: Sediment flux from a mountain belt derived by landslide mapping, Geology, 25, 231–234, 1997.
Hungr, O.: Prospects for Prediction of Landslide Dam Geometry Using Empirical and Dynamic Models, in: Natural and Artificial Rockslide Dams, edited by: Evans, S. G., Hermanns, R. L., Strom, A., and Scarascia-Mugnozza, G., Springer, Berlin, Heidelberg, Germany, 463–477, 2011.
Hungr, O. and Evans, S. G.: Entrainment of debris in rock avalanches: An analysis of a long run-out mechanism. Geol. Soc. Am. Bull., 116, 1240–1252, https://doi.org/10.1130/B25362.1, 2004.
Hungr, O. and McDougall, S.: Two numerical models for landslide dynamic analysis, Comput. Geosci., 35, 978–992, https://doi.org/10.1016/j.cageo.2007.12.003, 2009.
Jaboyedoff, M. and Labiouse, V.: Technical Note: Preliminary estimation of rockfall runout zones, Nat. Hazards Earth Syst. Sci., 11, 819–828, https://doi.org/10.5194/nhess-11-819-2011, 2011.
Jaboyedoff, M., Baillifard, F., Couture, R., Locat, J., and Locat, P.: Toward preliminary hazard assessment using DEM topographic analysis and simple mechanical modeling by means of sloping local base level, in: Landslides: Evaluation and Stabilization, edited by: Lacerda, W. A., Ehrlich, M., Fontoura, A. B., and Sayão, A., Taylor & Francis Group, London, 199–205, 2004.
Jaboyedoff, M., Carrea, D., Derron, M.-H., Oppikofer, T., Penna, I. M., and Rudaz, B.: A review of methods used to estimate initial landslide failure surface depths and volumes, Eng. Geol., 267, 105478, https://doi.org/10.1016/j.enggeo.2020.105478, 2020.
Jakobsen, V. U.: Investigation of rockslide dams in the southwestern part of Norway, Project thesis, Norwegian University of Science and Technology, Trondheim, Norway, 2015.
Jakobsen, V. U.: An empirical approach for determining the evolution and behavior of rockslide dams, MSc thesis, Norwegian University of Science and Technology, Trondheim, Norway, 2016.
Korup, O.: Recent research on landslide dams; a literature review with special attention to New Zealand, Prog. Phys. Geog., 26, 206–235, https://doi.org/10.1191/0309133302pp333ra, 2002.
Korup, O.: Geomorphometric characteristics of New Zealand landslide dams, Eng. Geol., 73, 13–35, 2004.
McDougall, S. and Hungr, O.: A model for the analysis of rapid landslide motion across three-dimensional terrain, Can. Geotech. J., 41, 1084–1097, https://doi.org/10.1139/T04-052, 2004.
NGU: Unstable Rock Slopes – National Database for Unstable Rock Slopes, available at: http://geo.ngu.no/kart/ustabilefjellparti_mobil/, last access: 23 September 2020.
Nicoletti, G. and Sorriso-Valvo, M.: Geomorphic controls of the shape and mobility of rock avalanches, Geol. Soc. Am. Bull., 103, 1365–1373, 1991.
Norwegian Mapping Authority: Height DTM 10 – Map Catalogue, available at: https://kartkatalog.geonorge.no/metadata/dddbb667-1303-4ac5-8640-7ec04c0e3918, last access: 23 September 2020a.
Norwegian Mapping Authority: Norge i bilder – Online map service for orthophotos, available at: https://www.norgeibilder.no/, last access: 23 September 2020b.
NVE: Skredatlas, available at: https://atlas.nve.no/Html5Viewer/index.html?viewer=nveatlas#, last access: 23 September 2020.
Oppikofer, T., Böhme, M., Nicolet, P., Penna, I. M., and Hermanns, R. L.: Metodikk for konsekvensanalyse av fjellskred, Geol. Surv. Norw., Trondheim, Norway, NGU report 2016.047, 67 pp., 2016a (in Norwegian).
Oppikofer, T., Hermanns, R. L., Sandøy, G., Böhme, M., Jaboyedoff, M., Horton, P., Roberts, N. J., and Fuchs, H.: Quantification of casualties from potential rock-slope failures in Norway, in: Landslides and Engineered Slopes. Experience, Theory and Practice, edited by: Aversa, S., Cascini, L., Picarelli, L., and Scavia, C., Associazione Geotecnica Italiana, Rome, Italy, 1537–1544, 2016b.
Oppikofer, T., Hermanns, R. L., Roberts, N. J., and Böhme, M.: SPLASH: semi-empirical prediction of landslide-generated displacement wave run-up heights, in: Subaqueous Mass Movements and Their Consequences: Assessing Geohazards, Environmental Implications and Economic Significance of Subaqueous Landslides, edited by: Lintern, D. G., Mosher, D. C., Moscardelli, L. G., Bobrowsky, P. T., Campbell, C., Chaytor, J. D., Clague, J. J., Georgiopoulou, A., Lajeunesse, P., Normandeau, A., Piper, D. J. W., Scherwath, M., Stacey, C., and Turmel, D., Geol. Soc. London Spec. Pub., 477, 353–366, https://doi.org/10.1144/SP477.1, 2019.
Oppikofer, T., Hermanns, R. L., Jakobsen, V. U., Böhme, M., Nicolet, P., and Penna, I.: Database on landslide dams in southwestern Norway, DataverseNO, https://doi.org/10.18710/47DXWT, 2020.
Plaza, G., Zevallos, O., and Cadier, E.: La Josefina Landslide Dam and Its Catastrophic Breaching in the Andean Region of Ecuador, in: Natural and Artificial Rockslide Dams, edited by: Evans, S. G., Hermanns, R. L., Strom, A., and Scarascia-Mugnozza, G., Springer, Berlin, Heidelberg, Germany, 389–406, 2011.
Scheidegger, A. E.: On the prediction of the reach and velocity of catastrophic landslides, Rock Mech., 5, 231–236, 1973.
Schleier, M., Hermanns, R. L., Rohn, J., and Gosse, J. C.: Diagnostic characteristics and paleodynamics of supraglacial rock avalanches, Innerdalen, Western Norway, Geomorphology, 245, 23–39, https://doi.org/10.1016/j.geomorph.2015.04.033, 2015.
Schleier, M., Hermanns, R. L., Gosse, J. C., Oppikofer, T., Rohn, J., and Tønnesen, J. F.: Subaqueous rock-avalanche deposits exposed by post-glacial isostatic rebound, Innfjorddalen, Western Norway, Geomorphology, 289, 117–133, https://doi.org/10.1016/j.geomorph.2016.08.024, 2017.
Sosio, R., Crosta, G. B., and Hungr, O.: Complete dynamic modeling calibration for the Thurwieser rock avalanche (Italian Central Alps), Eng. Geol., 100, 11–26, https://doi.org/10.1016/j.enggeo.2008.02.012, 2008.
Tacconi Stefanelli, C., Catani, F., and Casagli, N.: Geomorphological investigations on landslide dams, Geoenviron. Disasters, 2, 21, https://doi.org/10.1186/s40677-015-0030-9, 2015.
Tacconi Stefanelli, C., Segoni, S., Casagli, N., and Catani, F.: Geomorphological analysis for landslide dams, in: Landslides and Engineered Slopes. Experience, Theory and Practice, edited by: Aversa, S., Cascini, L., Picarelli, L., and Scavia, C., Associazione Geotecnica Italiana, Rome, Italy, 1883–1887, 2016.
Tacconi Stefanelli, C., Vilímek, V., Emmer, A., and Catani, F.: Morphological analysis and features of the landslide dams in the Cordillera Blanca, Peru, Landslides, 15, 507–521, https://doi.org/10.1007/s10346-017-0888-6, 2018.
Tochnog Professional: Tochnolog Professional Finite Element Analysis, available at: http://www.tochnogprofessional.nl, last access: 23 September 2020.
Weidinger, J. T.: Stability and life span of landslide dams in the Himalayas (India, Nepal) and the Qin Ling Mountains (China), in: Natural and Artificial Rockslide Dams, edited by: Evans, S. G., Hermanns, R. L., Strom, A., and Scarascia-Mugnozza, G., Springer, Berlin, Heidelberg, Germany, 243–277, 2011.
- Abstract
- Introduction
- Methodology
- Inventory of landslide dams in southwestern Norway
- Semi-empirical relationships
- Dam stability assessment
- Application to predict dam height and stability
- Discussion
- Conclusions and perspectives
- Data availability
- Author contributions
- Competing interests
- Acknowledgements
- Review statement
- References