the Creative Commons Attribution 4.0 License.
the Creative Commons Attribution 4.0 License.
 | 02 Nov 2020
Sensitivity of modeled snow stability data to meteorological input uncertainty
Bettina Richter
Alec van Herwijnen
Mathias W. Rotach
Jürg Schweizer
To perform spatial snow cover simulations for numerical avalanche forecasting, interpolation and downscaling of meteorological data are required, which introduce uncertainties. The repercussions of these uncertainties on modeled snow stability remain mostly unknown. We therefore assessed the contribution of meteorological input uncertainty to modeled snow stability by performing a global sensitivity analysis. We used the numerical snow cover model SNOWPACK to simulate two snow instability metrics, i.e., the skier stability index and the critical crack length, for a field site equipped with an automatic weather station providing the necessary input for the model. Simulations were performed for a winter season, which was marked by a prolonged dry period at the beginning of the season. During this period, the snow surface layers transformed into layers of faceted and depth hoar crystals, which were subsequently buried by snow. The early-season snow surface was likely the weak layer of many avalanches later in the season. Three different scenarios were investigated to better assess the influence of meteorological forcing on snow stability during (a) the weak layer formation period, (b) the slab formation period, and (c) the weak layer and slab formation period. For each scenario, 14 000 simulations were performed, by introducing quasi-random uncertainties to the meteorological input. Uncertainty ranges for meteorological forcing covered typical differences observed within a distance of 2 km or an elevation change of 200 m. Results showed that a weak layer formed in 99.7 % of the simulations, indicating that the weak layer formation was very robust due to the prolonged dry period. For scenario a, modeled grain size of the weak layer was mainly sensitive to precipitation, while the shear strength of the weak layer was sensitive to most input variables, especially air temperature. Once the weak layer existed (case b), precipitation was the most prominent driver for snow stability. The sensitivity analysis highlighted that for all scenarios, the two stability metrics were mostly sensitive to precipitation. Precipitation determined the load of the slab, which in turn influenced weak layer properties. For cases b and c, the two stability metrics showed contradicting behaviors. With increasing precipitation, i.e., deep snowpacks, the skier stability index decreased (became less stable). In contrast, the critical crack length increased with increasing precipitation (became more stable). With regard to spatial simulations of snow stability, the high sensitivity to precipitation suggests that accurate precipitation patterns are necessary to obtain realistic snow stability patterns.
- Article
(1084 KB) - Full-text XML
- BibTeX
- EndNote


Snow avalanches are a natural hazard, which can endanger roads, villages and human lives. A dry-snow slab avalanche starts with failure within a weak layer (Schweizer et al., 2003a). Such weak layers often form close to the snow surface. If weak layers are subsequently covered by new snow, they can persist for the entire season. Whether a failure in a weak layer is prone to propagation depends on the complex interaction between slab layers and the weak layer (van Herwijnen and Jamieson, 2007). The two key processes in avalanche release, failure initiation and crack propagation, can respectively be described with a stress-strength approach (expressed as stability index) and a fracture mechanical approach (considering the critical crack length as observed in a propagation saw test) (Reuter and Schweizer, 2018; Schweizer et al., 2016).
When assessing the avalanche danger, avalanche forecasters rely on snow instability data, combined with measured and forecasted meteorological data (McClung and Schaerer, 2006). Data on snow instability include recent observations of avalanches, or whumpfs and shooting cracks (Jamieson et al., 2009). Such signs of instability are very rare, especially on days with low avalanche activity (Reuter et al., 2015). Information on snow stratigraphy and so-called stability tests then becomes important. Unfortunately, these manual observations are relatively time-consuming point observations and sometimes dangerous to obtain so that the temporal and spatial resolution of snowpack data is limited. Detailed snow cover models, which simulate the full snowpack stratigraphy, can help fill this gap (e.g., Lafaysse et al., 2013; Morin et al., 2020) provided they include information on snow instability (e.g., Schweizer et al., 2006; Lehning et al., 2004; Vernay et al., 2015).
The two most advanced snow cover models are Crocus (Brun et al., 1992; Vionnet et al., 2012) and SNOWPACK (Lehning et al., 2002; Wever et al., 2015). Crocus is part of the French model chain SAFRAN–SURFEX/ISBA-Crocus–MEPRA (S2M), which predicts the regional avalanche danger (Durand et al., 1999; Lafaysse et al., 2013). The meteorological model SAFRAN provides the input for Crocus, which simulates the stratigraphy on virtual slopes for different elevations and aspects. MEPRA is an expert system, which derives the avalanche danger by combining various stability indices with a set of rules to evaluate the simulated snow stratigraphy in terms of stability classes (Giraud and Navarre, 1995). The snow cover model SNOWPACK can be used for point simulations or for distributed snow cover modeling, when coupled with the three-dimensional model Alpine3D (Lehning et al., 2006). SNOWPACK is forced with meteorological data from either automatic weather stations (Lehning et al., 1999) or numerical weather prediction models (Bellaire et al., 2011), and snow instability metrics can be derived from simulated stratigraphy (Lehning et al., 2004). The skier stability index SK38 relates to failure initiation and compares the shear strength of a weak layer with the shear stress acting on the weak layer due to the load of the overlaying slab and a skier (Föhn, 1987; Jamieson and Johnston, 1998; Monti et al., 2016). The critical crack length rc relates to crack propagation and was implemented into SNOWPACK by Gaume et al. (2017) and refined by Richter et al. (2019). Low values of SK38 indicate that initiation is likely; low values of rc indicate that propagation is likely.
When modeling spatially distributed snow stratigraphy and snow instability, uncertainties may arise from numerical weather prediction models or due to spatial interpolation of meteorological data. For numerical avalanche forecasting the sensitivity of these stability criteria to meteorological input uncertainty is of particular importance. However, only a few studies so far have addressed the sensitivity of modeled snow instability estimates. Previous snow sensitivity studies typically focused on snow depth or snow water equivalent (SWE). Uncertainties in modeled snow depth or SWE were estimated from meteorological input uncertainty (e.g., Bellaire et al., 2011; Côté et al., 2017; Lapo et al., 2015; Raleigh et al., 2015; Sauter and Obleitner, 2015), different model setups (Günther et al., 2019; Schlögl et al., 2016) or different physical model assumptions (Günther et al., 2019; Lafaysse et al., 2017). Uncertainties from meteorological input had the highest impact on SWE (Günther et al., 2019). For most applications, such as snow hydrology or glacier mass balance, these target variables and timescales are sufficient. However, for snow instability assessment and avalanche formation the relevant timescales are shorter (days to weeks) and snow stratigraphy is a key variable that has to be accounted for (Schweizer et al., 2003a). Indeed, a necessary prerequisite for dry-snow slab avalanche release is a weak layer within the snow cover below a cohesive slab. Slaughter (2010) therefore estimated the sensitivity of weak layer formation to meteorological input using a snow thermal model. Incoming long-wave radiation was most important, but how input uncertainty impacts the evolution of snow instability during the entire season was not investigated. Vernay et al. (2015) forced S2M with an ensemble of meteorological input data to estimate the uncertainty in forecasted avalanche hazard from numerical weather prediction models. While meteorological input was assumed to be the main source of uncertainty, the ways in which these input uncertainties influenced snow stability were not investigated in more detail.
We therefore investigated how meteorological input uncertainty influenced modeled snow stability by performing a global sensitivity analysis. SNOWPACK was forced with the meteorological input of an automatic weather station from a field site above Davos, Switzerland, and biases were introduced to the meteorological data. We performed simulations for the winter season 2016–2017, when one weak layer persisted for the entire season and affected snow stability in the region of Davos. We analyzed modeled snow instability metrics related to this weak layer in three steps: we independently investigated the influence of meteorological input uncertainty during three periods of (a) weak layer formation, (b) slab formation, and (c) weak layer and slab formation.
The paper is organized as follows. Section 2 provides an overview of the study site and the simulations with SNOWPACK. This is followed by the description of the uncertainties introduced to the model and the global sensitivity analysis. In Sect. 3, we first shortly present the winter evolution. Then, the sensitivity of modeled slab and weak layer properties to uncertainties in meteorological input is analyzed for two different days: immediately after burial of the weak layer (Sect. 3.2.1) and on a day with high avalanche activity (Sect. 3.2.2). Eventually, the evolution of snow stability was analyzed with respect to its sensitivity to input uncertainties during the three different periods (Sect. 3.3). Specific points are finally discussed in Sect. 4.
2.1 Study site and data
We used data from the field site Weissfluhjoch (WFJ), located in the eastern Swiss Alps above Davos, at an elevation of 2536 m a.s.l. The WFJ site is equipped with an automatic weather station (AWS), which provides the necessary meteorological input to the snow cover model. In addition, traditional snow profiles were conducted on a weekly basis according to Fierz et al. (2009) (Fig. 1a). The winter season 2016–2017 was selected for this study, since the snowpack was marked by a prominent weak layer at about 40 cm from the ground (dark blue colors in Fig. 1a) and pronounced avalanche activity on 9 March 2017. The weak layer formed between mid-November 2016 and the beginning of January 2017 at the surface of the shallow snowpack. For the analysis we will focus on the formation and evolution of this particular layer and its effect on snow stability for the period of high avalanche activity on 9 March 2017. We also calculated the avalanche activity index (AAI) based on visual avalanche observations from the region of Davos (about 360 km2), which were compiled by the avalanche warning service at the SLF. The AAI is the weighted sum of all observed avalanches, where weights are assigned according to avalanche size (Schweizer et al., 2003b).

Figure 1(a) Manually observed snow profiles at the Weissfluhjoch field site for the winter season 2016–2017. (b) Reference run simulated with SNOWPACK for the winter season 2016–2017 at the WFJ field site above Davos, Switzerland. Shown is the temporal evolution of simulated snow stratigraphy. Colors indicate grain type, i.e., precipitation particles (PP), decomposing and fragmented precipitation particles (DF), rounded grains (RG), faceted crystals (FC), depth hoar (DH), surface hoar (SH), melt forms (MF) and ice formations (IF). The red colored period refers to weak layer formation, the blue colored period to slab formation. Arrows indicate different scenarios for which uncertainties were introduced into meteorological model input.
2.2 SNOWPACK
We performed simulations with the snow cover model SNOWPACK version v1473 (e.g., Lehning et al., 2002). SNOWPACK was driven with meteorological data from the AWS at WFJ, including precipitation (P), air temperature (TA), relative humidity (RH), wind velocity (VW), and incoming shortwave (ISWR) and longwave (ILWR) radiation. For the reference run we used data from the quality-controlled data set at WFJ (Wever, 2017). SNOWPACK calculated the absorbed shortwave radiation from modeled surface albedo, not from measured data. Furthermore, data on measured snow depth and snow surface temperature were explicitly excluded in the configuration. The snow surface temperature was estimated from energy fluxes using Neumann boundary conditions at the snow–atmosphere interface (Bartelt and Lehning, 2002; Lehning et al., 2002). A constant geothermal heat flux of 0.06 W m−2 was assumed at the bottom of the snowpack (Davies and Davies, 2010; Pollack et al., 1993). The time step for the simulation was 15 min and output was written every 24 h.
The sensitivity analysis focused on weak and slab properties, as well as modeled snow stability. In particular, the skier stability index SK38 and the critical crack length rc were analyzed. We focused on the weak layer that formed between 16 November 2016 and 2 January 2017 (see red area in Fig. 1b). Since SNOWPACK produces considerably more layers than observed, all simulated snow layers that were deposited between these two dates and consisted of depth hoar, surface hoar, facets or rounding facets were considered as weak layers, similar to Richter et al. (2019). Hence, weak layer thickness Dwl was defined as the thickness of all layers consisting of facets, depth hoar or surface hoar, which were deposited between these two dates. The percentage of facets (% facets), was defined as Dwl, divided by the total thickness of all layers which were deposited between these two dates (see Sect. 3.2.1). Then, weak layer properties were obtained by a thickness-weighted average of the layer properties yi:
where di is the thickness of the simulated layer i. In analogy, slab properties were calculated from all layers above the weak layer, independent of grain type (see green area in Fig. 1b). Slab thickness Dsl was defined as the thickness of all slab layers.
The SK38 was calculated for each simulated snow layer from layer properties of flat-field simulations, which were extrapolated to a 38∘ slope according to Jamieson and Johnston (1998):
with the shear strength of the weak layer τp, the shear stress due to slab weight , the average slab density ρsl, the slab thickness Dsl, the gravitational acceleration g, and the additional shear stress acting on the weak layer due to the weight of a skier Δτ. The additional shear stress is modeled as a line load (Föhn, 1987) and for a 38∘ slope, it simplifies to m Pa (Monti et al., 2016). Parameterizations for shear strength for different grain types were derived based on shear frame measurements (see Table 8 in Jamieson and Johnston, 2001) and implemented into SNOWPACK. For surface hoar, the shear strength was calculated according to Lehning et al. (2004). Details on shear strength parameterization in SNOWPACK were described by Richter et al. (2019).
The critical crack length was calculated for each simulated snow layer from modeled layer properties using the improved parameterization suggested by Richter et al. (2019):
with the plane strain elastic modulus of the slab , the Poisson's ratio of the slab ν=0.2, and the normal stress σn=ρslgDsl acting on the weak layer due to the overlying slab. The elastic modulus of the slab, E, was related to the slab density by a power law fit to the data collected by Scapozza (2004):
Richter et al. (2019) introduced the correction factor Fwl to replace two variables of the original parameterization (Gaume et al., 2017), which were not well defined in SNOWPACK. The factor Fwl accounts for weak layer density and grain size and considerably improved the rc parameterization, and it yields lower values of rc for layers with larger grains (Richter et al., 2019).
with the weak layer density ρwl, the weak layer grain size gswl, the density of ice ρice=917 kg m−3 and the reference grain size gs0=0.00125 m. SK38 and rc were calculated for each of the weak layers as defined above and thickness-weighted mean instability metrics and were determined from all weak layers (Eq. 1).
2.3 Forcing uncertainties
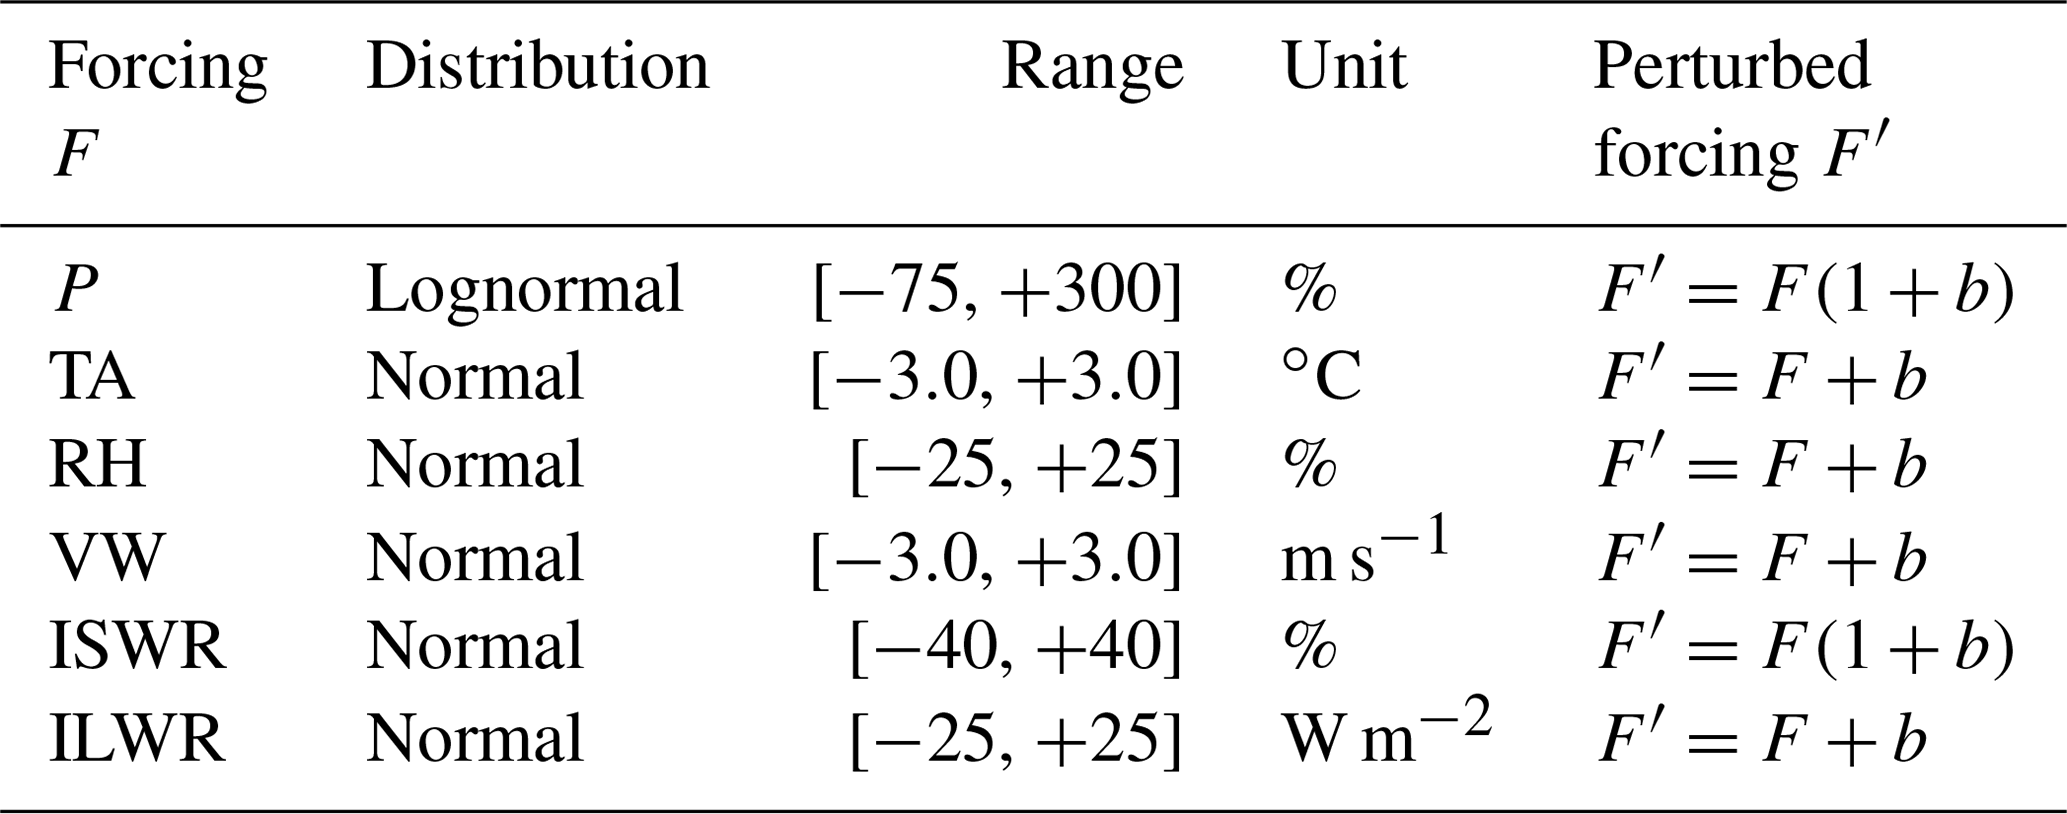
Uncertainties in the measured meteorological data (Table 1) should reflect uncertainties arising from interpolating meteorological data or weather forecast models. Therefore, uncertainties were introduced based on the values suggested by Raleigh et al. (2015). Uncertainties can be seen as a systematic bias with a given range and distribution. For a given time series, a bias b was randomly chosen for each variable, and then that single value was applied to the variable for the entire period. The probability distributions of the biases were described by mean (normal: 1, lognormal: 20) and standard deviation (normal: 1, lognormal: 0.5) and then scaled within the given ranges. The bias b was added to the forcing F as for an additive bias and for a multiplicative bias. Raleigh et al. (2015) proposed a multiplicative bias for precipitation (P) and an additive bias for air temperature (TA), relative humidity (RH), wind velocity (VW) and incoming longwave radiation (ILWR). For incoming shortwave radiation (ISWR) we chose a multiplicative bias using a range of 40 % according to the findings of Helbig and Löwe (2012). Biases resulting in non-physical forcing values were filtered to a physical range (e.g., RH was filtered within a range of [0, 100] %). With the given ranges and distributions (Table 1), biases can be interpreted as differences typically observed within a distance of about 2 km and an elevation range of about 200 m. For example, around 68 % of the simulations have a bias in air temperature of −1 to +1 K, which cover temperature differences within an elevation band of around 200 m. Uncertainties in P will yield rather shallow or rather thick snowpacks, as is typically observed for wind-exposed or wind-sheltered slopes.
Table 1Input uncertainties introduced as bias (b) to meteorological forcing.
In the reference run we used the data from the AWS at WFJ to drive the simulations. Then biases were introduced to the input data using three different scenarios. First, we introduced biases during weak layer formation up to the date when the weak layer was covered with new snow from 1 October 2016 to 2 January 2017. The subsequent slab formation process from 3 January to 1 April 2017 occurred under the same conditions as in the reference run. We refer to this first scenario as case WL (Fig. 1b). Second, meteorological conditions during the period of weak layer formation until 2 January 2017 were identical to those of the reference run, while uncertainties were introduced during the period of slab formation after 3 January 2017 (case SL). Third, we introduced uncertainties to meteorological forcing during the entire simulation period (case ALL). For each scenario, a unique set of quasi-random biases was introduced.
2.4 Global sensitivity analysis
Several studies have shown the advantages of considering co-existing sources of uncertainty by using a global sensitivity analysis rather than varying one input factor at a time while keeping all others fixed (Raleigh et al., 2015; Sauter and Obleitner, 2015). Following their approach, we employed a global sensitivity analysis to analyze the influence of input uncertainty to modeled snow instability. Sobol' (1990) suggested a robust method for nonlinear models based on variance decomposition. The total-order sensitivity index STi describes the variance in output variables Y, i.e., snow properties, due to uncertainties introduced to a specific meteorological input Xi, while including interactions with other forcing errors:
where E is the expectation operator, V is the variance operator, Y is the model output and X∼i denotes all input parameters except Xi. Values for STi range from 0 (no sensitivity) to 1 (one-to-one sensitivity).
To efficiently compute STi, a quasi-random set of input uncertainties was generated (Saltelli and Annoni, 2010; Saltelli et al., 2010). For this, two independent matrices of input uncertainties A and B were defined. The elements aji and bji of the two independent matrices A and B thus consist of biases for the input variables randomly picked from the ranges and distributions shown in Table 1. The subscript i ranges from one to the number of parameters k, in our case k=6 is the number of forcings F (see Table 1). The subscript j ranges from one to the number of samples N. The calculation of STi required the perturbation of parameters, so a third matrix was introduced, where all columns were taken from A, except for the ith column, which was taken from B, resulting in a kN×k matrix. From Eq. (6), STi can be computed as follows:
where f(A) is the output variable evaluated on the A matrix and is the output variable evaluated on the matrix. For the calculation of STi, we generated N(2k+2) samples, with N=1000 base samples, resulting in 14 000 simulations for each of the three applied scenarios.
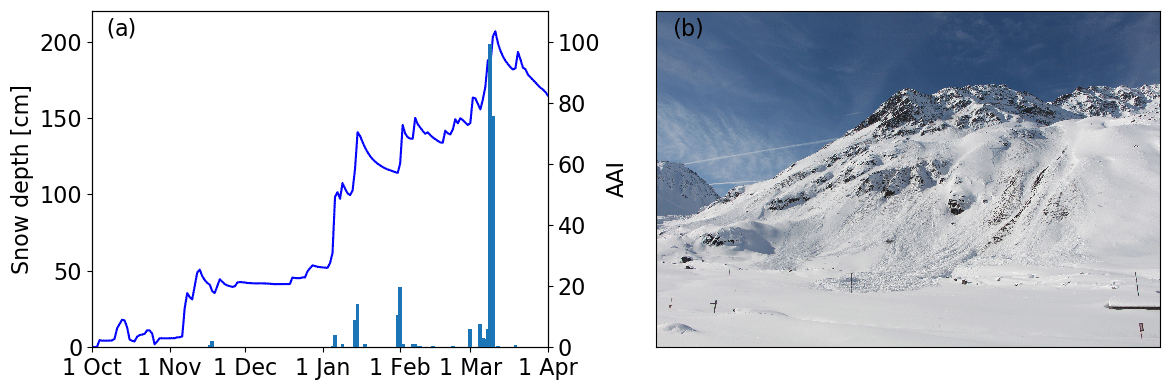
Figure 2(a) Evolution of modeled snow depth (full line) for the winter season 2016–2017 at the WFJ field site above Davos, Switzerland, and avalanche activity index (AAI) observed in the region of Davos (blue bars). (b) Avalanches that occurred during the cycle of 9–10 March 2017, in the valley of Dischma, Davos (picture taken on 15 March 2017). Often the ground or rocks are visible on the bed surface. This was a typical phenomenon for the winter season 2016–2017 due to the old snow problem.
3.1 Winter evolution
The winter started with a snow storm accumulating around 50 cm of snow at the beginning of November 2016 (Fig. 1). A melt–freeze crust subsequently formed at the snow surface due to high air temperatures between 16 and 19 November 2016 at around 25 cm from the ground (Fig. 1b). This crust was also reported in manually observed snow profiles (Fig. 1a). Until 2 January 2017, 20 cm of snow accumulated above the crust (Fig. 1). As the weather was mostly clear, the shallow snowpack was subject to strong temperature gradients during that period. The snow above the crust transformed into a weak layer of faceted crystals and depth hoar, which persisted throughout the entire season 2016–2017. This layer was visible in the simulated stratigraphy between 25 and 35 cm. After 2 January 2017, another 50 cm of snow accumulated, such that the snow depth increased from 50 to 100 cm within two days. Several small snow storms followed until a maximum snow depth of about 200 cm was reached on 10 March 2017. Although the snow depth only increased by around 50 cm between 4 and 10 March 2017, the peak of avalanche activity was observed by the end of this precipitation period during 9 March (Fig. 2a). Many very large avalanches occurred during this period. Many avalanches in the region of Davos entrained the whole snowpack so that the ground and rocks were visible on the bed surface (Fig. 2b). As there were no fracture line profiles recorded, we cannot know in which weak layer the primary failure occurred. Since the weak layer that had formed in December 2016 was the most prominent persistent weak layer within the snowpack (Fig. 1), this weak layer may have been the critical weakness. However, it is also possible that the primary failure occurred between new snow and old snow surface and then stepped down and entrained much of the old snowpack.
3.2 Properties of weak layer and slab
To quantify the influence of input uncertainty on slab and weak layer properties for the three cases, we focused on two specific points in time: 2 January 2017 when we investigated weak layer properties before burial and 9 March 2017 when avalanche activity peaked in the region of Davos (Heck et al., 2019).
3.2.1 2 January 2017
We present weak layer and slab properties on 2 January 2017 with results from the reference run and case WL because up to 2 January 2017 case SL was identical to the reference run and the distributions of input uncertainties were the same for case WL and case ALL.
On 2 January 2017, the percentage of faceted layers was highly sensitive to air temperature, while the thickness of the weak layer was sensitive to both TA and P (Fig. 3). Grain size and density of the weak layer were most sensitive to precipitation. Weak layer shear strength on 2 January 2017 was most sensitive to TA, P and VW (ST>0.3).
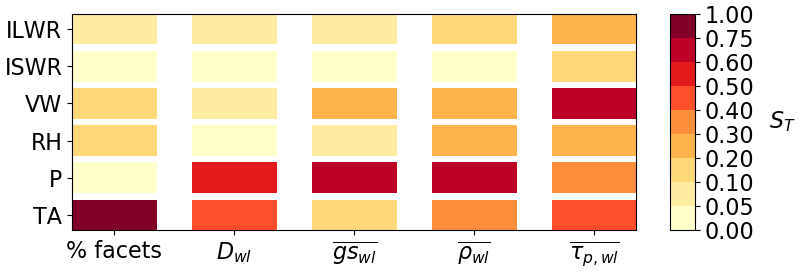
Figure 3Total sensitivity index of weak layer variables on meteorological input uncertainty on 2 January 2017. Weak layer variables are the proportion of faceted layers (% facets), weak layer thickness (Dwl), weak layer grain size (), weak layer density () and weak layer shear strength ().
In the reference run, 95 % of the layers that had formed between 16 November and 2 January consisted of faceted grains with a mean grain size of 1.3 mm and a density of 188 kg m−3 on 2 January 2017 (triangles in Fig. 4). For case WL, 36 % of the 14 000 simulations also predicted that at least 95 % of the layers that had formed between 16 November and 2 January consisted of faceted grains (Fig. 4a). In only 0.3 % of the simulations did the weak layer not form at all; i.e., there were no layers of faceted crystals. These simulations were characterized by a positive air temperature bias (red ellipse in Fig. 4a). Warmer air temperatures yielded less faceted layers within the weak layer, and above a bias of +1∘ C the percentage of faceted crystals occasionally reached 0 %. Increasing P led to denser weak layers and smaller grains (Fig. 4b and c). Positive biases in P result in thicker snowpacks, as would typically be observed in wind-sheltered locations. In fact, in 76 % of the simulations, the density of the weak layer was lower, and in 67 % of the simulations the grain size was larger than in the reference run. Both properties, soft snow (low density) and larger grains, are often associated with unstable weak layers (van Herwijnen and Jamieson, 2007).
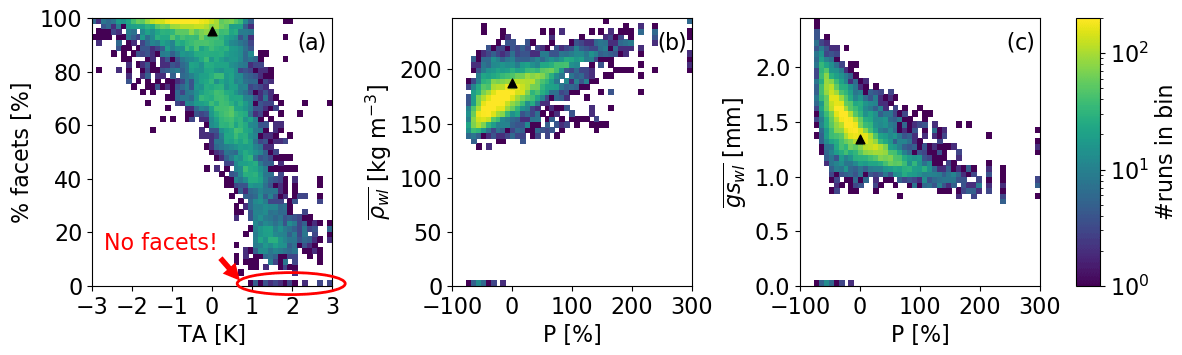
Figure 4(a) Proportion of faceted layers within the weak layer with uncertainty in air temperature (TA) on 2 January 2017. (b) Density () and (c) grain size () of faceted layers with uncertainty in precipitation (P). Colors indicate the binned number of simulations. Triangles indicate the reference run. The red ellipse indicates simulations in which no weak layer formed.
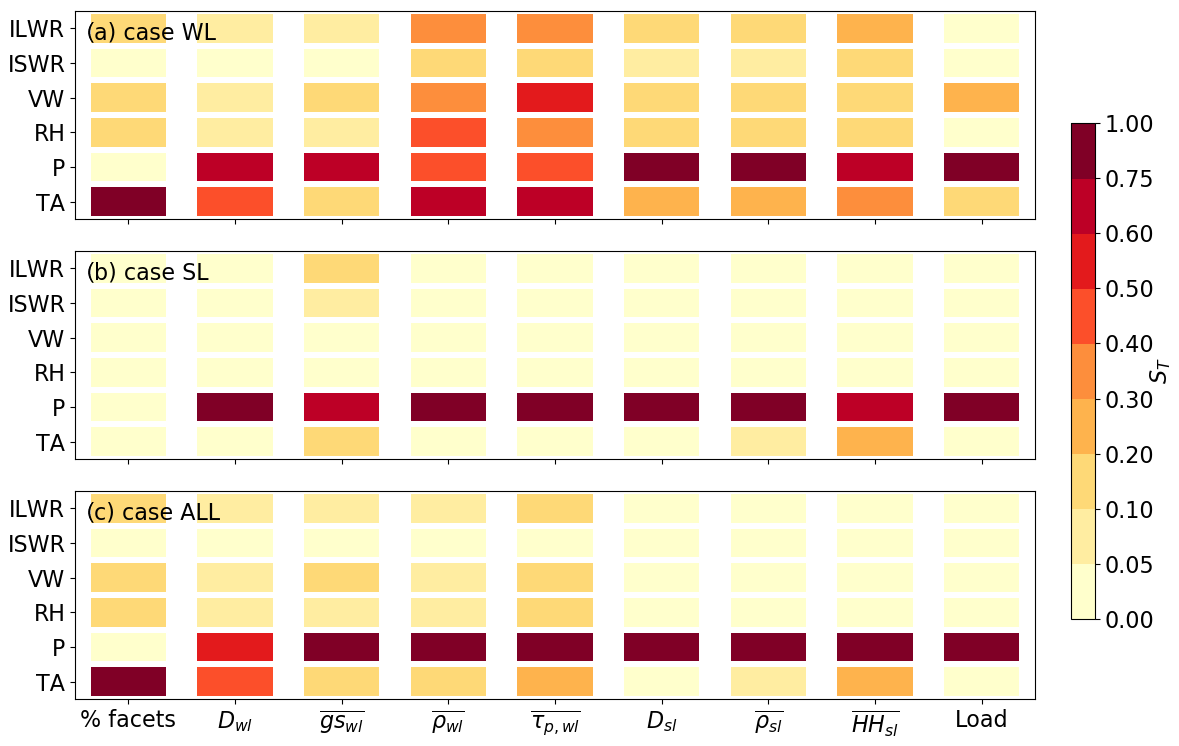
Figure 5Total sensitivity index of different weak layer and slab variables on meteorological input uncertainty on 9 March 2017 for (a) case WL, (b) case SL and (c) case ALL. Variables are the proportion of facets (% facets), weak layer thickness (Dwl), weak layer grain size (), weak layer density (), weak layer shear strength (), slab thickness (Dsl), slab density (), hand hardness index of the slab () and load due to the slab weight (Load).
3.2.2 9 March 2017
We present weak layer and slab properties on 9 March 2017 by comparing all three cases with results from the reference run.
The total sensitivity indices for case WL on 9 March 2017 were similar to those on 2 January 2017 for Dwl and . For density and shear strength, all input parameters except ISWR increased to ST>0.3 (Fig. 5a). In contrast, for case SL, weak layer and slab properties were primarily sensitive to P (Fig. 5b). Increasing P increased the load on the weak layer and yielded smaller grains and higher weak layer density (Fig. 6d and e). For case ALL, uncertainties in P dominated weak and slab properties. Similarly, density and shear strength of the weak layer on 9 March 2017 were mostly sensitive to P, suggesting that the density evolution of the weak layer was determined by the load rather than the original density after burial.
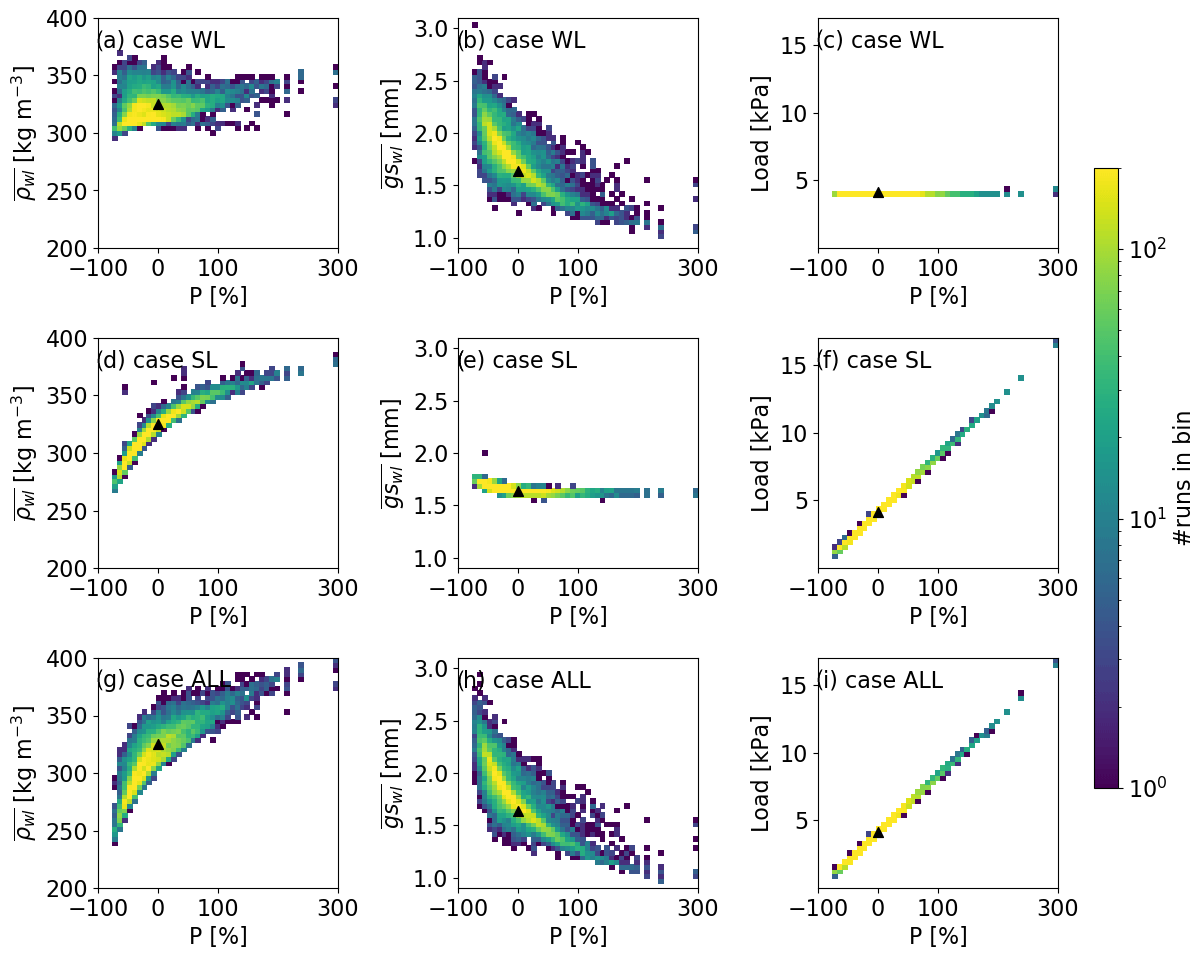
Figure 6Modeled (a, d, g) weak layer density, (b, e, h) weak layer grain size and (c, f, i) load of the slab with uncertainty in precipitation (P) on 9 March 2017 for (a–c) case WL, (d–f) case SL and (g–i) case ALL. Colors indicate the binned number of simulations. Triangles indicate the reference run.
On 9 March 2017, mean weak layer density (325 kg m−3) and mean grain size (1.6 mm) in the reference run had clearly increased compared to 2 January 2017. On top of the weak layer, the reference run simulated a 165 cm thick slab with a mean density of 256 kg m−3 corresponding to a load of 4.15 kPa (triangles in Fig. 6).
In all three cases, around 66 % of the simulations predicted a weak layer with a lower mean density than in the reference run. The range was smallest for case WL, with ranging from 295 to 370 kg m−3, and highest for case ALL, with ranging from 240 to 401 kg m−3 (Fig. 6a, d and g). This means that the weak layer density on 9 March 2017 was more influenced by the slab than the original density prior to burial. In contrast, the grain size of the weak layer rather depended on the original grain size. Hence, the dispersion for case ALL was similar to case WL, with ranging from 1.0 to 3.0 mm, whereas the predicted by case SL was similar to the reference run, ranging from 1.6 to 2.0 mm (Fig. 6b, e and h). In all three cases, around 70 % of the simulations predicted grain sizes larger than the reference run. As expected, the range in slab properties for case WL was minimal on 9 March 2017; e.g., the load of the slab ranged from 4.13 to 4.18 kPa. In contrast, the load for case SL and case ALL varied by a factor of 16, ranging from 1.03 to 16.7 kPa (Fig. 6c, f and i). In all three cases, around one-third of the simulations predicted a higher slab load than the reference run. Other slab properties, e.g., slab density, did not vary much for case WL, whereas they greatly varied for case SL and case ALL. To sum up, different slab properties strongly influenced the evolution of the weak layers, whereas different weak layers, as expected, did not influence the evolution of the slab.
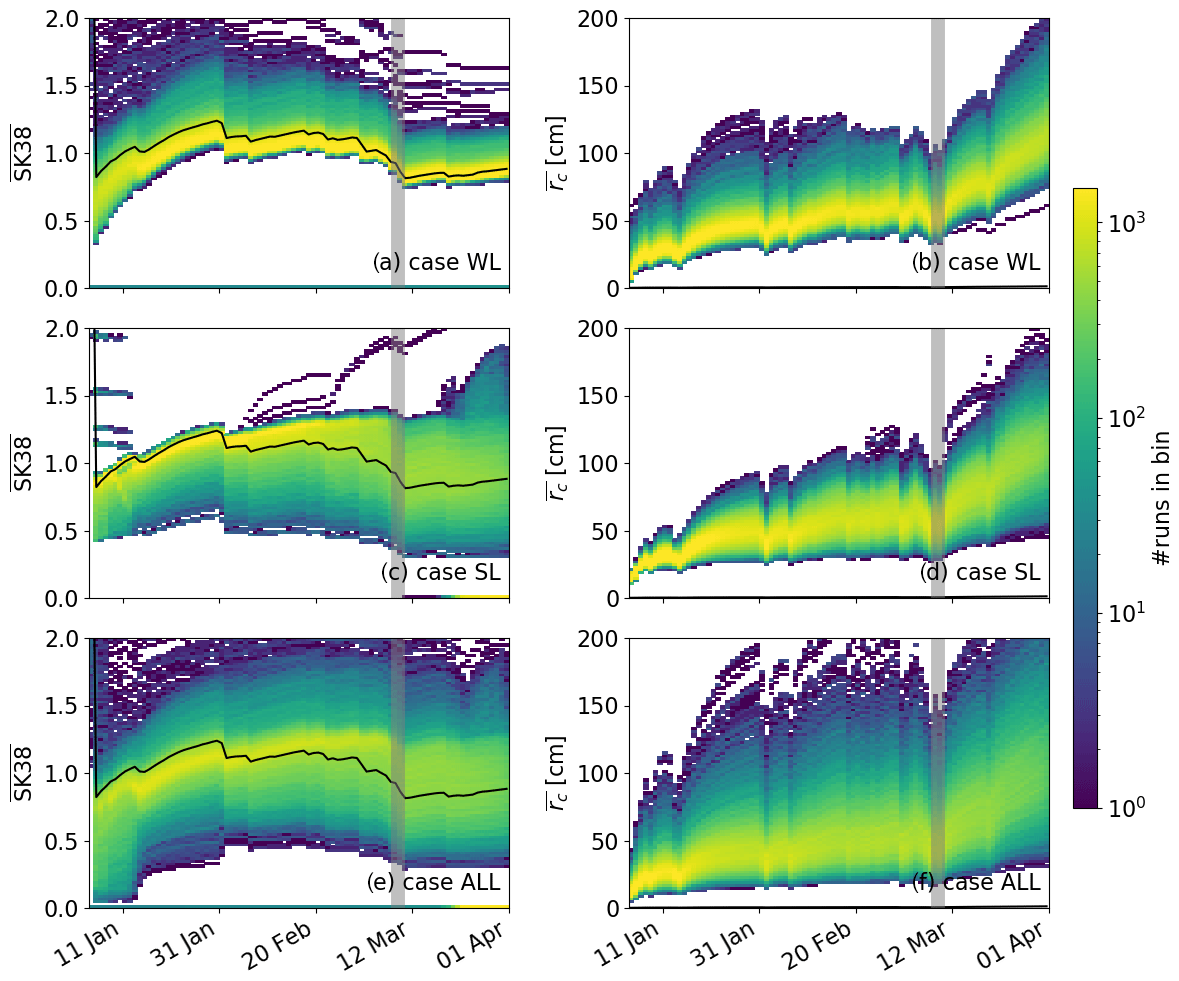
Figure 7Temporal evolution (January to March 2017) of input uncertainties to modeled skier stability index for (a) case WL, (c) case SL and (e) case ALL and critical crack length for (b) case WL, (d) case SL and (f) case ALL. Colors indicate the binned number of simulations. Black lines show the reference run and grey vertical bars highlight the period of high avalanche activity.
3.3 Evolution of snow stability
After burial of the weak layer, snow stability of the reference run, i.e., and , initially increased with time (black lines in Fig. 7). During periods with precipitation (increases in snow depth in Fig. 1), both indices decreased, whereas during periods without precipitation, both indices increased. However, this increase was very weak for . On 30 January 2017, reached a maximum value of 1.24. After that, decreases in during periods with precipitation events were stronger than increases in during periods without precipitation. Therefore, an overall decrease was observed for after 30 January 2017, such that reached a minimum value of 0.81 during the period of high avalanche activity (10 March 2017). In contrast, increased more prominently during periods without precipitation, such that reached a minimum value of 15 cm right after burial and a maximum value of 124 cm by the end of March. During periods with precipitation, decreased, e.g., decreased just before the period 9 March 2017, such that lower values for during the peak of avalanche activity were modeled (indicated by grey vertical bars in Fig. 7). Therefore, days with high avalanche activity coincided with days with small values for and small values for (Fig. 8). Similar to the reference run, and initially increased for all three cases. After 30 January, an overall decrease in was observed, while the increase in was more pronounced towards the end of the simulation period. During periods with precipitation, decreases in snow stability were observed (Fig. 7).
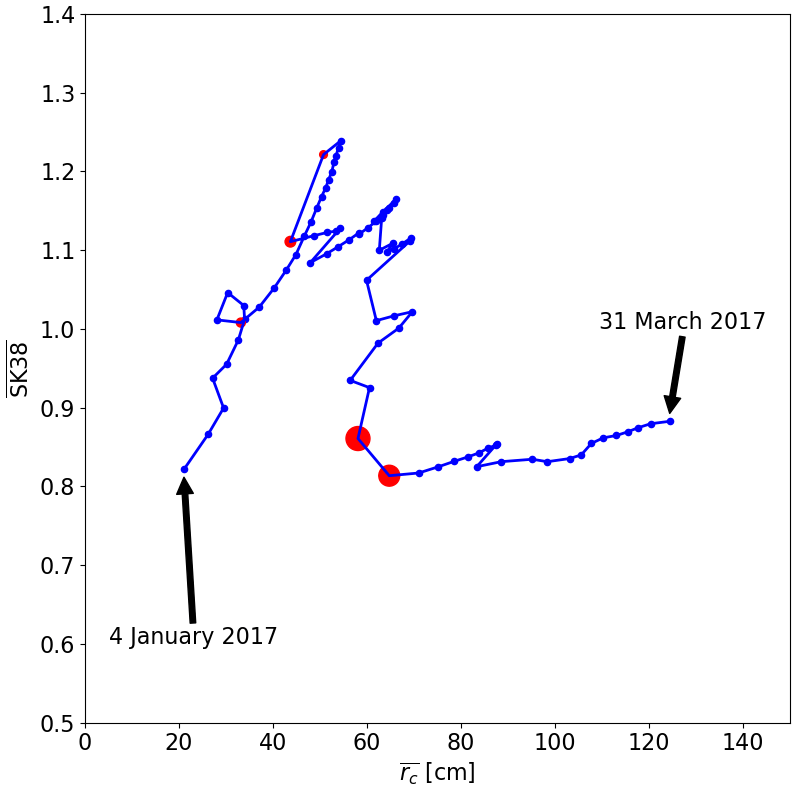
Figure 8 with of the reference run for all days from 4 January 2017 to 31 March 2017. Red circles are days with AAI > 10, and the size of the circles corresponds to the value of AAI.
While was mostly sensitive to precipitation for case WL, was highly sensitive to TA (Fig. 9a and b). In contrast, for case SL and case ALL, the total-order sensitivity index clearly highlighted precipitation as the most dominant input parameter for stability indices (Fig. 9c–f). Interestingly, the instability metrics were affected in different ways by uncertainties in precipitation. On 9 March 2017, for all cases, increasing precipitation yielded larger critical crack lengths (Fig. 10). The strongest increase for with P was observed for case ALL (Fig. 10d). Whereas increased with increasing TA for case WL (Fig. 10a), it clearly decreased with increasing P for case SL and case ALL (Fig. 10c and e). The decrease is a consequence of the more prominent increase in slab load than in shear strength. In fact, the shear strength increased with increasing precipitation by a factor of 2 while slab load increased with increasing precipitation by a factor of 6 (not shown).
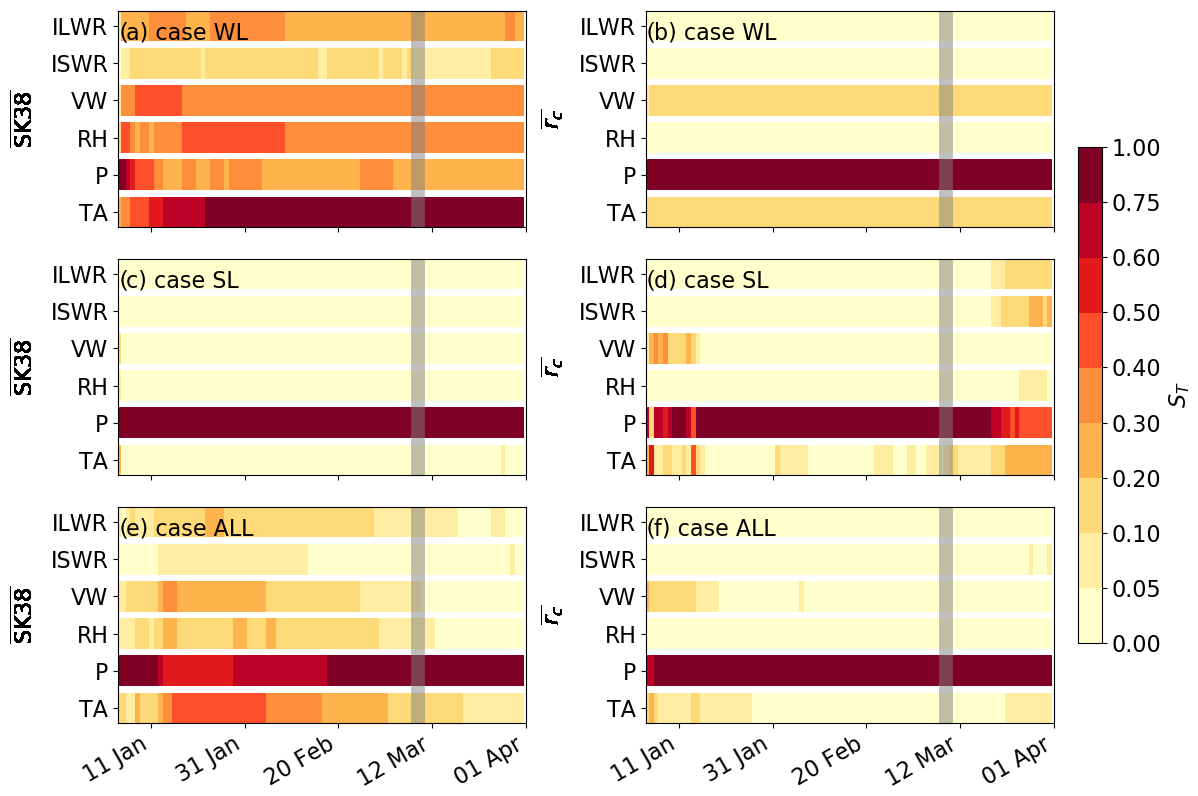
Figure 9Evolution of the total sensitivity index ST for the model output and for case WL, case SL and case ALL (from top to bottom). Grey vertical bars highlight a period of high avalanche activity.
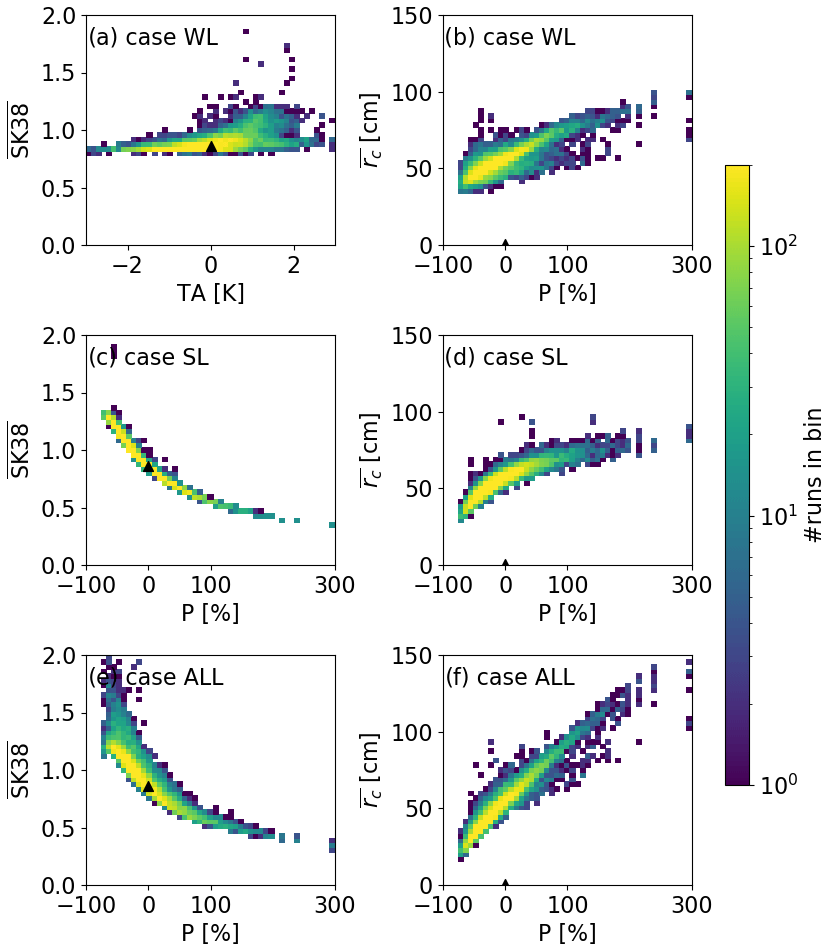
Figure 10Modeled (a, c, e) and (b, d, f) with uncertainty in the most sensitive input parameters, i.e., air temperature (TA) and precipitation (P), on 9 March 2017 for (a, b) case WL, (c, d) case SL and (e, f) case ALL. Colors indicate the number of simulations in each of the 50×50 bins. Triangles indicate the reference run.
The range of was larger in case SL compared to case WL, suggesting that the load due to slab weight had a stronger influence on than the shear strength of the weak layer. On 9 March 2017 for instance, ranged from 0.79 to 1.87 for case WL and 0.33 to 1.90 for case SL (Fig. 10a and c). This suggests that different slabs influenced more than different weak layers; i.e., the slab was more important. Case ALL showed the largest range from 0.32 to 3.05 (Fig. 10e). Around one-third of the simulations for all cases predicted a smaller than that for the reference run with a value of 0.86 (case WL: 44 %, case SL: 36 % and case ALL: 33 %). The spread of was similar in case WL and case SL, ranging from around 30 to 100 cm on 9 March 2017 (Fig. 10b and d). For case ALL, the spread of rc was larger, ranging from 18 to 146 cm on 9 March 2017 (Fig. 10f). This suggests that was equally impacted by weak layer and slab properties. Around two-thirds of the simulations in all three cases predicted a value of smaller than in the reference run with a value of 58 cm (case WL: 71 %, case SL: 65 % and case ALL: 69 %). However, only 30 % of the simulations of case WL predicted both a smaller and a smaller value on 9 March 2017. For case SL and case ALL, only 6 % and 7 % of the simulations, respectively, predicted lower values for both stability indices. This means that if a simulation yields a smaller , was mostly larger. Stability indices therefore did not respond to the biases in a similar manner.
We examined the sensitivity of modeled snow stability to meteorological input uncertainty using a global sensitivity analysis approach suggested by Sobol' (1990). To do so, we introduced biases to six meteorological inputs: air temperature, relative humidity, precipitation, wind velocity, and incoming short- and long-wave radiation, which are all required as input variables by the snow cover model SNOWPACK (Lehning et al., 2002). Among these input parameters, precipitation had the most prominent influence on modeled snow stability. Precipitation influences weak layer and slab properties. Although a positive bias in air temperature reduced the percentage of faceted crystals within the weak layer, in most simulations a weak layer had formed, which may indicate a widespread avalanche problem in the region.
We used biases instead of random uncertainties, as Raleigh et al. (2015) investigated different sources of errors and showed that biases had more influence on model output. For the parameter biases, we used the ranges suggested by Raleigh et al. (2015), who provided a comprehensive overview of typical variations in these parameters in complex topography. The only exception was for ISWR, for which we chose a multiplicative bias rather than a cumulative bias, since we expected bias in ISWR to depend on solar angle. Introducing a lognormal distribution for the bias in precipitation resulted in unequal proportions relative to the reference run (e.g., Figs. 4 and 6). A coefficient of variation for the lognormal distribution was chosen as this reflects typical snow depth patterns observed in mountainous terrain (e.g., Liston, 2004). Hence, relatively more simulations had smaller P values than the reference run. While the snow cover model SNOWPACK has traditionally been forced with measured data from automatic weather stations (Lehning et al., 1999; Monti et al., 2016; Wever et al., 2015), it is increasingly used for spatially distributed model applications either by interpolating measured meteorological data or using output from numerical weather prediction models (Bellaire et al., 2011; Bellaire and Jamieson, 2012; Schlögl et al., 2016). As such, the introduced biases can be seen as potential errors due to the interpolation schemes, or biases in the NWP output. For instance, for air temperature, the variation of ± 3 ∘ C (Table 1) corresponds roughly to typical errors between NWP output and TA measurements (Bellaire et al., 2017).
In complex terrain, wind-induced processes strongly influence snow distribution (Mott and Lehning, 2010). The bias introduced for P agrees with the high variations in snow depths, measured at very small scales (Bühler et al., 2015). Precipitation had the most significant impact on modeled sensitivity, which may partly be due to the high magnitude of bias (Raleigh et al., 2015). These results have implications for spatial snow cover modeling, which is increasingly applied in avalanche forecasting (Bellaire et al., 2017, 2011; Morin et al., 2020; Lafaysse et al., 2017; Vernay et al., 2015). Indeed, our results suggest that if we want to obtain realistic spatial patterns, we need to adequately model snow distribution in mountainous regions. This is not an easy task, as snow distribution is very complex (Grünewald et al., 2010; Helbig and van Herwijnen, 2017; Kirchner et al., 2014; Reuter et al., 2016). Since the mountain snow cover is largely shaped by snow transport by wind, adequate modeling can only be achieved through computationally expensive snow drift modeling (Gerber et al., 2018; Mott and Lehning, 2010; Vionnet et al., 2014). While from an operational point of view, high-resolution modeling (resolution of several meters) on large domains is presently out of reach, alternative approaches were suggested (e.g., Helbig et al., 2017; Vögeli et al., 2016; Winstral et al., 2002).
We investigated the formation and subsequent burial of a weak layer consisting of faceted and depth hoar crystals near the base of the snow cover, a so-called persistent weak layer (Jamieson and Johnston, 1992; Schweizer et al., 2003a). Such early-season weak layers are often widespread and associated with poor stability for most of the season. Results from our sensitivity analysis thus showed that the formation of the weak layer was mostly influenced by precipitation and air temperature early in the season (Fig. 3). This comes as no surprise since both the parameters directly affect the temperature gradient across the snowpack, which is the most important driver for the formation of facets and depth hoar (Birkeland, 1998; Miller and Adams, 2009; Staron et al., 2012). Our results also show that the formation of persistent weak layers is rather robust. Indeed, in only 0.3 % of the simulations no weak layer developed, suggesting that even within the range of meteorological input we used, if a prolonged dry-weather period occurs after the first snowfall, such weak layers will generally form. Only warm weather can prevent the formation of a weak layer during a prolonged dry-weather period, which is generally found at lower elevations. Our results suggest that spatial snow cover modeling can be used to predict the elevation range for weak layers. This result agrees with Horton et al. (2015), who examined how variability in meteorological fields from numerical weather prediction models across elevations resulted in reasonable predictions of surface hoar formation. However, we only looked at one type of weak layer. The formation and subsequent burial of surface hoar might be more sensitive to other meteorological parameters, such as wind speed (Stössel et al., 2010). In fact, Slaughter (2010) investigated the sensitivity of near-surface faceting and surface hoar formation at midday and midnight to input parameters using a snow thermal model. He found incoming long-wave radiation to be the most dominant input parameter, although they did not investigate the sensitivity to precipitation.
Grain size and hardness are important parameters to identify persistent weak layers and evaluate snow stability (e.g., Schweizer and Jamieson, 2007; van Herwijnen and Jamieson, 2007). The low sensitivity of weak layer grain size to air temperature and radiation (Fig. 4) during the weak layer formation period was somewhat surprising, since both these parameters are highly relevant for the energy input at the snow surface and thus snow surface temperature and temperature gradients across the snowpack. However, the weak layer formed in December, when the energy balance at the snow surface is generally negative (due to surface cooling), as days are very short and incoming short-wave radiation is very low. Even with positive air temperature, the snow surface often stays well below zero, except on very steep south-facing slopes (higher incoming short-wave radiation), or when there is thick cloud cover (higher incoming long-wave radiation). Since there was generally only limited cloud cover in December 2016 (low incoming long-wave radiation), and the simulations were performed for a flat-field site (low incoming short-wave radiation), we believe our results are plausible. Hence, weak layer grain size was mostly sensitive to uncertainties in precipitation, as thinner snow covers generally have a lower density (less settlement) and experience larger temperature gradients. Weak layer shear strength was sensitive to uncertainties in wind velocity and air temperature (Fig. 4). Shear strength in SNOWPACK is a function of grain type and density. As new snow density in SNOWPACK depends on VW and TA, we believe that weak layer shear strength depended on these variables for case WL on 2 January 2017. In fact, weak layer shear strength increased with increasing VW and increasing TA (not shown). As different weak layers on 2 January do not necessarily react exactly the same to the same slab, there were some changes in ST between 2 January and 9 March. Indeed, harder and denser weak layers will settle less than soft low-density weak layers.
We focused on two metrics of snow instability, namely SK38 (Eq. 2) and rc (Eq. 3). These metrics relate to both failure initiation (SK38) and crack propagation (rc), two fundamental processes required for avalanche release (Reuter and Schweizer, 2018; van Herwijnen and Jamieson, 2007). Given our current understanding of snow stability, critical weak layers require both a low failure initiation propensity and a low crack propagation propensity (Reuter and Schweizer, 2018). While both these indices have been validated (Schweizer et al., 2006; Richter et al., 2019), thus far no threshold values exist that separate stable from unstable snow conditions adapted for use in SNOWPACK. As such, we compared these stability indices to the reference run to determine if the introduced biases resulted in a more stable or a less stable snowpack, with a particular focus on 9 March 2017 when avalanche activity in the region of Davos peaked (Fig. 2).
To better assess the role of slab and weak layer properties with respect to snow instability, we used three scenarios where we varied meteorological input only during the weak layer formation period, only during the slab formation period and during the entire period. These three scenarios clearly highlighted that weak layer and slab formation are sensitive to different meteorological parameters and can influence snow instability in very different ways (Figs. 5 and 9). With higher precipitation during the slab formation period, rc generally increased, whereas SK38 decreased (Fig. 10c and d). Precipitation determined slab load and the consolidation of slab and weak layers. More precipitation resulted in thicker slabs which typically have a higher density, hardness and stiffness (van Herwijnen and Jamieson, 2007; van Herwijnen et al., 2016). Furthermore, due to higher slab load, the weak layer shear strength increased. Both stiffer slab and higher weak layer shear strength resulted in higher values for rc. This is in line with other parametric studies on snow instability showing that slab properties substantially affect snow instability (Gaume et al., 2017; Reuter and Schweizer, 2018; Schweizer and Reuter, 2015).
In contrast, SK38 decreased during precipitation due to the increase in slab load and slightly increased during periods without precipitation (Fig. 7a, c and e) due to the lagged increase in weak layer shear strength (Jamieson et al., 2007). However, the increase in slab load was more prominent than the increase in weak layer shear strength, resulting in an overall decrease in SK38, and values for SK38 remained low towards the end of March 2017 (Figs. 7 and 8). For the same reason, SK38 was affected differently than rc, with uncertainties in precipitation. Hence, SK38 decreased with increasing P (Fig. 10c) during the slab formation period. In fact, with increasing P, the slab load by 9 March had increased 3 times as much as weak layer shear strength (not shown). With increasing slab thickness the skier stress on the weak layer decreases and skier triggering becomes unlikely. SK38 can no longer be used to assess skier triggering (Schweizer et al., 2016). Instead, other stability indices should be considered, e.g., the natural stability index. However, the denominator in Eq. (2) is dominated by the shear stress due to the load of the slab for thicker slabs. Hence SK38 approaches the natural stability index for slab thicknesses above approximately 1 m. During the precipitation event of 9 March 2017, these strength-over-stress approaches reach a small value, meaning that a failure is easy to initiate. Even towards the end of March 2017, SK38 and the natural stability index (not shown) remain very low, which is rather counterintuitive regarding failure initiation.
In the context of climate change, Castebrunet et al. (2014) suggested a decrease in avalanche activity for the Alps and an increase in wet-snow avalanche activity during winter at high elevations. Martin et al. (2001) assumed that avalanche hazard (number of days with moderate or high avalanche hazard) decreased with increasing TA. Our study also allows the effect of increasing temperature on snow instability to be assessed. With increasing TA during the formation of the weak layer, the weak layer will get stronger, meaning higher density and smaller grain size. This results in an overall more stable snowpack. However, in our case study, in only 0.3 % of the simulations no weak layer formed at all. We therefore expect, that instabilities due to persistent weak layers will continue to challenge avalanche forecasting. This is of particular interest since about 70 % of 186 skier-triggered avalanches were released in weak layers of persistent grain types, i.e., surface hoar, faceted crystals, and depth hoar (Schweizer and Jamieson, 2001). Furthermore, the primary driver of snow instability after weak layer formation was precipitation. With climate change, extreme events may become more frequent; e.g., prolonged dry periods – favoring the formation of weak layers – may alternate with more extreme precipitation events (CH2018, 2018), with partly opposing effects on our snow instability metrics.
We investigated the sensitivity of two modeled snow instability metrics for a weak layer consisting of faceted and depth hoar crystals on meteorological input uncertainty by employing a global sensitivity analysis. We evaluated three scenarios, in which uncertainties were introduced during the weak layer formation period, the slab formation period and the whole winter season. This approach allowed the effects on weak layer and slab properties, which both contribute to snow stability, to be independently investigated.
The process of weak layer formation was very robust as in most simulations persistent grain types formed. However, weak layer properties strongly depended on meteorological conditions during the formation period. While we only investigated one winter with a rather thin snow cover, we expect this to also hold for a thicker snow cover, as the upper layers will experience strong temperature gradients. Hence, accurate meteorological input is important for forecasting the spatial distribution of weak layers and how weak they really are, since this helps the assessment of snow instability later in the season.
Once a weak layer had formed, both slab and weak layer properties were strongly sensitive to uncertainties in precipitation during the slab formation period. Precipitation determined the load and hence the settling of slab and weak layers. These snow properties, however, influenced modeled snow stability in different ways. A positive bias in precipitation, which can be found in wind-shaded areas with above-average accumulation, resulted in an overall lower skier stability index and higher critical crack length. In contrast, for areas with below-average snow depth, a higher skier stability index and a lower critical crack length were simulated. Our results suggest that even if a persistent weak layer forms at the start of the season, the remainder of the winter season can still have a profound effect on the overall evolution of snow instability.
As snow deposition in complex terrain substantially varies during storms and given the high sensitivity of stability to precipitation, numerical forecasting of snow stability in 3D terrain will require spatially highly resolved precipitation patterns.
All relevant data, including SNOWPACK simulations and manually observed snow profiles, are available at https://doi.org/10.16904/envidat.183 (Richter et al., 2020).
BR processed and analyzed the simulations. AvH and JS initiated this study. BR prepared the paper with contributions from all co-authors.
The authors declare that they have no conflict of interests.
Thanks to Mathias Bavay for helping with SNOWPACK issues, Thomas Kramer for IT support and Henning Löwe for discussions on programming style. Furthermore, we thank Simon Horton, one anonymous referee and the editor Margreth Keiler, who helped us to improve this paper. Bettina Richter has been supported by a grant of the Swiss National Science Foundation (200021_169641).
This research has been supported by the Swiss National Science Foundation (grant no. 200021_169641).
This paper was edited by Margreth Keiler and reviewed by Simon Horton and one anonymous referee.
Bartelt, P. and Lehning, M.: A physical SNOWPACK model for the Swiss avalanche warning Part I: Numerical model, Cold Reg. Sci. Technol., 35, 123–145, https://doi.org/10.1016/S0165-232X(02)00074-5, 2002. a
Bellaire, S. and Jamieson, B.: Nowcast with a forecast–snow cover simulations on slopes, in: Proceedings of International Snow Science Workshop, Anchorage, USA, 172–178, 2012. a
Bellaire, S., Jamieson, B., and Fierz, C.: Forcing the snow-cover model SNOWPACK with forecasted weather data, The Cryosphere, 5, 1115–1125, https://doi.org/10.5194/tc-5-1115-2011, 2011. a, b, c, d
Bellaire, S., van Herwijnen, A., Mitterer, C., and Schweizer, J.: On forecasting wet-snow avalanche activity using simulated snow cover data, Cold Reg. Sci. Technol., 144, 28–38, https://doi.org/10.1016/j.coldregions.2017.09.013, 2017. a, b
Birkeland, K. W.: Terminology and Predominant Processes Associated with the Formation of Weak Layers of Near-Surface Faceted Crystals in the Mountain Snowpack, Arct. Alp. Res., 30, 193–199, https://doi.org/10.2307/1552134, 1998. a
Brun, E., David, P., and Sudul, M.: A numerical-model to simulate snow-cover stratigraphy for operational avalanche forecasting, J. Glaciol., 38, 13–22, 1992. a
Bühler, Y., Marty, M., Egli, L., Veitinger, J., Jonas, T., Thee, P., and Ginzler, C.: Snow depth mapping in high-alpine catchments using digital photogrammetry, The Cryosphere, 9, 229–243, https://doi.org/10.5194/tc-9-229-2015, 2015. a
Castebrunet, H., Eckert, N., Giraud, G., Durand, Y., and Morin, S.: Projected changes of snow conditions and avalanche activity in a warming climate: the French Alps over the 2020–2050 and 2070–2100 periods, The Cryosphere, 8, 1673–1697, https://doi.org/10.5194/tc-8-1673-2014, 2014. a
CH2018: CH2018 – Climate Scenarios for Switzerland, Technical Report, National Centre for Climate Services, Zurich, ISBN 978-3-9525031-4-0, 2018. a
Côté, K., Madore, J.-B., and Langlois, A.: Uncertainties in the SNOWPACK multilayer snow model for a Canadian avalanche context: sensitivity to climatic forcing data, Phys. Geogr., 38, 124–142, https://doi.org/10.1080/02723646.2016.1277935, 2017. a
Davies, J. H. and Davies, D. R.: Earth's surface heat flux, Solid Earth, 1, 5–24, https://doi.org/10.5194/se-1-5-2010, 2010. a
Durand, Y., Giraud, G., Brun, E., Merindol, L., and Martin, E.: A computer-based system simulating snowpack structures as a tool for regional avalanche forecasting, J. Glaciol., 45, 469–484, 1999. a
Fierz, C., Armstrong, R., Durand, Y., Etchevers, P., Greene, E., McClung, D., Nishimura, K., Satyawali, P., and Sokratov, S.: The international classification for seasonal snow on the ground, HP-VII Technical Document in Hydrology, in: 83. UNESCO-IHP, Paris, France, p. 90, 2009. a
Föhn, P.: The “Rutschblock” as a pratical tool for slope stability evaluation, IAHS-AISH Publ., 162, 223–228, 1987. a, b
Gaume, J., van Herwijnen, A., Chambon, G., Wever, N., and Schweizer, J.: Snow fracture in relation to slab avalanche release: critical state for the onset of crack propagation, The Cryosphere, 11, 217–228, https://doi.org/10.5194/tc-11-217-2017, 2017. a, b, c
Gerber, F., Besic, N., Sharma, V., Mott, R., Daniels, M., Gabella, M., Berne, A., Germann, U., and Lehning, M.: Spatial variability in snow precipitation and accumulation in COSMO–WRF simulations and radar estimations over complex terrain, The Cryosphere, 12, 3137–3160, https://doi.org/10.5194/tc-12-3137-2018, 2018. a
Giraud, G. and Navarre, J.: MEPRA et le risque de déclenchement accidentel d'avalanches, in: Les apports de la recherche scientifique à la sécurité neige, glace et avalanche, in: Actes de Colloque, 30 May–3 June 1995, Chamonix, 145–150, 1995. a
Grünewald, T., Schirmer, M., Mott, R., and Lehning, M.: Spatial and temporal variability of snow depth and ablation rates in a small mountain catchment, The Cryosphere, 4, 215–225, https://doi.org/10.5194/tc-4-215-2010, 2010. a
Günther, D., Marke, T., Essery, R., and Strasser, U.: Uncertainties in Snowpack Simulations – Assessing the Impact of Model Structure, Parameter Choice, and Forcing Data Error on Point-Scale Energy Balance Snow Model Performance, Water Resour. Res., 55, 2779–2800, https://doi.org/10.1029/2018WR023403, 2019. a, b, c
Heck, M., van Herwijnen, A., Hammer, C., Hobiger, M., Schweizer, J., and Fäh, D.: Automatic detection of avalanches combining array classification and localization, Earth Surf. Dynam., 7, 491–503, https://doi.org/10.5194/esurf-7-491-2019, 2019. a
Helbig, N. and Löwe, H.: Shortwave radiation parameterization scheme for subgrid topography, J. Geophys. Res.-Atmos., 117, D03112, https://doi.org/10.1029/2011JD016465, 2012. a
Helbig, N. and van Herwijnen, A.: Subgrid parameterization for snow depth over mountainous terrain from flat field snow depth, Water Resour. Res., 53, 1444–1456, https://doi.org/10.1002/2016WR019872, 2017. a
Helbig, N., Mott, R., van Herwijnen, A., Winstral, A., and Jonas, T.: Parameterizing surface wind speed over complex topography, J. Geophys. Res.-Atmos., 122, 651–667, https://doi.org/10.1002/2016JD025593, 2017. a
Horton, S., Schirmer, M., and Jamieson, B.: Meteorological, elevation, and slope effects on surface hoar formation, The Cryosphere, 9, 1523–1533, https://doi.org/10.5194/tc-9-1523-2015, 2015. a
Jamieson, B., Zeidler, A., and Brown, C.: Explanation and limitations of study plot stability indices for forecasting dry snow slab avalanches in surrounding terrain, Cold Reg. Sci. Technol., 50, 23–34, https://doi.org/10.1016/j.coldregions.2007.02.010, 2007. a
Jamieson, B., Haegeli, P., and Schweizer, J.: Field observations for estimating the local avalanche danger in the Columbia Mountains of Canada, Cold Reg. Sci. Technol., 58, 84–91, https://doi.org/10.1016/j.coldregions.2009.03.005, 2009. a
Jamieson, J. and Johnston, C.: Snowpack characteristics associated with avalanche accidents, Can. Geotechn. J., 29, 862–866, 1992. a
Jamieson, J. and Johnston, C.: Refinements to the stability index for skier-triggered dry-slab avalanches, Ann. Glaciol., 26, 296–302, https://doi.org/10.3189/1998AoG26-1-296-302, 1998. a, b
Jamieson, J. and Johnston, C.: Evaluation of the shear frame test for weak snowpack layers, Ann. Glaciol., 32, 59–69, 2001. a
Kirchner, P. B., Bales, R. C., Molotch, N. P., Flanagan, J., and Guo, Q.: LiDAR measurement of seasonal snow accumulation along an elevation gradient in the southern Sierra Nevada, California, Hydrol. Earth Syst. Sci., 18, 4261–4275, https://doi.org/10.5194/hess-18-4261-2014, 2014. a
Lafaysse, M., Morin, S., Coléou, C., Vernay, M., Serça, D., Besson, F., Willemet, J.-M., Giraud, G., and Durand, Y.: Towards a new chain of models for avalanche hazard forecasting in French mountain ranges, including low altitude mountains, in: Proceedings of the International Snow Science Workshop Grenoble, Chamonix Mont-Blanc, France, 162–166, 2013. a, b
Lafaysse, M., Cluzet, B., Dumont, M., Lejeune, Y., Vionnet, V., and Morin, S.: A multiphysical ensemble system of numerical snow modelling, The Cryosphere, 11, 1173–1198, https://doi.org/10.5194/tc-11-1173-2017, 2017. a, b
Lapo, K. E., Hinkelman, L. M., Raleigh, M. S., and Lundquist, J. D.: Impact of errors in the downwelling irradiances on simulations of snow water equivalent, snow surface temperature, and the snow energy balance, Water Resour. Res., 51, 1649–1670, https://doi.org/10.1002/2014WR016259, 2015. a
Lehning, M., Bartelt, P., and Brown, B.: SNOWPACK model calculations for avalanche warning based upon a new network of weather and snow stations, Cold Reg. Sci. Technol., 30, 145–157, https://doi.org/10.1016/S0165-232X(99)00022-1, 1999. a, b
Lehning, M., Bartelt, P., Brown, B., and Fierz, C.: A physical SNOWPACK model for the Swiss avalanche warning: Part III: meteorological forcing, thin layer formation and evaluation, Cold Reg. Sci. Technol., 35, 169–184, https://doi.org/10.1016/S0165-232X(02)00072-1, 2002. a, b, c, d
Lehning, M., Fierz, C., Brown, B., and Jamieson, B.: Modeling snow instability with the snow-cover model SNOWPACK, Ann. Glaciol., 38, 331–338, https://doi.org/10.3189/172756404781815220, 2004. a, b, c
Lehning, M., Völksch, I., Gustafsson, D., Nguyen, T., Stähli, M., and Zappa, M.: ALPINE3D: A detailed model of mountain surface processes and its application to snow hydrology, Hydrol. Process., 20, 2111–2128, https://doi.org/10.1002/hyp.6204, 2006. a
Liston, G. E.: Representing Subgrid Snow Cover Heterogeneities in Regional and Global Models, J. Climate, 17, 1381–1397, https://doi.org/10.1175/1520-0442(2004)017<1381:RSSCHI>2.0.CO;2, 2004. a
Martin, E., Giraud, G., Lejeune, Y., and Boudart, G.: Impact of a climate change on avalanche hazard, Ann. Glaciol., 32, 163–167, https://doi.org/10.3189/172756401781819292, 2001. a
McClung, D. M. and Schaerer, P.: The Avalanche Handbook, The Mountaineers, Seattle, Washington, USA, 2006. a
Miller, D. A. and Adams, E. E.: A microstructural dry-snow metamorphism model for kinetic crystal growth, J. Glaciol., 55, 1003–1011, https://doi.org/10.3189/002214309790794832, 2009. a
Monti, F., Gaume, J., van Herwijnen, A., and Schweizer, J.: Snow instability evaluation: calculating the skier-induced stress in a multi-layered snowpack, Nat. Hazards Earth Syst. Sci., 16, 775–788, https://doi.org/10.5194/nhess-16-775-2016, 2016. a, b, c
Morin, S., Horton, S., Techel, F., Bavay, M., Coléou, C., Fierz, C., Gobiet, A., Hagenmuller, P., Lafaysse, M., Ližar, M., Mitterer, C., Monti, F., Müller, K., Olefs, M., Snook, J. S., van Herwijnen, A., and Vionnet, V.: Application of physical snowpack models in support of operational avalanche hazard forecasting: A status report on current implementations and prospects for the future, Cold Reg. Sci. Technol., 170, 102910, https://doi.org/10.1016/j.coldregions.2019.102910, 2020. a, b
Mott, R. and Lehning, M.: Meteorological Modeling of Very High-Resolution Wind Fields and Snow Deposition for Mountains, J. Hydrometeorol., 11, 934–949, https://doi.org/10.1175/2010JHM1216.1, 2010. a, b
Pollack, H. ., Hurter, S. J., and Johnson, J. R.: Heat flow from the Earth's interior: Analysis of the global data set, Rev. Geophysics, 31, 267–280, https://doi.org/10.1029/93RG01249, 1993. a
Raleigh, M. S., Lundquist, J. D., and Clark, M. P.: Exploring the impact of forcing error characteristics on physically based snow simulations within a global sensitivity analysis framework, Hydrol. Earth Syst. Sci., 19, 3153–3179, https://doi.org/10.5194/hess-19-3153-2015, 2015. a, b, c, d, e, f, g
Reuter, B. and Schweizer, J.: Describing snow instability by failure initiation, crack propagation, and slab tensile support, Geophys. Res. Lett., 45, 7019–7027, https://doi.org/10.1029/2018GL078069, 2018. a, b, c, d
Reuter, B., Schweizer, J., and van Herwijnen, A.: A process-based approach to estimate point snow instability, The Cryosphere, 9, 837–847, https://doi.org/10.5194/tc-9-837-2015, 2015. a
Reuter, B., Richter, B., and Schweizer, J.: Snow instability patterns at the scale of a small basin, J. Geophys. Res.-Earth, 121, 257–282, https://doi.org/10.1002/2015JF003700, 2016. a
Richter, B., Schweizer, J., Rotach, M. W., and van Herwijnen, A.: Validating modeled critical crack length for crack propagation in the snow cover model SNOWPACK, The Cryosphere, 13, 3353–3366, https://doi.org/10.5194/tc-13-3353-2019, 2019. a, b, c, d, e, f, g
Richter, B., van Herwijnen, A., Rotach, M. W., and Schweizer, J.: Sensitivity of modeled snow instability (dataset), EnviDat, https://doi.org/10.16904/envidat.183, 2020. a
Saltelli, A. and Annoni, P.: How to avoid a perfunctory sensitivity analysis, Environ. Model. Softw., 25, 1508–1517, 2010. a
Saltelli, A., Annoni, P., Azzini, I., Campolongo, F., Ratto, M., and Tarantola, S.: Variance based sensitivity analysis of model output. Design and estimator for the total sensitivity index, Comput. Phys. Commun., 181, 259–270, https://doi.org/10.1016/j.cpc.2009.09.018, 2010. a
Sauter, T. and Obleitner, F.: Assessing the uncertainty of glacier mass-balance simulations in the European Arctic based on variance decomposition, Geosci. Model Dev., 8, 3911–3928, https://doi.org/10.5194/gmd-8-3911-2015, 2015. a, b
Scapozza, C.: Entwicklung eines dichte- und temperaturabhängigen Stoffgesetzes zur Beschreibung des visko-elastischen Verhaltens von Schnee, PhD thesis, ETH Zürich, Zurich, 2004. a
Schlögl, S., Marty, C., Bavay, M., and Lehning, M.: Sensitivity of Alpine3D modeled snow cover to modifications in DEM resolution, station coverage and meteorological input quantities, Environ. Model. Softw., 83, 387–396, https://doi.org/10.1016/j.envsoft.2016.02.017, 2016. a, b
Schweizer, J. and Jamieson, J.: Snow cover properties for skier triggering of avalanches, Cold Reg. Sci. Technol., 33, 207–221, https://doi.org/10.1016/S0165-232X(01)00039-8, 2001. a
Schweizer, J. and Jamieson, J.: A threshold sum approach to stability evaluation of manual snow profiles, Cold Reg. Sci. Technol., 47, 50–59, https://doi.org/10.1016/j.coldregions.2006.08.011, 2007. a
Schweizer, J. and Reuter, B.: A new index combining weak layer and slab properties for snow instability prediction, Nat. Hazards Earth Syst. Sci., 15, 109–118, https://doi.org/10.5194/nhess-15-109-2015, 2015. a
Schweizer, J., Jamieson, J., and Schneebeli, M.: Snow avalanche formation, Rev. Geophys., 41, 1016, https://doi.org/10.1029/2002RG000123, 2003a. a, b, c
Schweizer, J., Kronholm, K., and Wiesinger, T.: Verification of regional snowpack stability and avalanche danger, Cold Reg. Sci. Technol., 37, 277–288, 2003b. a
Schweizer, J., Bellaire, S., Fierz, C., Lehning, M., and Pielmeier, C.: Evaluating and improving the stability predictions of the snow cover model SNOWPACK, Cold Reg. Sci. Technol., 46, 52–59, https://doi.org/10.1016/j.coldregions.2006.05.007, 2006. a, b
Schweizer, J., Reuter, B., van Herwijnen, A., Richter, B., and Gaume, J.: Temporal evolution of crack propagation propensity in snow in relation to slab and weak layer properties, The Cryosphere, 10, 2637–2653, https://doi.org/10.5194/tc-10-2637-2016, 2016. a, b
Slaughter, A. E.: Numerical analysis of conditions necessary for near-surface snow metamorphism, PhD thesis, Department of Civil Engineering, Montana State University, Bozeman, MT, USA, 562 pp., 2010. a, b
Sobol', I. M.: On sensitivity estimation for nonlinear mathematical models, Matematicheskoe modelirovanie, 2, 112–118, 1990. a, b
Staron, P. J., Adams, E. E., and Miller, D. A.: Formation of Depth Hoar Resulting from Thermal Optimization of Snow Microstructure, in: Proceedings of International Snow Science Workshop, Anchorage, USA, 186–193, 2012. a
Stössel, F., Guala, M., Fierz, C., Manes, C., and Lehning, M.: Micrometeorological and morphological observations of surface hoar dynamics on a mountain snow cover, Water Resour. Res., 46, W04511, https://doi.org/10.1029/2009WR008198, 2010. a
van Herwijnen, A. and Jamieson, B.: Snowpack properties associated with fracture initiation and propagation resulting in skier-triggered dry snow slab avalanches, Cold Reg. Sci. Technol., 50, 13–22, https://doi.org/10.1016/j.coldregions.2007.02.004, 2007. a, b, c, d, e
van Herwijnen, A., Gaume, J., Bair, E. H., Reuter, B., Birkeland, K. W., and Schweizer, J.: Estimating the effective elastic modulus and specific fracture energy of snowpack layers from field experiments, J. Glaciol., 62, 997–1007, https://doi.org/10.1017/jog.2016.90, 2016. a
Vernay, M., Lafaysse, M., Mérindol, L., Giraud, G., and Morin, S.: Ensemble forecasting of snowpack conditions and avalanche hazard, Cold Reg. Sci. Technol., 120, 251–262, https://doi.org/10.1016/j.coldregions.2015.04.010, 2015. a, b, c
Vionnet, V., Brun, E., Morin, S., Boone, A., Martin, E., Faroux, S., Moigne, P. L., and Willemet, J.-M.: The detailed snowpack scheme Crocus and its implementation in SURFEX v7.2, Geosci. Model. Dev., 5, 773–791, https://doi.org/10.5194/gmd-5-773-2012, 2012. a
Vionnet, V., Martin, E., Masson, V., Guyomarc'H, G., Naaim Bouvet, F., Prokop, A., Durand, Y., and Lac, C.: Simulation of wind-induced snow transport and sublimation in alpine terrain using a fully coupled snowpack/atmosphere model, The Cryosphere, 8, 395–415, https://doi.org/10.5194/tc-8-395-2014, 2014. a
Vögeli, C., Lehning, M., Wever, N., and Bavay, M.: Scaling Precipitation Input to Spatially Distributed Hydrological Models by Measured Snow Distribution, Front. Earth Sci., 4, 108, https://doi.org/10.3389/feart.2016.00108, 2016. a
Wever, N.: WFJ_MOD: Meteorological and snowpack measurements from Weissfluhjoch, Davos, Switzerland (dataset), WSL Institute for Snow and Avalanche Research SLF, Davos, Switzerland, https://doi.org/10.16904/1, 2017. a
Wever, N., Schmid, L., Heilig, A., Eisen, O., Fierz, C., and Lehning, M.: Verification of the multi-layer SNOWPACK model with different water transport schemes, The Cryosphere, 9, 2271–2293, https://doi.org/10.5194/tc-9-2271-2015, 2015. a, b
Winstral, A., Elder, K., and Davis, R. E.: Spatial Snow Modeling of Wind-Redistributed Snow Using Terrain-Based Parameters, J. Hydrometeorol., 3, 524–538, https://doi.org/10.1175/1525-7541(2002)003<0524:SSMOWR>2.0.CO;2, 2002. a