the Creative Commons Attribution 4.0 License.
the Creative Commons Attribution 4.0 License.
 | 27 May 2020
Evolution of a pyrocumulonimbus event associated with an extreme wildfire in Tasmania, Australia
Mercy N. Ndalila
Grant J. Williamson
Paul Fox-Hughes
Jason Sharples
David M. J. S. Bowman
Extreme fires have substantial adverse effects on society and natural ecosystems. Such events can be associated with the intense coupling of fire behaviour with the atmosphere, resulting in extreme fire characteristics such as pyrocumulonimbus cloud (pyroCb) development. Concern that anthropogenic climate change is increasing the occurrence of pyroCbs globally is driving more focused research into these meteorological phenomena. Using 6 min scans from a nearby weather radar, we describe the development of a pyroCb during the afternoon of 4 January 2013 above the Forcett–Dunalley fire in south-eastern Tasmania. We relate storm development to (1) near-surface weather using the McArthur forest fire danger index (FFDI) and the C-Haines index, the latter of which is a measure of the vertical atmospheric stability and dryness, both derived from gridded weather reanalysis for Tasmania (BARRA-TA); and (2) a chronosequence of fire severity derived from remote sensing. We show that the pyroCb rapidly developed over a 24 min period on the afternoon of 4 January, with the cloud top reaching a height of 15 km. The pyroCb was associated with a highly unstable lower atmosphere (C-Haines value of 10–11) and severe–marginally extreme (FFDI 60–75) near-surface fire weather, and it formed over an area of forest that was severely burned (total crown defoliation). We use spatial patterns of elevated fire weather in Tasmania and fire weather during major runs of large wildfires in Tasmania for the period from 2007 to 2016 to geographically and historically contextualise this pyroCb event. Although the Forcett–Dunalley fire is the only known record of a pyroCb in Tasmania, our results show that eastern and south-eastern Tasmania are prone to the conjunction of high FFDI and C-Haines values that have been associated with pyroCb development. Our findings have implications for fire weather forecasting and wildfire management, and they highlight the vulnerability of south-east Tasmania to extreme fire events.
- Article
(6040 KB) - Full-text XML
-
Supplement
(1498 KB) - BibTeX
- EndNote


Anthropogenic climate change is increasing the occurrence of dangerous fire weather conditions globally (Jolly et al., 2015; Abatzoglou et al., 2019), leading to high-intensity wildland fires. For instance, climate projections suggest a pronounced increase in the risk of extreme fire events in Australia, with a 15 %–70 % increase in the number of days conducive to extreme wildfire by 2050 in most locations (Hennessy et al., 2005), although the models show inconsistencies in the trajectory and variability of future fire weather, especially in eastern and south-eastern Australia (Clarke et al., 2011; Clarke and Evans, 2019). While fire weather is most often understood as a surface phenomenon (for example, through surface temperature, wind speed, and relative humidity), atmospheric processes such as instability, wind shear, and mesoscale conditions can also drive extreme fire development. Definitions of extreme wildfires vary (e.g. Sharples et al., 2016), but the associated behaviour includes rapid spread (>50 m min−1), high fireline intensity (>10 000 kW m−1), long distance spotting, erratic behaviour, and impossibility of control, often with the associated development of violent pyroconvection (Tedim et al., 2018). In some cases, violent pyroconvection can manifest as pyrocumulonimbus clouds (pyroCb), the tops of which can reach the upper troposphere and lower stratosphere, and can inject aerosols into altitudes where they can be transported for thousands of kilometres and, hence, affect global climate (Trentmann et al., 2006; Fromm et al., 2010; Peterson et al., 2018). Violent convection is defined here as strong, highly turbulent and deep convection.
PyroCbs lead to highly erratic fire behaviour due to strong updraughts and downdraughts, the possibility of associated whirlwinds and tornadoes, and rapid fire growth due to heightened ember generation, long-range spotting, and cloud to ground lightning strikes (Cunningham and Reeder, 2009; Fromm et al., 2010; Tory and Thurston, 2015; Lareau and Clements, 2016; Dowdy and Pepler, 2018). Specifically, downdraughts can cause erratic fire spread, driven by sudden wind gusts impacting the surface in multiple directions, endangering firefighters near the pyroCb (Johnson et al., 2014; Potter and Hernandez, 2017) and frustrating the accurate prediction of fire behaviour. Local surface processes can amplify fire behaviour; for instance, eddies in steep lee-facing slopes can cause lateral fire spread and mass spotting in downwind areas, which is a process known as fire channelling or vorticity-driven lateral spread (VLS; Sharples et al., 2012).
PyroCbs are comparatively poorly understood meteorological phenomena, as they have rarely been observed or studied world-wide until recently (Fromm et al., 2010). In Australia, pyroCbs have been confirmed during at least 85 fire events (Rick McRae, personal communication, 2020), with more than one event occurring over a single fire in some instances. The most significant events have produced plumes that have reached the upper troposphere–lower stratosphere (UTLS) region. Insights into pyroCb development have relied on weather radar (McRae, 2010; Fromm et al., 2012; Johnson et al., 2014; Peace et al., 2017; McCarthy et al., 2019; Terrasson et al., 2019) that provides high temporal resolution imagery of the pyroconvection, although, importantly, it does not accurately detect the exact extent of entrained gaseous and fine particulate emissions because it is sensitive to larger particles such as rain and ice crystals; therefore, weather radar can fortuitously detect pyrometeors such as ash, scorched debris, and embers (McCarthy et al., 2019).
An important correlate of pyroCb formation is atmospheric instability and moisture (Luderer et al., 2006; Rosenfeld et al., 2007; Fromm et al., 2010; Lareau and Clements, 2016; Di Virgilio et al., 2019). A fire weather index commonly used in Australia to monitor meteorological conditions in the lower atmosphere is the continuous Haines index (C-Haines; Mills and McCaw, 2010). This index is a modification of the Haines index (Haines, 1988), which is routinely used in the US, but has been adapted to suit the frequent hot and dry summer conditions in Australia. The C-Haines index provides a measure of the potential for erratic fire behaviour, based on the air temperature lapse and moisture content between two lower tropospheric levels, and typically ranges from 0 to 13, although values above 13 are possible (Yeo et al., 2015; Di Virgilio et al., 2019). High C-Haines values imply drier and more unstable atmospheric conditions, which favour the lifting of the heated air higher into the atmosphere. In particular, a large air temperature lapse in the atmosphere favours the maintenance of strong convection and increases the likelihood of pyroCb development. The role of tropospheric temperature and moisture in pyroCb dynamics is exemplified in the inverted-V thermodynamic profile (Peterson et al., 2017). The profile shows a dry and warm near-surface environment in which the temperature decreases adiabatically with altitude to the top of the mixed layer (∼3 km), where relative humidity is higher. Altitudes immediately above the mixed layer are usually drier, and this dry air can mix to the surface in strong convective downdraughts, increasing surface fire behaviour (McRae et al., 2015). Further, higher mid-troposphere moisture can interact with weaker wind shear and a high temperature lapse rate to produce strong convective updraughts (Peterson et al., 2017).
Here, we describe the evolution of a pyroCb event in south-eastern Tasmania that developed on 4 January 2013 during the Forcett–Dunalley fire (Ndalila et al., 2018). We use the Mt Koonya Doppler weather radar to document the temporal evolution of the pyroCb as well as to relate storm development to near-surface fire behaviour using the McArthur forest fire danger index (FFDI) and to vertical atmospheric stability and dryness using the C-Haines index, both of which are derived from gridded weather reanalysis for Tasmania (BARRA-TA). To understand how fire behaviour may have influenced the storm, we also associated the development of the pyroCb to a map of the temporal progression of fire severity derived from remote sensing and field observations (Ndalila et al., 2018) and terrain analysis based on a digital terrain model. Finally, we contextualise the pyroCb event by determining (i) the FFDI and C-Haines values associated with large wildfires in Tasmania within the period covered by the available BARRA meteorological reanalysis (2007–2016) and (ii) the geographic patterns of days with concurrent elevated C-Haines and FFDI values in Tasmania.
2.1 Study area
The Forcett–Dunalley fire occurred on the Forestier and Tasman peninsulas in the south-east of Tasmania (Fig. 1a), a temperate island state to the south of Australia (Fig. 1a). This region has a cool moist climate and an elevation reaching 600 m a.s.l. (above sea level; Fig. 1d). The fire was reported at 14:00 LT (local time) on 3 January 2013, and it ignited from a smouldering stump from an unextinguished campfire. On 4 January, south-east Tasmania recorded dangerous fire weather conditions, resulting in a large uncontrollable fire that led to the development of a pyrocumulonimbus (Fig. 1b) from around 15:24 LT and caused the near-complete destruction of Dunalley township (Fig. 1d). By the time of containment on 18 January, the fire had burnt 20 200 ha, mostly comprising native vegetation and rural lands (Fig. 1c). A detailed description of the fire and the associated broader meteorological and environmental conditions have been provided in previous reports/studies (Bureau of Meteorology, 2013; Fawcett et al., 2014; Marsden-Smedley, 2014; Ndalila et al., 2018).
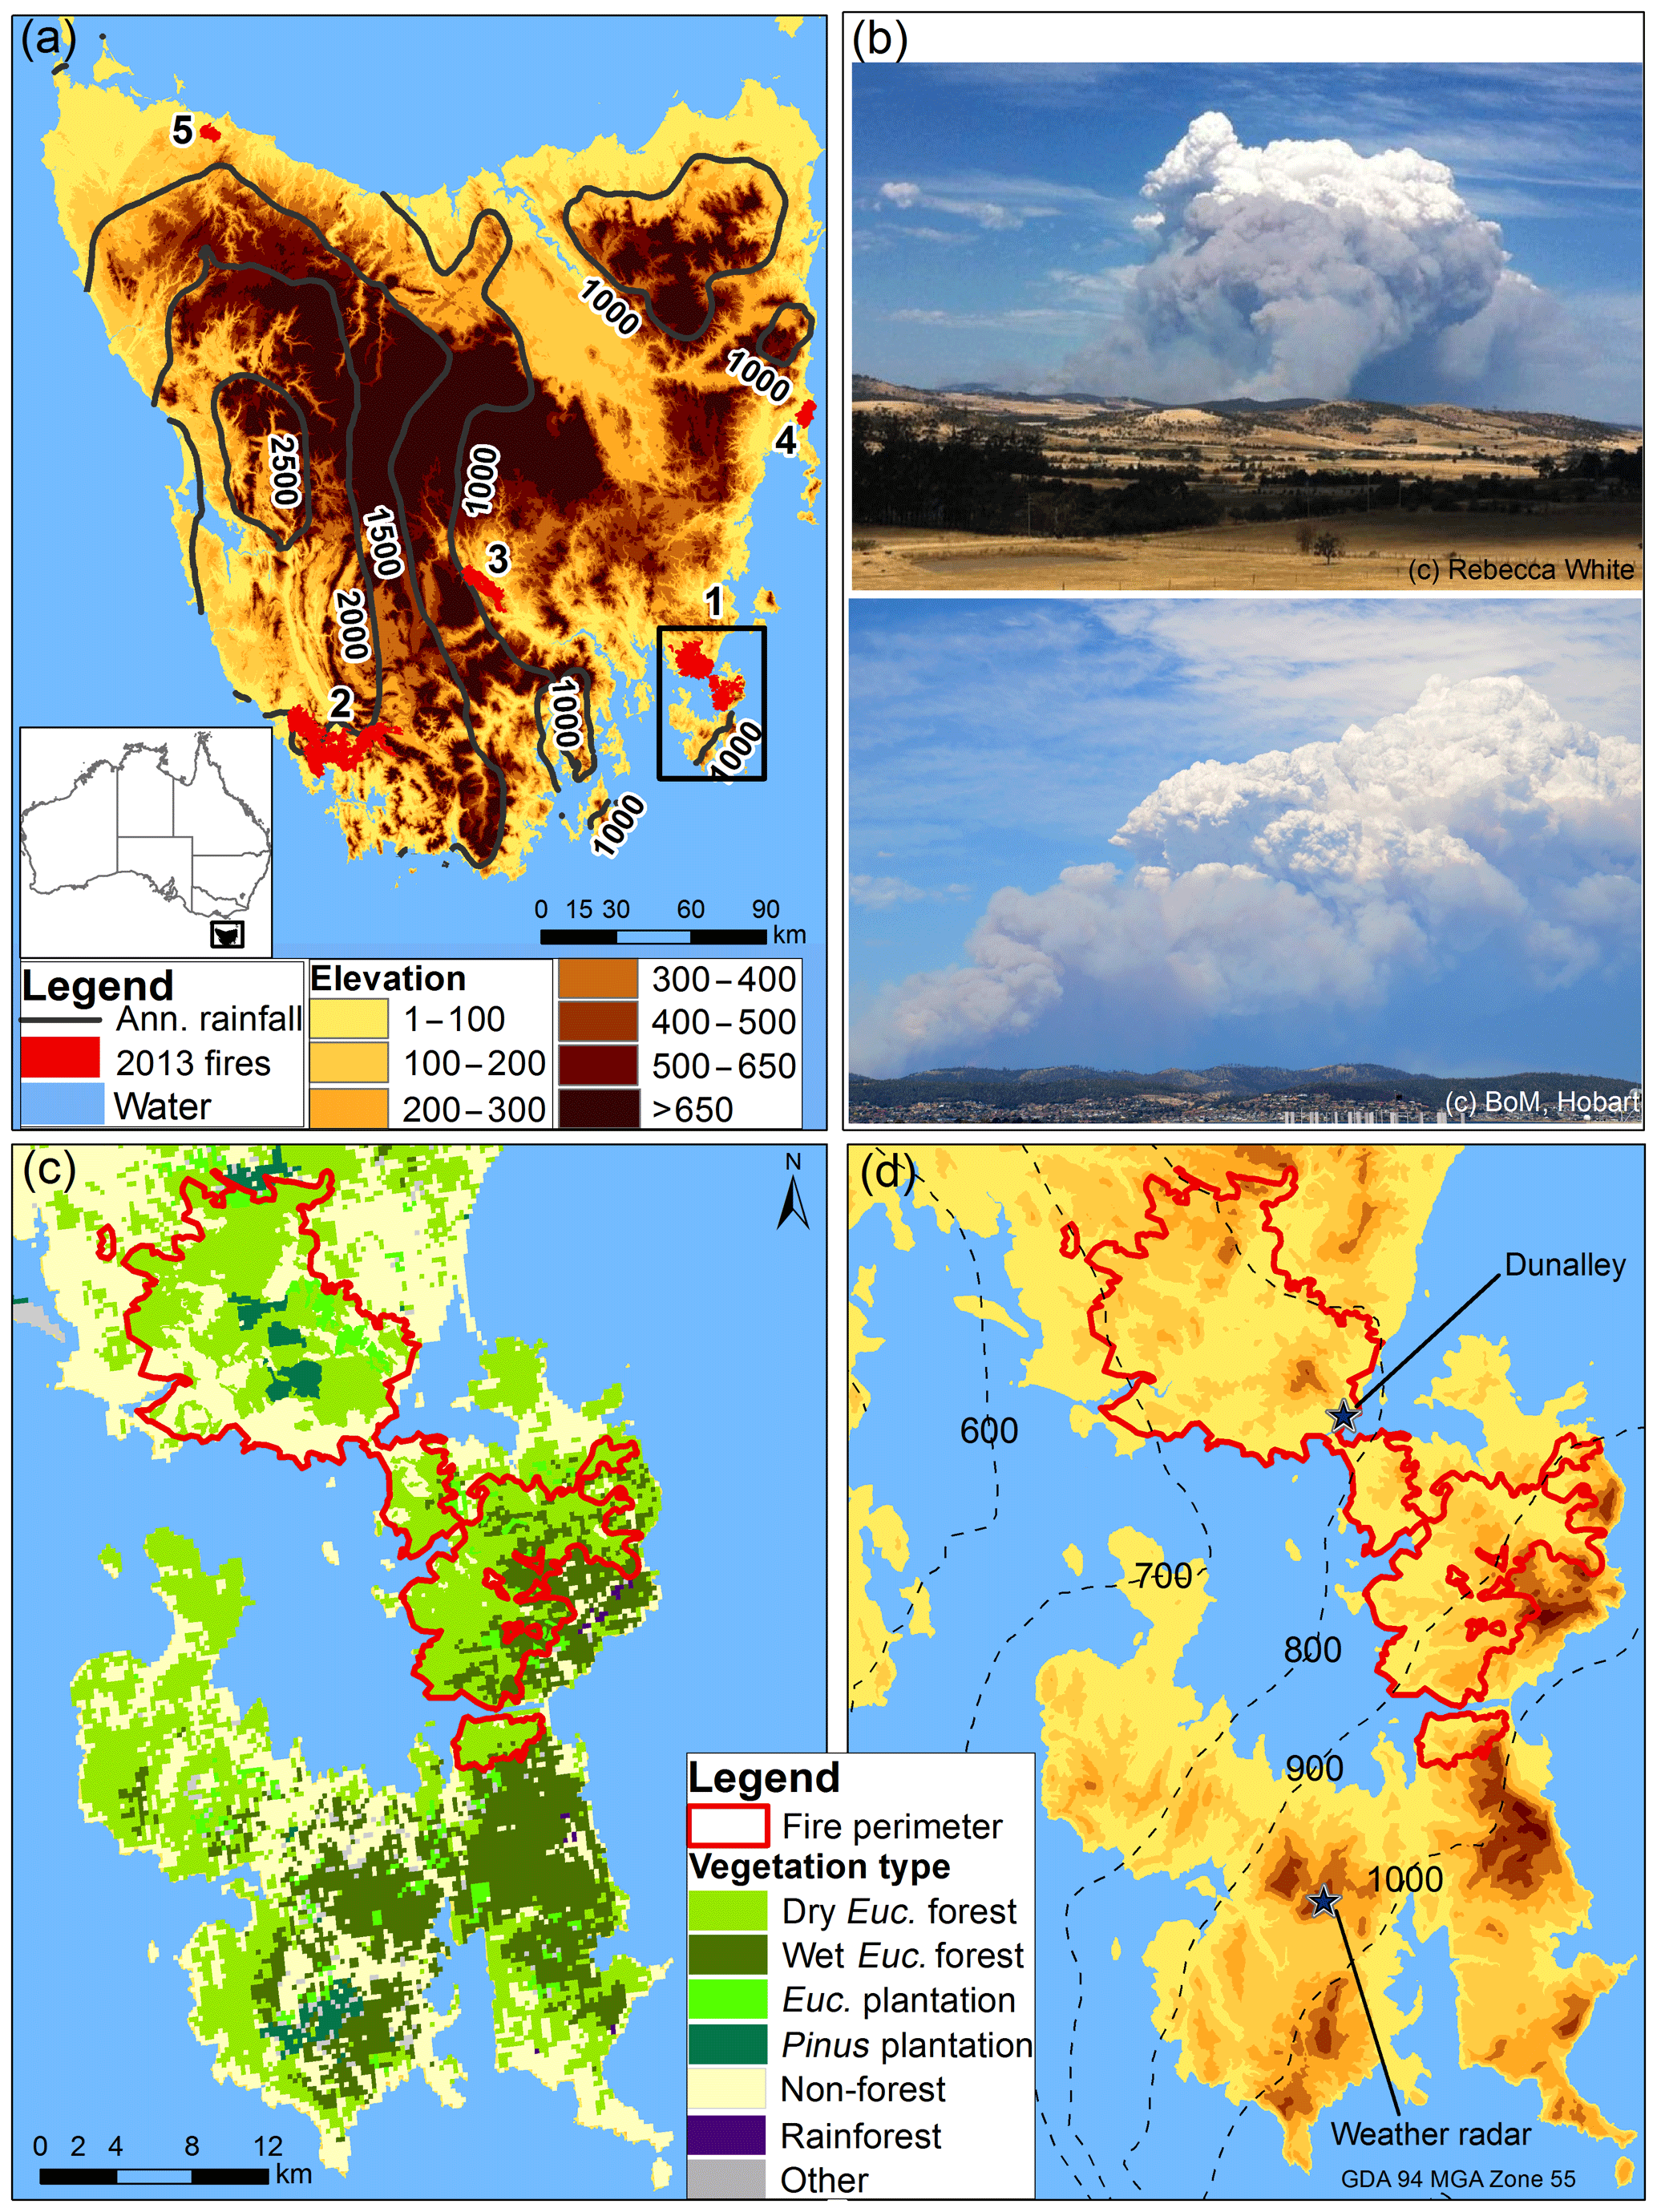
Figure 1Location of the Forcett–Dunalley fireground in south-eastern Tasmania: (a) annual rainfall (in millimetres) and elevation (in metres) across Tasmania, and the location of major fires in the 2013 fire season, including Forcett–Dunalley (1); (b) photographs of a pyrocumulonimbus cloud above Dunalley township, taken on the afternoon (at around 15:55 LT) of 4 January 2013. (c) Dominant vegetation on the Forestier and Tasman peninsulas based on TASVEG 3.0, an integrated vegetation map of Tasmania. Eucalyptus (Euc.) is the major vegetation type in the region. (d) Elevation and mean annual rainfall (dotted lines) across the two peninsulas, derived from WorldClim dataset (Hijmans et al., 2005). The locations of the Dunalley township and Mt Koonya weather radar are indicated on the map.
2.2 Meteorology of the fire
2.2.1 PyroCb development
We used Doppler weather radar to track the evolution of the pyroCb during the period of erratic fire behaviour. As most weather radars do not detect all components of a smoke plume, especially particles smaller than 100 µm (Jones and Christopher, 2010), we will refer to the signatures present in the radar data as “the plume”, which will also encompass the pyroCb cloud. Pyroconvective plumes typically contain some precipitation (and in extreme cases, glaciation from pyroCb) at high altitudes, as well as larger smoke particles (some of which can be water-coated). In this study, we assume that the highest radar returns (plume injection) during the period of violent convection represent the top of the pyroCb. This is justified, as McRae et al. (2015) also show that stronger radar returns at the highest altitudes during deep pyroconvection events are mostly from hydrological features (ice crystal and rain) rather than non-hydrological components (ash and debris).
We examined radar data for the period from 3 to 18 January 2013 from the Mt Koonya C-band (5 cm wavelength) weather radar (Fig. 1d) operated by the Australian Bureau of Meteorology (Soderholm et al., 2019). The radar's proximity and uninterrupted view of the Forcett–Dunalley fireground made it ideal for tracking the pyroCb. The radar is located at a height of 515 m, 46 km east-south-east of Hobart on the Tasman Peninsula, and its scan strategy contains 14 elevation angles, scanning through 360∘ within each angle. The radar is 24 km from Dunalley, where the lowest (0.5∘) elevation scan height is about 750 m, whereas the highest scan (32∘) is around an elevation of 25 km at a distance of 40 km from the radar. The radar has a 1∘ beam width, a 250 m radial resolution, an effective range of 150 km, and primarily provides 6 min reflectivity and velocity scans of the plume/pyroCb. In this study, a minimum reflectivity of 11 dBZ was used to detect the plume boundary. The time zone used is Australian eastern daylight time, which is referred to as local time (LT) in this paper.
The 3-D radar scans from 12:30 to 23:00 LT on 4 January were used to describe the pyroCb as they represent the period of peak fire behaviour. In the later periods, smoke had considerably reduced and was not visible on the radar. Radar files were first processed by converting the raw polar coordinates to Cartesian coordinates. We used the Integrated Data Viewer (IDV; Unidata, 2018) and ArcGIS 10.3 (ESRI, 2015) to detect and analyse radar returns in 2-D and 3-D displays, where the 2-D plan view of the radar indicates the horizontal extent of the dense plume, including embers, ash, and the pyroCb. Within IDV, a vertical cross-section through the 3-D plumes was used to estimate the maximum injection height (cloud top) at each 6 min timestamp of the radar data. ArcGIS software was used to measure the horizontal length and the size (area and perimeter) of the 2-D view of the plume, based on the lowest elevation angle of the radar. We compared the temporal variation of plume/cloud development with the time series of mapped fire severity and the progression of fire weather (FFDI and C-Haines) to determine any congruence between pyroCb dynamics and fire weather, area burnt, and fire severity patterns during the period of erratic fire behaviour. The chronosequence of fire severity was derived from a previous study (Ndalila et al., 2018) from the intersection of a fire severity map with fire progression isochrones within the fireground. Fire severity was based on the differential normalised burn ratio (dNBR; Key and Benson, 2006) analysis of pre- and post-fire 30 m resolution Landsat 7 satellite images. A detailed description of fire severity assessments is provided by Ndalila et al. (2018).
2.2.2 C-Haines analysis
We obtained gridded weather reanalysis data from the Bureau of Meteorology Atmospheric high-resolution Regional Reanalysis for Australia (BARRA), downscaled for the Tasmanian sub-domain (BARRA-TA) to a 1.5 km spatial resolution (Su et al., 2019). BARRA combines numerical weather forecasts with observational data to produce realistic depictions of surface meteorology and atmospheric conditions. We extracted hourly air temperature and dewpoint temperature at different air pressure levels (1000 hPa at the surface to 150 hPa in the lower stratosphere) as well as the pre-calculated hourly McArthur FFDI for the period of the fire and the period of BARRA data available at the time of the study (January 2007–October 2016). Extraction, conversion, and general BARRA analysis was performed using R software (version 3.4.0; R Core Team, 2017).
At each grid cell in Tasmania, the C-Haines index was calculated from the hourly estimates of air temperature and dewpoint temperature at relevant atmospheric levels (850 and 700 hPa) based on Eqs. (1)–(3). We preferred the BARRA product over radiosonde data when calculating the C-Haines index because of (1) a possible geographic drift of the weather balloon as it rises through the atmosphere, resulting in inconsistencies in locations where data were recorded; (2) availability of balloon data only twice a day at a single location, which is unrepresentative of many regions; and (3) the BARRA product combines other data sources such as satellite observations to model air temperature and moisture. Nevertheless, we validated our C-Haines values using the radiosonde data for Hobart Airport, thereby establishing a correlation of 0.74 between the two datasets. Our calculated hourly C-Haines values as well as the extracted hourly FFDI for Tasmania were then aggregated to maximum daily values. Temporal maps of the daily C-Haines distribution were then produced for the first 3 d of the fire, between 3 and 5 January.
Here, CA is a temperature lapse term, T850 is the air temperature at an atmospheric height of 850 hPa (or 1.3 km), T700 is the air temperature at a height of 700 hPa (around 3 km), DT850 is the dewpoint temperature at a height of 850 hPa, CB is a dewpoint depression term, and CH is the continuous Haines index (or C-Haines).
2.2.3 Vorticity-driven lateral fire spread
We also determined whether the period of rapid cloud/plume development coincided with local surface dynamics, which likely enhanced fire behaviour. Specifically, the effect of vorticity-driven lateral spread (VLS) on fire behaviour was tested. VLS is an atypical fire spread arising from the interaction between strong winds and terrain which creates lee-slope eddies that interact with the fire to cause lateral fire propagation, an increase in fire intensity, and mass spotting downwind of the lateral spread zone (Sharples et al., 2012). VLS-prone areas were defined according to the criteria from Sharples et al. (2012): lee-facing slopes steeper than 15∘ where the slopes are facing to approximately 40∘ of the direction that the wind is blowing towards. A wind direction layer (mostly north-westerly) at 16:00 LT on 4 January (the period around peak plume height) was extracted from the BARRA dataset and resampled to correspond to the spatial resolution of the digital elevation model (33 m) that was provided by the Tasmanian Department of Primary Industries, Parks, Water and Environment. Both layers were combined using the aforementioned criteria, resulting in a binary map where areas fulfilling the VLS criteria were assigned a value of one and all other areas were assigned zero.
2.3 Spatiotemporal context of fire weather in Tasmania
2.3.1 Weather conditions during large Tasmanian fires
We compared FFDI and C-Haines values during the Forcett–Dunalley fire and values associated with other large Tasmanian fires between 2007 and 2016 (the period of available BARRA data). A total of 77 fires, of varying ignition sources, were identified in the Tasmania Fire Service fire history database as being over 500 ha in size, and having a known ignition date. Of the 77 fires, 18 did not have recorded end dates, and these were operationally specified as being 4 weeks later, which was an arbitrary cut-off to capture the most likely major growth (or “run”) of the fire that typically occurs at or near the start of fires (e.g. the 2009 Victorian fires; Cruz et al., 2012). The assumption is that these runs result in peak fire intensities that most likely drive strong convections. We subsequently produced a scatterplot of the highest daily FFDI for the duration of each of the fires and the associated C-Haines value. These data were overlaid on a density map of C-Haines and FFDI values for all cells (and days) in Tasmania during the entire BARRA period to provide background weather conditions for Tasmania.
2.3.2 Elevated fire weather in Tasmania
To provide a geographic context for the Forcett–Dunalley fire, the spatial patterns of days conducive to extreme fire behaviour in Tasmania were mapped by determining counts of days that exceeded combined C-Haines and FFDI thresholds of 9 and 25 respectively, and then aggregating them to fire season (October–March) and non-fire season (April–September). These thresholds were defined to correspond to an elevated fire weather day (95th percentile) based on weather conditions at Hobart Airport, which represents the broader air mass in south-eastern Tasmania. For example, the FFDI threshold is close to the 95th percentile (FFDI 31) observed during the 1998–2005 fire seasons (Marsden-Smedley, 2014). We chose to use FFDI to describe near-surface fire weather across the state, but we acknowledge that for some fuel types (e.g. moorlands) that occur in Tasmania (Marsden-Smedley and Catchpole, 1995), other indices such as the grassland/moorland fire danger index may be more suitable. It is worth noting that the maximum daily FFDI calculated at the Hobart Airport station was always higher than the daily gridded FFDI extracted from the BARRA product (compare the maximum FFDI of 92 recorded at the station with the FFDI of 68.7 from the BARRA model on 4 January).
3.1 Fire weather during the fire
3.1.1 Surface fire weather
Dangerous fire weather conditions in south-east Tasmania were observed from 3 to 4 January 2013. At 14:00 LT on 3 January when the fire was reported, Hobart Airport recorded 33 ∘C (the maximum temperature for 3 January), a minimum relative humidity (RH) of 15 %, and strong north-westerly winds that reached 37 km h−1 and gusted to 55 km h−1 (Fig. 2). The smoke plume was detectable by weather radar between 15:18 and 19:00 LT. The weather conditions deteriorated on 4 January, with extreme maximum temperatures (reaching 40 ∘C), strong winds (35–46 km h−1, gusts of 60–70 km h−1), and low RH (11 %) in the afternoon. At 12:00 LT, the Forcett–Dunalley plume was again detectable by weather radar (Figs. 2, 3a), when values of the weather variables peaked and were maintained during the period of violent pyroconvection between 15:24 and 16:30 LT (Fig. 2). Winds were mostly north-westerly, with no noticeable change in the wind direction during the pyroCb period. However, a southerly change was observed at around 00:00 LT on 5 January, well after the Forcett–Dunalley pyroCb had already dissipated.
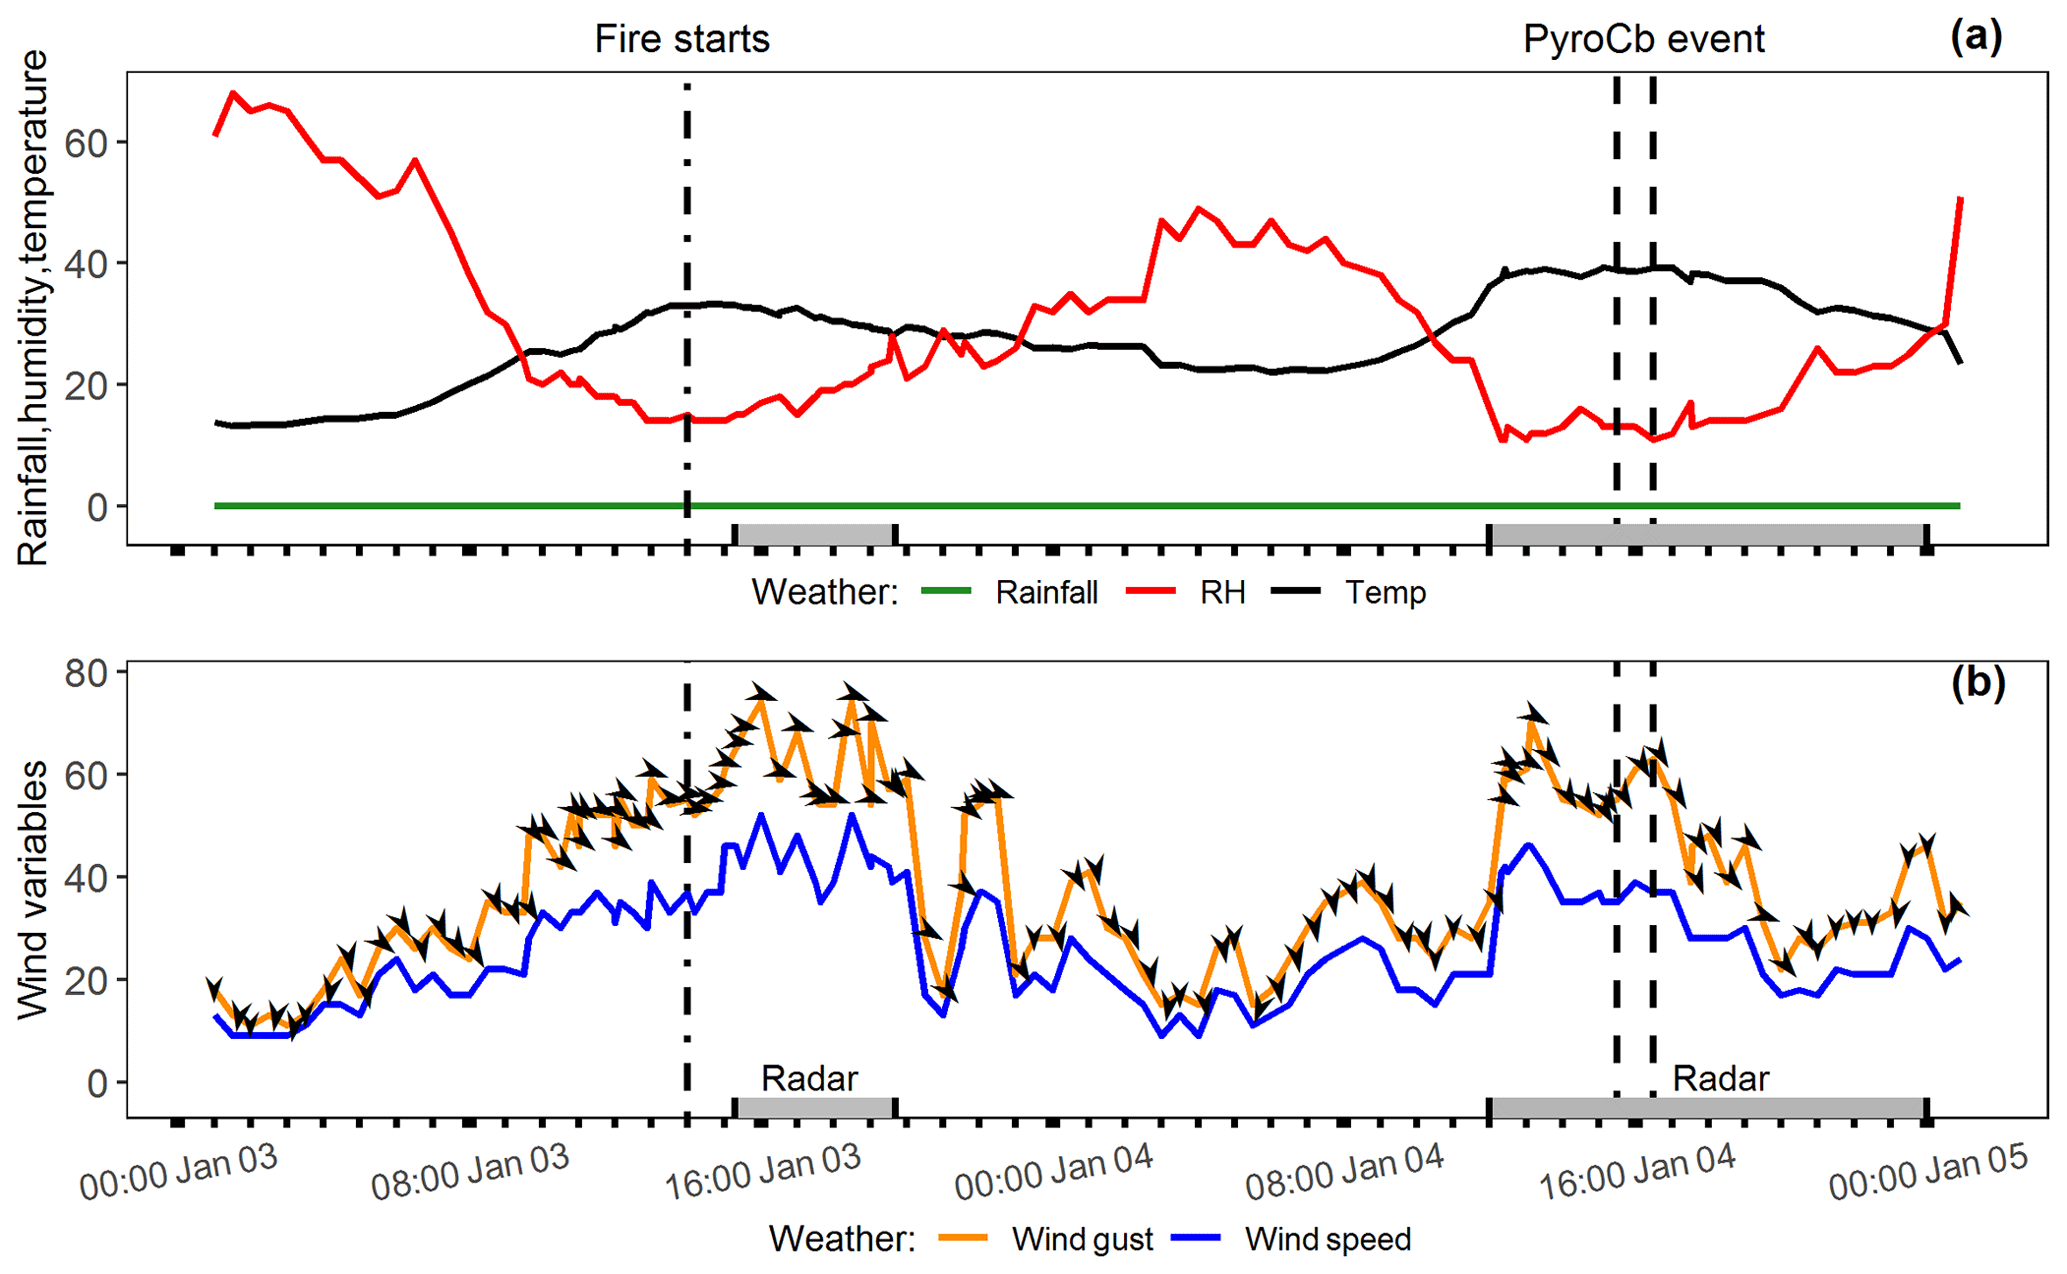
Figure 2Time series of 30 min weather data obtained from 3 to 4 January 2013 at Hobart Airport. (a) Rainfall (mm), relative humidity (RH; %), and air temperature (∘C). (b) Wind variables, including wind speed (km h−1), wind gust (km h−1), and wind direction (as cardinal direction). The arrows point in the direction that the wind is blowing to. The vertical lines represent the time of the start of the fire and the period of the pyroCb event. The periods of the radar detection of the plume for the 2 d are also shown on the graphs.
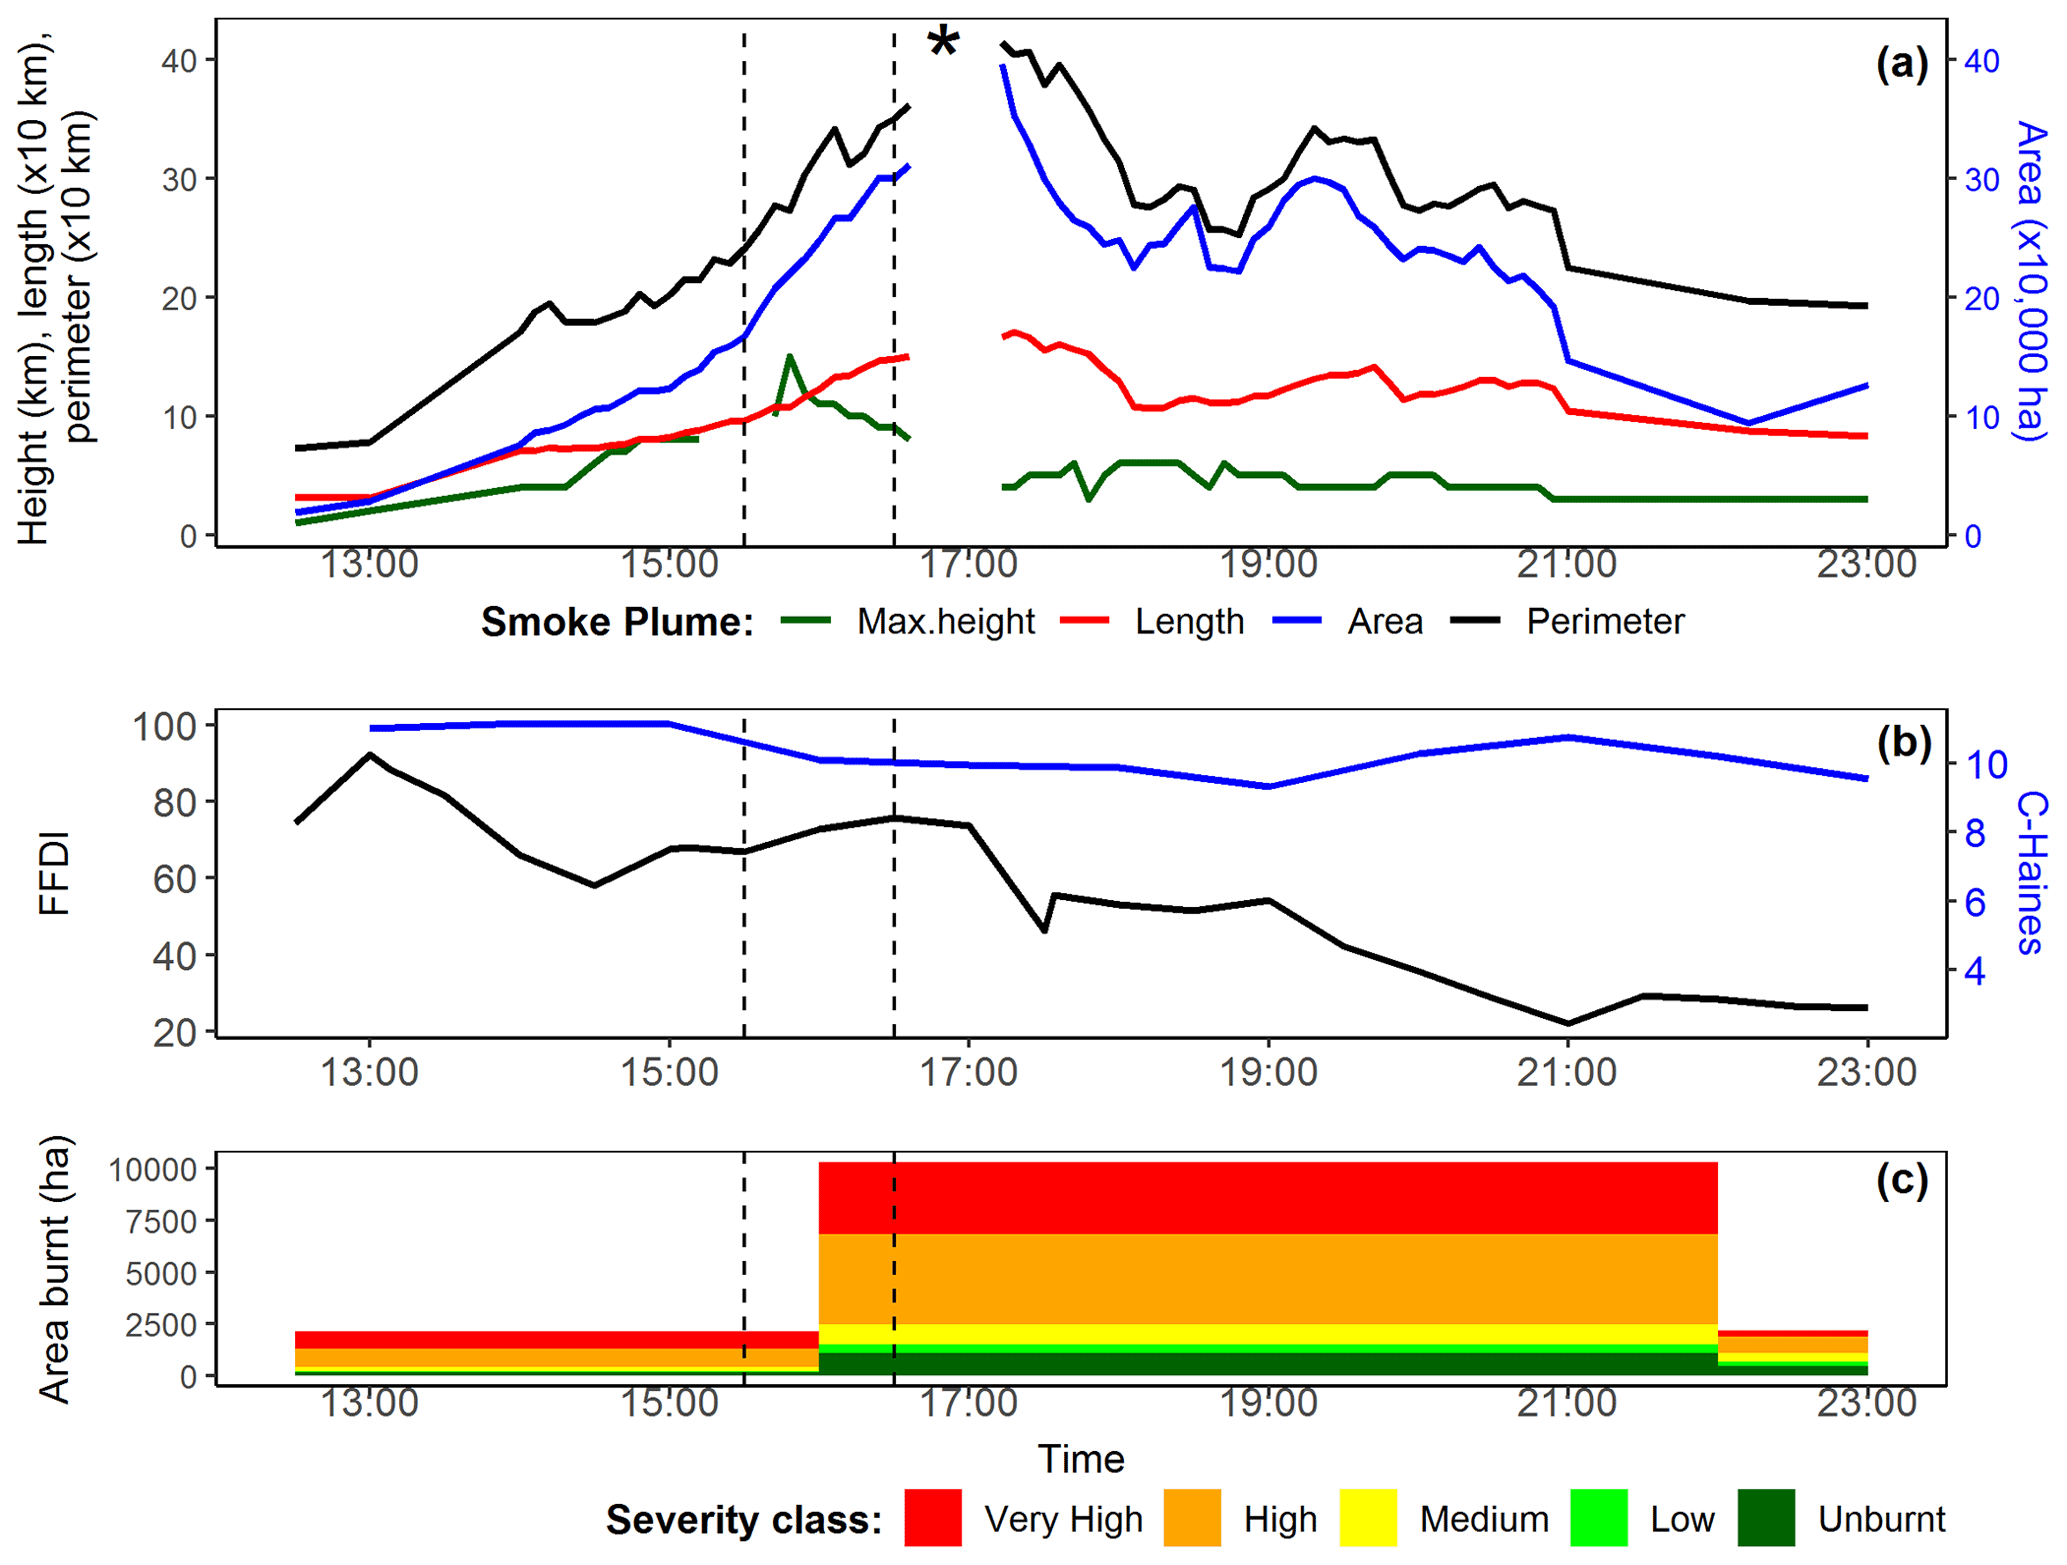
Figure 3Plume dimensions, fire weather, and fire severity traces during the evolution of a pyroCb on the afternoon of 4 January. (a) The 6 min variation of plume dimensions during peak fire behaviour. The asterisk (∗) represents the period (16:42–17:06 LT) with missing weather radar data. (b) The FFDI trace obtained from Hobart Airport weather station, and the C-Haines computed from the BARRA product during the corresponding period of smoke plume growth. (c) The temporal pattern of fire severity, adapted from Ndalila et al. (2018). Black vertical lines in the three graphs represent the period of violent pyroconvection.
3.1.2 Synoptic weather
On 3 January, a combination of (1) a high-pressure system to the north-east of Tasmania and (2) a cold front and pre-frontal trough approaching from the west directed a freshening dry and hot northerly airstream over the island – favourable conditions for elevated fire danger (Bureau of Meteorology, 2013). By 08:00 LT on 4 January, the high-pressure system had moved slowly eastward, while the trough had progressed closer to western Tasmania (Fig. S1 in the Supplement). This period coincided with moderate north-westerly winds in most locations in the state, except for the south-east (general area surrounding Dunalley) which recorded stronger winds and an elevated fire danger. The fire danger steadily increased towards midday (the start of the first fire progression isochrone in Fig. 3c); by 15:00 LT, the leading edge of the trough was much closer to the west of Tasmania. An increase in the pressure gradient brought about gusty conditions and a catastrophic fire danger in some locations in south-east Tasmania, causing erratic fire behaviour of the Forcett–Dunalley fire. During that time, the trough crossed western Tasmania. By 17:00 LT, when the pyroCb had likely dissipated (Fig. 3a), the pre-frontal trough was crossing Tasmania and the fire danger subsequently reduced due to decreasing temperatures and winds. The trough continued to move eastwards, and it crossed south-east Tasmania after 23:00 LT, leading to a westerly to south-westerly wind change by 00:00 LT on 5 January. The front passed over the state in the early morning of 5 January and caused lightning and limited showers across Tasmania. A detailed analysis of the synoptic weather patterns driving this event are provided in Bureau of Meteorology (2013).
3.1.3 PyroCb development in the atmosphere
On 4 January, the plume height from radar scans gradually increased from around 1 km a.s.l. at 13:00 LT to 8 km at around 15:00 LT and then rapidly rose to the maximum injection height of 15 km (lower stratosphere) between 15:24 and 15:48 LT (Figs. 3a, 4), representing the peak of pyroconvection. During the period of violent pyroconvection, thunderstorms developed and moved in a south-easterly direction towards the Tasman Sea, causing two lightning strikes, which were detected around 16:10 LT (Bureau of Meteorology, 2013). Radar returns during the peak period (Fig. 4) were likely due to glaciation within the pyroCb and precipitation at high altitudes, which then evaporated before reaching the surface due to intense heat, while the cooled air mass from evaporation descended towards the surface as convective outflows, generating gusty and erratic surface winds. The cloud top then decreased to around 7 km at 16:42 LT, after which the pyroCb likely dissipated and the plume subsequently stabilised at heights of 3 km (Fig. 3a). Atmospheric instability and the pyroCb dynamics are confirmed by atmospheric soundings from BARRA for 15:00–16:00 LT on 4 January (Fig. S2) and a time series of the 850–500 hPa air temperature lapse rate on 4 January (Fig. S3). The soundings show the air temperature at the tropopause (∼12 km, below the pyroCb height) to be −50 ∘C, supporting the observation of the electrification of the pyroCb. Electrification/lightning typically occurs at temperatures around or below −20 ∘C (Williams, 1989). The 850–500 hPa lapse rate gives an indication of the (in)stability of the lower half of the troposphere (1.3–5.5 km a.s.l.), with lapse rates of >7.5 ∘C km−1 considered as very unstable lower atmosphere (Peterson et al., 2014).
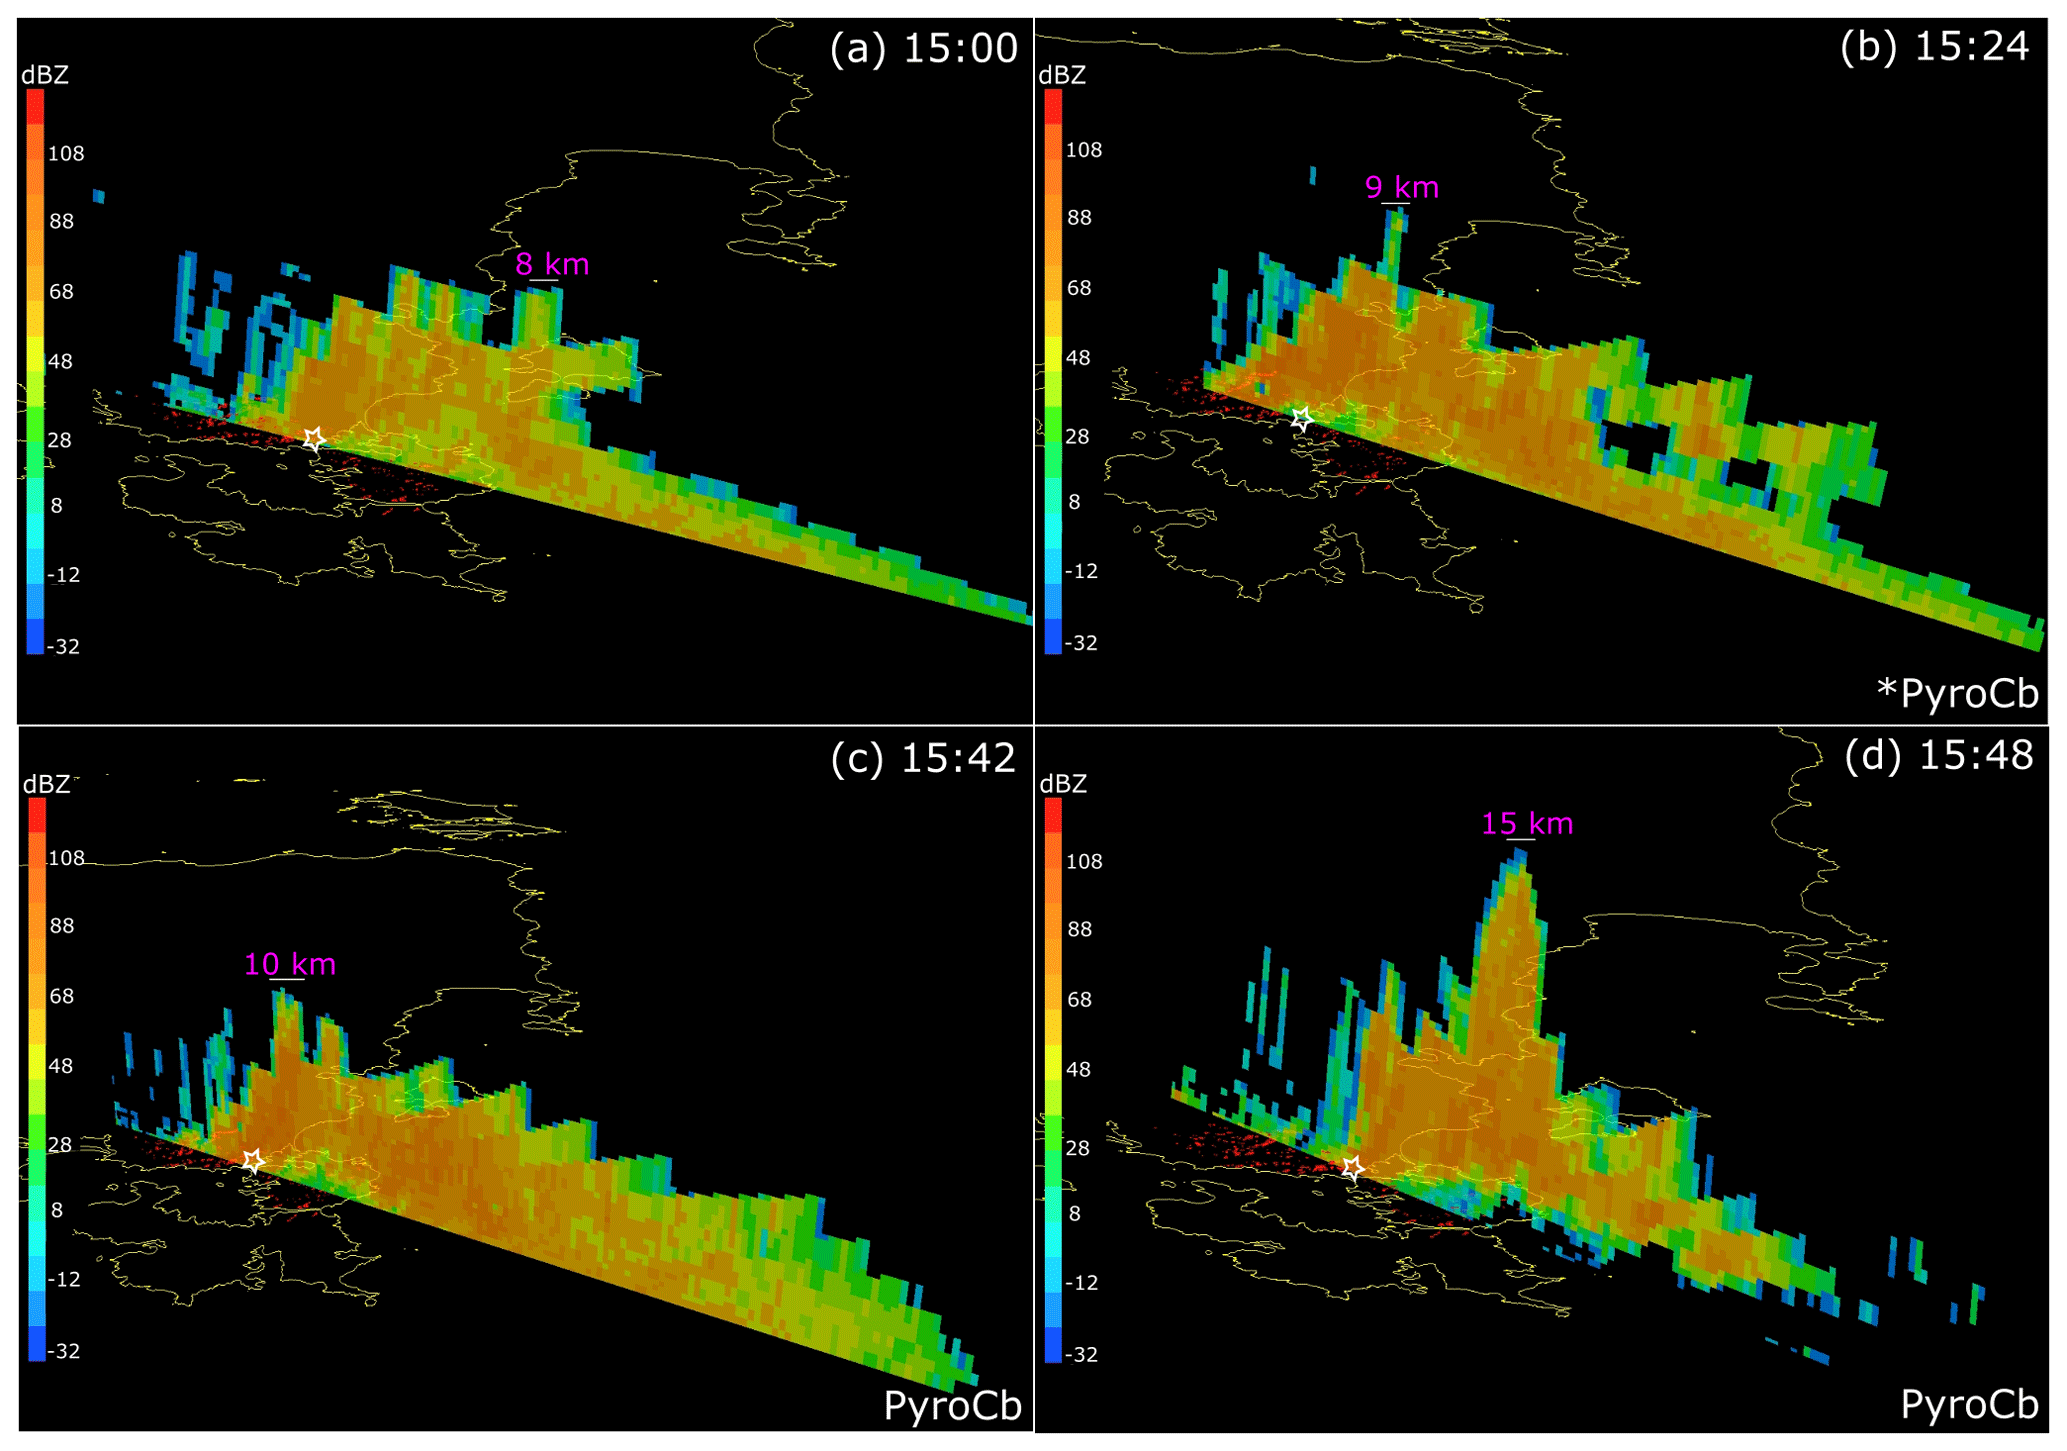
Figure 4Areas prone to vorticity-driven lateral spread (VLS; in red) overlaid with a 3-D rendering of the vertical cross-section of plumes from the radar reflectivity for specific times during peak fire behaviour. Higher reflectivity values (dBZ >48) in all maps represent the most intense parts of the plume (and the pyroCb which occurred from around 15:24 to 16:30 LT). The asterisk in Fig. 4b represents the likely initiation period of the pyroCb. Dunalley township is represented by a white star. A malfunction in radar for the 15:30 and 15:36 LT timestamps resulted in plume information only being available at the lowest elevation angle of the radar scan; therefore, these data are not shown.
For the horizontal plume dimensions (length, area, and perimeter), there was a lagged response to the effect of intense fire activity that occurred at around 15:24 LT. While a maximum in cloud height was observed at 15:48 LT, other plume metrics peaked at around 17:13 LT (Fig. 3a). Plume length is defined as the horizontal distance between the origin of the plume and its farthest extent.
The period of drastic increase in the height of the pyroCb cloud was associated with elevated FFDI values of 60–75 (severe, 50–74, to marginally extreme, 75, fire danger classes), elevated gridded C-Haines values of 10–11.1 at Hobart Airport (Fig. 3b), a large area burnt (approximately 10 000 ha), and the highest proportion of burning of the two highest fire severity (total crown defoliation) categories in dry Eucalyptus forests (Fig. 3c). The isochrone leading up to the peak in fire behaviour accounted for 10 % of total area burnt across all vegetation types within the entire fire perimeter, the peak period contributed 46 %, and the last isochrone on 4 January contributed 9 % of total area burnt (Fig. 3c). Evidence of the effect of vorticity-driven lateral spread on the fire behaviour was not strong. The analysis of the precursor terrain conditions only revealed small patches of VLS-prone areas near Dunalley township (Figs. 4, S4). However, we are not able to rule out VLS occurrence on parts of the terrain that were not resolved by the DEM and which may have played a part in the evolution of the plume. Indeed, the lateral development of the upwind edge of the plume in Fig. S4 suggests lateral development of the fire, similar to that associated with VLS in other fires (McRae et al., 2015). The majority of the plume area (>70 %) extended over the Tasman Sea in a south-easterly direction from the location of the fire, under the influence of above-surface winds (Fig. 4). The period of the pyroCb in Fig. 4 is defined by very high radar returns, with reflectivity values of 48–88 dBZ representing the most intense parts of the pyroCb. This strong reflectivity is indicative of high quantities of ash and larger-sized hydrometeors such as ice crystals at higher elevations.
3.1.4 Spatiotemporal variation of C-Haines
During the development of the pyroCb, the maximum daily FFDI and gridded C-Haines on 4 January at Hobart Airport were consistently high (92 and 11.1 respectively). During the following days, both of these indices markedly declined (Fig. S5); indeed, for the entire month of January 2013, there was a statistically significant moderate correlation (r=0.5, p<0.05) between these fire weather indices, although the FFDI lagged C-Haines by around a day. At a state-wide scale, from 3 to 4 January, the whole of Tasmania displayed dangerous fire weather, particularly south-eastern Tasmania, which recorded high C-Haines values (Fig. 5). Especially on the Tasman Peninsula, C-Haines was mostly within the range of 10–12 for both days (peaking at 12–14), but it moderated to 4–6 on 5 January after a south-westerly wind change at around 00:00 LT as a result of a pre-frontal trough crossing south-eastern Tasmania. A complete description of the overall meteorological conditions, including the aerological diagrams, can be found in the Supplement.
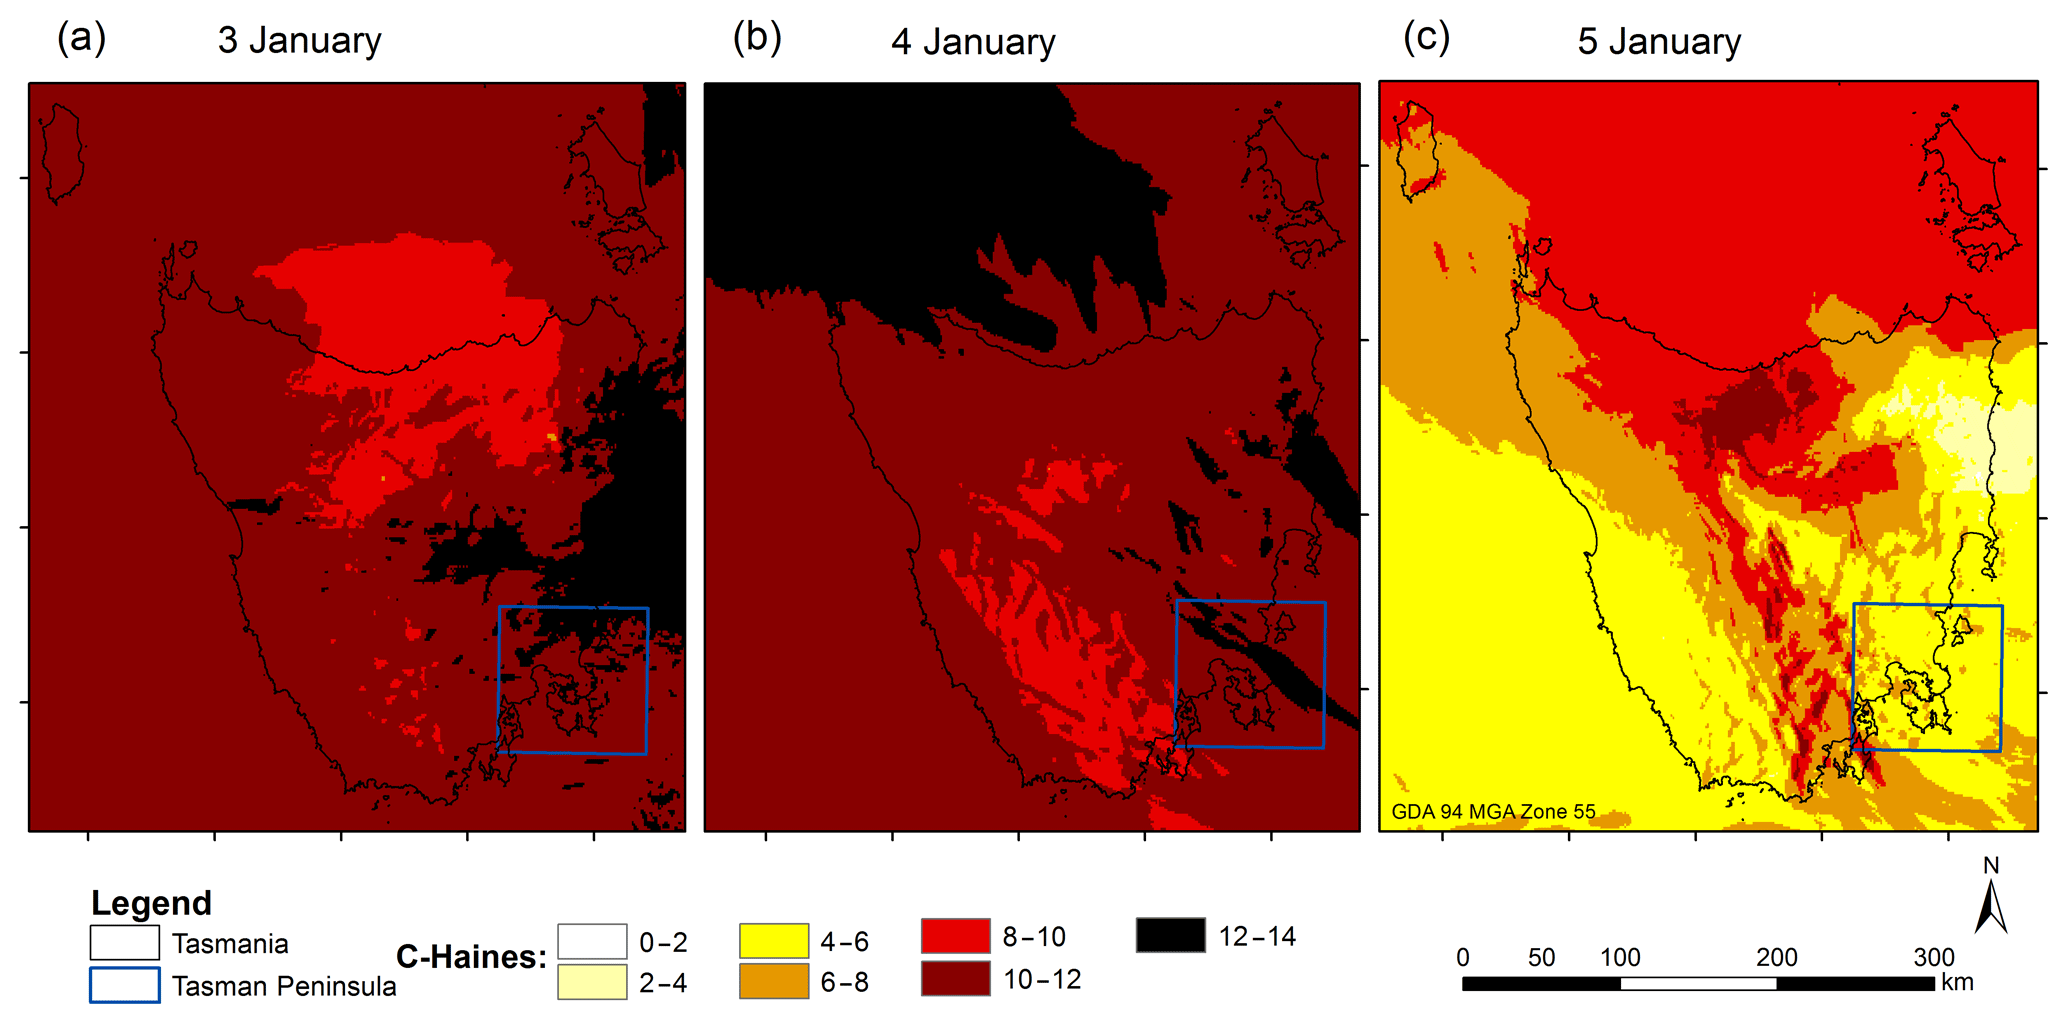
Figure 5Spatiotemporal distribution of maximum daily C-Haines values for Tasmania for 3–5 January 2013. The blue square indicates the location of the Tasman Peninsula.
3.2 Contextualising the Forcett–Dunalley pyroCb
3.2.1 Fire weather in large Tasmanian fires
The Forcett–Dunalley fire had amongst the highest levels of elevated fire weather (gridded FFDI and C-Haines of 68 and 11.5 respectively) of all of the 77 large (>500 ha) Tasmanian fires that occurred between 2007 and 2016 (Fig. 6). These values represent the 99th percentile of daily FFDI and C-Haines values for the grid cell in Dunalley that had the highest daily FFDI during the fire. Figure 6 also shows the fire weather associated with all of these fires overlaid on the bivariate density distribution of the FFDI and C-Haines for all days in the available record. The figure shows that despite being correlated, the probability of the concurrence of elevated C-Haines and FFDI values across Tasmania is low. Further, the scatterplot suggests that high FFDI values (>25) do not influence large fire occurrence as much as high C-Haines values (>9), and that most large fire events (52 fires or 68 %) occur within lower FFDI and C-Haines thresholds (15 and 7 respectively). Notably, the Forcett–Dunalley fire is an outlier and the only known fire to have produced a pyroCb in Tasmania.

Figure 6Scatterplot of the maximum daily FFDI and associated daily C-Haines values (corresponding to the time of the highest FFDI) of each of the 77 large (>500 ha) wildfires overlaid on the density of all days in the period of the BARRA data. The density scale has been log-transformed to allow for better visualisation, while the fires have been stratified into different fire size classes. The vertical and horizontal lines represent thresholds of elevated FFDI (25) and C-Haines (9) respectively. The Forcett–Dunalley fire (in red) is a clear outlier when compared to other fires (in green). (“K” in the legend represents thousand, and “M” represents million.)
3.2.2 Spatiotemporal variability of elevated fire weather
During the fire season (October–March), eastern Tasmania and the Bass Strait islands (Flinders and King islands) are prone to combined elevated C-Haines and FFDI values (Fig. 7), particularly so for south-east Tasmania. Outside the fire season, only south-eastern Tasmania is exposed to the risk of elevated C-Haines and FFDI values. There is no trend in elevated fire weather detectable in the existing BARRA weather record across Tasmania (Fig. S6); however, as longer reanalysis datasets become available, the examination of longer trends may also become possible.
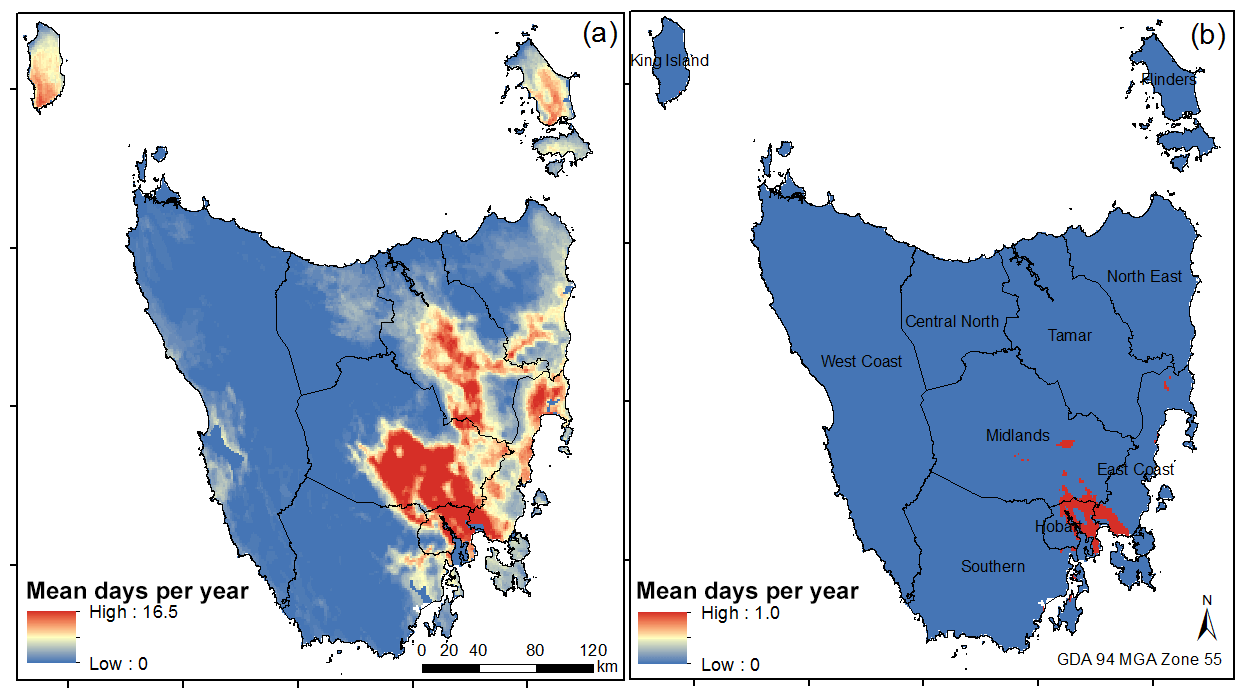
Figure 7Spatial distribution of mean days per year with both elevated C-Haines (>9) and FFDI (>25) values for (a) the fire season (October–March) and (b) the non-fire season (April–September), intersected by the operational fire management boundaries for Tasmania.
We have described the evolution of the only known pyroCb to have occurred in Tasmania. Our study opportunistically used weather radar to track violent pyroconvection, which reached a peak height of 15 km in less than 1 h during the afternoon on 4 January. We were able to associate this rapid escalation of the fire with a previously developed fire severity map and a digital terrain model of the fireground (Ndalila et al., 2018). Analysis of gridded weather data in Tasmania for the period from 2007 to 2016 showed that this event is an outlier in elevated FFDI and C-Haines values. Below, we discuss these findings with respect to the known drivers of pyroCbs as well as how it relates to previous pyroCb events in Australia and globally.
The Forcett–Dunalley firestorm developed in the late afternoon – a pattern similar to all reported Australian pyroCbs (Fromm et al., 2006; Dowdy et al., 2017; Peace et al., 2017; Terrasson et al., 2019), except the 2006 Grose Valley pyroCb in New South Wales (Fromm et al., 2012) and a second Waroona pyroCb event (Peace et al., 2017), which occurred in the late morning. For instance, the Kinglake fire, which was among the 2009 Victorian “Black Saturday” fires – the most destructive of all known Australian fires – had extensive pyroCb activity in the late afternoon, around 17:00 LT (Dowdy et al., 2017). PyroCbs are typically short-lived events that mature in less than 1 h, as was the case for the Forcett–Dunalley fire, although some can last for multiple hours, such as the 2003 Canberra fires (Fromm et al., 2006) and the 2017 Pacific Northwest wildfires in the north-western US and British Columbia (Peterson et al., 2018). The Forcett–Dunalley pyroCb achieved a height of 15 km, which is similar to that reported in other Australian events, including the 2003 Canberra fires (14 km; Fromm et al., 2006), the 2006 Wollemi fire in New South Wales (14 km; Fromm et al., 2012), the 2009 Black Saturday fires (∼13 km; Cruz et al., 2012), the 2016 Waroona fire in Western Australia (14 km; Peace et al., 2017), the 2017 Sir Ivan fire in New South Wales (12 km; Terrasson et al., 2019), and the recent 2019 Victorian fires (Mike Fromm, unpublished data). Further, two lightning strikes from the Forcett–Dunalley pyroCb were observed to the south-east of Dunalley, over the Tasman Sea. A majority of the Australian pyroCbs have been observed to generate lightning, which in some cases started new fires well ahead of the fire front (Peace et al., 2017); for example, the Kinglake fire produced several lightning clusters, which ignited a new fire 100 km downwind of the fire (Dowdy et al., 2017). The 2003 Canberra pyroCb did not produce lightning, but it is notable for being the only confirmed case in Australia that produced a genuine tornado (peak diameter of 400–500 m) which led to extensive vegetation damage along its path (McRae et al., 2013).
The Forcett–Dunalley fire and other known Australian pyroCbs share characteristics of events in North America in terms of height (>12 km; Diner et al., 2004; Fromm et al., 2005; Dahlkötter et al., 2014), lightning activity (Rosenfeld et al., 2007; Johnson et al., 2014), and time of occurrence (Rosenfeld et al., 2007; Peterson et al., 2017), although some events have been reported to have lasted up to 5 h (Ansmann et al., 2018; Peterson et al., 2018). North American studies have also highlighted the clear role that mid-tropospheric moisture plays in driving pyroCb development in the western US and Canada (Trentmann et al., 2006; Peterson et al., 2017), but this role does not appear as clear-cut in Australian pyroCbs. Indeed, a number of Australian pyroCb events exhibit a distinct lack of midlevel moisture in their associated atmospheric profiles, such as the 2003 Canberra fire (Fromm et al., 2006) and the 2013 Wambelong fire (Wagga Wagga sounding for 13 January 2013 on http://weather.uwyo.edu/upperair/sounding.html, last access: 28 February 2020). However, in this study, the mid- to upper-level moisture was higher during the time preceding pyroCb formation on 4 January (Fig. S2a), with a total precipitable water of 23 mm indicating a moist lower atmosphere (Webb and Fox-Hughes, 2015). Additionally, Terrasson et al. (2019) report on the effect of a change in moisture between the low- and upper-levels (brought by a cold front) on the development of a pyroCb and enhancement of fire behaviour in the Sir Ivan fire in eastern Australia. Further research is required to properly understand the potential influence of mid-tropospheric moisture in driving pyroCb development in Australia.
PyroCb development has been shown to be influenced by critical fire weather events. For instance, nocturnal foehn winds occurred the night preceding pyroCb development in both of the Forcett–Dunalley and Grose Valley fire cases. These warm, dry winds disrupt the fuel moisture recovery phase that usually occurs overnight, thereby priming the landscape with drier fuels the following day (McRae et al., 2015). PyroCb development can also be influenced by the passage of troughs or wind changes such as cold fronts or sea breezes (Mills and McCaw, 2010; Peace et al., 2017; Terrasson et al., 2019). Troughs provide a thermodynamic environment more favourable for moist convection in general, and the added lift from wind changes is thought to give pyroCb formation a boost. Recent research (Tory et al., 2018) also highlights the potential role that a wind change may play in enhancing pyroCb development by lowering the plume condensation height, through the entrainment of cooler and moister air. However, the Forcett–Dunalley pyroCb established itself well before the arrival of the wind change, as was the case with a number of other notable Australian pyroCbs such as the Grose Valley fire (McRae et al., 2015).
Extreme fire weather in eastern Tasmania reflects the combination of the (1) dominance of flammable vegetation, mainly composed of Eucalyptus forest and woodlands; (2) foehn-like winds (Fox-Hughes et al., 2014; Grose et al., 2014); and (3) pre-frontal troughs and cold fronts that cause elevated fire danger and rapid changes in fire spread (Sharples et al., 2010; Cruz et al., 2012; Bureau of Meteorology, 2013; Fox-Hughes et al., 2014; Grose et al., 2014). South-east Tasmania is particularly prone to foehn winds in pre-frontal environments, making the region vulnerable to wind direction changes that cause fire flanks to become fire fronts, thereby rapidly escalating the size of fires. Our analysis has shown that the Forcett–Dunalley fire was affected by these meteorological factors, had the highest levels of elevated fire weather of all the Tasmanian fires between 2007 and 2016, and was the only event to have produced a pyroCb. An important framework to understand the Forcett–Dunalley fire is the analysis of fire weather conditions during 40 pyroCb events in south-eastern Australia conducted by Di Virgilio et al. (2019); the above-mentioned analysis showed that the environmental conditions conducive to pyroCb development are extreme C-Haines conditions (10–13.7) and a very high to catastrophic near-surface fire danger (FFDI 25–150) occurring over forested and rugged landscapes. The Forcett–Dunalley pyroCb event is consistent with these observations, occurring under elevated C-Haines (10–11) and a severe–extreme FFDI (60–75) on undulating/rugged terrain that supported long unburnt, dry Eucalyptus fuels. Di Virgilio et al. (2019) suggest that extreme FFDI and C-Haines values may not lead to pyroCb development if there is a lack of deep flaming, due to factors such as elevated fuel moisture, low fuel loads, or fire suppression activities. This suggests that the heavy fuel loads that resulted in a large area burnt at high severity in the Forcett–Dunalley fire (Ndalila et al., 2018) may have contributed to the development of the pyroCb.
Mainland Australia, and especially the south-eastern region, experiences a greater number of days with elevated FFDI and C-Haines values than Tasmania (Dowdy and Pepler, 2018). The FFDI/C-Haines distribution in the above-mentioned region shows pyroCbs occurring over a wide range of FFDI values but under more limited extreme values of C-Haines (Di Virgilio et al., 2019). In Tasmania, however, we found that a fire weather environment conducive to pyroCb occurrence is likely to have high concurrent values of C-Haines and FFDI (Fig. 6), a conjunction that occurs rarely, although this may change with the projected warming climate in Australia (Dowdy, 2018; Di Virgilio et al., 2019). It is worth noting that the FFDI/C-Haines distribution for Tasmania reveals that high FFDI values (>25) do not influence large fire occurrence as much as high C-Haines values (>9), which is consistent with the findings of Di Virgilio et al. (2019). Climate modelling in Australia suggests that climate change may lead to an increased risk of strong pyroconvection, particularly in the spring months in south-eastern Australia (Dowdy and Pepler, 2018; Di Virgilio et al., 2019). Within Tasmania, climate models point to increased FFDI values and longer fire seasons (Fox-Hughes et al., 2014; Grose et al., 2014); hence, it is likely that the risk of pyroCbs will increase, with eastern and south-eastern Tasmania being particularly vulnerable, given the concentration of high C-Haines values identified in this study.
Turbulence associated with winds and terrain has been suggested as an important factor contributing to pyroCb formation via the amplification of fire through processes such as mass spotting, topographic channelling of winds, and vorticity-driven lateral spread (VLS; Sharples et al., 2012). Previous studies have linked abrupt increases in plume height with VLS; these include the 2003 Canberra fires (Sharples et al., 2012) and the 2006 Grose Valley fire (McRae et al., 2015). In these studies, VLS was confirmed based on the observation of rapid lateral expansion of the plume (McRae, 2010). However, this study did not find strong evidence of the effect of VLS on fire behaviour, as indicated by small patches of VLS-prone areas near Dunalley township (Fig. S4). Therefore, it is possible that the pyroCb attained its maximum height without the influence of VLS. However, this interpretation should be taken with caution as VLS possibly occurred but data constraints (especially the spatial resolution of the DEM and wind direction) may have precluded its accurate determination. Mapping of the Forcett–Dunalley fire by Ndalila et al. (2018) showed that areas subjected to the highest fire intensities were broadly aligned with undulating terrain and long unburnt dry Eucalyptus forest which under the influence of strong winds produced an ember storm that impacted the coastal township of Dunalley situated in the lee of the low hills. During this period (at 15:25 LT on 4 January), the rate of fire spread was reported to be around 50 m min−1 (or 3 km h−1), which then reduced to 1.9 km h−1 between 17:30 and 20:00 LT, and by the time of the next fire isochrone at 22:00 LT, when fire severity had significantly reduced (Fig. 3), the rate of spread was 1 km h−1 (Marsden-Smedley, 2014). It must be acknowledged that the role of downdraught and mass spotting underneath the plume during the period of extreme fire behaviour is hard to infer without additional data sources on fire behaviour (such as infra-red/multispectral linescans) and high-resolution coupled fire–atmosphere modelling (Peace et al., 2015).
This study hinges on the application of weather radars to track the evolution of a pyroCb. It is worth noting that weather radars are not perfectly suited for all fires due to their limited geographic range (relative to satellite observations) and their inability to detect microscale cloud particles (<100 µm). Nonetheless, radars remain a reliable data source that can provide near-real time monitoring of strong pyroconvection, as evidenced by previous pyroCb studies in Australia and globally (Rosenfeld et al., 2007; Fromm et al., 2012; Lareau and Clements, 2016; Dowdy et al., 2017; Peace et al., 2017; Lareau et al., 2018; Terrasson et al., 2019). This study did not analyse radial velocity from the Doppler radar; therefore, future research on the Forcett–Dunalley fire and other fires should consider using that information to provide a more quantitative analysis of the thunderstorm, drawing upon previous work in Australia (McCarthy et al., 2019; Terrasson et al., 2019). A feature of our study was linking plume evolution to fire severity mapping – an approach that has received limited attention. Duff et al. (2018) conducted one of the few studies and used statistical models to link the radar-detected plume volume to fire growth, and they found that radar return volume (above a threshold of 10 dBZ) was a robust predictor of fire-area change. These results appear consistent with the present findings, particularly with the correlation between rapid plume development and the horizontal growth of the fire. Other Australian studies linking fire behaviour to radar-detected plume development include McCarthy et al. (2018) and Terrasson et al. (2019).
The present study is the first in Tasmania that has utilised geographically comprehensive fire weather information both at the near-surface and the lower atmosphere to determine the spatiotemporal variation of elevated fire weather in the state. One opportunity for further research is to examine long-term trends in elevated fire weather as longer weather reanalysis datasets for Tasmania (1990–2019) become available. The influence of climate change on the spatial and seasonal dynamics of C-Haines is particularly important for comparison with projected changes in south-eastern Australia conducted by Di Virgilio et al. (2019).
Our analysis contributes to improving the prediction of extreme fire behaviour (Tory and Thurston, 2015). Indeed, in this context, it is interesting to know if the Forcett–Dunalley pyroCb could have been predicted with existing information. We suggest it is conceivable that the Forcett–Dunalley pyroCb blow-up between 15:24 and 16:30 LT on 4 January 2013 could have potentially been predicted 12–18 h in advance. Further, on the evening of 3 January, the Phoenix fire behaviour model predicted that the fire would reach Dunalley at approximately 15:00 LT on 4 January (Bureau of Meteorology, 2013); this was around the time that the fire reached Dunalley (15:24–15:48 LT) following the predicted path, which was confirmed by plume/pyroCb dynamics (Fig. 4) and witness reports. The conditions surrounding the pyroCb event are entirely consistent with those highlighted in the Blow-Up Fire Outlook (BUFO) model (McRae and Sharples, 2013, 2014). In essence, the BUFO model assesses the likelihood of a fire exhibiting deep flaming in an atmospheric environment conducive to rapid plume growth. Retrospective application of the BUFO model to the Forcett–Dunalley case yields the BUFO pathway summarised in Fig. S7. It is initiated by the presence of an uncontrolled fire in an elevated near-surface fire weather, combined with a wind speed of >25 km h−1 over rugged forested landscapes, with dead fuel moisture below 5 %, in a potential VLS-prone land form, and under extreme values of atmospheric instability and dryness (C-Haines ≥ 10).
This study provides an analysis of pyroCb dynamics and fire weather during an extreme fire event in Tasmania on 4 January 2013. We have shown that the pyroCb was associated with elevated fire weather conditions as well as with strong interactions between weather, terrain, and the fire itself, which caused dynamic fire behaviour and the near-destruction of Dunalley township. We have discussed the known drivers of pyroCbs and how the Forcett–Dunalley pyroCb relates to previous pyroCb events in Australia and globally. An analysis of fire weather in previous large wildfires in Tasmania between 2007 and 2016 suggests that the Forcett–Dunalley fire experienced among the highest levels of elevated fire weather of all the large fires in Tasmania, and it was the only event to have produced a pyroCb to date. A spatiotemporal analysis of fire weather in Tasmania shows that eastern (particularly south-eastern) Tasmania is subject to more days of elevated fire weather than the west, highlighting the vulnerability of this region to extreme fire events. This information is crucial for fire weather forecasting and fire management and planning.
The gridded weather reanalysis data for Tasmania (BARRA-TA) for the period from 2007 to 2016 are provided upon registration with the reanalysis helpdesk at the Bureau of Meteorology (BoM) via the following link: http://www.bom.gov.au/research/projects/reanalysis/ (Su et al., 2019). Weather radar data (in ODIM HDF5 format) are publicly available for noncommercial use via the Open Radar Data program at BoM: http://dapds00.nci.org.au/thredds/catalog/rq0/catalog.html (last access: 4 October 2019; Soderholm et al., 2019). The upper air (radiosonde) data are also available from BoM as two daily observations (at 09:00 and 21:00 local standard time). Global radiosonde data can be obtained from the University of Wyoming interactive mapping portal (http://weather.uwyo.edu/upperair/sounding.html; University of Wyoming 2020). The fire history dataset for Tasmania as well as the fire management area (FMA) boundary data for Tasmania are available from unpublished records held by Tasmania Fire Service; the 33 m digital elevation model is available from the Tasmanian Department of Primary Industries, Parks, Water and Environment (DPIPWE), but was originally derived from the WorldClim dataset (Hijmans et al., 2005).
The supplement related to this article is available online at: https://doi.org/10.5194/nhess-20-1497-2020-supplement.
MNN, GJW, PFH, JS, and DMJSB designed the experiments. PFH provided meteorological datasets. MNN analysed the data, and GJW developed the R code for the extraction and conversion of the gridded weather reanalysis (BARRA-TA) product and the weather radar dataset. MNN prepared the paper with contributions from all co-authors.
The authors declare that they have no conflict of interest.
We would like to thank Tom Remenyi of the University of Tasmania and the reanalysis team at the Bureau of Meteorology (BoM) for facilitating online access to the BARRA-TA product, Joshua Soderholm of BoM for providing additional weather radar datasets for this project, and Kevin Tory of BoM for his advice on some meteorological aspects of the study. We are also grateful to Rick McRae of the ACT Emergency Services Agency for assistance with the BUFO analysis. The support from the University of Tasmania, and the end-user support from Sam Ferguson of Tasmania Fire Service, through BNHCRC funding, is gratefully acknowledged.
This research has been supported by the Australian Research Council Linkage grant (grant no. LLP130100146) and the Bushfire and Natural Hazards Cooperative Research Centre (BNHCRC).
This paper was edited by Ricardo Trigo and reviewed by Paulo Fernandes and two anonymous referees.
Abatzoglou, J. T., Williams, A. P., and Barbero, R.: Global Emergence of Anthropogenic Climate Change in Fire Weather Indices, Geophys. Res. Lett., 46, 326–336, https://doi.org/10.1029/2018gl080959, 2019.
Ansmann, A., Baars, H., Chudnovsky, A., Mattis, I., Veselovskii, I., Haarig, M., Seifert, P., Engelmann, R., and Wandinger, U.: Extreme levels of Canadian wildfire smoke in the stratosphere over central Europe on 21–22 August 2017, Atmos. Chem. Phys., 18, 11831–11845, https://doi.org/10.5194/acp-18-11831-2018, 2018.
Bureau of Meteorology: 2013 Tasmanian Bushfires Inquiry, Hobart, Tasmania, Australia, 2013.
Clarke, H. and Evans, J. P.: Exploring the future change space for fire weather in southeast Australia, Theor. Appl. Climatol., 136, 513–527, https://doi.org/10.1007/s00704-018-2507-4, 2019.
Clarke, H. G., Smith, P. L., and Pitman, A. J.: Regional signatures of future fire weather over eastern Australia from global climate models, Int. J. Wildland Fire, 20, 550–562, https://doi.org/10.1071/WF10070, 2011.
Cruz, M. G., Sullivan, A. L., Gould, J. S., Sims, N. C., Bannister, A. J., Hollis, J. J., and Hurley, R. J.: Anatomy of a catastrophic wildfire: The Black Saturday Kilmore East fire in Victoria, Australia, For. Ecol. Manage., 284, 269–285, https://doi.org/10.1016/j.foreco.2012.02.035, 2012.
Cunningham, P. and Reeder, M. J.: Severe convective storms initiated by intense wildfires: Numerical simulations of pyro-convection and pyro-tornadogenesis, Geophys. Res. Lett., 36, L12812, https://doi.org/10.1029/2009GL039262, 2009.
Dahlkötter, F., Gysel, M., Sauer, D., Minikin, A., Baumann, R., Seifert, P., Ansmann, A., Fromm, M., Voigt, C., and Weinzierl, B.: The Pagami Creek smoke plume after long-range transport to the upper troposphere over Europe – aerosol properties and black carbon mixing state, Atmos. Chem. Phys., 14, 6111–6137, https://doi.org/10.5194/acp-14-6111-2014, 2014.
Diner, D. J., Fromm, M. D., Torres, O., Logan, J. A., Martonchik, J. V., Kahn, R. A., Moroney, C. M., Mazzoni, D. M., and Averill, C.: New Satellite Observations of Upper Tropospheric/Lower Stratospheric Aerosols: Case Studies over the U.S. and Canada, AGU Fall Meeting Abstracts, 1 December 2004, San Francisco, California, USA, 2004.
Di Virgilio, G., Evans, J. P., Blake, S. A. P., Armstrong, M., Dowdy, A. J., Sharples, J., and McRae, R.: Climate Change Increases the Potential for Extreme Wildfires, Geophys. Res. Lett., 46, 8517–8526, https://doi.org/10.1029/2019gl083699, 2019.
Dowdy, A. J.: Climatological Variability of Fire Weather in Australia, J. Appl. Meteorol. Clim., 57, 221–234, https://doi.org/10.1175/jamc-d-17-0167.1, 2018.
Dowdy, A. J. and Pepler, A.: Pyroconvection Risk in Australia: Climatological Changes in Atmospheric Stability and Surface Fire Weather Conditions, Geophys. Res. Lett., 45, 2005–2013, https://doi.org/10.1002/2017gl076654, 2018.
Dowdy, A. J., Fromm, M. D., and McCarthy, N.: Pyrocumulonimbus lightning and fire ignition on Black Saturday in southeast Australia, J. Geophys. Res.-Atmos., 122, 7342–7354, https://doi.org/10.1002/2017jd026577, 2017.
Duff, T. J., Chong, D. M., and Penman, T. D.: Quantifying wildfire growth rates using smoke plume observations derived from weather radar, Int. J. Wildland Fire, 27, 514–524, https://doi.org/10.1071/WF17180, 2018.
ESRI: ArcGIS Desktop Release 10.3, Environmental Systems Research Institute, Redlands, CA, USA, 2015.
Fawcett, R. J. B., Webb, M., Thurston, W., Kepert, J. D., and Tory, K. J.: Modelling the fire weather of the Dunalley, Tasmania fire of January 2013: an ACCESS case study, CAWCR Research Letters, Centre for Australian Weather and Climate Research, Melbourne, Victoria, Australia, 36–40, 2014.
Fox-Hughes, P., Harris, R., Lee, G., Grose, M., and Bindoff, N.: Future fire danger climatology for Tasmania, Australia, using a dynamically downscaled regional climate model, Int. J. Wildland Fire, 23, 309–321, https://doi.org/10.1071/WF13126, 2014.
Fromm, M., Bevilacqua, R., Servranckx, R., Rosen, J., Thayer, J. P., Herman, J., and Larko, D.: Pyro-cumulonimbus injection of smoke to the stratosphere: Observations and impact of a super blowup in northwestern Canada on 3–4 August 1998, J. Geophys. Res.-Atmos., 110, D08205, https://doi.org/10.1029/2004jd005350, 2005.
Fromm, M., Tupper, A., Rosenfeld, D., Servranckx, R., and McRae, R.: Violent pyro-convective storm devastates Australia's capital and pollutes the stratosphere, Geophys. Res. Lett., 33, 05815, https://doi.org/10.1029/2005GL025161, 2006.
Fromm, M., Lindsey, D. T., Servranckx, R., Yue, G., Trickl, T., Sica, R., Doucet, P., and Godin-Beekmann, S.: The Untold Story of Pyrocumulonimbus, B. Am. Meteorol. Soc., 91, 1193–1209, https://doi.org/10.1175/2010BAMS3004.1, 2010.
Fromm, M. D., McRae, R. H. D., Sharples, J. J., and Kablick, G. P.: Pyrocumulonimbus pair in Wollemi and Blue Mountains National Parks, 22 November 2006, Aust. Meteorol. Ocean., 62, 117–126, 2012.
Grose, M. R., Fox-Hughes, P., Harris, R. M. B., and Bindoff, N. L.: Changes to the drivers of fire weather with a warming climate – a case study of southeast Tasmania, Climatic Change, 124, 255–269, https://doi.org/10.1007/s10584-014-1070-y, 2014.
Haines, D. A.: A lower atmospheric severity index for wildland fires, Natl. Weather Dig., 13 23–27, 1988.
Hennessy, K. J., Lucas, C., Nicholls, N., Bathols, J. M., Suppiah, R., and Ricketts, J. R.: Climate Change Impacts on Fire-Weather in South-East Australia, CSIRO, Melbourne, Australia, 2005.
Hijmans, R. J., Cameron, S. E., Parra, J. L., Jones, P. G., and Jarvis, A.: Very high resolution interpolated climate surfaces for global land areas, Int. J. Climatol., 25, 1965–1978, https://doi.org/10.1002/joc.1276, 2005.
Johnson, R. H., Schumacher, R. S., Jr., J. H. R., Lindsey, D. T., Ruthford, J. E., and Kriederman, L.: The Role of Convective Outflow in the Waldo Canyon Fire, Mon. Weather Rev., 142, 3061–3080, https://doi.org/10.1175/mwr-d-13-00361.1, 2014.
Jolly, W. M., Cochrane, M. A., Freeborn, P. H., Holden, Z. A., Brown, T. J., Williamson, G. J., and Bowman, D. M. J. S.: Climate-induced variations in global wildfire danger from 1979 to 2013, Nat. Commun., 6, 7537, https://doi.org/10.1038/ncomms8537, 2015.
Jones, T. A. and Christopher, S. A.: Satellite and Radar Remote Sensing of Southern Plains Grass Fires: A Case Study, J. Appl. Meteorol. Clim., 49, 2133–2146, https://doi.org/10.1175/2010jamc2472.1, 2010.
Key, C. H. and Benson, N.: Landscape Assessment (LA). FIREMON: Fire effects monitoring and inventory system, LA-1-55, Rocky Mountain Research Station, USDA Forest Service, Fort Collins, Colorado, USA, 2006.
Lareau, N. P. and Clements, C. B.: Environmental controls on pyrocumulus and pyrocumulonimbus initiation and development, Atmos. Chem. Phys., 16, 4005–4022, https://doi.org/10.5194/acp-16-4005-2016, 2016.
Lareau, N. P., Nauslar, N. J., and Abatzoglou, J. T.: The Carr Fire Vortex: A Case of Pyrotornadogenesis?, Geophys. Res. Lett., 45, 13107–13115, https://doi.org/10.1029/2018gl080667, 2018.
Luderer, G., Trentmann, J., Winterrath, T., Textor, C., Herzog, M., Graf, H. F., and Andreae, M. O.: Modeling of biomass smoke injection into the lower stratosphere by a large forest fire (Part II): sensitivity studies, Atmos. Chem. Phys., 6, 5261–5277, https://doi.org/10.5194/acp-6-5261-2006, 2006.
Marsden-Smedley, J.: Tasmanian wildfires January-February 2013: Forcett-Dunalley, Repulse, Bicheno, Giblin River, Montumana, Molesworth and Gretna, Bushfire Cooperative Research Centre, East Melbourne, Victoria, Australia, 2014.
Marsden-Smedley, J. and Catchpole, W.: Fire Behaviour Modelling in Tasmanian Buttongrass Moorlands .II. Fire Behaviour, Int. J. Wildland Fire, 5, 215–228, https://doi.org/10.1071/WF9950215, 1995.
McCarthy, N., McGowan, H., Guyot, A., and Dowdy, A.: Mobile X-Pol Radar: A New Tool for Investigating Pyroconvection and Associated Wildfire Meteorology, B. Am. Meteorol. Soc., 99, 1177–1195, https://doi.org/10.1175/bams-d-16-0118.1, 2018.
McCarthy, N., Guyot, A., Dowdy, A., and McGowan, H.: Wildfire and Weather Radar: A Review, J. Geophys. Res.-Atmos., 124, 266–286, https://doi.org/10.1029/2018jd029285, 2019.
McRae, R.: Extreme Fire – a Handbook, ACT Government and Bushfire Cooperative Research Centre, Australian Capital Territory, Australia, 2010.
McRae, R. H. D. and Sharples, J. J.: A process model for forecasting conditions conducive to blow-up fire events, Proceedings, 2013 MODSIM Conference, 1–6 December 2013, Adelaide, Australia, 187–192, 2013.
McRae, R. H. D. and Sharples, J. J.: Forecasting conditions conducive to blow-up fire events, CAWCR Research Letters, Centre for Australian Weather and Climate Research, Melbourne, Victoria, Australia, 14–19, 2014.
McRae, R. H. D., Sharples, J. J., Wilkes, S. R., and Walker, A.: An Australian pyro-tornadogenesis event, Nat. Hazards, 65, 1801–1811, https://doi.org/10.1007/s11069-012-0443-7, 2013.
McRae, R. H. D., Sharples, J. J., and Fromm, M.: Linking local wildfire dynamics to pyroCb development, Nat. Hazards Earth Syst. Sci., 15, 417–428, https://doi.org/10.5194/nhess-15-417-2015, 2015.
Mills, G. A. and McCaw, L.: Atmospheric Stability Environments and Fire Weather in Australia – extending the Haines Index, Technical report No. 20, Centre for Australian Weather and Climate Research, Melbourne, Victoria, Australia, 2010.
Ndalila, M. N., Williamson, G. J., and Bowman, D. M. J. S.: Geographic Patterns of Fire Severity Following an Extreme Eucalyptus Forest Fire in Southern Australia: 2013 Forcett-Dunalley Fire, Fire, 1, 40, https://doi.org/10.3390/fire1030040, 2018.
Peace, M., Mattner, T., Mills, G., Kepert, J., and McCaw, L.: Fire-Modified Meteorology in a Coupled Fire–Atmosphere Model, J. Appl. Meteorol. Clim., 54, 704–720, https://doi.org/10.1175/jamc-d-14-0063.1, 2015.
Peace, M., McCaw, L., Santos, B., Kepert, J., Burrows, N., and Fawcett, R.: Meteorological drivers of extreme fire behaviour during the Waroona bushfire, Western Australia, January 2016, J. So. Hemisph. Earth, 67, 79–106, https://doi.org/10.22499/3.6702.002, 2017.
Peterson, D., Hyer, E., and Wang, J.: Quantifying the potential for high-altitude smoke injection in the North American boreal forest using the standard MODIS fire products and subpixel-based methods, J. Geophys. Res.-Atmos., 119, 3401–3419, https://doi.org/10.1002/2013jd021067, 2014.
Peterson, D. A., Hyer, E. J., Campbell, J. R., Solbrig, J. E., and Fromm, M. D.: A Conceptual Model for Development of Intense Pyrocumulonimbus in Western North America, Mon. Weather Rev., 145, 2235–2255, https://doi.org/10.1175/mwr-d-16-0232.1, 2017.
Peterson, D. A., Campbell, J. R., Hyer, E. J., Fromm, M. D., Kablick, G. P., Cossuth, J. H., and DeLand, M. T.: Wildfire-driven thunderstorms cause a volcano-like stratospheric injection of smoke, NPJ Clim. Atmos. Sci., 1, 30, https://doi.org/10.1038/s41612-018-0039-3, 2018.
Potter, B. E. and Hernandez, J. R.: Downdraft outflows: Climatological potential to influence fire behaviour, Int. J. Wildland Fire, 26, 685–692, https://doi.org/10.1071/WF17035, 2017.
R Core Team: R: A Language and Environment for Statistical Computing, R Foundation for Statistical Computing, Vienna, Austria, available at: https://www.R-project.org/ (last access: 20 May 2020), 2017.
Rosenfeld, D., Fromm, M., Trentmann, J., Luderer, G., Andreae, M. O., and Servranckx, R.: The Chisholm firestorm: observed microstructure, precipitation and lightning activity of a pyro-cumulonimbus, Atmos. Chem. Phys., 7, 645–659, https://doi.org/10.5194/acp-7-645-2007, 2007.
Sharples, J. J., Mills, G. A., McRae, R. H. D., and Weber, R. O.: Foehn-Like Winds and Elevated Fire Danger Conditions in Southeastern Australia, J. Appl. Meteorol. Clim., 49, 1067–1095, https://doi.org/10.1175/2010jamc2219.1, 2010.
Sharples, J. J., McRae, R. H., and Wilkes, S. R.: Wind–terrain effects on the propagation of wildfires in rugged terrain: fire channelling, Int. J. Wildland Fire, 21, 282–296, https://doi.org/10.1071/WF10055, 2012.
Sharples, J. J., Cary, G. J., Fox-Hughes, P., Mooney, S., Evans, J. P., Fletcher, M.-S., Fromm, M., Grierson, P. F., McRae, R., and Baker, P.: Natural hazards in Australia: extreme bushfire, Climatic Change, 139, 85–99, https://doi.org/10.1007/s10584-016-1811-1, 2016.
Soderholm, J., Protat, A., and Jakob, C.: Australian Operational Weather Radar Dataset, Electronic dataset, National Computing Infrastructure, https://doi.org/10.25914/5cb686a8d9450, 2019.
Su, C.-H., Eizenberg, N., Steinle, P., Jakob, D., Fox-Hughes, P., White, C. J., Rennie, S., Franklin, C., Dharssi, I., and Zhu, H.: BARRA v1.0: the Bureau of Meteorology Atmospheric high-resolution Regional Reanalysis for Australia, Geosci. Model Dev., 12, 2049–2068, https://doi.org/10.5194/gmd-12-2049-2019, 2019 (data available at: http://www.bom.gov.au/research/projects/reanalysis/, last access: 4 October 2019).
Tedim, F., Leone, V., Amraoui, M., Bouillon, C., Coughlan, M., Delogu, G., Fernandes, P., Ferreira, C., McCaffrey, S., McGee, T., Parente, J., Paton, D., Pereira, M., Ribeiro, L., Viegas, D., and Xanthopoulos, G.: Defining Extreme Wildfire Events: Difficulties, Challenges, and Impacts, Fire, 1, 9, https://doi.org/10.3390/fire1010009, 2018.
Terrasson, A., McCarthy, N., Dowdy, A., Richter, H., McGowan, H., and Guyot, A.: Weather Radar Insights Into the Turbulent Dynamics of a Wildfire-Triggered Supercell Thunderstorm, J. Geophys. Res.-Atmos., 124, 8645–8658, 2019.
Tory, K. J. and Thurston, W.: Pyrocumulonimbus: A Literature Review, Bushfire and Natural Hazards CRC, Melbourne, Victoria, Australia, 2015.
Tory, K. J., Thurston, W., and Kepert, J. D.: Thermodynamics of Pyrocumulus: A Conceptual Study, Mon. Weather Rev., 146, 2579–2598, https://doi.org/10.1175/mwr-d-17-0377.1, 2018.
Trentmann, J., Luderer, G., Winterrath, T., Fromm, M. D., Servranckx, R., Textor, C., Herzog, M., Graf, H.-F., and Andreae, M. O.: Modeling of biomass smoke injection into the lower stratosphere by a large forest fire (Part I): reference simulation, Atmos. Chem. Phys., 6, 5247–5260, https://doi.org/10.5194/acp-6-5247-2006, 2006.
Unidata: Integrated Data Viewer (IDV) version 5.5, UCAR/Unidata, Boulder, CO, USA, 2018.
University of Wyoming: Global upper air soundings, available at: http://weather.uwyo.edu/upperair/sounding.html, last access: 20 May 2020.
Webb, M. and Fox-Hughes, P.: An analysis of extreme rainfall in northern Tasmania, 12–14 January 2011. Bureau Research Report No. 003, Bureau of Meteorology, Hobart, Australia, 2015.
Williams, E. R.: The tripole structure of thunderstorms, J. Geophys. Res.-Atmos., 94, 13151–13167, https://doi.org/10.1029/JD094iD11p13151, 1989.
Yeo, C. S., Kepert, J. D., and Hicks, R.: Fire danger indices: current limitations and a pathway to better indices, Bushfire & Natural Hazards CRC, Melbourne, Victoria, Australia, 2015.