the Creative Commons Attribution 4.0 License.
the Creative Commons Attribution 4.0 License.
 | 28 Feb 2019
Integrated risk assessment due to slope instabilities in the roadway network of Gipuzkoa, Basque Country
Olga Mavrouli
Jordi Corominas
Iñaki Ibarbia
Nahikari Alonso
Ioseba Jugo
Jon Ruiz
Susana Luzuriaga
José Antonio Navarro
Transportation corridors such as roadways are often subjected to both natural instability and cut-slope failures, with substantial physical damage to the road infrastructure and threats to the circulating vehicles and passengers. In the early 2000s, the Gipuzkoa Provincial Council of the Basque Country in Spain noted the need for assessing the risk related to the geotechnical hazards of its road network, in order to assess and monitor their safety for road users. The quantitative risk assessment (QRA) was selected as a tool for comparing the risk of different hazards on an objective basis. Few examples of multi-hazard risk assessment along transportation corridors exist. The methodology presented here consists of the calculation of risk, in terms of probability of failure and its respective consequences, and it was applied to 84 selected points of risk (PoR) over the entire road network managed by the Gipuzkoa Provincial Council. The types of encountered slope instabilities that are examined are rockfalls, retaining-wall failures, and slow-moving landslides. The proposed methodology includes the calculation of the probability of failure for each hazard based on an extensive collection of field data, and its association with the expected consequences. Instrumentation data from load cells and inclinometers were used for the anchored walls and the slow-moving landslides, respectively. The expected road damage was assessed for each hazard level in terms of a fixed unit cost (UC). The results indicate that the risk can be comparable for the different hazards. A total of 21 % of the PoR in the study area were found to be of very high risk.
- Article
(6327 KB) - Full-text XML
- BibTeX
- EndNote


Transportation corridors such as roadways are often subjected to both natural instability and cut-slope failures, with substantial physical damage to the road infrastructure and threats to the circulating vehicles and passengers. The growing societal demand for road safety requires managing this risk and places a high priority on the identification of problematic areas to effectively manage the mitigation works.
Risk is most commonly conceptualized as the product of hazard, exposure, and vulnerability. Qualitative risk analysis for transportation corridors traditionally combines different levels of hazard and vulnerability to provide the risk across a network (e.g. Pellicani et al., 2017). Nevertheless, the interpretation of risk levels which are obtained qualitatively may vary for the different hazards (Eidsvig et al., 2017). The homogenization of the risk of multiple hazards remains a challenge because of the variability in the nature of soil or rock mass movement phenomena and the difference in the type and extent of the consequences. The comparison of different types of geotechnical risks for roadways, such as slope movements and retaining structure failure, requires bringing these phenomena under a common denominator. Quantitative risk descriptors, being objective expressions of the expected risk extent, may well aid in the homogenization of the risk levels for different hazards and types of exposed elements (persons, vehicles, infrastructure, and indirect economical loss). Common quantitative risk descriptors are the expected annual monetary loss, the probability of a given loss scenario, the probability of one or more fatalities, and others mentioned in Corominas et al. (2014).
One of the major limitations for the quantitative risk assessment of roadways is the great data demand that it implies. The hazard in terms of probability of an event of a given magnitude requires extensive data on the frequency and also magnitude (volume) of the events (Fell et al., 2008; Jaiswal et al., 2010). Most commonly, landslide inventories are required (Dai et al., 2002; Ferlisi et al., 2012), although in most cases they are scarce. Highway and traffic administration authorities are potential data providers (Hungr et al., 1999); however, complete and reliable maintenance records are rarely kept and made available. Alternative methods to overcome the scarcity of empirical data are provided in Corominas et al. (2014), and they are based on geomechanical or indirect approaches. They associate the occurrence of events with the temporal occurrence of their triggering factors, such as the return period of rainfall of a given intensity. On the other hand, for a purely quantitative risk assessment, the calculation of the consequences in terms of realistic expected costs is a challenge, as the amount of repair or insurance expenses fluctuates greatly depending on the type and extent of the damage, on top of the indirect costs related to traffic interruptions, detours, and further loss related to traffic accidents. Due to these limitations, few purely quantitative multi-hazard risk assessments for roadways exist in the literature.
An extensive review of highway slope instability risk assessment systems is provided by Pantelidis (2011), including several qualitative and semi-quantitative methods (by semi-quantitative we refer to the methodologies that assess the hazard in terms of numerical scores). A well-known example of semi-quantitative methods is the Rockfall Hazard Rating System (Pierson and Van Vickle, 1993) recommended by the FHWA (Federal Highway Administration of the United States), which was later adapted by Budetta (2004) specifically for rockfall risk along roads. The pure quantitative risk assessment (QRA), however, consists of the hazard assessment in terms of probability of failure or occurrence of an event of a given magnitude multiplied by its respective consequences (Fell et al., 2008), which is not treated by semi-quantitative methods.
Hungr et al. (1999) quantified the rockfall risk along roadways in British Columbia after deriving magnitude–cumulative frequency curves. Bunce et al. (1997) were amongst the first to use the roadway damage required in order to assess the rockfall frequency. Remondo et al. (2008) proposed a method for the quantification of the damage to the Gipuzkoa road network where losses were calculated on the basis of past damage records and took into account budgets for road and railway track repairs. Similarly, Zêzere et al. (2008) assessed the direct risk from translational, rotational, and shallow landslides to the north of Lisbon, Portugal, employing road reconstruction costs within a geographical information system. Ferlisi et al. (2012), using the fundamental risk equation provided by Fell et al. (2008), calculated the annual probability of one or more fatalities by rockfalls on the Amalfi coastal road, southern Italy, and Michoud et al. (2012) presented an example from the Swiss Alps. Jaiswal et al. (2010) applied a risk model for debris slides, where the temporal probability was indirectly obtained by the return period of the triggering rainfalls and the road vulnerability was assessed as a function of the road location and expected debris magnitude. Ferrero and Migliazza (2013) made an early attempt to incorporate the efficiency of protection measures into the risk assessment (Nicolet et al., 2016). Still, when it comes to the practical application of quantitative risk analysis to linear infrastructure, several challenges exist.
One of the most important challenges is the assessment of the expected magnitude–frequency relation and of the annual probability of occurrence for a hazard of a certain magnitude or intensity, in particular where past event inventories are incomplete or missing. As mentioned above, alternative methods have been suggested to this end; however, in most cases their application is limited to being site specific. There is a scarcity of cost-efficient, quick, simple, and easy enough methodologies to be applied to extensive road networks, using the evidence that can be found in the vicinity of the transportation corridors, field inspections, or instrumentation as input. Given those limitations, the determination of landslide magnitude–frequency data requirements and their specifications, within a suitable and feasible framework for transportation corridors, remains an issue.
Assessing the condition of assets such as road pavement and protection infrastructure (in this case retaining walls) allows for monitoring operational efficiency, planning future maintenance, and rehabilitation activities and controlling costs through condition forecasting models (Gharaibeh and Lindholm, 2014). Although models for predicting pavement deterioration under usual stress conditions have been used for more than 3 decades now, the literature is lacking in terms of prediction models for disruptive slope instability events. Similarly, simple yet functional and (semi-) quantitatively based empirical models for condition assessments of retaining walls are scarce.
Diverse hazard types require different descriptors for predicting asset condition. In quantitative multi-hazard risk assessment, the use of all descriptors should produce comparable results on a common and meaningful (commonly financial) scale. This requires, in each case, adequate criteria and thresholds for the establishment of hazard classes to associate with vulnerability levels and costs (Schmidt et al., 2011; Kappes et al., 2012). Very few examples of roadway vulnerability exist in the literature (e.g. Mansour et al., 2011; Eidsvig et al., 2017). Their applicability or adjustment to other case studies is a topic for further research.
The work that is presented here aims to fill these gaps with the development of a comprehensive procedure including suitable data collection, hazard and vulnerability assessment and their integration into risk calculations. Up until the time of writing, and to the authors' knowledge, there are few integrated approaches to multi-hazard quantitative risk analysis for transportation routes at site-specific and local scales. The starting point was the need for a risk assessment system for a specific area, and all approaches discussed here for confronting these issues are strongly related to the local characteristics of the study area and the available documentation and instrumentation.
In particular, in the early 2000s the Gipuzkoa Provincial Council of the Basque Country, Spain, emphasized the need to assess the risks related to the geotechnical hazards of its road network, in order to assess and monitor their safety for road users. The main objective is the identification of the most problematic areas where mitigation measures should be prioritized. In this specific road network, a variety of geotechnical hazards coexist, which are relevant to both cut and natural slope instabilities and include the potential failure of retaining walls. A quantitative risk analysis approach was proposed.
The methodology presented here was developed with the objective of comparing the risk levels for a variety of elements comprising roads and retaining walls using a common unique criterion for their evaluation. It consists of the QRA, in terms of probability of failure and its respective consequences, at 84 selected points of risk (PoR) over the entire road network managed by the Gipuzkoa Provincial Council (Fig. 1). The types of encountered slope instabilities that are treated in this paper are rockfalls, retaining walls, and slow-moving landslides. Further geotechnical risks in the area include debris flows, instability of embankments, and brittle slope failures, but their assessment is not included here.
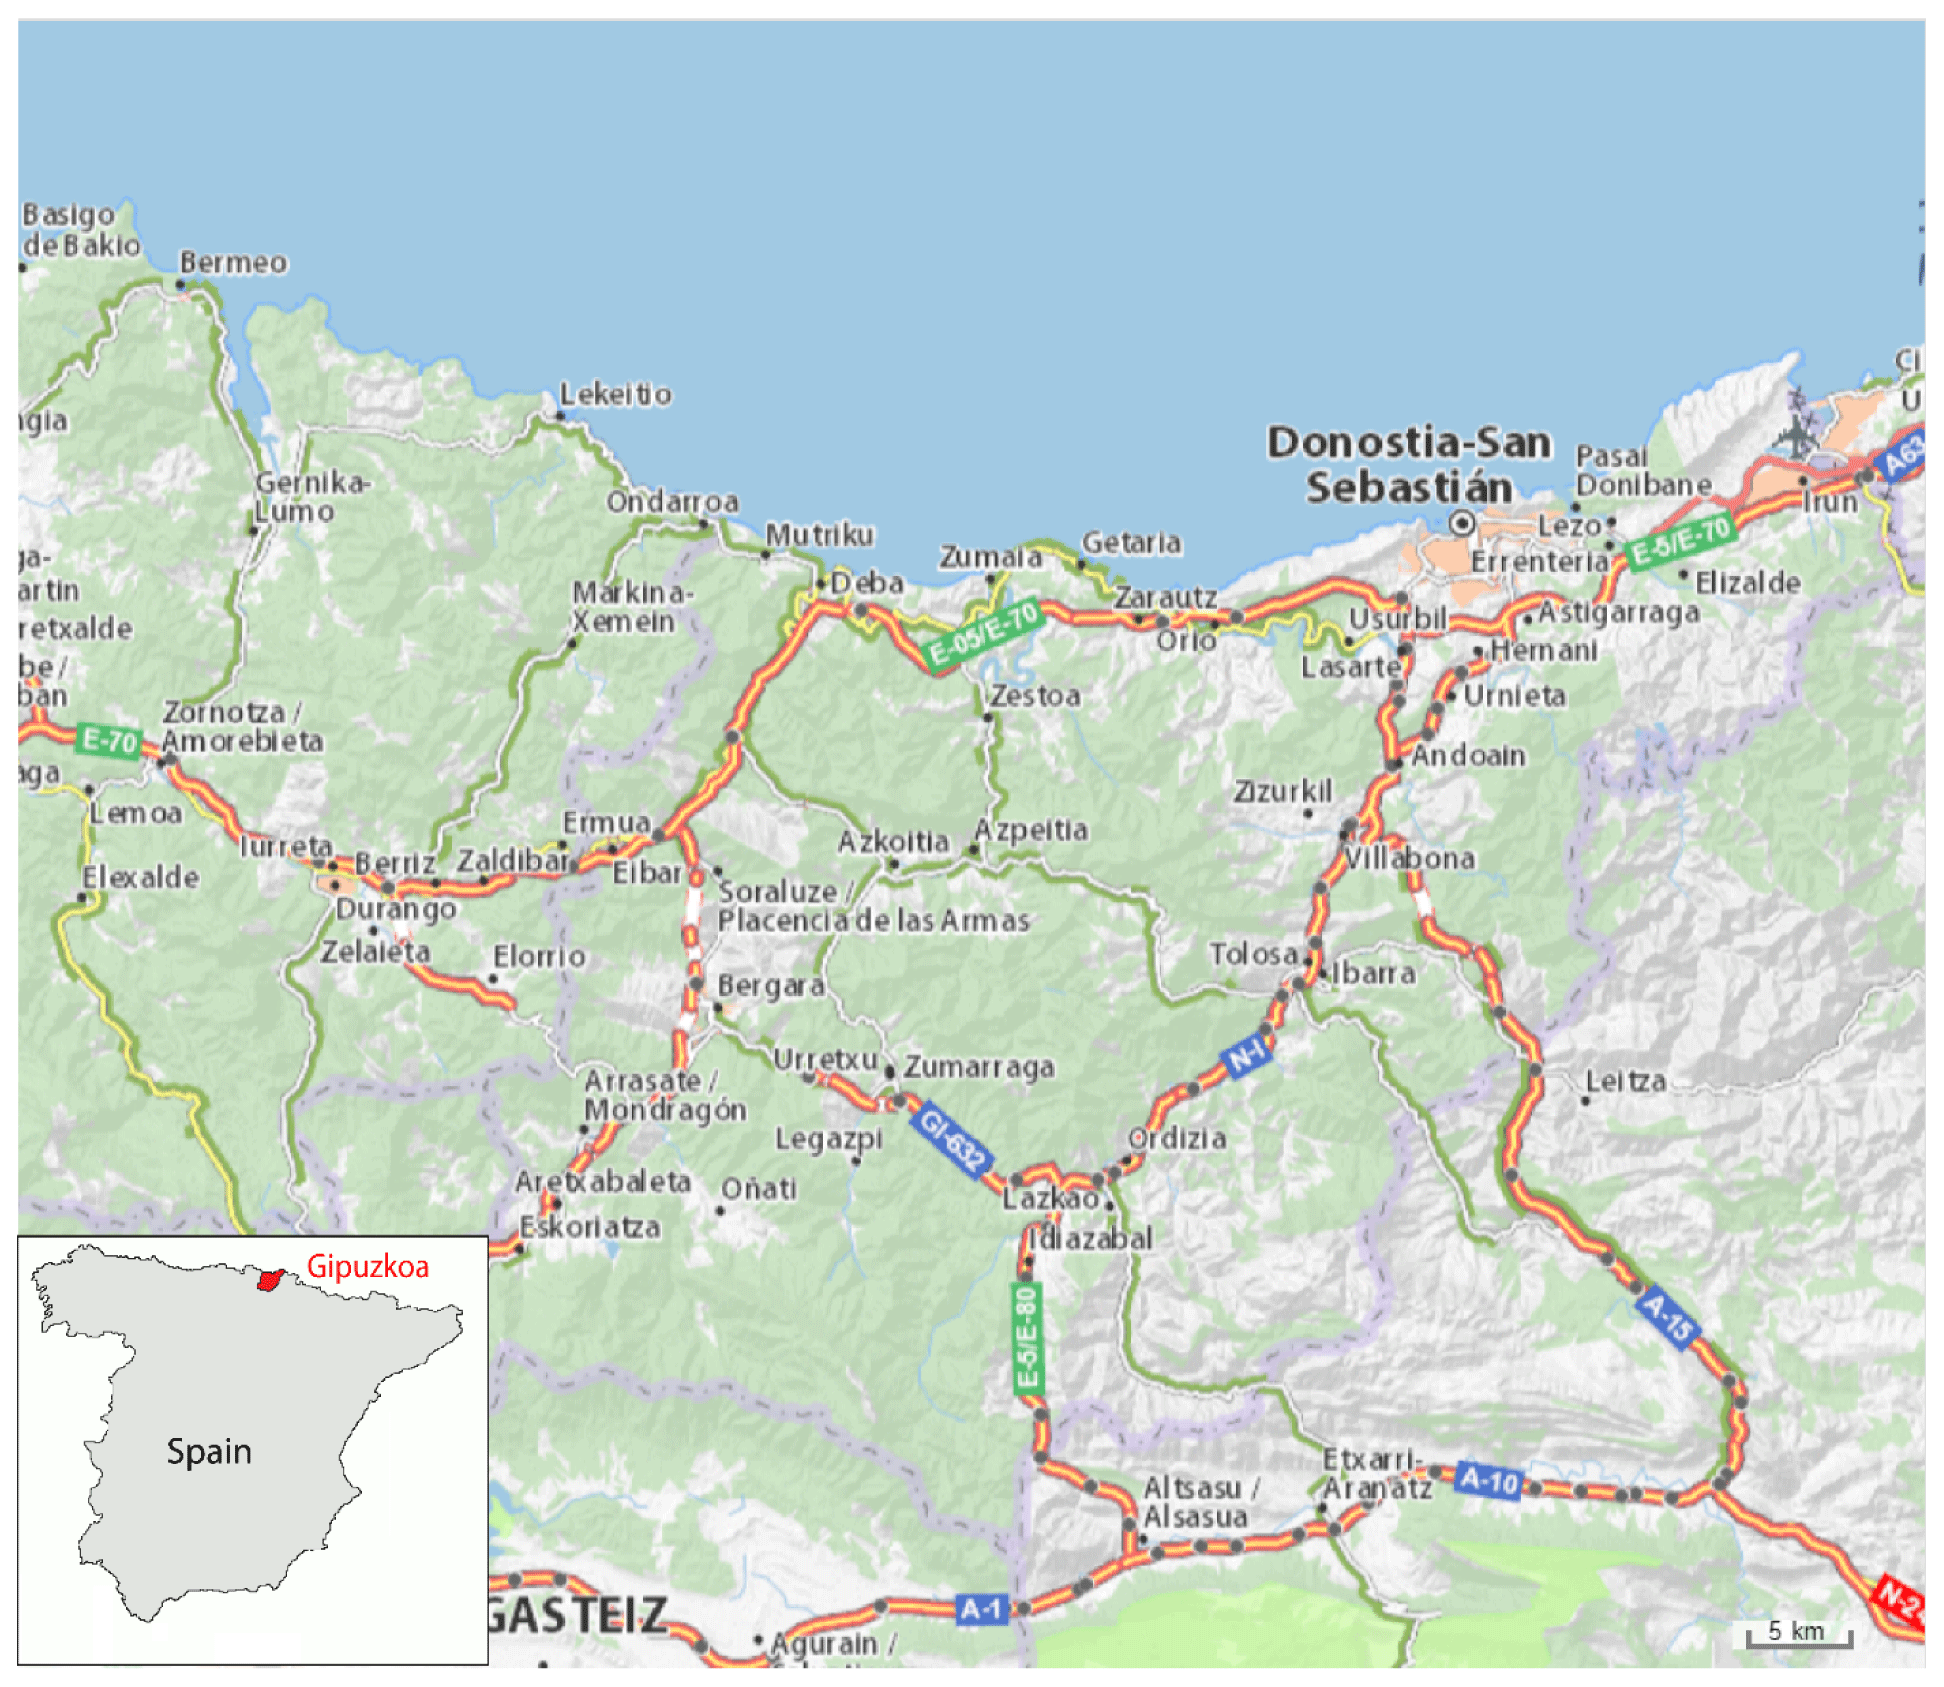
Figure 1Road network managed by the Gipuzkoa Provincial Council (map source: ViaMichelin website at https://www.viamichelin.com/web/Maps, last access: September 2018).
The study area is the road network managed by the Gipuzkoa Road Authority, in the Basque Country, Spain (Fig. 1). It consists of four networks: highways and primary, county, and local roads. Their difference lies in their capacity and function as connecting corridors between major and/or minor urban or rural nuclei. In that region, the layout of the road network has been spatially constrained since its design by its characteristically intense morphological relief. Soil infills or excavations and important constructions such as retaining walls are required to protect the road users and the road infrastructure against soil–rock mass movements and instabilities. A significant fraction of the retaining walls are composed of anchored walls.
From a geological point of view, Gipuzkoa province is part of the Basque–Cantabrian basin (Barnolas and Pujalte, 2004). More specifically, it is the segment connecting the Pyrenees and the Cantabrian Mountains to the west (Tugend et al., 2014). It experienced normal faulting and high subsidence rates during the Cretaceous and was inverted during Tertiary compression that was related to the Alpine orogeny (Gómez et al., 2002). The outcropping rocks cover a wide temporal record, from the upper Paleozoic to the Quaternary. However, there is no representation of the materials belonging to the period between the Oligocene (lower–middle Tertiary) and early Pleistocene. The geology of the study area is well synthetized by Ábalos (2016) (Fig. 2).
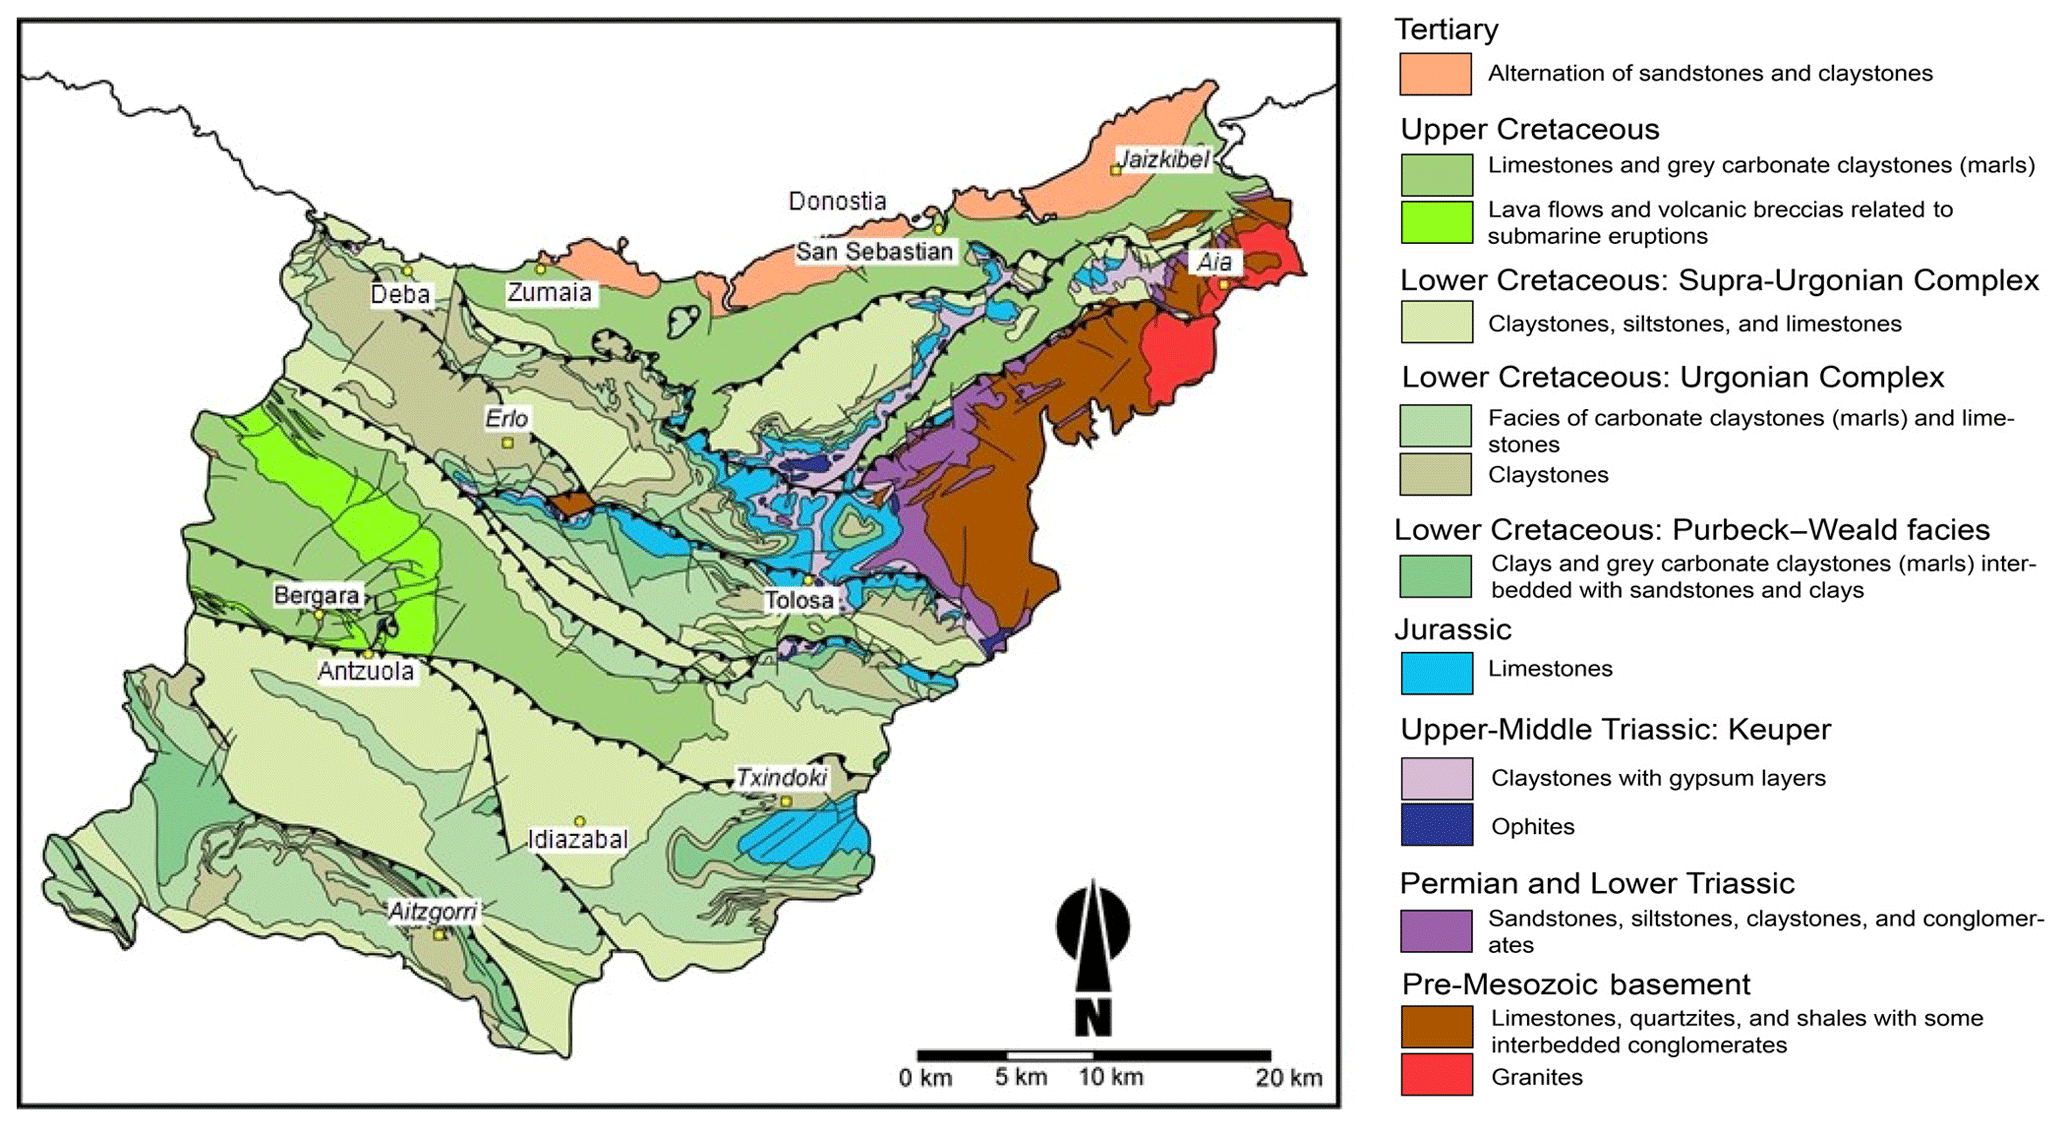
According to this source, two well differentiated geological sectors can be distinguished. The first one extends over the northeast corner of Gipuzkoa, in which the Paleozoic rocks (granitoid rocks and limestone layers overlaid with quartzites and shales with some interbedded conglomerate layers) and Triassic rocks (sandstones, siltstones, claystones, and conglomerates) are predominant. The rest of Gipuzkoa province is composed of thick sedimentary assemblages, mainly Cretaceous and Tertiary (Fig. 2). The outcropping lithological units are diverse. Jurassic rocks are usually composed of carbonate rocks of marine platform facies. Several stratigraphic units are found in the Lower Cretaceous formations. The Weald Complex is composed of continental and freshwater sedimentary rocks. The Urgonian Complex is formed by reefal limestones; the Supra-Urgonian Complex exhibits a considerable internal complexity, mostly clayey limestones, siltstones, and argillites. The Upper Cretaceous is characterized by flysch alternations and Tertiary flysch sandstones. In general, the sedimentary rocks were formed in a great diversity of depositional environments, although they mostly correspond to marine environments, with intercalations of continental or transitional facies.
Materials such as limestones, conglomerates, and sandstones stand out and form the topographic relief, as they are more resistant to erosion than the clay and siltstone zones that are also present in the area.
Concerning tectonics, all of the aforementioned materials appear folded and fractured as a result of actions during the two orogenic phases. The oldest one, corresponding to the Hercynian orogeny, affected the Paleozoic rocks while the more recent alpine orogeny was responsible for the general uplift of the Pyrenean mountain range. During the uplift, the Mesozoic sedimentary cover detached from the Paleozoic basement in favour of the most deformable lithological units (e.g. Keuper) and created a complex structure of folds faults and diapirs. Both the folds and the main fractures have alignments oriented in the directions of northeast–southeast and northwest–southeast, which in the eastern part of Gipuzkoa province form an arch that bounds the Paleozoic reliefs.
The Quaternary rock deposits pertain to residual soils, originating from the disintegration, weathering, or dissolution of the underlying rock mass, without having undergone transport (colluvium, scree deposits on the foot of steep slopes), as well as alluvial soils.
Since 2002, the Department of Mobility and Road Infrastructure of Gipuzkoa developed and installed an extensive system for the surveillance and monitoring of the anchored retaining walls with hydraulic or vibrating wire load cells placed over the most representative and critical retaining structures and slopes. The monitoring system is completed with further instrumentation of the slopes and embankments, comprising piezometers, inclinometers measuring quarterly to semi-annual displacement, and extensometers that control, on a continuous basis, 100 PoR. Together, 84 points involve rockfalls (20 PoR), potentially unstable anchored retaining walls (37 PoR), and slow-moving landslides (27 PoR). In spite of the instrumentation data available in the area, the comparison of the risk levels at the different PoR and the establishment of a methodology for the homogenous multi-hazard quantitative risk assessment have remained unresolved until the proposal of the methodology that is presented here.
Five road types based on the average daily traffic (ADT) can be distinguished (Table 1), for which the geotechnical hazard situations vary. For the sake of brevity, only the three aforementioned types of instability are treated here. Typical examples of them in the study area are shown in Sect. 4. In particular, the different hazard situations can be summarized as follows:
-
rockfalls with or without mitigation measures (RF);
-
anchored walls partially or totally instrumented with inclinometers and/or load cells inspected on a continuous or annual basis (RS);
-
instrumented slow-moving landslides with available geotechnical studies (SL).
Table 1Occurrence of geotechnical hazard types at different road types (data source: Department of Mobility and Road Infrastructure of Gipuzkoa).
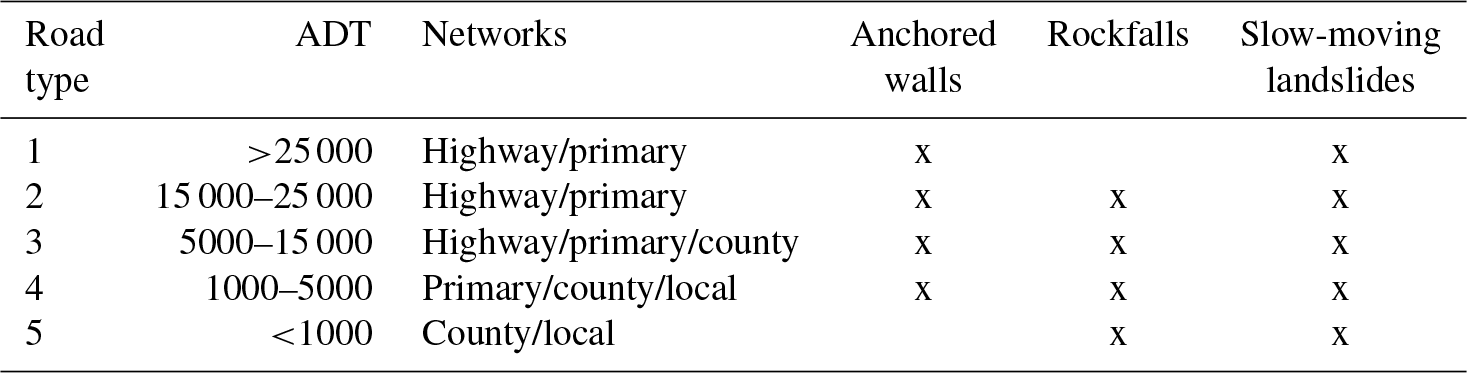
ADT: average daily traffic.
Rainfall data have been made available for the study site by the Meteorological Agency of the Basque Country. Further data have been collected after periodical field inspections and from the monitoring network, the type of which differs according to the hazard. This is detailed in the following section. Periodic inspections have been ongoing, up until the time of writing.
The objective of the general methodology that is presented here is to compare, on a common basis, the risk at the different PoR. The risk components that are used are the hazard and the consequences. For the calculation of the risk, the methodology takes into account the repair of damage required in order to restore normal traffic. This expresses the direct risk for the road. The risk quantification in terms of monetary loss requires calculating repair costs for different damages for each hazard, as described in Table A1 (see Appendix A). Indirect loss such as the economic impact of the road blockage and detours, although it might be substantial, is not described here.
The hazard is expressed in terms of annual probability of failure of a natural or cut slope or retaining wall of a given magnitude j. Magnitude (volume) or intensity (velocity) descriptors were defined for each hazard. Different procedures were used to assess the annual probability of an event of a given magnitude or intensity for the processes that are presented in the next sections. For dormant landslides, the probability of a sudden reactivation was assessed. The consequences include costs related to removal of rubble, repair/replacement of the pavement, scaling of the slopes (the removal of loose non-detached rock or debris), and slope stabilization. The cost is evaluated in multiples of a unit cost (UC), which is set at EUR 1000.
If more than one type of hazard is present at a given PoR, the total risk is the sum of those risks.
The overall methodology for the quantification of the risk consists of the general application of Eq. (1).
where RT is the average annual risk in terms of UC per year, j denotes the magnitude (volume) or intensity (velocity) class, k denotes the hazardous event type (rockfall, failure of an anchored retaining wall, slow-moving landslide), and Pr is the annual probability and frequency of occurrence of a failure/rupture of magnitude j. For slow-moving landslides, Pr refers to the probability of acceleration of a landslide with a given level of intensity (velocity). Ck is the consequences of the failure or rupture caused by a hazardous k-type event of magnitude j, in terms of multiples of the UC.
The magnitude classes of the adverse events are established empirically based on the observed consequences (road damage) and the average cost of the remedial measures typically undertaken (see Appendix A).
For each hazard, further assumptions are made and steps are followed for the evaluation of the components of Eq. (1), which are described in the following sections.
3.1 Rockfalls (RF)
Rockfalls are a major threat to the roads of Gipuzkoa. The rockfall hazard magnitude is classified according to the volume of the detached mass. Figure 3 shows representative examples of different rockfall magnitudes. A frequency or probability of occurrence is attributed to each volume class and the extent of disruption of the transportation corridor is determined.

Figure 3Examples of rockfall magnitudes (C, D, E, F) in the study area in relation to the classes of Table 2 (source: magnitudes C, D, E; Javi Colmenero; F, Servicio Geológico de Obras Públicas).
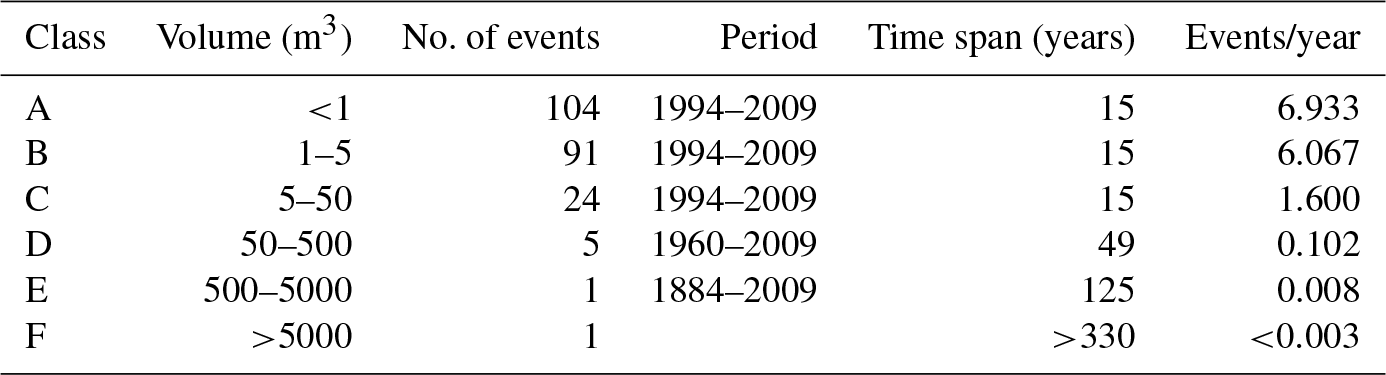
For the frequency–magnitude relation, a catalogue of events is only available for limited sections of the road network. An inventory of rockfalls was compiled for the road N-634 connecting Zarautz and Getaria, based on highway administration data and press sources. According to the recorded historical events, six (from A to F) volume ranges were considered (Table 2). For the sections of the road N-634 (5 out of 20), the frequency was then assessed as the number of events divided by the number of observation years.
Table 2Magnitude classes and respective annual frequency for the road connecting Zarautz and Getaria (N-634).
Although the same amount of information is not available for all of the PoR, numerous in situ inspections at the PoR have provided extensive topographical and geological data, which can be used for estimating the frequency at the rest of the sections. To achieve this aim, a geomorphological description was made for 18 representative examples with a known frequency of events on the road N-634. Then, for the rest of the sections with no frequency data, the same frequency values were established for the sections within the same geomorphological class. The main assumption is the equivalence of the frequency at slopes with similar geo-structural characteristics, number of recent scars, slope height, and blockage size. The suggested indicators to geomorphologically characterize the slope are the joint persistence (IP), the scar density (IDC), differential erosion (IE), the number of potentially unstable rock masses (IFP), and the slope mass rating index (ISMR). These indicators are calculated as follows.
-
The persistence of discontinuities in the rock mass, IP, is assumed high when planes of several tens of metres can be observed on the slope face, moderate when they are of a few metres, and low when they are sub-metric. The stratification is taken into consideration as well. Higher persistence of discontinuities results in the existence of more planes permitting blockage detachment from the slope face.
-
The scar density, IDC, is calculated as the ratio of the number of recent scars to the slope height. Scars can be noticed as areas with a different colour (often reddish) from the rest of the slope face. A greater number of recent scars indicates higher and more frequent activity.
-
Differential erosion, IE, can be present or absent and can be observed at rock masses constituted by materials of distinctive strength. Differential erosion leads to loss of support for the overlying rock mass.
-
The number of potential rockfalls, IFP, refers to the number of potentially unstable rock masses as observed by in situ inspections. This number is collected distinguishing between magnitude classes.
-
The slope mass rating index, ISMR, is the value of SMR, as proposed by Romana (1991).
Table 3Scoring of the geomorphological indicators used for the rockfall-frequency assessment.
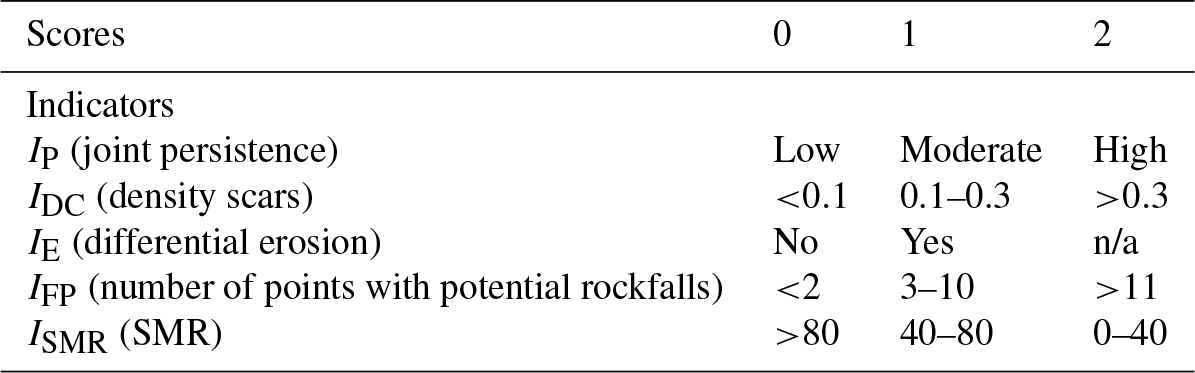
n/a: not applicable.
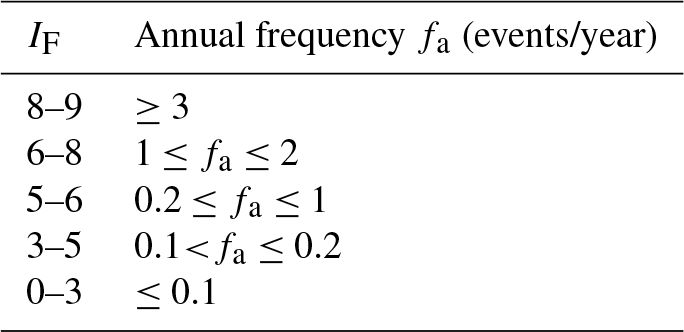
Each indicator, depending on its value, scores 0, 1, or 2 points, applying the criteria of Table 3, with the exception of IE, which scores up to 1. The indicator scores are summed up to provide the frequency index IF according to Eq. (2). We established the thresholds to relate the geomorphologically based index IF with the frequency of the events, after application to the sections with a known frequency, as shown in Table 4.
During the in situ inspections data are collected for the relative frequency (%) of potential rockfalls per volume class, and for the most frequently encountered rockfall size on the slope (modal). The annual number of events per volume class is calculated by multiplying the total annual frequency with the relative frequency of each class. If the relative frequency data have not been collected, risk calculations are made for the modal size as an average approximation.
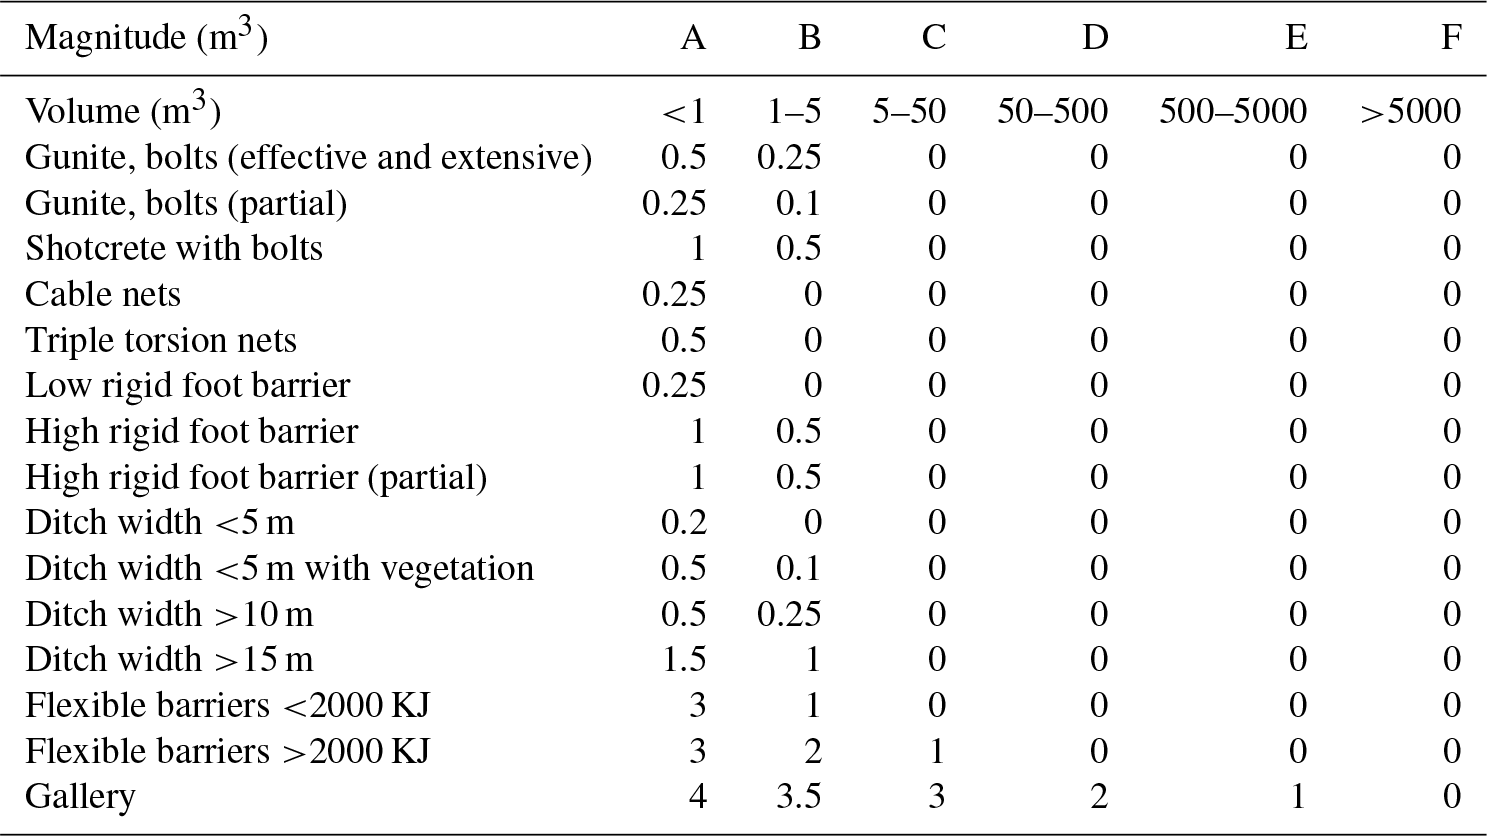
The implementation of stabilization (bolts, anchors), retention (nets and/or gunite), or protection measures (barriers, galleries) partially or entirely reduces the annual frequency of rock blockages reaching the roadway. To account for this, a corrected reduced frequency Frc is proposed, upon a correction factor n (Table 5), according to Eq. (3):
where Frc is the annual corrected frequency, Fr is the annual frequency before correction, and N is the correction factor given by Table 5.
Table 5Correction factor for different protection measures, to be applied to the annual frequency according to Eq. (3), for each magnitude.
The thresholds of Table 3 for the scoring of the indicator, the IF values, and the annual frequency, as indicated in Table 4, were obtained after a trial-and-error iterative procedure, so as to optimize the matching of the results with the observed frequency from real events at natural slopes (the latter marked as one to two events per year, or one event every 1–5 years, or one event every 5–10 years). The results from this iterative procedure yield an overestimation of a maximum of two events per year in five sections, while in the rest of the sections the results are compatible. At the second stage, further calibration was performed considering the protection measures, which yields the correction factors of Table 5.
The risk at each point is then calculated for each PoR by Eq. (1). For this, the consequences are assessed per rockfall magnitude class as indicated in Table A1 of the Appendix. The six magnitude classes, also shown in Table 2, were defined empirically, based on the principal consequences and disruption of the road, as observed from previous rockfalls and road maintenance interventions. In Table A1 the principal consequences and disruptions are shown for each magnitude class, as are the respective actions that are used as a guide for the establishment of the costs in terms of UC.
3.2 Failure of retaining structures (RS)
Another objective of this work was the analysis of the risk related to the failure of anchored reinforced concrete walls. The uncertainties characterizing the structural design parameters and the terrain resistance are substantial; thus, the safety level of these structures cannot be precisely assessed. The probability of failure is considered instead.
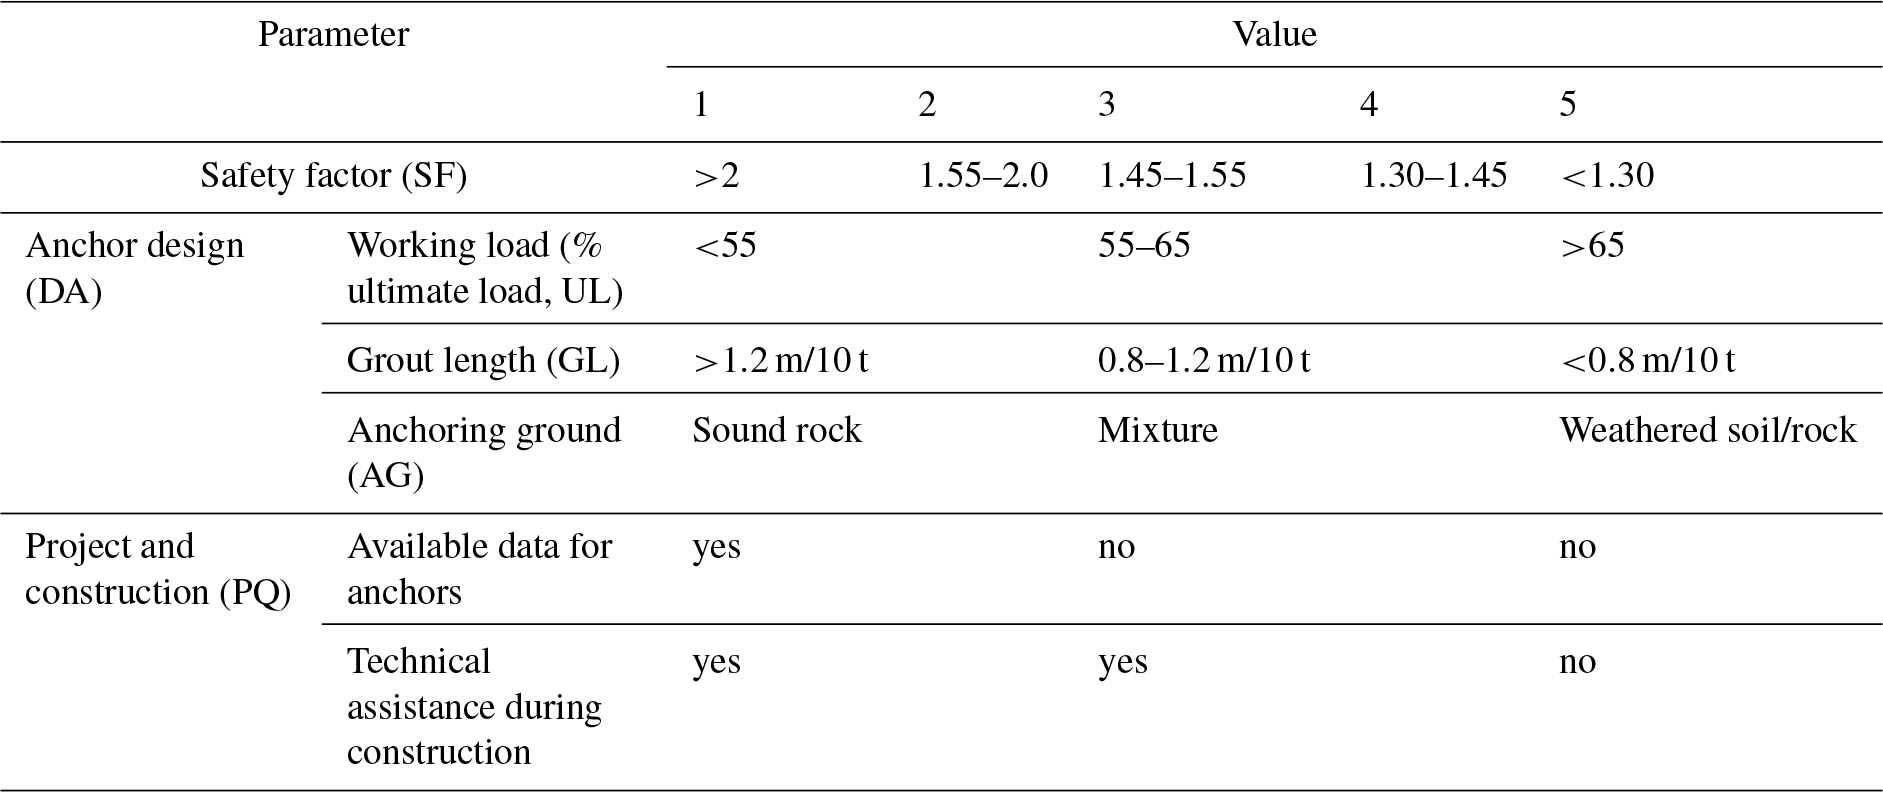
The hazard level associated with the anchored retaining walls is evaluated on the basis of a hazard index (HI). The evaluation consists of a modification of the methodology for the revision of anchors, which was developed by the company Euroestudios in 2004. According to this methodology, the HI for the retaining structures is equal to the average of the scores assigned to three components (Eq. 5). These components and their scores are presented in Table 6 and they are the safety factor of the wall, the anchorage design (DA), and the project and construction quality (PQ). The scoring for each component ranges between 1 and 5. Moreover, to calculate the scoring of the index DA, the average value from three parameters is considered according to Eq. (4): percentage working load/ultimate load ratio (UL), grout length per 10 t of load (GL), and the anchoring ground (AG). The term sound rock or mixture refers to the ground where the structure is anchored. For the parameter PQ there are three possible scores: 1 – when “Available data for anchors” is yes and “Technical assistance during construction” is yes; 3 – when “Available data for anchors” is no and “Technical assistance during construction” is yes; and 5 – when available data for anchors” is no and “Technical assistance during construction” is no.
Table 6Scores the hazard index (HI) components for the failure of retaining walls.
The HI is obtained using the following Eqs. (4) and (5):
The thresholds and the scoring of the parameters were established based on expert judgement, increasing the hazard index when the function of the anchors is critical or uncertain, and decreasing it when loading conditions and support structures, as well as when good practices in construction, can guarantee good function of the anchor. In Eqs. (4) and (5) all factors are equally weighted for simplicity.
Silva et al. (2008) have associated the safety factor of engineered slopes for a given project category with the probability of failure. For this, the structures are classified according to the level of engineering design. Category I comprises engineered slopes which were designed, constructed, and managed using the most advanced state-of-the-art knowledge. Category II includes constructions with normal standards. Category III includes constructions without specific designs that do not follow standards, and Category IV those with a poor or completely missing engineering knowledge basis. As the HI is an adaptation of the SF that takes into consideration additional criteria for the level of functioning of the structure, a similar relation between annual probability of failure of the anchored retaining walls can be established as well. The relation is presented in Fig. 4 and Table 7.
Table 7Annual probability of failure for HI values, according to Fig. 4.

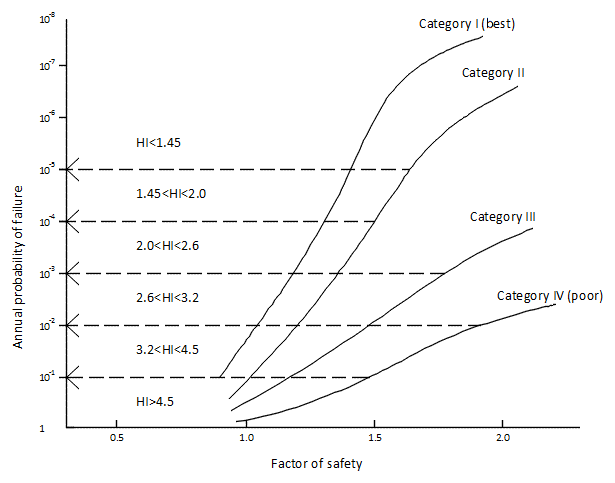
Figure 4Classification of the engineered slopes and their relation to the annual probability of failure (modified from Silva et al., 2008).
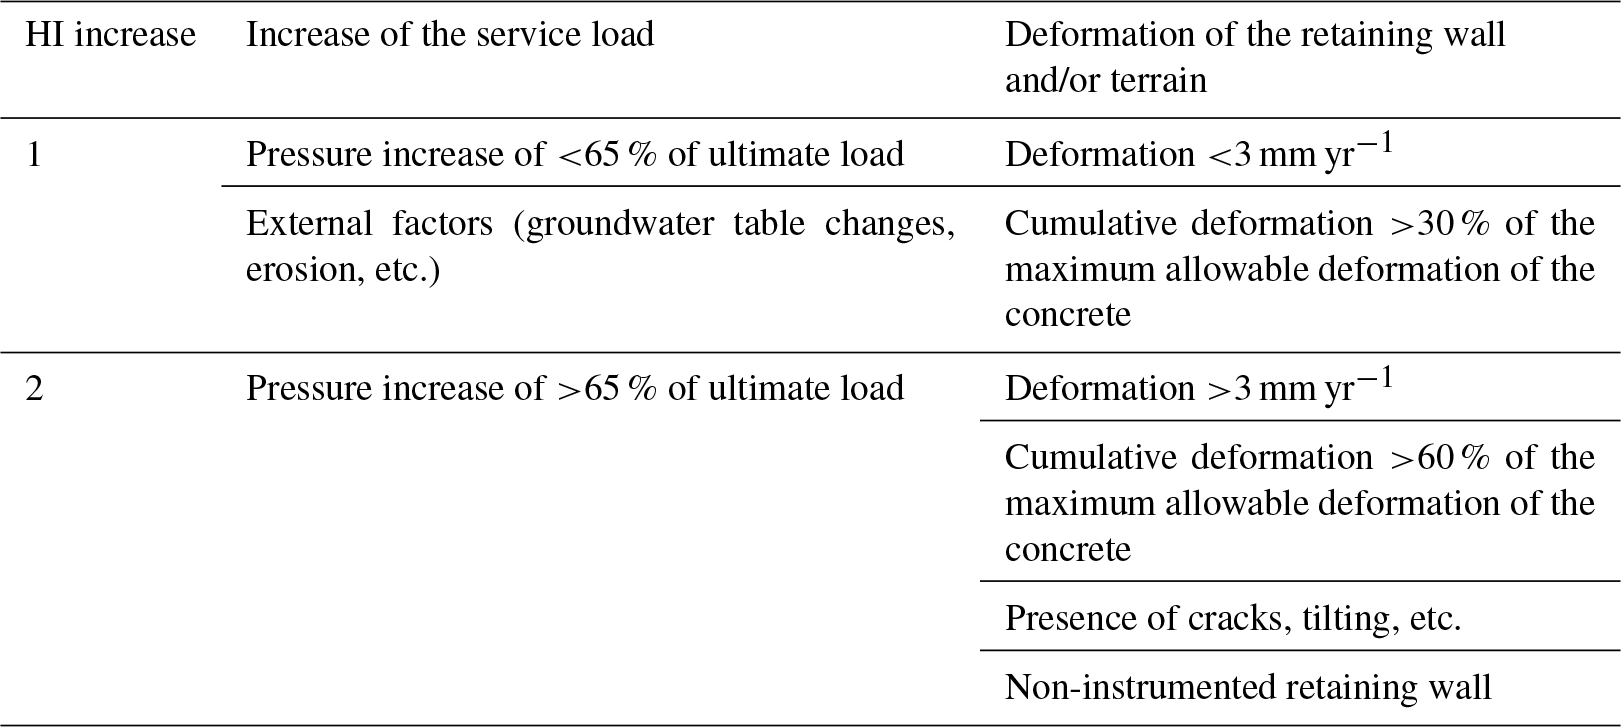
The proper design and construction of the anchored retaining walls should be reflected in the absence of deformations and anchor overloading. Increased pressure at the load cells, deformations, cracks, and wall tilting are interpreted as instability indicators. In that case the annual probability of failure Pr should be increased. Thus, factors of increase are added to the initial value of the HI, as shown in Table 8. The availability of this information implies that periodic and detailed wall inspections are carried out.
Table 8Increase factor of the HI according to instability indicators on the retaining walls.
For measuring the consequences, we distinguished between the failure of small retaining walls, retaining walls shorter than 6 m and higher than 6 m (Table A1). The length of the affected road section, considering the spreading of the debris, was empirically fixed as triple the wall height at the section.
3.3 Slow-moving landslides (SL)
The involved landslides at the PoR have a persistent creeping movement, which in a worst-case scenario can lead to a sudden acceleration. The clay materials in the study area have a viscous behaviour, characterized by resistance increase as the movement rate increases. High rainfall precipitation often results in landslide reactivation, with centimetre-scale displacements. As this analysis involves active landslides or landslides with episodic reactivation, the challenge here was to assess the probability of a given damage level, as a function of the landslide movement rate. All the road sections analysed here lay on previously well identified landslides and, as such, movements are associated with landslide activity.
Mansour et al. (2011) indicated that a relation may be established between the damage expected from slow-moving slides to roads versus the displacement rate. They proposed ranges for the annual displacement rate, leading to different extents of damage, which are 0–10, 10–100, 100–160, 160–1600, and >1600 mm yr−1 corresponding to limited, minor, moderate, severe damage, or total road destruction, respectively. They also provided a description for each damage extent with respect to the type and frequency of the actions to be taken for its repair. The aforementioned ranges do not distinguish between horizontal and vertical deformations, on the one hand, and on the other, they are based on the assumption that continuous and almost constant movement takes place.
Instead, our experience in Gipuzkoa shows that landslide reactivation is episodic and can be sudden, producing deformations even in short periods, such as a few days or weeks. Although those deformations are usually of centimetric order, they can cause cracks, bumps, and puddles on the pavement, which can jeopardize road traffic safety. For this reason, more restrictive criteria than those proposed by Mansour et al. (2011) were applied. They relate the maximum observed horizontal landslide velocity and the annual horizontal displacement rate to the annual probability of exceeding a damage level. The following paragraphs describe how they were established.

Figure 5The four damage levels identified on the roads of Gipuzkoa: (a) no/slight damage, (b) moderate damage, (c) severe damage, and (d) partial/total destruction.
In the case study, horizontal velocity data are available from the inclinometer measurements. After 2010, deformation readings were consistently taken every 3 months. In that sense, although the monthly velocity measurements have a limited precision, they can provide certain information on the landslide movement patterns. We inspected the in situ damage, in order to establish the relation between the velocity and the road damage. Four levels were identified, as shown in Fig. 5 and described qualitatively in the following.
-
Damage level A (landslides of low intensity). There are rarely cracks and deformations. No speed reduction is required while driving. Crack sealing and resurfacing is periodically performed over periods longer than 1 year.
-
Damage level B (landslides of moderate intensity). Damage includes pavement deformation and cracks and/or roadside destruction, without affecting the functioning of the road. If proper signalling is present, the chance of an accident is very low. Traffic conditions can be normally maintained if regular sealing and resurfacing is performed until a more permanent solution can be found.
-
Damage level C (landslides of high intensity). Pavement deformation is substantial, including the presence of steps and puddles, and there is a partial rupture of the platform partly or entirely affecting traffic lanes and/or the roadside. The normal functioning of the road is disturbed. Traffic is not interrupted, although restrictions such as alternative pass and traffic light regulations are required. Accidents might occur if the vehicles enter the affected zone without previous signalization. The normalization of the traffic conditions requires slope stabilization and road repair.
-
Damage level D (landslides of very high intensity). Displacements are of the same order of magnitude as for level C, but with the vertical component prevailing and providing the possibility for complete destruction and loss of the pavement continuity. This situation is typical for roads situated on the crest or on the boundaries of landslides. The functioning of the road is seriously affected. There is a high likelihood of an accident due to vehicles falling into generated depressions. High-priority stabilization works and reconstruction of the road are required.
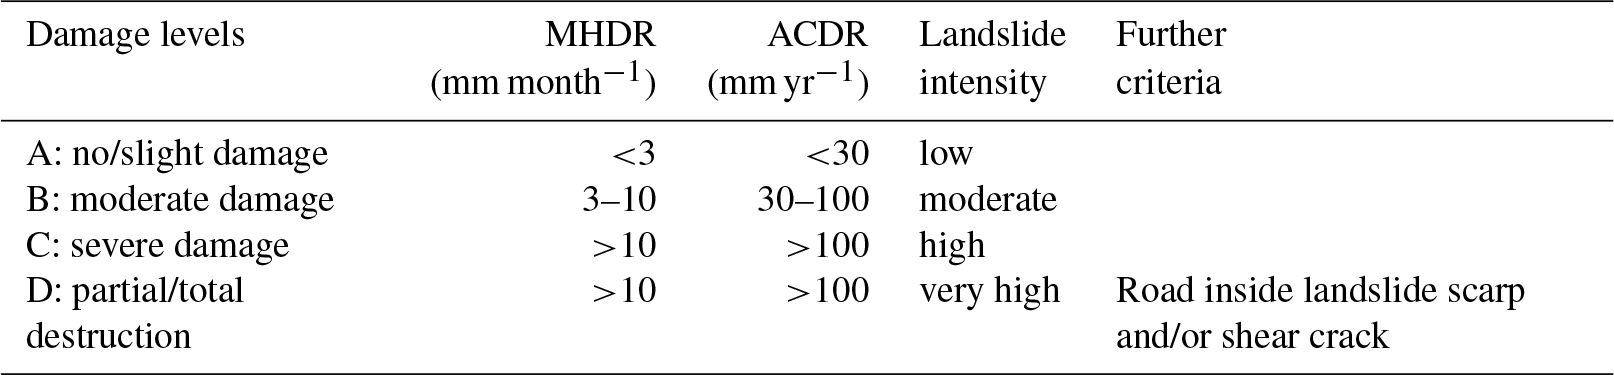
To establish damage proxies for the calculation of the expected consequences we correlated the observed road damage with the indications of the inclinometers at 24 reference PoR. The correlation was found to be positive, as, in most cases, increasing displacements were associated with more severe damage. In particular, the maximum horizontal monthly velocity and the cumulative displacement were used as two proxies for the damage. For the establishment of the thresholds that relate the damage level with the terrain displacements, we tried to maximize the right predictions (when the observed damage level is the same as the calculated damage level) and at the same time achieve a balance between damage underestimation and overestimation. The proposed thresholds are summarized in Table 9. Out of the 24 PoR, 20 yield accurate predictions, 1 presents damage overestimation, and 3 damage underestimation (out of which, the measurements of one inclinometer are not reliable). Partial/total destruction occurs when the criteria for severe damage plus either one of two further criteria are fulfilled: the road is located inside the landslide scarp or a shear crack has been formed (the scarp manifests itself in semicircular form on the pavement).
Table 9Damage criteria as a function of landslide velocity (MHDR: maximum monthly horizontal displacement rate; ACDR: annual cumulative horizontal displacement).
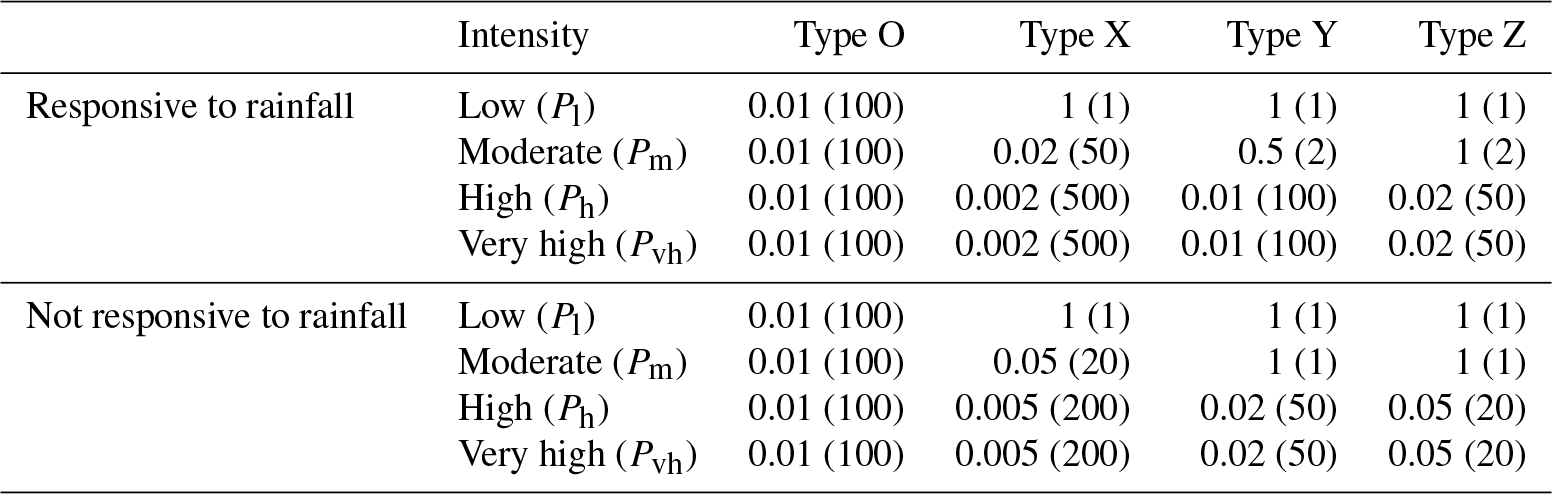
For the slow-moving landslides, the hazard was expressed in terms of temporal probability of reactivation with an intensity exceeding a given level of damage. To assess the temporal probability we first distinguished between the landslides that are responsive to intense rainfall precipitation, and those for which a clear relation between rainfall and reactivation cannot be established. For each case, typical movement patterns were observed from the inclinometer measurements. Four patterns were identified depending on the maximum monthly velocities. For each type (responsive and not responsive) and each pattern O, X, Y, or Z, as described in the following, the probability of reactivation with an intensity leading to low (A), moderate (B), high (C), or very high (D) damage is determined.
As most landslides in the study area are creeping, undergoing continuous small deformations, the probability of low damage is always high (P∼1). For some of them, acceleration takes place for intense or long rainfall periods. Moderate, high, or very high damage might then occur with an annual probability equal to or lower than 1. The assessment of the probability is herein based on the return period of two major extreme rainfall events in the area.
The two extreme events were recorded during the observation period covered by the monitoring network of the Gipuzkoa Road Authority, and they are (1) the rainfall events of 4 to 7 November 2011 that were of high intensity and short duration. The rain recorded at the Añarbe Dam on 6 November 2011 was 185 mm, which according to the Water Management Agency of the Basque Country corresponds to a return period of the order of 100 years. (2) The rainy period of January–February 2013 was characterized by moderate to low daily intensity but of long duration, with cumulative precipitation measurements that exceeded the maximums of the reference period 1971–2000, and a return period of over 100 years according the Euskalmet (Basque Meteorological Agency).
Accordingly, it can be assumed that the annual probability of reactivation or sudden acceleration of the instrumented landslides that have not experienced deformations during the two aforementioned events is lower than ). Using this probability as a reference, the reactivation probability for the different patterns and types is defined empirically, according to the observed number of peak month velocities on the inclinometer measurements.
For slow-moving landslides which are responsive to rainfall events, we distinguish between four movement patterns (Fig. 6).
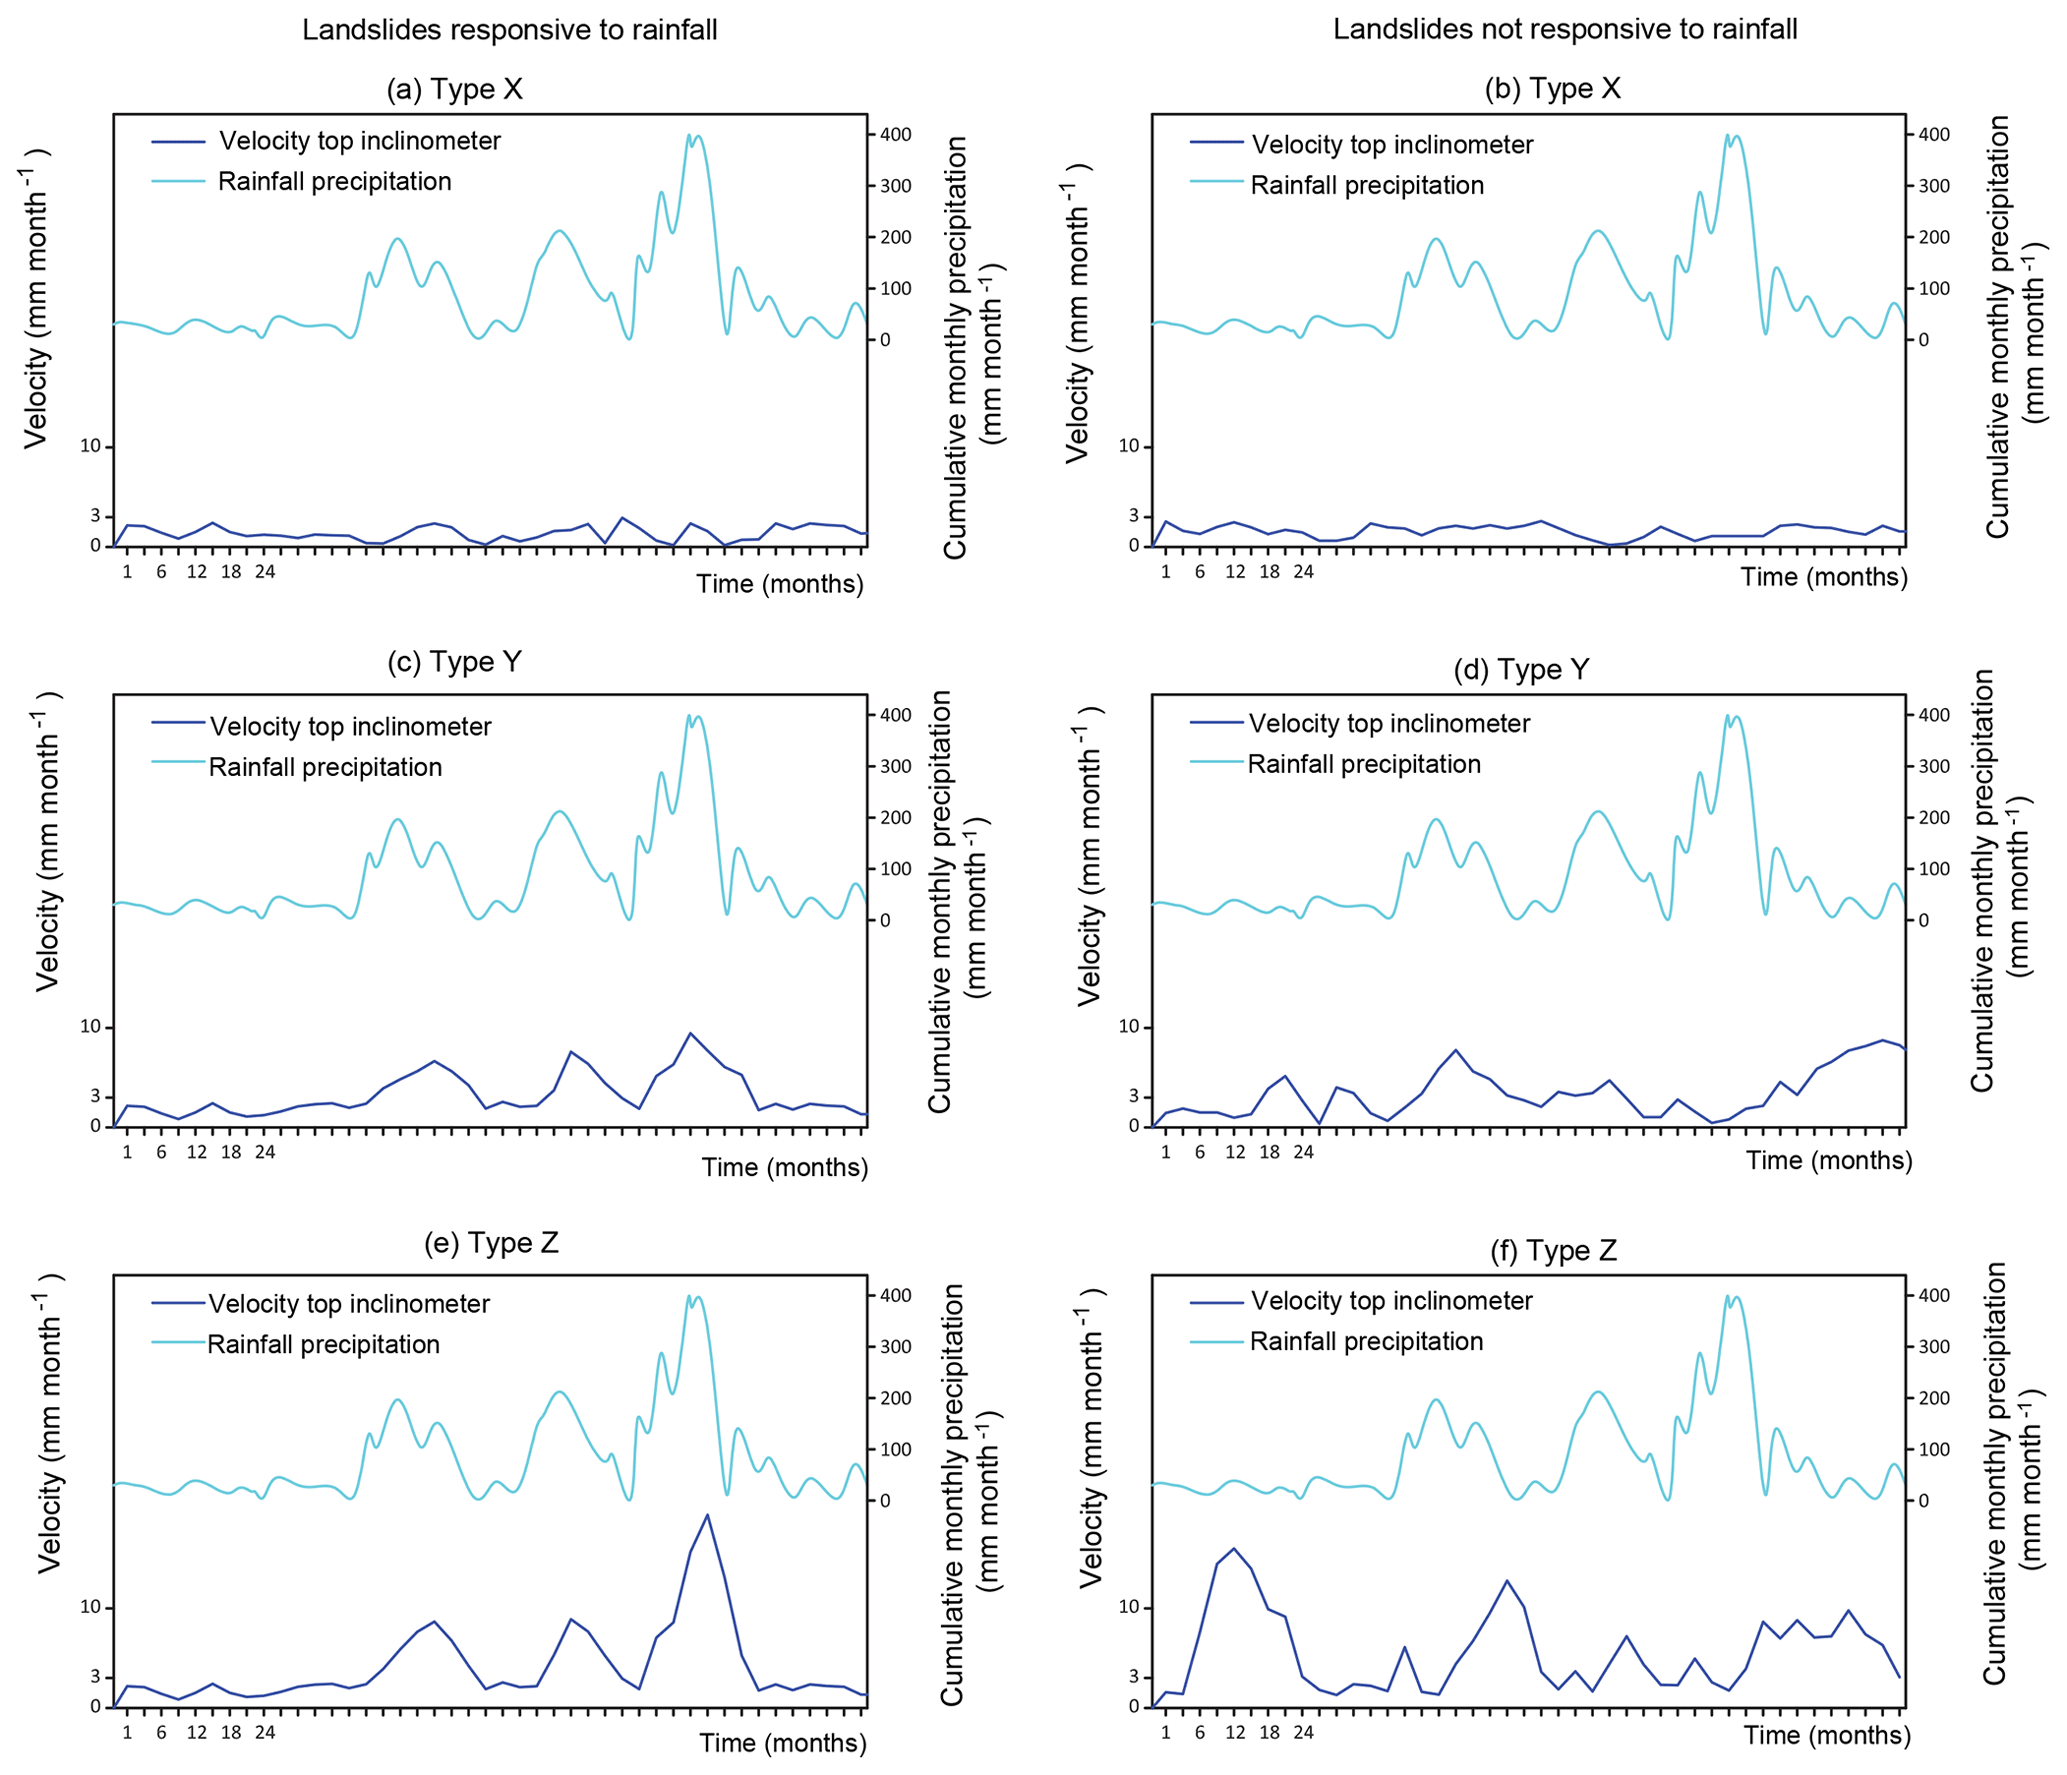
Figure 6Patterns of movement for landslides responsive (a, c, e) and not responsive (b, d, f) to rainfall.
-
Pattern O. Landslides which are inactive or extremely slow, which have experienced deformations neither in extreme nor in common precipitation conditions. The annual probability of reactivation is P=0.01.
-
Pattern X. Landslides with a high probability of reactivation and low intensity, characterized by displacement rates lower than 2–3 mm month−1 and cumulative displacements lower than 30 mm (Fig. 6, top left). They have not experienced significant accelerations for the two aforementioned extreme events. Damage level A is mostly expected.
-
Pattern Y. Landslides with a high probability of reactivation and low/moderate intensity, characterized by displacement rates mostly lower than 5 mm month−1 and cumulative displacements 30–100 mm (Fig. 6, middle left). They have experienced some accelerations for the two extreme events, with a displacement rate under 10 mm month−1. Low or moderate damage (levels A or B) is mostly expected.
-
Pattern Z. Landslides with a high probability of reactivation and moderate/high intensity, characterized by rates higher than 2–3 mm month−1 and cumulative displacements greater than 100 mm (Fig. 6, bottom left). They have experienced accelerations for the two extreme events, exceeding the displacement rate of 10 mm month−1. For the PoR where the road is situated on the crest, we consider that they follow the pattern Z, irrespective of the inclinometer measurements. High or very high damage (levels C or D) is mostly expected.
Using the intensity–damage correlations of Table 9, the annual probabilities of exceedance of a given damage level were established, as shown in Table 10. Similar patterns were detected too for landslides which are hardly or not at all responsive to rainfall events (Fig. 6, right column), even for the two aforementioned extreme events. In that case, higher probability values are set in order to reflect the increased uncertainty of the causes leading to the terrain acceleration (Table 10).
Table 10Annual probability of exceedance of a damage level and (in parentheses) return period in years.
The consequences, actions, and costs related to slow-moving landslide damage repair that were used for the risk assessment and for the characteristics of the case study are also reported in Table A1. The risk calculation for slow-moving landslides is also based on the general Eq. (1). Nevertheless, in this case, for the realistic application of that equation three further points should be taken into consideration.
-
The probabilities of high or very high damage alternate when applying Eq. (1), depending on the location of the road section on the body (high damage) or on the scarp of the landslide (very high damage), and/or the absence (high damage) or presence (very high damage) of a shear crack on the road platform.
-
To calculate the total expected cost, the UC of Table A1 has to be multiplied by the affected road section length (multiples of 10 m) for all damage levels. The affected section length is expected to vary for each damage level in different percentages of the (total) road length that are marked between the landslide boundaries. For no/slight damage the percentage 10 % of the total road length is taken, for moderate damage 20 %, for severe damage 50 %, and for partial/total destruction 100 % (the worst-case scenario).
The reasons for reducing the affected road section to a percentage of the total road section in the landslide are the following.
- i.
Some of the landslides in the study area demonstrate composite and complex movements, incorporating multiple smaller sliding bodies, with very localized displacements. In that case, instabilities and reactivations only take place locally, only affecting smaller fractions of the road.
- ii.
The landslide velocity is expected to present variations within the landslide body. More severe damage is often only demonstrated at limited sections of the road, corresponding to the local highest movement rates. This might occur mostly for lower velocities, while higher velocities are more probably related to generalized instability and damage.
- iii.
Minor displacements can be accommodated by the pavement (especially for flexible pavements); thus, they do not result in damage across the entire road section. Instead, major displacements result in greater stresses and strains for the pavement and more extensive damage, especially for rigid pavements that cannot accommodate them.
- i.
-
In the case of slow-moving landslides, the annual probabilities for the different damage levels should be mutually excluding for the risk calculation. The values of Table 10 provide the annual probability of exceeding a given damage level. Thus, the annual probability of damage level A, PA, (none/slight) is the annual probability of exceeding damage level A minus the probability of exceeding damage level B (moderate). Accordingly, the annual probability of damage level B, PB, is the annual probability of exceeding damage level B minus the probability of exceeding damage levels C or D (partial/total destruction or severe damage). The annual probability of damage levels C or D, PC or PD , is equal to the annual probability of exceeding damage levels C or D. All probabilities should be in the range [0,1]; thus, if the result from the above calculations is negative, PA, PB, PC, and PD are taken as 0.
After incorporating these modifications, Eq. (1) is modified to Eq. (6) for slow-moving landslides.
where RSL is the risk for slow-moving landslide, Pj is the annual probability of a given damage level (j takes the value of l: low, m: moderate, h: high, and vh: very high), Cj denotes the consequences corresponding to the velocity associated with the given damage level, in terms of UC, and L is total length the affected road section (multiples of 10 m).
This methodology is being applied on a periodic basis to the road network of Gipuzkoa. The calculation of the risk of the different hazards was organized using automatized Excel data sheets, where the user introduced the required data from a closed list of options. Some application examples for selected PoR are presented here. The overall results for all analysed PoR during the 2015 inspection are shown in Sect. 4.4. Due to space limitations, only the most important data needed for the application of the proposed methodology are provided here. An extended archive with further details on the location and type of instabilities, accompanied by images and maps and detailed descriptions, were at the disposal of the authors. For the same reason only a limited number of figures presenting the current state of the road have been included too.
4.1 Rockfalls
We indicatively present the risk for two different cases of rockfall-affected sections: the PoR L1C, situated at the local road GI-3324 (from km 0.700 to 1.450), and the PoR P4C of the highway N-1 (km 407.395 to 407.680). The two PoR are shown in Fig. 7.
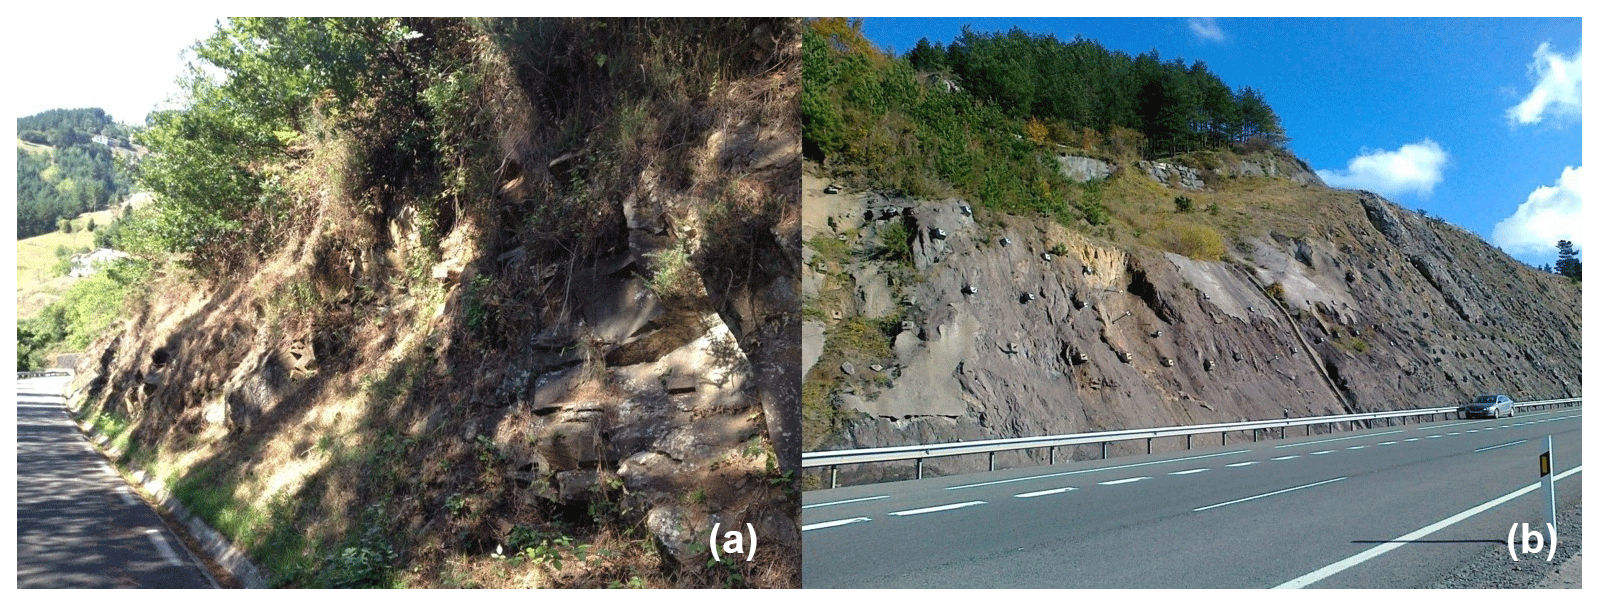
Figure 7(a) PoR L1C of the road GI-3324 (from km 0.700 to 1.450) without protection measures; (b) PoR P4C of the road N-1 (km 407.395 to 407.680) with protection measures.
Rock instabilities at the PoR L1C are due to the unfavourable structural conditions of the rock mass, leading to planar and wedge failures, with a safety factor of the blocks on the slope seemingly smaller than 1. In a few areas toppling mechanisms are also observed. Although rockfalls occur with a frequency higher than two events per year, there is no historical record of the events. The road platform is in a good state without major impact signs, indicating that no high-magnitude events have been occurring. Thus, the magnitude–frequency relation of events here is evaluated considering the slope properties from Table 3, and applying Eq. (2) for the calculation of the IF. For low joint persistence (IP: Low), scar density greater than 0.3 (IDC>0.3), presence of differential erosion (IE: Yes), number of points with potential rockfalls greater than 11 (IFP>11), and SMR between 40 and 80 (ISMR: 40–80), the index IF results to be 6, which, according to Table 4, corresponds to an annual frequency of events equal to 1. This frequency is proportionally distributed amongst the magnitude classes A, B, and C, according to the in situ observed relative frequency of potential unstable volumes (45 % for < A: 0.5 m3; 40 % for B: 0.5–5 m3; 15 % for C: 5–50 m3). This results in annualized expected frequency of events equal to 0.45, 0.40, and 0.15, respectively, for each magnitude class. No protection measures exist; thus, no correction is made on that frequency. The risk is then calculated for each magnitude size A, B, and C and summed up following Eq. (1), considering the UC of Table A1. The total annual risk for L1C is 1.55.
For the PoR P4C, a similar procedure was followed. For moderate joint persistence (IP: Moderate), scar density equal to 0.16 (IDC: 0.1–0.3), absence of differential erosion (IE: No), number of points with potential rockfalls equal to 4 (IFP: 3–10), and SMR index between 0 and 40 (ISMR: 0–40), IF results equal to 5, which corresponds to an annual frequency of events equal to 0.2. This frequency is distributed amongst the magnitude classes: 0.08 for A, 0.09 for B, 0.01 for C, 0.01 for D, and 0.01 for E. In this case, a correction is applied on the annual frequency. Considering that the slope is partially protected by gunite and bolts in a poor state of maintenance, and that a ditch with a width smaller than 5 m exists, the summative frequency correction factors for the two types of measures from Table 6 are 0.45 and 0.2 for magnitudes A and B, respectively. For higher magnitudes, the existing protection measures are not considered to be efficient. The annual frequencies of each size after correction are 0.03, 0.07, 0.01, 0.01, 0.01 for A, B, C, D and E, respectively, which after multiplication with the correspondent UC and summing, result in a higher total annual risk than for the PoR L1C and are equal to 3.05. The higher risk is attributed to the existence of bigger rock blocks that cannot be retained by the actual protection measures.
4.2 Anchored retaining structures
Two further examples of the risk related to the failure of anchored retaining structures are presented (Fig. 8).
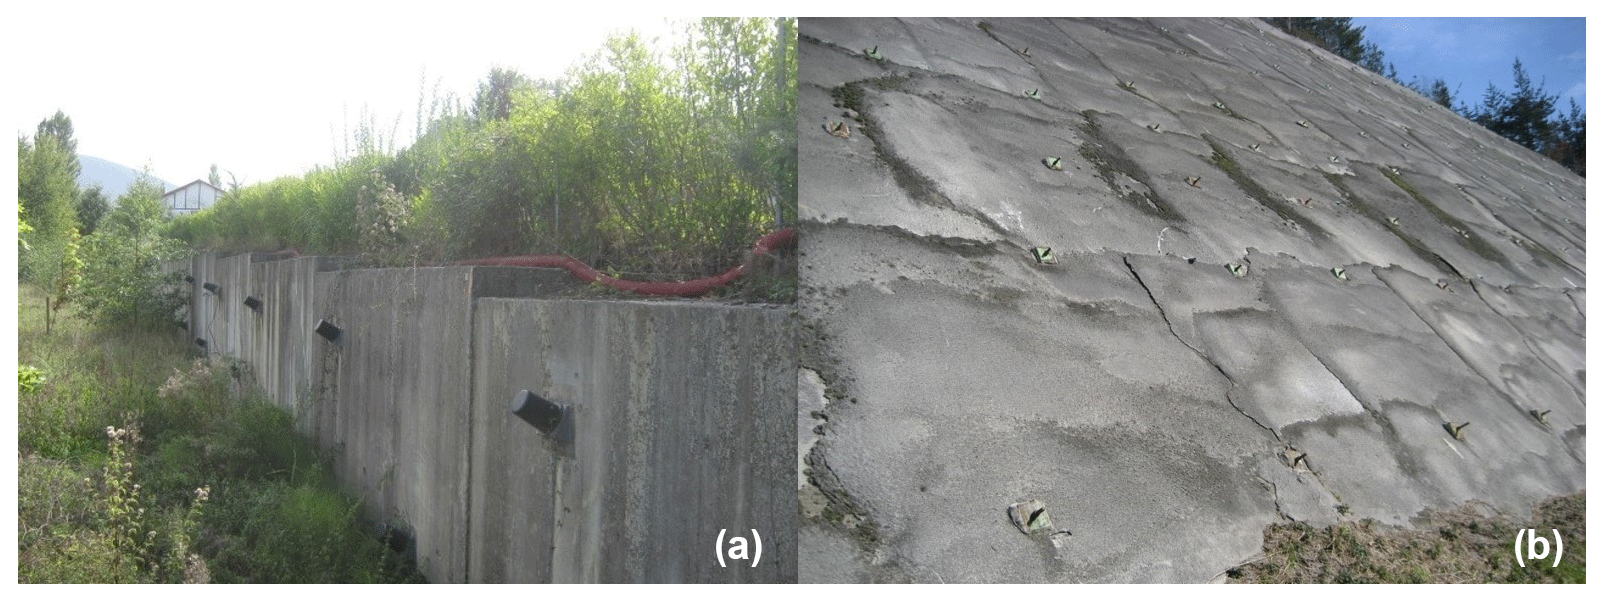
Figure 8(a) PoR P2A of the road AP-8-1-1 (from km 77.140 to 77.210) where the crest of the slope and the retaining wall with anchors is seen; (b) C8A of the road G-2634 (32.980 to 33.150) with gunite, rock bolts, and anchors.
The first one is the highway section P2A, where two anchored walls sustain a weathered flysch rock mass. The two walls cover the upper and middle part of the slope. The upper wall has a length of 60 m with 24 anchors and the lower is 42 m long with 42 anchors. The slope has an inclination of 35∘ in the first 20 m and of 20∘ for the rest of its length. At the bottom of the slope there is a concrete wall. During the construction works of the N-121-A, water seepage was detected on the middle and upper parts of the slope, which have been related to the mobilization of soil. The slope is monitored with inclinometers, piezometers, and walls with hydraulic load cells, given the existence of an urbanized area on the top of it. In the upper part of the slope there a weathered zone, with an estimated thickness of 20 to 22 m, which determined the type and length of the anchors.
Following the procedure described in Sect. 3.2, for a safety factor greater than 2 (which scores 1 point according to the Table 6), working load lower than 55 % (1 point), grout length greater than 1.2 m/10 t (1 point), anchoring ground being a mixture of sound and weathered rock (3 points), and availability of data for anchors as well as presence of technical assistance during construction (1 point), the calculated hazard index, as calculated from Eq. (5) and before correction, is 1.222. Given the presence of cracks in the lower wall, a correction factor of 2 is applied to the HI, which becomes 3.222 and the corrected annual probability of failure is then 0.0072 (from Table 7). The upper and lower walls together have a total height of 8 m. When applying the general risk equation the respective costs from Table A1 are considered and adjusted to the total length of the affected road section (24 m or 2.4 m ×10 m), and they are found to be 290.4 UC. The total risk for this section, as the product of failure probability with that cost, is equal to 2.09.
The second section, the PoR C8A corresponds to a rocky slope of 240 m and height 37 m, of an average inclination of 45∘. It is treated with gunite with a protection net and a reinforcement of 646 bolts of 16 m length. The works for the reinforcement of this slope were performed between 1992 and 1993, with eight strips of gunite, each 5 m tall. Every strip includes four rows of bolts, except the lowest one which has five rows and the crest which does not have any. The load cells indicate that several bolts are presently overloaded. The rock mass is slightly to moderately weathered over the entire slope. The maximum volume that has been estimated to be unstable is 21 800 m3.
The parameters and their respective scores (in parentheses) that have been used for calculating the HI for the C8A are (Fig. 7, right) safety factor lower than 1.30 (the safety factor is not known for this case) (5 points), working load greater than 65 % of the ultimate load (5 points), grout length >1.2 m/10 t (1 point), and the anchorage ground being slight to moderate weathered rock (3 points).. Although data exist for some anchors, data are not available for all of them, hence assuming the respective value of “no” in Table 6. Construction was performed with technical assistance. The initially calculated HI is 3.67. As the bolt pressure increase is greater than 65 % of the ultimate load (up to 80 %), the HI is increased by 2 and it is 5.667, which corresponds to an estimated failure probability of 0.82. This value was calculated according to Table 7, after fitting a power-law curve to the HI and the probability-threshold values mentioned therein. As the wall height is H>6 m and the affected road length is 111 m, the total cost is 1343.1 UC and the risk is 1101.34, which is substantially higher than the previous example, as a consequence of the higher hazard in this section.
4.3 Slow-moving landslides
Two examples of PoR that were subjected to damage by being situated within slow-moving-landslide areas are presented here: the C3C and the C9G (Fig. 9).
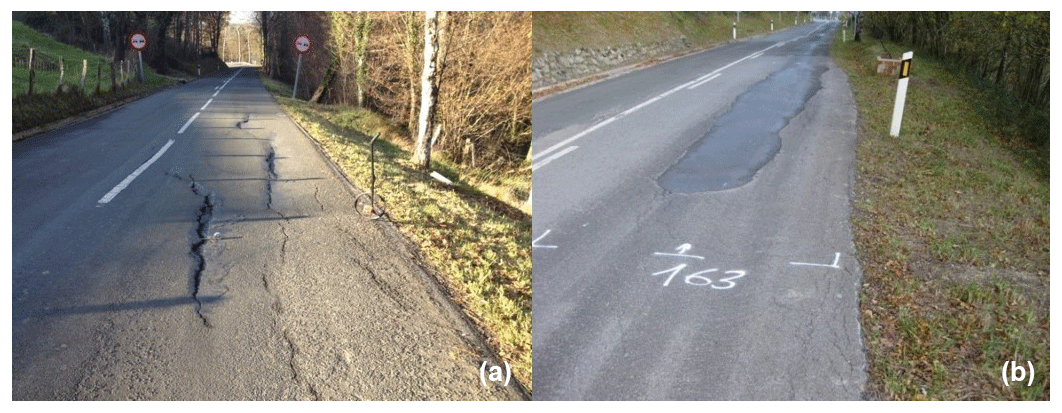
Figure 9Road sections situated within slow-moving landslides with damage shown: (a) PoR C3C of the road GI-2133 (from km 8.280) with observed deformations and cracks on the road pavement; (b) PoR C9G of the road GI-2637 (from km 17.891 to 18.220) showing minor cracks already sealed.
The PoR C3C involves a rotational landslide, occurring in the interface between clay colluvial soil and rock. It affects a road section of almost 200 m, with a retaining wall of 1 m height over 41 m. There is not a historical record of the damage evolution. The road platform is found to be cracked and vertically deformed, as well as the ditch. For about 20 m the cracks are 2–3 cm wide and mostly affect one direction of the road. The most probable reason for the instability is the presence of water and the deficient drainage causing humidity and water flows. Slope movements occur during high-rainfall episodes, which was also confirmed by the indications of the inclinometers, as explained in the following.
There are two inclinometers that started measuring in November 2013, initially with a monthly frequency, which are 14.5 and 15.5 m deep, respectively. Movements were found to be concentrated at a depth of 0.5–2.0 m (corresponding to the thickness of the colluvium soil layer). The inclinometer measurements indicate that the soil movements directly respond to the total monthly precipitation intensity, expressed in mm month−1, with records of up to 8 mm month−1 and cumulative displacement higher than 100 mm. These movement rates correspond to Pattern Z (Fig. 6, left). According to Table 10, the annual probability of exceeding low damage is 1, moderate damage is also 1, and high damage is 0.02. As field inspections indicated that no scarp or shear crack is present, the potential for very high damage was eliminated. Consequently, the probability of occurrence of only high damage is Ph=0.02, only moderate damage is , and only low damage is 0 (moderate damage constantly overlaps with low damage). Applying Eq. (2) and the costs of Table A1 for a total length of affected road of 200 m, the resulting risk here is 66.18.
The soil instability affecting the C9G is as well due to colluvial soil accumulations of 3–4 m depth, over the bedrock. There are visible settlements and the ditches are deformed. The landslide is instrumented with two inclinometers that indicate that it is active.
The inclinometer measurements indicate vertical displacements lower than 2–3 mm and cumulative displacement lower than 30 mm, which points to a movement pattern of type X. There is neither scarp nor developed shear displacements. Accordingly, the probability of exceeding low damage is 1, moderate damage is 0.05, and high damage is 0.005. As previously shown, the probability is calculated for high damage as 0.005, for moderate damage as 0.045, and for low damage as 0.5, which for a total length of 300 m and the same costs as previously gives a total risk of 10.84.
4.4 Overall results and discussion
As mentioned in Sect. 2, out of the total 84 PoR, 20 concern rockfalls, 37 anchored walls, and 27 slow-moving landslides. The classification of the risk was based on economic criteria, considering that it expresses the average annual repair cost of a section. Four risk levels were used: low (<1 UC), moderate (1–10 UC), high (10–100 UC), and very high (>100 UC).
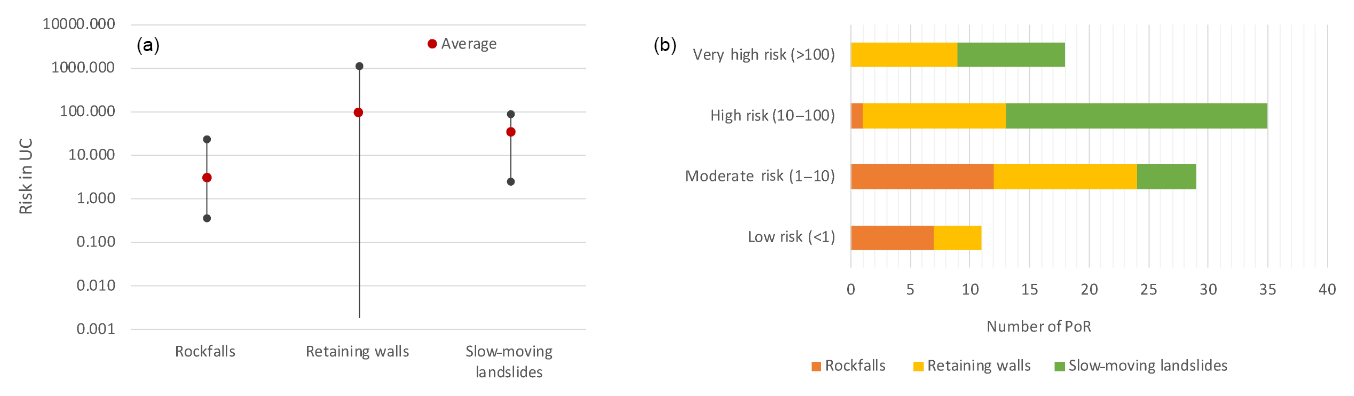
Figure 10(a) Average, maximum, and minimum calculated risk for each hazard type; (b) number of PoR per hazard type in each risk class.
Figure 10 shows how the risk levels are distributed over the different hazard types. High-risk areas mostly involve retaining-wall failures or slow-moving landslides. Rockfalls principally cause low and moderate risk. The risk classification highlights 21 % (18 PoR) of the analysed sections being of very high risk and needing imminent protection interventions. The highest risks in the study site (above 100 UC) were observed for nine of the retaining structures. A total of 42 % of the PoR fall into the class of high risk, 35 % moderate risk, and 13 % low risk. Depending on the prioritization needs and the economical restrictions on the planning of the interventions, other thresholds can be used for the risk classification, in order to reduce the number of sections marked as of highest priority.
The risks corresponding to the repairs related to the failure of the retaining walls can be 1 order of magnitude higher than for the rest of the hazards. This is reasonable given the fact that, besides road cleaning and repair costs, the additional wall construction and repair costs are high and that for this type of events high soil masses can be mobilized.
The calculated risks overestimate the real average annual costs, as they do not take into consideration that after protection interventions, the hazard is reduced and the chances of damage for the following period are much lower. Moreover, in practice, low and moderate damage is not repaired each time it occurs even if required but over larger time intervals, which reduces the real repair costs.
The values calculated here for the risk components are not precise but carry a certain degree of uncertainty as is also the case in other quantitative landslide risk studies (Jaiwsal et al., 2010; Vega et al., 2016; Corominas et al., 2014). An extensive quantification of the uncertainties and their effect on risk calculation procedure is a challenging task and has not been included here. However, some principal sources of uncertainty are mentioned in the following, with the aim of highlighting steps in the procedure, which present a high degree of uncertainty and that might have a strong effect on the final risk results.
For rockfalls, it is the attribution of large frequency values to the high-magnitude classes E and F that results in excessive costs. In any case, the definition of maximum rockfall volume of a slope is a complicated issue, especially considering the structural geology and the existence of bridges in the rock mass with a given persistence (Corominas et al., 2018). The mobilized volume for the failure of anchored retaining walls also implies a high degree of uncertainty with a substantial effect on the final risk. When it comes to slow-moving landslides, where the frequency and intensity assessment is based on the inclinometer measurements, uncertainties are associated with the location of the inclinometers in the landslide, the frequency of the measurements that also determine the precision of the velocity values, the potential existence of deeper rupture surfaces with displacements which are not registered by the actual inclinometers, and operability issues as well. Through the entire procedure, the definition of different thresholds presents moderate uncertainty as these were selected to fit the best real event occurrences, with a certain coherence, as explained, respectively for each hazard in the previous sections. The same is presented for the association of magnitude and intensity of events with damage, as the actions acting on the road and causing its damage are complex and the roads also vary in size, materials, and resistance.
The occurrence of landslides in areas intersecting transportation corridors might affect societies and the built environment in an extensive way (Remondo, 2008). The related indirect risk involves the impact on lifeline systems (e.g. water and sewage systems, energy grids, and lines of communication) in the vicinity of the roads, and present in the path of landslides. Interruption of access to and from rural and urban areas and critical transportation infrastructure like airports, ports, and bridges, as well as medical, educational, industrial, and other critical facilities, may cause important social and economic loss. Touristic, commercial, and business activities, as well as real estate values, are amongst the most commonly affected. Given the multiple dimensions and cascade effects that are inherent in such situations, indirect risks might entail large-scale consequences, which, in monetary terms, substantially exceed the direct risks. The establishment of the links and intersections, leading from the initial hazardous process to (some of) the aforementioned consequences presents certain perplexities, the investigation of which is out of the scope of this work. Simplified procedures such as the one presented by Corominas and Mavrouli (2015) have been proposed in the past for the study area. Despite this, the work presented here is limited to the investigation of the risk related to the direct losses and does not take indirect losses into consideration.
In this paper a procedure for the quantification of risk related to the geotechnical hazards across a road network has been presented. The studied hazards are rockfalls, failure of retaining structures, and slow-moving landslides. The risk has been calculated in monetary terms, as multiples of a UC set to EUR 1000.
In the studied area, the extensive and periodic collection of data permitted the magnitude–frequency evaluation based on historical data and, for rockfalls, where this data lacked, the development of an indicator model to assess it, which is based on local data. The parameters included in this model are the joint persistence, the density of scars, the differential erosion, the number of points with potential rockfalls, and the slope mass rating (SMR) index.
For slow-moving landslides with permanent or episodic activity, the landslide velocity was found to correlate well with the visible damage to the road pavement. The monthly thresholds of 3 and 10 mm and the cumulative displacement of 30 and 100 mm were used for the landslide intensity classification (see Table A1).
The highest risks in the study area that affect the repair cost from the damage to roads are in most cases associated, in descending order, with retaining structures, slow-moving landslides, and rockfalls. The annual repair cost for a retaining-wall failure presents a large variation over the different PoR, due to the variation on the maintenance conditions and working loads. Using the proposed procedure, the prioritization of interventions for all the PoR was made and the number and location of the PoR that require imminent interventions can be assessed. The thresholds defining the risk classes can be adjusted, according to the financial availability for interventions, so as to point out a smaller or higher number of PoR.
Several limitations exist in the application of the methodology, which are related to the availability of data in the area as well as the data quality. For slow-moving landslides, the assessment of the temporal probability of reactivation is evidence-based, upon displacement measurements, and does not take directly into consideration specific landslide mechanisms, material behaviour, infiltration, or groundwater variations with the uncertainties that these imply. In the case of landslides with movement patterns that cannot be correlated to rainfall precipitation, given the lack of knowledge of the causes of the acceleration, higher temporal probabilities of acceleration are attributed to the PoR. Still, this leads to the estimation of an approximate probability rather than to a direct calculation of it. The overall coherent results between movement rate and visible road damage have served as a starting point for the risk analysis here. Nevertheless, in the event of no apparent correlation between the two, or of velocity variations within the landslide body, further geotechnical studies are needed in order to study the effect of movement rate on the road. In the study area, slow-moving landslides are well identified through prior geological and geotechnical studies for the detection of the fracture or sliding surface and the back analysis of the stability; hence, deeper unmonitored sliding surfaces can be considered exceptional. The identification of the landslide depth for the exclusion of deeper unmonitored movements is a prerequisite for the proposed procedure, and is recommended for similar applications.
Given the inherent data and approach uncertainties, it is recommended that the final results are treated as relative and not as absolute ones. Further validation and refinement, using real annual costs are necessary for improving the method, which can be realized if repair cost data are systematically collected. This is an ongoing procedure, as in the study area inspections are made periodically for the PoR with higher risk rates, and landslide activity or damage is being assessed on a continuous basis, especially after extreme rainfall events. To this end and on a long-term basis, advanced monitoring techniques (e.g. use of synthetic-aperture radar techniques, lidar, etc.) with high temporal resolution and precision, as well as detailed water content measurements, could serve to validate the proposed procedure.
The calculated risk results are conservative, as in reality low and moderate damage is not repaired each time it occurs but over larger time intervals. The inclusion of this parameter cannot be standardized for the study area, as the repair works are not regular.
As described in the introduction, the methodology developed here had as a starting point the requirements and data availability of the selected case study. Several parts of the proposed procedure for the risk assessment and ranking along road networks are strongly related to local conditions, concerning geological, geomorphological, and climatic parameters, and are empirical. Accordingly, the thresholds that have been selected here for the hazard descriptors and the classification of the consequences strongly depend on the expected range of frequency, magnitude, and intensity of events in the study area. Moreover, the selection, scoring, and weighting of the factors which are used for the calculation of the risk components are based on data collected in the study area, and as such, their use, although supported by the physical interpretation of the phenomena, can only be acceptable for the specific case study and cannot be transferred to other areas without further studies. In that sense, the application of the proposed methodology to other case studies is principally suggested in terms of procedure and factors to consider for a multi-hazard integrated risk assessment for roadways. Adaptation to the local conditions is needed for the scoring and classification of the hazard parameters, and for the assessment of temporal probability values considering the intensity and recurrence of local triggering factors, as well as for the asset and cost assessments. Further applications of the procedure presented here to areas with similar or diverse data settings would be useful for its refinement and would provide an insight for framing the conditions of its transferability.
Data used in this work were made available to the authors by Ikerlur and Gipuzkoako Foru Aldundia.
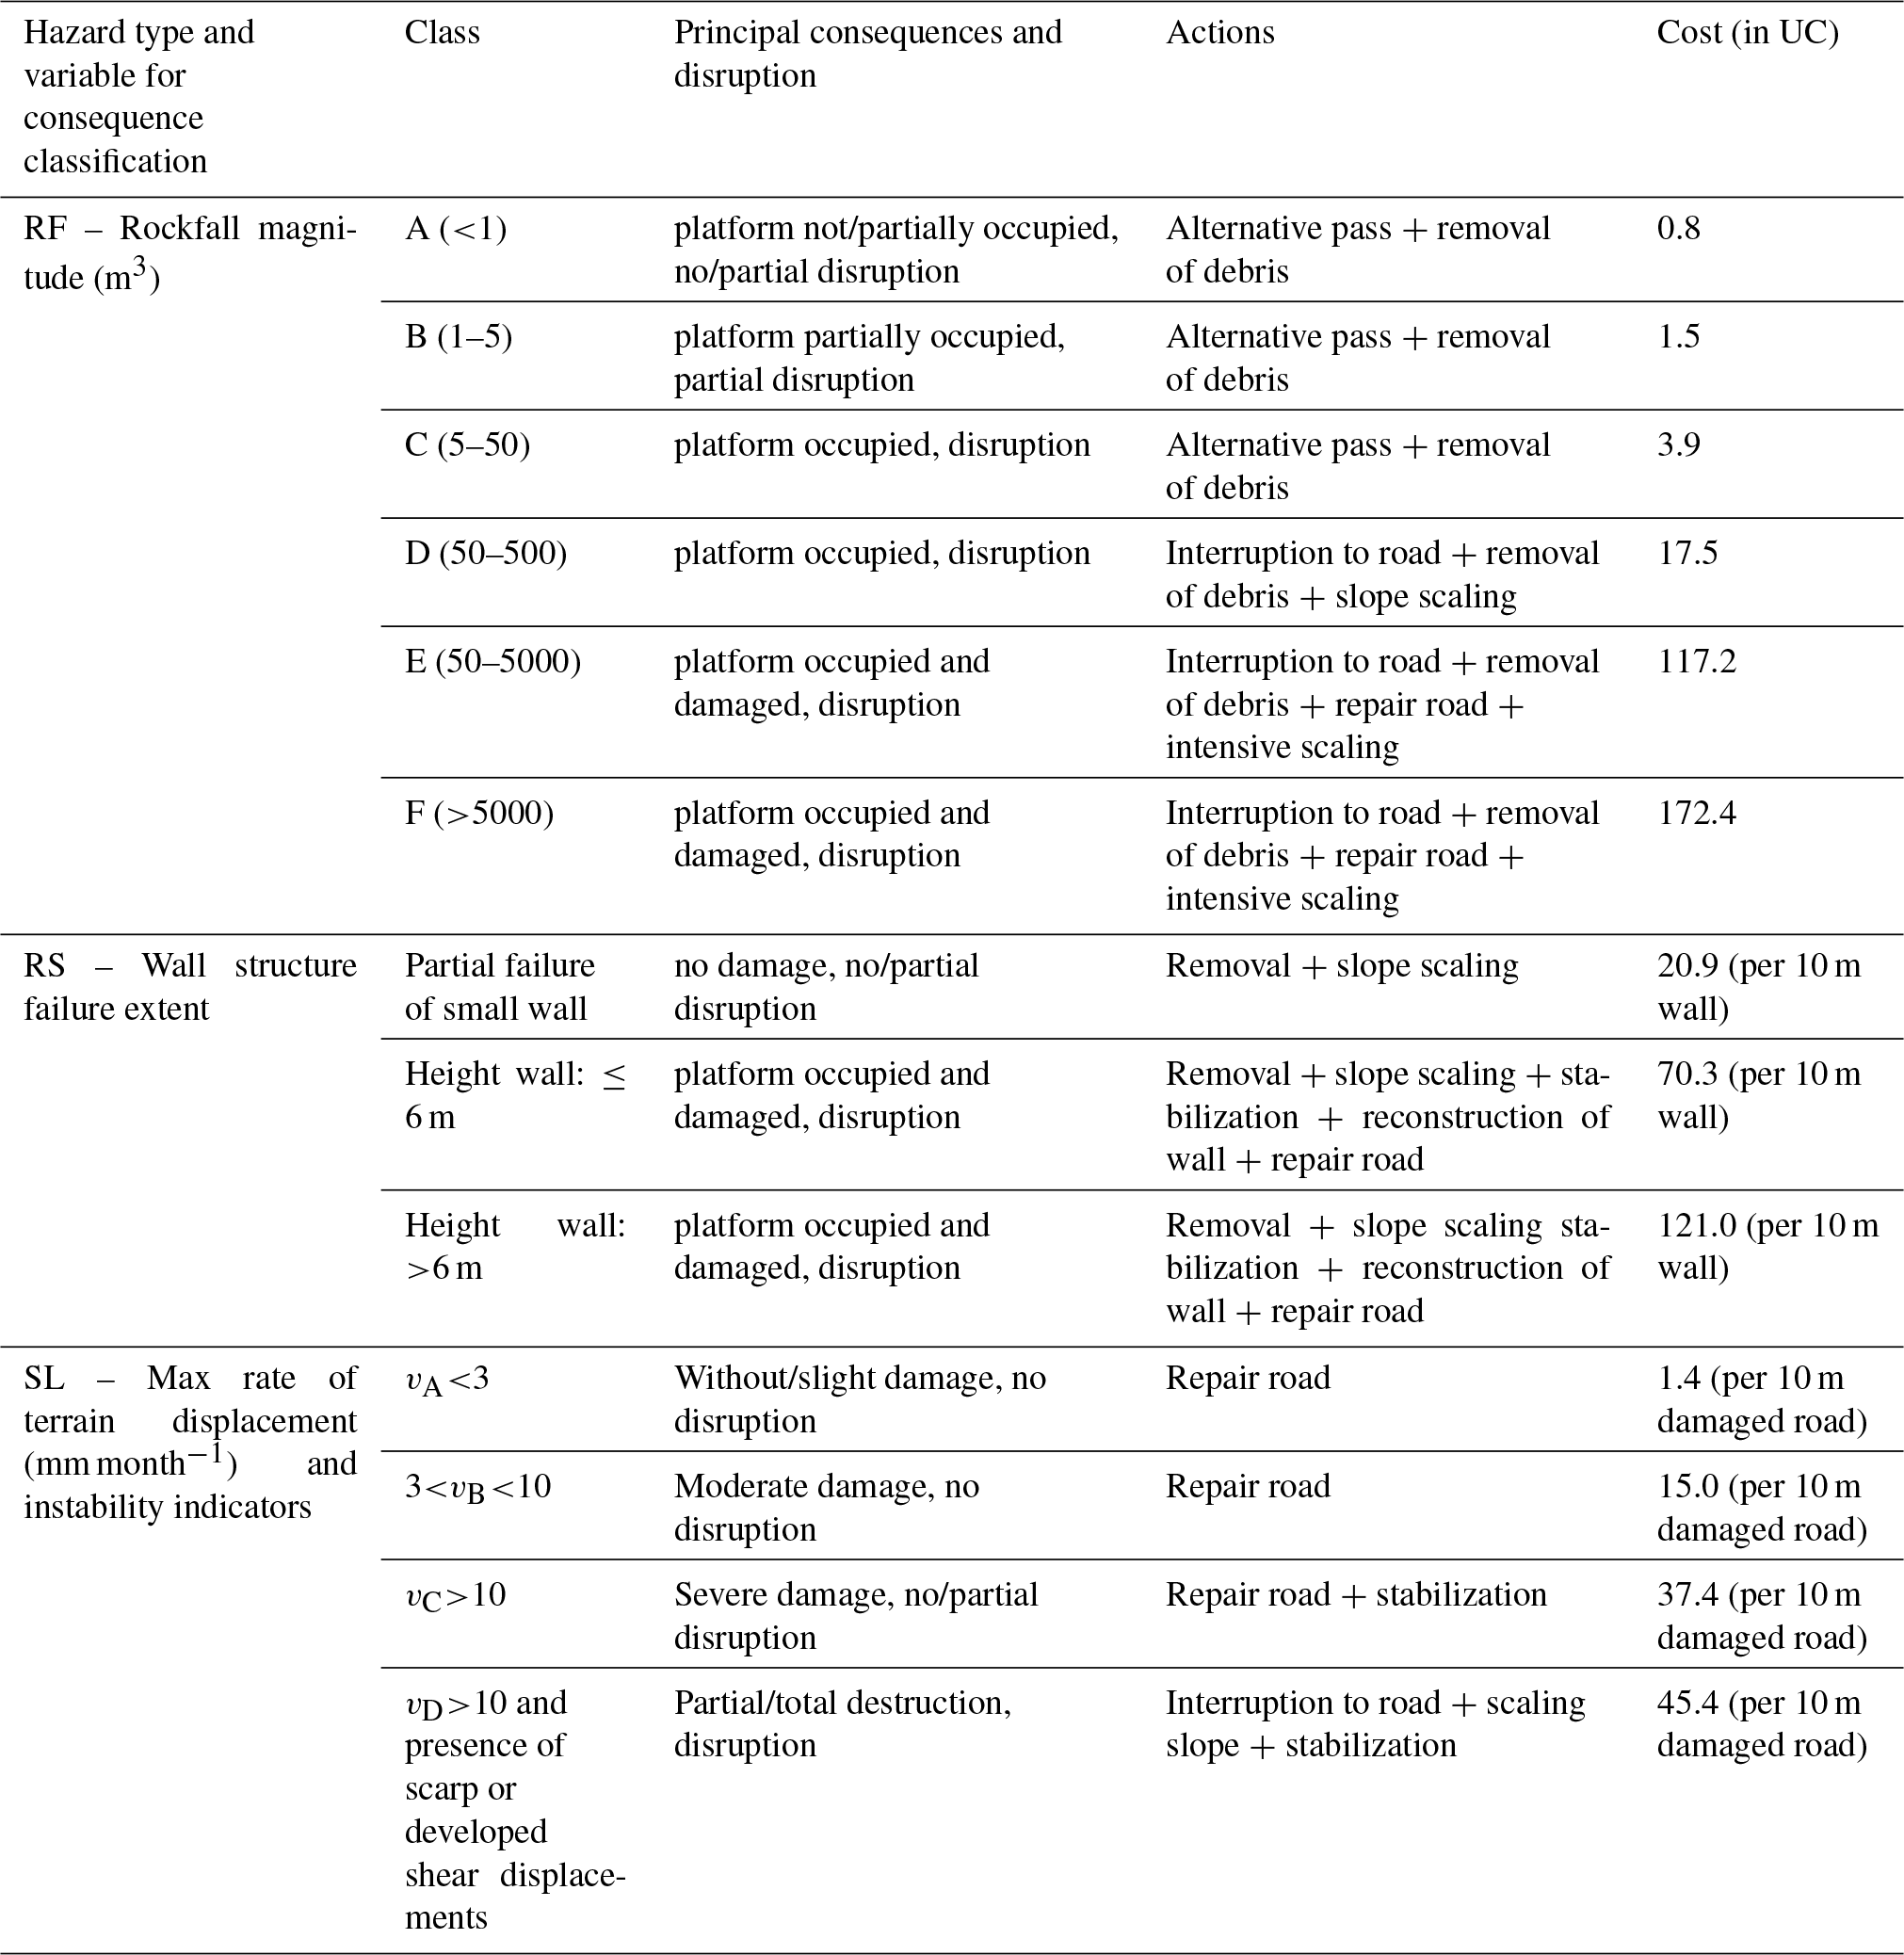
Table A1Consequence classification and costs for each hazard type (source of costs: Ikerlur and Gipuzkoa Provincial Council).
OM contributed to the conceptual ideas, performed the calculations, and contributed to the analysis of the results and writing of the manuscript; JC designed the study, developed the main conceptual ideas, and contributed to the analysis of the results and writing of the manuscript. II, NA, JR, and IJ prepared the geological context and applied the methodology to all PoR. SL and JAN compiled and made available the required data at the PoR and the repair costs, and they contributed to shaping the methodology requirements.
The authors declare that they have no conflict of interest.
This work has been performed with the support of the project Integrated
Assessment of the Geotechnical Risk of the Gipuzkoa road network
(15-ES-563/2009) funded by the Gipuzkoako Foru Aldundia and of the Project
RockModels-Caracterización y modelización de los desprendimientos
rocosos (https://rockmodels.upc.edu/en, last access: 25 February 2019), funded by the Spanish Ministry of
Economy and Business (Ref. BIA2016-75668-P, AEI/FEDER,UE).
Edited by: Margreth Keiler
Reviewed by: three anonymous referees
Ábalos, B.: Geologic map of the Basque-Cantabrian Basin and a new tectonic interpretation of the Basque Arc, Int. J. Earth Sci. (Geol. Rundsch.), 105, 2327, https://doi.org/10.1007/s00531-016-1291-6, 2016.
Barnolas, A. and Pujalte V.: La Cordillera Pirenaica: definición, límites y división, in: Vera JA (ed) Geología de España, Sociedad Geológica de España – Instituto Geológico y Minero de España, Madrid, 233–241, 2004.
Budetta, P.: Assessment of rockfall risk along roads, Nat. Hazards Earth Syst. Sci., 4, 71–81, https://doi.org/10.5194/nhess-4-71-2004, 2004.
Bunce, C. M., Cruden, D. M., and Morgenstern, N. R.: Assessment of the hazard from rock fall on a highway, Can. Geotech. J., 34, 344–356, https://doi.org/10.1139/cgj-34-3-344, 1997.
Corominas, J. and Mavrouli, O.: Quantitative rockfall risk assessment in the roadways of Gipuzkoa, in: Engineering Geology for Society and Territory, 2, 1813–1816, Springer, Cham, 2015.
Corominas, J., van Westen, C., Frattini, P., Cascini, L., Malet, J. P., Fotopoulou, S. Catani, F. Van Den Eeckhaut, M., Mavrouli, O., Agliardi, F., and Pitilakis, K., Winter, M. G., Pastor, M., Ferlisi, S., Tofani, V., Hervás, J., and Smith, J. T.: Recommendations for the quantitative analysis of landslide risk, B. Eng. Geol. Environ., 73, 209–263, https://doi.org/10.1007/s10064-013-0538-8, 2014.
Dai, F., Lee, C., and Ngai, Y.: Landslide risk assessment and management: an overview, Eng. Geol., 64, 65–87, https://doi.org/10.1016/S0013-7952(01)00093-X, 2002.
Eidsvig, U. M. K., Kristensen, K., and Vangelsten, B. V.: Assessing the risk posed by natural hazards to infrastructures, Nat. Hazards Earth Syst. Sci., 17, 481–504, https://doi.org/10.5194/nhess-17-481-2017, 2017.
Fell, R., Corominas, J., Bonnard, C., Cascini, L., Leroi, E., and Savage, W. Z.: Guidelines for landslide susceptibility, hazard and risk zoning for land use planning, Eng. Geol., 102, 85–98, https://doi.org/10.1016/j.enggeo.2008.03.022, 2008.
Ferlisi, S., Cascini, L., Corominas, J., and Matano, F.: Rockfall risk assessment to persons travelling in vehicles along a road: the case study of the Amalfi coastal road (southern Italy), Nat. Hazards, 62, 691–721, https://doi.org/10.1007/s11069-012-0102-z, 2012.
Ferrero, A. M. and Migliazza, M.: Landslide Transportation Network and Lifelines: Rockfall and Debris Flow, in: Landslide Science and Practice, Berlin, Heidelberg: Springer Berlin Heidelberg, 161–170, https://doi.org/10.1007/978-3-642-31319-6_23, 2013.
Gharaibeh, N. G. and Lindholm, D.: A condition assessment method for roadside assets, Struct Infrastruct E, 10, 409–418, https://doi.org/10.1080/15732479.2012.757330, 2014.
Gómez, M., Vergés, J., and Riaza, C.: Inversion tectonics of the northern margin of the Basque Cantabrian Basin, B. Soc. Geol. Fr., 173, 449–459, https://doi.org/10.2113/173.5.449, 2002.
Hungr, O., Evans, S. G., and Hazzard, J.: Magnitude and frequency of rock falls and rock slides along the main transportation corridors of southwestern British Columbia, Can. Geotech. J., 36, 224–238, https://doi.org/10.1139/t98-106, 1999.
Jaiswal, P., Van Westen, C. J., and Jetten, V.: Quantitative landslide hazard assessment along a transportation corridor in southern India, Eng. Geol., 16, 236–250, https://doi.org/10.1016/j.enggeo.2010.09.005, 2010.
Kappes, M. S., Gruber, K., Frigerio, S., Bell, R., Keiler, M., and Glade, T.: The MultiRISK platform: The technical concept and application of a regional-scale multihazard exposure analysis tool, Geomorphology, 151–152, 139–155, https://doi.org/10.1016/j.geomorph.2012.01.024, 2012.
Mansour, M. F., Morgenstern, N. R., and Martin, C. D.: Expected damage from displacement of slow-moving slides, Landslides, 8, 117–131, https://doi.org/10.1007/s10346-010-0227-7, 2011.
Michoud, C., Derron, M.-H., Horton, P., Jaboyedoff, M., Baillifard, F.-J., Loye, A., Nicolet, P., Pedrazzini, A., and Queyrel, A.: Rockfall hazard and risk assessments along roads at a regional scale: example in Swiss Alps, Nat. Hazards Earth Syst. Sci., 12, 615–629, https://doi.org/10.5194/nhess-12-615-2012, 2012.
Nicolet, P., Jaboyedoff, M., Cloutier, C., Crosta, G. B., and Lévy, S.: Brief communication: On direct impact probability of landslides on vehicles, Nat. Hazards Earth Syst. Sci., 16, 995–1004, https://doi.org/10.5194/nhess-16-995-2016, 2016.
Pantelidis, L.: A critical review of highway slope instability risk assessment systems, B. Eng. Geol. Environ., 70, 395–400, https://doi.org/10.1007/s10064-010-0328-5, 2011.
Pellicani, R., Argentiero, I., and Spilotro, G.: GIS-based predictive models for regional-scale landslide susceptibility assessment and risk mapping along road corridors, Geomat Nat Haz Risk, 8, 1012–1033, https://doi.org/10.1080/19475705.2017.1292411, 2017.
Pierson, L. A. and Van Vickle, R.: Rockfall Hazard Rating System, Publication No. FHWA SA-93, U.S. Department of Transportation, Fedeal Highway Administration, retrieved from: http://www.dot.ca.gov/hq/esc/geotech/references/Rockfall_References/30_Pierson_Rockfall_Hazard_Rating_System.pdf (last access: 3 August 2018), 1993.
Remondo, J., Bonachea, J., and Cendrero, A.: Quantitative landslide risk assessment and mapping on the basis of recent occurrences, Geomorphology, 94, 496–507, https://doi.org/10.1016/j.geomorph.2006.10.041, 2008.
Romana, M.: SMR classification. In: International Society of Rock Mechanics (ed) Proceedings 7th International Congress on Rock Mechanics, Aachen, Germany, Balkema, Rotterdam, 2, 955–960, 1991.
Schmidt, J., Matcham, I., Reese, S., King, A., Bell, R., Henderson, R., Smart, G., Cousins, J., Smith, W., and Heron, D.: Quantitative multi-risk analysis for natural hazards: a framework for multi-risk modelling, Nat. Hazards, 58, 1169–1192, https://doi.org/10.1007/s11069-011-9721-z, 2011
Silva, F., Lambe, T. W., and Marr, W. A.: Probability and Risk of Slope Failure, J. Geotech. Geoenviron., 34, 1691–1699, https://doi.org/10.1061/(ASCE)1090-0241(2008)134:12(1691), 2008.
Tugend, J., Manatschal, G., Kuzsnir, N. J., Masini, E., Mohn, G., and Thinon I: Formation and deformation of hyperextended rift systems: insights from rift domain mapping in the Bay of Biscay-Pyrenees, Tectonics, 33, 1239–1276, https://doi.org/10.1002/2014TC003529, 2014.
Vega, J. A. and Hidalgo, C. A.: Quantitative risk assessment of landslides triggered by earthquakes and rainfall based on direct costs of urban buildings, Geomorphology, 273, 217–235, https://doi.org/10.1016/j.geomorph.2016.07.032, 2016.
Zêzere, J. L., Garcia, R. A. C., Oliveira, S. C., and Reis, E.: Probabilistic landslide risk analysis considering direct costs in the area north of Lisbon (Portugal), Geomorphology, 94, 467–495, https://doi.org/10.1016/j.geomorph.2006.10.040, 2008.