the Creative Commons Attribution 4.0 License.
the Creative Commons Attribution 4.0 License.
 | 12 Jun 2019
Taylor's power law in the Wenchuan earthquake sequence with fluctuation scaling
Peijian Shi
Yang Li
Jie Liu
Haixia Shi
Tao Xie
Chong Yue
Taylor's power law (TPL) describes the scaling relationship between the temporal or spatial variance and mean of population densities by a simple power law. TPL has been widely testified across space and time in biomedical sciences, botany, ecology, economics, epidemiology, and other fields. In this paper, TPL is analytically reconfirmed by testifying the variance as a function of the mean of the released energy of earthquakes with different magnitudes on varying timescales during the Wenchuan earthquake sequence. Estimates of the exponent of TPL are approximately 2, showing that there is mutual attraction among the events in the sequence. On the other hand, the spatio-temporal distribution of the Wenchuan aftershocks tends to be nonrandom but approximately definite and deterministic, which highly indicates a stable spatio-temporally dependent energy release caused by regional stress adjustment and redistribution during the fault revolution after the mainshock. The effect of different divisions on estimation of the intercept of TPL straight line has been checked, while the exponent is kept to be 2. The result shows that the intercept acts as a logarithm function of the time division. It implies that the mean–variance relationship of the energy release from the earthquakes can be predicted, although we cannot accurately know the occurrence time and locations of imminent events.
- Article
(1854 KB) - Full-text XML
-
Supplement
(319 KB) - BibTeX
- EndNote


The Wenchuan MS 8.0 earthquake on 12 May 2008 was the result of the intensively compressive movement between the Qinghai–Tibet Plateau and the Sichuan Basin. It ruptured the middle segment of the Longmenshan (LMS) thrust belt (Burchfiel et al., 2008), with a total length of the fault trace of approximately 400 km along the edge of the Sichuan Basin and the eastern margin of the Tibetan Plateau, in the middle of the north–south seismic belt of China. Millions of aftershocks occurred after the main event. Up to now, the focus zone has tended to be quiet, with only small ones occurring occasionally. A complete Wenchuan earthquake sequence has been attained.
Statistical seismology applies statistical methods to the investigation of seismic activities, and stochastic point process theory promotes the development of statistical seismology (Vere-Jones et al., 2005). After some improvement, most of the point process theories and methods can be used to analyze spatio-temporal data of earthquake occurrence and to describe active laws of aftershocks. The term “aftershock” is widely used to refer to those earthquakes which follow the occurrence of a large earthquake and aggregately take place in abundance within a limited interval of space and time. This population of earthquakes is usually called an earthquake sequence. In seismological investigations, one important subject has long been the statistical properties of the aftershocks. The spatial and temporal distribution of aftershocks after a destructive earthquake is usually performed in a general survey (Utsu, 1969). In seismology, one of the most famous theories describing the activities of aftershocks is the Gutenberg–Richter law (Gutenberg and Richter, 1956), which expresses the relationship between the magnitude and the total number of earthquakes with at least that magnitude in any given region and time interval. Another one is Omori's law, which was first depicted by Fusakichi Omori in 1894 (Omori, 1894) and shows that the frequency of aftershocks decreases roughly with the reciprocal of time after the mainshock. Utsu (1969) and Utsu et al. (1995) developed this law and proposed the modified Omori formula afterwards. Since the 1980s, with the development of nonlinear theory, an epidemic-type aftershock sequence (ETAS) model has been proposed by Ogata (1988, 1989, 1999), which is based on the empirical laws of aftershocks and quantifies the dynamic forecasting of the induced effects. This model has been used broadly in earthquake sequence study (Kumazawa and Ogata, 2013; Console, 2010).
An increasing number of investigations show that there is an interaction effect for the occurrence of aftershocks in a given area. A stress-triggering model is usually used to depict interaction between larger earthquakes in the view of physics (Harris, 1998; Stein, 1999). More and more results show that obvious increases in Coulomb stress not only promote the occurrence of upcoming middle or strong events of an earthquake sequence but also affect their spatial distribution to some degree (Robinson and Zhou, 2005).
The goal of this paper is to introduce a different statistical method called Taylor's power law (TPL) into the statistical seismology field by analyzing the Wenchuan earthquake sequence from the point of view of energy distribution or energy release. We aim to find out whether or not the energy distribution or energy release of the Wenchuan earthquake sequence complies with a specific power-law function as described by the TPL for different scaled samples and what the spatial and temporal properties are.
In statistics, there are two important moments in a distribution, the mean (μ) and the variance (σ2). It is common to describe the types of the distributions using the relationship between these two parameters. For instance, we have σ2=μ for a Poisson distribution. In nature, however, the variance is not always equal to or proportional to the mean. Mutual attraction or mutual repulsion for individuals in natural populations, e.g., the intra-specific competition of plants, makes variance different from the mean. After examining many sets of samples of animal and plant population spatial densities, Taylor (1961) found that the variance appears to be related to the mean by a power-law function: the variance is proportional to the mean raised to a certain power,
or equivalent to a linear function when the mean and variance are both logarithmically transformed,
where a and b are constants and c=log 10(a). Equations (1) and (2) are called Taylor's power law (henceforth TPL) or Taylor's power law of fluctuation scaling (Eisler et al., 2008).
Equations (1) and (2) may be exact if the mean and variance are population moments calculated from certain parametric families of skewed probability distributions (Cohen and Xu, 2015). TPL describes the species-specific relationship between the spatial or temporal variance of populations and their mean abundances (Kilpatrick and Ives, 2003). It has been verified for hundreds of biological species and abiotic quantities in biomedical sciences, botany, ecology, epidemiology, and other fields (Taylor, 1961, 1984; Kendal, 2002; Eisler et al., 2008; Cohen and Xu, 2015; Shi et al., 2016, 2017; Lin et al., 2018). Most of the scientific investigations of TPL mainly focus on the power-law exponent b (or slope b in the linear form), which has been believed to contain information on aggregation in space or time of populations for a certain species (Horne and Schneider, 1995).
In this study, we also concentrate on the parameter b of TPL. We expect that b is independent of the temporal block size A, which is used to divide the Wenchuan sequence into different temporal blocks because the aftershock area is invariable during this period.
A large earthquake of magnitude MS 8.0 hit Wenchuan in the Sichuan province of China, at 14:28:01 CST (China Standard Time) on 12 May 2008, with an epicenter located at 103.4∘ N and 31.0∘ E and a depth of 19 km.
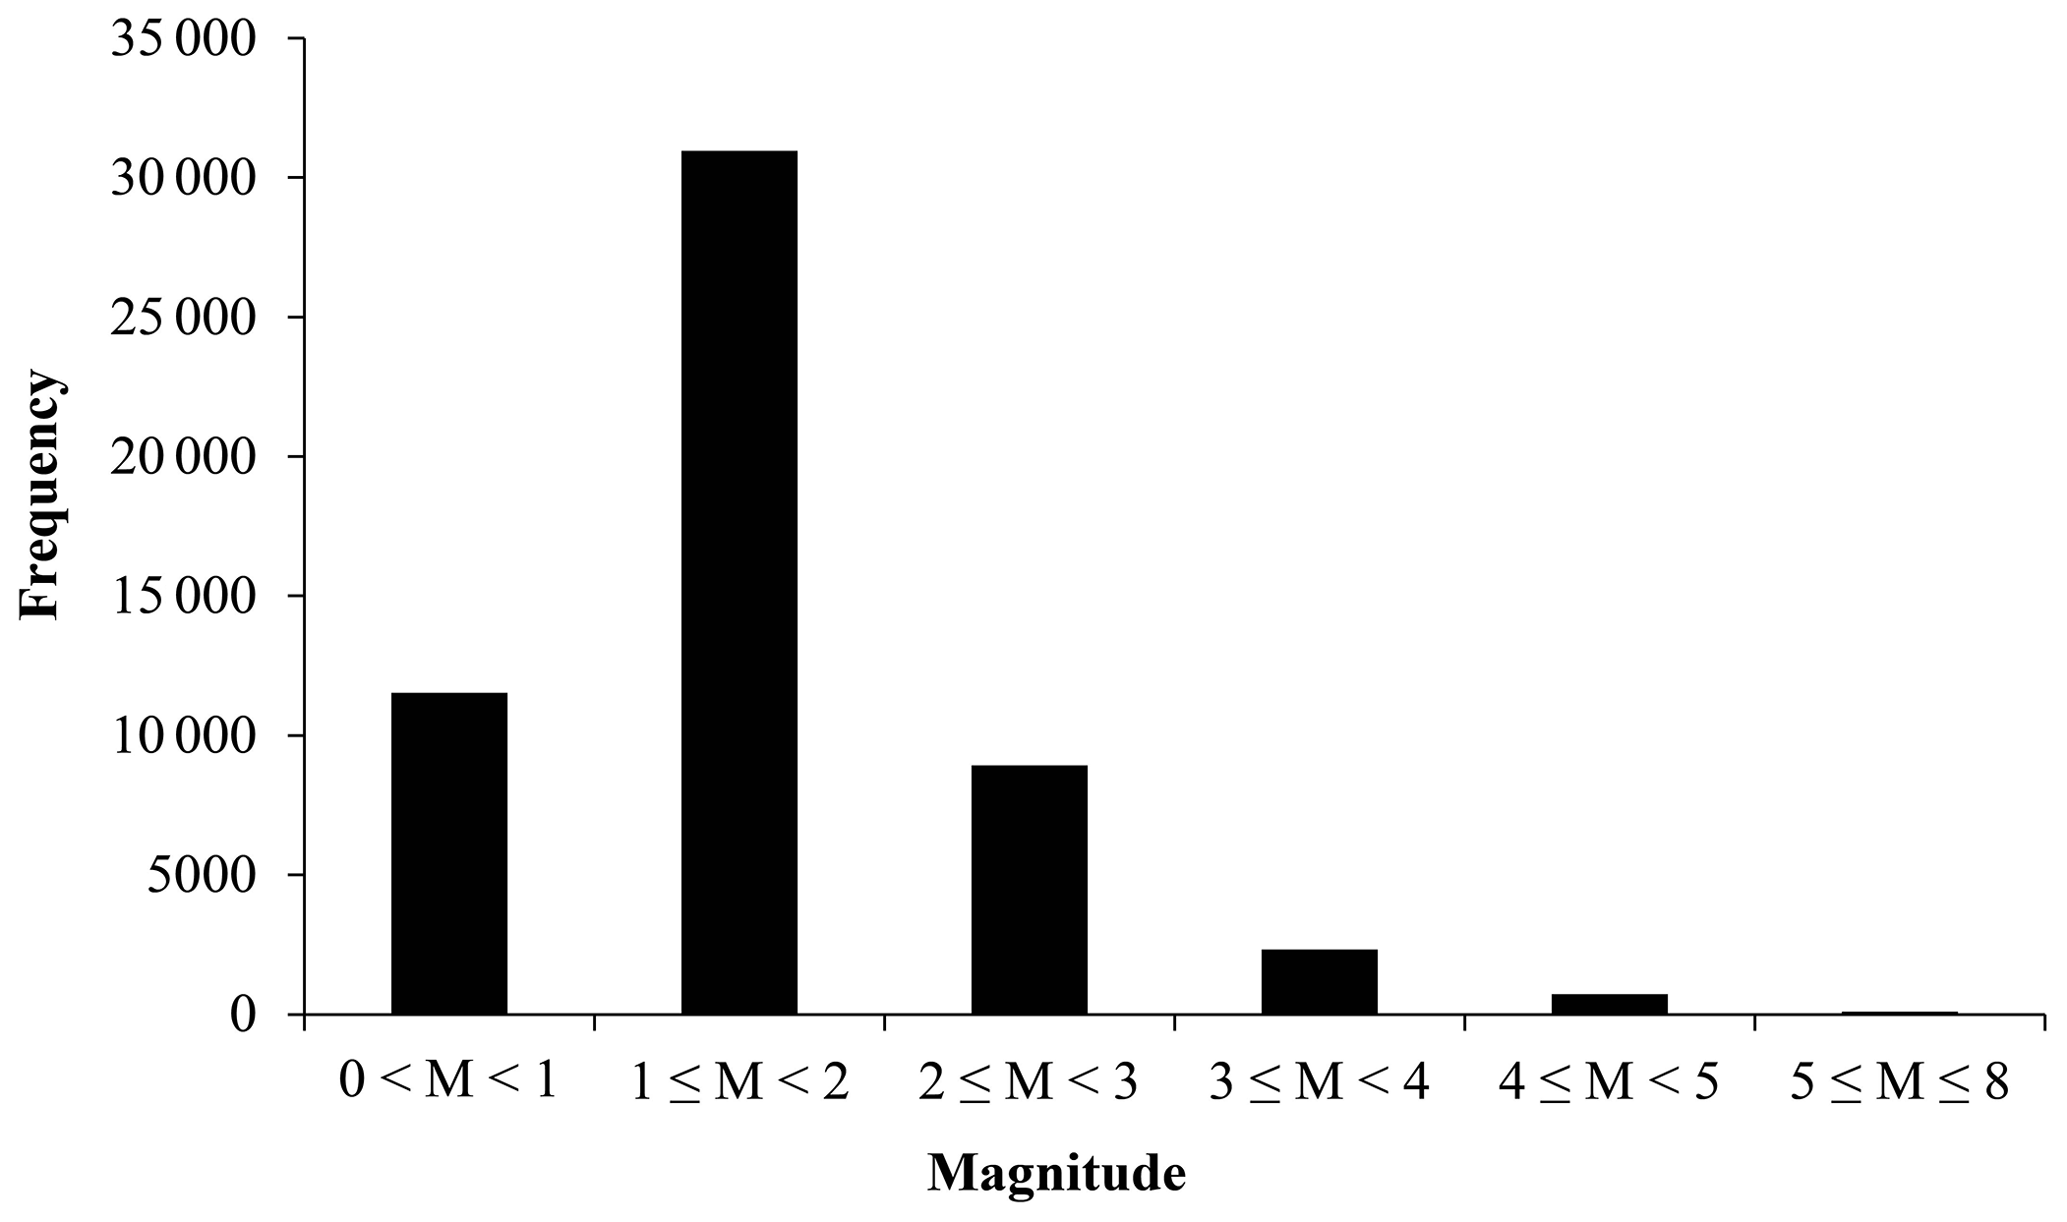
According to the earthquake catalogue of the China Earthquake Networks Center (CENC; http://www.csi.ac.cn/, last access: 30 June 2017), there have been 54 554 earthquakes of magnitudes M > 0 recorded for the Wenchuan sequence by 31 December 2016. Figure 1 shows the frequency of aftershocks with different magnitudes. Here, aftershocks with M < 2.0 account for 77.9 % of the total sequence due to the fact that only weak ones occur after a long period of time after the mainshock. In addition, except for the mainshock, the number of aftershocks is 733 for magnitudes 4.0 ≤ M < 5.0 and 86 for 5.0 ≤ M < 8.0. They account for a very small percentage of the total.
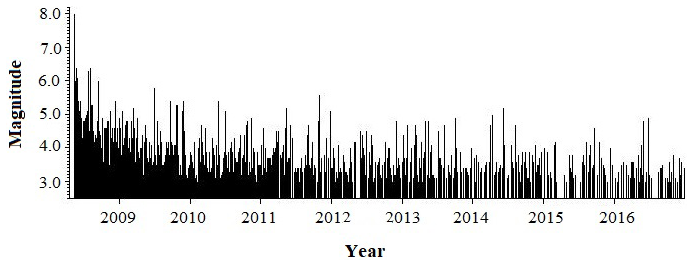
Figure 2Series plot of the Wenchuan earthquake sequence with M≥3.0 from 12 May 2008 to 31 December 2016.
Figure 2 displays the fluctuation variability of the Wenchuan earthquake sequence with M≥3.0 from 12 May 2008 to 31 December 2016. The temporal distribution of the magnitudes of aftershocks attenuates quickly after the mainshock. The three larger aftershocks all occurred in 2008, with M 6.4 on 25 May, M 6.1 on 1 August and M 6.1 on 5 August; 85 % of aftershocks with M≥3.0 occurred by the end of 2011, about 2.5 years after the mainshock.

Figure 3Spatial distribution of epicenters of the Wenchuan earthquake sequence with (a) M > 0 and (b) M≥5.0 from 12 May 2008 to 31 December 2016. The mainshock on 12 May 2008 is labeled by a red solid circle.
Figure 3a shows the spatial distribution of epicenters of the Wenchuan earthquake sequence with M > 0 from 12 May 2008 to 31 December 2016. The aftershocks are distributed in the region with latitude 102–107∘ E and longitude 30–34∘ N, mainly along the Longmenshan thrust fault, which is a junction region of the Songpan–Garze block and South China block and extends along the north–east–east (NEE) direction for more than 400 km. The size of the aftershocks on different scales is characterized by a population density of the events distributed in space and time after the Wenchuan MS 8.0 earthquake, but we neglect the variations of the aftershock area in the next step. The distribution of strong aftershocks is of different segment characteristics. Earthquakes with a magnitude M≥5.0 are mainly spread in the southern Miaoxian and Mianzhu area and northern Pingwu area. There are no strong aftershocks occurring in the middle areas such as Beichuan and Anxian (see Fig. 3b). According to the primary investigation results of the Wenchuan rupture process conducted by Chen et al. (2008), the rupture of the Wenchuan MS 8.0 earthquake originated from Wenchuan thrust fault with a little right lateral slip component and extended mainly in the northeast (NE) direction. The whole process formed two areas with larger dislocations. One is the southern area of Miaoxian located in the bottom section in Fig. 3b. The other one lies near Beichuan area (the middle segment in Fig. 3b), but no strong shocks happened there.
For the complete Wenchuan earthquake sequence, we denote the number of all earthquakes by N, i.e., N= 54 554, and use to index each earthquake. For each earthquake with magnitude Mq, its corresponding energy release is labeled by Eq, and it can be attained in the light of the following relationship (Xu and Zhou, 1982):
We use tq to index the time lag of the qth aftershock from the mainshock (in days), i.e., t1=0 for the main event. The last aftershock occurred at 18:05:57 CST (China Standard Time) on 31 December 2016, and its tq value is 3155.
In order to study the relationship between the variance and mean of the energy sequence Eq, we first divide it into equally spaced short temporal blocks with size A (in days). For example, if A=10, then the number of blocks is , which is rounded to the nearest integer. Now the complete energy sequence Eq is partitioned into n=316 blocks of short energy subsequences. We use i to index each block, i.e., , and hi to denote the number of data points in each block, which is variable because earthquakes occurred stochastically in the sequence. Now we can calculate the mean (μ) and variance (σ2) for each block using
where Ei,j denotes the energy of the jth earthquake in the ith block.
The data processing procedure has been performed with different block sizes . The number of sample points in each block decreases as the block size increases. The relationships between the mean and variance of the released energies from earthquakes in six representative temporal blocks are shown in Fig. 4 on a log–log scale. The red line stands for the fitted linear function of TPL using the least squares method. The 95 % confidence intervals (CIs) of the slope and the coefficients of determination R2 are shown in Table S1 in the Supplement. For instance, Fig. 4a shows the variance as a function of the mean for 316 time intervals when A=10. The estimated intercept is 0.702, the estimated slope is 2.060, with a 95 % CI (1.989, 2.076), and R2=0.963. The root-mean-square error (RMSE) was also calculated to exhibit the feasibility of using TPL with the exponent 2 to approximate that with the exponent to be estimated (unknown).
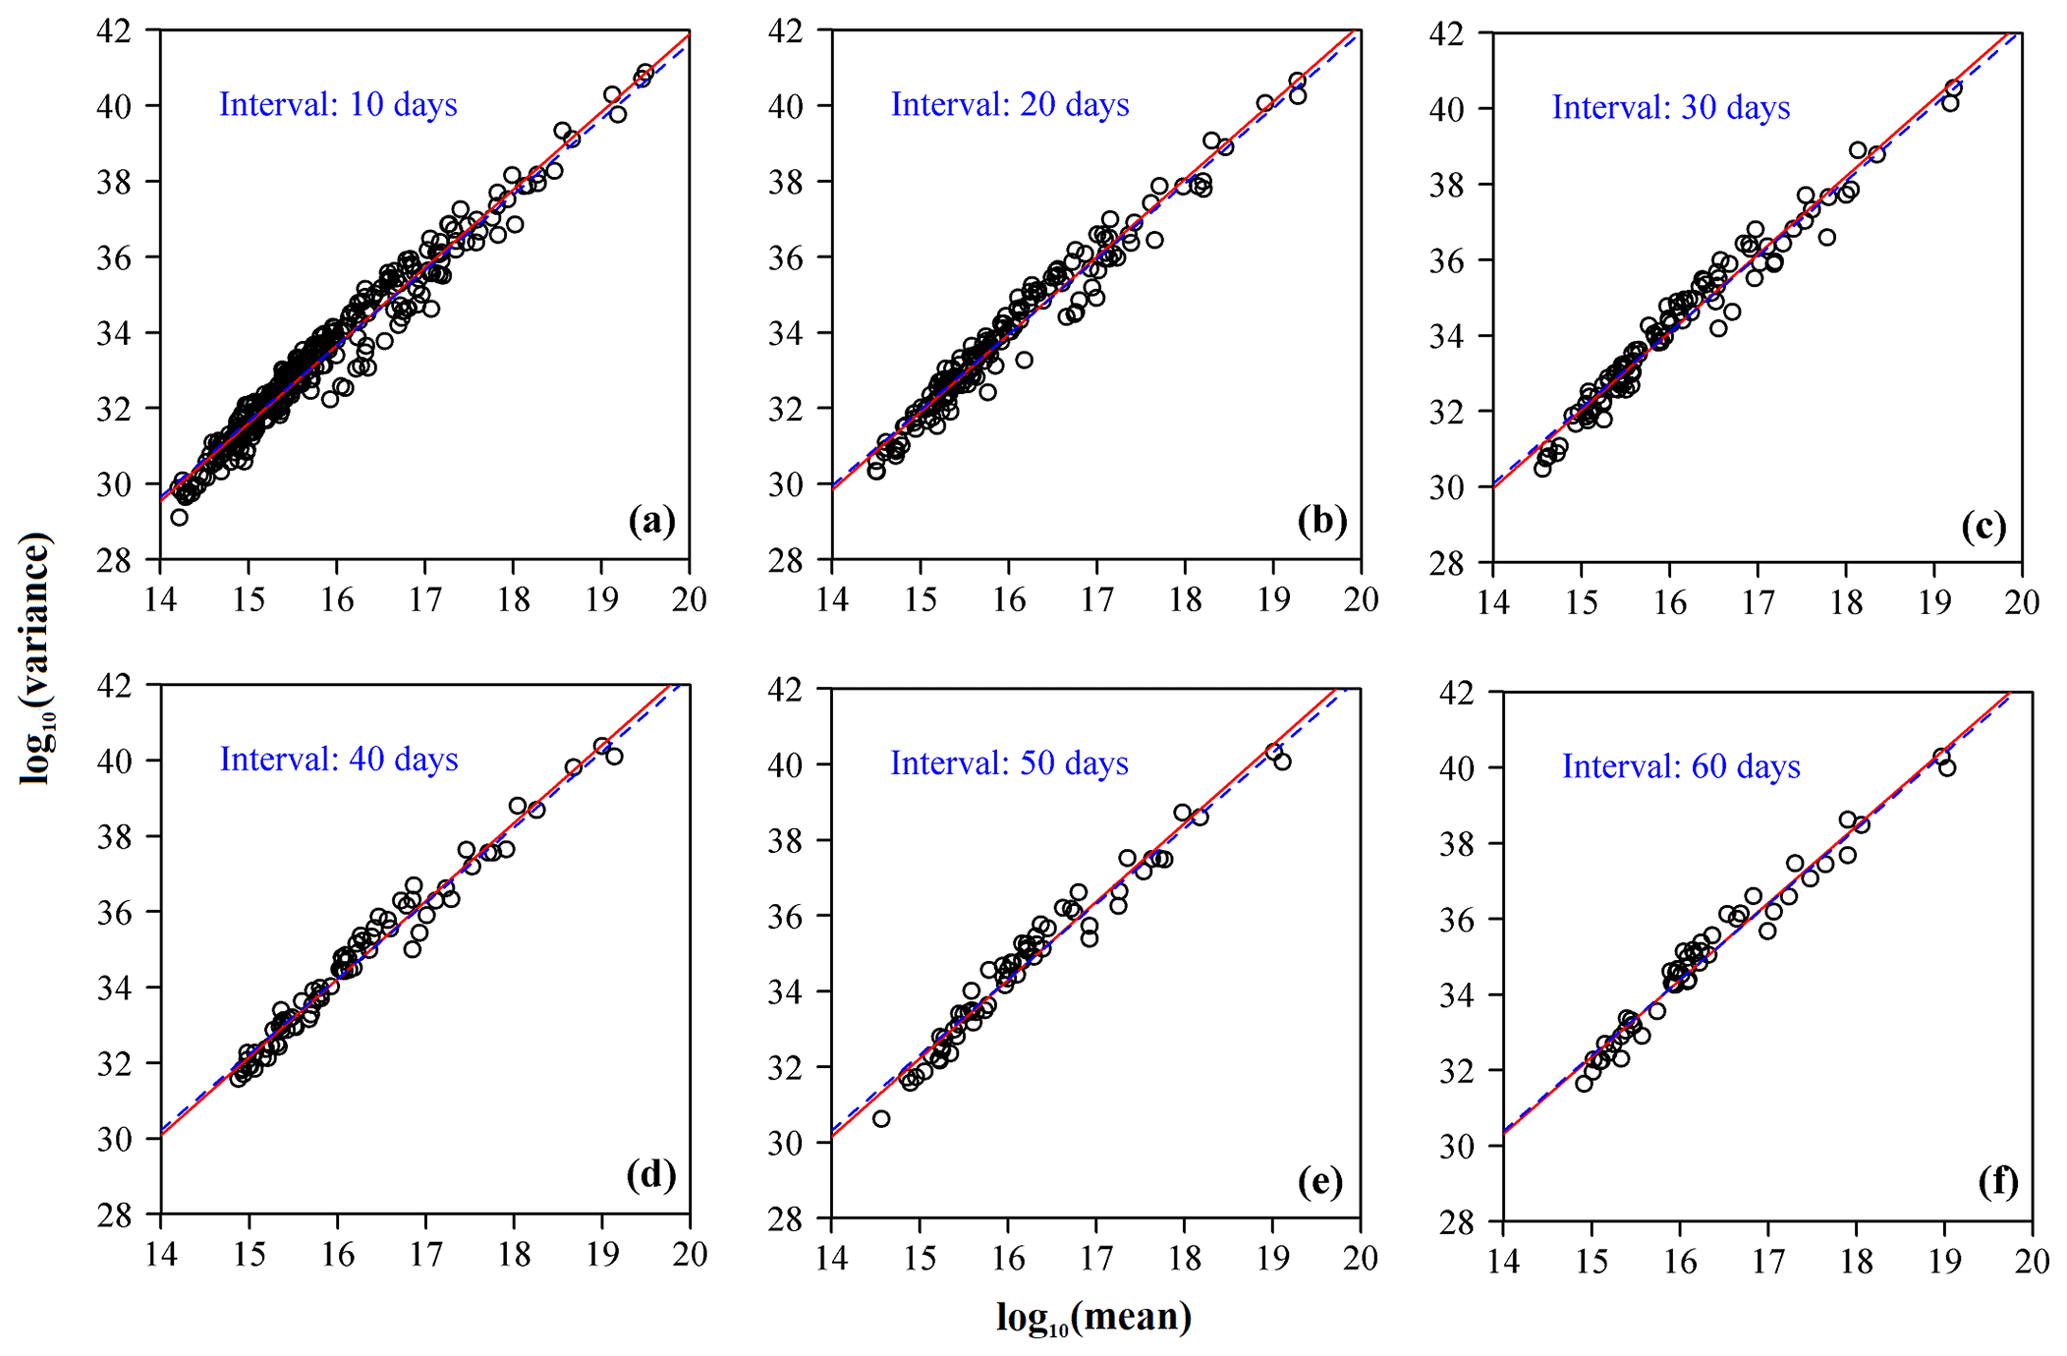
Figure 4Calculated variance as a function of the observed mean of the energies from earthquakes in each time interval on a log–log coordinate (open circles) for different values of A. The red straight line corresponds to the fitted TPL with an unknown exponent, i.e. , using the least squares method. The blue dashed line corresponds to the fitted TPL with the exponent 2, i.e. . There are 97 different values of A in total, and only six are shown here: (a) A=10, (b) A=20, (c) A=30, (d) A=40, (e) A=50, and (f) A=60.
Figure 4 and Table S1 show that there is an apparent linear relationship between the common logarithm of the variance and that of the mean for all earthquakes occurring within different temporal blocks, characterized by a property of aggregation on different timescales. The estimated value of the intercept, c (or log 10(a)), which is mainly influenced by the number of samples, increases overall with A, from 0.016 to 3.249 (Table S1). The estimates of slope b, on the other hand, are roughly 2 for all block sizes used in the study. All R2 values are greater than 0.96, showing a very strong linear relationship. These results indicate that the energy release of aftershocks of the Wenchuan sequence complies well with a temporal TPL.

Figure 5The calculated variance as a function of the observed mean of the energies from earthquakes in each block on a log–log scale (open circles) where A is fixed as 10. The red straight line corresponds to the fitted TPL with an unknown exponent, i.e. , using the least squares method. The blue dashed line corresponds to the fitted TPL with exponent 2, i.e. . This is shown for the following years: (a) 2008–2008, (b) 2008–2009, (c) 2008–2010, (d) 2008–2011, (e) 2008–2012, (f) 2008–2013, (g) 2008–2014, (h) 2008–2015, and (i) 2008–2016.
Next, we divide the Wenchuan earthquake sequence into nine time stages in years: 2008–2008, 2008–2009, 2008–2010, 2008–2011, 2008–2012, 2008–2013, 2008–2014, 2008–2015, and 2008–2016. For each stage, we use a similar procedure, which has been used in Fig. 4, to generate Fig. 5. We first transform all earthquakes into their energy forms using the relationship between earthquake magnitude M and energy E. Then the energy sequences are partitioned into temporal blocks with a fixed block size A=10 d. The calculated variances and means are plotted on a log–log scale, as shown in Fig. 5. Again, TPL comes into play for all time stages. The estimates of the parameters in Eq. (2) for the data in different stages were listed in Table S2.
Figure 5 shows a strong linear relationship between the variance and mean of the earthquake energy populations on a log–log scale, especially for those large samples. The estimates summarized in Table S2 (red fitted lines in Fig. 5) show similar results to Table S1. The intercept gradually increases as the total number of samples increases, but with a little more fluctuation. Meanwhile, the estimate of slope b is still roughly constant at around 2.
Here with the exponent b=2 fixed, the possible relationship between the estimate of the intercept (namely d) in equation and the temporal block size A is also examined. The estimated intercepts of the Wenchuan sequence as A increases from 4 to 100 d in 1 d increments are shown in Fig. 6. At the same time, a logarithm function and an exponential function are employed respectively to fit the data (i.e., and , where α, β, m, and n are constants), and the results show that the logarithm function has a higher goodness of fit (namely a lower residual sum of squares). The estimate of parameter α is equal to 0.7398, with a 95 % CI (0.7246, 0.7581), and the estimate of parameter β is equal to 0.9121, with a 95 % CI (0.9004, 0.9229). Because , we will have the following:
This shows that the variance of energy releases from aftershocks depends on two factors: (i) the squared mean and (ii) the size of the temporal block. Up to now, we confirm that the mean–variance relationship of energy releases from an earthquake sequence can be quantified, although the accurate prediction of the time and location of an imminent event is still not attainable.
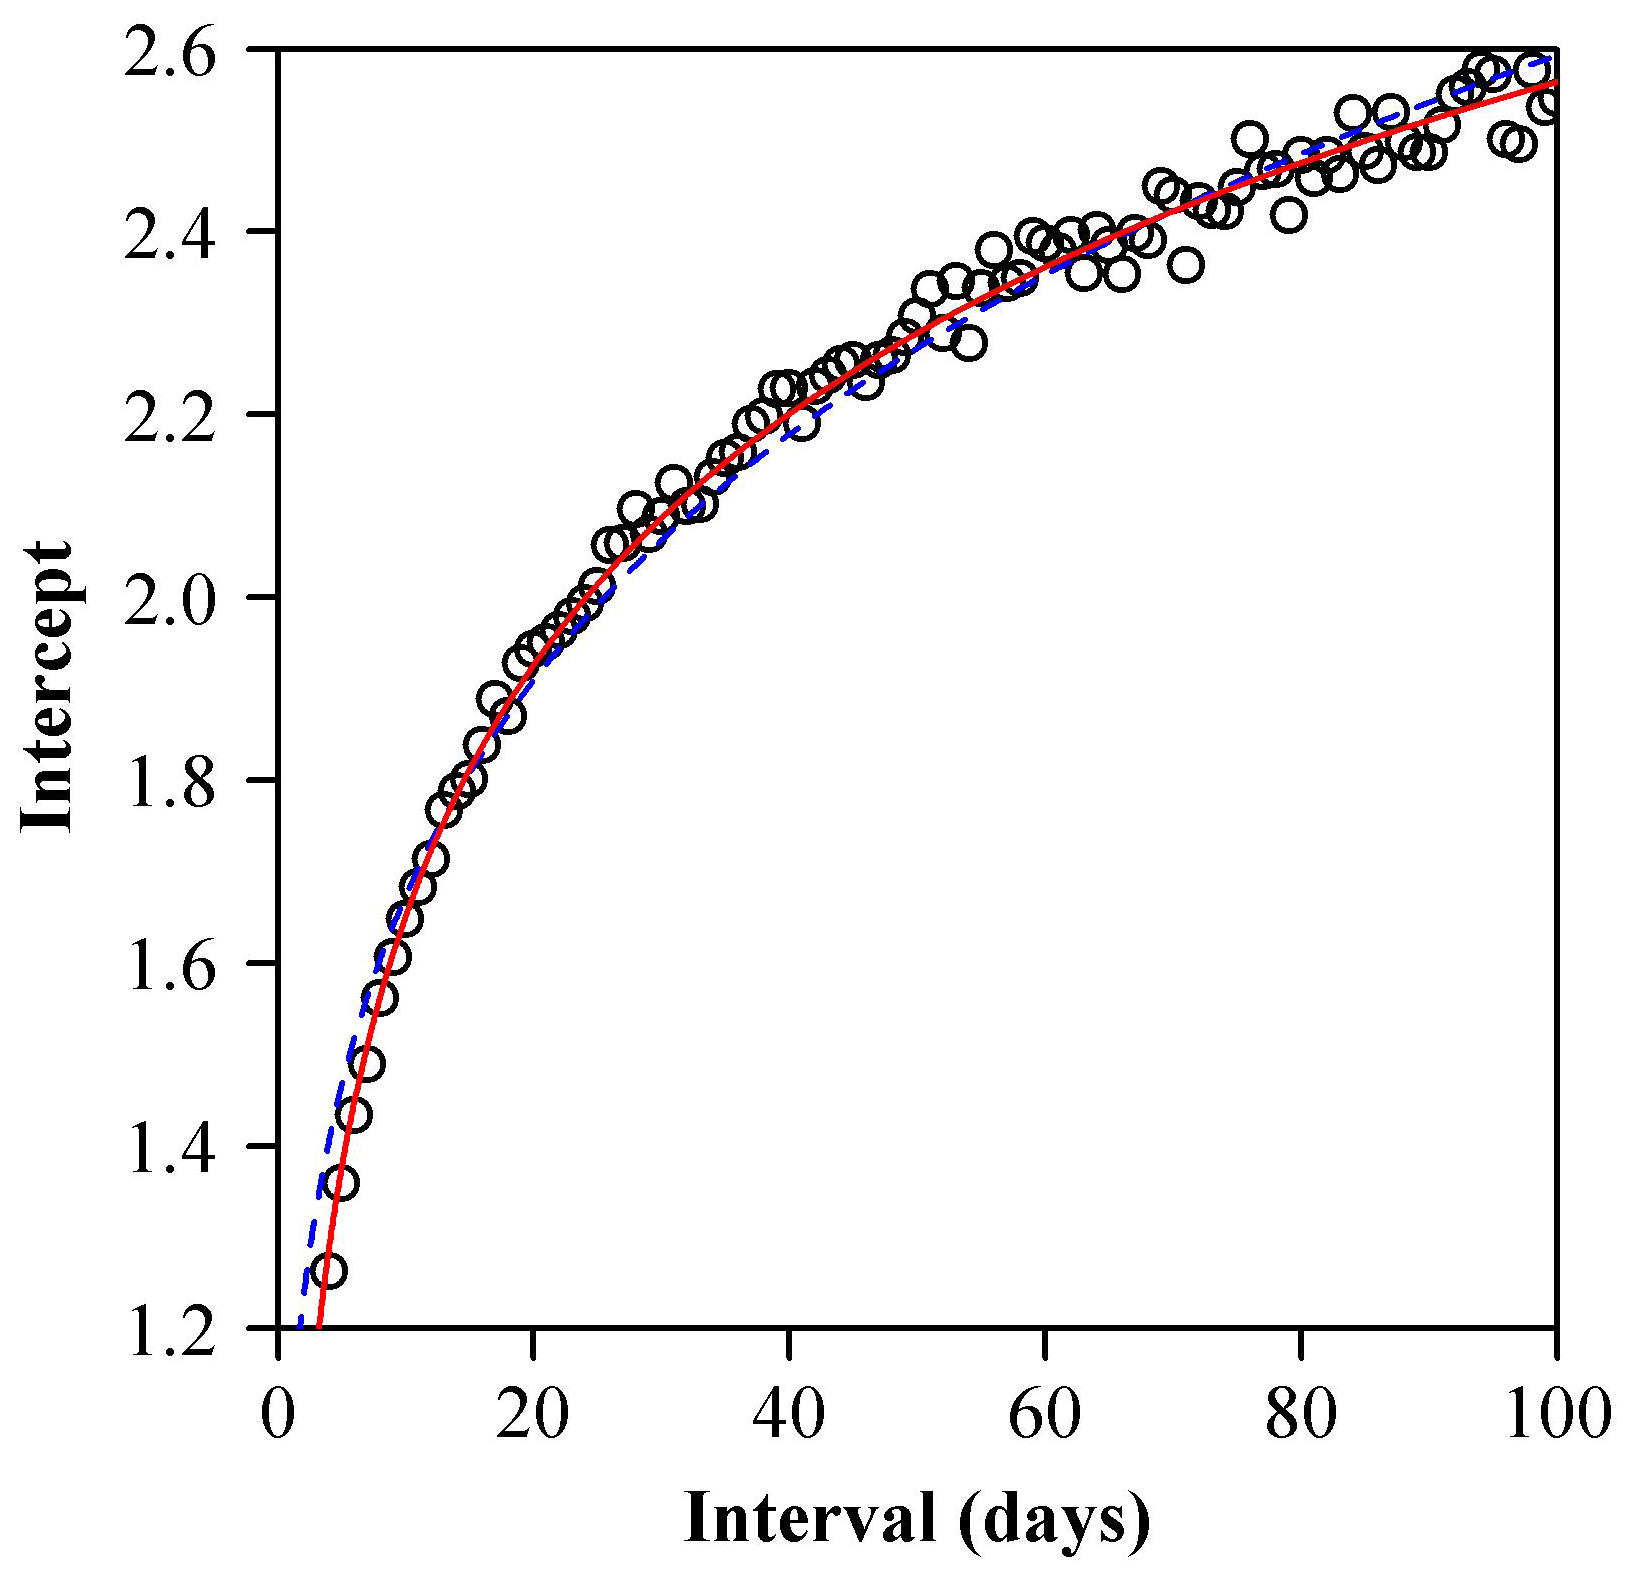
Figure 6The effect of time division (time span) on the estimate of the intercept in TPL with a fixed exponent of 2, i.e. , where d denotes the intercept. Two equations were used to fit the data ( and , where α, β, m, and n are constants). The residual sum of squares (=0.0535) using the logarithm function (represented by the red curve) is lower than that (=0.1460) using the exponential function (represented by the blue curve).
The evolutionary process of a large earthquake is characterized by some complex features from stochastic to chaotic or pseudo-periodic dynamics (McCaffrey, 2011). On the one hand, there is a long-term slow strain of accumulation and culmination of rocks in the rigid lithosphere prior to the event, with a sudden rupture and displacement of blocks. On the other hand, there is another long-term slow strain of redistribution and energy release with a large number of aftershock occurrences in an extensive area, which generally lasts for several months, sometimes even years, after the mainshock.
It has been statistically established that in populations, if individuals distribute randomly and are independent of each other, then the variance is equal to the mean, i.e., σ2=μ; individuals show mutual attraction if the variance is proportional to the mean to a power more than 1, and individuals mutually repel each other if the variance is proportional to the mean to a power less than 1 (Taylor, 1961; Horne and Schneider, 1995). The results obtained in this study show that the exponent of TPL is around 2 in the Wenchuan energy sequence, either with a different time span d or with a fixed time span A=10 d, but for nine time stages between 2008 and 2016. This means that earthquakes in the Wenchuan sequence are not distributed at random and independent of each other but have a mutual attraction. It also indicates that there are possible interactions among different magnitudes in the earthquake sequence. Cohen and Xu (2015) showed analytically that observations randomly sampled in blocks from any single skewed frequency distribution with four finite moments give rise to TPL because the covariance of the sample mean and the sample variance is proportional to the skewness of the underlying distribution.
There are various types of interpretations for the value of parameter b. Ballantyne and Kerkhoff (2007) suggested that individuals' reproductive correlation determines the size of b, while Kilpatrick and Ives (2003) proposed that inter-specific competition could reduce the value of b. Above all, empirically, b usually lies between 1 and 2 (Maurer and Taper, 2002). However, it is expected that TPL holds with b=2 exactly in a population with a constant coefficient of variation (CV) of population density. This expectation is derived from the well-known relationship: SD (standard deviation) equals the square root of variance (σ2), i.e., SD=σ, and the coefficient of variation CV = SD, here k, is a constant. Then we can obtain σ2=(kμ)2. The relationship between log 10(σ2) and log 10(kμ) is a straight line with a slope of 2 on a log–log scale.
It is well established that there is a specific property on the population either in space or in time when b equals 2. Ballantyne (2005) proposed that b=2 is a consequence of deterministic population growth, while Cohen (2013) showed that b=2 arose from exponentially growing, noninteracting clones. Furthermore, using the Lewontin–Cohen (LC) model of stochastic population dynamics, Cohen et al. (2013) provided an explicit, exact interpretation of its parameters of TPL. They proposed that the exponent of TPL will be equal to 2 if and only if the LC model is deterministic; it will be greater than 2 if the model is supercritical (growing on average) and will be less than 2 if the model is subcritical (declining on average). This property indicates that parameter b=2 in our investigation on the Wenchuan earthquake sequence depends exactly on its specific distribution of aftershocks. In other words, the law of occurrence of all events or energy release in space and time is deterministic following the mainshock on 12 May 2008.
Although various empirical confirmations suggest that no specific biological, physical, technological, or behavioral mechanism can explain all instances of TPL, there has been some improvement in understanding the distribution and duration time of aftershocks after the main event. Jiang et al. (2008) studied the Wenchuan earthquake sequence using the Gutenberg–Richter law (Gutenberg and Richter, 1956) and Omori's law (Omori, 1894). Their investigation attained a specific relationship between the magnitude and the total number of earthquakes for a stable b value, which indicates that the frequency of aftershocks decreases roughly with the reciprocal of time after the mainshock. One of the models with physical parameters is the stress-triggering mechanism put forward by Dieterich (1994) with Dieterich and Kilgore (1996). Shen et al. (2013) achieved a good fit between the observed Wenchuan aftershocks and the analytic solution of the modified Dieterich model. Their results suggested that the generation of earthquakes is actually related to the state of the fault and can quantitatively describe the temporal evolution of the aftershock decay. In this sense, the Wenchuan energy sequence satisfies TPL with the slope b=2, indicating a stable spatio-temporal dependent energy release caused by regional stress adjustment and redistribution during the fault revolution after the mainshock. These results are of high coherence with what has been attained by Christensen et al. (2002), who proposed a unified scaling law linking the Gutenberg–Richter law, Omori's law of aftershocks, and the fractal dimensions of the faults. Their results show that a nonzero driving force in the crust of the Earth leads to an earthquake as a sequence of hierarchical correlated processes, and this mechanism, responsible for small events, is also responsible for large events. In other words, a mainshock and an aftershock are consequences of the same process.
It is possible that there are some interactions among earthquakes with different magnitudes in an earthquake sequence. This kind of interaction is probably derived from the medium-stress state of the focus zone where earthquakes happen. The stress field in the aftershock area is in a rapidly adjusting state when a lager earthquake has occurred. It is probable that a light stress adjustment caused by a small earthquake most likely induces an obvious event in its surroundings in the near future. This process can lead to aggregation of aftershocks in space and time in extensive areas, causing TPL to hold for the Wenchuan earthquake energy sequence. However, whether TPL accords with all earthquake sequences and complies with specific parameters, e.g., b=2, needs further investigation. Up to now, one thing we can confirm is that the missing events can lead to the exponent in TPL increase. For example, the estimated b is approximately 2.1 to 2.2 if only the events with magnitude M > 1.0 are used. It indicates that missing events can change the state of energy release from a stable (deterministic) state to an unstable (supercritical) state, as Cohen et al. (2013) proposed.
The current study shows that the exponents of TPL for different temporal blocks for the Wenchuan earthquake sequence are approximately equal to 2 universally. The estimated intercept could be expressed as a linear equation of the log transformation of temporal block A (Fig. 6). The goodness of fit of the nonlinear regression is fairly high (R2=0.9940 in Fig. 6), indicating some interesting underlying mechanism leading to the occurrence of the aftershocks. The distribution of the energy releases from aftershocks should be a right-skewed unimodal curve that can be reflected by magnitude frequency distribution as shown in Fig. 1. In fact, Cohen and Xu (2015) have demonstrated that the correlated sampling variation of the mean and variance of skewed distributions could account for TPL under random sampling and the estimated exponent of TPL was proportional to the skewness of the distribution curve. For an exponential distribution, the variance equals its mean squared. However, in our study, although the variance of energy releases from aftershocks is similarly proportional to its mean squared, the coefficient of proportionality (i.e., a in Eq. 1) does rely on the size of the temporal block. This means that the energy releases from aftershocks might follow a temporal block-dependent generalized exponential distribution, which should be more complex than the generalized exponential distribution (Gupta and Kundu, 2007). However, the distribution function for the energy releases from aftershocks has not been well defined so far. The existing functions for describing a skewed distribution of energy releases or magnitudes usually belong to pure statistical models that lack a clear physical dynamic mechanism. Our study suggests that further studies should focus on a temporal block-dependent or a sub-region-dependent distribution. However, providing a clear mathematical expression for this distribution function is beyond the scope of this paper. It deserves further investigation.
In summary, we attempt to use a new way of investigating a spatio-temporal distribution property of aftershocks of the Wenchuan earthquake sequence during 2008–2016. In terms of the energy release, the variance of samples in the earthquake population is shown to have a simple power-law relationship as a function of the mean on different timescales, which gives rise to a TPL, i.e., σ2=aμb, with b=2. On the one hand, the results show that the intercept of the fitted line in the linear form on a log–log scale increases with the number of samples, and it is reconfirmed that parameter c (namely log 10(a)) predominantly depends on the size of the sampling units (Taylor, 1961). On the other hand, if TPL holds, the estimated values of parameters a and b support the conclusion that the Wenchuan aftershocks mutually trigger each other and distribute in space and time not randomly but determinately and definitely. We fix the exponent of TPL to be 2 and check the effects of different time divisions on the estimate of the intercept. The results show that the intercept acts as a logarithm function of the timescale. This implies that the mean–variance relationship of energy releases from the earthquakes can be predicted even though we cannot accurately predict the time and location of imminent events.
The data that can be publicly accessed are described within the text. The corresponding author, Mei Li, would like to provide the data on request of the readers who are interested in reanalyzing them but cannot successfully download them.
The supplement related to this article is available online at: https://doi.org/10.5194/nhess-19-1119-2019-supplement.
PS, ML, and YL analyzed the data. ML and YL wrote the paper. PS and JL further revised the paper. HS collected the data of the Wenchuan earthquake sequence. TX and CY drew the figures. All authors read and commented on the paper.
The authors declare that they have no conflict of interest.
We thank Joel E. Cohen for providing valuable help during the preparation of this work. We are also thankful to the editor and three reviewers for their productive comments. The work has been funded from the NSFC (National Natural Science Foundation of China) under grant no. 41774084 and National Key R&D Program of China under grant no. 2018YFC1503506. Peijian Shi was supported by the Priority Academic Program Development of Jiangsu Higher Education institutions.
This paper was edited by Oded Katz and reviewed by Pedro Puig and two anonymous referees.
Ballantyne IV, F.: The upper limit for the exponent of Taylor's power law is a consequence of deterministic population growth, Evol. Ecol. Res., 7, 1213–1220, 2005.
Ballantyne IV, F. and Kerkhoff, A. J.: The observed range for temporal mean–variance scaling exponents can be explained by reproductive correlation, Oikos, 116, 174–180, https://doi.org/10.1111/j.2006.0030-1299.15383.x, 2007.
Burchfiel, B. C., Royden, L. H., van der Hilst, R. D., Hager, B. H., Chen, Z., King, R. W., Li, C., Lu, J., Yao, H., and Kirby, E.: A geological and geophysical context for the Wenchuan earthquake of 12 May 2008, Sichuan, People's Republic of China, GSA Today, 18, 4–11, https://doi.org/10.1130/GSATG18A.1, 2008.
Chen, Y., Xu, L., Zhang, Y., Du, H., Feng, W., Liu, C., and Li, C.: Report on source characteristics of the larger Wenchuan earthquake source on 12 May 2008, available at: http://www.csi.ac.cn/Sichuan/chenyuntai.pdf, last access: 30 June 2017, 2008. (In Chinese with English abstract)
Christensen, K., Danon, L., Scanlon, T., and Bak, P.: Unified scaling law for earthquakes, P. Natl. Acad. Sci. USA, 99, 2509–2513, https://doi.org/10.1073/pnas.012581099, 2002.
Cohen, J. E.: Taylor's power law of fluctuation scaling and the growth–rate theorem, Theor. Popul. Biol., 88, 94–100, https://doi.org/10.1016/j.tpb.2013.04.002, 2013.
Cohen, J. E., and Xu, M.: Random sampling of skewed distributions implies Taylor's power law of fluctuation scaling, P. Natl. Acad. Sci. USA, 112, 7749–7754, https://doi.org/10.1073/pnas.1503824112, 2015.
Cohen, J. E., Xu, M., and Schuster, W. S. F.: Stochastic multiplicative population growth predicts and interprets Taylor's power law of fluctuation scaling, Proc. R. Soc. B. Biol. Sci., 280, 20122955, https://doi.org/10.1098/rspb.2012.2955, 2013.
Console, R., Jackson, D. D., and Kagan, Y. Y.: Using the ETAS model for catalog declustering and seismic background assessment, Pure Appl. Geophys., 167, 819–830, https://doi.org/10.1007/s00024-010-0065-5, 2010.
Dieterich, J. H.: A constitutive law for rate of earthquake production and its application to earthquake clustering, J. Geophys. Res., 99, 2601–2618, https://doi.org/10.1029/93JB02581, 1994.
Dieterich, J. H. and Kilgore, B.: Implications of fault constitutive properties for earthquake prediction, P. Natl. Acad. Sci. USA, 93, 3787–3794, 1996.
Eisler, Z., Bartos, I., and Kertész, J.: Fluctuation scaling in complex systems: Taylor's law and beyond, Adv. Phys., 57, 89–142, https://doi.org/10.1080/00018730801893043, 2008.
Gupta, R. D. and Kundu, D.: Generalized exponential distribution: Existing results and some recent developments, J. Stat. Plan. Infer., 137, 3537–3547, https://doi.org/10.1016/j.jspi.2007.03.030, 2007.
Gutenberg, B. and Richter, C. F.: Magnitude and energy of earthquakes, Annali di Geofisica, 9, 1–15, 1956.
Harris, R. A.: Introduction to special section: stress triggers, stress shadows, and implications for seismic hazard, J. Geophys. Res., 103, 24347–24358, https://doi.org/10.1029/98JB01576, 1998.
Horne, J. K. and Schneider, D. C.: Spatial variance in ecology, Oikos, 74, 18–26, 1995.
Jiang, H. K., Li, M. X., Wu, Q., and Song, J.: Features of the May 12 M 8.0 Wenchuan earthquake sequence and discussion on relevant problems, Seismol. Geol., 30, 746–758, 2008. (In Chinese with English abstract)
Kendal, W. S.: A frequency distribution for the number of hematogenous organ metastases, J. Theor. Biol., 217, 203–218, https://doi.org/10.1006/jtbi.2002.3021, 2002.
Kilpatrick, A. M. and Ives, A. R.: Species interactions can explain Taylor's power law for ecological time series, Nature, 422, 65–68, 2003.
Kumazawa, T. and Ogata, Y.: Quantitative description of induced seismic activity before and after 2011 Tohoku Oki–earthquake by nonstationary ETAS models, J. Geophys. Res., 118, 6165–6182, https://doi.org/10.1002/2013JB010259, 2013.
Lin, S., Shao, L., Hui, C., Sandhu, H. S., Fan, T., Zhang, L., Li, F., Ding, Y., and Shi, P.: The effect of temperature on the developmental rates of seedling emergence and leaf-unfolding in two dwarf bamboo species, Trees Struct. Funct., 32, 751–763, https://doi.org/10.1007/s00468-018-1669-0, 2018.
Maurer, B. A. and Taper, M. L.: Connecting geographical distributions with population processes, Ecol. Lett., 5, 223–231, https://doi.org/10.1046/j.1461-0248.2002.00308.x, 2002.
McCaffrey, R.: Earthquakes and crustal deformation, in: Encyclopedia of Solid Earth Geophysics, edited by: Gupta, H. K., Springer, Dordrecht, 218–225, 2011.
Ogata, Y.: Statistical models for earthquake occurrences and residual analysis for point processes, J. Am. Stat. Assoc., 83, 9–27, 1988.
Ogata, Y.: Statistical model for standard seismicity and detection of anomalies by residual analysis, Tectonophysics, 169, 159–174, https://doi.org/10.1016/0040-1951(89)90191-1, 1989.
Ogata, Y.: Seismicity analysis through point–process modeling: A review, Pure Appl. Geophys., 155, 471–507, https://doi.org/10.1007/s000240050275, 1999.
Omori, F.: On the aftershocks of earthquakes, J. College Sci., Imperial University, Tokyo, 7, 111–200, 1894.
Robinson, R. and Zhou, S.: Stress interactions within the Tangshan, China, earthquake sequence of 1976, Bull. Seism. Soc. Amer., 95, 2501–2505, https://doi.org/10.1785/0120050091, 2005.
Shen, W. H., Liu, B. Y., and Shi, B. P.: Triggering mechanism of aftershocks triggered by Wenchuan MW 7.9 earthquake, Acta Seismologica Sinica, 35, 461–476, 2013. (In Chinese with English abstract)
Shi, P. J., Sandhu, H. S., and Reddy, G. V. P.: Dispersal distance determines the exponent of the spatial Taylor's power law, Ecol. Model., 335, 48–53, https://doi.org/10.1016/j.ecolmodel.2016.05.008, 2016.
Shi, P. J., Ratkowsky, D. A., Wang, N. T., Li, Y., Reddy, G. V. P., Zhao, L., and Li, B. L.: Comparison of five methods for parameter estimation under Taylor's power law, Ecol. Compl., 32, 121–130, https://doi.org/10.1016/j.ecocom.2017.10.006, 2017.
Stein, R. S.: The role of stress transfer in earthquake occurrence, Nature, 402, 605–609, 1999.
Taylor, L. R.: Aggregation, variance and the mean, Nature, 189, 732–735, 1961.
Taylor, L. R.: Assessing and interpreting the spatial distributions of insect populations, Annu. Rew. Entomol., 29, 321–357, https://doi.org/10.1146/annurev.en.29.010184.001541, 1984.
Utsu, T.: Aftershocks and earthquake statistics (1): some parameters which characterize an aftershock sequence and their interrelations, Journal of the Faculty of Science Hokkaido University, 3, 129–195, 1969.
Utsu, T., Ogata, Y., and Matsu'ura, R. S.: The centenary of the Omori formula for a decay law of aftershock activity, J. Phys. Earth, 43, 1–33, https://doi.org/10.4294/jpe1952.43.1, 1995.
Vere-Jones, D., Ben-Zion, Y., and Zúñiga, R.: Statistical seismology, Pure Appl. Geophys., 162, 1023–1026, https://doi.org/10.1007/s00024-004-2659-2, 2005.
Xu, G. M. and Zhou, H. L.: Principle of Earthquake, Science Publication House, Beijing, 325–352, 1982.