the Creative Commons Attribution 4.0 License.
the Creative Commons Attribution 4.0 License.
A study of earthquake recurrence based on a one-body spring-slider model in the presence of thermal-pressurized slip-weakening friction and viscosity
Jeen-Hwa Wang
Earthquake recurrence is studied from the temporal variation in slip through numerical simulations based on the normalized form of equation of motion of a one-body spring-slider model with thermal-pressurized slip-weakening friction and viscosity. The wear process, whose effect is included in the friction law, is also taken into account in this study. The main parameters are the normalized characteristic displacement, Uc, of the friction law and the normalized damping coefficient (to represent viscosity), η. TR, D, and τD are the recurrence time of events, the final slip of an event, and the duration time of an event, respectively. Simulation results show that TR increases when Uc decreases or η increases, D and τD decrease with increasing η, and τD increases with Uc. The time- and slip-predictable model can describe the temporal variation in cumulative slip. When the wear process is considered, the thickness of slip zone, h, which depends on the cumulated slip, S(t) = ∑D(t), i.e., h(t) = CS(t) (C is a dimensionless increasing rate of h with S), is an important parameter influencing TR and D. Uc is a function of h and thus depends on cumulated normalized slip, ∑U, with an increasing rate of C. In the computational time period, the wear process influences the recurrence of events and such an effect increases with C when C > 0.0001. When viscosity is present, the effect due to wear process becomes stronger. Both TR and D decrease when the fault becomes more mature, thus suggesting that it is more difficult to produce large earthquakes along a fault when it becomes more mature. Neither the time-predictable nor the slip-predictable model can describe the temporal variation in cumulative slip of earthquakes under the wear process with large C.
- Article
(5840 KB) - Full-text XML
- BibTeX
- EndNote
Earthquake recurrence that is relevant to the physics of faulting is an important factor in seismic hazard assessment. It is related to the seismic cycle, which represents the occurrence of several earthquakes in the same segment of a fault during a time period. Figure 1 exhibits the general pattern of time variation in slip and particle velocity during a seismic cycle. In the figure, TR is the recurrence (also denoted by repeat or inter-event) time of two events in a seismic cycle, τD is the duration time of slip of an event, D is the final slip of an event, and Vm is the peak value of particle velocity of an event. The four parameters could be constants in the time history when all model parameters do not vary with time and could also vary with time, represented by TR(t), τD(t), D(t), and Vm(t), when one of model parameters does vary with time. Sykes and Quittmeyer (1981) pointed out that the major factors in controlling TR are the plate moving speed and the geometry of the rupture zone. Based on Reid's elastic rebound theory (Reid, 1910), Schwartz and Coppersmith (1984) assumed that an earthquake occurs when the tectonic shear stress on a fault is higher than a critical level, which is dependent on the physical conditions of the fault and the loading by regional tectonics. Since in their work a fault has a homogeneous distribution of physical properties under constant tectonic loading, earthquakes could happen regularly.
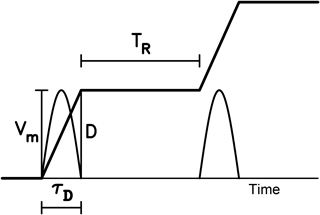
Figure 1A general pattern of time variations in slip (thick solid line) and particle velocity (thin solid curve) during a seismic cycle: TR is the recurrence time or the inter-event time of two events in a seismic cycle; τD is the duration time of slip of an event; D is the final slip of an event; and Vm is the peak particle velocity of an event.
Some observations exhibit periodicity for different size earthquakes. Bakun and McEvilly (1979) obtained TR ≈ 23 ± 9 years for M ≈ 6 earthquakes at the Parkfield segment of the San Andreas fault, USA since 1857. Sykes and Menke (2006) estimated TR ≈ 100 years for M ≥ 8 earthquakes in the Nankaido segments of the Nankai Trough, Japan. Okada et al. (2003) gained TR = 5.5 ± 0.7 years for earthquakes with M = 4.8 ± 0.1 off Kamaishi, Japan, since 1957. Nadeau and Johnson (1998) inferred an empirical relation between TR and seismic moment, Mo: TR ∝ . To make this relation valid, the stress drop, Δσ, or the long-term slip velocity of a fault, vl, must be in terms of Mo. Based on three data set from eastern Taiwan, Parkfield, USA, and northeastern Japan, Chen et al. (2007) inferred TR ∼ . Beeler et al. (2001) proposed a theoretical relation: TR = , where μ is the rigidity of the fault-zone materials.
However, the main factors in influencing earthquake occurrences commonly are spatially heterogeneous and also vary with time. Thus, the recurrence times of earthquakes, especially large events, are not constant inferred either from observations (Ando, 1975; Sieh, 1981; Kanamori and Allen, 1986; Wang and Kuo, 1998; Wang, 2005; Sieh et al., 2008) or from modeling (Wang, 1995, 1996; Ward, 1996, 2000; Wang and Hwang, 2001). Kanamori and Allen (1986) observed that faults with longer TR are stronger than those with shorter TR. Davies et al. (1989) proposed that the longer it has been since the last earthquake, the longer the expected time until the next. Wang and Kuo (1998) observed that for M ≥ 7 earthquakes in Taiwan TR strongly follows the Poissonian processes. Enescu et al. (2008) found that the probability density distribution of TR can be described by an exponential function. From the estimated values of TR of earthquakes happened on the Chelungpu fault in central Taiwan from trenching data, Wang (2005) found that the earthquakes occurred non-periodically.
In order to interpret earthquake recurrences, Shimazaki and Nakata (1980) proposed three simple phenomenological models. Each model has a constantly increasing tectonic stress that is controlled by a critical stress level, σc, for failure and a base stress level, σb. The three models are (1) the perfectly periodic model (with constant σc, σb, and Δσ); (2) the time-predictable model (with constant σc, variable σb, and variable Δσ); and (3) the slip-predictable model (with variable σc, constant σb, and variable Δσ). For the first model, both TR and D of next earthquake can be predicted from the values of TR or D of previous ones. For the second model, TR of next earthquake can be predicted from the values of D of previous ones. For the third model, D of next earthquake can be predicted from the values of TR of previous ones. However, debates about the three models have been made for a long time. Some examples are given below. Ando (1975) suggested that the second model worked for post-1707 events but not for pre-1707 ones in the Nankai Trough, Japan. Wang (2005) assumed that the second model could describe the earthquakes occurred on the Chelungpu fault, Taiwan, in the past 1900 years. For the Parkfield earthquake sequence, Bakun and McEvilly (1984) took different models, while Murray and Segall (2002) considered the failure of the second model. From laboratory results, Rubinstein et al. (2012) assumed the failure of the time- and slip-predictable models for earthquakes.
Some models, for instance the crack model and dynamical spring-slider model, have been developed for fault dynamics, even though the seismologists have not a comprehensive model. There are several factors in controlling fault dynamics and earthquake ruptures (see Bizzarri, 2009; Wang, 2017b). Among the factors, friction (Nur, 1978; Belardinelli and Belardinelli, 1996) and viscosity (Jeffreys, 1942; Spray, 1993; Wang, 2007) are two significant ones.
Modeling earthquake recurrence based on different models has been long made and is reviewed by Bizzarri (2012a, b) and Franović et al. (2016). Among the models, the spring-slider model has been used to study fault dynamics and earthquake physics (see Wang, 2008). Burridge and Knopoff (1967) proposed the one-dimensional N-body model (abbreviated as the 1-D BK model henceforth). Wang (2000, 2012) extended the 1-D model to 2-D one. The one-, two-, three-, and few-body models with various friction laws have also been applied to approach fault dynamics (see Turcotte, 1992). The studies for various friction laws based on spring-slider models are briefly described below: (1) for rate- and state-dependent friction (e.g., Rice and Tse, 1986; Ryabov and Ito, 2001; Erickson et al., 2008, 2011; He et al., 2003; Mitsui and Hirahara, 2009; Bizzarri, 2012a; Abe and Kato, 2013; Kostić et al., 2013a; Bizzarri and Crupi, 2014; Franović et al., 2016); (2) for velocity-weakening friction (e.g., Carlson and Langer, 1989; Huang and Turcotte, 1992; Brun and Gomez, 1994; Wang and Hwang, 2001; Wang, 2003; Kostić et al., 2013b); (3) for simple static–dynamic friction (e.g., Abaimov et al., 2007; Hasumi, 2007).
Some results concerning earthquake recurrence are simply explained below. Erickson et al. (2008) suggested that aperiodicity in earthquake dynamics is due to either the nonlinear friction law (Huang and Turcotte, 1990) or the heterogeneous stress distribution (Lapusta and Rice, 2003). Wang and Hwang (2001) emphasized the importance of heterogeneous frictional strengths. Mitsui and Hirahara (2009) pointed out the effect of thermal pressurization. Dragoni and Piombo (2011) found that variable strain rate causes aperiodicity of earthquakes. Bizzarri and Crupi (2014) found that TR is dependent on the loading rate, effective normal stress, and characteristic distance of the rate- and state-dependent friction law.
As mentioned previously, numerous studies have been made for exploring the frictional effect on earthquake recurrence. However, studies concerning the viscous effect on earthquake recurrence are rare. In the following, we will investigate the effects of slip-weakening friction due to thermal-pressurization and viscosity on earthquake recurrence based on the one-body spring-slider model.
Figure 2 displays the one-body spring-slider model. In the model, m, K, σn, F, η, u, v (= du∕dt), vp, and uo = vpt denote, respectively, the mass of the slider, the stiffness (or spring constant) of the leaf spring, the normal stress, the frictional force between the slider and the moving plate, the damping coefficient (to represent viscosity as explained below), the displacement of the slider, the velocity of the slider, the plate moving speed, and the equilibrium location of the slider. The frictional force F (with the static value of Fo) is usually a function of u or v. Viscosity results in the viscous force, Φ, between the slider and the moving plate, and Φ is in terms of v. A driving force, Kvpt, caused by the moving plate through the leaf spring pulls the slider to move. The equation of motion of the model is
When Kvpt ≥ Fo, F changes from static frictional force to dynamic one and thus makes the slider move. Among the physical models to approach earthquake faults, the single spring-slider model, which can represent a single fault, is actually the simplest one. However, based on this simple model in the presence of thermal-pressurized friction and viscosity we can obtain good simulations of earthquake recurrences along a single fault. Results can exhibit the frictional and viscous effects on earthquake recurrence.
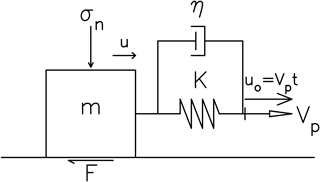
Figure 2One-body spring-slider model. In the figure, t, m, K, η, Vp, σn, F, u, and uo denote, respectively, the time, the mass of the slider, the spring constant, the damping coefficient, the driving velocity, the normal stress, the frictional force, displacement of the slider, and the equilibrium location of the slider (after Wang, 2016).
The frictional force F(u, v) is controlled by several factors (see Wang, 2016, and cited references therein). An effect combined from temperature and fluids in a fault zone can result in thermal pressurization (abbreviated as TP hereafter) which would yield a shear stress (resistance) on the fault plane (Sibson, 1973; Lachenbruch, 1980; Rice, 2006; Wang, 2009, 2011, 2016, 2017a–c; Bizzarri, 2009). Rice (2006) proposed two end-member models of TP, i.e., the adiabatic undrained deformation (AUD) model and slip-on-a-plane (SOP) model. Since the characteristic distance of the SOP model cannot be associated with the wear process, the SOP model is not used in this study. The AUD model is related to a homogeneous simple strain ε at a constant normal stress σn on a spatial scale of the sheared layer. Its shear stress–slip function, τ(u), is τ(u) = μf(σn − ) (Rice, 2006), which decreases exponentially with increasing u. The characteristic displacement is uc = ρfCvh∕μfΛ, where ρf, Cv, h, μf, and Λ are, respectively, the fluid density, heat capacity (in J ∘C−1 kg−1), the thickness, frictional strength, and the undrained pressurization factor of the fault zone. The parameter Λ is (λf − λn)∕(βf + βn), where βf is isothermal compressibility of the pore fluid, βn is isothermal compressibility of the pore space, λf is isobaric volumetric thermal expansion coefficient for the pore fluid, and λn is isobaric volumetric thermal expansion coefficient for the pore space.
Based on the AUD model, Wang (2009, 2016, 2017a–c) took a simplified slip-weakening friction law (denoted by the TP law hereafter):
The value of F(u) at u = 0 is Fo, i.e., the static friction force. An example of the plot of F(u) versus u for five values of uc, i.e., 0.1, 0.3, 0.5, 0.7, and 0.9 m when Fo = 1N m−2, which are taken from Wang (2016), is displayed in Fig. 3. F(u) decreases with increasing u and its decreasing rate, γ, decreases with increasing uc. The force drop is lower for larger uc than for smaller uc for the same final slip. When u ≪ uc, ≈ 1 − u∕uc, thus indicating that is almost γ at small u. This TP law is used in this study.
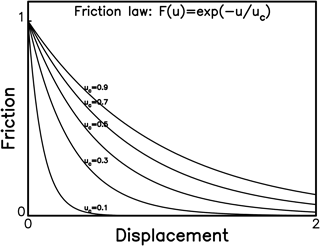
Figure 3The plots of F(u) = ) versus u when uc = 0.1, 0.3, 0.5, 0.7, and 0.9 m when Fo = 1N m−2 (after Wang, 2016).
A detailed description about viscosity and the viscous force Φ(v) can be found in Wang (2016), and only a brief explanation is given below. Jeffreys (1942) first and then numerous authors (Byerlee, 1968; Turcotte and Schubert, 1982; Scholz, 1990; Rice et al., 2001; Wang, 2016) emphasized the viscous effect on faulting due to frictional melts. The viscosity coefficient, υ, of rocks is influenced by T (see Turcotte and Schubert, 1982; Wang, 2011). Spray (2005, and cited references therein) observed a decrease in υ with increasing T. He also stressed that frictional melts with low υ could produce a large volume of melting, thus reducing the effective normal stress. This behaves like fault lubricants during seismic slip.
The physical models of viscosity can be found in several articles (e.g., Cohen, 1979; Hudson, 1980). The stress–strain relationship is σ = Eε, where σ and E are, respectively, the stress and the elastic modulus for an elastic body; and σ = υ(dε∕dt), where υ is the viscosity coefficient for a viscous body. Two simple models with a viscous damper and an elastic spring are often used to describe the viscous materials. A viscous damper and an elastic spring are connected in series, leading to the Maxwell model, and in parallel, resulting in the Kelvin–Voigt model (or the Voigt model). According to Hudson (1980), Wang (2016) proposed that the latter is more suitable than the former for seismological problems and thus the Kelvin–Voigt model, whose constitution law is σ(t) = Eε(t) + υdε(t)∕dt, is taken here and displayed in Fig. 2. The viscous stress is υv.
In order to investigate the viscous effect in a dynamical system, Wang (2016) defined the damping coefficient, η, based on the phenomenon that an oscillating body damps in viscous fluids. According to Stokes' law, η = 6πRυ for a sphere of radius R in a viscous fluid of υ (see Kittel et al., 1968). Hence, the viscous force in Eq. (1) is represented by Φ = ηv. Note that the unit of η is N(m/s)−1. Since υ decreases with increasing T, η decreases with increasing T. Hence, η can vary with time during faulting. This point has been studied by Wang (2017b) for the generation of nuclear phase before an earthquake ruptures. In this study, constant η is considered for each case.
Some authors (Knopoff et al., 1973; Cohen, 1979; Rice, 1993; Xu and Knopoff, 1994; Knopoff and Ni, 2001; Bizzarri, 2012a; Dragoni and Santini, 2015) considered that viscosity plays a role on causing seismic radiation to release strain energy during faulting.
Putting Eq. (2) and Φ = ηv into Eq. (1) leads to
Equation (3) is normalized for easy numerical computations based on the normalization parameters, which is dimensionless: Do = Fo∕K, ωo = , τ = ωot, U = u∕Do, and Uc = uc∕Do. The normalized velocity, acceleration, and driving velocity are V = dU∕dτ = du∕dt, A = d2U∕dτ2 = d2u∕dt2, and Vp = vp∕(Doωo), respectively. Ω = ω∕ωo is defined as the dimensionless angular frequency, and thus the phase ωt becomes Ωτ. For the purpose of simplification, is denoted by η below. Substituting all normalization parameters into Eq. (3) leads to
In order to numerically solve Eq. (4), we define two new parameters, i.e., y1 = U and y2 = dU∕dτ. Equation (4) can be rewritten as two first-order differential equations:
We can numerically solve Eq. (5) by using the fourth-order Runge–Kutta method (Press et al., 1986). In general, the values of Do are several meters and ωo are in the range of 0.1 Hz to few Hz (see Wang, 2016). This leads to that Doωo has an order of magnitude of 1 m s−1. The value of Vp must be much smaller than 1 because of vp ≈ 10−10 m s−1. Since the value of Vp mainly influences the recurrence time, TR, between two events and can only make a very small influence on the pattern of time variations in velocities and displacements of events. In order to study long-term earthquake recurrence, there must be numerous modeled events with clear and visualized time functions of displacements and velocities for an event in the computational time period. If Vp = 10−10 is considered, TR is very long and thus τD is much shorter than TR. This makes the time function of an event displayed in the long-term temporal variation in slip looks like just a step function for the displacements and an impulse for the velocities. Hence, in order to get fine visualization a larger value of Vp is necessary. The value of Vpτ is usually very small during an event and cannot influence the rupture because of a very tiny value of Vp. Numerical test shows that when Vp > 10−2, the value of Vpτ is not small during an event and can influence the rupture. Hence, Vp = 10−2 is taken in this study. The backward slip is not allowed in the simulations because of common behavior of forward earthquake ruptures.
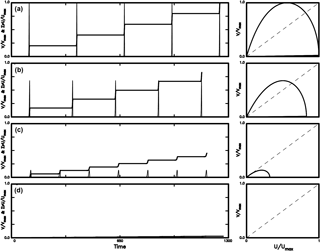
Figure 4The time variations in V∕Vmax (thin solid line) and cumulative slip ΣU∕Umax (solid line) and the phase portrait of V∕Vmax versus U∕Umax (solid line) for four values of Uc: (a) for Uc = 0.2; (b) for Uc = 0.4; (c) for Uc = 0.8; and (d) for Uc = 1.0 when η = 0.0.
A phase portrait, which is a plot of a physical quantity, y, versus another, x, i.e., y = f(x), is commonly used to represent nonlinear behavior of a dynamical system (Thompson and Stewart, 1986). The intersection point between f(x) and the bisection line of y = x is defined as the fixed point, that is, f(x) = x. If f(x) is continuously differentiable in an open domain near a fixed point xf and < 1, attraction can appear at the fixed point. Chaos can also be generated at some attractors. The details can be seen in Thompson and Stewart (1986). In this study, the phase portrait is the plot of V∕Vmax versus U∕Umax.
Numerical simulations lead to the temporal variations in particle velocities and displacements as displayed in Fig. 1. The values of Vm and D, respectively, represent the peak value of velocity and final slip for each event. Since four cases related to our values of a particular model parameter, there are four values of Vm and D in a figure. In order to plot the temporal variations in both normalized displacements and velocities, the maximum values of Vm and D of the modeled events, i.e., Vmax and Umax, respectively, are taken into account. The values of Vm and D usually appear in panel (a) of a figure. Simulation results are shown in Figs. 4–12. The temporal variations in V∕Vmax (displayed by thin solid lines) and cumulative slip ΣU∕Umax (displayed by solid lines) are displayed in the left panels. The normalization scales to plot the temporal variations in slip and velocity are Vmax for the velocities and the final value of ΣU∕Umax for the displacements in the computational time. Hence, the upper-bound scale is “1” for the two temporal variations. Hence, only the patterns of temporal variations of velocity and cumulative slip are concerned in these figures.
Simulation results displayed in these figures show that the maximum values of both V and U decrease from case (a) to (d) in each figure. Hence, the maximum velocity and maximum displacement, which are denoted by Vmax and Umax, respectively, for case (a) can be taken as the scaled factor to normalize the waveforms from case (a) to (d). This makes it easy to compare the waveforms of the four cases in each figure.
The cases excluding the viscous effect, i.e., η = 0, are first simulated and results are shown in Fig. 4 for four values of Uc: (a) for Uc = 0.2; (b) for Uc = 0.4; (c) for Uc = 0.8; and (d) for Uc = 1.0. The results of the cases including viscosity, i.e., η ≠ 0, are displayed in Figs. 5–7 for four values of η: (a) for η = 0.20; (b) for η = 0.40; (c) for η = 0.6; and (d) for η = 0.8. The values of Uc are 0.2 in Fig. 5, 0.5 in Fig. 6, and 0.8 in Fig. 7.
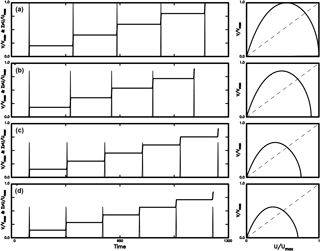
Figure 5The time variations in V∕Vmax (thin solid line) and cumulative slip ΣU∕Umax (solid line) and the phase portrait of V∕Vmax versus U∕Umax (solid line) for four values of η: (a) for η = 0.2; (b) for η = 0.4; (c) for η = 0.8; and (d) for η = 1.0 when Uc = 0.2.
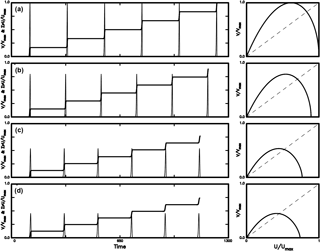
Figure 6The time variations in V∕Vmax (thin solid line) and cumulative slip ΣU∕Umax (solid line) and the phase portrait of V∕Vmax versus U∕Umax (solid line) for four values of η: (a) for η = 0.2; (b) for η = 0.4; (c) for η = 0.8; and (d) for η = 1.0 when Uc = 0.5.
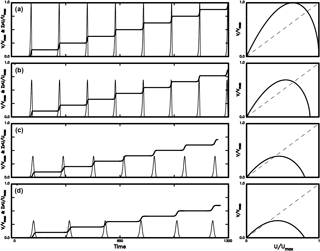
Figure 7The time variations in V∕Vmax (thin solid line) and cumulative slip ΣU∕Umax (solid line) and the phase portrait of V∕Vmax versus U∕Umax (solid line) for four values of η: (a) for η = 0.2; (b) for η = 0.4; (c) for η = 0.8; and (d) for η = 1.0 when Uc = 0.8.
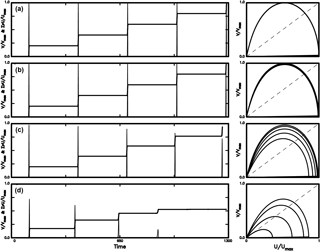
Figure 8The time variations in V∕Vmax (thin solid line) and cumulative slip ΣU∕Umax (solid line) and the phase portrait of V∕Vmax versus U∕Umax (solid line) for four values of C: (a) for C = 0.0001; (b) for C = 0.001; (c) for C = 0.01; and (d) for C = 0.05 when Uco = 0.1 and η = 0.
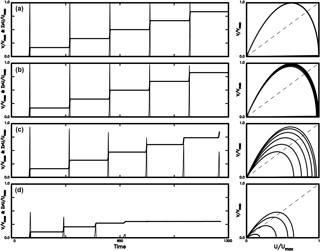
Figure 9The time variations in V∕Vmax (thin solid line) and cumulative slip ΣU∕Umax (solid line) and the phase portrait of V∕Vmax versus U∕Umax (solid line) for four values of C: (a) for C = 0.0001; (b) for C = 0.001; (c) for C = 0.01; and (d) for C = 0.05 when Uco = 0.5 and η = 0.
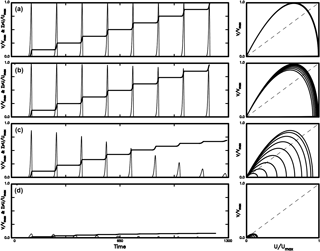
Figure 10The time variations in V∕Vmax (thin solid line) and cumulative slip ΣU∕Umax (solid line) and the phase portrait of V∕Vmax versus U∕Umax (solid line) for four values of C: (a) for C = 0.0001; (b) for C = 0.001; (c) for C = 0.01; and (d) for C = 0.05 when Uco = 0.9 and η = 0.
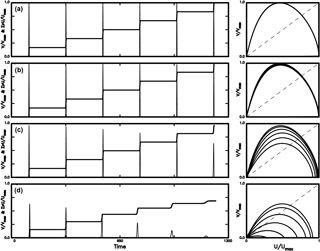
Figure 11The time variations in V∕Vmax (thin solid line) and cumulative slip ΣU∕Umax (solid line) and the phase portrait of V∕Vmax versus U∕Umax (solid line) for four values of C: (a) for C = 0.0001; (b) for C = 0.0010; (c) for C = 0.0100; and (d) for C = 0.0380 when Uco = 0.1 and η = 1.
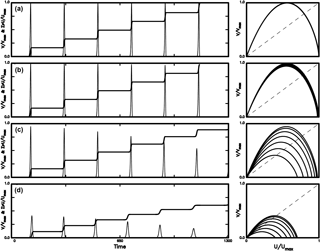
Figure 12The time variations in V∕Vmax (thin solid line) and cumulative slip ΣU∕Umax (solid line) and the phase portrait of V∕Vmax versus U∕Umax (solid line) for four values of C: (a) for C = 0.0001; (b) for C = 0.0010; (c) for C = 0.0100; and (d) for C = 0.0136 when Uco = 0.5 and η = 1.
The left panels in Fig. 4 with η = 0 show that the peak velocity of an event, Vm, and final slip, D, with the respective maximum values in case (a) as mentioned above, for all simulated events decrease with increasing Uc. From Fig. 3, the force drop, ΔF, decreases with increasing Uc for a certain final slip, thus indicating that larger ΔF yields higher Vm and larger D. This interprets the negative dependence of Vm and D on Uc. When the viscous effect is absent, i.e., η = 0, the value of τD increases with Uc, while TR decreases with increasing Uc. When Uc = 1, Vm and D are both very small and the system behaves like creeping of a fault. In the right panels, there are two fixed points for each case: one is called the non-zero fixed point at larger V and larger U and the other the zero fixed point at V = 0 and U = 0. The slope at a fixed point is defined to be dd(U∕Umax) = (Umax∕Vmax)(dV∕dU). The absolute values of slope at the two fixed points decrease with increasing Uc, thus suggesting that the fixed point is not an attractor for small Uc and could be an attractor for larger Uc. The phase portrait for Uc = 1 is very tiny, because the final slip for Uc = 1.0 is much smaller than those for Uc = 0.2, 0.4, and 0.8. Hence, Uc = 1 will not be taken into account in the following simulations.
The left panels in Figs. 5–7 show that Vm and D decrease when either Uc or η increases, while τD increases with η and Uc. Meanwhile, TR increases when either η increases or Uc decreases. The right panel shows that the phase portraits coincide for all simulated events for a certain η. The absolute values of slope at the two fixed points decrease when either Uc or η increases. This suggests that the fixed point is not an attractor for small Uc and low η, and can be an attractor for large Uc and high η. Like Fig. 4, the final slip decreases with increasing Uc.
In Figs. 5–7 we can see that the temporal variation in cumulative slip can be described by the perfectly periodic model as mentioned above. Hence, when Uc and η do not change with time, the rate of cumulative slip retains a constant in the computational time period. This is similar to the simulation results with the periodical earthquake occurrences obtained by some authors (e.g., Rice and Tse, 1986; Ryabov and Ito, 2001; Erickson et al., 2008; Mitsui and Hirahara, 2009) based on the one-body model with rate- and state-dependent friction or velocity-weakening friction. However, the present result is inconsistent with the simulation results, from which either the time-predictable model or the slip-predictable model cannot interpret the temporal variation in cumulative slip, based on the same model obtained by others (e.g., He et al., 2003; Bazzarri, 2012b; Bizzarri and Crupi, 2014; Kostić et al., 2013a, b; Franović et al., 2016). The differences between the two groups of researchers might be due to distinct additional constrains in respective studies. Although the detailed discussion of such differences is important and significant, it is out of the scope of this study and ignored here.
The phase portraits in Figs. 5–7 exhibit two kinds of fixed points as mentioned above. The absolute values of slope at the non-zero fixed point are higher than 1 and decreases with increasing η. This means that larger η is easier to generate an attractor than small η. However, the reducing rate of absolute value of slope decreases with increasing Uc. The absolute values of slope of the zero fixed point are higher than 1 and decrease with increasing η. This suggests that the zero fixed points can be an attractor. This behavior becomes weaker when Uc increases.
Figures 4–7 show that when Uc and η are constants during the computational time periods, the general patterns of temporal variations in cumulated slip do not change. Some of the previous studies (e.g., Bizzarri, 2012a, b; Franović et al., 2016) suggest that the patterns of temporal variations in cumulated slip can change with time. The changes of Uc and η with time should play the main roles. From uc = ρfCVh∕μfΛ of the TP model (see Rice, 2006), the width of the slipping zone, h, where the maximum deformation is concentrated (Bizzarri, 2009), is a significant parameter in this study. From geological surveys, Rathbun and Marone (2010) observed that h is not spatially uniform even within a single fault. Hull (1988) and Marrett and Allmendinger (1990) found that the wear processes occurring during faulting could widen h, and thus h could vary with time. According to the results gained by several authors (e.g., Power et al., 1988; Robertson, 1983; Bizzarri, 2010), Bizzarri (2012b) proposed a linear dependence of h on the cumulated slip, S(t) = ∑D(t), i.e., h(t) = CS(t), where C is a dimensionless increasing rate of h with S and is considered to be a constant in each case. Based on h(t) = CS(t), the more mature the fault is, the thicker its slip zone is. Since uc is proportional to h and Uc = uc∕Do, Uc is related to C. Here, we assume that Uc varies with cumulative slip in the following way: Uc = Uco + C∑U(t), where Uco is the initial value of Uc. Simulation results for four values of C are shown in Figs. 8–12: (a) for C = 0.0001, (b) for C = 0.001, (c) for C = 0.01, and (d) for C = 0.05 when η = 0 in Figs. 8–10; (a) for C = 0.0001, (b) for C = 0.001, (c) for C = 0.01, and (d) for C = 0.038 when η = 1 in Fig. 11; and (a) for C = 0.0001, (b) for C = 0.001, (c) for C = 0.01, and (d) for C = 0.0136 when η = 1 in Fig. 12. The initial values of Uc are 0.1 for Fig. 8, 0.5 for Fig. 9, 0.9 for Fig. 10, 0.1 for Fig. 11, and 0.5 for Fig. 12. Note that the value Uc varies with time due to time-varying h.
The left panels of Figs. 8–12 show that Vm, D, τD, and TR are all similar when C ≤ 0.001. However, in general Vm and D decrease with increasing C, TR slightly decreases with increasing C, and τD slightly increases with C. A decrease in D is particularly remarkable when C ≥ 0.01. When h is wider than a critical value with C = 0.05 for η = 0, normal earthquakes cannot occur and only creeping may happen. The critical value of h decreases when the viscous effect is present with η = 1 in this study. This decrease is also influenced by Uc: C = 0.038 when the initial value of Uc is 0.1 and C = 0.0136 when the initial value of Uc is 0.5. Obviously, TR decreases with increasing C, thus leading to a decrease in TR with increasing h. This is similar to the result obtained by Bizzarri (2010, 2012b). However, the viscous effect was not included in his studies.
The right panels of Figs. 8–12 show that the phase portraits for C = 0.001 are slightly different from those for C = 0.0001 even though the patterns of their variations in V and U are similar, while the phase portraits for C > 0.001 are different from those for C ≤ 0.001. An increase in h due to an increase in C with cumulative slip enlarges Uc. This can be explained from Fig. 3, which shows that larger Uc yields a lower ΔF than smaller Uc for the same final slip. Hence, an increase in Uc produces a decrease in ΔF, thus resulting in low Vm and small D. In addition, an increase in Uc makes approach unity, especially for small U, thus reducing the nonlinear effect caused by TP friction.
Unlike Figs. 4–7, the size of phase portraits in the right panels of Figs. 8–12 decreases with increasing C. This reflects a decrease in both TR and D of events with increasing C as mentioned previously. The absolute values of slope at the non-zero fixed point are higher than 1 and only slightly decrease with time when C < 0.01, while the values remarkably decrease with time when C ≥ 0.01. The absolute values of slope at the zero fixed point are higher than 1 and only slightly decrease with time when C < 0.01, while those decrease with time when C ≥ 0.01. Results suggest that the non-zero fixed points for all cases in the study are not an attractor, and those at the zero fixed points can evolve to an attractor with time when C ≥ 0.01. The phenomenon is particularly remarkable for C = 0.05 in Figs. 8–10, C = 0.0380 in Fig. 11, and C = 0.0136 in Fig. 12, and the evolution is faster for large Uc than for small Uc.
The simulation results as mentioned previously demonstrate that when Uc and η are constants during the computational time periods, the general patterns of temporal variations in cumulated slip cannot change. In order to investigate the effect of time-varying η and Uc on the patterns of temporal variations in cumulated slip, we must consider changes of Uc and η with time. The viscosity coefficient can actually vary immediately before and after the occurrence of an earthquake (see Spray, 1883, 2005; Wang, 2017b, c). However, a lack of long-term variation in η does not allow us to explore its possible effect on the change of general patterns of temporal variations in cumulated slip. Here, only the possible effect due to time-varying Uc.
As mentioned above, the equality Uc = uc∕Do leads to Uc = ρfCVh∕μfDoΛ. Obviously, Uc is controlled by six factors, i.e., ρf, CV, h, μf, Do, and Λ. Since the tectonics of a region is generally stable over a long time, the value of Do = Fo∕K could not change too much and thus would not influence Uc. The Debye law (cf. Reif, 1965) gives Cv ∼ (T + 273.16)3, where 273.16 is the value to convert temperature from Celsius to kelvin, at low T and Cv ≈ constant at high T. The threshold temperature, from which Cv begins to approach a constant, is 200–300 ∘K. In this study, Cv is almost a constant because of T > 250 ∘C = 523.16 ∘K, which is the average ambient temperature of fault zone with depths ranging from 0 to 20 km. Hence, Cv is almost constant during a long time and thus cannot influence Uc.
The frictional strength, μf, is influenced by several factors including humidity, temperature, sliding velocity, strain rate, normal stress, and thermally activated rheology (Marone, 1998; Rice, 2006), and thus can change with time (Sibson, 1992; Rice, 2006). Hirose and Bystricky (2007) observed that serpentine dehydration and subsequent fluid pressurization due to coseismic frictional heating may reduce μf and thus promote further weakening in a fault zone. The pore fluid pressure exists in wet rocks, yet not in dry rocks. Clearly, the time variation in μf can affects the earthquake recurrences. However, a lack of long-term observations of μf during a seismic cycle makes the study of its effect on earthquake recurrence be impossible.
The fluid density ρf and the porosity n depend on T and p. Although there are numerous studies on such dependence (Lachenbruch, 1980; Bizzarri, 2012b; and cited references therein), observed data and theoretical analyses about the values of ρf and n during a seismic cycle are rare.
The porosity is associated with the permeability, κ. Bizzarri (2012c) pointed out that the time-varying permeability, κ(t), and porosity of a fault zone (cf. Mitsui and Cocco, 2010; Bizzarri, 2012b) can reduce TR. One of the Kozeny–Carman relations (Costa, 2006, and references cited therein) is κ(t) = κCφ2(t)d3(t)∕[1 − φ(t)]2, where κC is a dimensionless constant depending on the material in consideration; φ is Vvoids∕Vtot, where Vvoids and Vtot are, respectively, the pore volume and the total volume of the porous materials; and d is the (average) diameter of the grains, ranging between 4 × 10⁻⁵ and 1 × 10⁻⁴ m (Niemeijer et al., 2010). Usually, κ, φ, and d can vary in the fault zone (Segall and Rice, 1995). After faulting κ and φ would change and d becomes smaller because of refining of the grains. According to this relation, Bizzarri (2012b) found that κ(t) could significantly reduce TR in comparison with the base model with constant κ. The reason is explained below. An increase in permeability can result in an increase in pore pressure, pf. This can reduce the frictional resistance from τ = μ(σn − pf) and thus could trigger earthquakes earlier. Hence, the time-varying permeability can change TR. Nevertheless, we cannot investigate its influence on earthquake recurrence here because there is a lack of a long-term observation of hydraulic parameters during a seismic cycle.
It is significant to explore the factors that can yield a non-perfectly periodic seismic cycle. The width of the slipping zone, h, can be a candidate as pointed out by some authors (e.g., Bizzarri, 2009; Rathbun and Marone, 2010). Since the displacement along a fault is controlled by the fault rheology, h should depend on the rheology on the sliding interface. The wear processes occurring during faulting could widen h (Hull, 1988; Marrett and Allmendinger, 1990). According to the results gained by several authors (e.g., Power et al., 1988; Robertson, 1983; Bizzarri, 2010), simulation results for various values of C and the results are shown in Figs. 8–10 with η = 0 and in Figs. 11 and 12 with η = 1. Results show that when C > 0.0001, the wear process affects the recurrence of slip and the effect increases with C and when C is larger than an upper-bound value, larger-sized events cannot occur and the earthquake recurrence does not exist. Both TR and D decrease when the fault becomes more mature due to a thicker slip zone. Meanwhile, the viscous effect can also play a secondary role on the earthquake recurrence because it makes upper-bound value become smaller. Although either the time- or slip-predictable model can describe the temporal variations of cumulative slip of events occurring in the earlier time period, they cannot interpret those of events in the later parts. This might suggest that it is more difficult to produce large earthquakes along a fault when it becomes more mature, especially for the cases with viscosity. This implicates that seismic hazard is higher for a young fault than a mature one. Hence, it is significant and important to identify the width of slip zone of an earthquake fault for seismic hazard estimates.
To study the frictional and viscous effects on earthquake recurrence, numerical simulations of the temporal variations in cumulative slip have been conducted based on the normalized equation of a one-body model in the presence of thermal-pressurized slip-weakening friction and viscosity. The wear process, which is included in the friction law, is also taken into account. The model parameters of friction and viscosity are represented, respectively, by Uc and η, where Uc = uc∕Do is the normalized characteristic distance and η is the normalized damping coefficient. Numerical simulation of the time variations in V∕Vmax and cumulative slip ΣU∕Umax as well as the phase portrait of V∕Vmax versus U∕Umax are made for various values of Uc and η.
Results show that both friction and viscosity remarkably affect earthquake recurrences. The recurrence time, TR, increase when η increases or Uc decreases. The final slip, D, and the duration time of slip, τD, of an event slightly decrease when η or τD increases and slightly increases with Uc. Considering the effect due to wear process, the thickness of slip zone, h, that depends on the cumulated slip, S(t) = ∑D(t), i.e., h(t) = CS(t) (C is a dimensionless constant), is an important factor in influencing earthquake recurrences. Uc increases with ∑U with an increasing rate of C. When C > 0.0001, the wear process influences the recurrence of slip and the effect increases with C. When C is larger than an upper-bound value, larger-sized events cannot occur and the earthquake recurrence does not exist. If the slip zone becomes thicker, the fault is more mature. This makes TR and D become shorter. This might suggest that it is more difficult to produce large earthquakes along a fault when it becomes more mature. This phenomenon becomes remarkable when the viscous effect exists because the upper-bound value becomes smaller. The temporal variation in slip cannot be interpreted by the time-predictable or slip-predictable model when the fault is affected by wear process with large C. In addition, the size of phase portrait of V∕Vmax versus U∕Umax decreases with increasing C. This again reflects decreases in both TR and D of events with increasing C as inferred from the temporal variations in cumulative slip.
No data sets were used in this article.
The author declares that he has no conflict of interest.
The author would like to thank Filippos Vallianatos (Editor of NHESS) and two
anonymous reviewers for their valuable comments and suggestions to help me to
substantially improve this article. The study was financially supported by
Academia Sinica and the Ministry of Science and Technology (grant no. MOST-106-2116-M-001-005).
Edited by: Filippos Vallianatos
Reviewed by: two anonymous referees
Abaimov, S. G., Turcotte, D. L., Shcherbakov, R., and Rundle, J. B.: Recurrence and interoccurrence behavior of self-organized complex phenomena, Nonlin. Processes Geophys., 14, 455–464, https://doi.org/10.5194/npg-14-455-2007, 2007.
Abe, Y. and Kato, N.: Complex earthquake cycle simulations using a two-degree-of-freedom spring-block model with a rate- and state-friction law, Pure Appl. Geophys., 170, 745–765, 2013.
Ando, M.: Source mechanisms and tectonic significance of historic earthquakes along the Nankai trough, Japan, Tectonpohys, 27, 119–140, 1975.
Bakun, W. H. and McEvilly, T. V.: Earthquakes near Parkfield, California: comparing the 1934 and 1966 sequences, Science, 205, 1375–1377, 1979.
Bakun, W. H. and McEvilly, T. V.: Recurrence models and Parkfield, California, earthquakes, J. Geophys. Res., 89, 3051–3058, 1984.
Beeler, N. M., Lockner, D. L., and Hickman, S. H.: A simple stick-slip model for repeating earthquakes and its implication for microearthquakes at Parkfield, Bull. Seismol. Soc. Am., 91, 1797–1804, 2001.
Belardinelli, M. E. and Belardinelli, E.: The quasi-static approximation of the spring-slider motion, Nonlin. Processes Geophys., 3, 143–149, https://doi.org/10.5194/npg-3-143-1996, 1996.
Bizzarri, A.: What does control earthquake ruptures and dynamic faulting? A review of different competing mechanism, Pure Appl. Geophys., 166, 741–776, 2009.
Bizzarri, A.: On the recurrence of earthquakes: Role of wear in brittle faulting, Geophys. Res. Lett., 37, L20315, https://doi.org/10.1029/2010GL045480, 2010.
Bizzarri, A.: Modeling repeated slip failures on faults governed by slip-weakening friction, Bull. Seismol. Soc. Am., 102, 812–821, https://doi.org/10.1785/0120110141, 2012a.
Bizzarri, A.: What can physical source models tell us about the recurrence time of earthquakes?, Earth-Sci. Rev., 115, 304–318, https://doi.org/10.1016/j.earscirev.2012.10.004, 2012b.
Bizzarri, A.: Effects of permeability and porosity evolution on simulated earthquakes, J. Struct. Geol., 38, 243–253, https://doi.org/10.1016/j.jsg.2011.07.009, 2012c.
Bizzarri, A. and Crupi, P.: Linking the recurrence time of earthquakes to source parameters: A dream or a real possibility?, Pure Appl. Geophys., 171, 2537–2553, https://doi.org/10.1007/s00024-013-0743-1, 2014.
Brun, J. L. and Gomez, A. B.: A four-parameter, two degree-of-freedom block-spring model: Effect of the driver velocity, Pure Appl. Geophys., 143, 633–653, 1994.
Burridge, R. and Knopoff, L.: Model and theoretical seismicity, Bull. Seismol. Soc. Am., 57, 341–371, 1967.
Byerlee, J. D.: Brittle-ductile transition in rocks, J. Geophys. Res., 73, 4711–4750, 1968.
Carlson, J. M. and Langer, J. S: Mechanical model of an earthquake fault, Phys. Rev. A, 40, 6470–6484, 1989.
Chen, K. H., Nadeau, R. M., and Rau, R. J.: Towards a universal rule on the recurrence interval scaling of repeating earthquakes?, Geophys. Res. Lett., 34, L16308, https://doi.org/10.1029/2007GL030554, 2007.
Cohen, S.: Numerical and laboratory simulation of fault motion and earthquake occurrence, Rev. Geophys. Space Phys., 17, 61–72, 1979.
Costa, A.: Permeability-porosity relationship: a reexamination of the Kozeny–Carman equation based on a fractal pore-space geometry assumption, Geophys. Res. Lett., 33, L02318, https://doi.org/10.1029/2005GL025134, 2006.
Davis, P. M., Jackson, D. D., and Kagan, Y. Y.: The longer it has been since the last earthquake, the longer the expected time till the next?, Bull. Seismol. Soc. Am., 79, 1439–1456, 1989.
Dragoni, M. and Piombo, A.: Dynamics of a seismogenic fault subject to variable strain rate, Nonlin. Processes Geophys., 18, 431–439, https://doi.org/10.5194/npg-18-431-2011, 2011.
Dragoni, M. and Santini, S.: A two-asperity fault model with wave radiation, Phys. Earth Planet. Int., 248, 83–93, 2015.
Enescu, B., Struzik, Z., and Kiyono, K.: On the recurrence time of earthquakes: insight from Vrancea (Romania) intermediate-depth events, Geophys. J. Int., 172, 395–404, https://doi.org/10.1111/j.1365-246X.2007.03664.x, 2008.
Erickson, B., Birnir, B., and Lavallée, D.: A model for aperiodicity in earthquakes, Nonlin. Processes Geophys., 15, 1–12, https://doi.org/10.5194/npg-15-1-2008, 2008.
Erickson, B., Birnir, B., and Lavallée, D.: Periodicity, chaos and localization in a Burridge–Knopoff model of an earthquake with rate-and-state friction, Geophys. J. Int., 187, 178–198, https://doi.org/10.1111/j.1365-246X.2011.05123.x, 2011.
Franović, I., Kostić, S., Perc, M., Klinshov, V., Nekorkin, V., and Kurths, J.: Phase response curves for models of earthquake fault dynamics, Chaos, 26, 063105, https://doi.org/10.1063/1.4953471, 2016.
Hasumi, T.: Interoccurrence time statistics in the two-dimensional Burridge- Knopoff earthquake model, Phys. Rev. E, 76, 026117, https://doi.org/10.1103/PhysRevE.76.026117, 2007.
He, C., Wong, T. F., and Beeler, N. M.: Scaling of stress drop with recurrence interval and loading velocity for laboratory-derived fault strength relations, J. Geophys. Res., 108, 2037, https://doi.org/10.1029/2002JB001890, 2003.
Hirose, T. and Bystricky, M.: Extreme dynamic weakening of faults during dehydration by coseismic shear heating, Geophys. Res. Lett., 34, L14311, https://doi.org/10.1029/2007GL030049, 2007.
Huang, J. and Turcotte, D. L.: Are earthquakes an example of deterministic chaos?, Geophys. Res. Lett., 17, 223–226, 1990.
Huang, J. and Turcotte, D. L.: Evidence of chaotic fault interactions in the seismicity of the San Andreas fault and Nankai trough, Nature, 348, 234–236, 1992.
Hudson, J. A.: The excitation and propagation of elastic waves, in: Cambridge Monographs on Mechanics and Applied Mathematics, Cambridge University Press, Cambridge, 226 pp., 1980.
Hull, J.: Thickness–displacement relationships for deformation zones, J. Struct. Geol., 10, 431–435, https://doi.org/10.1016/0191-8141(88)90020-X, 1988.
Jeffreys, H.: On the mechanics of faulting, Geol. Mag., 79, 291–295, 1942.
Kanamori, H. and Allen, C. R.: Earthquake repeating time and average drop, in: Earthquake Source Mechanics Maurice Ewing Series 6, Geophys. Mono. Ser., AGU, Washington, D.C., USA, 37, 227–235, 1986.
Kittel, C., Knight, W. D., and Ruderman, M. A.: Mechanics, in: Berkeley Physics Course, vol. 1, McGraw-Hill Book Co, New York, 1968.
Knopoff, L. and Ni, X. X.: Numerical instability at the edge of a dynamic fracture, Geophys. J. Int., 147, F1–F6, 2001.
Knopoff, L., Mouton, J. Q., and Burridge, R.: The dynamics of a one-dimensional fault in the presence of friction, Geophys. J. R. Astro. Soc., 35, 169–184, 1973.
Kostić, S., Franović, I., Todorović, K., and Vasoví, N.: Friction memory effect in complex dynamics of earthquake model, Nonlin. Dynam. 73, 1933–1943, https://doi.org/10.1007/s11071-013-0914-8, 2013a.
Kostić, S., Vasoví, N., Franović, I., and Todorović, K.: Dynamics of simple earthquake model with time delay and variation of friction strength, Nonlin. Processes Geophys., 20, 857–865, https://doi.org/10.5194/npg-20-857-2013, 2013b.
Lachenbruch, A. H.: Frictional heating, fluid pressure, and the resistance to fault motion, J. Geophys. Res., 85, 6097–6122, 1980.
Lapusta, N. and Rice, J. R.: Nucleation and early seismic propagation of small and large events in a crustal earthquake model, J. Geophys. Res., 108, 1–18, 2003.
Marone, C.: Laboratory-derived friction laws and their application to seismic faulting, Annu. Rev. Earth Planet. Sci., 26, 643–669, 1998.
Marrett, R. and Allmendinger, R. W.: Kinematic analysis of fault-slip data, J. Struct. Geol., 12, 973–986, https://doi.org/10.1016/0191-8141(90)90093-E, 1990.
Mitsui, Y. and Cocco, M.: The role of porosity evolution and fluid flow in frictional instabilities: a parametric study using a spring-slider dynamic system, Geophys. Res. Lett., 37, L23305, https://doi.org/10.1029/2010GL045672, 2010.
Mitsui, Y. and Hirahara, K.: Coseismic thermal pressurization can notably prolong earthquake recurrence intervals on weak rate and state friction faults: numerical experiments using different constitutive equations, J. Geophys. Res., 114, B09304, https://doi.org/10.1029/2008JB006220, 2009.
Murray, J. and Segall, P.: Testing time-predictable earthquake recurrence by direct measurement of strain accumulation and release, Nature, 49, 287–291, 2002.
Nadeau, R. M. and Johnson, L. R.: Seismological studies at Parkfield VI moment release rates and estimates of source parameters for small repeating earthquake, Bull. Seismol. Soc. Am., 88, 790–814, 1998.
Niemeijer, A., Marone, C., and Ellsworth, D.: Frictional strength and strain weakening in simulated fault gouge: competition between geometrical weakening and chemical strengthening, J. Geophys. Res., 115, B10207, https://doi.org/10.1029/2009JB000838, 2010.
Nur, A.: Nonuniform friction as a physical basis for earthquake mechanics, Pure Appl. Geophys., 116, 964–989, 1978.
Okada, T., Matsuzawa, T., and Hasegawa, A.: Comparison of source areas of M4.8 ± 0.1 repeating earthquakes off Kamaishi, NE Japan: are asperities persistent features?, Earth Planet. Sci. Lett., 213, 361–374, https://doi.org/10.1016/S0012-821X(03)000299-1, 2003.
Power, W. L., Tullis, T. E., and Weeks, D. J.: Roughness and wear during brittle faulting, J. Geophys. Res., 93, 15268–15278, https://doi.org/10.1029/JB093iB12p15268, 1988.
Press, W. H., Flannery, B. P., Teukolsky, S. A., and Vetterling, W. T.: Numerical Recipes, Cambridge University Press, Cambridge, 1986.
Rathbun, A. P. and Marone, C.: Effect of strain localization on frictional behavior of sheared granular materials, J. Geophys. Res., 115, B01204. https://doi.org/10.1029/2009JB006466, 2010.
Reid, H. F.: The California earthquake of April 18, 1906, in: Report of the State Investigation Commission 2, Mechanics of the Earthquake Carnegie Inst., Washington, D.C., 1910.
Reif, F.: Fundamentals of statistical and thermal physics, McGraw-Hill, New York, 651 pp., 1965.
Rice, J. R.: Spatio-temporal complexity of slip on a fault, J. Geophys. Res., 98, 9885–9907, 1993.
Rice, J. R.: Heating and weakening of faults during earthquake slip, J. Geophys. Res., 111, B05311, https://doi.org/10.1029/2005JB004006, 2006.
Rice, J. R. and Tse, S. T.: Dynamic motion of a single degree of freedom system following a rate and state dependent friction law, J. Geophys. Res., 91, 521–530, 1986.
Rice, J. R., Lapusta, N., and Ranjith, K.: Rate and state dependent friction and the stability of sliding between elastically deformable solids, J. Mech. Phys. Solids, 49, 1865–1898, 2001.
Robertson, E. C.: Relationship of fault displacement to gouge and breccia thickness, Mining Eng., 35, 1426–1432, 1983.
Rubinstein, J. L., Ellsworth, W. L., Beeler, N. M., Kilgore, B. D., Lockner, D. A., and Savage, H. M.: Fixed recurrence and slip models better predict earthquake behavior than the time- and slip-predictable models: 2. Laboratory earthquakes, J. Geophys. Res., 117, B02307, https://doi.org/10.1029/2011JB008723, 2012.
Ryabov, V. B. and Ito, K.: Intermittent phase transitions in a slider-spring model as a mechanism for earthquakes, Pure Appl. Geophys., 158, 919–930, 2001.
Scholz, C. H.: The Mechanics of Earthquakes and Faulting. Cambridge Universtiy Press, Cambridge, 439 pp., 1990.
Schwartz, D. P. and Coppersmith, K. S.: Fault behavior and characteristic earthquakes: examples from the Wasatch and San Andreas fault zones, J. Geophys. Res., 89, 5681–5698, 1984.
Segall, P. and Rice, J. R.: Dilatancy, compaction, and slip instability of a fluid-infiltrated fault, J. Geophys. Res., 100, 22155–22171, 1995.
Shimazaki, K. and Nakata, T.: Time-predictable model for large earthquakes, Geophys. Res. Lett., 7, 279–282, https://doi.org/10.1029/GL007i004p00279, 1980.
Sibson, R. H.: Interaction between temperature and pore-fluid pressure during earthquake faulting and a mechanism for partial or total stress release, Nat. Phys. Sci., 243, 66–68, 1973.
Sibson, R. H.: Implications of fault-valve behavior for rupture nucleation and recurrence, Tectonophys., 211, 283–293, 1992.
Sieh, K.: A review of geological evidence for recurrence times of large earthquakes, in: Earthquake Prediction – An International Review, Mauric Ewing Series 4, AGU, Washington, D.C., USA, 181–207, 1981.
Sieh, K., Natawidjaja, D., Meltzner, A. J., Shen, C. C., and Cheng, H.: Earthquake supercycles inferred from sea-level changes recorded in the corals of West Sumatra, Science, 322, 1674–1678, 2008.
Spray, J. G.: Viscosity determinations of some frictionally generated silicate melts: Implications for fault zone rheology at high strain rates, J. Geophys. Res., 98, 8053–8068, 1983.
Spray, J. G.: Evidence for melt lubrication during large earthquakes, Geophys. Res. Lett., 32, L07301, https://doi.org/10.1029/2004GL022293, 2005.
Sykes, L. R. and Menke, W.: Repeat times of large earthquakes: implications for earthquake mechanics and long-term prediction, Bull. Seismol. Soc. Am., 96, 1569–1596, https://doi.org/10.1785/0120050083, 2006.
Sykes, L. R. and Quittmeyer, R. C.: Repeat times of great earthquakes along simple plate boundaries, in: Earthquake Prediction – An International Review, Maurice Ewing Series 4, AGU, Washington, D.C., USA, 217–247, 1981.
Thompson, J. M. T. and Stewart, H. B.: Nonlinear Dynamics and Chaos, John Wiley and Sons, New York, 376 pp., 1986.
Turcotte, D. L.: Fractal and Chaos in Geology and Geophysics, Cambridge Universtiy Press, New York, 221 pp., 1992.
Turcotte, D. L. and Schubert, G.: GEODYNAMICS – Applications of Continuum Physics to Geological Problems, John Wiley and Sons, New York, 450 pp., 1982.
Wang, J. H.: Effect of seismic coupling on the scaling of seismicity, Geophys. J. Int., 121, 475–488, 1995.
Wang, J. H.: Velocity-weakening friction law as a factor in controlling the frequency-magnitude relation of earthquakes, Bull. Seismol. Soc. Am., 86, 701–713, 1996.
Wang, J. H.: Instability of a two-dimensional dynamical spring-slider model of an earthquake fault, Geophys. J. Int., 143, 389–394, 2000.
Wang, J. H.: A one-body model of the 1999 Chi-Chi, Taiwan, earthquake, Terr. Atmos. Ocean. Sci., 14, 335–342, 2003.
Wang, J. H.: Earthquakes rupturing the Chelungpu fault in Taiwan are time-predictable, Geophys. Res. Lett., 32, L06316, https://doi.org/10.1029/2004GL021884, 2005.
Wang, J. H.: A dynamic study of the frictional and viscous effects on earthquake rupture: a case study of the 1999 Chi-Chi earthquake, Taiwan, Bull. Seismol. Soc. Am., 97, 1233–1244, 2007.
Wang, J. H.: One-dimensional dynamical modeling of earthquakes: A review, Terr. Atmos. Ocean. Sci., 19, 183–203, 2008.
Wang, J. H.: Effect of thermal pressurization on the radiation efficiency, Bull. Seismol. Soc. Am., 99, 2293–2304, 2009.
Wang, J. H.: Thermal and pore fluid pressure history on the Chelungpu fault at a depth of 1111 meters during the 1999 Chi-Chi, Taiwan, earthquake, J. Geophys. Res., 116, B03302, https://doi.org/10.1029/2010JB007765, 2011.
Wang, J. H.: Some intrinsic properties of the two-dimensional dynamical spring-slider model of earthquake faults, Bull. Seismol. Soc. Am., 102, 822–835, 2012.
Wang, J. H.: Slip of a one-body spring-slider model in the presence of slip-weakening friction and viscosity, Ann. Geophys., 59, S0541, https://doi.org/10.4401/ag-7063, 2016.
Wang, J. H.: Slip of a two-degree-of-freedom spring-slider model in the presence of slip-weakening friction and viscosity, Ann. Geophys., 60, S0659, https://doi.org/10.4401/ag-7295, 2017a.
Wang, J. H.: Frictional and viscous effects on the nucleation phase of an earthquake nucleation, J. Seismol., 21, 1517–1539, 2017b.
Wang, J. H.: Multi-stable slip in a one-degree-of-freedom spring-slider model with thermal-pressurized friction and viscosity, Nonlin. Processes Geophys., 24, 467–480, https://doi.org/10.5194/npg-24-467-2017, 2017c.
Wang, J. H. and Hwang, R. D.: One-dimensional dynamical simulations of slip complexity of earthquake faults, Earth Planets Space, 53, 91–100, 2001.
Wang, J. H. and Kuo, C. H.: On the frequency distribution of inter-occurrence times of earthquakes, J. Seismol., 2, 351–358, 1998.
Ward, S. N.: A synthetic seismicity model for southern California: Cycles, probabilities, and hazard, J. Geophys. Res., 101, 22393–22418, 1996.
Ward, S. N.: San Francisco Bay Area earthquake simulations: A step toward a standard physical earthquake model, Bull. Seismol. Soc. Am., 90, 370–386, 2000.
Xu, H. J. and Knopoff, L.: Periodicity and chaos in a one-dimensional dynamical model of earthquakes, Phys. Rev. E., 50, 3577–3581, 1994.


