
the Creative Commons Attribution 4.0 License.
the Creative Commons Attribution 4.0 License.
 | 16 Nov 2026

Development of a national-scale rip current forecast for Aotearoa New Zealand
Christopher Stokes

Juliana Albertoni de Miranda
Tim Scott
Gerd Masselink
Adam Wooler
Rip currents are dangerous flows in the surfzone of wave-exposed beaches and can take bathers from the shallows into deeper water. They cause hundreds of drownings globally each year and are the leading cause of all beach lifeguard rescues. In New Zealand, with a population of approx. 5 million people, rip currents typically cause 500–1000 lifeguard rescues each year and are attributed to 53 % of all Surf Life Saving New Zealand rescues. This study aims to identify environmental conditions associated with rip current incidents and develop a simple algorithm for forecasting rip current risk and hazard. A dataset of ∼ 9000 recorded rip current rescues along with water user head counts made at 58 beaches by lifeguards around the coast of New Zealand between 2001 and 2022 was used to assess rip current risk (parameterised from the total number of incidents) and rip current hazard (parameterised as the likelihood of an individual being in a rip incident) under different wave, tide, and wind conditions. In concurrence with previous findings, most rip incidents in New Zealand were recorded at beaches with intermediate “bar-rip” beach morphology and occurred disproportionately during wave conditions at or above average breaker height with tide level at or below average low tide for a given beach. Although rip incidents were also recorded at dissipative and reflective beaches lacking in bar-rip morphology, water users were 4 and 24 times more likely, respectively, to be in a rip-related incident at intermediate beaches with bar-rip morphology. A simple, threshold-based algorithm was developed using only breaker height, relative tide level, and a binary bar-rip morphology variable as predictors for use as a national-scale rip forecast across New Zealand. The algorithm achieves a high incident hit rate, capturing 98 % of historic rip incidents across New Zealand, and captures exponentially increasing hazard at each of its five Rip Index levels, with a water user 6 times more likely to be in a rip incident at the highest Rip Index (∼ 1-in-200) compared to the lowest (∼ 1-in-1200). It also conservatively replicates a lifeguard's perception of rip hazard, with an overall agreement rate of approximately 81 %, indicating it could provide useful forewarnings to the public especially at non-lifeguarded beaches or outside lifeguard patrol hours. To our knowledge, this represents the longest running rip incident data set analysed, and most widely validated rip forecast in the literature to date.
- Article
(8799 KB) - Full-text XML
- BibTeX
- EndNote


Along the world's wave-dominated coasts, rip currents or “rips” cause hundreds of drownings and tens of thousands of rescues globally each year and are the leading cause of all beach lifeguard rescues, including those made in New Zealand where the present study is focussed (Brighton et al., 2013; Castelle et al., 2016). Rip currents are wave-driven flows that originate in the surfzone of wave-exposed beaches and can carry water users from the shallows out into deeper water where panic, exhaustion, and in some cases drowning, can occur (Brander et al., 2011; Cornell et al., 2024). International rip current incident and fatality reporting is inconsistent, but available statistics suggest that rip currents cause more than 50 % of lifeguard rescues on surf beaches globally (Brewster et al., 2019; Brighton et al., 2013; Woodward et al., 2013) and fatalities numbering approximately 100 per year in the United States (Brewster et al., 2019), 21 per year in Australia (Kelly et al., 2025), and > 10 per year (including fatal and severe non-fatal drowning) in southwest France (Castelle et al., 2020). As in other countries, rip currents account for more than half of all lifeguard rescues in New Zealand (Sect. 3.1) and police and coroner's reports attributed rip currents to 17 % (29 out of 170) of drowning deaths at surf beaches in New Zealand between January 2014 and June 2024 (Water Safety New Zealand, 2024). That represents an average of 3 rip related drownings per year in New Zealand, although this is expected to be an underestimate due to the challenges of attribution after the drowning has occurred. Rip Currents are therefore one of the primary life risks faced by water-users at beaches in New Zealand.
Increasing rip current flow speed and decreasing surfzone retention increase bathing hazard by increasing the difficulty with which a bather can return to shore (Austin et al., 2013; McCarroll et al., 2014, 2015; Scott et al., 2014). Surfzone retention is largely driven by the circulation pattern occurring, which can vary between “alongshore” flow at the shore with high retention and a low level of bathing hazard; “rotational” surfzone flows with circulating offshore and onshore currents that result in an intermediate level of retention and bathing hazard; and “exiting” surfzone currents where rips flow directly or obliquely out of the surfzone representing the lowest retention and highest hazard to bathers (Scott et al., 2014). Field experiments and numerical simulations have shown that rip current velocity increases with wave height and period (Castelle et al., 2006, 2020; MacMahan et al., 2005, 2006), as well as shore-normal wave incidence in the case of channel rips (Castelle et al., 2020; Long and Özkan-Haller, 2016; Moulton et al., 2017). However, there is some ambiguity regarding whether larger waves always induce a higher level of rip current hazard. Larger waves breaking further from shore saturate the surfzone inducing cellular circulation, limiting flow velocities within channels (Castelle et al., 2014), and reducing the proportion of surfzone exits (MacMahan et al., 2010). Scott et al. (2014) proposed that wave power at or just below the seasonal mean provides optimised breaking over the template morphology, inducing the strongest rip flows and highest proportion of surf zone exits. They found this correlated with the highest occurrence of rip incidents and periods of high rip hazard, defined using rip incident totals normalized by surf zone population in the UK over the 5-year period they studied. On the other hand, Castelle et al. (2020) found that wave power at or in excess of the mean was associated with the highest prevalence of fatal and non-fatal rip-related drownings in France.
Bathymetrically-controlled rip currents (“channel rips” and “focused rips”) are the most studied and well understood rip current type (Brander and Scott, 2018) and are synonymous with intermediate morphological beach states (Wright and Short, 1984), where alongshore variable wave breaking caused by subtidal sandbars is the primary driver. Wave breaking over the sandbars creates a reduction in momentum flux, resulting in wave induced set up at the shore (Longuet-Higgins and Stewart, 1964). Gradients in the set up drive flows alongshore which return back out to sea in concentrated and often fast-moving, O (0.5–1 m s−1), offshore flows (Brander, 1999; MacMahan et al., 2006). Bathymetrically-controlled rips are sensitive to water level, with low tide levels enhancing wave focussing and breaking over surfzone sandbars as well as reducing the cross-sectional area of, and enhancing flow velocity through, intervening rip channels (Aagaard et al., 1997; Austin et al., 2010, 2014; Brander, 1999; MacMahan et al., 2005; Sonu, 1972). As a result, low tide levels have been widely linked to increased occurrence of rip incidents (Castelle et al., 2020; Engle, 2003; Scott et al., 2014) and rip related drownings (Arun Kumar and Prasad, 2014; Castelle et al., 2020), even in microtidal settings such as Australia (Koon et al., 2023). Rip currents are less commonly observed on non-intermediate beach types, but hydrodynamic instabilities in the surfzone (“shear instability rips” and “flash rips”), and control of wave-driven flows by headlands or other boundaries (“deflection rips”, “shadow rips”, and “cellular circulation”) can cause rips to occur at non-intermediate beaches or on planar portions (for example, upper intertidal) of intermediate beaches (Castelle et al., 2016; Scott et al., 2016).
Rip current forecasts have been developed in previous studies dating back to the 1990s, with the aim of forewarning members of the public that a bathing hazard exists at a given point in time or informing lifeguard rostering and operations. These early forecasts developed rip hazard indexes for the eastern coast of the USA, linking rip occurrence initially to strong winds (Lushine, 1991) and later to the presence of long-period swell waves (Lascody, 1998), wave direction, and tide (Engle, 2003). Dusek and Seim (2013a) provided a significant contribution to these efforts, developing a probabilistic rip forecast using lifeguard rip intensity estimates made over two summers, and further validating against 741 lifeguard rescues made over nine summers, at one beach in North Carolina. They linked (in order of decreasing predictive power) significant wave height, wave direction, tide level, and a “post-wave event” parameter, intended to represent periods of increased morphological relief, to binary “rip or no-rip” lifeguard observations. This was further validated (Churma et al., 2017; Gibbs et al., 2015; Moulton et al., 2017) before becoming the first publicly-broadcast, national-scale rip current forecast system in the world. Another long-running (2014-present) national-scale rip forecast was developed in the UK, based on in-situ rip measurements (Austin et al., 2014; Scott et al., 2014) and numerical modelling (Austin et al., 2013) at Perranporth Beach, UK, as well as rip incident statistics (n = 6458) collected at 20 bar-rip beaches in southwest UK over 5 summer seasons (Scott et al., 2014). The system predicts 5 different Rip Index levels based on thresholds of wave power relative to the seasonal mean (parameterised as Wfac, Eq. 2), daily low tide level relative to mean low water (parameterised as TfacLW, Eq. 3), a binary bar-rip beach morphology variable, and wind speed (Scott et al., 2022).
Examples of other operational rip forecasts include a system developed from rip drowning statistics collected across India (n = 388) over 11 years (Arun Kumar and Prasad, 2014), a system for four beaches in South Korea developed from physics-based modelling of flow velocities at Hyundai Beach (Lee et al., 2018), and a combined rip and estuary current forecast developed from physics-based modelling at Crantock beach in England (Stokes et al., 2024). Recently, simplified physics-based rip forecasts are starting to be developed (Casper et al., 2024; Castelle et al., 2025) which overcome some of the computational expense that has prohibited the widescale use of process-based models in operational rip forecasts. These show promising skill when tested against lifeguard recorded hazard perceptions and rip incident records but are so far limited in application to channel rips and have only been calibrated and tested at individual beaches.
The present study aims to assist in the management and mitigation of rip current hazard in New Zealand by developing a simple predictive rip current hazard algorithm that can be operationalised within a national-scale forecast system. It is hoped that such a forecast will inform lifeguard management decisions such as rostering ahead of high-hazard times and inform water users of the risk posed by rips and inform decisions about where to bathe on a given day. The objectives of the research are to:
-
Identify environmental conditions associated with high rip current hazard in New Zealand
-
Develop a simple algorithm that is effective at predicting the occurrence of rip current incidents and that can differentiate times of low and high hazard
-
Assess the performance of the rip prediction algorithm by comparing its predictions to historic rip incidents and lifeguard perceived rip hazard
This study uses a large number of lifeguard-recorded, rip-related bathing incidents and water user head counts (Sect. 2.2) to estimate rip current hazard (Sect. 2.3) and associate this with environmental forcing conditions occurring at different times (Sect. 2.4). The distributions of wave, tide, and wind (herein termed met-ocean) forcing conditions occurring at incident and non-incident times are used to develop a predictive algorithm for rip current hazard. When using this approach, it is important to account for both the number of water users present at a given time and the background distribution of each met-ocean forcing parameter, otherwise the system could unintentionally predict rips during the most popular or most frequently occurring marine conditions, rather than the most hazardous. A threshold-based algorithm is developed (Sect. 3.1–3.2) to predict rip current hazard by identifying conditions associated with disproportionately high (i.e. outside the background distribution) occurrences of rip incidents. To account for water-user exposure, the algorithm was validated for its ability to differentiate times of low and high rip hazard (Sect. 3.3.1), parameterised as the likelihood of an individual being involved in a rip incident. The predictions of rip hazard were then compared to lifeguard perceptions of rip hazard at different times and locations around New Zealand (Sect. 3.3.3).
2.1 Study setting
New Zealand's coasts (Fig. 1) are exposed to waves from the Pacific Ocean to the north and east, the Tasman Sea to the west, and the Southern Ocean to the south. The west and south facing coasts of New Zealand have an extremely energetic wave climate resulting from eastward propagating low pressure systems within the mid-latitude storm track. As a result, these coasts experience powerful breakers from locally generated storm waves and swells propagating from the Southern Ocean, with mean and maximum significant wave heights at the coast of 3 and 10 m, respectively, and mean zero-crossing wave period of 8 s (Albuquerque et al., 2021; Gorman et al., 2003). The east facing coastline is largely sheltered against the dominant south-westerly wave approach but still receives locally generated storm waves and south-westerly swells that propagate around the land mass to the east facing beaches (Coggins et al., 2016), resulting in mean and maximum significant wave heights at the coast of 2 and 9 m, respectively, and mean zero-crossing wave period of 7 s (Albuquerque et al., 2021; Gorman et al., 2003). The north-east facing coastline is the most sheltered overall, receiving locally-generated windseas and less frequent swells from tropical cyclones in the southwest Pacific and subtropical Pacific trade-wind belt (Laing, 2000), resulting in mean and maximum significant wave heights at the coast of 1 and 8 m, respectively, and mean zero-crossing wave period of 6 s (Albuquerque et al., 2021; Gorman et al., 2003).

Figure 1Sitemap of New Zealand surrounded by the Pacific Ocean (to the east), Tasman Sea (to the west), and Southern Ocean (far to the south). North Island and South Island are shown with locations of the 92 SLSNZ lifeguard patrolled beaches as triangles (intermediate morphology), circles (reflective morphology), or squares (dissipative morphology). Blue symbols show the location of the 12 SLSNZ beaches where lifeguard perceptions of rip current hazard were gathered for this study. Subpanels show wave roses of wave height directional distribution at 10 m water depth for a sample of SLSNZ patrolled beaches, with mean Spring Tide Range (STR) indicated underneath.
New Zealand has mixed semi-diurnal tides, predominantly in the meso-tidal (2–4) range with some microtidal (< 2 m range) locations. The largest and smallest tides occur on the west and east coasts, respectively, at opposing sides of Cook Strait (Costa et al., 2023), which divides the north and south islands. Due to a complete 360° range of tidal phases, there is both a high and low tide occurring along the New Zealand coast at any given time (Walters et al., 2001). The varied tide, wave, and sediment characteristics result in a wide range of coastal morphotypes (Hesp et al., 1999), including all major beach morphology states (Wright and Short, 1984) except those limited to macro-tidal environments. Figure 1 demonstrates the spatial distribution of the three main beach morphology types (dissipative, intermediate, reflective) at the beaches studied in this paper. The exposed west and east facing coastlines are dominated by intermediate “bar-rip” beach morphology, synonymous with rip currents (for example, Muriwai Beach), while wave-sheltered, tide-dominated locations exhibit dissipative morphology (for example, Tahunanui Beach), and semi-sheltered beaches with moderate tide ranges and coarser or denser sediments exhibit reflective morphology (for example, Mairangi Bay).
New Zealand's beaches are popular with locals and tourists due to their picturesque nature and amenity value for leisure and water-sports activities, such as surfing and swimming. Surf Life Saving New Zealand (SLSNZ) is the primary beach and coastal safety, drowning prevention and rescue authority and provides beach lifeguard services at 92 locations during the summer season (Fig. 1, main panel), utilising > 4500 volunteer surf lifeguards. Through their lifeguard and emergency response services, SLSNZ collects Incident Report Forms and water user head counts in their daily logs that provide an extensive catalogue of surfzone incidents back to the start of the 21st century.
2.2 Incident and head count data
Lifeguard incident data enables identification of environmental conditions associated with rip current incidents and allows us to verify whether or not an algorithm would have correctly given a rip current warning at the time of a past incident. Including both rip and non-rip related incidents, between December 2001 and November 2022, a total of 49 881 Incident Report Forms were recorded across 92 SLSNZ patrolled beaches, involving 53 847 individuals and 21 090 lifeguard rescues. Key data variables for the present analysis are the time and location at which the incident took place, the number of people rescued, the estimated cause of the incident, and a classification of the severity of the incident (“Life Threatening”, “Involved Rescue”, “Involved First Aid”, “Involved Search”, “Near Miss”, or “Patient Assistance”). Lifeguard rescues of any severity which were attributed to rip currents were considered (n = 11 121), which removes non-rip related incidents and first aid incidents not requiring lifeguard in-water response. Herein, each reference to an incident represents one individual person being rescued from a rip current. 58 SLSNZ patrolled beaches had all the required met-ocean data for the present study and could therefore be included in the analysis, reducing the usable dataset of time-stamped incidents to n = 9811 individual rip current rescues. This dataset was used to analyse environmental conditions associated with rip current incidents.
A further subset of 8911 incidents was recorded at 58 beaches where head count data were also available, enabling the probability of an individual water user being involved in a rip current incident to also be computed at those beaches (Sect. 2.3). SLSNZ lifeguards routinely conducted hourly head counts of people in the water during patrol hours since approximately 2016 and recorded these in their daily logs. Before 2016, some clubs recorded estimates of the average head count across each day. In either case, the head counts represent an estimate of the number of people present in the water at a given point in time (instantaneous exposure), and do not represent the cumulative number of water users over the observation period. Although it is accepted that head count data are subjective and not always accurate (Sect. 4), especially when large numbers (e.g., hundreds or even thousands) of water-users are present or where daily averages are provided, the head count estimates provide an approximate means by which to normalise the number of incidents occurring to account for the fact that more incidents are likely to occur when more people are present.
2.3 Exposure, life risk, and hazard
A key objective of this study is to predict when the physical hazard posed by rips is maximised. In the context of emergency and disaster risk management, the World Health Organisation (WHO) considers “Life Risk” (number of life-threatening incidents) to be the product of “Exposure”, “Hazard”, and “Vulnerability” (Kennedy et al., 2013; Saulnier et al., 2020). For example, a high degree of Life Risk could occur at a beach when only modest rip flows (i.e. with high surfzone retention and low velocity) are present if the Exposure (number of water-users present) is sufficiently high or if those water users are particularly vulnerable to the hazards due to low water competency or hazard awareness. Conversely, low Life Risk might occur at a beach with highly hazardous rip current flows (i.e. with low surfzone retention and high velocity) if few people enter the water, or if the water users have high surfzone competence.
With enough observations, this conceptual relationship allows us to parameterise rip current hazard Prip using incident counts ninc (Life Risk) and water user head counts nexp (Exposure), as the probability of an individual water user requiring rescuing from a rip current over a given time period using the following form (Kennedy et al., 2013; Saulnier et al., 2020; Stokes et al., 2017):
This parameterisation provides a proxy for the underlying physical hazard, estimated by normalising the number of incidents that occur by the number of water users exposed to the hazard. As water user vulnerability influences the number of incidents that occur, Prip has to be averaged over many observations to provide useful quantification of the physical rip hazard for a given set of forcing conditions. Equation (1) then approximates the hazard level for a water user of “average” vulnerability (swimming ability, water competency). Prip was quantified for each beach by discretising the lifeguard data into 2 h time bins and dividing the number of incidents that occur in each time period by the instantaneous number of water users counted by the lifeguards.
A subset of “high-hazard” events was also analysed, defined as conditions where Prip exceeds the 90th percentile; equivalent to Prip = 0.2. Only 448 of these events exist in the dataset and they occurred either when a single person got into a rip incident with only 5 people counted in the water or when a mass rescue event occurred with, for example, 10 simultaneous incidents with 50 people counted in the water. The data shows that the median nexp during these high-hazard events was 5 people with an interquartile range of 1–13 people and the median ninc during high-hazard events was 3 incidents with an interquartile range of 1–8 incidents (at one location in a single 2 h time period). Conversely, during “standard” rip incidents (Prip < 0.2), nexp was 53 people with an interquartile range of 27–105 people and the median ninc was 1 incident with an interquartile range of 1–2 incidents.
2.4 Wave, tide, and wind conditions
Wave, tide, and wind conditions were used in this study to investigate environmental conditions associated with rip incidents, and to generate hindcast rip hazard predictions. Wave conditions were obtained from a validated wave model hindcast with a 9 km spatial resolution (Albuquerque et al., 2021) which provided three-hourly time series of nearshore wave characteristics (significant wave height, Hs, peak wave period, Tp, and mean wave angle, Dm) for each SLSNZ beach over the study period. Local wind conditions (direction and magnitude) were estimated using the wave model forcing wind data. Time series of tidal water level were predicted for each site using a model developed by the National Institute of Water and Atmosphere (NIWA, https://tides.niwa.co.nz/, last access: 7 November 2026). The hindcast wave conditions are well correlated with observed conditions (Pearson Correlation, R ≈ 0.9, 0.8 and 0.7 for Hs, mean wave period, and mean wave direction, respectively) and have Normalised Root Mean Squared Errors on the order of 10 % for wave height and mean wave period (Albuquerque et al., 2021). Predicted tidal levels are expected to be accurate to within approximately ±20 cm, neglecting storm surge effects.
Breaking wave conditions are important to rip current analysis (Dusek and Seim, 2013a) as wave refraction, shoaling, and sheltering in the nearshore alter surfzone wave power, breaker type, and momentum flux. For the present study, breaking significant wave height Hb was estimated from the wave model output depth (typically 10–30 m) using the formula of Larson et al. (2010), which computes incipient breaking wave conditions using a simplified wave energy flux conservation equation combined with Snell's law. This assumes shore-parallel depth contours and does not account for complex nearshore bathymetry such as reefs and sandbars or sheltering from small headlands not resolved by the wave hindcast model. Despite this shortcoming, it provides a consistent method to estimate surfzone conditions on a national scale that would not be feasible using process-based modelling due to computational demand and lack of surfzone bathymetry data.
Wave, tide, and wind factors were also developed following the approach used in the UK's national-scale rip forecast (Scott et al., 2014, 2022). The dimensionless “wave power factor” Wfac represents the level of forecasted wave power relative to the average wave power at a given beach. Wfac was computed from wave conditions shoaled to 10 m depth Wfac10 m and for breaking conditions Wfacb:
where the overbar signifies time averaging across the austral summer months (DJF). We also test two forms of the tide factor, Tfac (Eqs. 3 and 4). The first form (TfacLW) from Scott et al. (2014) represents the daily low tide level relative to average low tide at a given beach, with units of meters. Values below zero indicate larger than average (i.e. spring) tidal range on a given day. The second dimensionless form (Tfac) parameterises the instantaneous predicted tide level as a proportion of the average tide range for a given site, with values of 0 and 1 equal to average low and high tide levels, respectively:
Here, η = water level, HW and LW are high-water and low-water elevation, respectively, and the overbars signify time averaging across the austral summer months (DJF). Normalised wind parameters were also computed, including the magnitude of the offshore directed wind component (“offshore wind”), where positive and negative values represent offshore and onshore directed wind velocity, respectively, and a “wind factor” parameter which represents the absolute magnitude of the cross-shore directed wind component (Wifac).
2.5 Beach morphology classification
Each of the SLSNZ lifeguarded beaches was given a static beach morphology classification using a desk-study of satellite and aerial imagery. Typically, between 10–20 images spanning the years 2003–2023 were assessed for each beach, revealing visible bed features and surfzone breaker patterns (for example, Fig. 2) which were classified as either dissipative, intermediate (including longshore bar-trough, rhythmic bar and beach, transverse bar and rip, ridge runnel/low tide terrace), or reflective using the main beach classes from the Wright and Short (1984) beach state model. While it was beyond the scope of the present study to use information about beach slope or sediment size to inform the beach classification, the satellite and aerial images provide a view of the beach under a range of tide and wave conditions over multiple seasons and years and therefore allowed qualitative assessment of the dominant summer morphology type at each site. It should be noted that these images were not intentionally chosen to coincide with times of rip current incidents. High-resolution (meter scale) imagery available in Google Earth Pro supplied by multiple providers was used for this analysis and included a mixture of commercial high-resolution satellite imagery (Digital Globe/Maxar World View, Geo Eye and Quick Bird missions), Landsat-7/8 and Sentinel-2 satellite imagery, and orthorectified aerial photography (Airbus SPOT/Pléiades, LINZ).
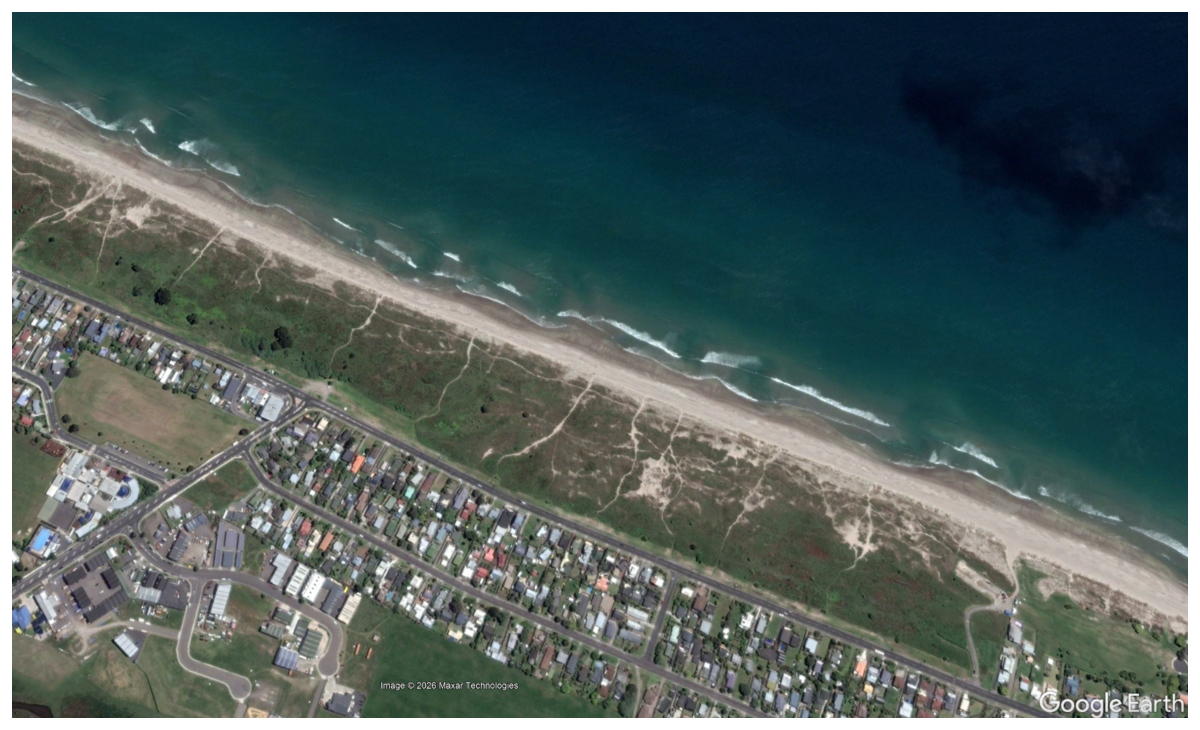
Figure 2Example satellite image from Papamoa beach from November 2011 used to inform the beach morphology classification. In this example, “transverse bar-rip” morphology features are visible from the subtidal beach surface and breaker patterns indicating an intermediate beach type. Maps data: © Google Earth 2026; images: © 2026 Maxar Technologies.
2.6 Predictive skill and comparison to lifeguard perceived hazard
To assess the skill of the developed algorithm, we consider the proportion of observed incidents (ninc) correctly associated with the upper Rip Index values (RI 2–5). This indicates a rip incident's “probability of detection” by the algorithm (Panofsky and Brier, 1953), now more commonly referred to as the recall or rate of true positives achieved by the predictive system. We also examine how often the hindcast missed an incident (i.e. RI 1 was predicted when an incident was recorded), which represents the rate of false negatives. It was not possible to examine the rate of false positives because bathing hazard can be high without an incident occurring, for example if no one enters the water or due to lifeguard preventative actions. We test the system's ability to capture the “observed” level of hazard by determining the average incident derived Prip at each of the five Rip Index levels.
Another means to assess the effectiveness of a hazard warning system is to examine its efficiency. A system that gives warnings all the time will correctly predict all the risk and hazard but will be highly ineffective due to a high rate of false alarms and low levels of user confidence. Conversely, a system that gives out warnings sparingly but captures a disproportionate amount of risk and hazard with those warnings is likely to be effective as users are more likely to pay attention when warnings occur. Efficiency is quantified as the ratio of useful output to total input (Sickles and Zelenyuk, 2019) which in the present context can be represented as:
Where r is the efficiency of the rip hazard predictor, O is the proportion of incidents or high-hazard events captured (the “useful output” of the system), and C is the proportion of time that warnings are given (the “cost” of the system).
Table 1Description of Rip Index levels and forcing thresholds used in the New Zealand Rip Forecast algorithm.

As a means to further verify the developed rip prediction algorithm, the predicted Rip Index levels were compared to lifeguard perceptions of rip hazard (Fig. 3), ranked on an equivalent 1–5 scale. The purpose of this assessment was to determine how well the predicted hazard replicates a lifeguard's perception of rip hazard. Over an austral summer season between September 2024 and February 2025, lifeguards at 12 beaches across New Zealand (Fig. 1) visually rated the rip hazard. The wave and tide conditions forecasted within 30 min of these observations were used to generate equivalent predictions of rip hazard from the developed algorithm. Lifeguards were asked to subjectively rate the rip current hazard between 1 and 5 and were provided with the rip warning levels and forcing descriptions in Table 1 as a reference. This was necessary to ensure a transferable scale between beaches with different levels of wave exposure, such as a sheltered beach where 0.5 m waves represent the most energetic conditions and a more energetic beach where waves frequently exceed 2 m. However, it is acknowledged that this information may have influenced (consciously or unconsciously) the perceived rip hazard level. In line with previous similar studies (Castelle et al., 2025; Dusek and Seim, 2013b), lifeguards were not provided with any information on expected rip current type, behaviour, or morphologic descriptors at each Rip Index level and were simply asked to subjectively rate the rip hazard. These ratings could be provided at any time during their patrols and, during validation, the model prediction used corresponded to the closest available forecast to the time the assessment was initiated. For example, if a lifeguard began an audit at 10:15 a.m. LT, the forecasted values for 10:00 a.m. LT were used. Forecast data were available for each hour and refreshed every three hours, ensuring that the most recent information as close as possible to the time of the assessment was used. 10 of the 12 beaches were intermediate beaches featuring some form of bar-rip morphology, with 1 reflective and 1 dissipative beach also included in the observation exercise (Table A1).

Figure 3Lifeguards observing surfzone conditions from the patrol tower at Papamoa Beach, North Island, New Zealand. Source: Surf Life Saving New Zealand.
3.1 Comparison of rip incidents to environmental conditions
Rip currents were attributed to 53 % of all SLSNZ recorded rescues over the study period. However, inconsistency in the method of attribution of incidents to rip currents within the Incident Report Forms (tick box versus free text entry) over certain time periods means that variation is seen in the proportion of incidents attributed to rip currents in some years (Fig. B1), and the true proportion may be higher. The majority of lifeguard data in New Zealand between 2001–2022 comes from intermediate (bar-rip) beaches, where 86 % of all lifeguard patrol hours are undertaken, while 10 % and 4 % are undertaken at dissipative and reflective beaches, respectively. Furthermore, 96 % of rip current rescues and 95 % of the highest-hazard events (Prip > 90th percentile) occurred at intermediate beaches. Dissipative and reflective beaches in comparison contribute far fewer rip incidents, at 3 % and 1 %, respectively, and fewer high-hazard events, at 5 % and 1 %, respectively. It is acknowledged that because the vast majority of lifeguards operate on intermediate beaches there is data imbalance between the three beach types. This is symptomatic of the fact that rip currents most commonly occur on intermediate morphology beaches and that surf lifesaving clubs have often been formed on beaches where people have drowned or because those beaches were risk assessed by SLSNZ and found to require lifeguards, indicating a high level of historical risk.
Figure 4 compares normalised frequency distributions of the tested met-ocean parameters against distributions of conditions at the time of rip incidents. Rip incidents were recorded over almost the full distribution of each environmental variable, suggesting that rip hazard is present over a wide range of met-ocean conditions. The difference between the background and incident related distributions is shown as either a positive or negative orange bar, with positive (negative) bars indicating conditions associated with disproportionately more (less) rip current incidents. Figure 4 (left panels) shows that rip incidents across New Zealand occurred disproportionately under moderately energetic wave conditions (Hb ≥ 1 m, peak wave period Tp ≥ 8 s, Wfac ≥ 1), with tide level around average low tide level (Tfac < 0.3). Tide range also seems to have some importance, with rip incidents disproportionately more common during spring tides (TfacLW < 0; Fig. C1) than during neap tides. Low wind speeds (Ws < 5 m s−1) also appear to be linked with a disproportionate increase in rip current incidents, relative to the occurrence of such winds.
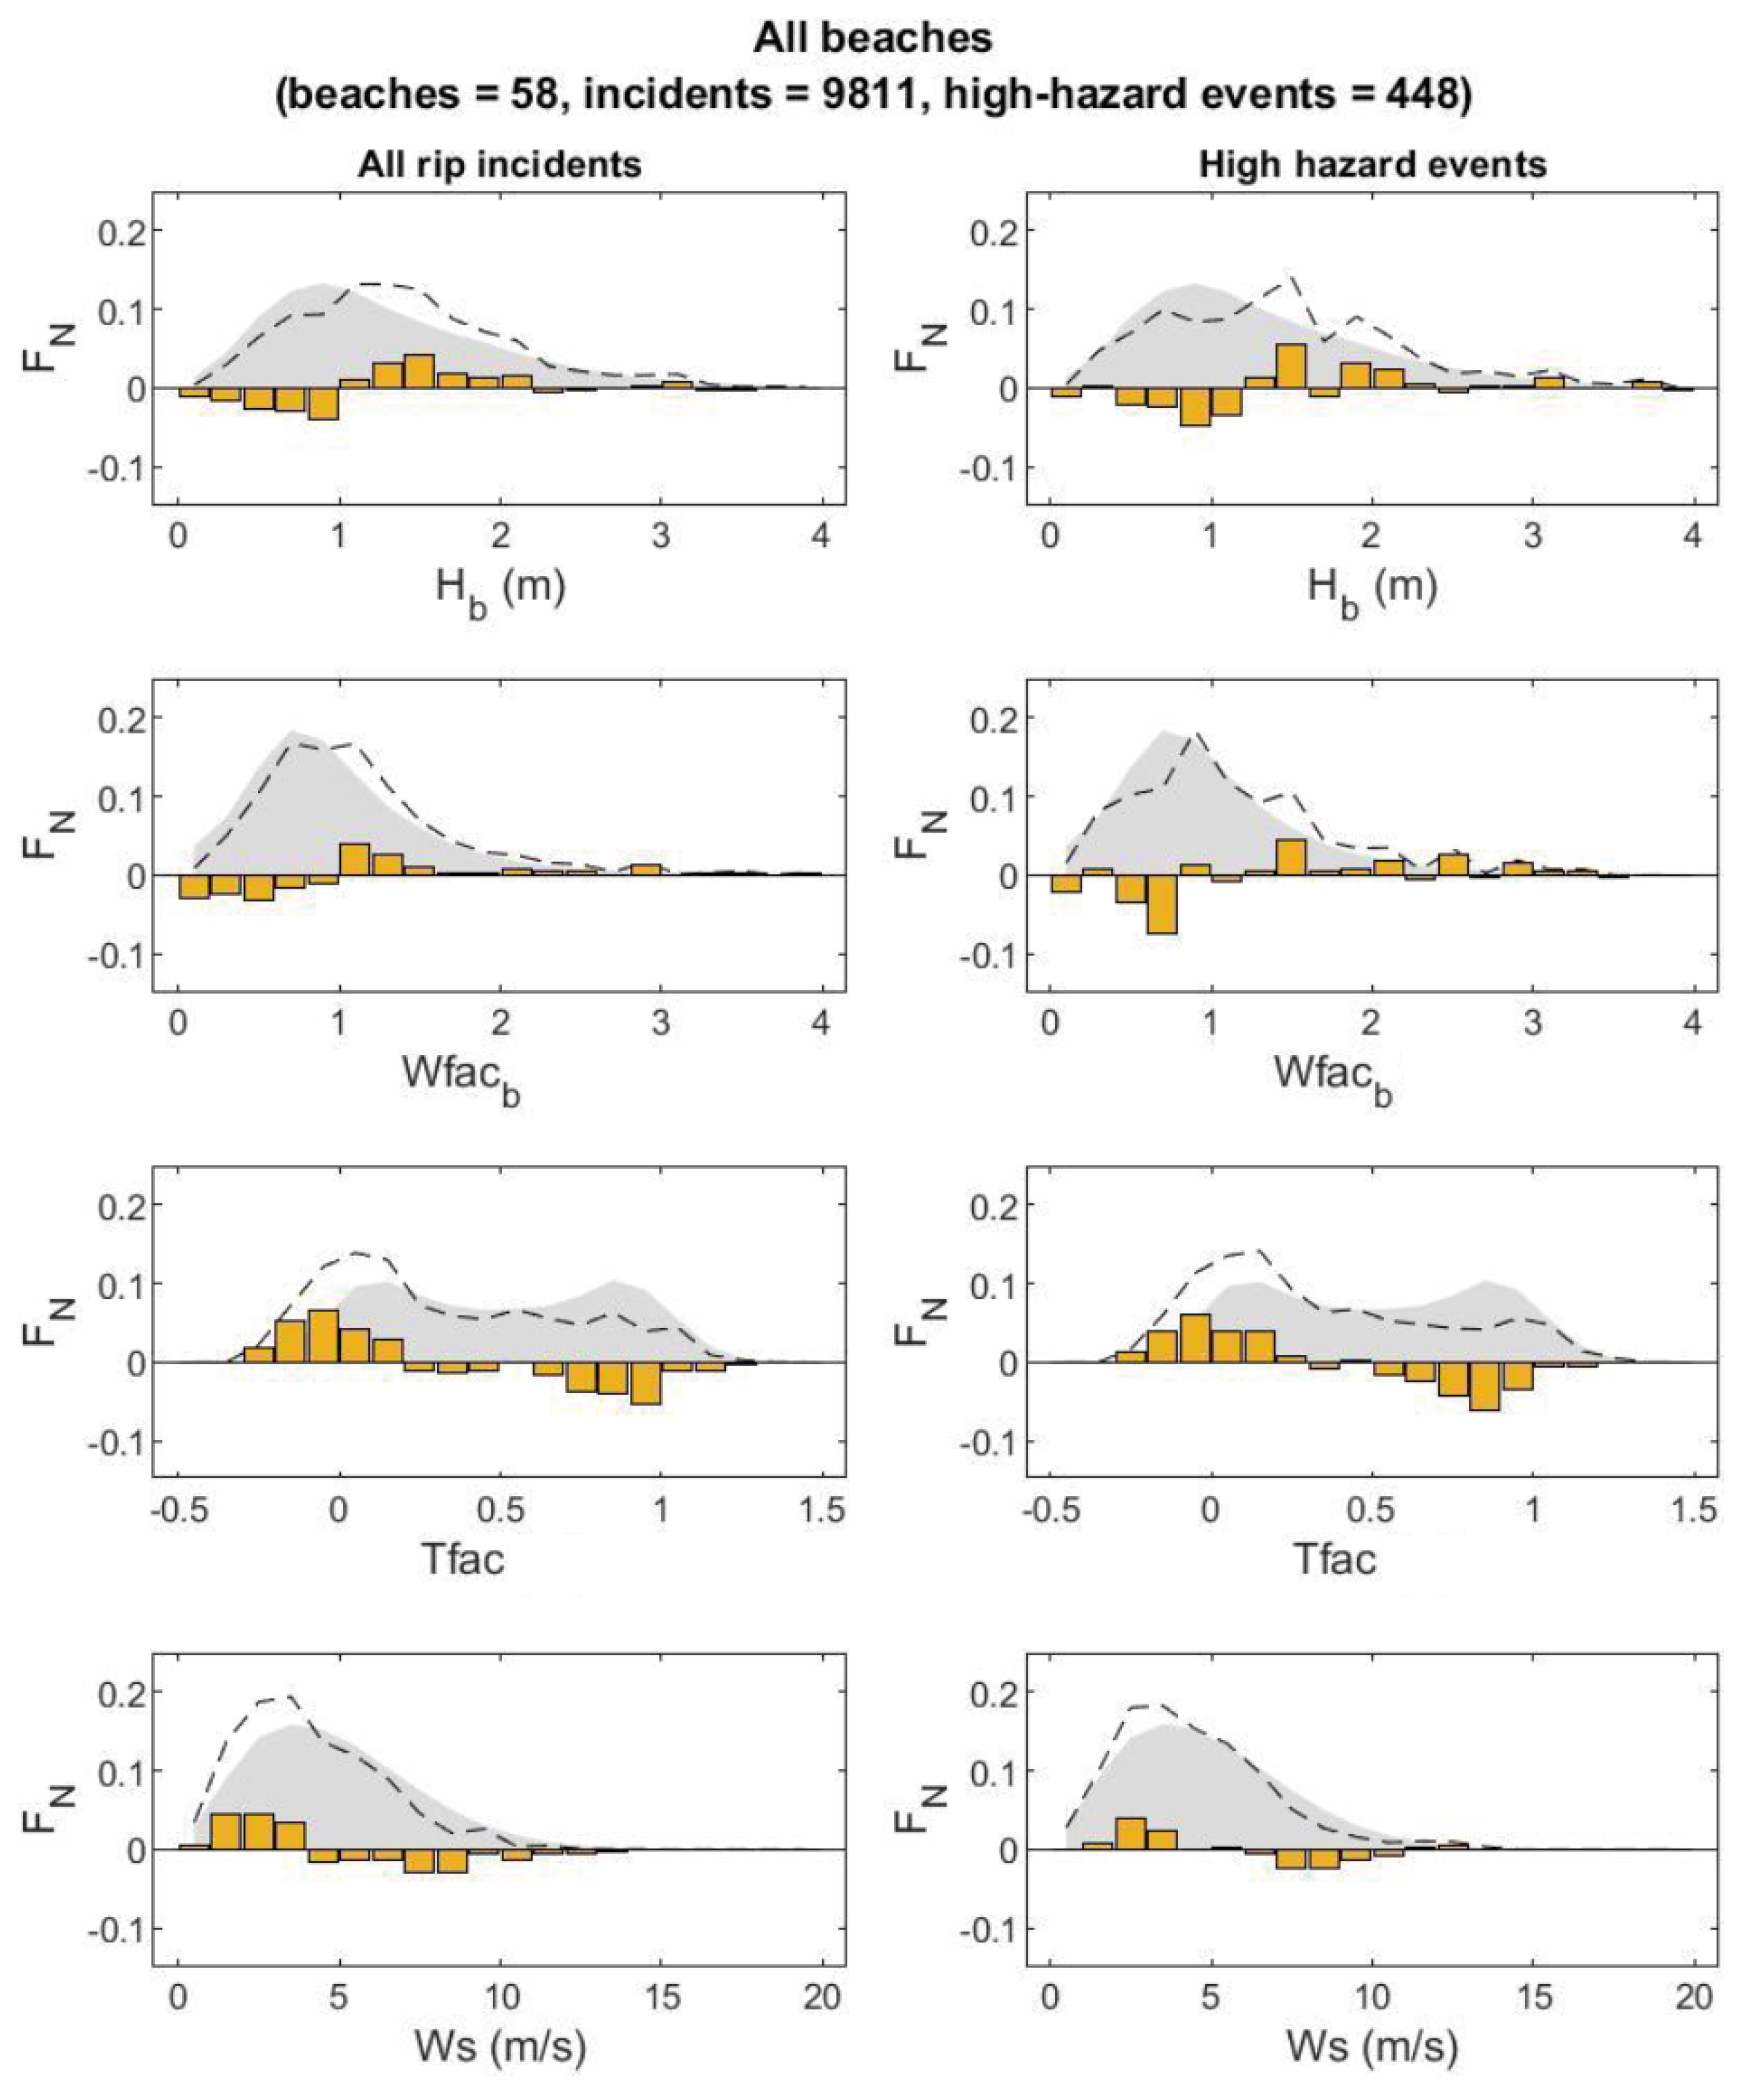
Figure 4Normalised frequency distributions FN of key forcing variables at times of rip current incidents (left panels) and for Prip > 90th percentile – “high-hazard events” (right panels). From top to bottom panels show breaker significant wave height Hb, Wave Factor at break point Wfacb, Tide Factor Tfac, and wind speed Ws. Dashed lines show conditions occurring during rip current incidents, while grey shaded areas show the background distribution that occurs naturally over the Austral summer (December, January, February). The difference between the background and incident related distributions is shown as either a positive or negative orange bar, with positive (negative) bars indicating conditions associated with disproportionately more (less) rip current incidents.
These relationships also hold true for the most hazardous conditions observed (Prip > 90th percentile), as demonstrated in Fig. 4 (right panels), albeit with slightly elevated thresholds for breaker height (Hb > 1.2 m) and wave factor (Wfac > 1.4). Under increasingly large breaker heights the distribution of rip incidents is approximately the same as the background forcing distribution, but some increase in high-hazard events is noticeable at Hb > 2.5 m (Fig. 4, top right panel). This confirms that the previously identified thresholds do not just relate to increased numbers of incidents (which could occur during the most popular conditions, for example), but that a higher level of overall hazard occurs during the identified conditions as well.
In general, the comparison between rip incidents and environmental forcing conditions suggests that there is a disproportionate increase in rip current Risk and Hazard when:
-
Hb ≥ 1 m
-
Wfac ≥ 1
-
Tfac < 0.3
-
Ws < 5 m s−1
Significantly fewer incidents were recorded at the 7 dissipative beaches studied (incidents = 327, high-hazard events = 16) and 2 reflective beaches studies (rip incidents = 28, high-hazard events = 2), than at the 49 intermediate beaches in the dataset (incidents = 9456, high-hazard events = 430). The distributions are noisier at dissipative and reflective beaches due to the relatively low data counts. However, the thresholds remain relevant for each of the three main beach types studied (Appendix C). Across all the data, the average likelihood of a water user being involved in a rip incident at an SLSNZ lifeguarded beach is = 0.0020 (1 rip-related incident per 500 people in the water). However, this varies significantly between the main beach types, with hazard highest at intermediate beaches ( = 0.0022) and significantly lower at reflective beaches ( = 0.00009) and dissipative beaches ( = 0.00062).
3.2 Rip forecast algorithm
To develop a predictive algorithm for rip current hazard, the transitions in forcing associated with a switch from disproportionately fewer to greater incident numbers (Sect. 3.1) were used as thresholds to define 5 “Rip Index” levels (Table 1). As Hb and Tfac both displayed a strong relationship to rip incidents and high-hazard events, the algorithm relies on the identified thresholds in those parameters alongside a binary bar-rip beach morphology variable determined from an intermediate or non-intermediate morphology classification. Rip Index 1 is given during low energy wave conditions (Hb ≤ 0.5 m), when few incidents were recorded. Rip Index 2 is given under moderate waves (Hb ≤ 1 m threshold) acting on non-bar-rip morphology, which is assumed to occur at any stage of the tide at non-intermediate beaches, or at intermediate beaches during mid to high tide levels (Tfac ≥ 0.3 threshold). Rip Index 3 is given under either (a) energetic waves (Hb ≥ 1 m threshold) at non-intermediate beaches, or (b) moderate waves (Hb ≤ 1 m threshold) and low tide (Tfac ≤ 0.3 threshold) at intermediate beaches. Rip Index 4 is only given under energetic waves when tide is at or below average low tide level at intermediate beaches (Hb ≥ 1 m and Tfac ≤ 0.3 thresholds). Rip Index 5 was included to capture high-energy conditions when surfzone currents (whether classically defined as rips or not) are likely to be strong (Hb > 2.5 m threshold).

Figure 5Example time series of forcing conditions (Tide Factor, Tfac and Significant breaking wave height, Hb) and Rip Index values, compared to in-water population (IWP) and number of incidents (INC) during lifeguard patrol hours over an Austral summer at Muriwai Beach (Intermediate morphology; see Fig. 1 for location). Occurrences of rip incidents are shown as triangles alongside their associated Rip Index prediction in the middle panel.
Using these thresholds a decision tree algorithm, herein referred to as the NZ Rip Forecast, was used to generate Rip Index predictions from predicted wave and tide conditions and the pre-determined beach morphology class. An example time series of forcing conditions and resulting Rip Index values is compared to IWP and INC values at Muriwai Beach in Fig. 5. To assess the performance of the algorithm (Sect. 2.6), hindcast Rip Index predictions were generated over the time period 2001–2022 at an hourly resolution by applying the environmental forcing data (Sect. 2.4) to the algorithm described in Table 1.
3.3 Performance of the Rip Forecast algorithm
3.3.1 Predicting rip current risk
Firstly, we compare hazard predications (RI 2–5) with incident occurrence (observed risk). Across the studied beaches, the recall (proportion of true positives) of the NZ Rip Forecast was 98 % (Fig. 6). False negatives therefore occurred 2 % of the time, with the algorithm predicting RI 1 (predicted Hb ≤ 0.5 m) during those recorded incidents. This recall rate was achieved by issuing rip warnings (RI 2–5) 92 % of the time; the low energy wave conditions associated with RI 1 therefore occurred a small proportion (8 %) of the time at the studied SLSNZ beaches, but rip incidents also occurred infrequently (2 %) under those conditions. Most past incidents occurred at RI 3 (39 %) and RI 4 (42 %). 10 % of past rip incidents occurred when RI 5 was predicted by the algorithm. While RI 5 is intended to represent “very high hazard”, it is included in the forecasts to capture times when high wave energy drives very strong surfzone currents, regardless of whether they typify a rip current flow. Because RI 5 occurs only under very large waves when water-user exposure is expected to be reduced, the rip current risk is lower under RI 5 than at RI 4.
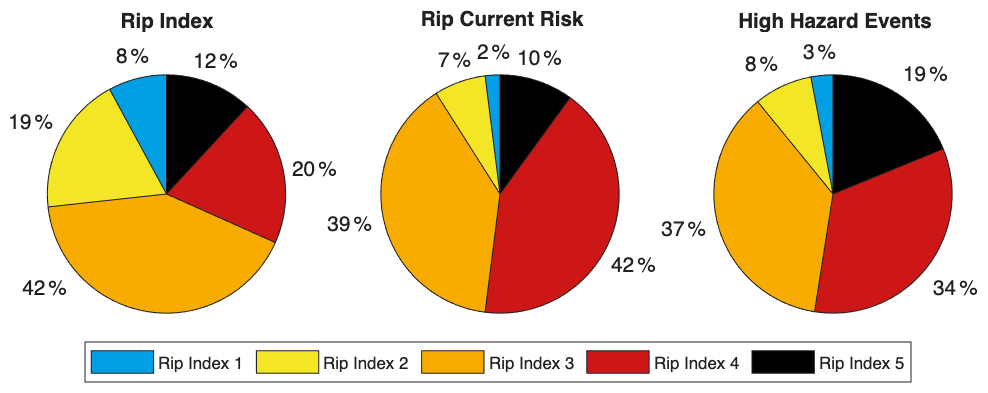
Figure 6Summary of the performance of the NZ Rip Forecast against 22 years of SLSNZ rip incident data collected at 58 beaches (8911 incidents). Proportion of Rip Index levels forecasted (upper left), proportion of rip current incidents “Risk” at each Rip Index (upper right), average probability of an individual water user being involved in a rip incident “Hazard” at each Rip Index (lower left), and proportion of high-hazard (Prip > 90 percentile) events at each Rip Index (lower right).
The efficiency of the algorithm (Eq. 5) at predicting incidents increases as the RI level increases. Looking at all warnings in excess of RI 1 the efficiency is 1.06, meaning that a slightly larger proportion of incidents happen at RI 2–5 than the proportion of time those warnings are given. However, for RI > 2 efficiency increases to 1.23, and at RI > 3 efficiency is 1.63. This suggests that warnings above those thresholds are given sparingly relative to the proportion of incidents they capture. For example, RI 4 was predicted 20 % of the time but captured 42 % of all SLSNZ rip incidents.
3.3.2 Predicting rip current hazard
The average rip current hazard occurring at each RI level was computed from the lifeguard incident and head count data using Eq. (1). Figure 7 indicates that the probability of a water user being involved in a rip incident increases exponentially from RI 1–5, with Prip increasing an order of magnitude between RI 1 (Prip = 0.0008) and RI 4 (Prip = 0.0055) and remaining high at RI 5 (Prip = 0.0048). 90 % of the high-hazard events (Prip > 90th percentile) occurred at RI 3–5. The algorithm captured slightly lower hazard at RI 5 than at RI 4, indicating that larger waves (RI 5) do not necessarily lead to higher hazard levels than moderate waves acting on low tide bar-rip morphology (RI 4).
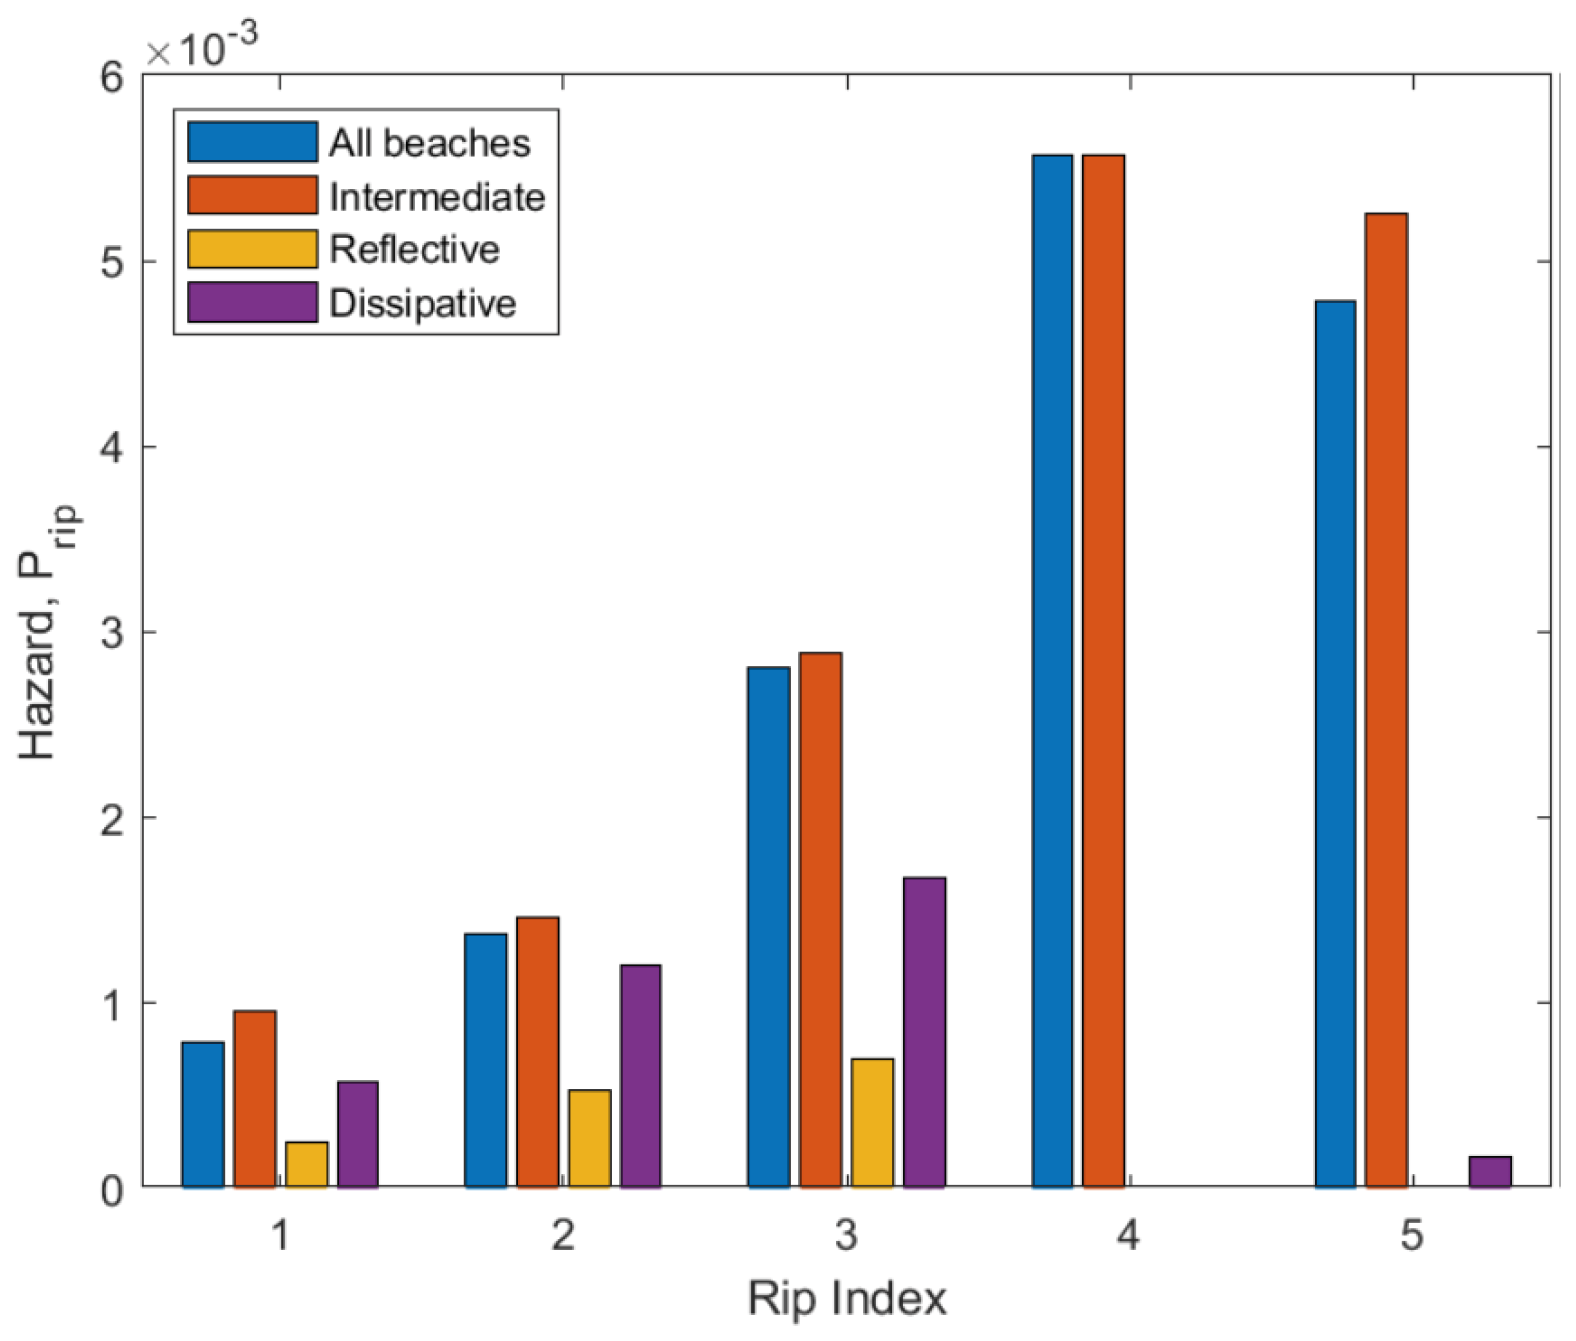
Figure 7Average probability of an individual water user being involved in a rip incident, Prip, at each Rip Index level for different beach morphology types.
As with rip current risk, the algorithm is increasingly efficient at capturing high-hazard events as RI increases. For warnings above RI 1, the efficiency is 1.05 meaning the algorithm captures a slightly larger proportion of high-hazard events than the proportion of time warnings are given. The efficiency increases to 1.22 at RI > 2 and to 1.66 at RI > 3. This means that high-hazard events occur frequently at RI 3–5 relative to the number of warnings given.
For each of the three main beach morphology types (Dissipative, Intermediate, Reflective), increasing rip hazard was captured at RI 1–3 by the algorithm (Fig. 7). For non-bar-rip morphology (Dissipative and Reflective) beaches, an approximately linear increase in rip hazard is observed with increasing breaker height between RI 1–3, with Dissipative beaches exhibiting more rip current hazard at each RI level than Reflective beaches. The highest hazard levels and steepest increase in hazard with RI level occurs at bar-rip (intermediate) beaches, where an exponential increase in hazard was captured between RI 1–4 (Fig. 7). RI 4 only applies to bar-rip beaches and is a key level in the algorithm as it represents a high-risk, high-hazard scenario, when channel rip activity is expected to be at its peak. A slight decrease in hazard occurs at RI 5 for intermediate beaches. Few incidents occurred under RI 5 at dissipative beaches and no incidents at all occurred at RI 5 at reflective beaches.
3.3.3 Comparison to lifeguard hazard perceptions
Lifeguards conducted a total of 568 rip hazard assessments over the austral summer season between late September 2024 and early February 2025 (Table 2). Participation across the 12 patrol locations (Fig. 1) varied, with an average of 4.3 assessments per day. Perfect agreement between lifeguard observations and the forecast occurred in 53 % of cases across all patrol locations. When lifeguards perceived the hazard to be between RI 2 and RI 5 (i.e. when some level of rip hazard was present), the level of perfect agreement with the algorithm was between 64 %–86 %. Among the 266 assessments where discrepancies were recorded, 158 ratings (28 % of all assessments) were perceived to be one index level lower than the forecasted rip hazard.
Table 2Percentage of rip forecast predictions at each lifeguard perceived hazard level. Light to dark green indicates increasing levels of agreement. Totals (counts) are provided in the “All” column and row.

There were few cases overall (1.58 %) where the rip forecast algorithm underpredicted rip hazard relative to the lifeguard perceived hazard. However, 17 % of the assessments rated at RI 4 or 5 by lifeguards were underestimated by 1–2 levels by the algorithm. Disagreements were most frequent when RI 1 was perceived by lifeguards. Under such conditions, the algorithm occasionally predicted up to RI 4, suggesting that the lifeguards perceived the hazard to be low despite the modelled wave conditions being Hb ≥ 1 m in some cases.
Combining instances of perfect agreement with those perceived by lifeguards to be one RI level lower than the predicted RI provides a conservative measure of overall agreement. As such, it is reasonable to infer an overall agreement rate of approximately 81 %. This indicates a generally high level of consistency between the rip forecast model and lifeguard perceptions of rip hazard, albeit with a tendency for the rip hazard algorithm to occasionally overpredict the lifeguard perceived hazard.
This study developed a threshold-based forecasting system for predicting times of high rip hazard using a large dataset of rip-related incidents and associated water user head counts. While a number of previous studies have developed rip forecasts with good predictive power, these have often been optimised and tested on relatively few years of data or using data from only one or a few beaches (Castelle et al., 2025; Dusek and Seim, 2013a; Engle, 2003; Lee et al., 2018) and require further verification to determine how well the predictions generalise to other coastal settings. Prior to national implementation by the National Oceanic and Atmospheric Administration in the USA, the algorithm of Dusek and Seim (2013a) was tested against in-situ flow measurements near Duck, North Carolina (Moulton et al., 2017) and additional lifeguard observations at five locations across Florida, North Carolina, and California (Churma et al., 2017; Gibbs et al., 2015), indicating good correlation with rip intensity observations. That algorithm is already used to generate operational rip forecasts for New Zealand by the “Swellmap” platform (https://www.swellmap.com/potential-rip-hazard-forecasts/new-zealand, last access: 7 November 2026). However, the predictions may not represent rip hazard at beaches with significantly different wave climate, tides, and morphology to the 6 beaches on which it was developed, and consideration of many tens of sites in the optimisation and validation of a rip forecast is therefore desirable.
Given the expense of fieldwork and numerical modelling, the use of incident data or lifeguard hazard perceptions are some of the only feasible means to achieve this. However, where larger scale studies of rip incidents have been undertaken, water-user numbers and forcing climatology have sometimes not been accounted for (Arun Kumar and Prasad, 2014), raising questions around whether physical hazard is being predicted or simply times when the most incidents occur. Such systems are susceptible to false negatives (“misses”) as high hazard often occurs during inclement weather or large wave conditions when water user exposure, and therefore total incidents numbers are low (Castelle et al., 2020; Scott et al., 2014). The present study has sought to overcome these limitations by analysing ∼ 9000 incidents collected at 58 beaches in New Zealand, accounting for water-user exposure and the background climatology of forcing variables. While this provides good quantification of life risk and allows physical hazard to be inferred from the normalised incident numbers, future research could seek to further improve the Rip Index levels by associating each level with contextual data such as indicative flow speeds from in-situ measurements, or rip current types, number, and size from in-situ or remote (i.e. aerial or satellite) observations.

Figure 8Diagram of the New Zealand Rip Hazard Index describing thresholds in Hb (significant breaking wave height) and Tfac (tide level as a proportion of the average tide range), as well as conceptual rip behaviours and hazard level Prip (incidents per water users exposed) associated with each Rip Index level.
The developed rip prediction algorithm is extremely simple and uses no statistical modelling other than the identification of thresholds in key forcing variables known to contribute to rip hazard. It uses just two temporally varying predictors (Hb and Tfac) and one “static” binary predictor (intermediate beach type). The forcing thresholds, conceptual rip current behaviour, and hazard level associated with each Rip Index level are depicted in Fig. 8. These variable choices were informed by both the present analysis and by previous studies that have shown wave energy, tide, and beach morphology to be key factors driving rip hazard (Castelle et al., 2016). However, other predictor variables could have been included. The Wfac parameter has been found in previous studies to correlate with occurrence of rip incidents (Castelle et al., 2019, 2025; Scott et al., 2014) and lifeguard hazard perceptions (Castelle et al., 2025). The present data set concurs with these previous findings, although contrary to Scott et al. (2014) we see disproportionately more rip incidents with Wfac ≥ 1, supporting the observation of Castelle et al. (2020) that wave power in excess of the mean leads to the highest levels of rip current hazard. Similarly, rip incidents showed a clear increase when Hb exceeded 1 m in the present study – approximately the background mean value (Fig. 5). Hb was chosen to be included in the developed algorithm instead of Wfac as it is a more intuitive parameter for non-scientists to understand, and because in highly sheltered (exposed) locations mean Wfac is exceeded during very low (high) energy conditions which could lead to false positives (negatives).
Shore-normal wave incidence has been linked to increased rip flow speed in channel rips (Castelle et al., 2020; Dusek and Seim, 2013a; Long and Özkan-Haller, 2016; Moulton et al., 2017), while oblique wave incidence is known to be important for boundary rip circulation (Mouragues et al., 2021; Scott et al., 2016). The importance of wave period on rip hazard has also been debated in the literature (Castelle et al., 2025; Moulton et al., 2017). Despite the lack of wave angle or period as predictors in the developed NZ rip forecast, it successfully differentiates risk and hazard across the five Rip Index levels. This may be because both wave angle to the shore and wave period are considered in the calculation of Hb, making it a functional predictor of rip hazard. Local wind velocity has been used for rip forecasting in at least two previous studies (Lushine, 1991; Scott et al., 2022) but has been disregarded by others (Castelle et al., 2025; Dusek and Seim, 2013a). The data from New Zealand shows an apparent link between light (< 3 m s−1) onshore directed winds and increased rip incidents and high-hazard events (Fig. 5), which concurs with previous observations that more incidents occur during either light winds (Engle, 2003; Scott et al., 2022) or onshore winds (Gensini and Ashley, 2010; Lushine, 1991). For example, Gensini and Ashley (2010) found that onshore winds were associated with 70 % of rip drownings in the USA. Future research should therefore seek to clarify whether there is a physical mechanism linking onshore directed wind and rip current hazard, or whether the apparent links are an artefact of wind climatology.
The algorithm captures past rip incidents best at beaches with intermediate bar-rip morphology (99 % recall) using thresholds based on breaker height and tide level, but acceptable skill is also achieved at reflective beaches (80 % recall) and dissipative beaches (82 % recall) using thresholds based on breaker height alone. While the vast majority of incidents (96 %) and high hazard events (95 %) were recorded at Intermediate beaches, rip incidents were recorded at Dissipative (3 %) and Reflective (1 %) beaches too. Given the lack of defined bar-rip features at those beach types, it is assumed those incidents are caused by either hydrodynamic instabilities such as flash rips, or boundary rip currents (Fig. 8). The acceptable recall and ability of the forecast to capture increasing Prip using thresholds in breaker height alone suggests it is a useful indicator of rip hazard for beaches lacking bar-rip morphology. It is possible that the apparent decrease in hazard at RI 5 could be due to surfzone saturation under very large breakers causing shoreward bores that inhibit seaward rip flows (Castelle et al., 2016), especially at beaches lacking bar-rip morphology. However, the paucity of rip-related incidents under RI 5 at reflective and dissipative beaches is largely driven by the fact that Hb > 2.5 m occurred less frequently at those beaches than at intermediate beaches (Appendix C). This makes it difficult to achieve a statistically robust estimate of rip hazard at RI 5 for non-intermediate beaches but does not provide reliable evidence that hazard is reduced or absent.
Lifeguard-collected incident data has limitations, including poorly recorded or missing timestamps (impacting ability to link to forcing), subjective attribution to rip currents, subjective need for rescue to take place, and influence of water-user exposure and vulnerability on incident numbers. Where head count data are available to normalise incident numbers, they are not always reliable and are assumed to represent the average exposure over a given period. When a few tens of water users are present it can be assumed that these are actual head counts of each individual in the water, but with larger numbers present these head counts will involve estimation and will therefore vary between different lifeguards, introducing subjectivity to the data. Furthermore, because of the unaccounted variation in water user vulnerability, the individual likelihood of an incident is a noisy proxy for hazard that is only useful when averaged over large numbers of incidents. Despite these limitations, the present analysis strongly supports conclusions from previous studies based on field experiments, numerical modelling, and lifeguard hazard perceptions that have found rip hazard increases during wave conditions at or above average breaker height with tide level at or below average low tide (Castelle et al., 2020; Moulton et al., 2017; Scott et al., 2014). This demonstrates that normalised incident numbers represent rip current hazard in a physically sensible manner. A unique strength of incident data is that it reveals conditions that most often lead to bathers getting into trouble due to rip currents. While this indirectly represents the physical hazard, it directly represents the outcome of most interest to coastal hazard managers.
Incident severity is often recorded by lifeguards. Incidents were not distinguished by severity in the present study as many non-environmental factors influence whether an incident is “Life Threatening” or even “Fatal” and filtering would have also reduced the sample size considerably. However, previous studies of fatal rip incidents have demonstrated that low tide levels and average to above average wave height and period can be linked to the most severe rip incident outcomes (Castelle et al., 2020; Koon et al., 2023), supporting the rip index thresholds chosen in this study. Demographics were also not analysed here, but it is known that young males are over-represented in rip incident statistics (Castelle et al., 2018; Gensini and Ashley, 2010; Woodward et al., 2013), and in New Zealand over estimation of ability and underestimation of risk are thought to be contributing factors (Stanley et al., 2024). Similar biases are expected in the present data set, and the incident likelihood statistics may over-represent young males compared to other demographic groups.
A degree of uncertainty is brought into the algorithm through the use of modelled tide and wave data (Albuquerque et al., 2021). This may explain, for example, why rip incidents were in some cases linked to very low energy conditions (Hs < 0.2 m, Tp < 5 s) and may have been forced by larger waves in reality. Breaker conditions were estimated from nearshore model output locations using linear shoaling and Snell's refraction law (Larson et al., 2010), which leads to inaccuracies in locations that are sheltered within small embayments or where the nearshore morphology diverges significantly from a planar slope. At some forecast locations, this may lead to overprediction of hazard, as sheltering or wave dissipation through breaking may not be well represented. Beach morphology is a key driver for bathymetrically controlled rips and is accounted for in the present system only in a static, binary form, which assumes the presence or absence of bar-rip features is relatively static on a seasonal timeframe (Castelle et al., 2016; Scott et al., 2014). Dusek and Seim (2013a) demonstrated some predictive skill by including a time-varying proxy for morphological relief in their algorithm, although it was found to have weaker predictive power than other variables (Dusek and Seim, 2013a; Moulton et al., 2017). A generalisable and computationally inexpensive predictor for morphological relief of bar-rip features is yet to be demonstrated in the scientific literature but could help improve predictive skill in rip current forecasts.
The ability of the NZ rip forecast to achieve a high recall rate, capture increasing hazard at each Rip Index level, and conservatively agree with lifeguard hazard perceptions provides confidence that the system is appropriate for forecasting rip hazard in New Zealand. SLSNZ are now using this algorithm internally to forewarn lifeguard managers of times of peak rip hazard and are working on a technical and operational readiness plan to implement the rip hazard forecast publicly alongside water quality warnings on the “Safeswim” online platform (https://safeswim.org.nz/, last access: 7 November 2026). The former is expected to help mitigate rip current risk by informing lifeguard rostering days ahead of high-hazard times, while the latter could help inform water users of the risk posed by rips and help inform their decisions about where to bathe on a given day (for example, choosing a lifeguarded beach over a non-lifeguarded beach). Future research should evaluate how the Rip Index is best communicated to different end users. While experienced lifeguards at familiar beaches may already recognise periods of elevated rip hazard, the forecast could provide additional decision support for novice lifeguards or personnel deployed to unfamiliar locations. For the public, a simple beach-specific 1–5 hazard scale paired with consistent behavioural guidance may be more appropriate than treating each elevated value as a discrete warning, particularly at exposed beaches where high hazard levels may occur frequently. Evaluation of a public-facing system should therefore extend beyond forecast skill to include warning comprehension, perceived risk, trust, behavioural response, and, where feasible, changes in safety outcomes.
Outside of New Zealand, the findings are potentially generalisable to other locations with comparable micro-meso tide range and associated beach morphology types, as the sampled wave conditions are common to most beaches globally (breaker heights and periods up to 4 m and > 15 s, respectively). The absolute thresholds in breaker height determined in the present are comparable to findings from other countries (Castelle et al., 2020; Dusek and Seim, 2013a; Moulton et al., 2017; Scott et al., 2014). In particular, the 0.5 and 1 m breaker heights we use to define thresholds at RI 2–3 align with the steep increase in rip likelihood observed in the USA by Dusek and Seim (2013a). Comparable tide thresholds were also linked to increased rip incidents in the macrotidal setting of southwest UK (Scott et al., 2014, 2022), and along the microtidal coast of Australia (Koon et al., 2023). With further testing, the New Zealand rip forecast may therefore provide a simple and computationally in-expensive means to forecast rips in other countries.
This study utilised approximately 9000 rip incidents and associated lifeguard head counts spanning 21 years at 58 beaches in New Zealand to develop a threshold-based rip prediction algorithm. This was then compared to lifeguard hazard perceptions at 12 beaches over one summer season. To our knowledge, this represents the longest running rip incident data set analysed, and most widely validated rip forecast in the literature to date. The developed algorithm is extremely simple and uses no statistical modelling other than the identification of thresholds in key forcing variables known to contribute to rip hazard. The analysis shows strong agreement with previous findings from field experiments and numerical modelling in concluding that rip current hazard is disproportionately increased during wave conditions at or above average breaker height and with tide level at or below average low tide (Castelle et al., 2020; Moulton et al., 2017; Scott et al., 2014).
Rip currents were attributed to 53 % of all SLSNZ recorded rescues made over the data record. Surprisingly, rip incidents were recorded under almost the full range of met-ocean conditions studied and no conditions (with the exception of zero wave energy) should be considered completely free of rip risk for water users. While bar-rip morphology was linked to the majority of rip incidents, they were also recorded by lifeguards at dissipative and reflective beaches in New Zealand. However, the data suggests that water users at intermediate beaches are 4 times more likely to be involved in a rip incident than those at dissipative beaches, and 25 times more likely than those at reflective beaches.
We have demonstrated using simple thresholds in breaker height and relative tide level, as well as consideration of beach morphology type, that high incident recall (2 % false negatives) can be achieved with exponentially increasing rip hazard captured across five Rip Index levels. Because water user exposure has been accounted for, the developed Rip Index levels represent the physical hazard that is expected to occur, regardless of how many people enter the water. A water user is 6 times more likely to be involved in an incident at the highest Rip Index level (∼ 1-in-200) than when Rip Index 1 is predicted (∼ 1-in-1200), with warnings above Rip Index 3 given sparingly relative to the proportion of incidents they capture. The forecast algorithm captures past rip incidents best at beaches with intermediate “bar-rip” morphology (99 % recall) using thresholds based on breaker height and tide level, but acceptable skill is also achieved at reflective beaches (80 % recall) and dissipative beaches (82 % recall) using thresholds based on breaker height alone.
The predictions conservatively replicate lifeguard perceptions of rip hazard with an overall agreement rate (either exactly the same or one level higher) of 81 %, providing confidence that the system can generate warnings consistent with those of a lifeguard. This provides opportunities to forewarn the public during times of high rip current hazard at un-lifeguarded beaches or outside lifeguard patrol hours. SLSNZ are now in the process of operationalising the NZ rip forecast algorithm nationally, on a public-facing web application. With further testing, the New Zealand rip forecast may provide a simple and computationally in-expensive means to forecast rips in other countries.
Table A1List of Surf Lifesaving New Zealand patrolled beaches and their associated beach morphology classification as either Reflective, Intermediate, or Dissipative (Sect. 2.5), and as a binary bar-rip morphology type (Yes for Intermediate, No for Dissipative/Reflective) as used in the developed NZ rip forecast algorithm (Sect. 3.2). The final column indicates whether lifeguards at that beach were involved in collecting rip current hazard perceptions for the present study.

The reporting in the incident records exhibits some inconsistencies, with a binary field for “Rips/Holes” (Rip channels and associated rip flows are often referred to as “holes” by SLSNZ lifeguards) present on the IRFs between 2001–2016, but no such field available for data between 2017–2022. Therefore, to arrive at the complete number of rip incidents mentioned above, a text search within the incident narratives was required to isolate any missing rip current incidents, especially for the period when a binary “Rips/Holes” field was not used on the IRFs. Narratives including the words “rip(s)” and “current” were initially isolated and then manually verified, resulting in 1170 additional rip incidents between 2017–2022. It is apparent from the number of recorded incidents per year (Fig. B1) that during the years when only free-text entries were used to describe the cause of incidents (2017–2022) far fewer rip incidents were recorded than in previous years. As there is no known reason for a statistical drop in incidents to have occurred, it is assumed that rip incidents were underreported during these years due to the need for free-text entry, or in some cases that incidents were missed by the text search because other terminology may have been used. It is therefore possible that the total proportion of incidents attributed to rip currents is even higher than the 53 % stated above.
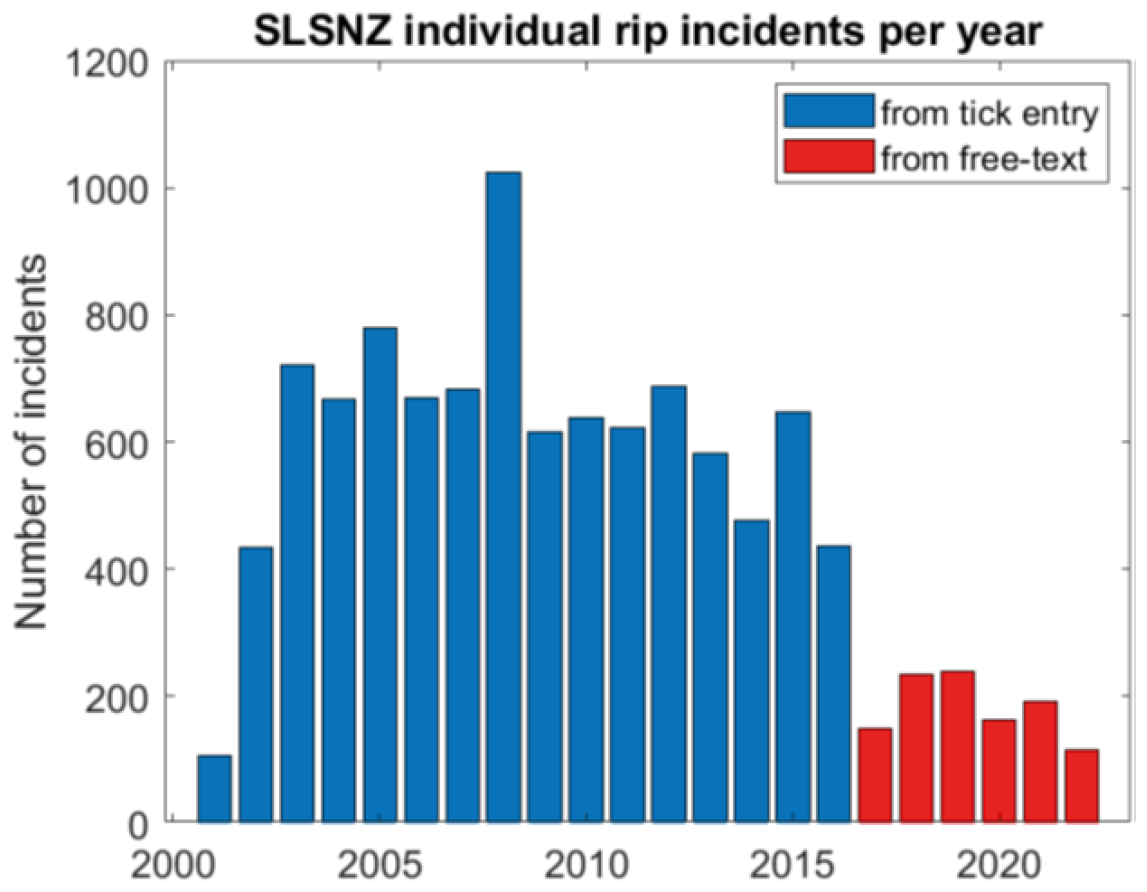
Figure B1Number of rip current related incidents reported by SLSNZ lifeguards per year. Each incident represents one individual person rescued or assisted from a rip current.
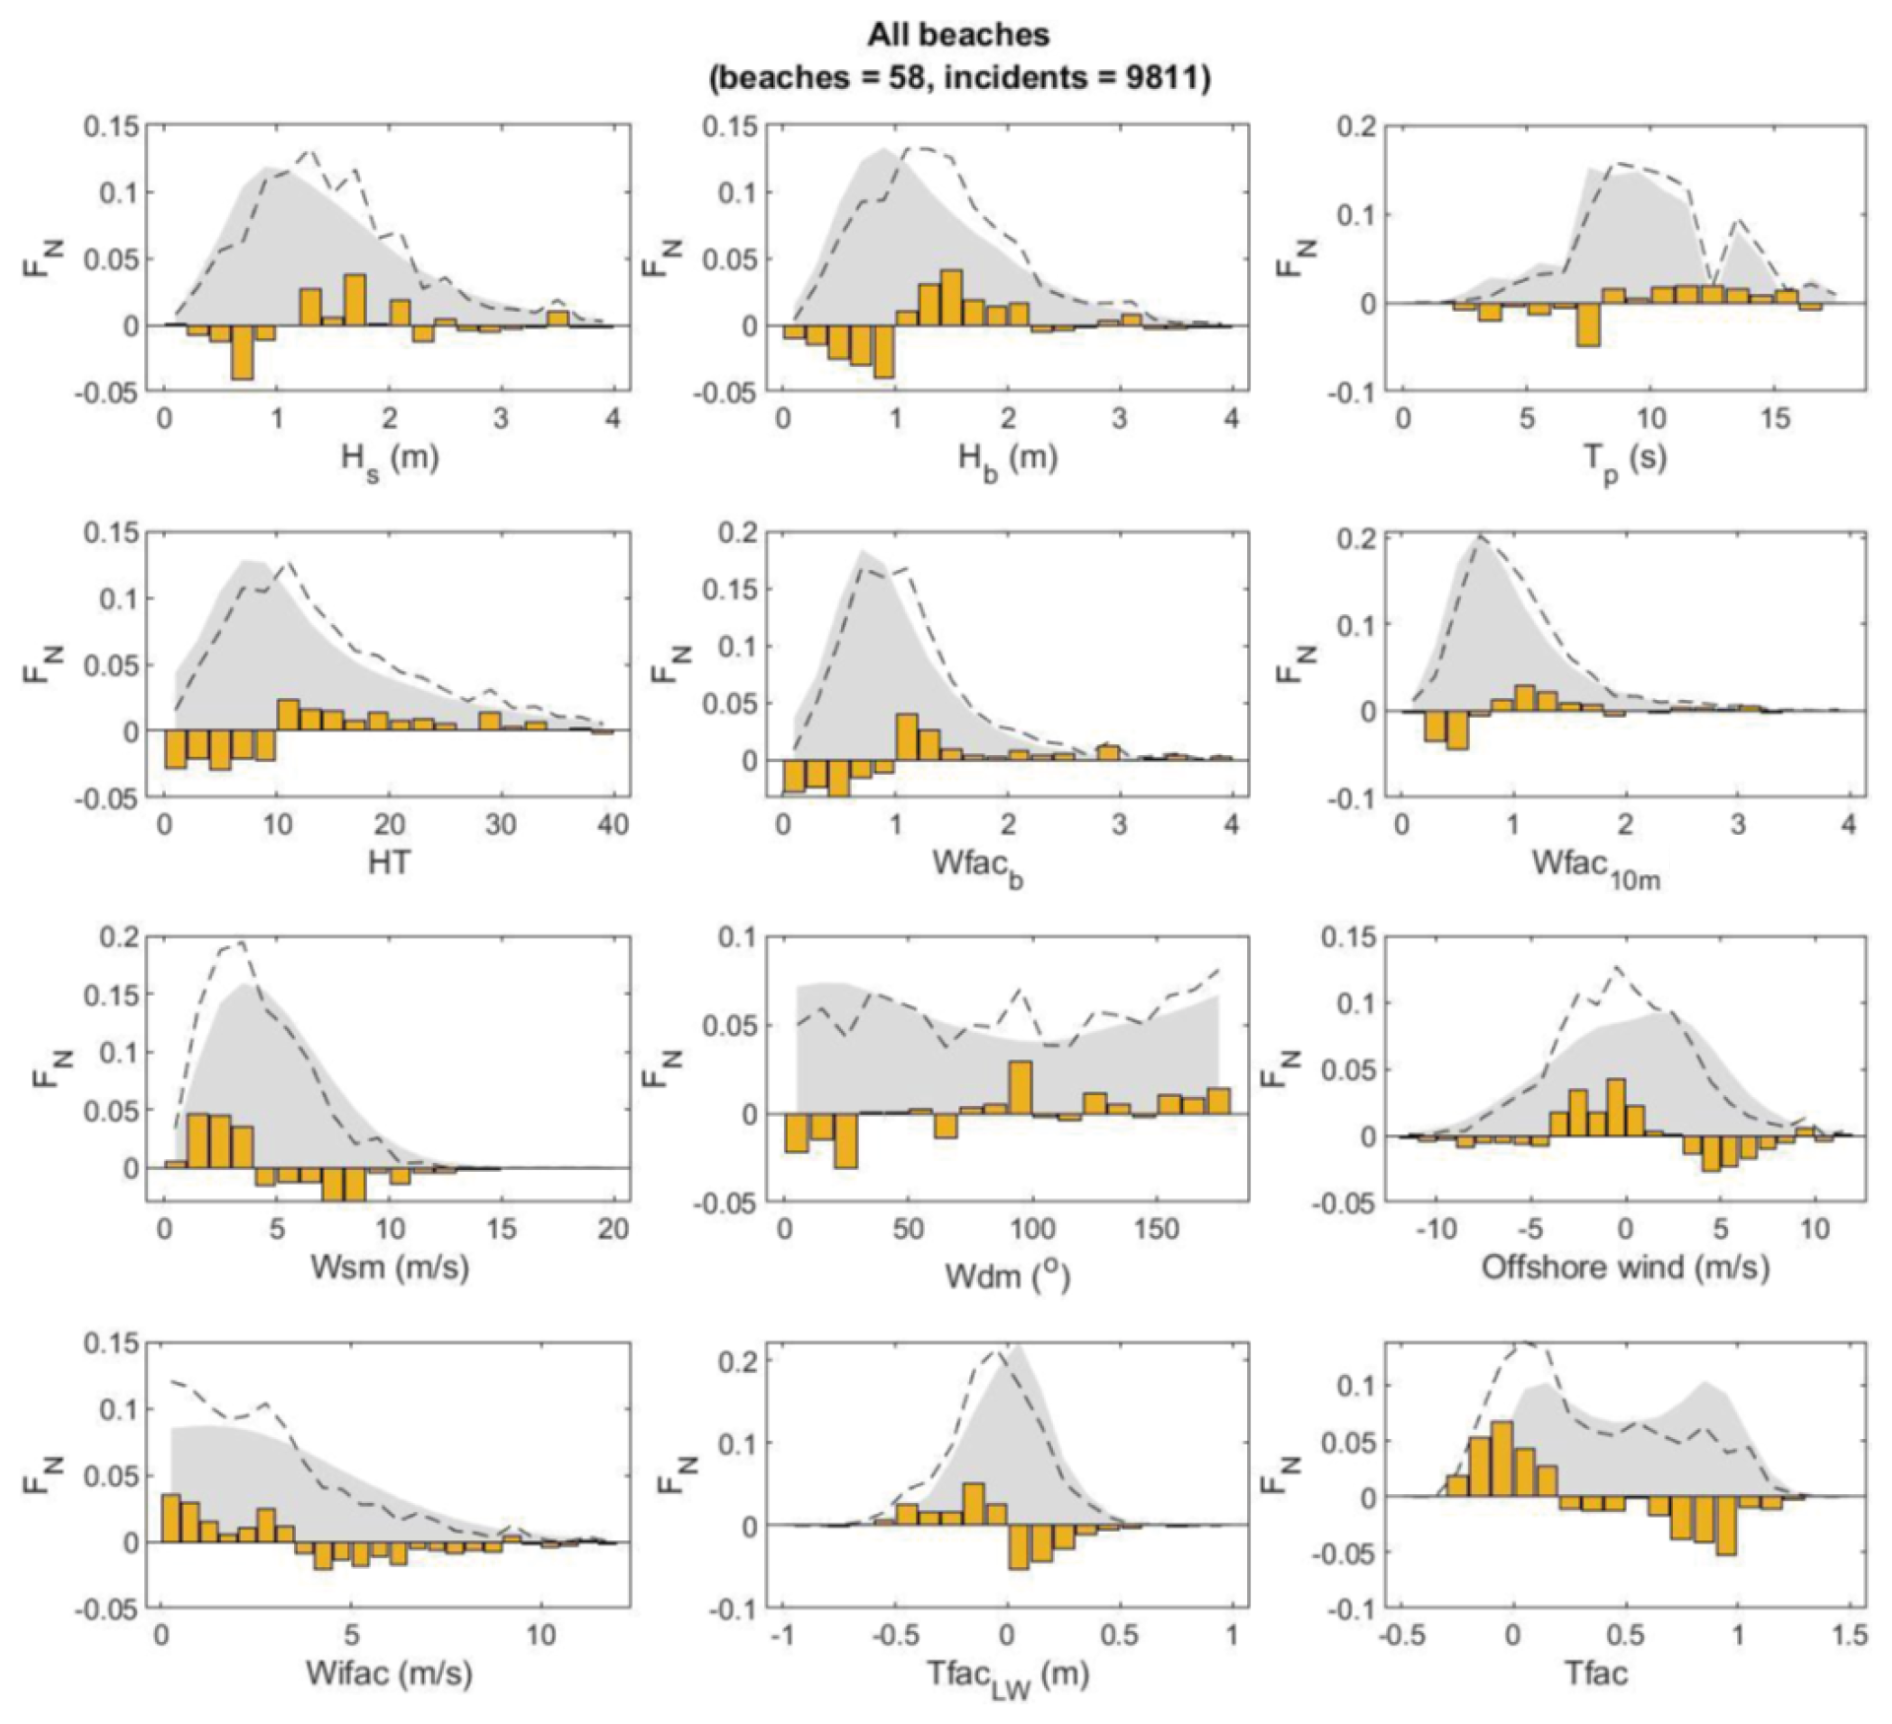
Figure C1Normalised frequency distributions FN of key forcing variables at times of rip current incidents for all beaches studied. From left to right and top to bottom: significant wave height at 10 m depth (Hs) and at breaking (Hb), peak wave period (Tp), proxy wave power (HT), wave factor at break point (Wfacb) and at 10 m water depth (Wfac10 m) both computed relative to Austral summer (December, January, February) mean, wind speed Wsm, wind direction relative to shore-normal Wdm, offshore directed wind component, cross-shore wind component Wifac, Tide Factor using the nearest low tide TfacLW, and Tide Factor using the instantaneous water level Tfac. Dashed lines show conditions occurring during rip current incidents, while grey shaded areas show the background distribution that occurs naturally over the Austral summer. The difference between the background and incident related distributions is shown as either a positive or negative orange bar, with positive (negative) bars indicating conditions associated with disproportionately more (less) rip current incidents.

Figure C2Normalised frequency distributions FN of key forcing variables at times of rip current incidents (left panels) and for Prip > 90th percentile – “high-hazard events” (right panels) at Dissipative beaches. From top to bottom panels show breaker significant wave height Hb, Wave Factor at break point Wfacb, Tide Factor Tfac, and wind speed Ws. Dashed lines show conditions occurring during rip current incidents, while grey shaded areas show the background distribution that occurs naturally over the Austral summer (December, January, February). The difference between the background and incident related distributions is shown as either a positive or negative orange bar, with positive (negative) bars indicating conditions associated with disproportionately more (less) rip current incidents.

Figure C3Normalised frequency distributions FN of key forcing variables at times of rip current incidents (left panels) and for Prip > 90th percentile – “high-hazard events” (right panels) at Intermediate beaches. From top to bottom panels show breaker significant wave height Hb, Wave Factor at break point Wfacb, Tide Factor Tfac, and wind speed Ws. Dashed lines show conditions occurring during rip current incidents, while grey shaded areas show the background distribution that occurs naturally over the Austral summer (December, January, February). The difference between the background and incident related distributions is shown as either a positive or negative orange bar, with positive (negative) bars indicating conditions associated with disproportionately more (less) rip current incidents.
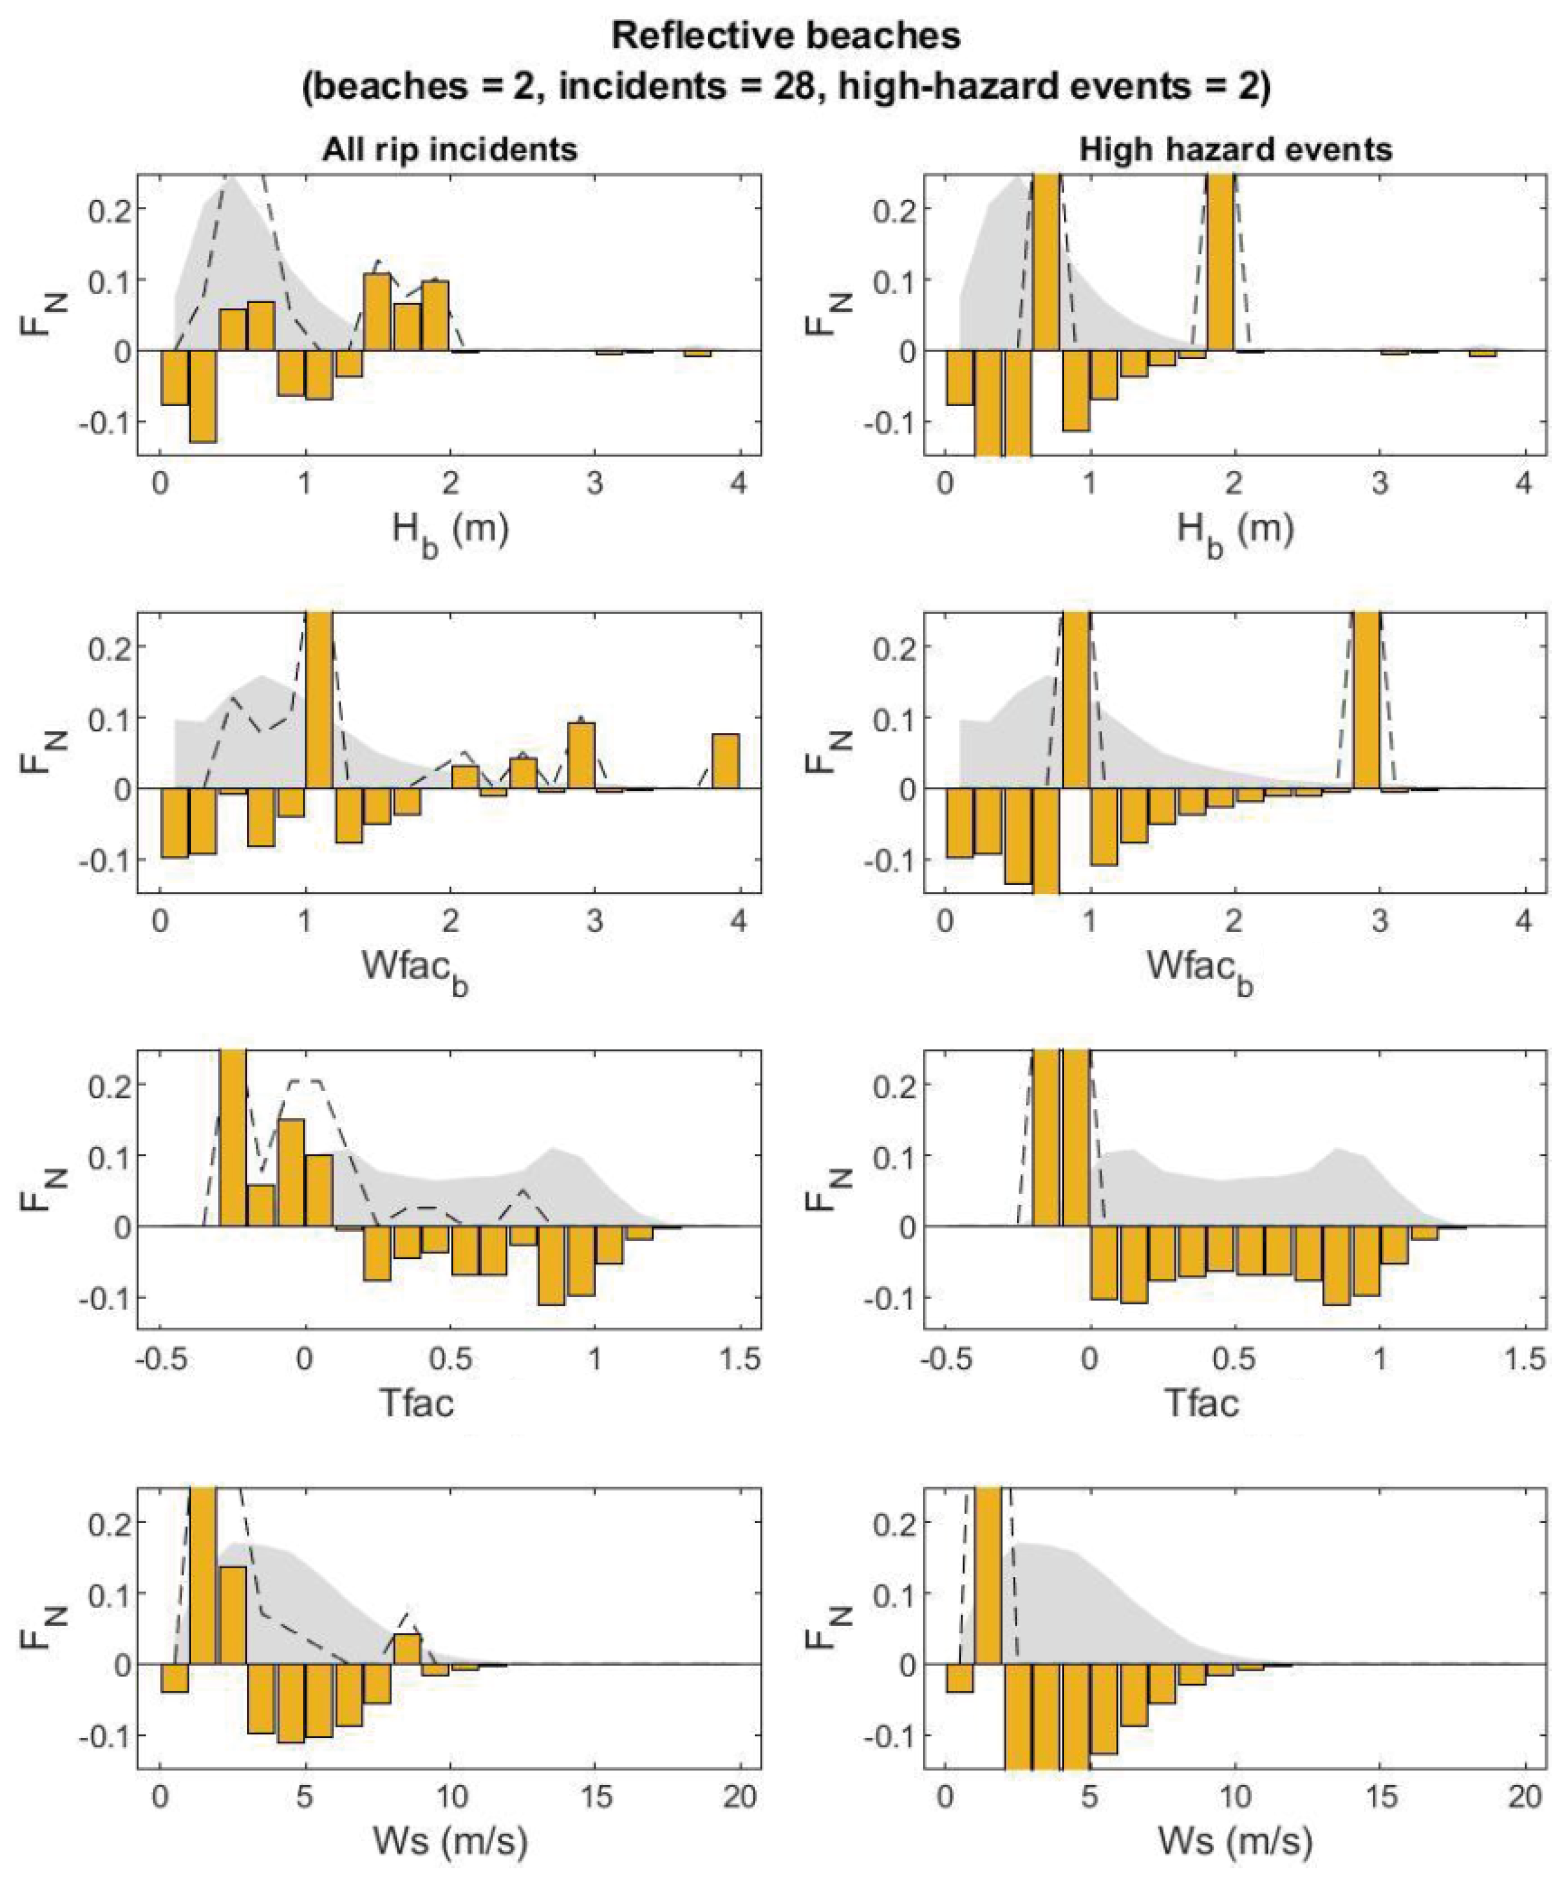
Figure C4Normalised frequency distributions FN of key forcing variables at times of rip current incidents (left panels) and for Prip > 90th percentile – “high-hazard events” (right panels) at Reflective beaches. From top to bottom panels show breaker significant wave height Hb, Wave Factor at break point Wfacb, Tide Factor Tfac, and wind speed Ws. Dashed lines show conditions occurring during rip current incidents, while grey shaded areas show the background distribution that occurs naturally over the Austral summer (December, January, February). The difference between the background and incident related distributions is shown as either a positive or negative orange bar, with positive (negative) bars indicating conditions associated with disproportionately more (less) rip current incidents.
Code and data may be partially available upon request. Surf Life Saving New Zealand lifeguard collected incident report forms can contain sensitive information relating to individuals. In some cases permission may also be required from local authorities to use these data.
All authors conceived of the presented idea and developed the theory. CS performed the data analysis for the beach classification, environmental forcing data, and lifeguard incident data. JAdM orchestrated and analysed the lifeguard perception data. AW, GM, and TS supervised the findings of this work. All authors discussed the results and contributed to the final manuscript.
The contact author has declared that none of the authors has any competing interests.
Publisher's note: Copernicus Publications remains neutral with regard to jurisdictional claims made in the text, published maps, institutional affiliations, or any other geographical representation in this paper. The authors bear the ultimate responsibility for providing appropriate place names. Views expressed in the text are those of the authors and do not necessarily reflect the views of the publisher.
This article is part of the special issue “Early Warning Systems from Research to Operations: Status, Innovations and Multi-Hazard Applications”. It is not associated with a conference.
The authors are grateful to the many paid and volunteer lifeguards that diligently collected rip incident and head count data over the > 20-year study period, as well as those who provided rip hazard perceptions for this research. The authors are also grateful to Giovanni Coco and Nelis Drost at the University of Auckland for providing the modelled wave and water level data at each beach location in the study.
The research was funded by Surf Life Saving New Zealand. The pilot project was funded by Water Safety New Zealand and Auckland Council.
This paper was edited by Timothy Tiggeloven and reviewed by two anonymous referees.
Aagaard, T., Greenwood, B., and Nielsen, J.: Mean currents and sediment transport in a rip channel, Mar. Geol., 140, 25–45, https://doi.org/10.1016/S0025-3227(97)00025-X, 1997.
Albuquerque, J., Antolínez, J. A. A., Gorman, R. M., Méndez, F. J., and Coco, G.: Seas and swells throughout New Zealand: A new partitioned hindcast, Ocean Model., 168, 101897, https://doi.org/10.1016/j.ocemod.2021.101897, 2021.
Arun Kumar, S. V. V. and Prasad, K.: Rip current-related fatalities in India: a new predictive risk scale for forecasting rip currents, Nat. Hazards, 70, 313–335, https://doi.org/10.1007/s11069-013-0812-x, 2014.
Austin, M., Scott, T., Brown, J., MacMahan, J., Masselink, G., and Russell, P.: Temporal observations of rip current circulation on a macrotidal beach, Cont. Shelf Res., 30, 1149–1165, https://doi.org/10.1016/j.csr.2010.03.005, 2010.
Austin, M. J., Scott, T. M., Russell, P. E., and Masselink, G.: Rip current prediction: Development, validation, and evaluation of an operational tool, J. Coast. Res., 29, 283–300, https://doi.org/10.2112/JCOASTRES-D-12-00093.1, 2013.
Austin, M. J., Masselink, G., Scott, T. M., and Russell, P. E.: Water-level controls on macro-tidal rip currents, Cont. Shelf Res., 75, 28–40, https://doi.org/10.1016/j.csr.2013.12.004, 2014.
Brander, R. and Scott, T.: Science of the rip current hazard, in: The science of beach lifeguarding, CRC Press, 67–85, ISBN 9781482245981, 2018.
Brander, R. W.: Field observations on the morphodynamic evolution of a low-energy rip current system, Mar. Geol., 157, 199–217, https://doi.org/10.1016/S0025-3227(98)00152-2, 1999.
Brander, R. W., Bradstreet, A., Sherker, S., and MacMahan, J.: Responses of swimmers caught in rip currents: Perspectives on mitigating the global rip current hazard, International Journal of Aquatic Research and Education, 5, 11, https://doi.org/10.25035/ijare.05.04.11, 2011.
Brewster, B. C., Gould, R. E., and Brander, R. W.: Estimations of rip current rescues and drowning in the United States, Nat. Hazards Earth Syst. Sci., 19, 389–397, https://doi.org/10.5194/nhess-19-389-2019, 2019.
Brighton, B., Sherker, S., Brander, R., Thompson, M., and Bradstreet, A.: Rip current related drowning deaths and rescues in Australia 2004–2011, Nat. Hazards Earth Syst. Sci., 13, 1069–1075, https://doi.org/10.5194/nhess-13-1069-2013, 2013.
Casper, A., Nuss, E. S., Baker, C. M., Moulton, M., and Dusek, G.: Assessing NOAA rip-current hazard likelihood predictions: comparison with lifeguard observations and parameterizations of Bathymetric and transient rip-current types, Weather Forecast., 39, 1045–1063, https://doi.org/10.1175/WAF-D-23-0181.1, 2024.
Castelle, B., Bonneton, P., Senechal, N., Dupuis, H., Butel, R., and Michel, D.: Dynamics of wave-induced currents over an alongshore non-uniform multiple-barred sandy beach on the Aquitanian Coast, France, Cont. Shelf Res., 26, 113–131, https://doi.org/10.1016/j.csr.2005.08.027, 2006.
Castelle, B., Almar, R., Dorel, M., Lefebvre, J.-P., Senechal, N., Anthony, E. J., Laibi, R., Chuchla, R., and Penhoat, Y. du: Rip currents and circulation on a high-energy low-tide-terraced beach (Grand Popo, Benin, West Africa), J. Coast. Res., 633–638, https://doi.org/10.2112/SI70-107.1, 2014.
Castelle, B., Scott, T., Brander, R. W., and McCarroll, R. J.: Rip current types, circulation and hazard, Earth Sci. Rev., 163, 1–21, https://doi.org/10.1016/j.earscirev.2016.09.008, 2016.
Castelle, B., Brander, R., Tellier, E., Simonnet, B., Scott, T., McCarroll, J., Campagne, J.-M., Cavailhes, T., and Lechevrel, P.: Surf zone hazards and injuries on beaches in SW France, Nat. Hazards, 93, 1317–1335, https://doi.org/10.1007/s11069-018-3354-4, 2018.
Castelle, B., Scott, T., Brander, R., McCarroll, J., Robinet, A., Tellier, E., de Korte, E., Simonnet, B., and Salmi, L.-R.: Environmental controls on surf zone injuries on high-energy beaches, Nat. Hazards Earth Syst. Sci., 19, 2183–2205, https://doi.org/10.5194/nhess-19-2183-2019, 2019.
Castelle, B., Scott, T., Brander, R., McCarroll, R. J., Tellier, E., de Korte, E., Tackuy, L., Robinet, A., Simonnet, B., and Salmi, L.-R.: Wave and tide controls on rip current activity and drowning incidents in Southwest France, J. Coast. Res., 95, 769–774, https://doi.org/10.2112/SI95-150.1, 2020.
Castelle, B., Dehez, J., Savy, J.-P., Liquet, S., and Carayon, D.: Semi-empirical forecast modelling of rip-current and shore-break wave hazards, Nat. Hazards Earth Syst. Sci., 25, 2379–2397, https://doi.org/10.5194/nhess-25-2379-2025, 2025.
Churma, M. E., Kurkowski, N. P., Dusek, G., van der Westhuysen, A. J., Im, J.-S., Schattel, J. L., Alves, H., Padilla-Hernandez, R., Atkinson, D., and Chawla, A.: Observation methodologies for NOAA operational rip current forecast models, in: American Meteorological Society Meeting Abstracts, 2–3, https://ui.adsabs.harvard.edu/abs/2017AMS....9715894C (last access: 7 November 2026), 2017.
Coggins, J. H. J., Parsons, S., and Schiel, D.: An assessment of the ocean wave climate of New Zealand as represented in Kidson's synoptic types, Int. J. Climatol., 36, https://doi.org/10.1002/joc.4507, 2016.
Cornell, S., Brander, R. W., Roberts, A., Koon, W., Peden, A. E., and Lawes, J. C.: “I actually thought that I was going to die”: Lessons on the rip current hazard from survivor experiences, Health Promot. J. Aust., 35, 551–564, https://doi.org/10.1002/hpja.785, 2024.
Costa, W., Bryan, K. R., Stephens, S. A., and Coco, G.: A regional analysis of tide-surge interactions during extreme water levels in complex coastal systems of Aotearoa New Zealand, Front. Mar. Sci., 10, 1170756, https://doi.org/10.3389/fmars.2023.1170756, 2023.
Dusek, G. and Seim, H.: A probabilistic rip current forecast model, J. Coast. Res., 29, 909–925, https://doi.org/10.2112/JCOASTRES-D-12-00118.1, 2013a.
Dusek, G. and Seim, H.: Rip current intensity estimates from lifeguard observations, J. Coast. Res., 29, 505–518, https://doi.org/10.2112/JCOASTRES-D-12-00117.1, 2013b.
Engle, J. A: Formulation of a rip current forecasting technique through statistical analysis of rip current-related rescues, Master's thesis, University of Florida, Gainesville, USA, https://scispace.com/pdf/formulation-of-a-rip-current-forecasting-technique-through-x7pqo5bws9.pdf (last access: 13 November 2026), 2003.
Gensini, V. A. and Ashley, W. S.: An examination of rip current fatalities in the United States, Nat. Hazards, 54, 159–175, https://doi.org/10.1007/s11069-009-9458-0, 2010.
Gibbs, A., Dusek, G., Van der Westhuysen, A., Santos, P., Huddleston, S., Estupiñan, J., Rivera, E., Stripling, S., and Padilla, R.: Numerical Validation of a Coupled Probabilistic Rip Current Model and Nearshore Wave Prediction System for South Florida, in: 95th AMS Annual Meeting/13th Symposium on Coastal Environment, 1–9, https://ams.confex.com/ams/95Annual/webprogram/Manuscript/Paper265327/AMS_ripcurrent_2015_ext-abs_Final.pdf (last access: 7 November 2026), 2015.
Gorman, R. M., Bryan, K. R., and Laing, A. K.: Wave hindcast for the New Zealand region: nearshore validation and coastal wave climate, N. Z. J. Mar. Freshwater Res., 37, 567–588, https://doi.org/10.1080/00288330.2003.9517190, 2003.
Hesp, P. A., Shepherd, M. J., and Parnell, K.: Coastal geomorphology in New Zealand, 1989–99, Prog. Phys. Geogr., 23, 501–524, https://doi.org/10.1177/030913339902300403, 1999.
Kelly, S., Ledger, J., Koon, W., Brander, R., Peden, A. E., Daw, S., and Lawes, J. C.: Quantifying rip current-related drowning deaths and exposure on Australian beaches, Inj. Prev., https://doi.org/10.1136/ip-2024-045565, 2025.
Kennedy, D. M., Sherker, S., Brighton, B., Weir, A., and Woodroffe, C. D.: Rocky coast hazards and public safety: Moving beyond the beach in coastal risk management, Ocean Coast. Manag., 82, 85–94, https://doi.org/10.1016/j.ocecoaman.2013.06.001, 2013.
Koon, W., Brander, R. W., Dusek, G., Castelle, B., and Lawes, J. C.: Relationships between the tide and fatal drowning at surf beaches in New South Wales, Australia: Implications for coastal safety management and practice, Ocean Coast. Manag., 238, 106584, https://doi.org/10.1016/j.ocecoaman.2023.106584, 2023.
Laing, A. K.: New Zealand wave climate from satellite observations, N. Z. J. Mar. Freshwater Res., 34, 727–744, https://doi.org/10.1080/00288330.2000.9516973, 2000.
Larson, M., Hoan, L. X., and Hanson, H.: Direct formula to compute wave height and angle at incipient breaking, J. Waterw. Port Coast. Ocean Eng., 136, 119–122, https://doi.org/10.1061/(ASCE)WW.1943-5460.0000030, 2010.
Lascody, R. L.: East central Florida rip current program, National Weather Digest, 22, 25–30, https://www.weather.gov/media/mlb/marine/ECFLRipCurrentProgram_NWA.pdf (last access: 7 November 2026), 1998.
Lee, J., Kim, I., and Lee, J. L.: Improving the Performance of Rip Current Forecasting Index with a Focus on Haeundae Beach, Korea, J. Coast. Res., 1556–1560, https://doi.org/10.2112/SI85-312.1, 2018.
Long, J. W. and Özkan-Haller, H. T.: Forcing and variability of nonstationary rip currents, J. Geophys. Res.-Oceans, 121, 520–539, https://doi.org/10.1002/2015JC010990, 2016.
Longuet-Higgins, M. S. and Stewart, R. W.: Radiation stresses in water waves; a physical discussion, with applications, in: Deep Sea Research and Oceanographic Abstracts, 529–562, https://doi.org/10.1016/0011-7471(64)90001-4, 1964.
Lushine, J. B.: A study of rip current drownings and related weather factors, National Weather Digest, 16, 13–19, 1991.
MacMahan, J., Brown, J., Brown, J., Thornton, E., Reniers, A., Stanton, T., Henriquez, M., Gallagher, E., Morrison, J., and Austin, M. J.: Mean Lagrangian flow behavior on an open coast rip-channeled beach: A new perspective, Mar. Geol., 268, 1–15, https://doi.org/10.1016/j.margeo.2009.09.011, 2010.
MacMahan, J. H., Thornton, E. B., Stanton, T. P., and Reniers, A. J. H. M.: RIPEX: Observations of a rip current system, Mar. Geol., 218, 113–134, https://doi.org/10.1016/j.margeo.2005.03.019, 2005.
MacMahan, J. H., Thornton, E. B., and Reniers, A. J. H. M.: Rip current review, Coast. Eng., 53, 191–208, https://doi.org/10.1016/j.coastaleng.2005.10.009, 2006.
McCarroll, R. J., Brander, R. W., MacMahan, J. H., Turner, I. L., Reniers, A. J. H. M., Brown, J. A., Bradstreet, A., and Sherker, S.: Evaluation of swimmer-based rip current escape strategies, Nat. Hazards, 71, 1821–1846, https://doi.org/10.1007/s11069-013-0979-1, 2014.
McCarroll, R. J., Castelle, B., Brander, R. W., and Scott, T.: Modelling rip current flow and bather escape strategies across a transverse bar and rip channel morphology, Geomorphology, 246, 502–518, https://doi.org/10.1016/j.geomorph.2015.06.041, 2015.
Moulton, M., Dusek, G., Elgar, S., and Raubenheimer, B.: Comparison of rip current hazard likelihood forecasts with observed rip current speeds, Weather Forecast., 32, 1659–1666, https://doi.org/10.1175/WAF-D-17-0076.1, 2017.
Mouragues, A., Bonneton, P., Castelle, B., and Martins, K.: Headland rip modelling at a natural beach under high-energy wave conditions, J. Mar. Sci. Eng., 9, 1161, https://doi.org/10.3390/jmse9111161, 2021.
Panofsky, H. W. and Brier, G. W.: Some Applications of Statistics to Meteorology, The Pennsylvania State University Press, Philadelphia, https://catalog.hathitrust.org/Record/009082519 (last access: 7 November 2026), 1953.
Saulnier, D., Dixit, A., Nunes, A. R., and Murray, V.: Disaster Risk Factors–Hazards, exposure, and vulnerability, in: WHO Guidance on Research Methods for Health Emergency and Disaster Risk Management, World Health Organization, 151–163, https://doi.org/10.82444/warw.33893881, 2020.
Scott, T., Masselink, G., Austin, M. J., and Russell, P.: Controls on macrotidal rip current circulation and hazard, Geomorphology, 214, 198–215, https://doi.org/10.1016/j.geomorph.2014.02.005, 2014.
Scott, T., Austin, M., Masselink, G., and Russell, P.: Dynamics of rip currents associated with groynes – field measurements, modelling and implications for beach safety, Coast. Eng., 107, 53–69, https://doi.org/10.1016/j.coastaleng.2015.09.013, 2016.
Scott, T., Masselink, G., Stokes, C., Poate, T., Wooler, A., and Instance, S.: A 15-year partnership between UK coastal scientists and the international beach lifeguard community, Cont. Shelf Res., 241, 104732, https://doi.org/10.1016/j.csr.2022.104732, 2022.
Sickles, R. C. and Zelenyuk, V.: Measurement of productivity and efficiency, Cambridge University Press, https://doi.org/10.1017/9781139565981, 2019.
Sonu, C. J.: Field observation of nearshore circulation and meandering currents, J. Geophys. Res., 77, 3232–3247, https://doi.org/10.1029/JC077i018p03232, 1972.
Stanley, T., Moran, K., Garbett, D., and Ovens, A.: Perceived and real water competency and drowning risk among adults, International Journal of Aquatic Research and Education, 14, 6, https://doi.org/10.25035/ijare.14.03.06, 2024.
Stokes, C., Masselink, G., Revie, M., Scott, T., Purves, D., and Walters, T.: Application of multiple linear regression and Bayesian belief network approaches to model life risk to beach users in the UK, Ocean Coast. Manag., 139, 12–23, https://doi.org/10.1016/j.ocecoaman.2017.01.025, 2017.
Stokes, C., Poate, T., Masselink, G., Scott, T., and Instance, S.: New insights into combined surfzone, embayment, and estuarine bathing hazards, Nat. Hazards Earth Syst. Sci., 24, 4049–4074, https://doi.org/10.5194/nhess-24-4049-2024, 2024.
Walters, R. A., Goring, D. G., and Bell, R. G.: Ocean tides around new Zealand, N. Z. J. Mar. Freshwater Res., 35, 567–579, https://doi.org/10.1080/00288330.2001.9517023, 2001.
Water Safety New Zealand: Coastal drowning deaths 2014–2024, retrieved from DrownBase™ database, https://www.watersafetynz.org/drowning-insights/drownbase-and-data-science (last access: 7 November 2026), 2024.
Woodward, E., Beaumont, E., Russell, P., Wooler, A., and Macleod, R.: Analysis of rip current incidents and victim demographics in the UK, J. Coast. Res., 850–855, https://doi.org/10.2112/SI65-144.1, 2013.
Wright, L. D. and Short, A. D.: Morphodynamic variability of surf zones and beaches: A synthesis, Mar. Geol., 56, 93–118, https://doi.org/10.1016/0025-3227(84)90008-2, 1984.
- Abstract
- Introduction
- Methodology
- Results
- Discussion
- Conclusions
- Appendix A: List of Surf Lifesaving New Zealand patrolled beaches
- Appendix B: Rip Incident Reporting
- Appendix C: Rip incidents and met-ocean conditions for different beach morphology types
- Code and data availability
- Author contributions
- Competing interests
- Disclaimer
- Special issue statement
- Acknowledgements
- Financial support
- Review statement
- References
- Abstract
- Introduction
- Methodology
- Results
- Discussion
- Conclusions
- Appendix A: List of Surf Lifesaving New Zealand patrolled beaches
- Appendix B: Rip Incident Reporting
- Appendix C: Rip incidents and met-ocean conditions for different beach morphology types
- Code and data availability
- Author contributions
- Competing interests
- Disclaimer
- Special issue statement
- Acknowledgements
- Financial support
- Review statement
- References