
the Creative Commons Attribution 4.0 License.
the Creative Commons Attribution 4.0 License.
 | 11 Nov 2026
Reservoir-induced seismicity in China: Systematic characterization and implications for hazard assessment
Jiashan Zhang

Fengling Yin
Yiming Zhu
Hongyu Zhai
Jinmeng Bi
Yan Zhang
Reservoir-Induced Seismicity (RIS) poses a significant geological risk for large-scale hydropower projects. However, its nationwide characteristics remain poorly understood in China, the country with the world's largest hydropower capacity. This study integrates a high-resolution national reservoir dataset (CRD) with a unified earthquake catalog since 1970 to establish a screening-eligible sample of 1435 large/medium-sized reservoirs (impounded between 1971 and 2015) in China. Based on spatiotemporal clustering criteria, we systematically identified 88 induced-type reservoirs – that is, reservoirs exhibiting spatiotemporally clustered seismicity significantly associated with impoundment. Analysis of this dataset reveals fundamental characteristics of RIS in China: Spatially, induced-type reservoirs are selectively concentrated in tectonically active regions like the eastern margin of the Tibetan Plateau, showing significant coupling with active faults and historical seismicity. In the near field, 95 % of RIS events occur within 24.8 km of the reservoir shoreline. Temporally, the time lag between impoundment and peak seismicity, together with the distance-dependent occurrence rate, follows patterns governed primarily by pore pressure diffusion, leading to the development of a W-score model for probabilistic RIS identification. In terms of sequence characteristics, RIS exhibits statistically distinct parameters of their frequency-magnitude distribution (e.g., lower α-value, higher b-value) compared to natural earthquakes, revealing a unique physical process of activating near-critical faults via pore pressure diffusion. The spatial evolution of the b-value further confirms an effective permeability boundary of pore water penetration at approximately 30–40 km, far exceeding the current Chinese national standard (10 km). Correlation analysis shows that static reservoir parameters (e.g., reservoir capacity, dam height, and reservoir major axis length) are statistically intercorrelated; thus, only one parameter should be selected for hazard analysis. Reservoir capacity greater than 3.2 × 10⁸ m3 or reservoir major axis length exceeding 15.9 km could serve as quantitative thresholds for preliminary risk screening during the planning stage. However, correlation matrix analysis reveals only weak correlations between all static/dynamic parameters and the maximum magnitude (Mmax), highlighting the urgent need for physics-based mechanistic models. This study provides the first national-scale systematic characterization of RIS in China, a quantitative identification tool (W-score), and key engineering thresholds for RIS risk assessment in China, pointing towards future directions beyond traditional empirical models.
- Article
(7598 KB) - Full-text XML
-
Supplement
(2988 KB) - BibTeX
- EndNote


Reservoir-Induced Seismicity (RIS), a typical example of human engineering activities altering the local crustal stress field and triggering seismic events, holds significant engineering and scientific value (Gupta, 2002). From an engineering perspective, even low-magnitude RIS can cause damaging shaking and social impact in steep terrain due to its shallow source characteristics, potentially triggering secondary disasters like rockfalls (Julian and Foulger, 2010). Scientifically, RIS provides a unique natural laboratory for understanding the critical role of fluids in fault instability (Talwani, 1997). The physical mechanisms linking reservoir impoundment to triggered seismicity are broadly categorized into two end-member processes (Talwani, 1997; Simpson et al., 1988). Elastic loading by the water column causes near-instantaneous crustal flexure and stress changes, typically affecting the near field within hours to weeks. In contrast, pore-pressure diffusion involves infiltration of reservoir water along fractures and faults, elevating pore pressure and reducing effective normal stress on pre-existing planes of weakness; this mechanism can operate over several tens of kilometres and produces a characteristic delayed response from months to years. The interplay between these processes, modulated by local fault permeability and crustal stress state, governs the characteristic spatiotemporal signatures of RIS – namely, the distance-dependent decay of seismicity rates and the post-impoundment time lag analysed in the present study.
While over 200 RIS cases have been reported globally, systematic, national-scale studies remain relatively scarce, with only a few countries like Canada, France, and Brazil having conducted comprehensive analyses based on their own data (Lamontagne et al., 2018; Grasso et al., 2018; Barros et al., 2018). These studies reveal that RIS occurrence is not random but strongly controlled by the regional tectonic setting. For instance, RIS in Canada is concentrated within the ancient, stable Canadian Shield, associated with the reactivation of fragile faults from paleo-rifts, with a typically limited affected distance (< 5 km, Lamontagne et al., 2018). In France, RIS primarily occurs in active tectonic zones like the Western Alpine Arc and the Pyrenees, and its spatial distribution can be normalized using the reservoir major axis length as a characteristic scale (Grasso et al., 2018). Research in Brazil further indicates that RIS probability is significantly higher in regions of strong natural tectonic seismicity (Peak Ground Acceleration, PGA > 0.1 g; i.e., PGA with 10 % probability of exceedance in 50 years, or approximately a 475 year return period), suggesting that a critically stressed crust is a key prerequisite (Barros et al., 2018). Beyond spatial distributions, these global case studies have also established empirical understanding regarding the spatiotemporal evolution of induced sequences. For example, all RIS events in Canada are concentrated within 5 km of the reservoir shoreline, related to the permeability of faults near the reservoir and the localized effect of pore pressure diffusion (Lamontagne et al., 2018). In France, the spatial distribution of RIS can be normalized using the reservoir major axis length as a characteristic scale, with the earthquake occurrence rate within 1–3 times the reservoir major axis being 4.5 times higher than in the far-field (10 times the reservoir major axis), confirming the localized nature of tectonic stress perturbation (Grasso et al., 2018). Regarding the time lag between RIS occurrence and the initial impoundment, previous studies found that RIS in Canada is predominantly characterized by a delayed response, where the Time Lag is negatively correlated with fault permeability (Lamontagne et al., 2018). In France, 62 % of RIS events occur within 2 years after impoundment, corresponding to a rapid response to elastic loading, consistent with Simpson et al. (1988) Type I model (Grasso et al., 2018). These regional systematic studies have greatly enhanced our understanding of RIS patterns, but their conclusions are derived from specific, mostly moderately to low-active tectonic settings. Consequently, a key scientific question is whether these patterns apply to the world's most active tectonic domains. Addressing this question remains urgent.
As the country with the largest global hydropower capacity, China has accumulated valuable insights into RIS through case studies over the long term. The early case of the Xinfengjiang Reservoir in Guangdong Province, South China, is a globally recognized typical RIS event (Talwani, 1997; Gupta, 2002). Recent studies further revealed renewed intensification of seismicity northwest of the reservoir area after 2012, interpreted as the reactivation of a pre-existing NW-SE trending fault due to increased pore pressure from reservoir water infiltration (Dong et al., 2022). Research on the Three Gorges Reservoir in central China (Hubei Province and Chongqing Municipality) uncovered complex spatiotemporal patterns of its seismicity, which can be divided into near-field (0–12 km) and far-field (32–70 km) areas, possibly controlled by different mechanisms (Li and Luo, 2022). In the lower reaches of the Jinsha River, impoundment of cascade reservoirs like Xiluodu and Xiangjiaba (Sichuan-Yunnan border region, China) was shown to alter the local stress field through the dual mechanisms of “elastic loading and pore pressure diffusion”, and was highly correlated in time and space with a series of earthquakes with surface-wave magnitude MS>4.5 (Miao et al., 2025; Zhang et al., 2021). These case studies not only confirm the presence of RIS in China but also preliminarily highlight the critical role of pore pressure diffusion in specific Chinese geological environments (e.g., areas with high-permeability faults and karst), where its influence range may far exceed traditional understanding (Miao et al., 2025).
Despite significant progress in case studies, the systematic patterns of RIS at the national scale in China remain unclear. Due to the lack of a unified, high-precision coupled dataset of national reservoirs and earthquakes, fundamental scientific questions persist: To what extent is the spatial distribution of RIS controlled by macro-tectonic patterns? What are the common characteristics of its spatiotemporal evolution? Do sequence behaviors exhibit nationwide statistical fingerprints? What are the quantitative influences of static or dynamic reservoir parameters on seismic activity? This knowledge gap directly hampers the precision of engineering practice. China's current risk assessment standards (GB/T 21075-2007, 2007) largely rely on early international experience and static models (Simpson et al., 1988; Gupta, 2002). Whether their core parameters (e.g., the 10 km influence range) are universally applicable in China's complex and diverse geological environments, especially in the southwestern region with widely developed high-permeability faults, has become a critical issue requiring urgent verification.
Addressing the above questions, this study makes the first attempt at a comprehensive, multi-dimensional characterization of RIS across China. We integrated the high-resolution China Reservoir Dataset (CRD) with a unified national earthquake catalog spanning over fifty years to construct a screening sample (i.e., the initial pool of candidate reservoirs subjected to the induced-seismicity screening) of 1435 large/medium-sized reservoirs (first impounded between 1 January 1971 and 27 March 2015). Using unified spatiotemporal clustering criteria, we systematically identified 88 induced-type reservoirs (i.e., reservoirs exhibiting spatiotemporally clustered seismicity significantly associated with impoundment; see Sect. 3 for detailed screening criteria). Based on this, to date, the most complete national-scale RIS dataset, this paper systematically examines the spatial distribution pattern of RIS in China and its coupling with the regional tectonic background, the spatiotemporal evolution and sequence characteristics of induced seismicity, the statistical differences between RIS and natural earthquake sequences, and the quantitative correlations between reservoir attributes and the RIS maximum magnitude (defined as the largest magnitude within the identified induced sequence for a given reservoir). The results of this study will provide insights into the macroscopic patterns of RIS in the world's most active tectonic domain and contribute to the development of more physics-based risk assessment methods.
This study utilizes seismic data from the National Unified Official Earthquake Catalog provided by the China Earthquake Networks Center (CENC, https://doi.org/10.5.160.18/console/exit.action, 2025). The catalog spans from 1 January 1970 to 27 March 2025, and contains basic parameters for all earthquakes recorded by the national and regional seismic networks within China's territory. Compiled and processed centrally by the CENC, this catalog integrates observation reports from provincial and national centers to produce a unified earthquake catalog and report (Dai et al., 2019). The seismic monitoring capability, represented by the minimum completeness magnitude (MC), of the China Seismograph Network has evolved significantly since 1970. For eastern China, where reservoirs are densely distributed, the MC was approximately local magnitude (ML) 3.0–3.5 in the 1970s, improved to ML 2.0–2.5 during 1980–2001, and after the nationwide digital upgrade of the network around 2009, the MC reached or even fell below ML 2.0 in most regions (Mignan et al., 2013; Wang et al., 2017). This macroscopic evolution of monitoring capability and the actual recorded data were considered during the identification of induced seismicity sequences for individual reservoirs. While dedicated seismic networks at individual reservoir sites often provide more complete data with lower MC, accessing such data uniformly across China is challenging. Therefore, this study utilizes the National Unified Official Earthquake Catalog, which offers the significant advantages of relatively consistent spatial coverage across China and a long-term record spanning over 50 years.
The spatial distribution and fundamental attributes of reservoirs are primarily sourced from the China Reservoir Dataset (CRD; Song et al., 2022). The CRD is a comprehensive dataset constructed based on the interpretation of high-resolution satellite imagery, providing vector boundaries and key attributes – including name, geographic location, reservoir capacity, reservoir surface area, and administrative region – for 97 435 reservoirs across China. Compared to mainstream international databases (e.g., GeoDAR, GOODD and GRanD), the CRD offers significant advantages in terms of reservoir coverage, spatial resolution, and attribute completeness within China (Song et al., 2022). Specifically, the CRD catalogs 97 435 vectorized reservoir polygons – approximately one to two orders of magnitude more than the Chinese subsets of GRanD (∼ 900), GeoDAR (∼ 4900), and GOODD (∼ 9200) – and achieves near-complete coverage of small reservoirs (< 1 km2, and especially < 0.1 km2) that are largely absent from global products. Its boundaries are mapped from high-resolution satellite imagery (including 10 m Sentinel-2 data for narrow valley reservoirs), and it compiles essential engineering attributes such as storage capacity and surface area indispensable for reservoir-induced seismicity characterization.
Critical parameters for identifying RIS, such as the initial impoundment time, dam height, and reservoir capacity, were obtained through the integration of multi-source, heterogeneous data. We systematically collected publicly available academic literature, sources like the Encyclopedia of Chinese Rivers and Lakes, local gazetteers, government reports, and news archives. The CRD contains 4854 medium and large reservoirs (reservoir capacity ≥ 0.1 × 10⁸ m3), for which, we performed rigorous cross-validation and data fusion. Due to limitations in data availability, the precision of the obtained initial impoundment times varies. For times precise only to the month, the last day of that month was taken as the initial impoundment time; for times precise only to the year, 1 January of the following year was used. This dataset is nearly complete for large reservoirs (reservoir capacity ≥ 1 × 10⁸ m3) nationwide, comprising 746 reservoirs, accounting for 84.29 % of the corresponding large reservoirs in the CRD. For medium reservoirs, 2111 were compiled, representing 53.39 % of the corresponding medium reservoirs in the CRD. Among the 1997 reservoirs with incomplete records, 1433 (71.76 %) have a reservoir capacity below 0.3 × 10⁸ m3. As this study requires comparing seismic activity for at least one year before initial impoundment and examining seismicity for at least 10 years after impoundment, only those 1435 reservoirs with initial impoundment dates between 1 January 1971 and 27 March 2015 were selected as the target group for identifying induced seismicity. The spatial distribution of the full 4854-reservoir set, the 1435-reservoir screening sample, and the excluded reservoirs is presented in Sect. S1 and Fig. S1 in the Supplement; the close similarity in their geographic patterns confirms that the screening process does not introduce spatial bias into the characterization of induced-type reservoirs.
3.1 Identification Criteria for Induced Seismicity
As this study focuses on the overall statistical characteristics of RIS, we did not employ quantitative probabilistic methods like the spatiotemporal Epidemic-Type Aftershock Sequence (ETAS) model (Zhuang et al., 2002) or the nearest neighbor distance (NND) method (Zaliapin et al., 2008) for cluster identification. Instead, we adopted an approach similar to Bi and Jiang (2019), manually selecting the natural boundaries of spatiotemporal earthquake clusters. To facilitate reproducibility, this manual selection followed a standardized three-step protocol applied to each of the 1435 reservoirs: (1) Temporal distinguishability – a sharp, sustained post-impoundment increase in cumulative seismicity, assessed at MC=ML2.0, 2.5, and 3.0, was required, clearly separable from pre-impoundment background trends; reservoirs showing only a continuation of background activity, or increases attributable to regional tectonic episodes, were rejected. (2) Spatial separability – induced clusters must exhibit compact, shoreline-proximal aggregation (dominant distance peak typically at 0–10 km) with geometries consistent with local fault reactivation by pore-pressure diffusion, whereas diffuse alignments along major regional active faults with strong background activity were classified as natural tectonic clustering and excluded. (3) Spatiotemporal congruence – the temporal and spatial anomalies must coincide in the same near-reservoir volume, preventing misclassification of distant post-impoundment tectonic swarms.
3.2 Normalization and Spatiotemporal Coupling (W-score) Method
Based on the identified induced seismicity sequences from the 88 reservoirs, this study uses a completeness magnitude of ML2.5 and a sequence duration of 10 years after initial impoundment to investigate the distance-from-shoreline distribution and time lag distribution characteristics of RIS. Since the occurrence rate varies significantly among different RIS sequences, we normalized the frequency for each sequence to extract common patterns. Specifically, the earthquake frequency in each distance or time bin was divided by the total number of earthquakes in the respective RIS sequence, so that the sum of normalized frequencies (relative frequencies) for all bins equals 1, intuitively reflecting the proportion of earthquakes in each bin. The statistical distributions from all RIS sequences were then stacked and normalized again.
To quantitatively characterize the spatiotemporal coupling features of RIS, this study adopted the W-score method from Ghofrani and Atkinson (2020). In constructing this national-scale model, we adopt a first-order assumption of spatiotemporal uniformity: the characteristic distance decay and post-impoundment time lag are treated as statistically uniform across all tectonic provinces and reservoir geologies. This simplification is necessary to obtain a robust, generalizable baseline from the nationwide ensemble, but it inherently neglects regional variations in crustal permeability, stress regime, and lithology. Based on the spatial and temporal evolution characteristics described above, we constructed a exponential decay distribution function for the distance from the shoreline (d) and a hybrid exponential and linear distribution function for the time lag (t). Empirical functions were obtained by fitting the actual data as follows:
Assuming equal weight for the empirical function of distance (d) and the empirical function of time lag (t), the comprehensive W-score formula was established as follows:
3.3 Sequence Parameter Calculation (b-value, p-value, α-value)
For the b-value calculation, we followed the approach of Yin and Jiang (2024), using the continuous distribution function given by Ogata and Katsura (1993) to describe the magnitude-frequency distribution (FMD), hereafter referred to as the OK1993 model:
where λ is the expected number of earthquakes, m is the magnitude, σ is the standard deviation of the normal distribution describing the detection capability, x is the integration variable, and μ is the magnitude at which the detection probability is 0.5. M is the maximum magnitude in the earthquake catalog used for calculation, and the exponent β is related to the traditional Gutenberg-Richter (G-R) relation b-value by . Specifically, the value of β was obtained by fitting the log-likelihood function of the OK1993 model using the maximum likelihood method, and the b-value was subsequently estimated.
We used the time-dependent Epidemic-Type Aftershock Sequence (ETAS) model to calculate the parameters p-value and α-value. The conditional intensity function of the ETAS model can be expressed as (Ogata, 1988):
In the above equation, t* is the time after the mainshock, M0 is the cutoff magnitude (typically set equal to the completeness magnitude MC); Mi and ti are the magnitude and occurrence time of the i-th event, respectively, λ (t*) is the conditional intensity function, μ is the background seismicity rate of the source region, c is the time after the mainshock when the aftershock frequency peaks, and the constant K represents the productivity of aftershocks. The p-value for natural tectonic earthquakes is typically around 1.0, and the α-value is generally greater than 1.0 but is usually less than 1.0 for swarm-like sequences (Ogata, 2001). Limited by an insufficient number of earthquakes (N<40) in some RIS sequences – where 40 events is an empirical threshold widely used in earthquake sequence parameter fitting to ensure stability (e.g. Bi et al., 2022) – or large uncertainties in the sequence parameters (determined as the standard errors derived from the maximum likelihood estimation, δb, δp, δα> parameter), we successfully calculated the corresponding parameters for 38 RIS sequences.
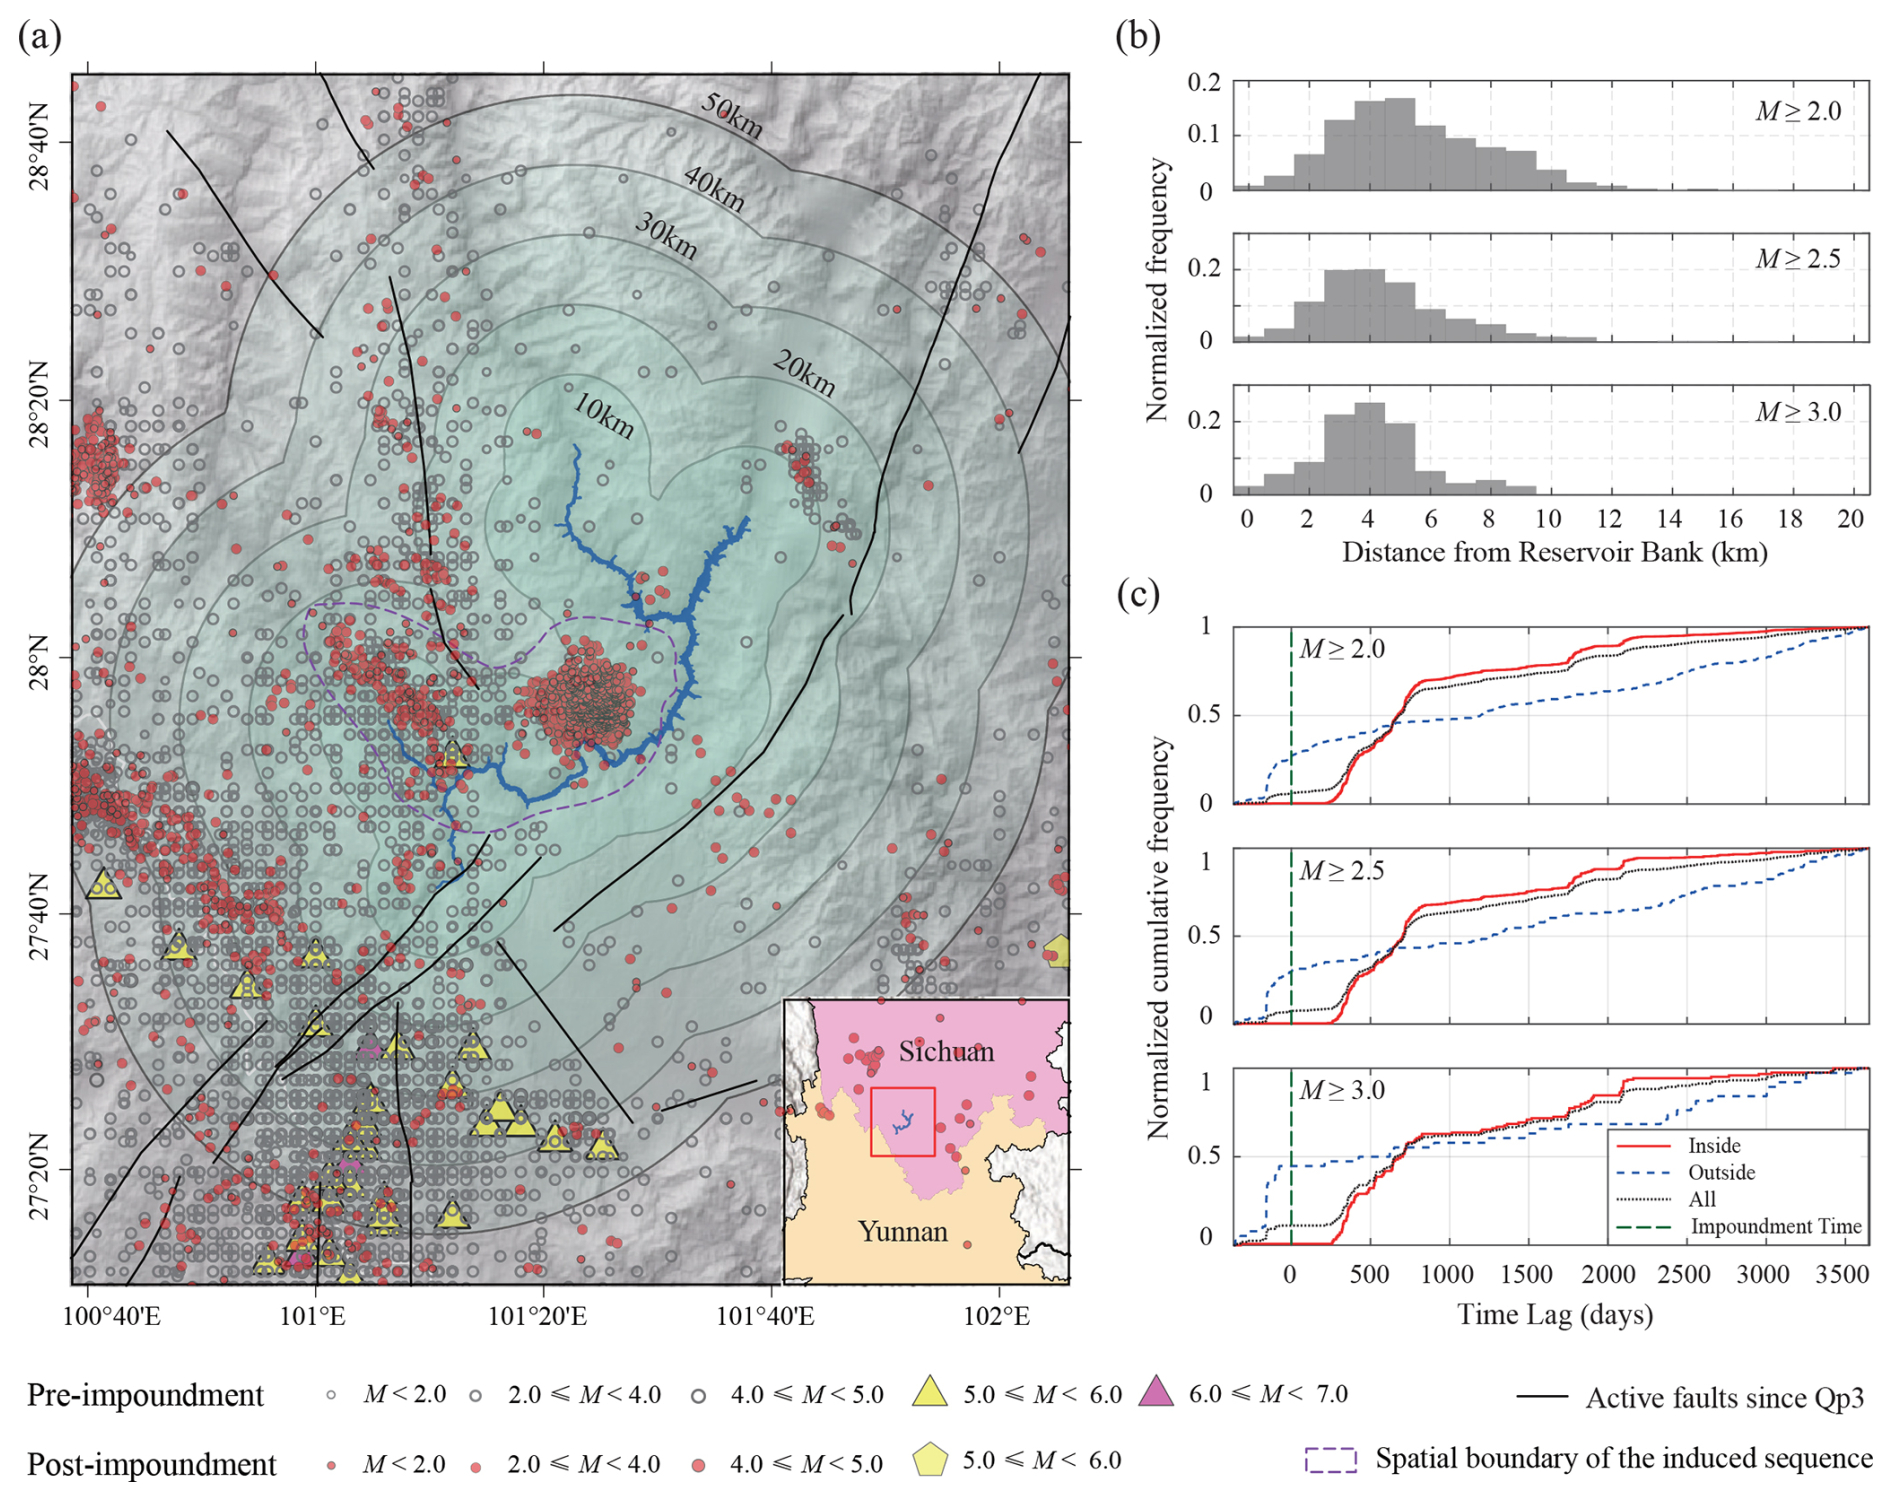
Figure 1Example of identified reservoir-induced seismicity sequences at the Jinping-I Reservoir. (a) Reservoir boundary and spatial distribution of seismicity. Gray dots represent background seismicity recorded from 1970 to the initial impoundment; red dots represent earthquakes after the initial impoundment; purple dashed lines outline the spatiotemporal clusters of induced sequences; black curves denote active faults since the Late Pleistocene; gradient green areas indicate zones within 10, 20, 30, 40, and 50 km from the reservoir shoreline. Note that gray dots represent cumulative seismicity over ∼ 42 years (1970–2012), whereas red dots represent cumulative seismicity over only 10 years (2012–2022); therefore, spatial densities are not directly comparable. The inset shows the location of the study area. (b) Normalized frequency distribution of induced earthquakes as a function of distance from the reservoir shoreline (for the 0–20 km range, with 1 km bins). Subplots (from top to bottom) show results for MC of ML 2.0, 2.5, and 3.0, respectively. (c) Temporal comparison of cumulative earthquake frequency (from one year before to 10 years after the initial impoundment). “Inside” denotes earthquakes located within the manually delineated induced-seismicity clusters (outlined by the purple dashed polygons in Fig. 1a), “outside” denotes background seismicity within 50 km of the reservoir shoreline but outside those cluster boundaries, and “all” denotes all earthquakes within the 50 km buffer. Note that all curves are normalized to their respective maximum values. Consequently, the initial slope of the outside curve during the pre-impoundment baseline reflects the normalization of a small number of background events rather than an abrupt increase in seismicity. The green vertical dashed line marks the time of initial impoundment. Subplots (from top to bottom) correspond to (MC) of ML2.0, 2.5, and 3.0, respectively.
3.4 Correlation Analysis Methods
To comprehensively analyze the potential correlations with Mmax, we employed both the Pearson correlation coefficient (r) (Pearson, 1895), suitable for linear correlation analysis, and the Spearman correlation coefficient (ρ) (Spearman, 1904), suitable for non-linear monotonic correlation analysis. The Pearson correlation coefficient is a statistic based on linear relationships, measuring the strength of linear correlation by calculating the standardized covariance. Its value ranges from [−1, 1], with positive values indicating a positive correlation and negative values a negative correlation (Pearson, 1895). Its mathematical expression is:
The Spearman correlation coefficient is a non-parametric rank-based coefficient used to capture non-linear monotonic relationships, particularly suitable for non-normally distributed data or data containing outliers (Spearman, 1904). Its mathematical expression is:
In the above equations, x represents the logarithmically transformed inducing factor,
y represents the maximum magnitude, and di is the difference in ranks. Using these two methods in combination allows for the identification of both linear trends and non-linear monotonic relationships, with significance testing (P<0.05 considered significant) ensuring robust conclusions.
4.1 Spatial Distribution of Induced-Type Reservoirs
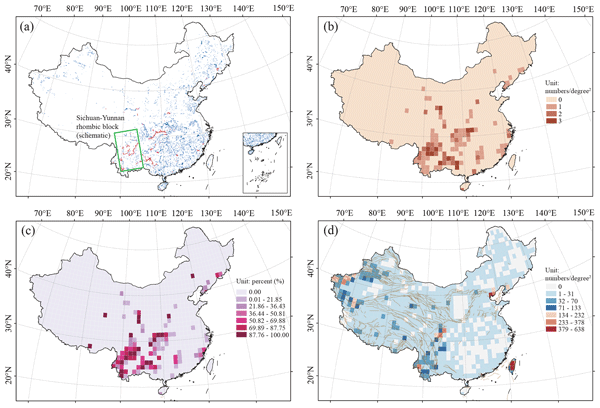
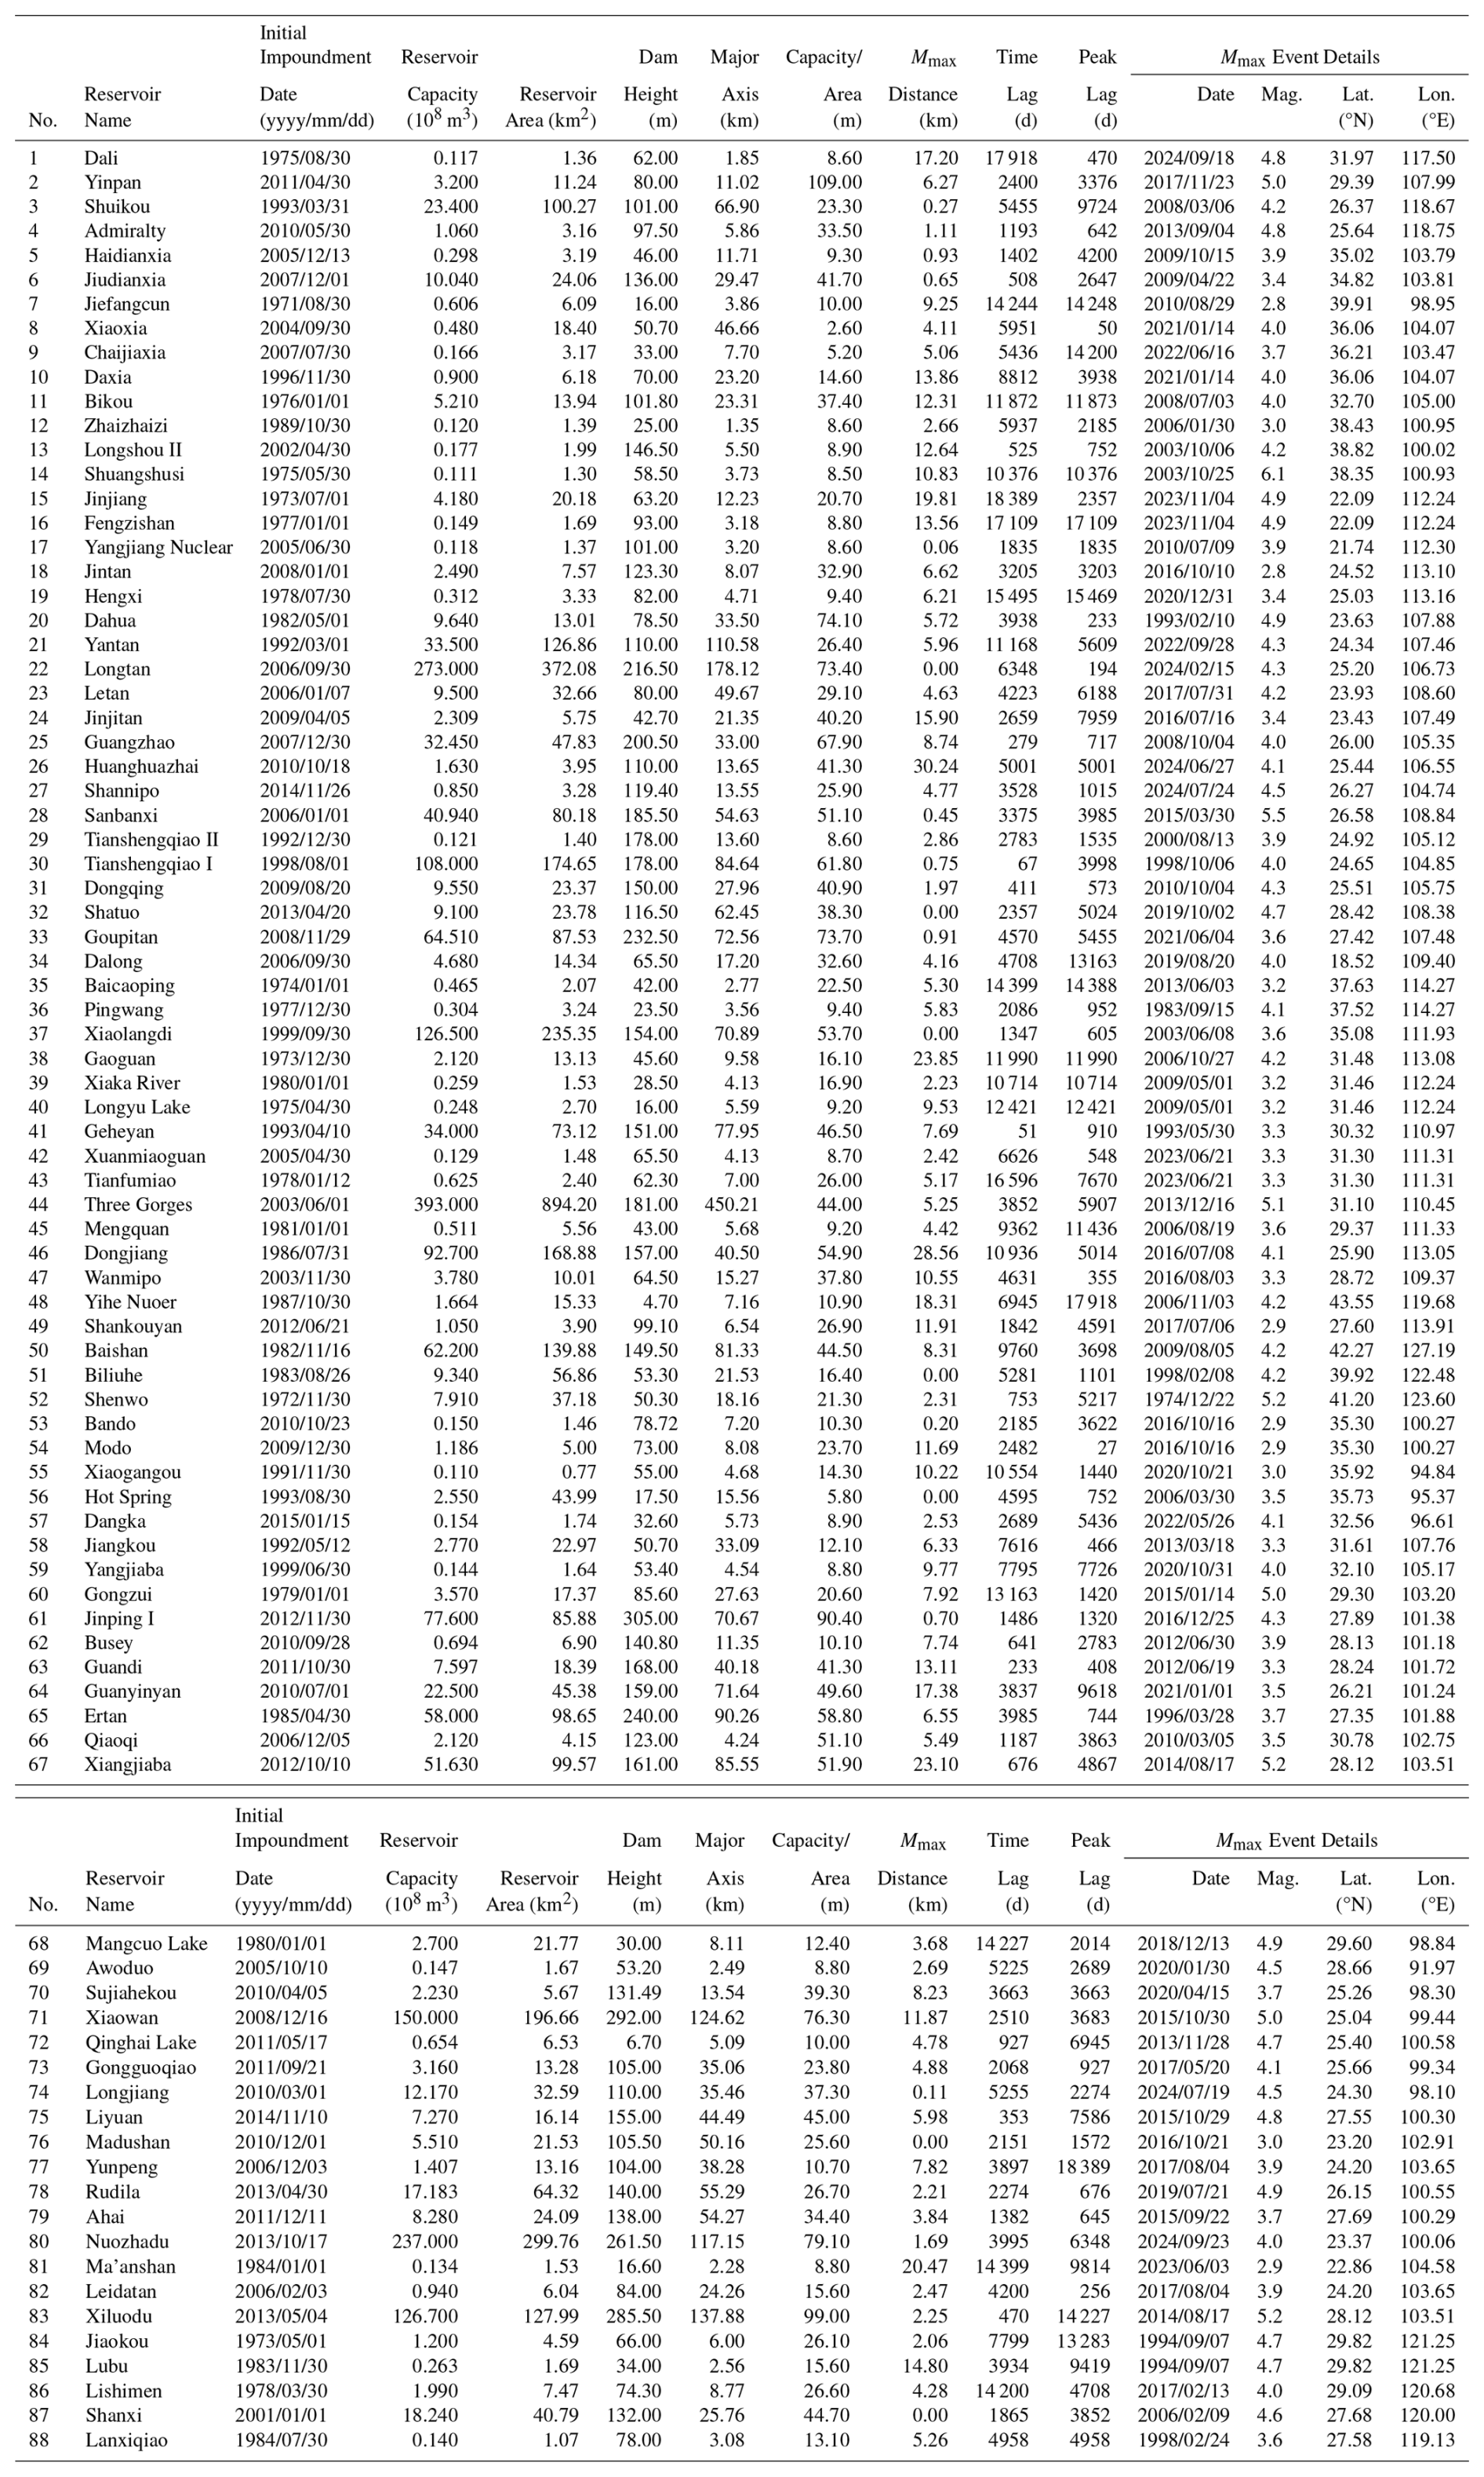
By applying the identification criteria described above, we operationally examined seismic events within 50 km of the reservoir shoreline and screened them against these criteria to select RIS sequences. Figure 1 shows an example of RIS identification for the Jinping-I Reservoir. Located on the main stream of the Yalong River in Yanyuan and Muli counties, Liangshan Prefecture, Sichuan Province, China, this reservoir is a key component of the Jinping-I Hydropower Station. It has a total reservoir capacity of 7.76 billion m3, serves annual regulation functions, and provides comprehensive benefits including power generation, flood control, and sediment retention. Initial impoundment began at 09:26 UTC+8 on 30 November 2012. Within the following year, significant earthquake clustering occurred around the reservoir (Fig. 1a). Notably, two distinct seismic clusters emerged near the central part and the western end (tail) of the reservoir, close to the shoreline, with a maximum magnitude of MS 4.3 (surface-wave magnitude; determined from 20 s surface-wave amplitudes). These two clusters, delineated by purple dashed polygons in Fig. 1a, were manually selected as candidate induced sequences. Analyzing the distance-from-shoreline distribution for earthquakes within these clusters, selected using the minimum magnitude of completeness (MC, used as the lower-bound cut-off) of ML 2.0, 2.5, and 3.0, revealed similar characteristics: events were primarily concentrated within 0–12 km of the shoreline, with a peak distribution at 4–5 km (Fig. 1b). Similarly, examining the temporal evolution of the cumulative frequency for these candidate sequences (using different MC thresholds) and comparing it with the cumulative frequency of background seismicity (unselected events within 50 km) and all earthquakes in the area, shows a distinct increase in the candidate sequences starting around 250 d after impoundment. This increase clearly distinguishes them from the background seismicity, the total seismicity, and the pre-impoundment background activity (Fig. 1c). This consistency satisfies the three identification criteria proposed herein. Therefore, the Jinping-I Reservoir is classified as an induced-type reservoir, and the selected sequences are identified as RIS sequences. As the spatiotemporal patterns remain consistent across different MC values, indicating the stability of the identification results, we used the sequences filtered with MC=ML2.5 – considering the completeness of the catalog in the reservoir area – as the dataset for subsequent analysis. Applying the above RIS identification methodology to the 1435 large/medium reservoirs in the study period, we identified 88 induced-type reservoirs, comprising 56 large reservoirs and 32 medium reservoirs. Their spatial distribution is shown in Fig. 2a, and basic information is listed in Table 1.
Table 1Inventory of 88 identified induced-type reservoirs in China with reservoir properties and parameters of the largest induced earthquake (Mmax).
Based on the 88 identified induced-type reservoirs, we systematically analyzed their spatial distribution characteristics. The results indicate a pronounced regional clustering of induced-type reservoirs in China, predominantly concentrated in the tectonically most active southwestern region, especially central Sichuan-Yunnan rhombic block and southwestern Yunnan, with only sporadic occurrences in southeastern coastal and northeastern regions (Fig. 2a). This spatial pattern is highly consistent when viewed in terms of the density (number per unit area) of induced-type reservoirs (Fig. 2b) and their proportion relative to all large/medium reservoirs within a region (Fig. 2c). The southwestern region is not only the core area of China's hydropower resources and the most densely populated area for large/giant reservoirs but also has the highest identified proportion of induced-type reservoirs, highlighting the elevated risk of induced seismicity for large reservoirs in specific tectonic environments. Visual spatial overlay comparison with the regional tectonic background (active faults since the Late Pleistocene) and the spatial distribution of moderate-to-strong seismicity (M≥4.0 earthquakes since 1970, Fig. 2d) reveals a clear spatial consistency between the distribution of induced-type reservoirs and areas of active tectonics and seismicity. Therefore, compared to the overall distribution of large/medium reservoirs nationwide, the spatial distribution of induced-type reservoirs is highly selective and primarily controlled by regional tectonic activity. In particular, the strong crustal deformation, high tectonic stress accumulation, and widely developed active fault systems along the eastern margin of the Tibetan Plateau provide favorable mechanical conditions and pathways for reservoir water infiltration, fault weakening, and earthquake triggering. In contrast, the relatively stable tectonic eastern plains, despite having numerous reservoirs, show a significantly lower incidence of induced seismicity. This marked spatial correlation reveals the non-uniformity of reservoir-induced seismic hazard at the regional scale, an important aspect to be considered in the planning and siting of future major water conservancy and hydropower projects, regional seismic hazard assessments, and the development of operational risk monitoring strategies.
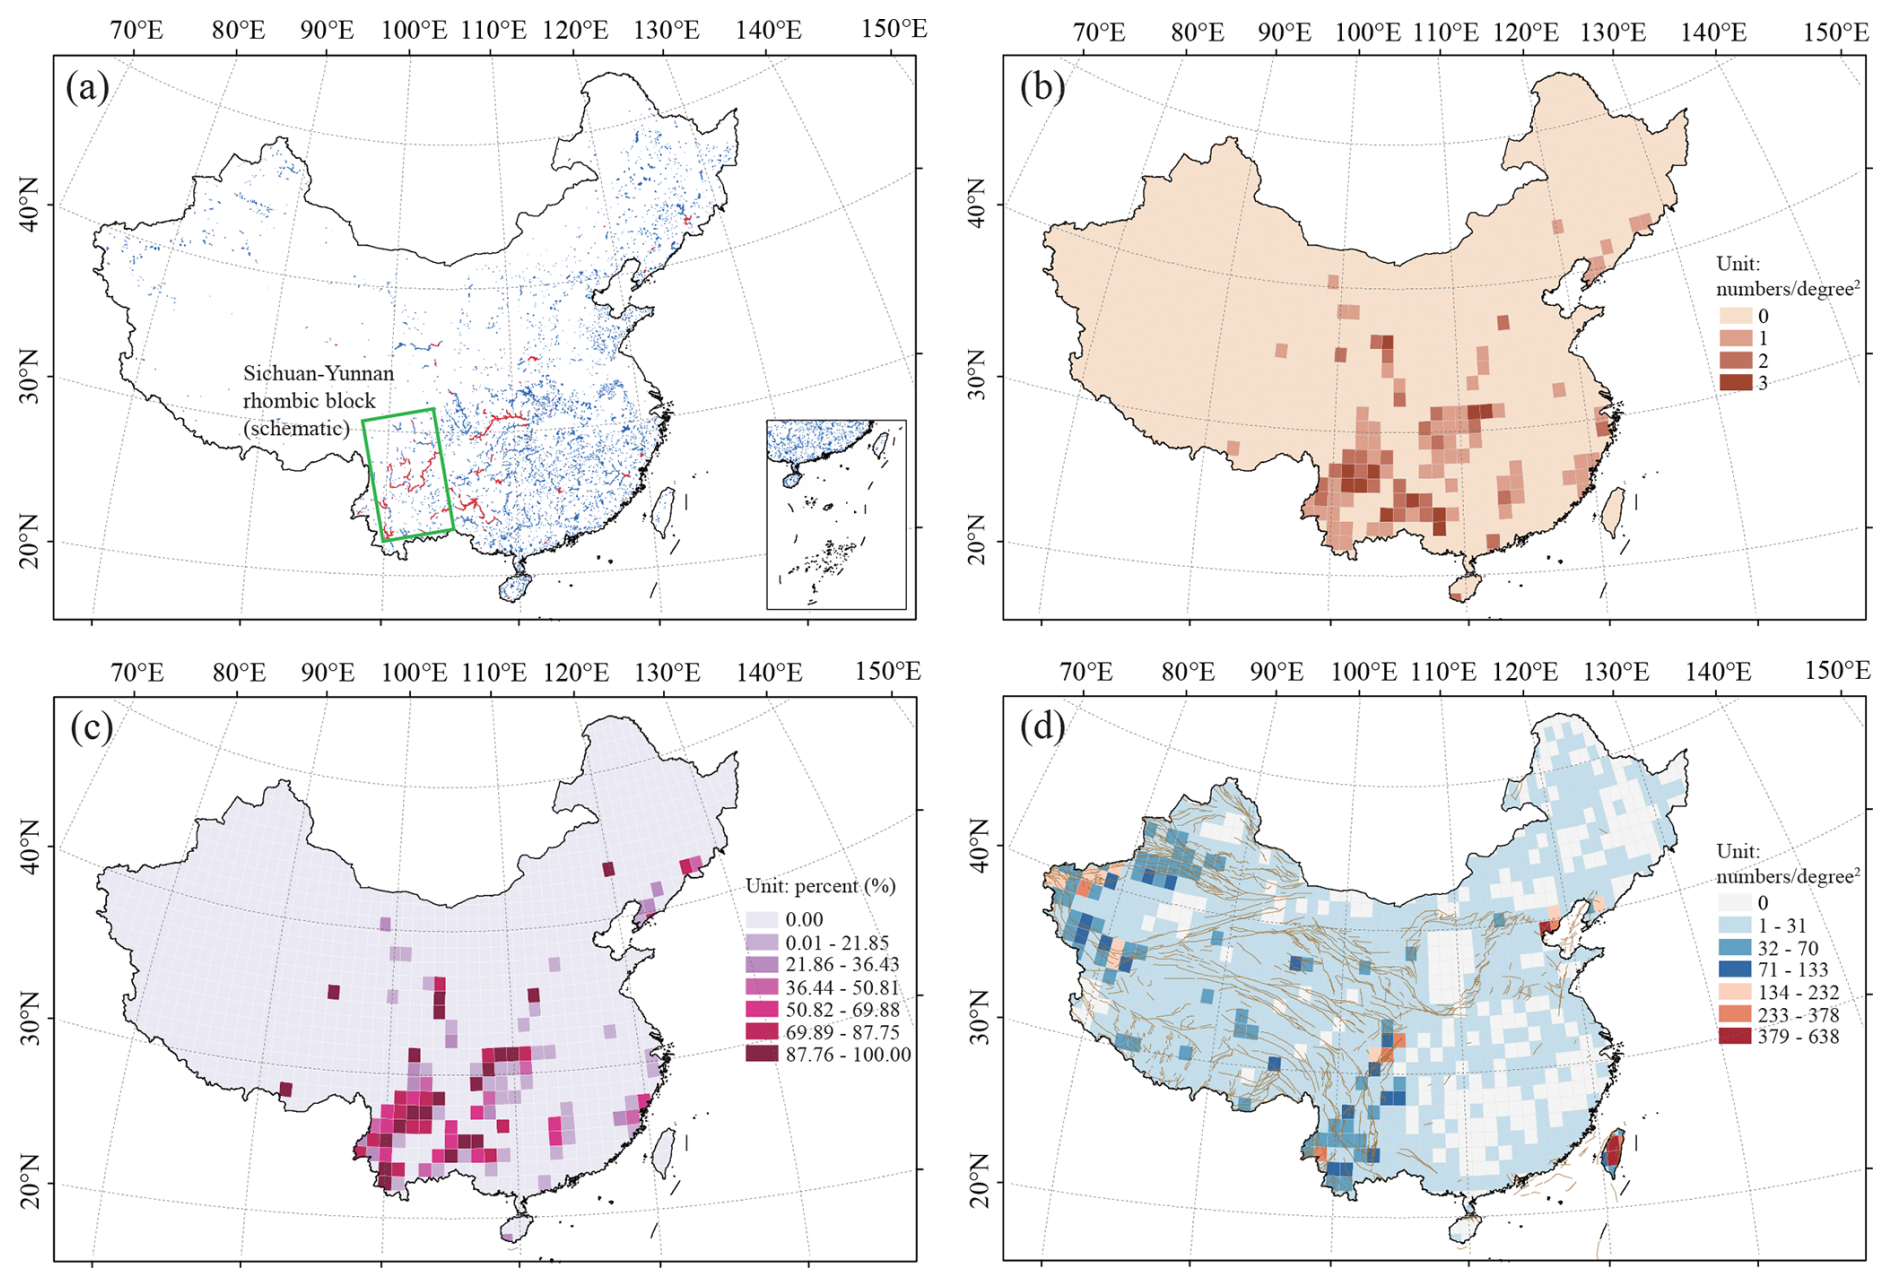
Figure 2Spatial distribution characteristics of reservoir-induced seismicity in China. (a) Spatial distribution of large/medium-sized reservoirs and reservoirs with induced seismicity. Blue polygons represent large/medium-sized reservoirs (capacity m3) with complete parameters (e.g., impoundment time, dam height); red polygons represent reservoirs with induced seismicity, identified based on spatiotemporal clustering. The green oblique box schematically outlines the approximate extent of the Sichuan-Yunnan rhombic block, highlighting the tectonic region where reservoir-induced earthquakes are predominantly concentrated. (b) Spatial density of reservoirs with induced seismicity (units: number per square degree). (c) Spatial distribution of the proportion of reservoirs with induced seismicity among all large/medium-sized reservoirs. (d) Density distribution of M≥4.0 earthquakes in China (units: number per square degree) and mapped active faults (brown lines, Xu et al., 2016). This threshold is chosen to illustrate the long-term regional tectonic setting and active fault framework, distinct from the MC=ML2.5 catalog used for RIS sequence analysis.
4.2 Spatiotemporal Characteristics of Induced Seismicity Sequences
The composite distance-from-shoreline and time lag distributions for the identified RIS sequences are shown in Fig. 3a and b, respectively. The results show that RIS sequences are closely distributed around the reservoir area. The cumulative frequency of earthquakes along the distance from the shoreline reaches 95 % at 24.8 km and 99 % at 38.2 km. This indicates that the maximum distance of RIS sequences can approach 40 km, suggesting that the influence range stipulated within 10 km of the reservoir area in the current Chinese national standard GB/T 21075-2007 (Reservoir-Induced Seismic Hazard Assessment) is overly conservative and may underestimate the spatial extent required for risk prevention and control. More importantly, Fig. 3a shows that the earthquake occurrence rate of RIS sequences follows a significant exponential decay with increasing distance from the reservoir shoreline.
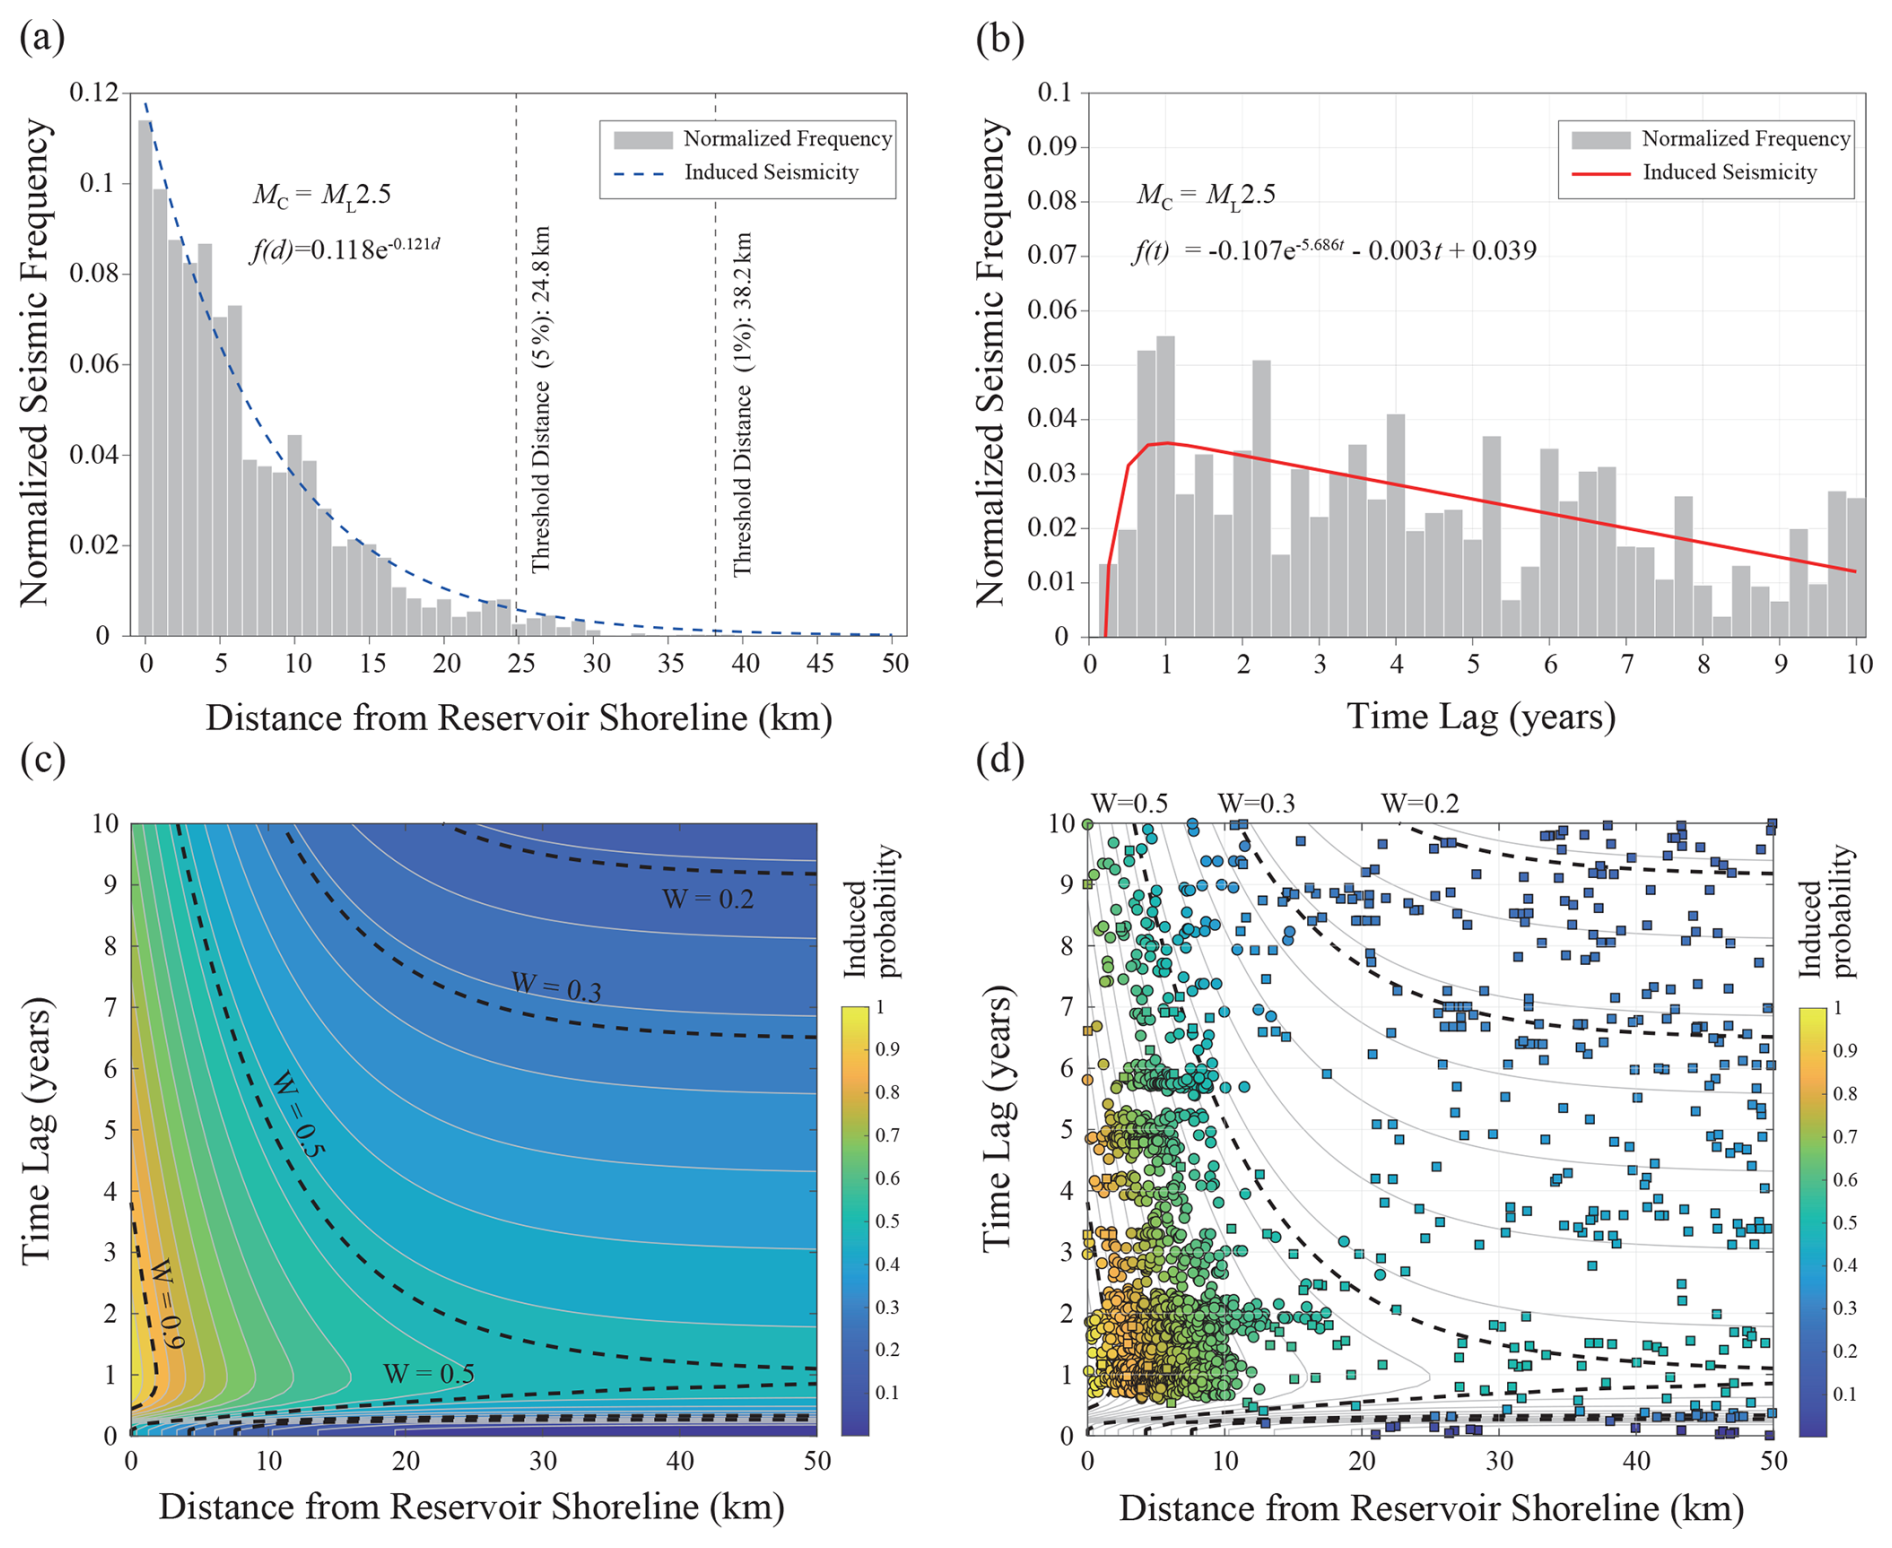
Figure 3Spatiotemporal patterns of reservoir-induced seismicity and construction of the W-score table. (a) Empirical distribution of normalized earthquake frequency versus distance from the reservoir shoreline, with the blue curve showing the fit of a exponential function. (b) Empirical distribution of normalized earthquake frequency versus time lag since initial impoundment, with the red curve showing the fit of an exponential-linear hybrid model. (c) W-score table constructed based on the joint distribution of reservoir distance and time lag. The color fill indicates the probability of induced seismicity; black contour lines mark the boundaries for probabilities of 0.2, 0.3, 0.5, and 0.9. (d) Example application of the W-score table, using the Jinping-I Reservoir and induced seismicity identification results for a completeness magnitude MC=ML2.5. Circles represent manually identified induced earthquakes, squares represent background earthquakes, and the color fill indicates the probability of induced seismicity.
Figure 3c shows the two-dimensional W-score results described by Eq. (3). The W-score at any location in the figure represents the probability of any earthquake event being induced, thus enabling a quantitative assessment of the probability of RIS. Figure 3d shows an example application of the W-score to the RIS sequence at the Jinping-I Reservoir (Fig. 1). It can be seen that the RIS sequence is significantly clustered in high W-value regions (0.6 < W < 1.0), while background natural tectonic earthquakes are mainly distributed in low W-value regions (W < 0.4). This W-score table provides a new quantitative analysis tool for identifying RIS in China. While the Jinping-I Reservoir is presented here as a representative illustration, the W-score model has been further validated for four additional reservoirs (Xiluodu and Xiangjiaba in southwestern China, Guangzhao in Guizhou Province, and Shuikou in Fujian Province) spanning contrasting tectonic regimes, reservoir geometries, and storage capacities (Sect. S2 in the Supplement). Notably, these reservoirs differ in induced-seismicity intensity by over an order of magnitude, yet exhibit consistent W-score segregation – induced events consistently occupy high-W regions (0.6 < W < 1.0) independent of absolute event counts. This consistency arises because the W-score is formulated from normalized dimensionless parameters, ensuring applicability across reservoirs with varying seismicity rates and confirming that no single high-activity reservoir dominates the statistical signature.
4.3 Parameter Characteristics of Induced Seismicity Sequences
The statistical parameters of reservoir-induced seismicity sequences contain key information about their triggering mechanisms and evolution processes. For example, the b-value in the magnitude-frequency relationship describes the differential stress level (Jiang et al., 2021; Yin and Jiang, 2024; Chang et al., 2025); the p-value in the Omori-Utsu formula describes the decay rate of a sequence (Trivedi, 2015; Utsu, 1999); and the α-value in the Epidemic-Type Aftershock Sequence (ETAS) model describes the ability of an earthquake to generate secondary events (Ogata, 1988; Bi and Jiang, 2019). To systematically reveal the characteristics and physical implications of RIS sequences in China, this study calculated the α-value, b-value, and p-value for each of the identified induced seismicity sequences from reservoirs impounded between 1 January 1971, and 27 March 2015, and compared these sequence parameters with parameters of natural earthquake sequences. Additionally, we compared the b-value of each RIS sequence with the b-value of the background seismicity in the respective reservoir areas.
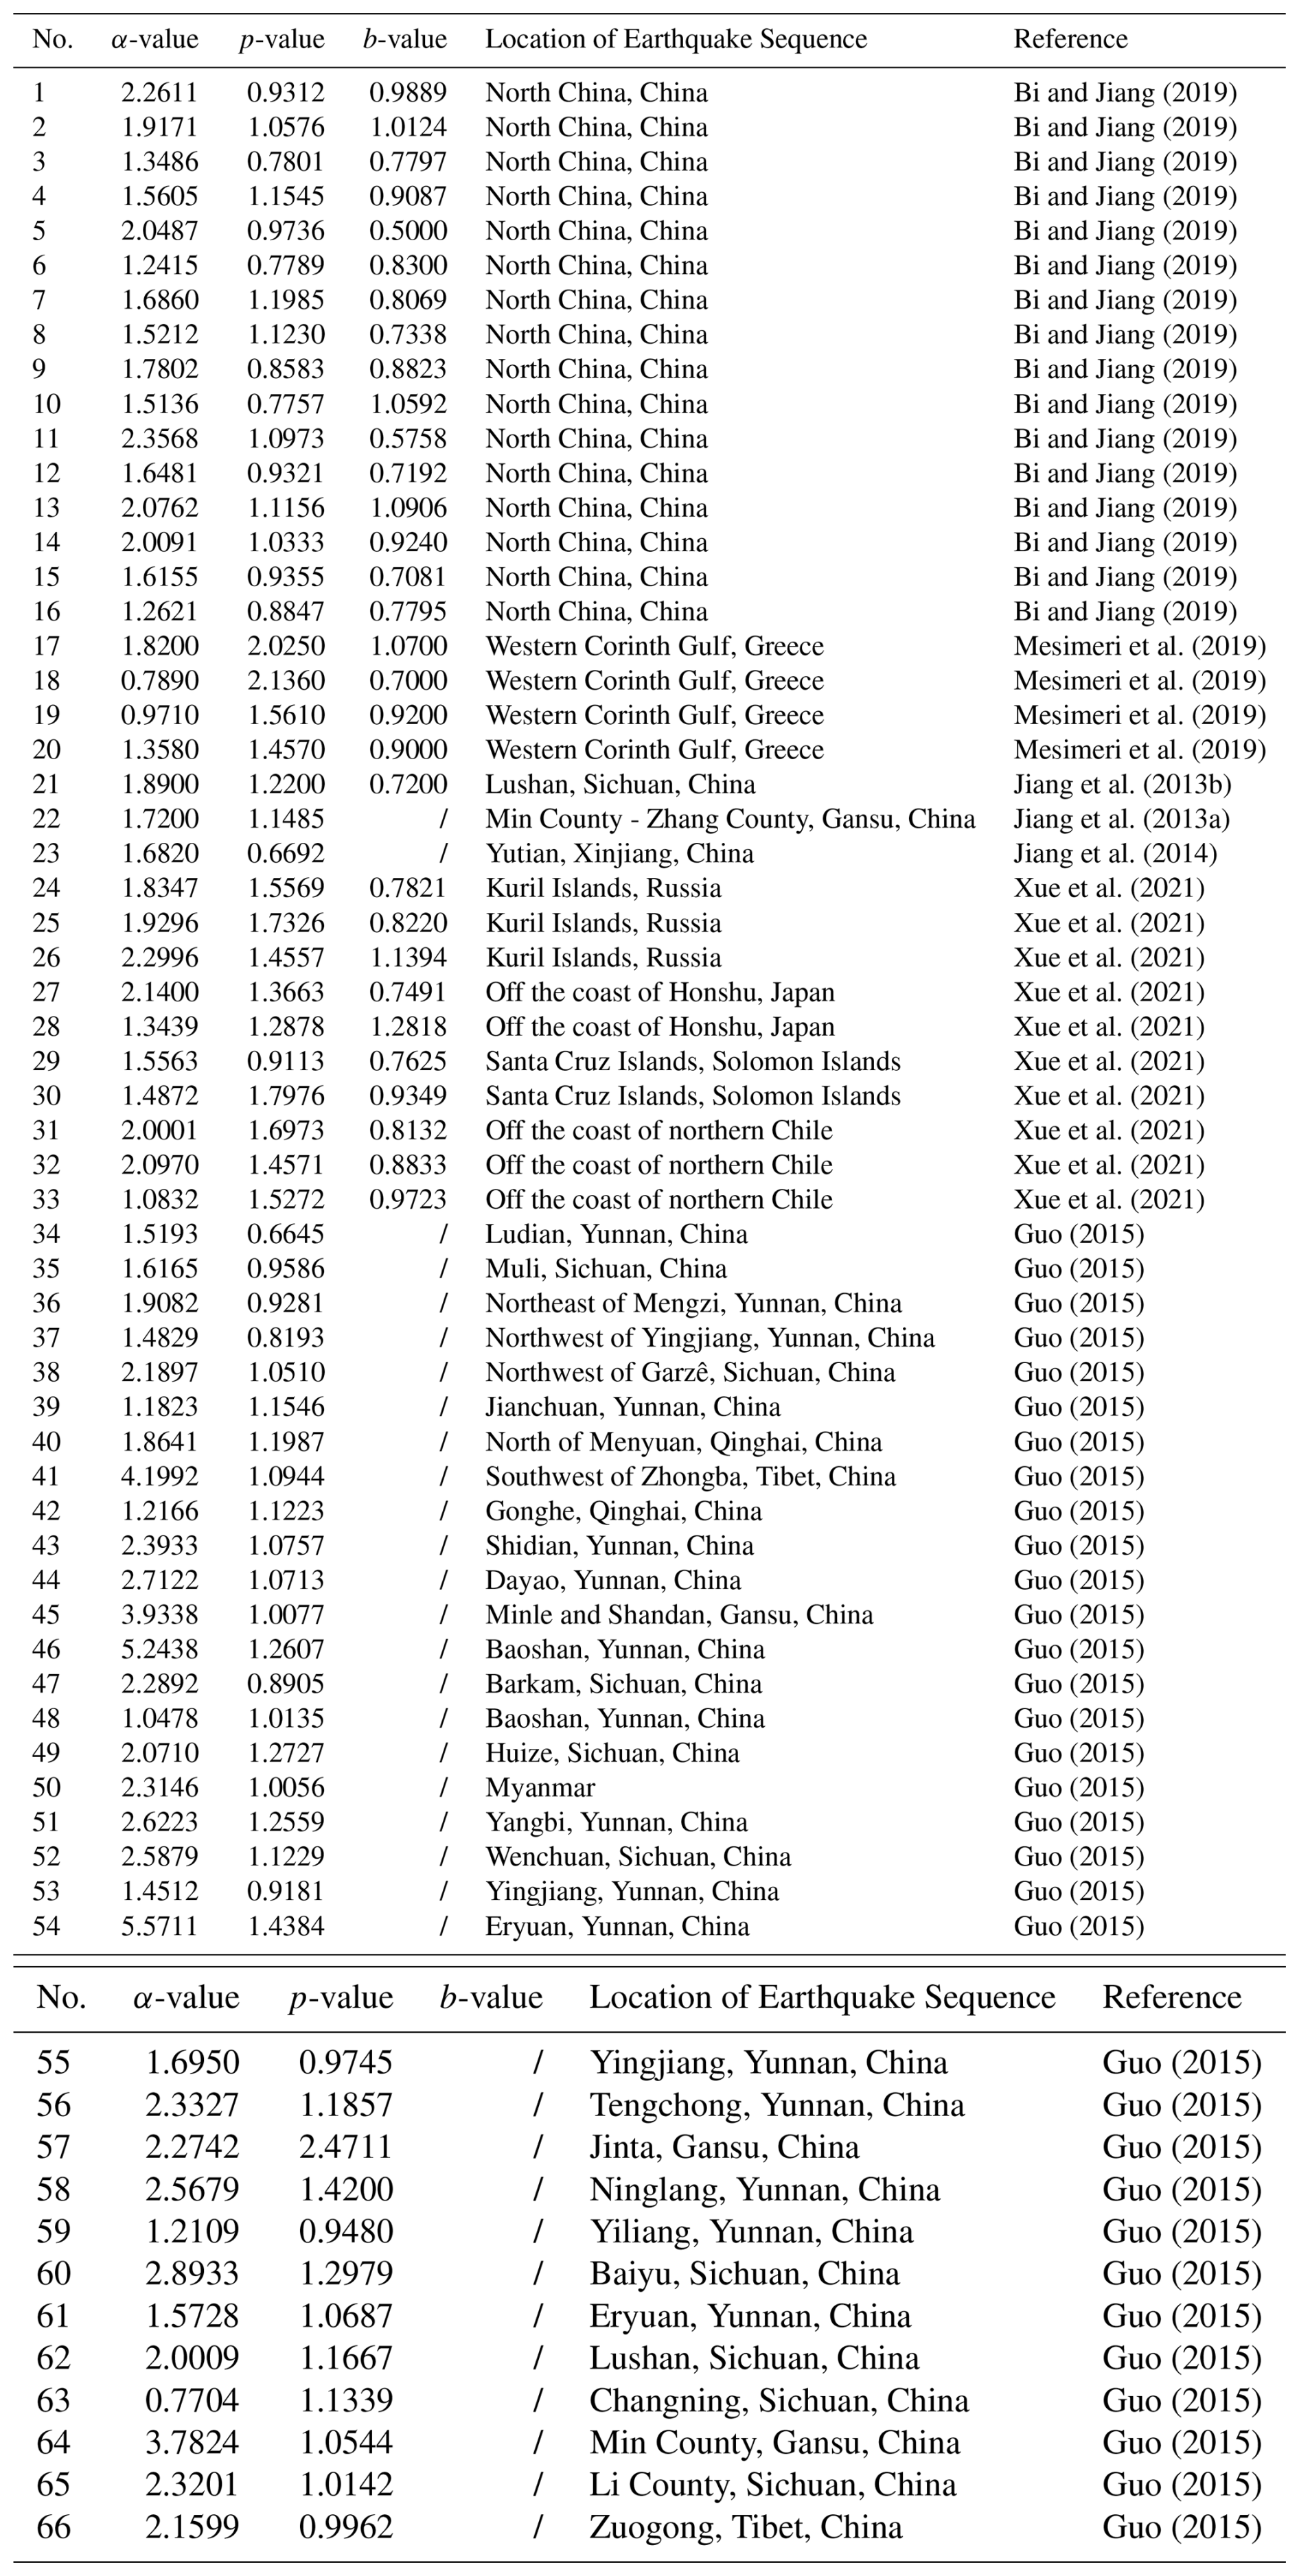
The statistical distributions of the calculated α-values, b-values, and p-values are shown in Fig. 4a–c. The median α-value is 0.89, the median b-value is 1.16, and the median p-value is 1.11. To compare with the statistical characteristics of natural earthquake sequence parameters, we collected 66 cases from previous studies that also used the time-dependent ETAS model for fitting and provided the resulting parameters (Jiang et al., 2013a, b, 2014; Guo, 2015; Bi and Jiang, 2019; Mesimeri et al., 2019; Xue et al., 2021). These cases are mainly from China (51 cases) and partially from other regions globally (15 cases). All provide calculated p-values and α-values, and some provide b-value results (31 cases). The median α-value for these natural sequences is 1.88, the median b-value is 0.83, and the median p-value is 1.10. The corresponding parameter values are listed in Table 2. Direct comparison of the statistical distributions of α-value, b-value, and p-value shows that the α-values of RIS sequences are generally smaller than those of natural sequences, the b-value distribution is more scattered and generally higher, and the p-values are relatively similar. We used the Kolmogorov-Smirnov test (significance level P=0.05) to examine whether the respective parameter combinations of RIS sequences and natural sequences come from the same distribution. The results show significant differences for b-value and α-value (significance level P<0.05), while the difference for p-value is not statistically significant (significance level ). Furthermore, to avoid potential intrinsic correlations among these parameters (e.g., Wang, 1994; Jiang et al., 2015) affecting the distinguishability between RIS and natural sequence characteristics, we examined the pairwise distribution relationships among the three sequence parameters. As shown by the sample density contour plots in Fig. 4d–f, the distribution of RIS sequence parameters can be clearly distinguished from that of natural earthquake sequence parameters in the combined distributions of b-value vs. α-value, b-value vs. p-value, and p-value vs. α-value. Therefore, it can be concluded that RIS sequences and natural earthquake sequences have distinct characteristics in their statistical parameters, mainly manifested as: RIS sequences typically have higher b-values (indicating lower effective stress/higher proportion of small earthquakes) and significantly lower α-values (indicating weaker ability of small-magnitude events to trigger secondary earthquakes). Therefore, RIS sequences and natural earthquake sequences exhibit distinct statistical characteristics in their frequency-magnitude distributions and triggering abilities.
To further investigate the differences between RIS sequences and the background seismicity around the reservoir areas, this study compared the b-value of the induced sequence with the b-values of background seismicity at different distances from the reservoir shoreline (Fig. 5). We employed two spatial strategies: The first was a non-overlapping concentric zoning strategy, dividing the area around the reservoir into discrete concentric zones of 0–10, 10–20, 20–30, 30–40, and 40–50 km. The b-value of background seismicity in each zone was calculated independently and compared with the RIS sequence b-value using the Kolmogorov-Smirnov (KS) test (significance level P=0.05). The results show that the P for all zones are greater than 0.05, indicating no significant difference was identified. The second was a cumulative zoning strategy, gradually expanding the study area in 10 km increments (0–10 km → 0–50 km). The b-value of background seismicity within the cumulative range was calculated. The KS test results show that the P decreases initially with increasing cumulative distance, becomes significantly lower than 0.05 at 30 and 40 km, indicating a significant difference between the background seismicity b-value beyond this distance and the RIS sequence b-value. The P increases again after 40 km, possibly because beyond the effective range of reservoir water penetration, the background seismicity is controlled by the tectonic environment, and the b-value stabilizes. These results suggest that a distance of 30 to 40 km from the shoreline may be a critical physical boundary, which can be defined as the effective spatial scale of reservoir water penetration. The first strategy failed to identify a difference, primarily due to insufficient sample size of far-field earthquakes and the smoothing effect of spatial continuity.
Table 2Statistical parameters (α-value, p-value and b-value) of natural tectonic earthquake sequences.
4.4 Correlation Analysis of Inducing Factors
To further elucidate the potential factors influencing the intensity of RIS sequence activity, we analyzed the correlation between the maximum magnitude (Mmax) of the RIS sequences and two categories of parameters, totaling eight specific factors. The first category comprises static reservoir attributes: reservoir capacity (108 m3), dam height (m), reservoir surface area (km2), reservoir major axis length (km), and mean water depth, the latter calculated as reservoir capacity/reservoir area. The second category describes the dynamic response of RIS: the distance from the reservoir shoreline of the Mmax event (Mmax distance, km), the time lag of the Mmax event since initial impoundment (time lag, days), and the time lag between initial impoundment and the peak seismicity rate (peak lag, days). Peak lag is operationally defined by binning the post-impoundment earthquake catalog into 0.25 year (3 month) intervals, computing the event frequency for each bin, and taking the elapsed time from the initial impoundment date to the bin with the maximum frequency. It is important to note that since dynamic response parameters cannot be defined for non-induced reservoirs, this analysis is based solely on the sample of 88 induced-type reservoirs.
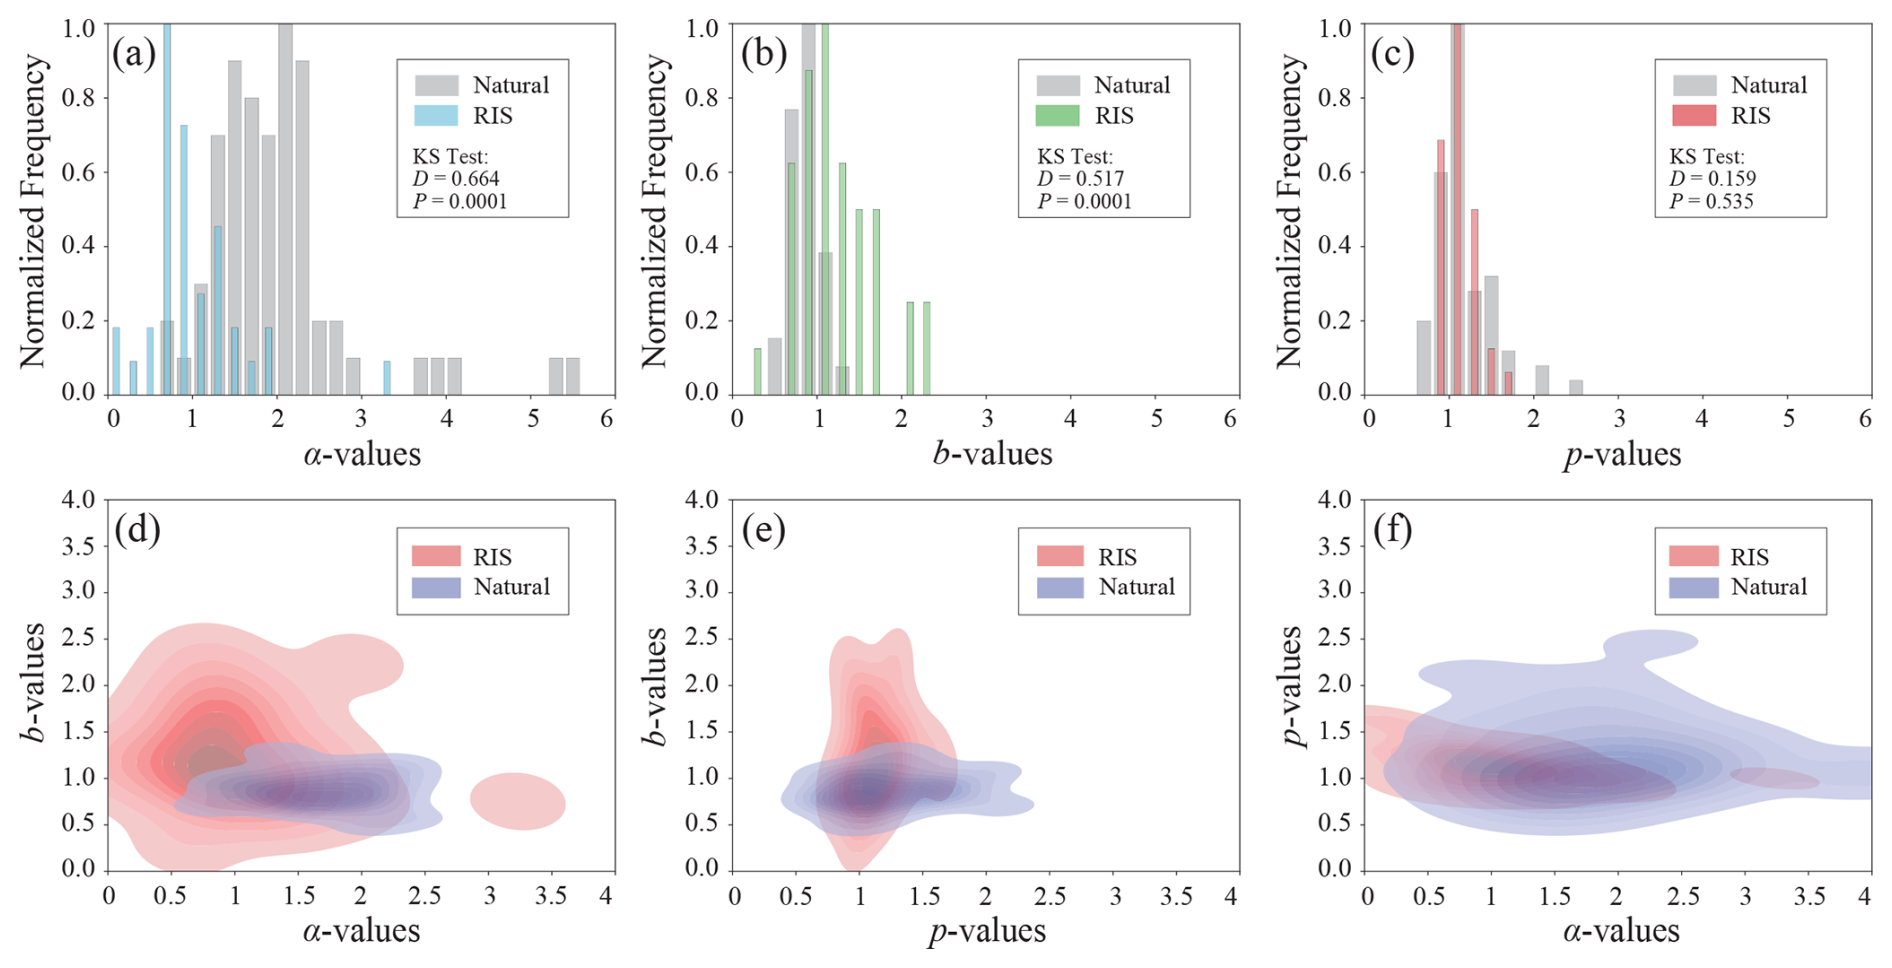
Figure 4Parameter characteristics of the reservoir-induced seismicity sequences. (a) Statistical distribution of the α-value from the ETAS model for the induced sequences. (b) Statistical distribution of the p-value from the ETAS model. (c) Statistical distribution of the b-value estimated using the OK1993 model. (d) Scatter plot of α-value versus b-value. (e) Scatter plot of p-value versus b-value. (f) Scatter plot of α-value versus p-value. In panels (d) to (f), the blue contours represent the bivariate kernel density estimate (KDE) for parameters of natural tectonic seismicity sequences from previous studies, and the red contours represent the KDE for parameters of the induced seismicity sequences from this study.
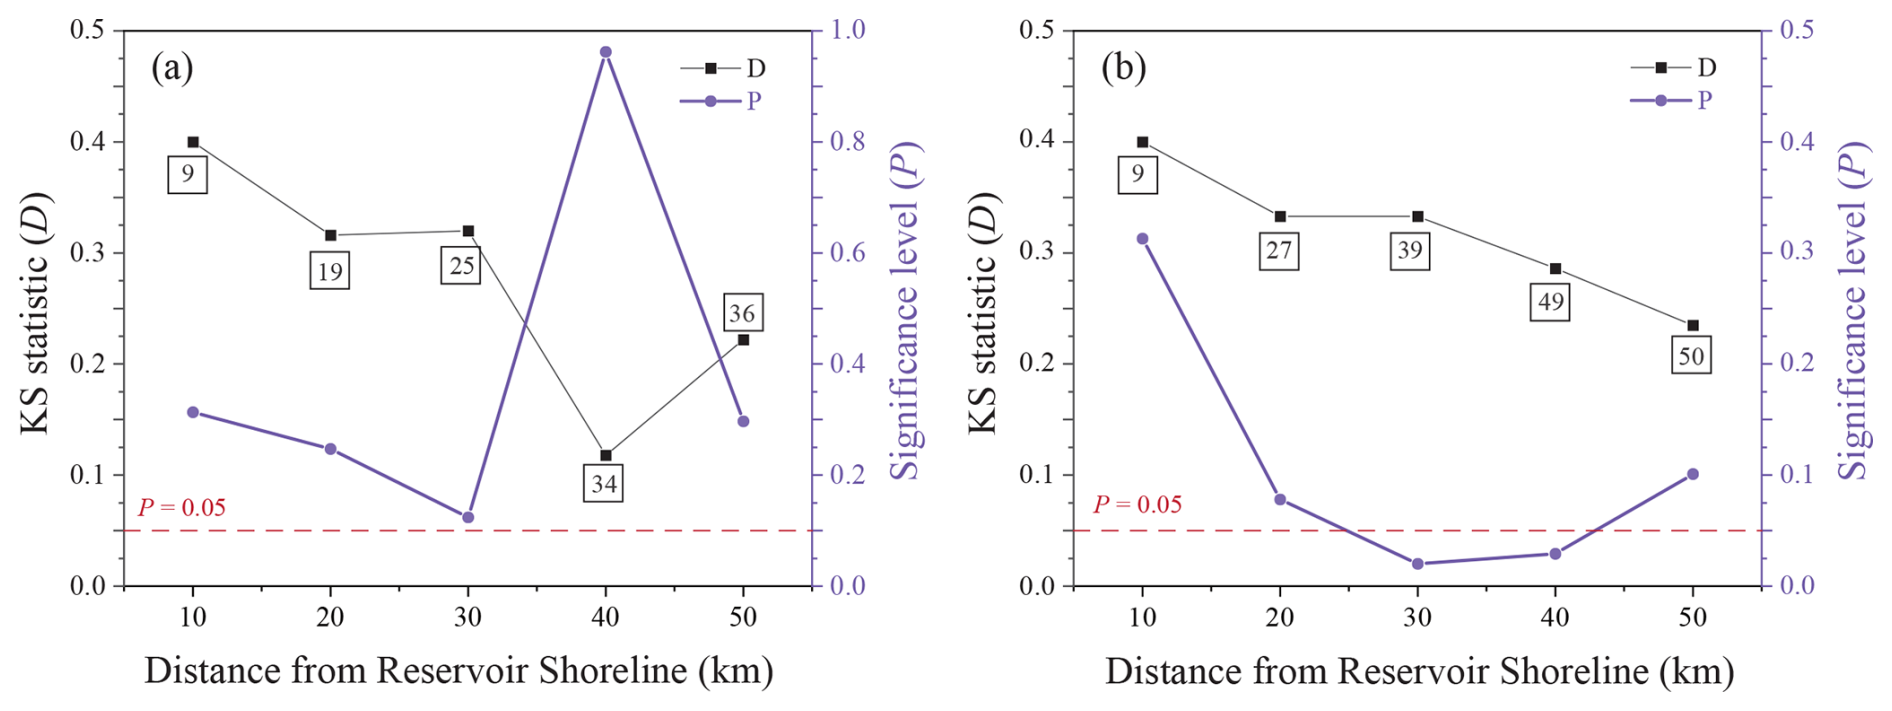
Figure 5Statistical characteristics of the Kolmogorov-Smirnov (KS) test comparing the b-values of induced sequences and background seismicity. (a) Zonal KS test results: b-values of background seismicity within concentric distance zones (0–10, 10–20, 20–30, 30–40, 40–50 km from the reservoir shoreline) are compared against the b-value of the induced sequence. The KS statistic (D) and significance level (P) are plotted against distance. (b) Cumulative zonal KS test results: based on b-values of background seismicity within cumulative distance ranges (0–10, 0–20, 0–30, 0–40, 0–50 km). The red horizontal dashed lines in both panels indicate the statistical significance threshold (P=0.05).
The results of the correlation analysis between the eight potential inducing factors and Mmax are shown in Fig. 6. The results indicate that the five static reservoir attribute parameters exhibit weak positive correlations with Mmax. The Pearson correlation coefficient (r) values range from 0.20 to 0.28, and the Spearman correlation coefficient (ρ) values range from 0.21 to 0.32. For each parameter, at least one of the r or ρ values has a significance level less than 0.05. In contrast, the three dynamic attribute parameters show no correlation with Mmax, with r or ρ values close to zero, and the corresponding significance levels all exceed 0.05. These results suggest that relying on any single static or dynamic reservoir attribute parameter is insufficient for reliably predicting the maximum magnitude (Mmax) of RIS.
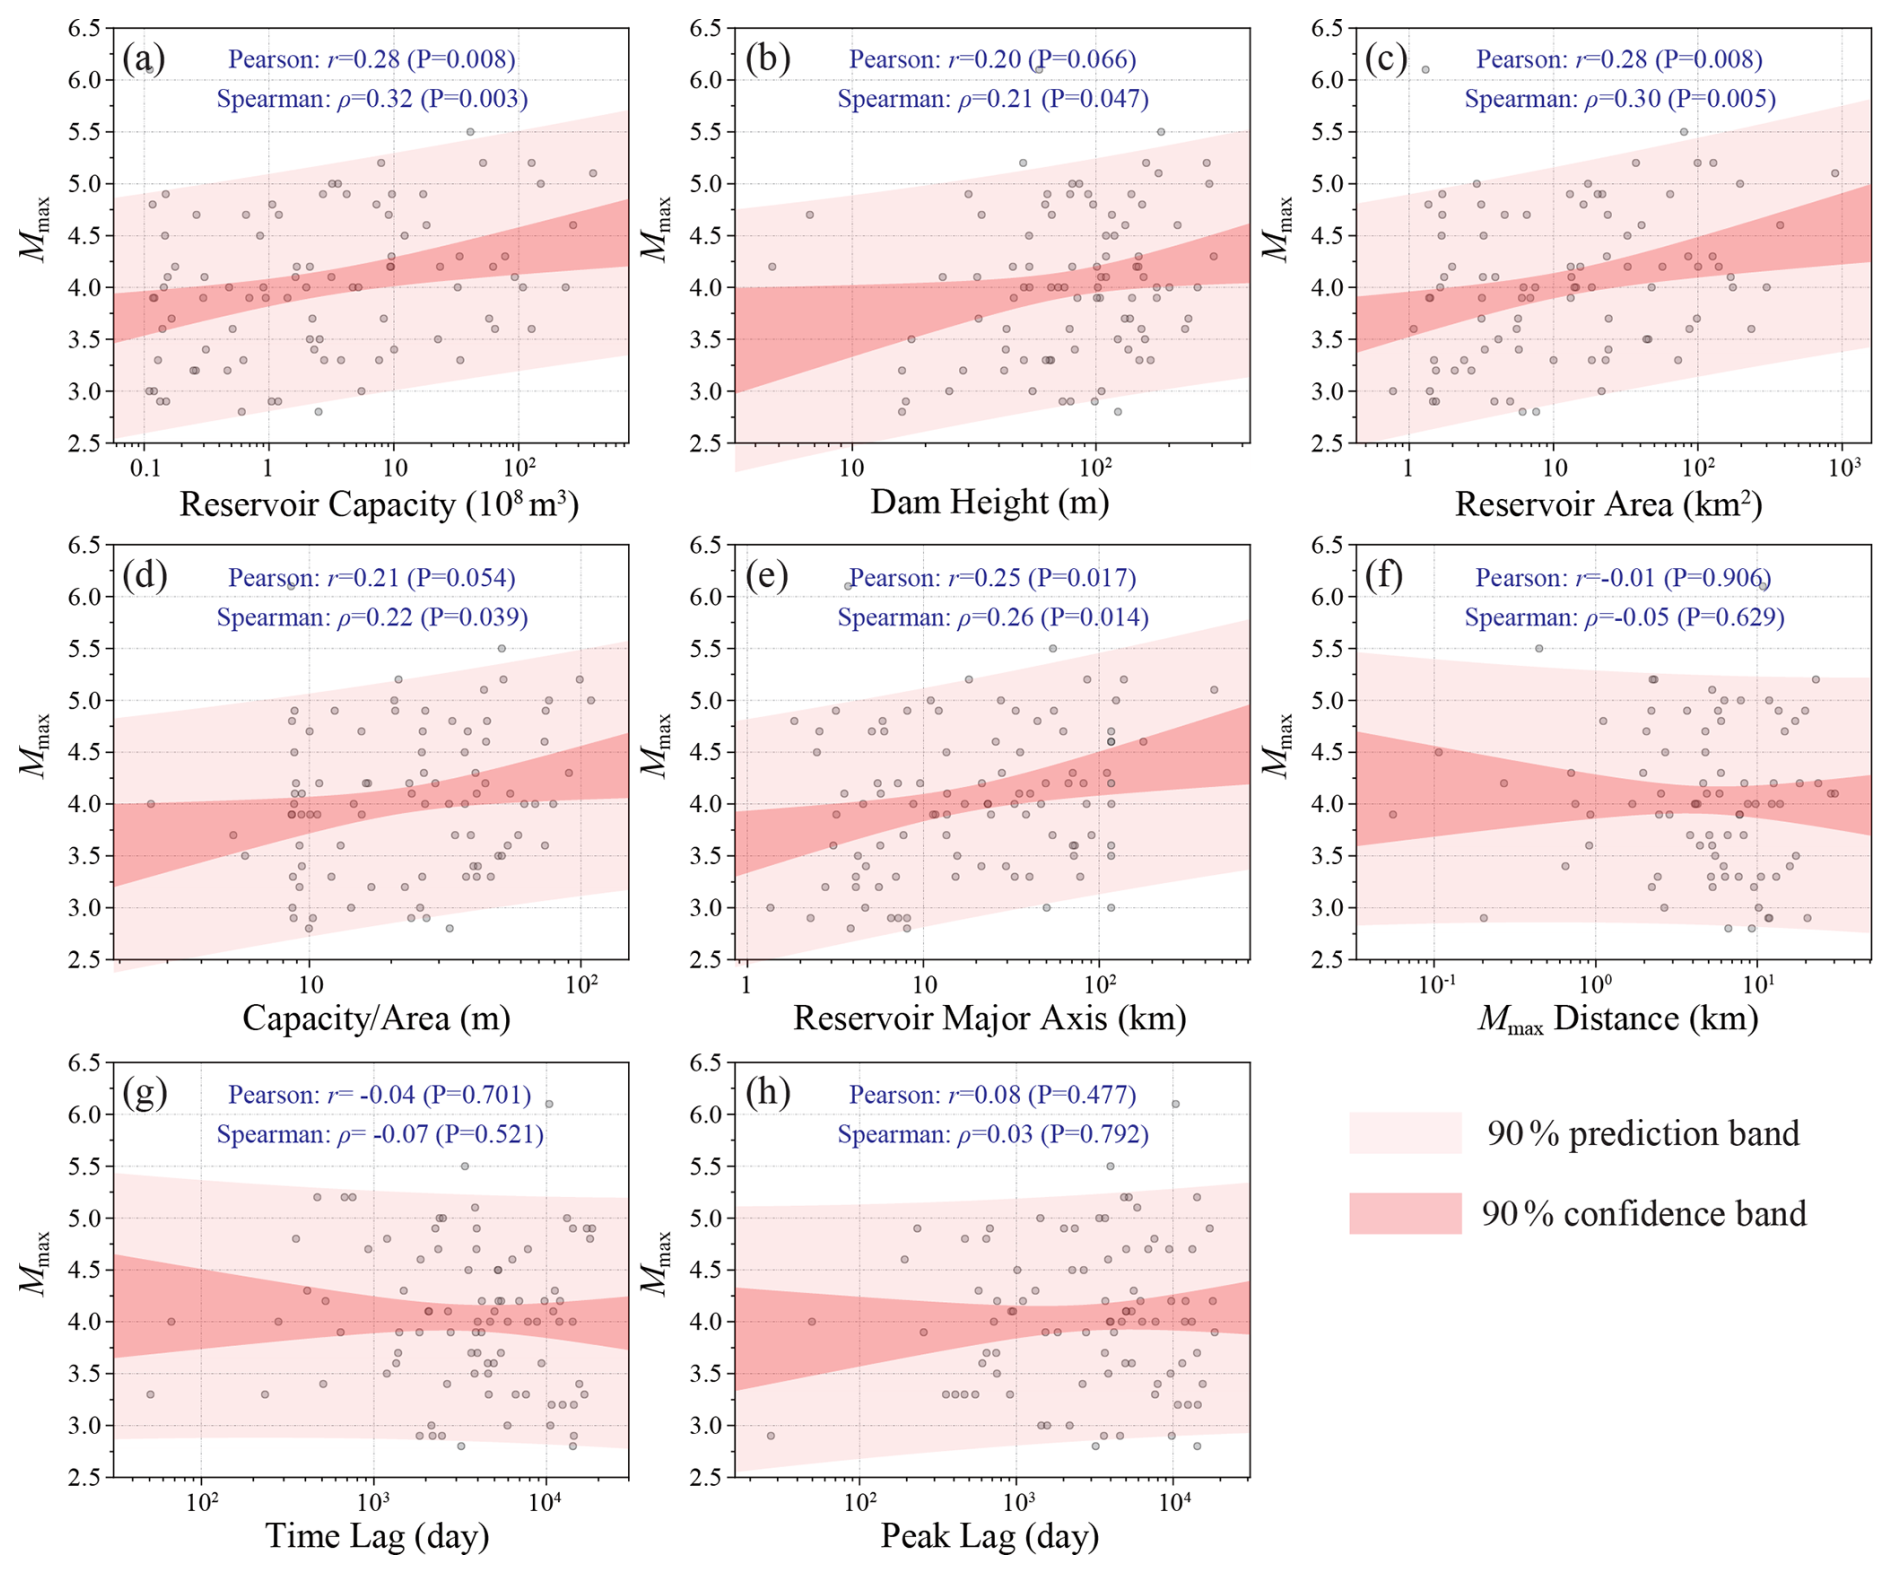
Figure 6Correlation analysis between the maximum magnitude (Mmax) of induced seismicity and potential inducing factors. (a) Reservoir capacity (108 m3). (b) Dam height (m). (c) Reservoir surface area (km2). (d) Mean water depth (Capacity/Area, m). (e) Reservoir major axis length (km). (f) Distance from the reservoir shoreline of the Mmax event (Mmax distance, km). (g) Time lag of the Mmax event since initial impoundment (time lag, days). (h) Time lag of the peak seismicity rate since initial impoundment (peak lag, days). The Pearson correlation coefficient (r), Spearman correlation coefficient (ρ), and the corresponding significance level (P) are indicated textually in each subplot.
Although the static and dynamic reservoir parameters show only weak or no correlation with the intensity (Mmax) of the RIS sequences, whether these parameters can be used for preliminary screening of induced seismic risk prior to reservoir construction remains a valuable question. We address this from two perspectives. First, we examine whether thresholds exist for the five static parameters that show weak but statistically significant correlations, which could indicate high RIS risk. For this purpose, we binned the values of the five static reservoir attribute parameters and examined the proportion of induced-type reservoirs within each bin. The results are shown in Fig. 7. Reservoir capacity and reservoir major axis show clear threshold indicative value for the occurrence probability of induced-type reservoirs: As shown in Fig. 7b, when the reservoir capacity exceeds 3.2 × 10⁸ m3 (100.5×10⁸ m3), the proportion of induced-type reservoirs approaches 15 %, which is already significant. In capacity bins above this threshold, the proportion of induced-type reservoirs generally shows a positive correlation with capacity. Figure 7c shows that the reservoir major axis exhibits a similar characteristic; when it exceeds 15.9 km (101.2 km), the proportion of induced-type reservoirs exceeds 11 %. In length bins above this threshold, the proportion shows a positive correlation with length. The existence of such clear thresholds in the proportion of induced-type reservoirs for these two static parameters can provide a basis for preliminary screening during project planning. Specifically, sites meeting or exceeding these threshold conditions warrant specialized RIS hazard assessment.
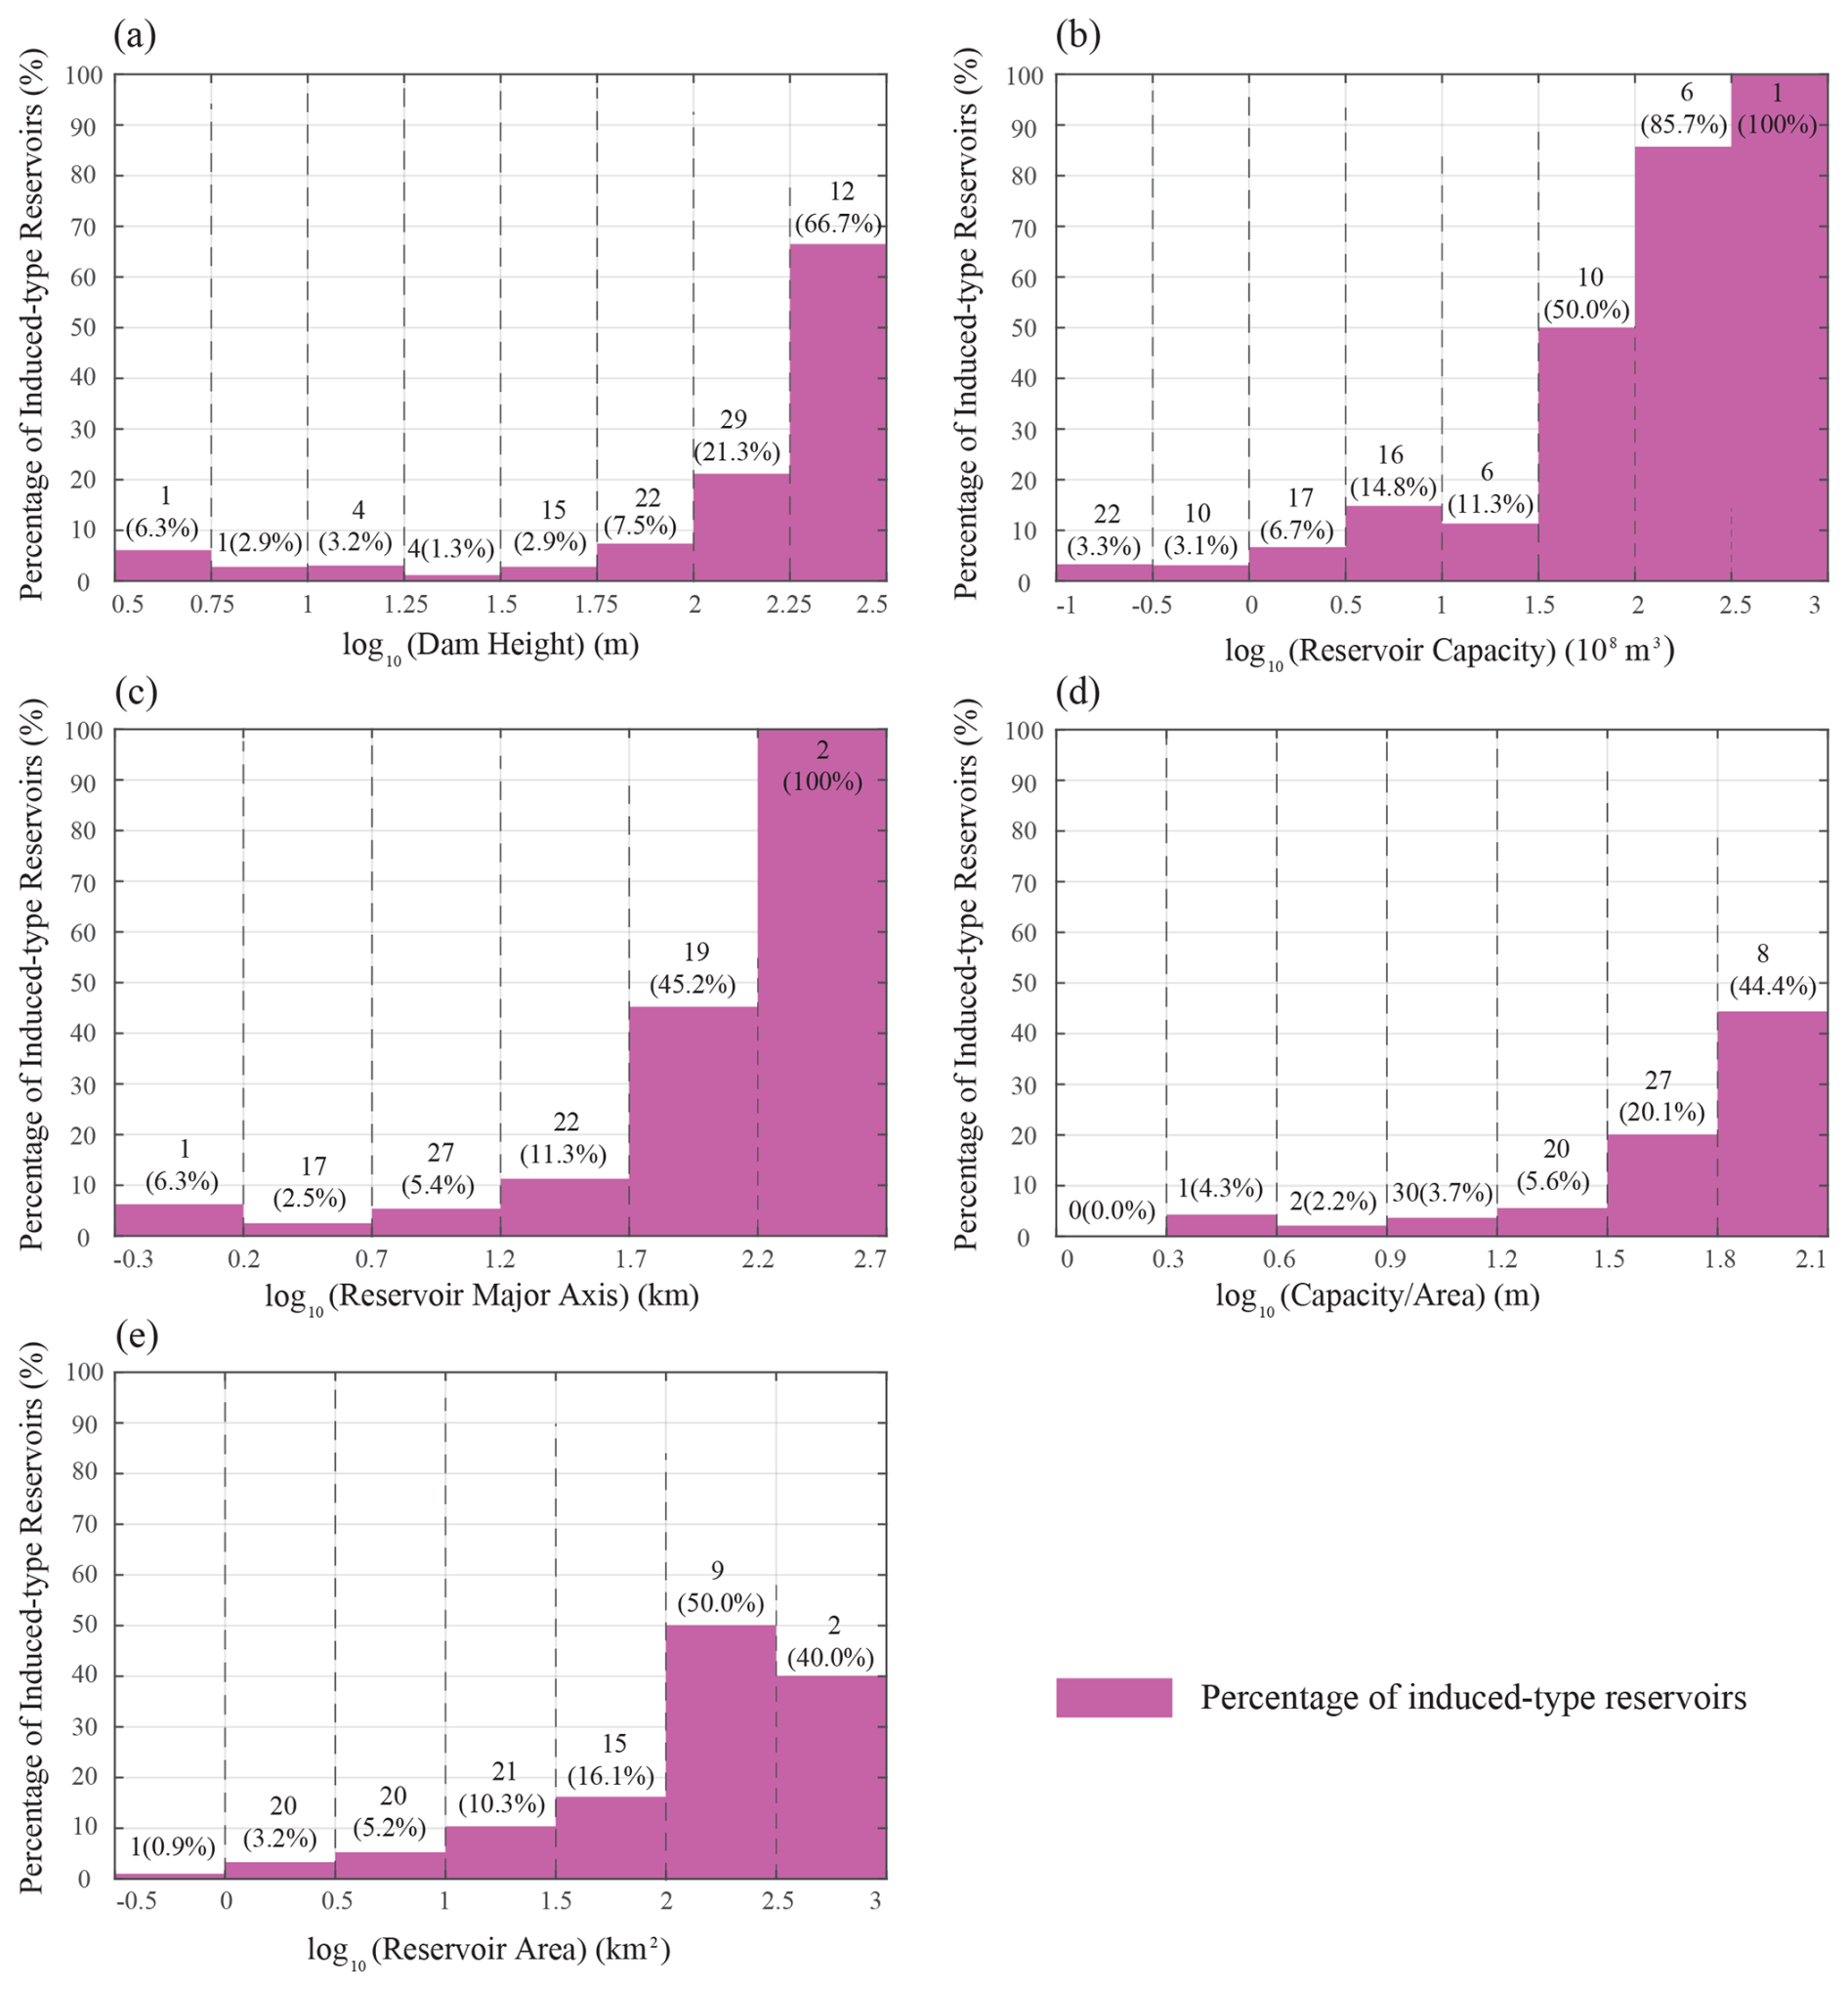
Figure 7Proportion characteristics of induced-type reservoirs under the influence of single factors. (a) Proportion across different bins of dam height (m). (b) Proportion across different bins of reservoir capacity (108 m3). (c) Proportion across different bins of reservoir major axis length (km). (d) Proportion across different bins of mean water depth (Capacity/Area, m). (e) Proportion across different bins of reservoir surface area (km2). In each subplot, the bars represent the percentage of induced-type reservoirs within the respective bin. Bars start from the zero line, so the y-axis value read at the top of a bar is the induced-type percentage itself; the non-induced complement is not plotted, and within each bin the two percentages sum to 100 %. Numbers above the bars give the number of induced-type reservoirs in each bin.
Furthermore, to examine the independence or intercorrelation among the attribute parameters, we calculated the Pearson correlation coefficient matrix (Fig. 8) and the Spearman correlation coefficient matrix (Fig. 9) for all eight parameters. The results show that the five static reservoir attribute parameters are relatively highly correlated among themselves. The pairwise Pearson correlation coefficients (r) range from 0.39 to 0.95, and the Spearman correlation coefficients (ρ) range from 0.59 to 0.95. All are positive correlations and statistically significant at the P<0.01 level. This reflects the statistical redundancy among geometric parameters in hydropower project design and highlights the need to focus on parameter independence when used in seismic hazard analysis. The three dynamic reservoir attribute parameters show relatively weaker correlations among themselves. The pairwise Pearson correlation coefficients (r) range from 0.23 to 0.38, and the Spearman correlation coefficients (ρ) range from 0.22 to 0.33, also all positive. Notably, the correlations between static and dynamic attribute parameters are all negative. This implies that larger reservoir dimensions tend to be associated with the Mmax event occurring closer to the reservoir shoreline (smaller Mmax distance) and within a shorter time lag after initial impoundment, and the peak seismicity rate also tends to be reached sooner after impoundment (smaller peak lag).
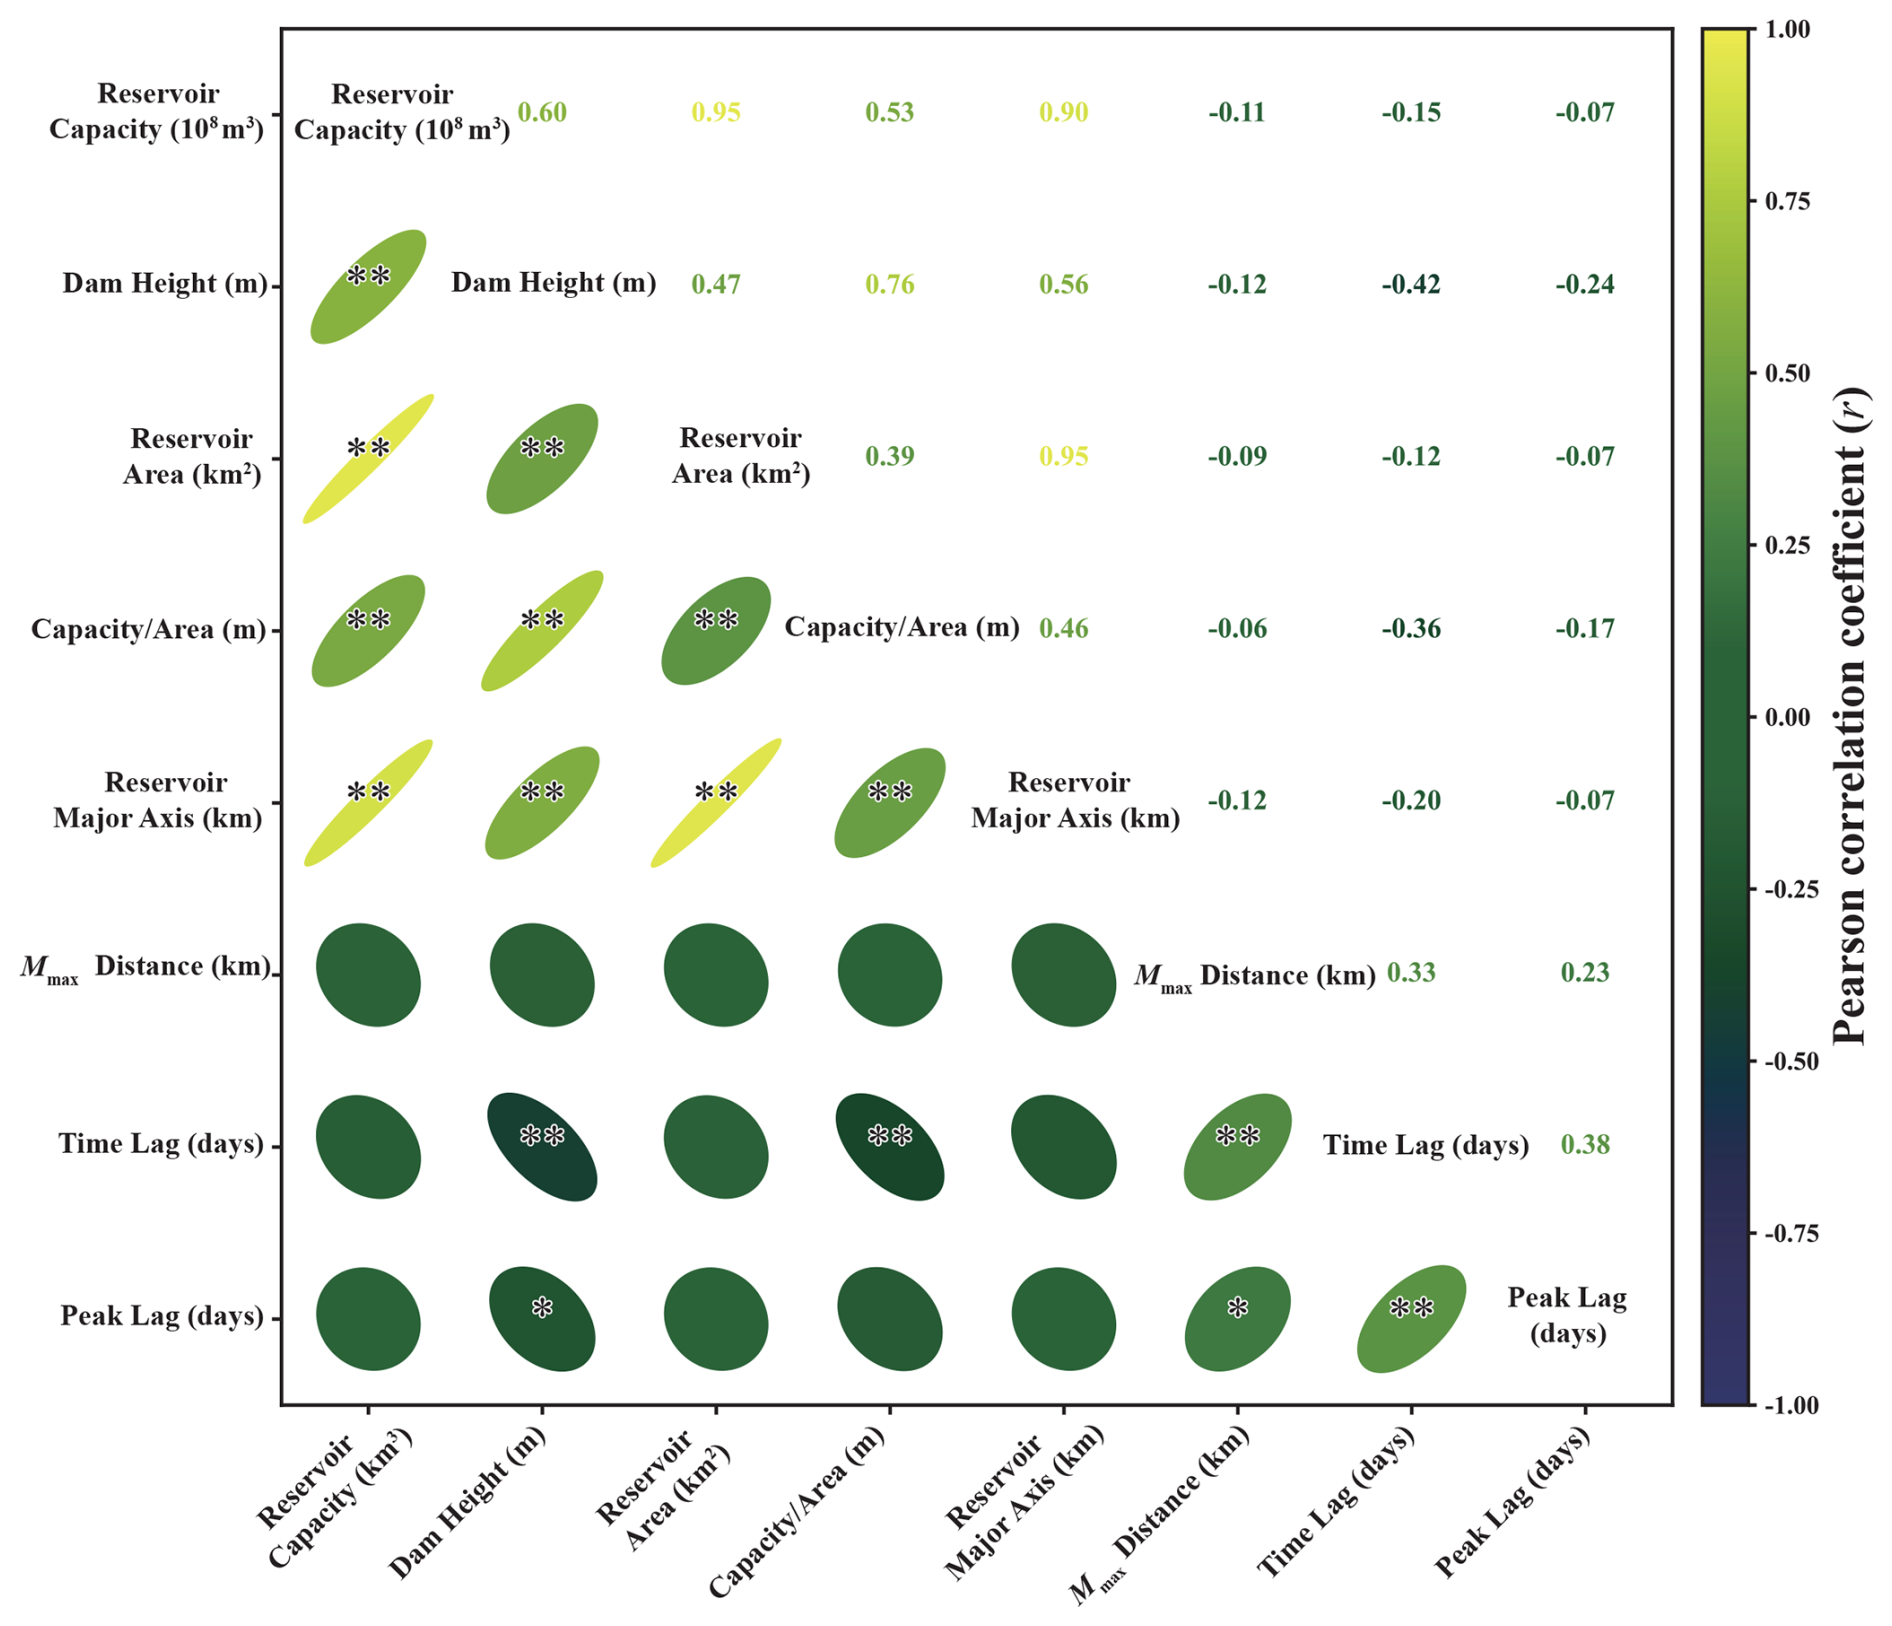
Figure 8Pearson correlation matrix among inducing factors. The lower triangle of the matrix visualizes the correlation coefficients using ellipses: flatter ellipses indicate stronger correlations; a 45° tilt indicates a positive correlation, and a −45° tilt indicates a negative correlation; asterisks indicate the statistical significance level (, ). The upper triangle displays the Pearson correlation coefficient (r) numerically, with colors transitioning from blue (strong negative correlation) through green (weak correlation) to yellow (strong positive correlation). The inducing factors are: Reservoir capacity (108 m3), dam height (m), reservoir area (km2), Capacity/Area (m), reservoir major axis (km), Mmax distance (km), time lag (days), peak lag (days).
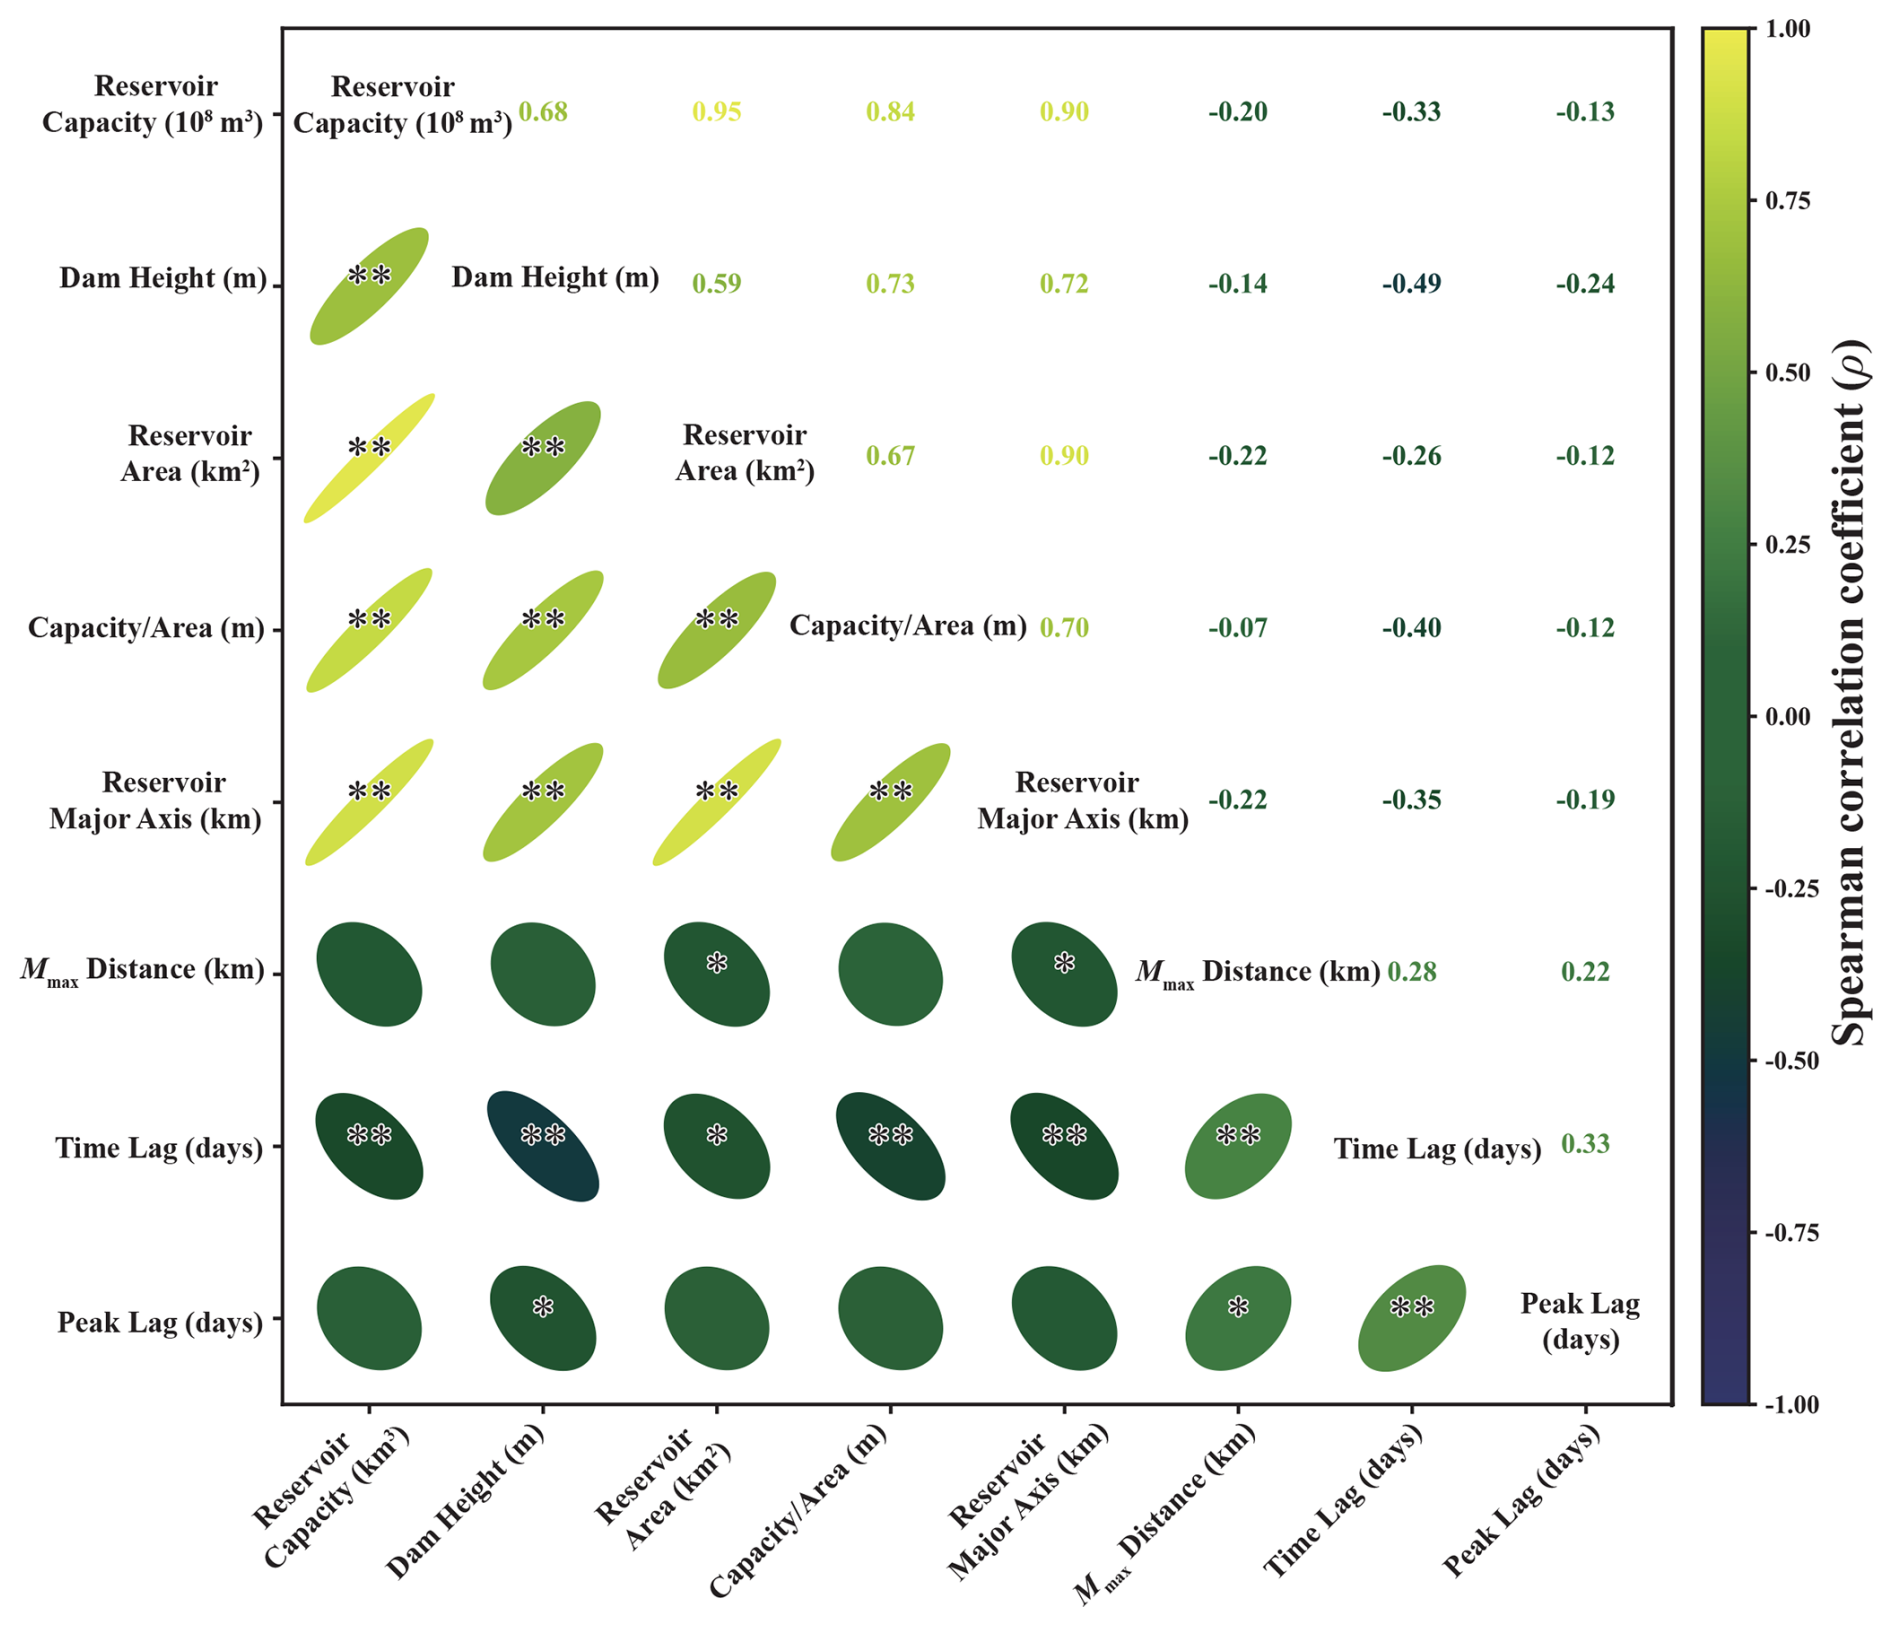
Figure 9Spearman correlation matrix among inducing factors. In the lower triangle of the matrix, ellipses visualize the rank correlation coefficients: flatter ellipses indicate stronger correlations; a 45° tilt indicates a positive correlation, and a −45° tilt indicates a negative correlation; asterisks indicate the statistical significance level (, ). The upper triangle displays the Spearman correlation coefficient (ρ) numerically, with colors transitioning from blue (strong negative correlation) through green (weak correlation) to yellow (strong positive correlation). The inducing factors are the same as in Fig. 8.
This study finds that induced-type reservoirs in China exhibit a high degree of spatial selectivity, with the vast majority concentrated in the strong tectonic activity zone along the eastern margin of the Tibetan Plateau, showing clear spatial consistency with active faults since the Late Pleistocene and historical moderate-to-strong (M≥4.0) seismicity. This finding resonates with conclusions from several regional systematic studies worldwide, collectively highlighting the critical controlling role of the regional tectonic background on the occurrence of RIS. In Canada, RIS is concentrated within the relatively stable Canadian Shield, and its limited triggering range (<5 km) is attributed to the reactivation of fragile faults associated with paleo-rifts under reservoir water infiltration (Lamontagne et al., 2018). In France, RIS preferentially occurs in active tectonic zones (e.g., Alps, Pyrenees), and its spatial influence range can be effectively explained using the reservoir major axis (Deng et al., 2010; Grasso et al., 2018). Studies in Brazil also indicate that the probability of RIS is twice as high in areas of high natural seismicity compared to aseismic regions, further supporting the view that a critically stressed crust is an important prerequisite for RIS occurrence (Barros et al., 2018). The high concentration of RIS along the eastern margin of the Tibetan Plateau revealed in this study reinforces the global understanding that “high tectonic stress accumulation and developed fault systems are prerequisite geological conditions for RIS occurrence” (e.g., Barros et al., 2018; Grasso et al., 2018; Lamontagne et al., 2018). Compared to the Canadian and French cases, RIS in China exhibits a broader spatial influence range (95 % of events within 24.8 km, 99 % within 38.2 km of the shoreline). This difference may stem from the more complex intraplate tectonic setting in China, characterized by intense crustal deformation and widely developed deep-seated strike-slip faults. These pre-existing fault networks provide preferred pathways for fluid migration. Although systematic quantitative comparisons of fault permeability between China and other regions remain scarce, the observed long-distance diffusion of pore pressure (up to 30–40 km) indicates that the hydraulic properties of these active faults meet or exceed the threshold of seismogenic permeability (Talwani et al., 2007; Miao et al., 2025), facilitating far-reaching pore pressure perturbations. Conventional understanding suggests that the occurrence mechanisms of RIS are closely related to the regional tectonic setting, and their spatial distribution contains key information about the triggering mechanisms. Understanding the spatial distribution patterns of induced-type reservoirs and their relationship with geological structures and regional seismicity is fundamental for revealing RIS triggering mechanisms and assessing regional RIS hazard. Furthermore, the observed RIS influence range far exceeds the 10 km specified in the current Chinese national standard (GB/T 21075-2007), strongly suggesting that this parameter should be revised in future risk assessments to prevent potential spatial underestimation of risk.
The sequence parameter analysis in this study provides statistical evidence for distinguishing RIS from natural tectonic earthquakes. We found that Chinese RIS sequences exhibit significantly higher b-values and lower α-values. A high b-value typically indicates lower effective stress in the source region or more fractured media, which aligns well with the physical mechanism of pore pressure diffusion reducing the effective normal stress on faults, thereby activating a large number of small-scale faults that are in a critical state (Talwani, 1997; Rajendran and Talwani, 1992). A low α-value suggests a weaker ability of small-magnitude events to trigger secondary sequences, revealing a fundamental difference in the energy release pattern between the RIS triggering process and natural mainshock-aftershock sequences. These differences may reveal the fundamental distinctions between the triggering mechanism (dominated by pore pressure diffusion) and evolution process (rapid decay, weaker triggering ability of large earthquakes) of RIS compared to natural earthquakes. These characteristics are consistent with findings from studies of the Xiluodu-Xiangjiaba reservoirs on the lower Jinsha River in China (Miao et al., 2025) and are inherently linked to the observation in French RIS sequences of a large difference between the magnitude of the second-largest aftershock and the mainshock (Grasso et al., 2018). However, studies on a few cases in Brazil found no significant difference between the b-value of RIS sequences and the local natural earthquake b-value (Barros et al., 2018), which differs from the traditional view that RIS has higher b-values (Gupta et al., 1972). Such regional differences suggest that the sequence characteristics of RIS may be influenced by local geological conditions, rock mechanical properties, and subtle differences in triggering mechanisms, necessitating consideration of regional applicability when using statistical parameters for discrimination. Furthermore, the spatial evolution analysis of the b-value in this study statistically validates an effective boundary for reservoir water penetration at 30–40 km. This not only supports the physical mechanism of RIS but also provides a referential spatial constraint for defining monitoring and assessment ranges in risk evaluation.
Regarding the triggering mechanism, the spatiotemporal evolution characteristics of RIS in China are most consistent with pore pressure diffusion as the primary process, though elastic loading may contribute in the near field. The peak in seismic activity 1–2 years after impoundment, and the significant exponential decay of the occurrence rate with distance from the reservoir shoreline (Mmax distance), are typical manifestations of the pore pressure diffusion process (Talwani, 1997; Cheng et al., 2012; Grasso et al., 2018). This characteristic highly aligns with theoretical models of fault activation by fluid infiltration and diffusion (Talwani, 1997), consistent with pore pressure diffusion as a contributing mechanism. This is because the pore pressure increase caused by reservoir impoundment diffuses through pre-existing fractures, faults, and pores in the rock mass. The combined effect of the diffusion front and the nonlinear dependence of triggering probability on pressure changes – where small pore pressure increments below a critical threshold may produce negligible triggering, but the probability rises rapidly once the threshold is approached (Talwani, 1997) – typically results in a exponential decay of the probability or occurrence rate of triggered seismicity with distance.
This is very similar to the case of the Song Tranh 2 reservoir in Vietnam, where seismicity was triggered shortly after impoundment (rapid response) but the increase persisted after water level drop due to the delayed effect of pore pressure diffusion, clearly identified as a typical case of “rapid and delayed triggering” (Gahalaut et al., 2016). Similarly, in the cascade reservoirs on the lower Jinsha River in China, detailed 3D finite element simulations show the combined action of “elastic loading and pore pressure diffusion” dual mechanisms, with pore pressure diffusion dominating the contribution to Coulomb stress changes (Miao et al., 2025). In terms of temporal response type, different regions globally show some variation: RIS in France is predominantly rapid response (Type I), with 62 % of events occurring within 2 years of impoundment (Grasso et al., 2018); whereas RIS in Canada and Brazil more often exhibits delayed response characteristics (Lamontagne et al., 2018; Barros et al., 2018). The observed peak 1–2 years after initial impoundment in Chinese RIS is similar in timescale to the rapid response mode in France, but the decay after the peak may be slower due to the higher regional tectonic stress background and more active faulting. This delayed response and gradual increase are typical manifestations of the time required for pore pressure diffusion. Reservoir water infiltrates downward and outward through pores, fractures, and pre-existing fault networks in the rock, causing pore pressure perturbations to propagate at a rate controlled by the hydraulic diffusivity. Significant increase in seismicity occurs only when the pore pressure front reaches and sufficiently increases the effective pore pressure in deep potential fault zones to meet the critical failure condition. The decay after the peak reflects stress release from the most easily triggered fault ruptures in areas reached early by the pressure front. As the diffusion distance increases, the pressure perturbation gradient decreases, and the efficiency of infiltration paths reduces, making it more difficult to trigger new earthquakes. Additionally, for special scenarios like cascade reservoirs, the superposition effect of stress perturbations caused by the impoundment and operation of adjacent reservoirs can significantly elevate the peak pore pressure, far exceeding the perturbation amplitude of a single reservoir (Zhang et al., 2021), increasing the complexity of RIS risk assessment. These comparisons indicate that although pore pressure diffusion is a common thread in many RIS cases, its specific temporal manifestation (rapid or delayed) and spatial extent are modulated by the combined effects of regional fault permeability, hydraulic diffusivity, reservoir operation patterns, and the initial tectonic stress level.
A principal limitation of this study is the first-order assumption of uniform spatiotemporal behavior across China's diverse tectonic settings. The W-score and the derived engineering thresholds are based on ensemble averages over 1435 reservoirs spanning the Tibetan Plateau margin, the South China Block, and the North China Craton, among other provinces with vastly different crustal structures, stress states, and permeability distributions. Consequently, the model may underestimate RIS potential in high-permeability, extensional regimes where pore-pressure diffusion is rapid, or overestimate it in stable cratonic interiors. Future work should develop region-specific variants of the W-score framework by partitioning the dataset according to tectonic province, reservoir volume, or local geological setting.
The correlation analysis in this study leads to an enlightening conclusion for the paradigm of RIS risk assessment: although a reservoir capacity greater than 3.2 × 10⁸ m3 or a reservoir major axis exceeding 15.9 km can serve as practical thresholds for preliminary risk screening during the planning stage, all static or dynamic reservoir attribute parameters show only weak or no correlation with the maximum magnitude (Mmax). This finding is highly consistent with observations worldwide (Klose, 2013). The physical mechanism underlying this is that Mmax is primarily controlled by the pre-existing stress state and rupture scale of local faults (Talwani, 1997), rather than by the properties of the reservoir itself. The static reservoir parameters mainly modulate the timing of earthquake triggering through the process of pore pressure diffusion. For example, the study in Brazil explicitly states that no clear trend is observed between the maximum magnitude and dam height, reservoir capacity, or reservoir area (Barros et al., 2018), and Gupta (2002) compilation of 117 global RIS cases also supports this general rule. This statistically confirms that Mmax is primarily controlled by inherent geological factors such as the size of local faults, their pre-existing stress state, and rock strength (Talwani, 1997), while static or dynamic reservoir parameters mainly influence the probability and timing of earthquake triggering by modulating the pore pressure diffusion process, rather than directly controlling the final rupture scale. Consequently, traditional empirical models that over-rely on static reservoir parameters for predicting Mmax have clear limitations. Based on this, the future framework for RIS risk assessment should gradually shift beyond static empirical models towards models that integrate multi-source information and physical processes. The W-score model developed in this study, which couples the observed exponential decay of RIS with Mmax distance and its time lag since initial impoundment, provides a new quantitative tool for the probabilistic identification of RIS events. This direction aligns with the probabilistic identification framework combining reservoir length, volume, and tectonic background proposed earlier by Grasso et al. (2018), and the “pore pressure-fault activity” coupling indicator suggested by Miao et al. (2025) for cascade reservoirs, representing a common trend in development. For engineering practice in China, we recommend significantly expanding the monitoring and assessment range from the current 10 km to the 30–40 km permeability boundary identified in this study within the current standards. A dual-threshold screening process based on tectonic activity and reservoir geometric parameters (e.g., reservoir capacity or reservoir major axis) should be introduced during the planning stage of reservoir construction. In the long term, it is essential to develop coupled multi-physics models that integrate geological structure, in-situ stress field, fault permeability, and hydrogeological conditions to achieve more accurate risk prediction and management.
Addressing the insufficient systematic understanding of Reservoir-Induced Seismicity (RIS) patterns in China, this study integrated a high-resolution national reservoir dataset (CRD) with a unified earthquake catalog spanning over fifty years to establish the first national-scale screening sample covering 1435 large/medium-sized reservoirs, from which 88 induced-type reservoirs were identified. Through systematic analysis of their spatial distribution, spatiotemporal evolution, sequence parameters, and inducing factors, this study reveals a series of fundamental characteristics and physical mechanisms of RIS in China and offers new insights for risk assessment applications. The main conclusions are as follows:
-
RIS spatial distribution is dominated by the regional tectonic background, exhibiting significant selectivity. Induced-type reservoirs are not uniformly distributed but are highly concentrated in strong tectonic activity zones such as the Sichuan-Yunnan rhombic block along the eastern margin of the Tibetan Plateau. Their spatial pattern shows a high degree of coupling with Late Pleistocene active faults and historical moderate-to-strong (M≥4.0) seismicity. This clearly indicates that high tectonic stress accumulation and developed fault systems are prerequisite geological conditions for RIS occurrence. In contrast, the tectonically stable eastern region, despite having a high density of reservoirs, shows a significantly lower probability of induction. This pattern provides a reference basis for the macro-siting of major hydropower projects.
-
RIS spatiotemporal evolution is most consistent with pore pressure diffusion as the primary process, with potential near-field contributions from elastic loading. RIS events exhibit a significant exponential decay with increasing distance from the reservoir shoreline (Mmax distance), with 95 % and 99 % of events concentrated within 24.8 and 38.2 km, respectively. Temporally, seismic activity peaks 1–2 years after impoundment, showing a typical delayed response. The W-score model established based on these characteristics provides a quantitative screening framework for the spatiotemporal coupling effect, providing a new tool for the probabilistic identification of RIS events. The effective boundary of reservoir water penetration determined in this study (30–40 km) far exceeds the 10 km zone suggested in the current national standard (GB/T 21075-2007). It is recommended to revise this parameter in future risk assessments to prevent potential underestimation of the spatial risk.
-
RIS sequence parameters possess statistical fingerprints distinct from natural earthquakes, revealing a unique triggering and evolution physical process. Compared to natural earthquake sequences, RIS sequences exhibit significantly lower α-values (weaker ability to trigger secondary events) and higher b-values. This reveals that RIS primarily activates critically stressed faults through pore pressure diffusion, leading to unique sequence behavior characterized by a high proportion of small earthquakes and a weaker ability of large earthquakes to trigger secondary sequences. Furthermore, a significant difference emerges between the b-value of RIS sequences and the b-value of background seismicity at a distance of 30–40 km from the shoreline, statistically validating this distance as the critical physical boundary for reservoir water penetration.
-
Correlation analysis reveals the fundamental limitations of using static or dynamic reservoir attribute parameters to predict the maximum magnitude, providing crucial evidence for risk assessment. The study finds that a reservoir capacity exceeding 3.2 × 10⁸ m3 or a reservoir major axis exceeding 15.9 km can serve as practical thresholds for preliminary risk screening during the planning stage. However, in-depth correlation matrix analysis shows that both static reservoir attributes (e.g., reservoir capacity, dam height, reservoir area, Capacity/Area, reservoir major axis) and dynamic response parameters (Mmax distance, time lag, peak lag) have only weak correlations with the RIS maximum magnitude (Mmax). This finding statistically confirms that Mmax is primarily controlled by geological factors such as local fault development scale, pre-existing stress state, and rock strength, while reservoir parameters mainly influence the probability of earthquake triggering by modulating the pore pressure diffusion process. Therefore, future risk assessment should gradually shift from experience-based models reliant on reservoir scale towards physics-based mechanistic models that integrate geological structure, in-situ stress field, and hydrogeological conditions.
The seismic data used in this study were obtained from the National Unified Official Earthquake Catalog provided by the China Earthquake Networks Center (CENC access 10.5.160.18/console/exit.action). This catalog contains earthquake parameters for events across China from 1 January 1970 to 27 March 2025. This earthquake catalog is proprietary and cannot be released to the public. The spatial distribution and fundamental attributes of reservoirs were primarily sourced from the published China Reservoir Dataset (CRD, Song et al., 2022). Critical reservoir parameters, such as the initial impoundment time and dam height, were compiled and integrated by the authors from publicly available sources, including the Encyclopedia of Chinese Rivers and Lakes, local gazetteers, government reports, and news archives. This integrated reservoir attributes dataset is proprietary to this study and may be available from the corresponding author upon reasonable request. The computer codes used for calculating sequence parameters (α-value, b-value, and p-value) and the W-score model in this study are available from the corresponding author upon reasonable request.
The supplement related to this article is available online at https://doi.org/10.5194/nhess-26-5711-2026-supplement.
CJ and JZ conceived and designed the study. JZ, CJ, and YZ performed the data analysis and developed the W-score model. FY and HZ compiled and curated the reservoir and earthquake datasets. JB contributed to the tectonic analysis and active fault mapping. YZ assisted with figure preparation and manuscript editing. CJ wrote the manuscript with contributions from all co-authors. All authors discussed the results and commented on the manuscript.
The contact author has declared that none of the authors has any competing interests.
Publisher's note: Copernicus Publications remains neutral with regard to jurisdictional claims made in the text, published maps, institutional affiliations, or any other geographical representation in this paper. The authors bear the ultimate responsibility for providing appropriate place names. Views expressed in the text are those of the authors and do not necessarily reflect the views of the publisher.
Data support was provided by the National Earth System Science Data Center, National Science & Technology Infrastructure of China (http://www.geodata.cn, last access: 7 October 2025). We are grateful to Senior Engineer Xiaojing Ma of the Guangdong Earthquake Agency and Dr. Xinxin Yin of the Gansu Earthquake Agency for their valuable assistance in providing reservoir attribute information. We also extend our sincere appreciation for their support. We sincerely thank Dr. Abhineet Gupta and Dr. Jürgen Mey for their thorough and constructive review comments, which significantly improved the clarity, structure, and rigor of this manuscript.
This research has been supported by the Institute of Geophysics, China Earthquake Administration (grant no. DQJB24Z04).
This paper was edited by Veronica Pazzi and reviewed by Abhineet Gupta and Jürgen Mey.
Barros, L. V., Assumpção, M., Ribotta, L. C., Ferreira, V. M., De Carvalho, J. M., Bowen, B. M. D., and Albuquerque, D. F.: Reservoir-Triggered Seismicity in Brazil: Statistical Characteristics in a Midplate Environment, B. Seismol. Soc. Am., 108, 3046–3061, https://doi.org/10.1785/0120170364, 2018.
Bi, J. M. and Jiang, C. S.: Distribution characteristics of earthquake sequence parameters in North China, Chin. J. Geophys., 62, 4300–4312, https://doi.org/10.6038/cjg2019M0453, 2019 (in Chinese).
Bi, J. M., Jiang, C. S., Lai, G. J., and Song, C.: Effectiveness evaluation and constraints of early aftershock probability forecasting for strong earthquakes in continental China, Chin. J. Geophys., 65, 2532–2545, https://doi.org/10.6038/cjg2022P0411, 2022 (in Chinese).
Chang, Y., Wang, R., Han, P., Wang, J., Miao, M., Zeng, Z., Wu, W., Jiang, C., Meng, L., Shi, H., and Hattori, K.: b-Value Evaluation and Applications to Seismic Hazard Assessment, Entropy, 27, 958, https://doi.org/10.3390/e27090958, 2025.
Cheng, H., Zhang, H., Zhu, B., Sun, Y., Zheng, L., Yang, S., and Shi, Y.: Finite element investigation of the poroelastic effect on the Xinfengjiang Reservoir-triggered earthquake, Sci. China Earth Sci., 55, 1942–1952, https://doi.org/10.1007/s11430-012-4470-8, 2012.
Dai, G. H., Miao, C., and Zhai, L.: Unified earthquake cataloging of China seismographic network, Earthquake Research in China, 35, 192–203, 2019 (in Chinese).
Deng, K., Zhou, S., Wang, R., Robinson, R., Zhao, C., and Cheng, W.: Evidence that the 2008 Mw 7.9 Wenchuan Earthquake Could Not Have Been Induced by the Zipingpu Reservoir, B. Seismol. Soc. Am., 100, 2805–2814, https://doi.org/10.1785/0120090222, 2010.
Dong, S., Li, L., Zhao, L., Shen, X., Wang, W., Huang, H., Peng, B., Xu, X., and Gao, R.: Seismic Evidence for Fluid-Driven Pore Pressure Increase and Its Links With Induced Seismicity in the Xinfengjiang Reservoir, South China, J. Geophys. Res.-Solid Earth, 127, e2021JB023548, https://doi.org/10.1029/2021JB023548, 2022.
Gahalaut, K., Tuan, T. A., and Purnachandra Rao, N.: Rapid and Delayed Earthquake Triggering by the Song Tranh 2 Reservoir, Vietnam, B. Seismol. Soc. Am., 106, 2389–2394, https://doi.org/10.1785/0120160106, 2016.
GB/T 21075-2007: Reservoir-induced earthquake hazard assessment, Beijing: Standards Press of China, https://std.samr.gov.cn/gb/search/gbDetailed?id=71F772D768EAD3A7E05397BE0A0AB82A (last access: 7 October 2025), 2007.
Ghofrani, H. and Atkinson, G. M.: Activation Rate of Seismicity for Hydraulic Fracture Wells in the Western Canada Sedimentary Basin, B. Seismol. Soc. Am., 110, 2252–2271, https://doi.org/10.1785/0120200002, 2020.
Grasso, J. -R., Karimov, A., Amorese, D., Sue, C., and Voisin, C.: Patterns of Reservoir-Triggered Seismicity in a Low-Seismicity Region of France, B. Seismol. Soc. Am., 108, 2967–2982, https://doi.org/10.1785/0120180172, 2018.
Guo, L. J.: A study on the statistical features of earthquake sequence parameters of the North-South Seismic Belt (Master's thesis), Institute of Geophysics, China Earthquake Administration, 2015.
Gupta, H. K.: A review of recent studies of triggered earthquakes by artificial water reservoirs with special emphasis on earthquakes in Koyna, India, Earth-Sci. Rev., 58, 279–310, https://doi.org/10.1016/S0012-8252(02)00063-6, 2002.
Gupta, H. K., Rastogi, B. K., and Narain, H.: Common features of the reservoir-associated seismic activities, B. Seismol. Soc. Am., 62, 481–492, https://doi.org/10.1785/BSSA0620020481, 1972.
Jiang, C. S., Zhuang, J. C., Long, F., Han, L. B., and Guo, L. J.: Statistical analysis of ETAS parameters in the early stage of the 2013 Lushan MS7.0 earthquake sequence, Acta Seismol. Sinica, 35, 661–669, https://doi.org/10.3969/j.issn.0253-3782.2013.05.005, 2013a (in Chinese).
Jiang, C. S., Wu, Z. L., Han, L. B., and Guo, L. J.: Effect of cutoff magnitude Mc of earthquake catalogues on the early estimation of earthquake sequence parameters with implication for the probabilistic forecast of aftershocks: The 2013 Minxian-Zhangxian, Gansu, MS6.6 earthquake sequence, Chin. J. Geophys., 56, 4048–4057, https://doi.org/10.6038/cjg20131210, 2013b (in Chinese).
Jiang, C. S., Han, L. B., and Guo, L. J.: Parameter characteristics in the early period of three earthquake sequences in the Yutian, Xin Jiang since 2008, Acta Seismol. Sinica, 36, 165–174, https://doi.org/10.3969/j.issn.0253-3782.2014.02.002, 2014 (in Chinese).
Jiang, C. S., Wu, Z. L., Yin, F. L., Guo, L. J., Bi, J. M., and Wang, Y. W.: Stability of early-estimation sequence parameters for continuous forecast of the aftershock rate: A case study of the 2014 Ludian, Yunnan MS6.5 earthquake, Chin. J. Geophys., 58, 4163–4173, https://doi.org/10.6038/cjg20151123, 2015 (in Chinese).
Jiang, C., Jiang, C. S., Yin, F. L., Zhang, Y. B., Bi, J. M., Long, F., Si, Z. Y., and Yin, X. X.: A new method for calculating b-value of time sequence based on data-driven (TbDD): A case study of the 2021 Yangbi MS6.4 earthquake sequence in Yunnan, Chin. J. Geophys., 64, 3126–3134, https://doi.org/10.6038/cjg2021P0385, 2021 (in Chinese).
Julian, B. R. and Foulger, G. R.: Time-dependent seismic tomography: Time-dependent seismic tomography, Geophys. J. Int., 182, 1327–1338, https://doi.org/10.1111/j.1365-246X.2010.04668.x, 2010.
Klose, C. D.: Mechanical and statistical evidence of the causality of human-made mass shifts on the Earth's upper crust and the occurrence of earthquakes, J. Seismol., 17, 109–135, https://doi.org/10.1007/s10950-012-9321-8, 2013.
Lamontagne, M., Rogers, G., Cassidy, J., Tournier, J., and Lawrence, M. S.: A Review of Reservoir Monitoring and Reservoir-Triggered Seismicity in Canada, B. Seismol. Soc. Am., 108, 3062–3079, https://doi.org/10.1785/0120180009, 2018.
Li, L. and Luo, G.: What causes the spatiotemporal patterns of seismicity in the Three Gorges Reservoir area, central China?, Earth Planet. Sci. Lett., 592, 117618, https://doi.org/10.1016/j.epsl.2022.117618, 2022.
Mesimeri, M., Karakostas, V., Papadimitriou, E., and Tsaklidis, G.: Characteristics of earthquake clusters: Application to western Corinth Gulf (Greece), Tectonophysics, 767, 228160, https://doi.org/10.1016/j.tecto.2019.228160, 2019.
Miao, M., Han, P., Yao, M., Wang, R., Zhao, C., Zhao, C., Lu, R., Du, Z., and Chen, X.: Spatial-Temporal Pore Pressure and Stress Evolution Associated With the Impoundment of Two Contiguous Reservoirs in Jinsha River, China and Regional Seismicity, J. Geophys. Res.-Solid Earth, 130, e2025JB031220, https://doi.org/10.1029/2025JB031220, 2025.
Mignan, A., Jiang, C., Zechar, J. D., Wiemer, S., Wu, Z., and Huang, Z.: Completeness of the Mainland China Earthquake Catalog and Implications for the Setup of the China Earthquake Forecast Testing Center, B. Seismol. Soc. Am., 103, 845–859, https://doi.org/10.1785/0120120052, 2013.
Ogata, Y.: Statistical Models for Earthquake Occurrences and Residual Analysis for Point Processes, J. Am. Stat. Assoc., 83, 9–27, https://doi.org/10.1080/01621459.1988.10478560, 1988.
Ogata, Y.: Increased probability of large earthquakes near aftershock regions with relative quiescence, J. Geophys. Res., 106, 8729–8744, https://doi.org/10.1029/2000JB900400, 2001.
Ogata, Y. and Katsura, K.: Analysis of temporal and spatial heterogeneity of magnitude frequency distribution inferred from earthquake catalogues, Geophys. J. Int., 113, 727–738, https://doi.org/10.1111/j.1365-246X.1993.tb04663.x, 1993.
Pearson, K.: VII. Note on regression and inheritance in the case of two parents, P. Roy. Soc. London, 58, 240–242, https://doi.org/10.1098/rspl.1895.0041, 1895.
Rajendran, K. and Talwani, P.: The role of elastic, undrained, and drained responses in triggering earthquakes at Monticello Reservoir, South Carolina, B. Seismol. Soc. Am., 82, 1867–1888, https://doi.org/10.1785/BSSA0820041867, 1992.
Simpson, D. W., Leith, W. S., and Scholz, C. H.: Two types of reservoir-induced seismicity, B. Seismol. Soc. Am., 78, 2025–2040, https://doi.org/10.1785/BSSA0780062025, 1988.
Song, C., Fan, C., Zhu, J., Wang, J., Sheng, Y., Liu, K., Chen, T., Zhan, P., Luo, S., Yuan, C., and Ke, L.: A comprehensive geospatial database of nearly 100 000 reservoirs in China, Earth Syst. Sci. Data, 14, 4017–4034, https://doi.org/10.5194/essd-14-4017-2022, 2022.
Spearman, C.: The Proof and Measurement of Association between Two Things, The Am. J. Psychol., 15, 72, https://doi.org/10.2307/1412159, 1904.
Talwani, P.: On the Nature of Reservoir-induced Seismicity, Pure Appl. Geophys., 150, 473–492, https://doi.org/10.1007/s000240050089, 1997.
Talwani, P., Chen, L., and Gahalaut, K.: Seismogenic permeability, ks, J. Geophys. Res.-Solid Earth, 112, 2006JB004665, https://doi.org/10.1029/2006JB004665, 2007.
Trivedi, P. C.: Application of Omori's Decay Law to the 2001 Bhuj Aftershock Sequence for Kachchh Region of Western India, OJER, 04, 94–101, https://doi.org/10.4236/ojer.2015.43009, 2015.
Utsu, T.: Representation and Analysis of the Earthquake Size Distribution: A Historical Review and Some New Approaches, Pure Appl. Geophys., 155, 509–535, https://doi.org/10.1007/s000240050276, 1999.
Wang, J.-H.: On the correlation of observed Gutenberg-Richter's b value and Omori's p value for aftershocks, B. Seismol. Soc. Am., 84, 2008–2011, https://doi.org/10.1785/BSSA0840062008, 1994.
Wang, Y. W., Jiang, C. S., Liu, F., and Bi, J. M.: Assessment of earthquake monitoring capability and score of seismic station detection capability in China Seismic Network (2008-2015), Chin. J. Geophys., 60, 2767–2778, https://doi.org/10.6038/cjg20170722, 2017 (in Chinese).
Xu, X., Han, Z., Yang, X., Zhang, S., Yu, G., Zhou, B., Li, F., Ma, B., Chen, G., and Ran, Y.: Seismotectonic Map in China and its Adjacent Regions (1:4 000 000), Seismol. Press, https://doi.org/10.12031/activefault.china.250.2016.db, 2016 (in Chinese).
Xue, Y., Xie, M. Y., Liu, J., and Zhuang, J. C.: Study on foreshock sequences of the global great shallow-focus earthquakes with MW≥8.0, Seismol. Geol., 43, 1233–1249, 2021 (in Chinese).
Yin, F. and Jiang, C.: Enhanced b-value time-series calculation method using data-driven approach, Geophys. J. Int., 236, 78–87, https://doi.org/10.1093/gji/ggad419, 2024.
Zaliapin, I., Gabrielov, A., Keilis-Borok, V., and Wong, H.: Clustering Analysis of Seismicity and Aftershock Identification, Phys. Rev. Lett., 101, 018501, https://doi.org/10.1103/PhysRevLett.101.018501, 2008.
Zhang, M., Ge, S., Yang, Q., and Ma, X.: Impoundment-Associated Hydro-Mechanical Changes and Regional Seismicity Near the Xiluodu Reservoir, Southwestern China, J. Geophys. Res.-Solid Earth, 126, e2020JB021590, https://doi.org/10.1029/2020JB021590, 2021.
Zhuang, J., Ogata, Y., and Vere-Jones, D.: Stochastic Declustering of Space-Time Earthquake Occurrences, J. Am. Stat. Assoc., 97, 369–380, https://doi.org/10.1198/016214502760046925, 2002.