
the Creative Commons Attribution 4.0 License.
the Creative Commons Attribution 4.0 License.
 | 10 Nov 2026
21st-century strong wind and heavy precipitation hazards in the Asian monsoon region related to mesoscale convective systems: climatology, variability, and trends
Jie Feng
Jian Yang
Zhongdong Duan

Mesoscale convective systems (MCSs) occur frequently throughout the Asian monsoon region (AMR) and exhibit distinct spatial distribution patterns, often associated with extreme weather events, including heavy rainfall, hail and tornadoes. To assess the hazardous impacts of MCSs and enhance disaster warning and response strategies, this study develops a database of MCSs across the AMR study domain from 2001 to 2023 using half-hourly infrared brightness temperature data and further examines their relationships with weather hazards based on observational data. Results show that more than 50 % of total precipitation is associated with MCSs in most parts of the AMR study domain, providing further evidence for the important role of MCSs in regional precipitation. More than 70 % of heavy rainfall events (HREs) over land and 47 % of strong wind events (SWEs) in the Chinese mainland are associated with MCSs, indicating the relevance of MCSs to hazardous weather. Furthermore, over 70 % of hail and tornado occurrences in China co-occur with MCSs. Statistically significant increases in MCS activity are observed in eastern China, while statistically significant decreases are noted from western China to the Bay of Bengal. Notably, in eastern China and its adjacent seas (ECAS), the conditional probabilities of HREs and SWEs given MCS occurrence have been increasing at average annual rates of 2.77 % and 3.11 %, respectively. Given the increasing trends in MCS activity and the probability of hazard occurrence given MCS presence in eastern China, strengthening preventive measures against weather-related disasters in this region is imperative.
- Article
(14795 KB) - Full-text XML
-
Supplement
(25993 KB) - BibTeX
- EndNote


Cumulonimbus clouds that cluster and evolve into a cohesive system, with precipitation extending over a horizontal scale of hundreds of kilometers, are known as mesoscale convective systems (MCSs), associated with severe weather events like heavy rainfall, hail, and tornadoes (Coniglio et al., 2010; Houze, 2018; Hu et al., 2020; Schumacher and Rasmussen, 2020). MCSs play an essential role in regulating regional and global precipitation patterns (Durkee and Mote, 2010; Fritsch et al., 1986; Houze, 1990; Meng et al., 2021; Nesbitt et al., 2006). In most tropical regions and certain mid-latitude areas, MCS-related rainfall accounts for over 50 % of the annual total precipitation and exhibits strong seasonality (Chen et al., 2021; Feng et al., 2021). In most parts of China, particularly in low-altitude regions, MCSs are responsible for 40 %–50 % of the precipitation (Li et al., 2020), and nearly 50 % of intense hourly precipitation events in eastern China are associated with MCSs (He et al., 2016). According to statistics on meteorological disasters in China (Song, 2022), MCSs are responsible for over 22 % of direct economic losses and more than 17 % of agricultural crop losses resulting from weather-related hazards from 2005 to 2019.
Observations of MCSs typically rely on two primary approaches: satellite observations and radar observations (Feng et al., 2019, 2021; Smith et al., 2012). These methods combine wide-area monitoring with localized high-resolution observations. Satellite observations offer extensive coverage and indirectly reflect cloud-top height – and by extension, convective intensity – by measuring equivalent cloud-top temperature (Maddox, 1980; Vicente et al., 1998). Geostationary meteorological satellites equipped with instruments such as thermal infrared radiometers can capture the dynamic evolution of convective systems (Machado et al., 1998; Roca et al., 2017). Radar observations, on the other hand, provide higher temporal and spatial resolution (Valdés-Manzanilla, 2022). Doppler and dual-polarization radars provide detailed insights into the internal structure of convective systems – including precipitation intensity, wind fields, and hydrometeor types – making radar an indispensable tool for real-time monitoring of heavy rainfall and severe storms (Marshall et al., 1947; Weber and Wuertz, 1990). Nevertheless, radar coverage is limited in range and may be constrained in complex terrains such as mountainous regions (Feng et al., 2018). Considering the widespread distribution of MCSs from tropical to mid-latitude regions and the limitations of radar coverage, satellite data are more suitable for comprehensive meteorological analyses of MCSs over large regions. Feng et al. (2021) identified MCSs globally from 2000 to 2020 using brightness temperature (Tb) data and precipitation data, highlighting the significant role of MCSs in low-latitude precipitation, as well as their distinct seasonality and land-ocean differences. You and Deng (2023) identified MCSs in the United States using satellite data and examined their large-scale forcing patterns based on reanalysis data, revealing the influence of local dynamic and thermodynamic forcing on MCS evolution. Cheng et al. (2022) investigated variations in MCS precipitation across eight monsoon stages in eastern China using satellite data and a hybrid tracking algorithm. These studies collectively demonstrate the effectiveness of satellite data in reliably identifying MCSs across different regions, enabling comprehensive analyses of MCS climatology.
In recent years, the impact of global warming and climate change on the climatology of MCSs has received increasing attention. According to the Clausius-Clapeyron equation, for every 1 °C increase in global temperature, atmospheric water vapor rises by approximately 7 % (Trenberth et al., 2003), thereby elevating the likelihood of extreme precipitation events. Extensive reliable observational data indicate that in certain regions, MCSs have exhibited increasing frequency and intensity (Feng et al., 2016; Li et al., 2023; Taylor et al., 2017). Feng et al. (2016) analysed long-term observational data and proposed that MCS activity in the central United States has intensified under warming conditions. Similarly, based on precipitation data, Li et al. (2023) revealed increasing MCS precipitation along the East Asian rainband over the past two decades, while also showing decreasing trends over Taiwan and parts of the South China Sea coast, including the Pearl River Delta and northern Philippines. Nekkali and Osuri (2026) also found increasing MCS-related precipitation over western India in recent years, accompanied by a decrease over eastern India. Collectively, existing research highlights substantial increases in MCS-related precipitation across certain regions, potentially heightening the risk of flooding and other hydrometeorological hazards.
Current research on MCSs across the Asian monsoon region (AMR) has primarily focused on their climatology, related precipitation distributions, and interannual trends in MCS activity and precipitation. However, investigations into the relationship between MCSs and weather-related hazards within the AMR, as well as their temporal trends, remain relatively limited. To further investigate these issues, this study focuses on a selected domain (15–45° N, 70–125° E) within the broader AMR, which encompasses a major subtropical-to-midlatitude continental sector of the AMR and its adjacent seas. For clarity, this selected domain is hereafter referred to as the AMR study domain. The AMR study domain covers regions with distinct monsoon characteristics and MCS activity patterns, allowing the spatial differences and long-term changes in MCSs and MCS-related hazards to be examined across different regional settings. In this context, this study is guided by two main hypotheses. First, given the close association between MCS activity and the occurrence of weather-related hazards (Hu et al., 2020; Schumacher and Rasmussen, 2020), this study aims to quantify the strength of this statistical association within the study region and characterize its regional and seasonal differences. Second, considering that MCS activity and its statistical association with weather-related hazards may vary over time and exhibit statistically significant interannual trends under changing climate, this study further analyses the interannual variations and trends in MCS activity and MCS-associated hazards across the AMR study domain. It should be noted that, attributing the trend, if there is any detectable signal, to climate change is beyond the scope of this study. Specifically, globally merged IR Tb data are used to identify MCSs over the AMR study domain from 2001 to 2023. Radar reflectivity images covering Hong Kong and surrounding (HKS) regions are used to validate the MCS database established with Tb. Subsequently, the Integrated Multi-satellitE Retrievals for Global Precipitation Measurement (IMERG) Final Precipitation V07 data (Huffman et al., 2023) and observational data from surface meteorological stations are employed to statistically analyse the hazardous impacts of MCSs across the AMR study domain, as well as their interannual variations. This paper is organized as follows: Sect. 2 introduces the data and methods used in this study, along with the methods for developing and validating the MCS database; Sect. 3 presents an MCS database, and discusses the spatial distribution, hazardous impacts and interannual variations of MCSs and MCS-associated hazard across the AMR study domain; Sect. 4 presents conclusions.
2.1 Data
In this study, the NASA globally merged IR Tb data (Janowiak et al., 2017) are used to identify and track MCSs, establishing an MCS database of the AMR study domain (70–125° E, 15–45° N; the red box in Fig. 1a) from 2001 to 2023. The data provides half-hourly Tb data from 1998 to the present, with a spatial resolution of 4 km.
Radar reflectivity images from the Hong Kong Observatory (HKO) (Shi et al., 2017), covering the period from 2009 to 2015 and observed at an altitude of 2 km, are used to validate the MCS database established with Tb data in HKS. The observation area of radar is a circular region with a 500 km radius centred on HKO (the blue circle in Fig. 1a), with a time resolution of 6 min and a spatial resolution of approximately 1 km.
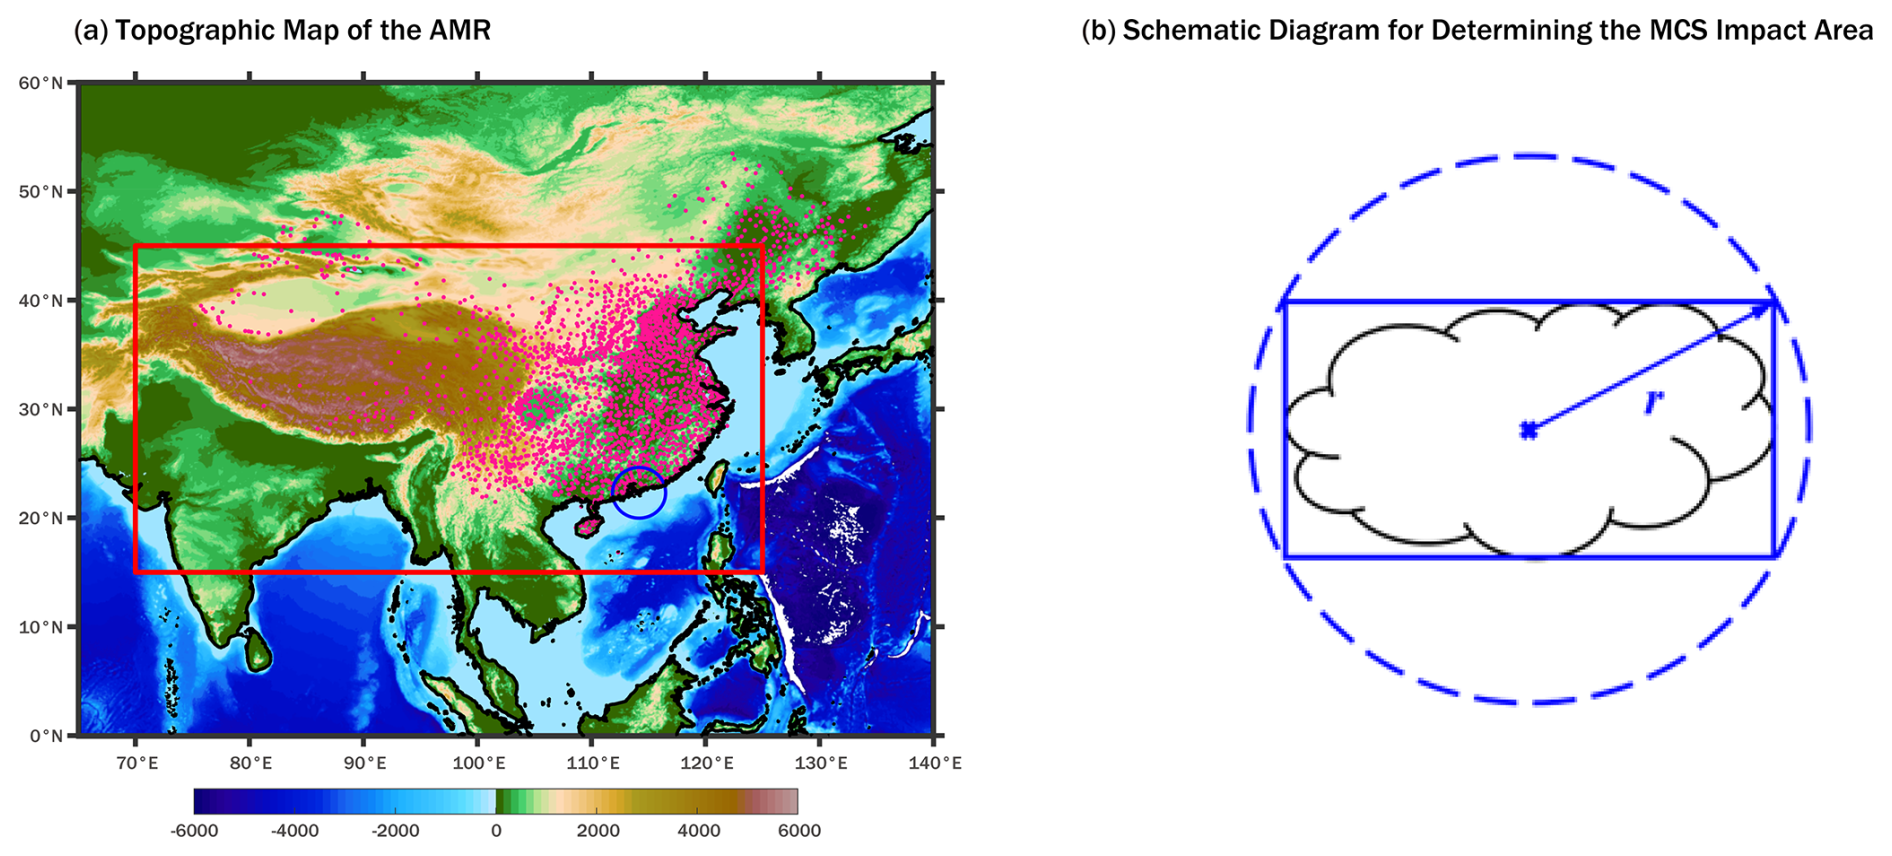
Figure 1Study region and schematic definition of the MCS impact area. (a) Topographic map of the AMR, with color shading indicating elevation (unit: m). The red box denotes the AMR study domain, the blue circle indicates the spatial coverage of the HKO radar data, and the pink dots mark the locations of surface meteorological observation stations in mainland China. (b) Schematic diagram for defining the MCS impact area. The solid black line represents the actual MCS extent, the solid blue line denotes the bounding rectangle of the MCS, and the dashed blue line represents the circumscribed circle of the bounding rectangle. The radius of this circle, denoted by r, is used to define the MCS impact area following Zhang et al. (2021).
To evaluate MCS-related severe convective weather events, several additional datasets are used. The IMERG Final Precipitation V07 data (Huffman et al., 2023), with a spatial resolution of 0.1°, are used to quantify MCS-related precipitation. Surface meteorological observations from the National Meteorological Information Center (NMIC) of the China Meteorological Administration (CMA), covering the period 2008–2022, are used to analyse severe wind events. These observations include hourly peak wind speeds from 1811 stations within the study domain. Records of hail and tornadoes for 2003–2020 are obtained from the Yearbook of Meteorological Disasters in China (Song, 2022), published by the CMA.
Tropical cyclone (TC) information is obtained from the CMA tropical cyclone database (Lu et al., 2021; Ying et al., 2014) and the International Best Track Archive for Climate Stewardship (IBTrACS; Gahtan et al., 2024; Knapp et al., 2010), which provide TC track and position information for the identification of cloud systems associated with TCs.
2.2 Methods
2.2.1 Identification and track of MCSs
Since Tb can indirectly reflect cloud top height by indicating cloud top temperature (Rickenbach, 1999), it is widely used in the automatic event detection algorithm for MCS database (Chen et al., 2019; Feng et al., 2021; Fiolleau and Roca, 2013; Huang et al., 2018; Jirak et al., 2003; Liu et al., 2021; Machado et al., 1998; Yang et al., 2015). The identification of MCSs refers to extracting a series of low-brightness-temperature areas, known as cold cloud areas (CCAs), from a Tb field by setting Tb thresholds. The Tb threshold varies depending on the geographic regions. Morel and Senesi (2002a, b) used a threshold of −48 °C (225 K) to establish the MCS database for France from 1993 to 1997. Chen et al. (2019) used 235 K as Tb threshold to analyse the climatology of MCSs in the monsoon region of East Asia. In this study, a Tb threshold of 233 K is used to identify CCAs, and a threshold of 225 K is used to identify cold cores to distinguish stratiform clouds, which means a CCA containing pixels with Tb ≤ 225 K. Specifically, pixels with Tb ≤ 233 K are labelled and connected using an 8-connectivity method (Cheng et al., 2022), forming several continuous regions composed of adjacent grids. Considering the unique advantage of high spatiotemporal resolution Tb data in tracking the evolution of MCSs, this study adopts a 3000 km2 area threshold for identifying Cold cloud systems (CCSs). This threshold improves the accuracy of capturing the complete MCS life cycle, from initial convective initiation to maturation and dissipation. CCSs are defined as CCAs with cold cores (Tb ≤ 225 K).
The tracking of MCSs refers to tracking the development of CCSs, essentially establishing connections between CCSs at two consecutive time instants. The majority of researchers currently use the overlap method (Cheng et al., 2022; Feng et al., 2021; Morel and Senesi, 2002a), which determines whether to link two CCSs as part of the same CCS based on the horizontal overlapping area between the two consecutive time instants. In this study, the 15 % overlapping-area ratio is used to track MCSs. Finally, CCSs with a duration exceeding 3 h are classified as MCSs.
The Tb thresholds are determined based on the Tb characteristics of CCAs and the precipitation within their extent in the AMR study domain in 2001. First, CCAs in the AMR study domain for the year 2001 are identified using thresholds ranging from 230 to 245 K at 3 K intervals. The total precipitation volume (TPV), the number of heavy precipitation (≥ 20 mm h−1) occurrences (nHPOs), and the number of CCAs (nCCAs) are calculated for each threshold. TPV primarily reflects the overall amount of precipitation associated with CCAs; nHPOs mainly indicates the capability of the corresponding threshold to identify extreme weather events; and nCCAs primarily affects computational efficiency, as a smaller nCCAs reduces the computational resources required.
Considering both computational efficiency and the accuracy in identifying extreme weather events, the Tb threshold for identifying CCAs (TbCCAthr) is set to 233 K (Fig. 2a). Assuming that the CCAs identified using a 245 K threshold represent all CCAs, using a 233 K threshold can identify over 97 % of the CCAs associated with heavy precipitation, 50 % of the nCCAs, and 70 % of the TPV, which indicates that most of the CCAs not selected by this threshold are linked to lower precipitation intensities and rarely lead to heavy precipitation. With the TbCCAthr set to 233 K, the cumulative frequency distributions of TPV, nHPOs, and nCCAs with respect to the minimum Tb (Tbmin) within the CCA are calculated (Fig. 2b). The threshold for identifying cold cores is set to 225 K, at which over 90 % of the CCAs associated with heavy precipitation can be identified. By combining the Tb thresholds with the area and overlapping area thresholds, this method can identify more than 75 % of the CCAs associated with heavy precipitation. To evaluate the sensitivity of selected key results to MCS identification thresholds, a series of sensitivity analyses were conducted using different threshold settings, as shown in Figs. S2, S3 and Tables S1, S2 in the Supplement.
To exclude cloud systems associated with TCs from the MCS database, the CMA tropical cyclone database (Lu et al., 2021; Ying et al., 2014) and the IBTrACS (Gahtan et al., 2024; Knapp et al., 2010) are used to identify and remove TC-related MCSs. At each time step throughout an MCS lifetime, an MCS intersecting the 500 km-radius circle centred on a contemporaneous TC centre is classified as a TC-related cloud system and excluded from the MCS event set used in subsequent analyses.
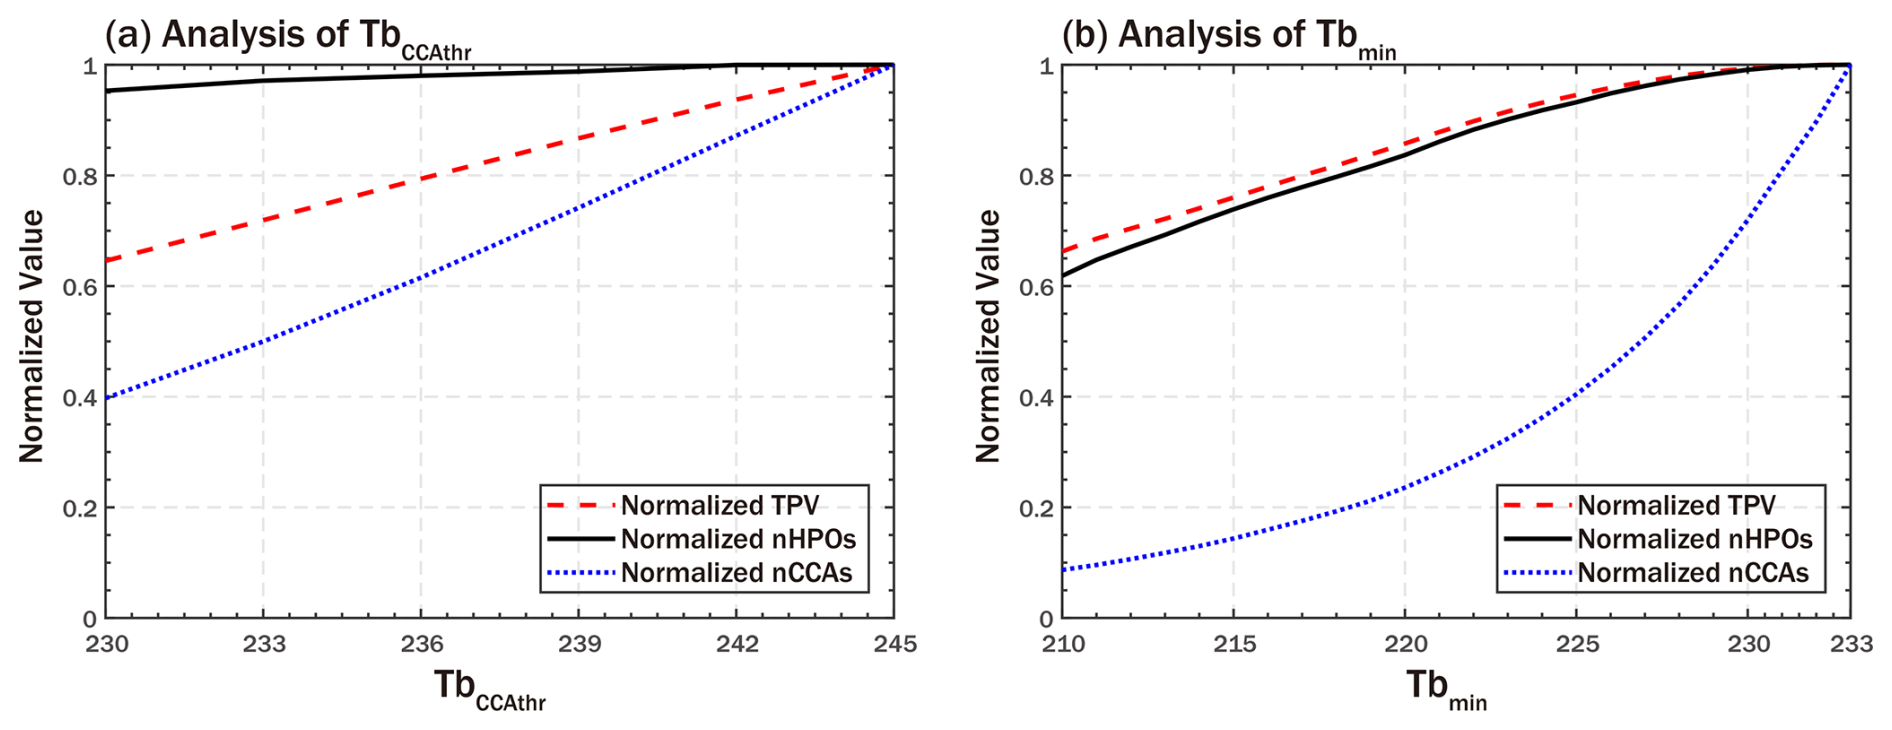
Figure 2Analysis of Tb threshold. (a) Total precipitation volume, number of heavy precipitation occurrences, and number of CCAs obtained for different TbCCAthr values, normalized to those at 245 K. (b) Total precipitation volume, number of heavy precipitation occurrences, and number of CCAs obtained for different Tbmin values with TbCCAthr fixed at 233 K, normalized to those at 233 K.
2.2.2 Verification of MCS database
The verification of the MCS database focuses on two main aspects: first, assessing the suitability of the Tb data for identifying MCSs over the AMR study domain through validation with localized radar observations; and second, evaluating the accuracy of the algorithm for MCS identification and tracking by comparing the spatial distribution of MCSs with that obtained by Dong et al. (2022) using the same Tb data source.
To assess the suitability of the Tb data for identifying MCSs over the AMR study domain, radar echo images from the Hong Kong Observatory (HKO) spanning 2009–2015 are employed, from which precipitation features (PFs) and convective features are identified to detect MCSs. PFs are identified using a 17 dBZ threshold, and convective features potentially present within precipitation regions are identified using a 42 dBZ threshold (Chen et al., 2020; Feng et al., 2019). Similar to the identification of MCSs using Tb data, contiguous pixels with radar reflectivity ≥ 17 dBZ are labelled using an 8-connectivity method to identify PFs in the radar reflectivity images. A PF, with major axis length > 100 km, containing pixels with radar reflectivity ≥ 42 dBZ and lasting at least 2 h, is defined as an MCS. Compared to other studies, the duration threshold of 2 h used in this study is relatively short (Feng et al., 2019; Haberlie and Ashley, 2019). This is because the spatial coverage of radar data is relatively small, and to capture MCSs that briefly pass through this window, a shorter duration threshold is chosen.
Based on this radar-based detection approach, an MCS database for the HKS region for the period 2009–2015 is established, referred to as RadMCS, which serves as the ground truth for validation. Using the Tb-based detection method described in Sect. 2.2.1, we further extract MCSs occurring within the HKS region during the same period to form a corresponding dataset, referred to as TbMCS. The accuracy of TbMCS is then evaluated by comparing MCS precipitation between RadMCS and TbMCS.
2.2.3 MCS activity metrics
To characterize the spatial distribution characteristics of MCSs within the study region, two metrics are employed: MCS hours (MCSH) and MCS days (MCSD). MCSH refers to the cumulative duration of MCSs at each grid point, while MCSD denotes the number of days affected by MCSs. The cumulative duration is calculated in half-hour increments, consistent with the half-hourly temporal resolution of the Tb data. The annual mean MCSH over the study period serves as an indicator of spatial and temporal characteristics of MCSs, providing a direct measure of regional MCS activity. For each grid point, an MCSD is defined as any day during which it is covered by the MCS impact area (Fig. 1b), regardless of duration. The annual mean MCSD quantifies the frequency of MCS occurrences at each grid point, offering a clear spatial depiction of regional exposure to MCS activity.
In addition, two precipitation-related metrics are employed to evaluate the hydrological contribution of MCSs: MCS precipitation (MCSP) and MCS precipitation fraction (MCSPF). MCSP refers to the total precipitation related to MCSs. This study uses IMERG Final Precipitation V07 data to quantify MCS-related rainfall. Specifically, it is defined as the precipitation occurring within the circumcircle of the bounding rectangle enclosing each MCS (Zhang et al., 2021). MCSPF denotes the ratio of MCSP to the total precipitation, indicating the relative importance of MCS-related rainfall. Collectively, these two metrics characterize MCS-related regional precipitation in both absolute and relative terms. A summary of all MCS metrics used in this study, including their definitions and units, is provided in Table S3 in the Supplement.
2.2.4 Associations between MCSs and different types of weather-related hazards
Based on the data described in Sect. 2.1 and the MCS event database developed in Sect. 2.2.1, this study further examines the association between mesoscale convective systems (MCSs) and several types of weather-related hazards, including heavy rainfall events (HREs, defined as daily precipitation exceeding 50 mm), strong wind events (SWEs, defined as daily peak wind speeds exceeding 17.2 m s−1, equivalent to Beaufort Force 8 or above), hail, and tornadoes. Hazard events are uniformly analysed at daily resolution. For SWEs, hail, and tornadoes, the analysis is limited to the Chinese mainland, as the corresponding station-based data and severe weather records are available only for this region.
The impact area of an MCS is determined using the circumscribed circle of the bounding rectangle of the MCS region (Fig. 1b), which provides a consistent and operational estimate of the MCS influence area for large-scale climatological analyses, although it may not precisely represent the actual impact area of individual convective events. Because the Tb data have a temporal resolution of 30 min and MCSs may move substantially between successive observations, convective hazards may occur outside the instantaneous cloud mask. Therefore, the circumscribed-circle-based definition is intended to account for the broader potential influence area of MCSs. Taking precipitation as an example, a comparison (Fig. S1) with a cloud-mask-based definition using the identified MCS cloud mask shows that the choice of impact-area definition mainly affects the absolute magnitude of MCS-related precipitation, while the overall spatial distribution pattern remains broadly similar.
Due to differences in data sources, the spatial representation of hazard types varies accordingly. HREs are georeferenced to regular grid points. SWEs, derived from hourly wind observations at surface meteorological stations, are assigned to the geographic locations of the respective stations. Hail and tornado records are obtained from the Yearbook of Meteorological Disasters in China (Song, 2022), which integrates reports from meteorological departments and emergency management authorities at various administrative levels in China. Considering the differences in reporting format and spatial precision among these reports, hail days and tornado days are aggregated to prefecture-level administrative units and subsequently mapped onto the corresponding grid cells. A hazard event is classified as MCS-associated if its spatial unit (e.g., grid point, station location, or aggregated grid cell) overlaps with the impact area of an MCS at the time of occurrence, with MCSD used to quantify MCS occurrence. The conditional probability of each hazard given MCS occurrence was then calculated for each spatial unit as follows,
where P (Hazard|MCS) represents the conditional probability of a weather-related hazard given the MCS occurrence. N (MCSD ∩ Hazard) denotes the number of occurrences in which an MCSD and a specific type of hazard (including HRE, SWE, hail day, or tornado day) co-occur within a given location unit, whereas N (MCSD) denotes the total number of MCSD occurrences at that location unit. The spatial scale of the location unit (e.g., single grid cell, station point, or aggregated region) varies depending on the hazard type and data availability. In this study, the relationship between MCSs and each hazard type is analysed separately, without combining the hazard types into a single category or quantifying their co-occurrence.
3.1 Evaluation of the MCS database derived from Tb data
In this section, the subset (TbMCS) of the MCS database based on Tb data is evaluated against the RadMCS identified by HKO radar data, as described in Sect. 2.2.2. Since that the large scale, high cloud-top heights, and abundant water vapor content of tropical cyclones (TCs) make their regions distinctly identifiable in both the radar data and the Tb data, the MCS precipitation during typhoon periods of HKS is removed.

Figure 3Comparison of spatial distributions of (a, c) MCS precipitation and (b, d) MCS precipitation fraction between TbMCS and RadMCS over HKS during 2009–2015. The black solid lines indicate prefecture-level administrative boundaries, and the blue solid line denotes the observational coverage of the radar data. Color shading indicates: annual mean (a, c) cumulative MCS precipitation (mm yr−1) and (b, d) MCS precipitation fraction (%).
In terms of annual cumulative precipitation, the spatial distribution of TbMCS precipitation and RadMCS precipitation shows a high degree of consistency (Fig. 3a, c). The locations and ranges of several high precipitation areas are nearly identical, indicating that Tb data can effectively capture the primary impact areas of MCS activity. Regarding the distribution of MCS precipitation fraction (Fig. 3b, d), TbMCS shows a more even distribution across the study area, with a larger coverage of high-value areas (> 60 %), whereas RadMCS exhibits a more concentrated pattern, with high values primarily located along coastal regions. This difference may reflect the distinct advantages of the two types of data: high-resolution radar data can more accurately capture precipitation features in the strong convective core region, while Tb data, due to its broader identification of stratiform precipitation areas, is better suited to reflecting the overall spatial distribution of precipitation. Meanwhile, by comparing the spatial distribution of MCSs developed in this study with that of Dong et al. (2022), the performance of the algorithm for MCS identification and tracking employed in this study is acceptable (Fig. S4).
In summary, the Tb data used in this study are effective in capturing MCS activity over the AMR study domain. Moreover, the MCS database developed using the method described in the Sect. 2.2.1 exhibits good accuracy, supporting its reliable use in subsequent analyses. Additionally, the broad spatial coverage of Tb data facilitates the observation of MCS activity over extensive areas, making it particularly advantageous for analysing the characteristics and impacts of MCSs at regional scales.
3.2 Spatial characteristics of MCSs in the AMR study domain
Based on the methodology described in Sect. 2.2.1, this study identifies MCS events from 2001 to 2023 within the spatial domain of 15–45° N and 70–125° E, and further analyses their characteristics. From the spatial distribution of MCSs, as shown in Fig. 4a, the Bay of Bengal stands out as the most significantly affected region by MCSs within the study area, with MCSH exceeding 700 h annually. It decreases progressively from the ocean toward the land, which is consistent with the findings of other researchers (Feng et al., 2021; Hu et al., 2016; Li et al., 2020). Additionally, the coastal areas of the South China Sea and the East China Sea show concentrated MCS activity, with annual MCSH generally around 200 h. However, unlike the Bay of Bengal, the distribution of oceanic MCSs in this region is relatively sparse, with the main areas of MCSs concentrated along the coast and gradually decreasing inland. A comparison with the MCS dataset developed by Dong et al. (2022) over eastern China (Fig. S4) demonstrates a comparable spatial distribution of MCSH during the overlapping period, thereby supporting the robustness of the identification method employed in this study.
MCSD demonstrate a clear spatial pattern (Fig. 4b), with higher frequencies observed along the northern coast of the Indian Ocean compared to the western Pacific, over land relative to ocean, and showing a gradual northward decrease from the mid-latitudes. Notably, MCSD exceeds 150 d over the Tibetan Plateau, the Bay of Bengal and its adjacent coastal regions, and northern Philippines, while lower values of approximately 100–120 d are found along the eastern coast of China.
From the overall distribution, MCSP is predominantly concentrated over the Bay of Bengal and the Indian subcontinent, aligning closely with the spatial distribution of MCSs (Fig. 4c). Additionally, the coastal areas of the South China Sea and the East China Sea, along with their adjacent inland regions, exhibit relatively high levels of MCSP, with a clear decreasing trend from coastal to inland areas. In areas south of 30° N, MCSP generally accounts for more than 50 % of total precipitation, with values exceeding 70 % over the Bay of Bengal and the Indian subcontinent (Fig. 4d). A significant geographical distinction exists between MCSP and MCSPF: the coastal-to-inland disparity is more pronounced for MCSP, whereas MCSPF is more strongly correlated with latitude.
Despite exhibiting relatively low MCSP, the Tibetan Plateau stands out with notably high values of both MCSH and MCSD, with MCSD exceeding 200 d in the eastern Tibetan Plateau (32–34° N and 87–102° E). This apparent inconsistency may be attributed to two factors. First, the Himalayas act as a barrier that prevents most south-side MCSs, such as those over the Bay of Bengal, from moving northward. Second, the region's high elevation enables convective clouds to more readily reach high cloud-top altitudes, making them more likely to be identified as MCSs by Tb thresholds – even when the convective activity is weak (Kukulies, 2023; Kurosaki and Kimura, 2002). Seasonal variations in MCS characteristics provide additional support for this interpretation (Fig. S5): over the Tibetan Plateau, MCSH and MCSP are relatively consistent during the warm season, whereas MCSH and MCSD remain high in the cold season despite very low MCSP. Together, these factors likely contribute to an overestimation of MCSH and MCSD over the Plateau.
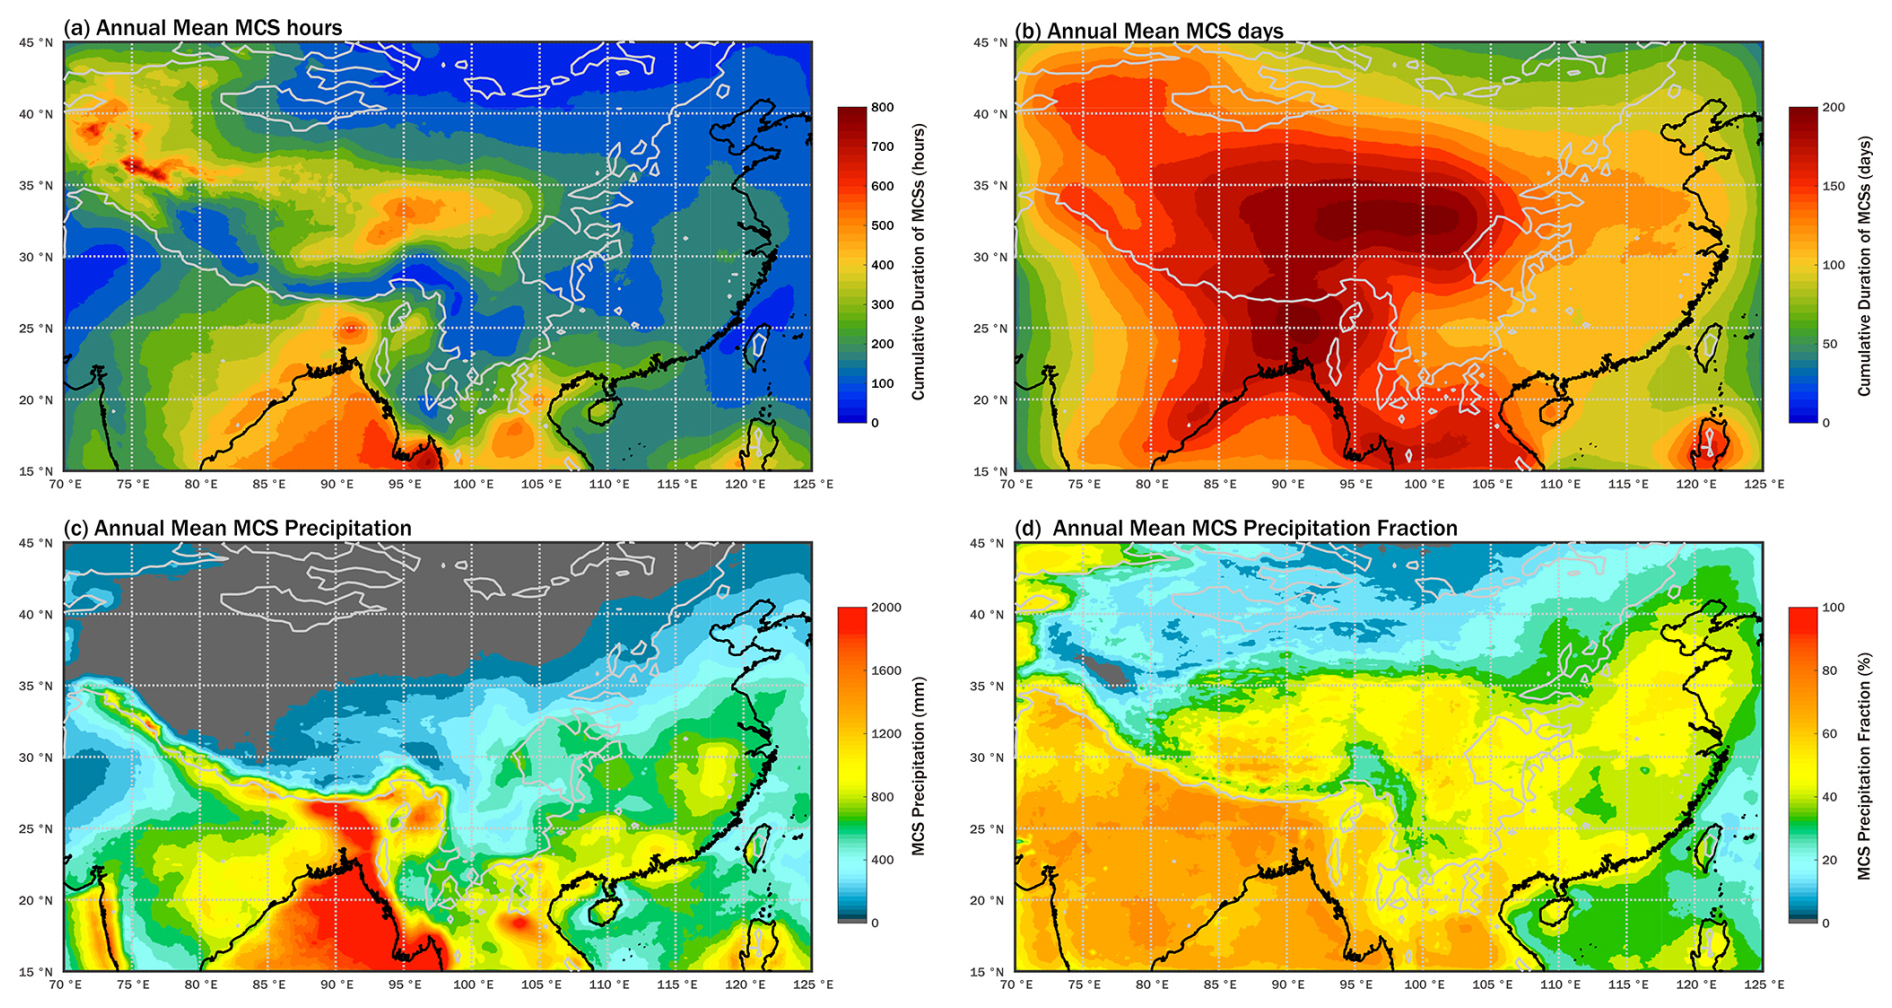
Figure 4Annual mean spatial distributions of (a) MCSH, (b) MCSD, (c) MCSP, and (d) MCSPF. The black solid line represents the coastline, and the gray solid line represents the 1000 m elevation contour. Color shading indicates: annual mean (a) cumulative MCS duration (hours), (b) number of MCS days (days), (c) cumulative MCS precipitation (mm), and (d) MCS precipitation fraction (%).
Although the South China Sea and the Bay of Bengal are located at similar latitudes, MCS activity differs significantly between the two regions. Numerically, the MCSH, MCSP, and MCSPF values in the South China Sea are notably lower than those in the Bay of Bengal. Spatially, the centers of MCSH, MCSP, and MCSPF in the South China Sea are located further south compared to those in the Bay of Bengal. These differences are consistent with the variations in monsoon activity between the two regions: the southwest monsoon over the Bay of Bengal begins earlier, is stronger, lasts longer, and advances farther north than the tropical monsoon over the South China Sea (Li and Ju, 2013).
3.3 Hazardous impact of MCSs in the AMR study domain
3.3.1 MCS-related heavy rainfall events
In this study, a day with precipitation exceeding 50 mm is defined as an HRE, a criterion widely used for identifying rainstorms (Nastos and Zerefos, 2008; Oh et al., 2014; Sun et al., 2007). As described in Sect. 2.2.4, if an HRE occurs within the impact area of MCSs (Fig. 1b), it is considered to be associated with them. HRE's association with MCS enables further quantification of the probabilistic relationship between MCSs and heavy rainfall.
The spatial distribution of HREs (Fig. 5a) exhibits pronounced contrasts between land and ocean, across topographic features, and among different monsoon subregions. Specifically, HREs are predominantly concentrated along coastal areas and on windward slopes of mountainous regions. Moreover, both the frequency and spatial extent of HREs along the coastal region of the Bay of Bengal are significantly greater than those in the coastal region of the South China Sea. For instance, the average annual number of HREs along the Bay of Bengal coast exceeds 24 d, whereas it is fewer than 8 d in southeastern China and fewer than 15 d in the western Philippines. These differences can be attributed to several physical mechanisms. Coastal regions not only receive abundant moisture directly from adjacent oceans but also experience enhanced convective development driven by convergence and uplift associated with land–sea thermal contrasts near the shoreline. In mountainous areas, windward slopes promote orographic lifting, which rapidly forces moist air to ascend, cool, and condense, thereby increasing precipitation efficiency. Variations in large-scale circulation and surface conditions – including regional differences in monsoon characteristics, land–sea transitions, and topographic relief – jointly shape the spatial distribution of HREs across the AMR study domain.
Building on these overall spatial patterns of HREs, we further compare the distributions of total HREs and those associated with MCSs. The spatial distribution of MCS-associated HREs (MCS-HREs) is generally similar to that of total HREs (Fig. 5a, b). The main difference lies in the oceanic regions, where the fraction of HREs associated with MCSs (MCS-HRE fraction) is relatively lower. As shown in Fig. 5c, the MCS-HRE fraction over land areas typically exceeds 70 % and approaches 100 % in many inland regions. In contrast, it decreases over oceanic regions, with particularly low values over the South China Sea, where the fraction drops to around 50 %.
In addition to the MCS-HRE fraction, this study analyses the conditional probability of HRE occurrence given MCS occurrence (P (HRE|MCS)), calculated respectively for the entire year, the warm season (May–September), and the cold season (October–April), to assess the potential of MCSs for producing HREs and the seasonal variation of P (HRE|MCS). The spatial pattern of P (HRE|MCS) largely resembles that of MCS-HRE frequency (Fig. 5b), with high values primarily located along coastlines and at the foothills of mountains, particularly along the eastern coasts of the Bay of Bengal and the Arabian Sea, where it exceeds 13 %. In contrast, across most of eastern China, P (HRE|MCS) is generally below 2 %, with only a few localized areas exceeding 5 %.
The warm-season distribution of P (HRE|MCS) (Fig. 5e) closely matches the annual pattern (Fig. 5d), with relatively higher values in regions such as the northern Bay of Bengal, southwestern China, and the East China Sea. In the cold season (Fig. 5f), P (HRE|MCS) over inland areas decreases markedly, accompanied by a pronounced southward retreat across the Bay of Bengal, indicating that MCS-HREs are concentrated mainly in the warm season. For eastern AMR study domain, two notable features are evident. First, in the South China Sea and its coastal areas, the high-P (HRE|MCS) zones shift from being concentrated in the east during the warm season to the west during the cold season. Second, over the western Philippine Sea, such zones exhibit a southward retreat during the cold season.
These changes reflect a seasonal redistribution of MCS-related contributions to heavy rainfall, primarily driven by seasonal variations in large-scale circulation during the transition from the warm to the cold season. As the South Asian monsoon weakens, MCS activity over the Bay of Bengal declines and shifts southward, forming part of the broader monsoon-driven redistribution pattern across the AMR study domain. Locally elevated conditional probabilities over the southwestern Philippine Sea may be attributed to the southward retreat of the Western Pacific Subtropical High (Hong and Zhang, 2021). Meanwhile, the relatively delayed withdrawal of the South China Sea tropical monsoon (Li and Ju, 2013) and the dominance of northeasterly winds in the lower troposphere during the cold season (Liu et al., 2025) may help explain the higher P (HRE|MCS) observed along its western coast.
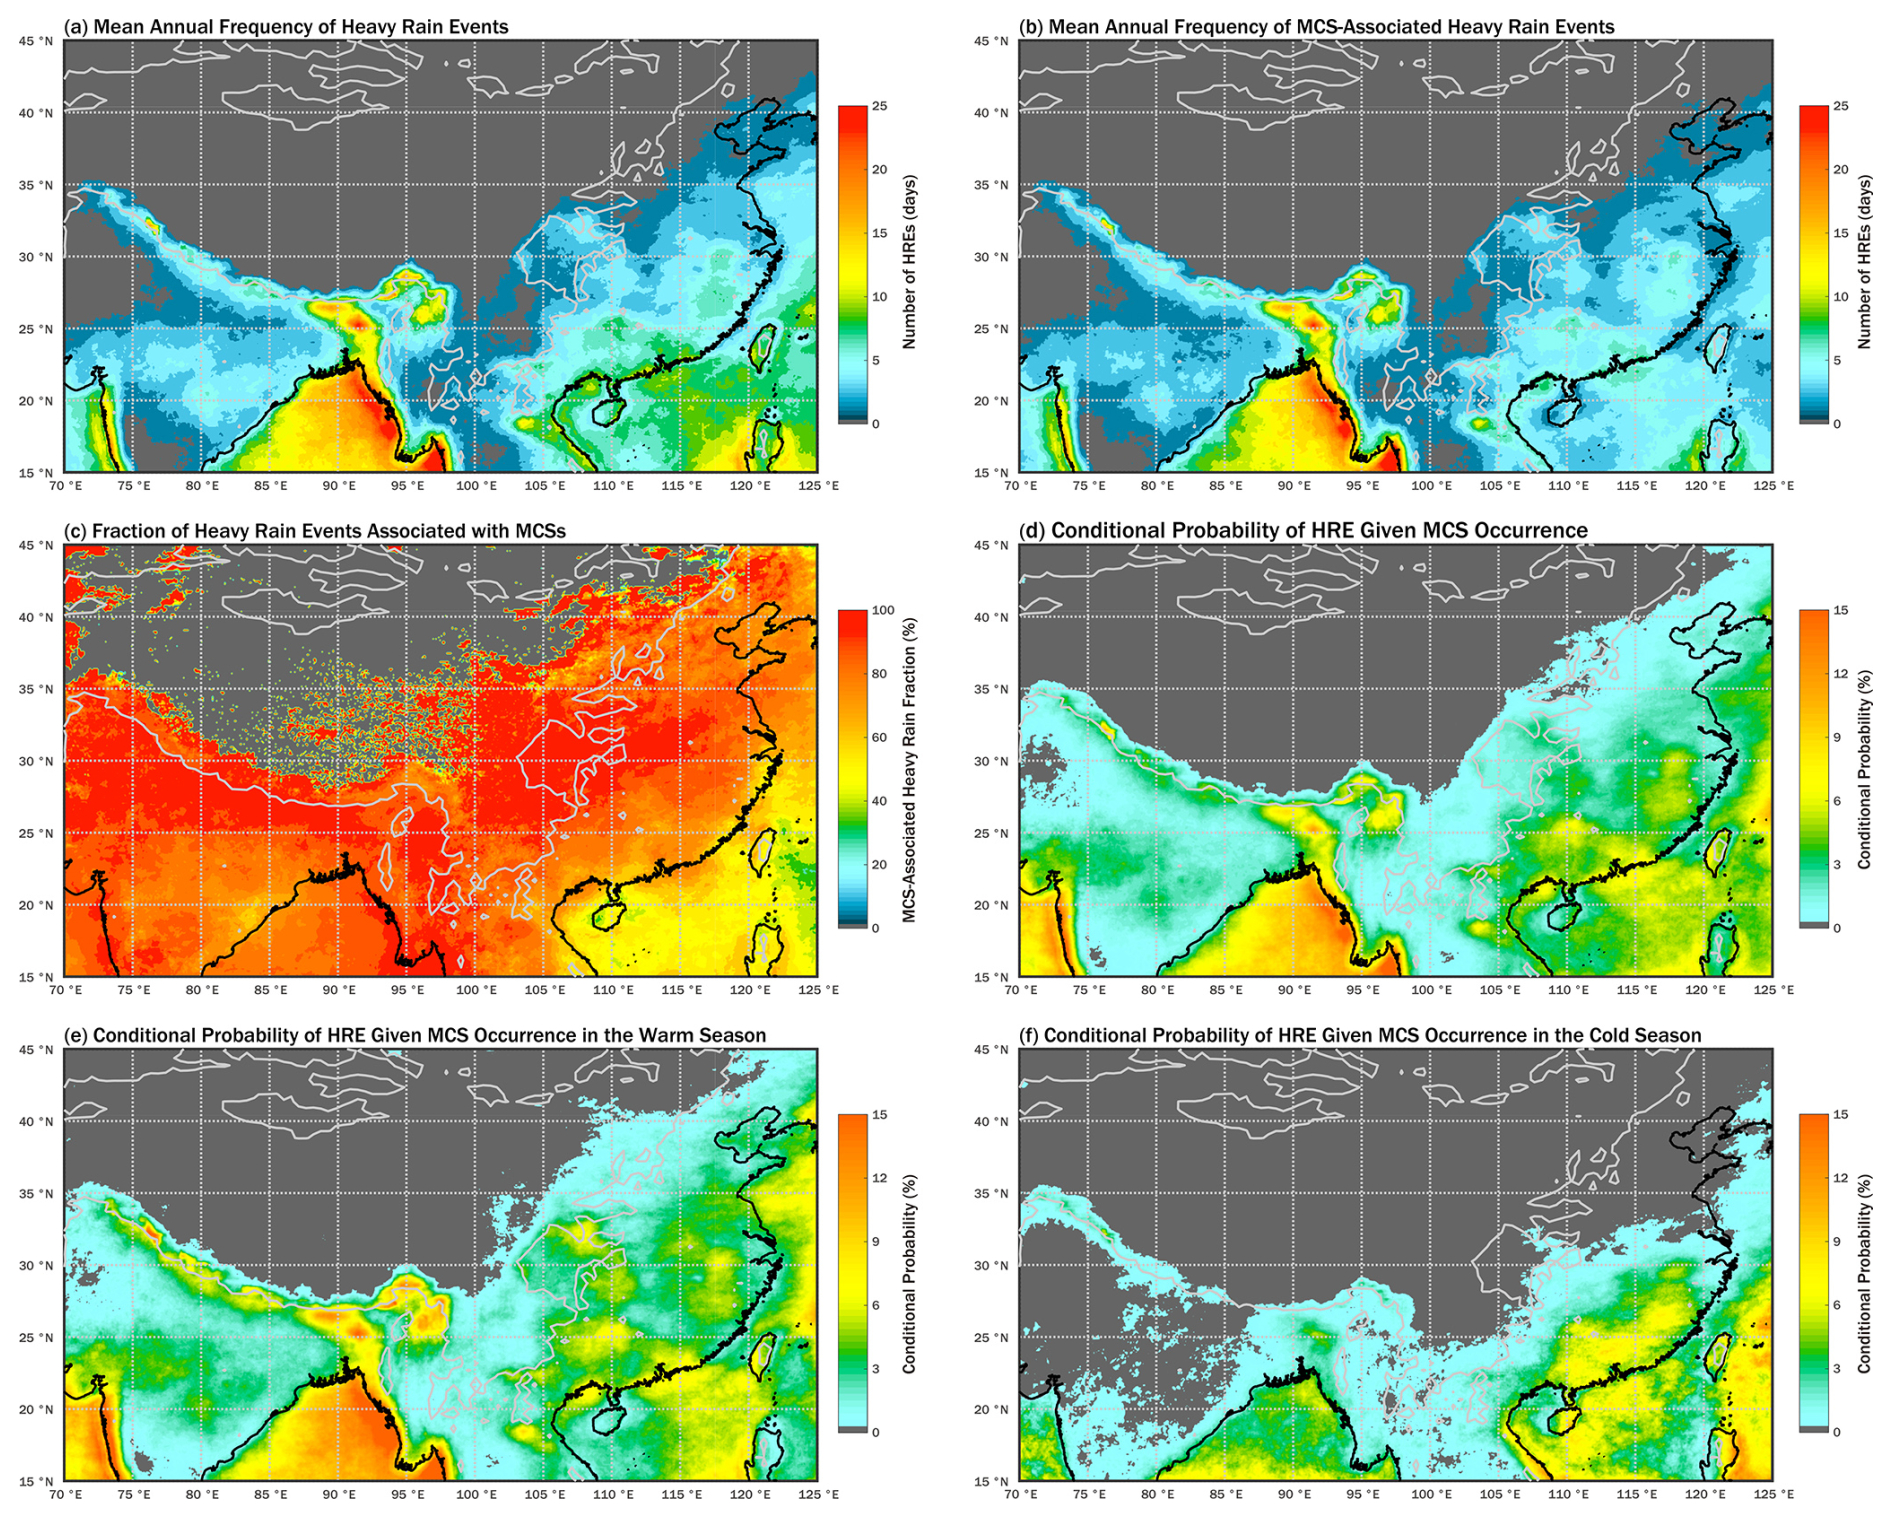
Figure 5Annual mean spatial distributions of (a) HREs, (b) MCS-HREs, (c) MCS-HRE fraction, and P (HRE|MCS) for (d) the whole year, (e) the warm season, and (f) the cold season. The black solid line represents the coastline, and the gray solid line represents the 1000 m elevation contour. The color shading indicates the annual mean number of events (days) for (a) and (b), the fraction of events associated with MCSs (%) for (c), and the conditional probability (%) for (d)–(f).
3.3.2 MCS-related strong wind events
This study utilizes observational data from surface meteorological stations across the Chinese mainland from 2008 to 2022 to assess the relationship between MCSs and SWEs. The relationship between SWEs and MCSs is quantified as the fraction of MCS-SWEs to the total number of SWEs (MCS-SWE fraction) and conditional probability of SWE given MCS occurrence (P (SWE|MCS)), offering insights into probabilistic relationship between MCSs and extreme wind weather.
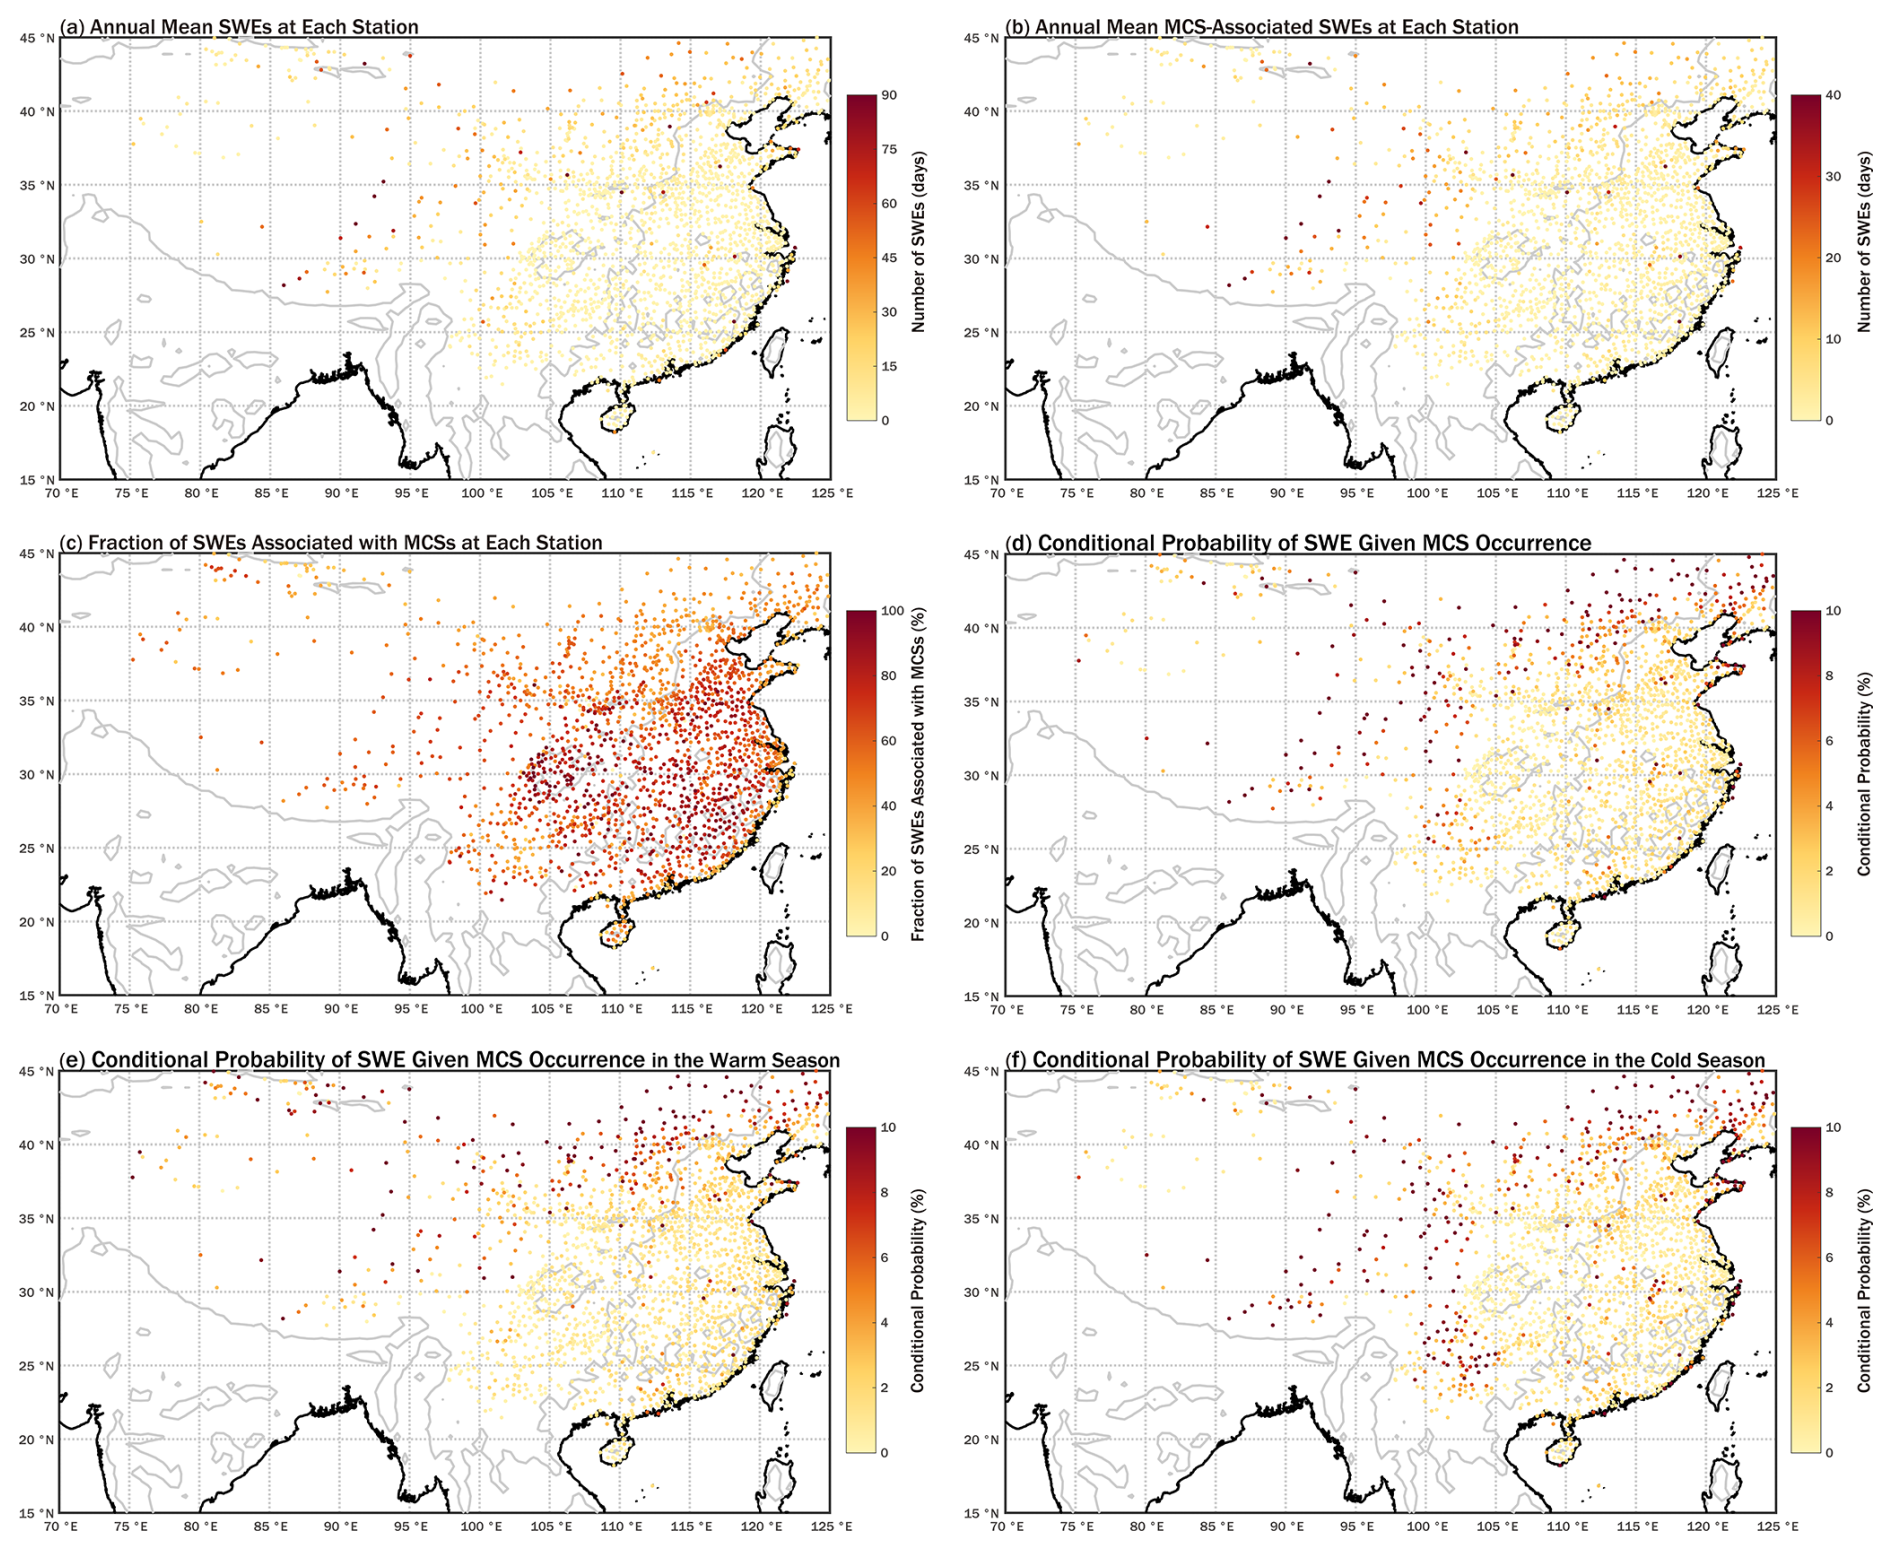
Figure 6Annual mean spatial distributions of (a) SWEs, (b) MCS-SWEs, (c) MCS-SWE fraction, and P(SWE|MCS) for (d) the whole year, (e) the warm season, and (f) the cold season. The black solid line represents the coastline, and the gray solid line represents the 500 m elevation contour. The dots represent meteorological station locations. The color shading of dots indicates the annual mean number of events (days) for (a) and (b), the fraction of events associated with MCSs (%) for (c), and the conditional probability (%) for (d)–(f).
Figure 6a illustrates the spatial distribution of the annual average number of SWEs across China from 2008 to 2022. Each dot represents a meteorological station, with color intensity indicating the recorded frequency of SWEs. Unlike precipitation patterns, SWEs are primarily concentrated in western China, where several stations record more than 60 SWEs per year, and a few exceed 120 d annually. Northern China also exhibits relatively high SWE frequencies, with many stations observing over 45 d yr−1. In contrast, SWE occurrences in southeastern China are generally infrequent, typically fewer than 5 d yr−1, while a few stations in this region record more than 110 d annually. These regional disparities highlight the distinct spatial characteristics of SWEs and provide a foundation for subsequent analysis of their associations with MCS activity.
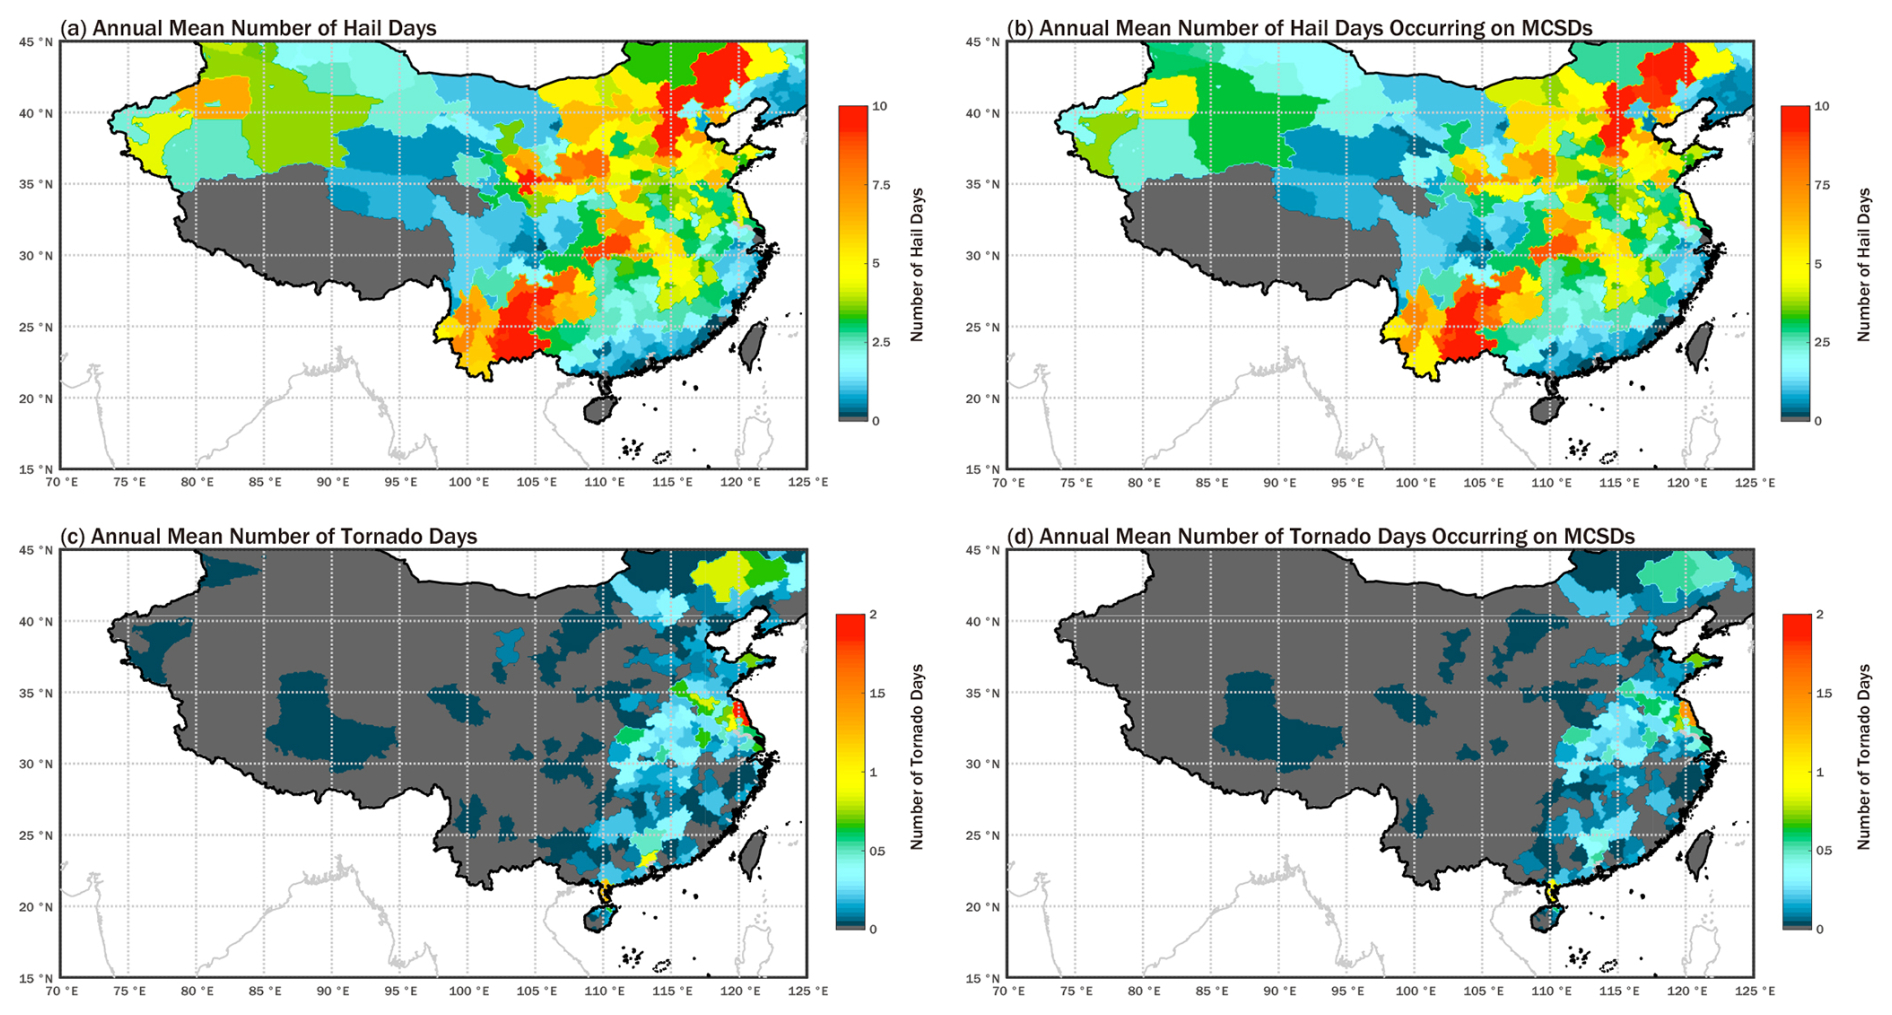
Figure 7Annual mean spatial distributions of (a) hail days, (b) MCS-associated hail days, (c) tornado days, and (d) MCS-associated tornado days. The black solid line represents the national boundaries of China. The gray solid line represents the coastline. The color shading indicates the annual mean number of events (days).
Figure 6b, c present the MCS-SWE frequency and fraction, respectively, at each meteorological station. The spatial distribution of MCS-SWE frequency resembles that of total SWEs, characterized by higher values in the northwest and lower values in the southeast. Overall, approximately 47 % of all recorded SWEs are associated with MCSs. In southeastern China, where SWEs are generally infrequent, the MCS-SWE fraction is notably high at most stations, often exceeding 70 %. Meanwhile, a distinct spatial pattern is observed: coastal stations in this region tend to show lower MCS-SWE fractions, which increase sharply to above 70 % at stations located slightly farther inland. In contrast, northern and western China – where SWEs are more frequent – exhibit relatively lower MCS-SWE fractions, generally below 40 % in the north and below 60 % in the west. In the Tibetan Plateau region, overestimation of MCS detections may partially contribute to the inflated MCS-SWE fractions observed there.
Unlike the spatial pattern of the MCS-SWE fraction, P (SWE|MCS) is generally high in northern and western China, often exceeding 10 %, but remains mostly below 2 % in southeastern China, with a few stations exceeding 5 % (Fig. 6d). From the warm to the cold season, P (SWE|MCS) remains relatively stable across northern China, while notable increases are observed in parts of the south – for example, in the Yungui Plateau, values rise from below 2 % to above 10 % or even 20 % (Fig. 6e, f). In southern China, stations generally exhibit a high MCS-SWE fraction (exceeding 70 %), whereas the corresponding P (SWE|MCS) remains low (around 1 %). This contrast indicates that while most SWEs in the region coincide with MCS activity, only a small fraction of MCSs actually generate SWEs. Notable exceptions occur in areas with pronounced topographic transitions, such as mountainous margins or complex coastlines, where relatively high frequencies of SWEs on MCSDs are observed. This spatial variability suggests a possible correspondence between MCS-SWE occurrence and local terrain complexity, which may modulate near-surface winds through processes such as channeling, terrain-induced acceleration, and localized convergence.
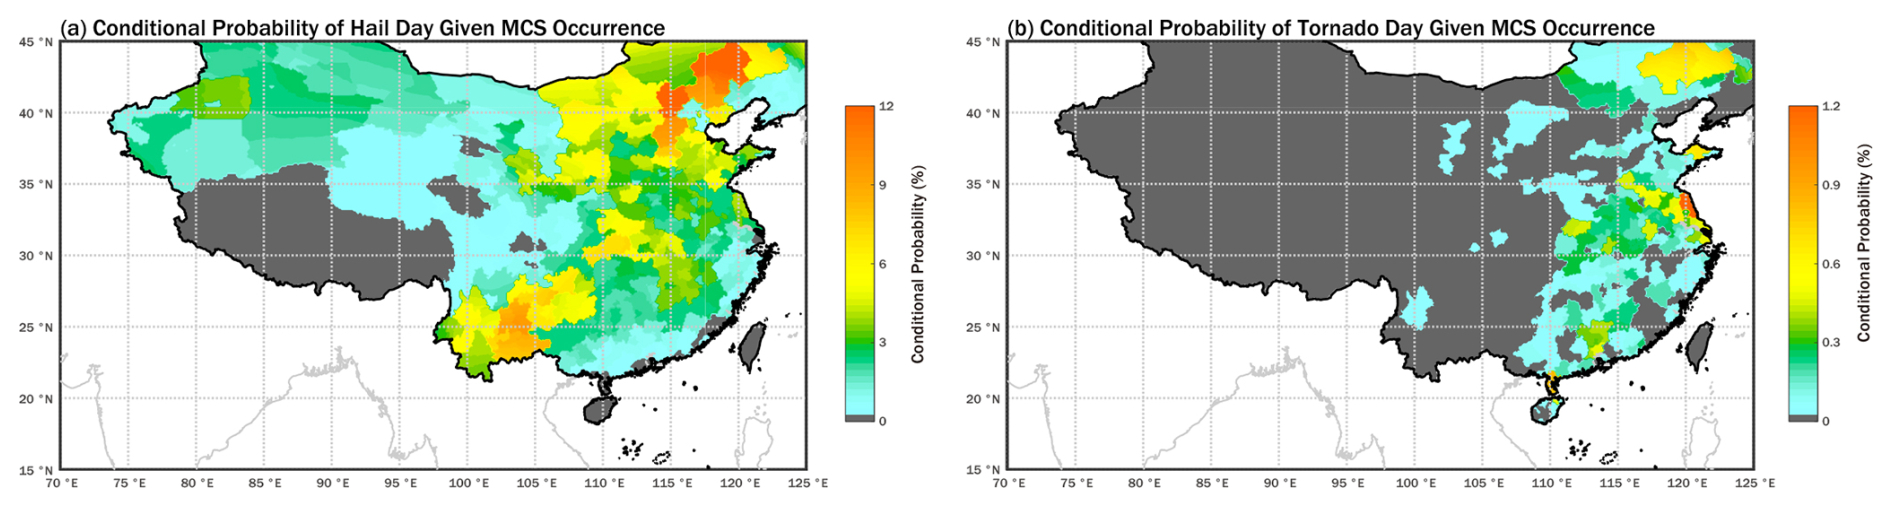
Figure 8Annual mean spatial distributions of conditional probability of (a) hail and (b) tornado day given MCS occurrence. The black solid line represents the national boundaries of China. The gray solid line represents the coastline. The color shading indicates the conditional probability (%).
3.3.3 Co-occurrence of MCSDs with Hail and Tornado Days
Based on hail and tornado records across the Chinese mainland from 2003 to 2020, together with the developed MCS database, this study investigates the relationship between MCSs and these two types of severe convective weather at daily resolution and the prefectural level.
The spatial distribution of hail frequency (Fig. 7a) exhibits a distinct pattern, with the highest occurrences primarily concentrated along a belt extending from the Yungui Plateau to the Northeast China Plain, where annual frequencies exceed 10 d in certain localized areas. Comparison with the topography (Fig. 1a) reveals that this belt is characterized by pronounced terrain gradients. Such a distribution pattern aligns with the known tendency for hail to occur near the transition zones between plains and mountainous regions. Steep elevation changes facilitate the rapid ascent of near-surface warm and moist air, enhancing convective development and promoting strong updraft formation, which are favorable conditions for hail generation. Approximately 82 % of hail days occurred on MCSDs, and their spatial distribution closely resembles that of total hail days, indicating a strong linkage between hail occurrences and MCS activity in China.
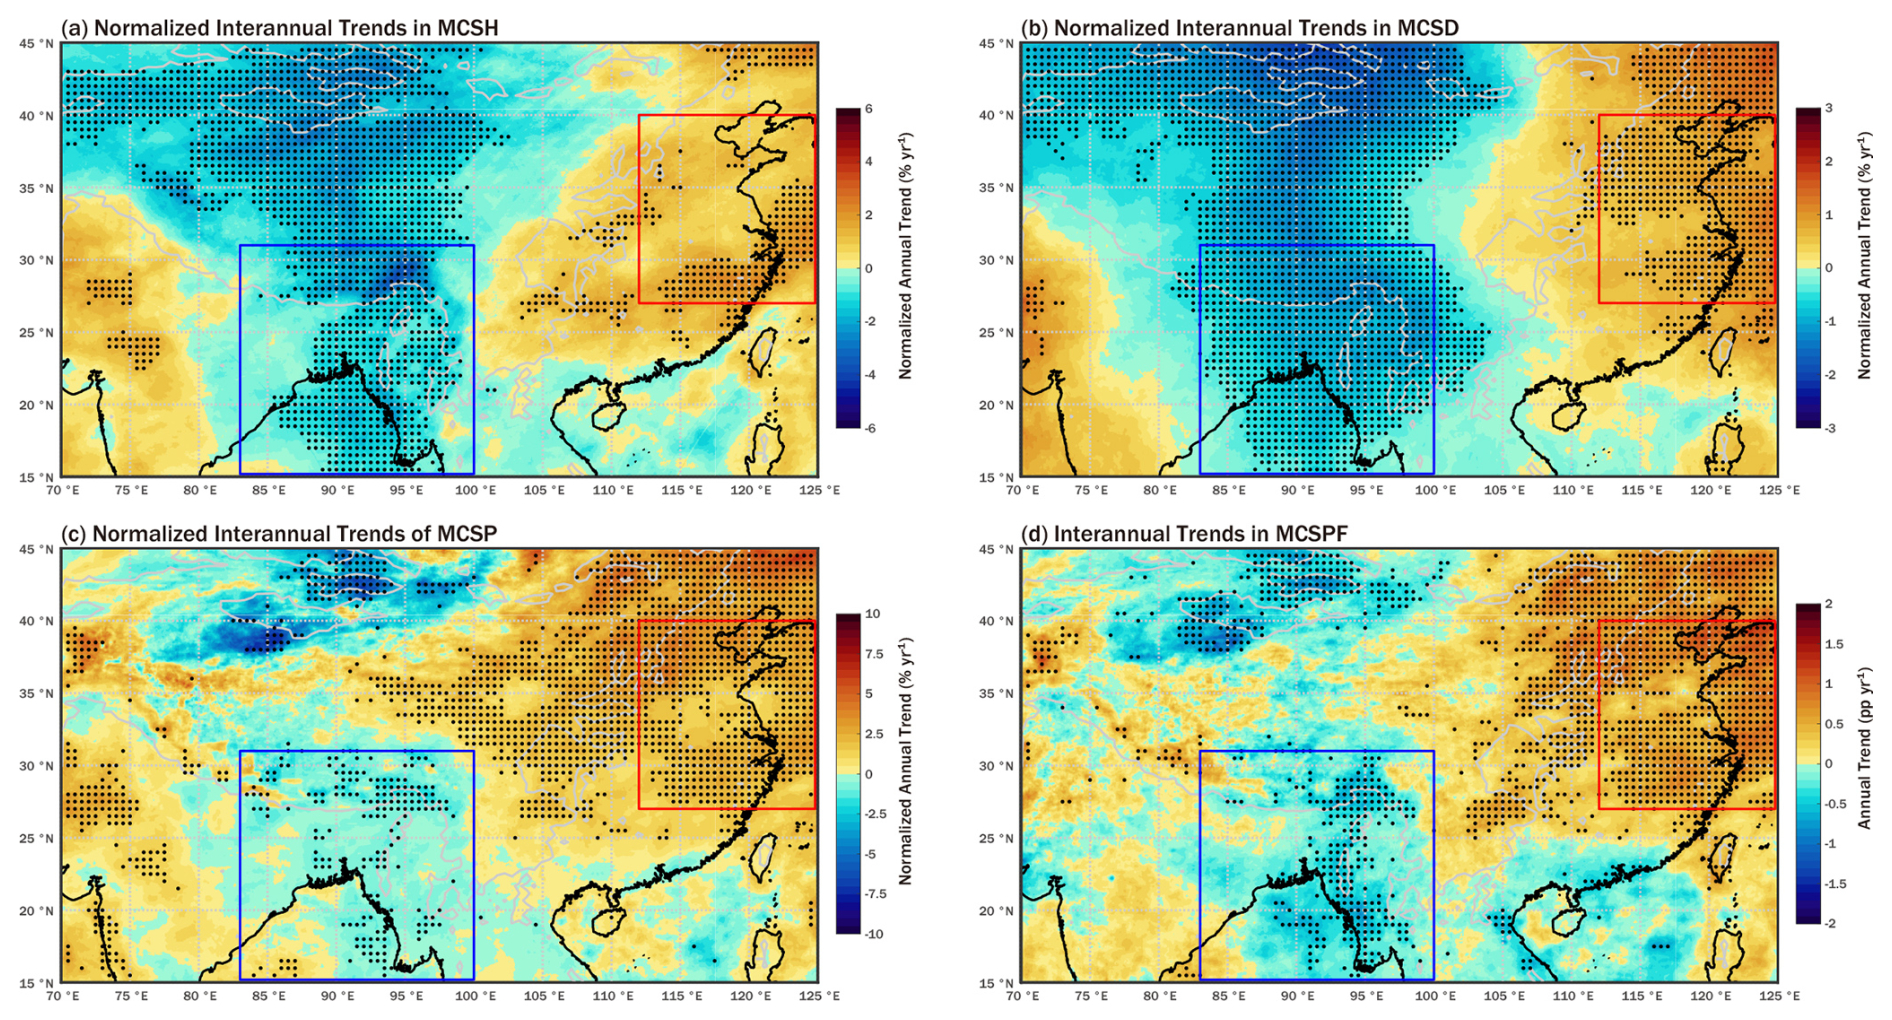
Figure 9Spatial distribution of interannual variation of (a) MCSH, (b) MCSD, (c) MCSP, and (d) MCSPF. The black solid line represents the coastline, and the gray solid line represents the 1000 m elevation contour. The color shading in (a), (b), and (c) denotes the normalized annual trend, which is the ratio of the interannual trend of each grid to its annual mean value (unit: % yr−1); color shading in (d) denotes the annual trend (unit: pp yr−1). The black dots indicate regions with statistical significance at 5 % level, as determined by a two-tailed Student's t-test. The blue box indicates the range of BoBCR in this study, and the red box indicates the range of ECAS in this study.
The conditional probability of hail day given MCS occurrence (P (Hail|MCS)) is also predominantly distributed along the transition zones between plains and mountainous regions (Fig. 8a). Notably, in the belt extending from the Yungui Plateau to the Northeast China Plain, where hail days are frequent, P (Hail|MCS) ranges from 3 % to 14 %, meaning that on any given day when an MCS passes through this region, there is a 3 %–14 % likelihood of hail occurring, depending on the specific local area.
The spatial distribution of tornado days (Fig. 7c) appears rather scattered. Several localized areas with relatively high tornado activity are identified within the Yangtze Plain, the Leizhou Peninsula, the Pearl River Delta, and the Northeast China Plain, where annual Tornadoes generally range from 0.8 to 1.8 d. Approximately 72 % of tornado days occurred on MCSDs, and their spatial distribution (Fig. 7d) closely resembles the total tornado days (Fig. 7c). The conditional probability of tornado day given MCS occurrence (P (Tornado|MCS)) shows a spatial pattern similar to that of the frequency of tornado days (Fig. 7c, d), with higher values (0.6 %–1.2 %) concentrated in tornado-prone areas such as subregions of the Yangtze Plain (Fig. 8b). In addition, elevated P (Tornado|MCS) values are also observed in parts of the Jiaodong Peninsula, suggesting that, in addition to the aforementioned tornado-prone regions, tornado events also have a relatively high likelihood of co-occurring with MCS activity.
Overall, approximately 82 % of hail days and 72 % of tornado days are associated with MCSs. Compared with the findings of Wang et al. (2023) on relationship between MCSs and hail and tornadoes in the United States, these values are significantly higher. This discrepancy may be attributed to differences in MCS identification criteria, as well as variations in geographic and climatic conditions. In addition, the markedly different spatial distributions of hail and tornadoes suggest that, although both types of severe convective weather require significant convective instability, their actual triggering mechanisms may differ considerably (Davies-Jones, 2015; Kim et al., 2023).
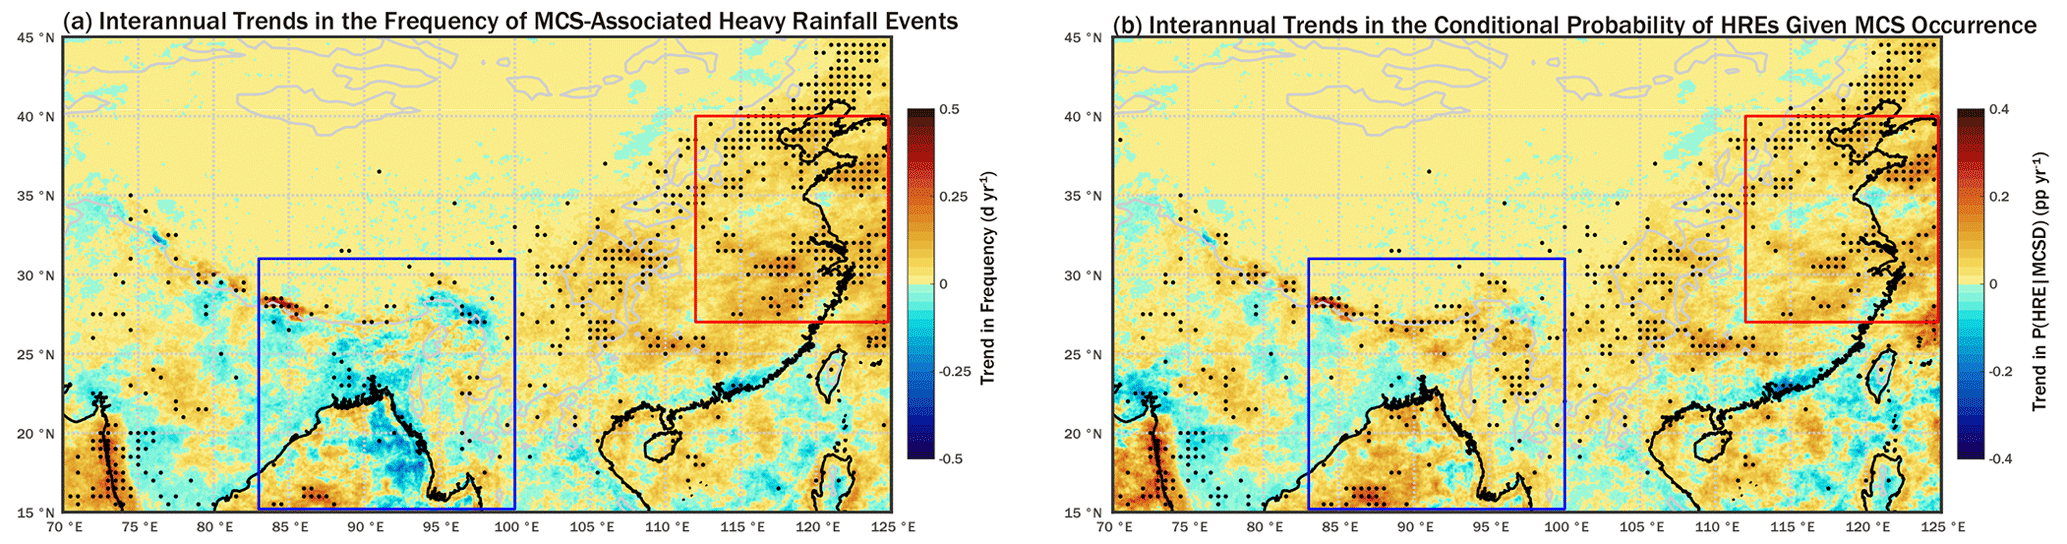
Figure 10Spatial distribution of interannual variation of (a) MCS-associated HREs, (b) P (HRE|MCS). The black solid line represents the coastline, and the gray solid line represents the 1000 m elevation contour. The color shading in (a) denotes the annual trend of MCS-HREs (unit: d yr−1). The color shading in (b) denotes the annual trend of P (HRE|MCS) (unit: pp yr−1). The black dots indicate regions with statistical significance at 5 % level, as determined by a two-tailed Student's t-test. The blue box indicates the range of BoBCR in this study, and the red box indicates the range of ECAS in this study.

Figure 11Spatial distribution of interannual variation of (a) MCS-associated SWEs, (b) P (SWE|MCS). The black solid line represents the coastline, and the gray solid line represents the 500 m elevation contour. The dots represent meteorological station locations. The color shading of dots in (a) denotes the annual trend of MCS-SWEs (unit: d yr−1). The color shading in (b) denotes the annual trend of P (SWE|MCS) (unit: pp yr−1). Stations that do not pass the significance test are not shown in this figure. The red box indicates the range of ECAS in this study.
It should be noted that the occurrence and development of MCSs, as well as their associated hazardous weather impacts, exhibit pronounced regional dependence. MCSs in different regions may differ in terms of their environmental conditions, organizational characteristics, and hazard-producing features. Therefore, the statistical relationships identified in this study should be regarded as characteristics of the specific region and period considered in this analysis, and should not be directly generalized to other regions or periods.
The relatively broad definition of the MCS impact area, together with the daily-scale framework used to link MCSs with hazard events, may lead to an overestimation of the association between MCS activity and weather hazards (Figs. S6 and S7). For heavy rainfall and strong wind events, whose records provide relatively clearer temporal and spatial constraints, the results can be interpreted as statistical attribution at regional and climatological scales, rather than as causal attribution of individual events. For short-lived and highly localised hazards such as tornadoes and hail, however, the daily-scale temporal matching and prefecture-scale spatial matching provide only an approximate correspondence with MCS activity. Therefore, the relationships between MCSs and tornado or hail events should be interpreted as statistical co-occurrence at regional and climatological scales. In addition, possible observational biases in sparsely populated areas, together with the underreporting of weak events in the Yearbook of Meteorological Disasters in China (Song, 2022), may further affect the documented distributions of hail and tornado events and their estimated co-occurrence with MCSs. Moreover, when severe weather records with precise occurrence times are available, hourly-scale analyses based on MCSH, which more directly reflects the cumulative influence of MCS activity, could further improve the assessment of the spatiotemporal correspondence between MCS activity and weather-related hazards.
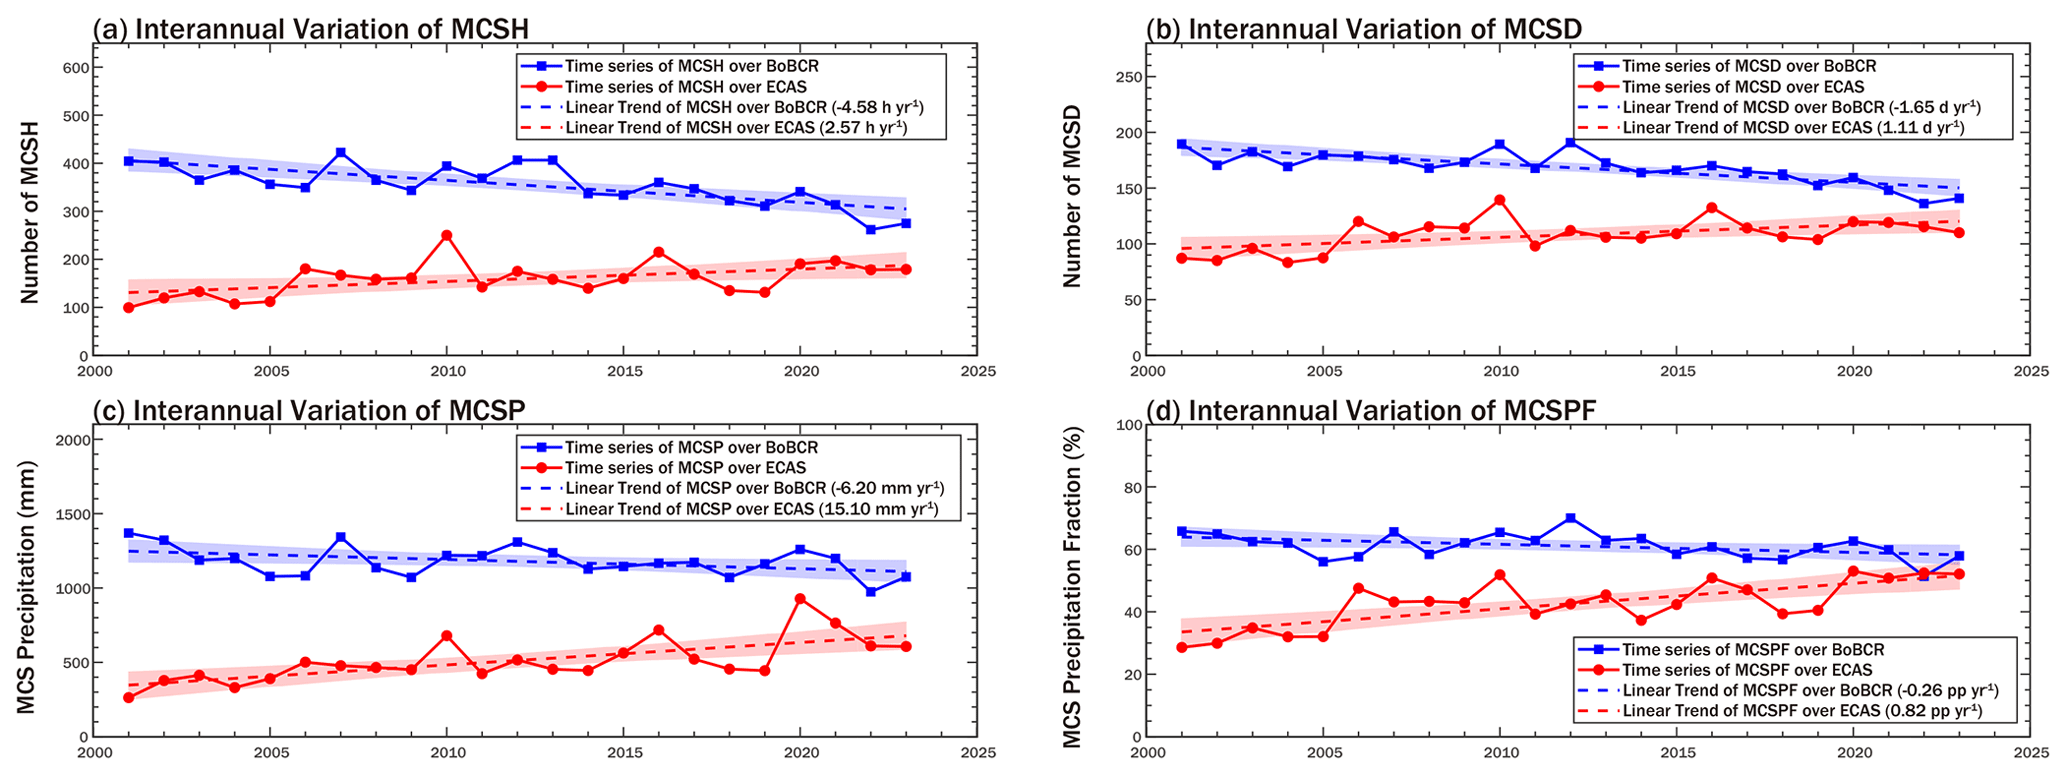
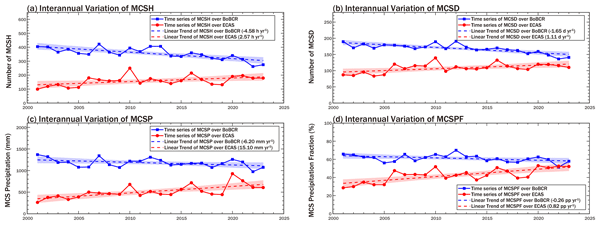
Figure 12Regional interannual variation of (a) MCSH, (b) MCSD, (c) MCSP, and (d) MCSPF in BoBCR and ECAS. The blue and red shading represent the confidence bands of the corresponding statistics in BoBCR and ECAS, respectively. The statistical significance exceeds the 95 % confidence level, as determined by a two-tailed Student's t-test.
3.4 Interannual trends in MCS activity and MCS-associated hazard events
The seasonal variation in the spatial pattern of P (HRE|MCS) highlights the strong linkage between MCS activity and large-scale atmospheric circulation. To further investigate the trends in MCS activity and their associated hazardous impacts under the influence of climate change, this study conducts a statistical analysis of the interannual variations in MCS activity and associated hazards. Due to the high uncertainty in hail and tornado records, including possible misreporting and omissions, their interannual variation is not addressed in this study. Linear trends are calculated at each spatial location, and the statistical significance of these trends is evaluated using two-tailed Student's t-tests. Particular attention is given to the regional mean trends over two key areas: the Bay of Bengal and its coastal region (BoBCR), and eastern China and its adjacent seas (ECAS).
Table 1Regional trends in MCS activity and associated hazards. Values outside parentheses are absolute annual trends, with the units shown expressed per year; values in parentheses indicate the ratio of the trend to the regional interannual mean, representing the relative magnitude of change. Blank cells indicate results that are not statistically significant or data are unavailable.


Figure 13Regional interannual variation of (a) MCS-HREs and (b) P (HRE|MCS) in BoBCR and ECAS. The blue and red shading represent the confidence bands of the corresponding statistics in BoBCR and ECAS, respectively. The statistical significance exceeds the 95 % confidence level, as determined by a two-tailed Student's t-test, except for MCS-HREs in BoBCR (gray solid line, dashed line, and shading).
3.4.1 Interannual variation of MCS activity
Figure 9 presents the interannual trends in MCS activity from 2001 to 2023. To visually illustrate the magnitude of changes, the Fig. 9 shows the ratio of the trend line slope to the local annual mean at each grid point, except for MCSPF (Fig. 9d). Overall, the four metrics exhibit a broadly consistent spatial pattern in trend direction: statistically significant decreases are observed across central the AMR study domain – from western China to the Bay of Bengal – while significant increases occur over ECAS. Specifically, over the central AMR study domain, MCSH and MCSD exhibit large contiguous areas with statistically significant decreasing trends, with annual decline rates ranging from 1 % to 5.5 % for MCSH and 1 % to 2.5 % for MCSD. Although the two MCS-related precipitation indicators, MCSP and MCSPF, also exhibit notable decreasing trends in this region, the areas with statistical significance are more spatially scattered, suggesting that the overall trends in MCS-related precipitation are less robust. In certain parts of the Bay of Bengal, MCSP shows annual decreases exceeding 1 %, while MCSPF declines by approximately 1 percentage point per year (pp yr−1) on average. In particular, over Bangladesh and northeastern India, MCS activity shows a spatially coherent and significant decreasing trend, whereas decreases in MCSP and MCSPF are more spatially scattered, indicating that the decline in MCS activity is not accompanied by a proportional decrease in MCS-related precipitation impacts and may reflect regional differences in precipitation efficiency. In contrast, ECAS exhibit increasing trends in both MCSH and MCSD, with growth rates of approximately 1 % to 3 % for MCSH and 1 % to 2 % for MCSD. Notably, MCSP and MCSPF of ECAS show statistically significant increases across broad areas, with MCSP rising by approximately 2 % to 7 %, and MCSPF increasing by about 0.5 to 2 pp yr−1.

Figure 14Regional interannual variation of (a) MCS-SWEs and (b) P (SWE|MCS) in ECAS. The red shading represents the confidence bands of the corresponding statistics in ECAS. The statistical significance exceeds the 95 % confidence level, as determined by a two-tailed Student's t-test.
On the seasonal scale, the overall spatial distribution of interannual trends in MCS activity is broadly consistent with the annual results, with the main differences occurring in the spatial extent of areas with statistically significant trends (Fig. S8). It should be noted that, as mentioned in Sect. 3.2, the Tb-based identification method may overestimate MCS activity over the Tibetan Plateau and may further affect the estimation of MCS activity trends in this region. Therefore, given the sensitivity of trend estimates to MCS identification methods (Guo et al., 2023) and the conflicting findings in previous literature (Guo et al., 2023; Mai et al., 2021), the results of trend analysis for MCS activity and MCS-related weather hazards over the Tibetan Plateau and western China should be interpreted with caution.
3.4.2 Interannual variation of MCS-related hazard
Based on the annual number of MCS-HREs and MCS-SWEs at each location, we investigated their interannual variations. Due to differences in data coverage periods, the trend analysis for MCS-HRE is conducted over 2001–2023, while that for MCS-SWE is based on the period 2008–2022.
Figure 10a illustrates the interannual variation in the number of MCS-HREs, directly reflecting the trend in MCS-HRE occurrences. While no clear overall trend is observed over the Bay of Bengal, certain localized areas within the Himalayan foothills exhibit annual increases of up to 0.8 d. In eastern China, a relatively clear increasing trend is evident, with annual increases of 0.1 to 0.3 d in statistically significant areas.
Since changes in MCS-HRE occurrences are jointly influenced by variations in both MCS activity and the likelihood of HRE occurrence under MCS conditions, the trends in P (HRE|MCS) are further examined as an indicator of changes in MCS-related heavy-rainfall potential (Fig. 10b). Over the Bay of Bengal, although MCS activity shows a decreasing trend, many areas exhibit an increasing trend in P (HRE|MCS), indicating that the likelihood of HRE occurrence under MCS conditions is increasing in localized regions. In eastern China, P (HRE|MCS) exhibits an increasing trend, with statistically significant areas appearing more continuous and extensive than those over the Bay of Bengal. The simultaneous increase in both MCS activity and P (HRE|MCS) has ultimately led to a pronounced rise in MCS-HRE occurrences in this region.
Following the analysis of the interannual variation in MCS-HREs, a similar approach is used to assess the trends in MCS-SWEs. Figure 11 presents the trends in the annual number of MCS-SWEs and P (SWE|MCS) at meteorological stations across the Chinese mainland. The dots represent the locations of meteorological stations, with color intensity indicating the magnitude of the trend. Stations that do not pass the significance test are not shown in the figure. In eastern China, more stations exhibit increasing trends, generally ranging from 0.1 to 0.5 d yr−1, with a few stations in the northeast reaching increases of over 1 d (Fig. 11a). A small number of stations show decreasing trends, mostly below 0.5 d. In contrast, western China shows the opposite pattern, with most stations exhibiting decreasing trends, many of which exceed 1.5 d yr−1. The spatial distribution of trends in P (SWE|MCS) (Fig. 11b) closely resembles that of MCS-SWE frequency (Fig. 11a), with significant increases observed in eastern China and notable decreases in the west. The concurrent rise in MCS activity and the risk of strong winds associated with MCSs has ultimately contributed to the increased frequency of MCS-SWE occurrences in this region.
3.4.3 Regional interannual variation in MCS activity and MCS-associated hazard
To further investigate the regional characteristics of trends in MCS activity and related hazard, this study conducts a statistical analysis in two regions: BoBCR (15–31° N, 83–100° E) and ECAS (27–40° N, 112–125° E). The delineated boundaries of these regions are illustrated in Fig. 9a. Trends of each metric for the two regions are shown in Table 1, excluding cases that fail the 95 % significance test or have unavailable data.
As shown in Fig. 12, the long-term regional mean values of MCSH, MCSD, MCSP and MCSPF are calculated, along with their respective annual trends, all of which are statistically significant at the 95 % confidence level based on the Student's t-test. The overall regional trends align with the spatial patterns observed in the gridded trend maps, with MCS activity decreasing in BoBCR and increasing in ECAS. For example, in BoBCR, MCSD decreases by 1.65 d annually (representing an annual decline of 0.98 % relative to the regional mean), whereas in ECAS it increases by 1.11 d (1.03 %). Moreover, since MCSPF reflects the relative contribution of MCSs to the regional water vapor cycle, its trends further underscore the shifting role of MCSs: MCSPF in BoBCR decreases by 0.26 pp yr−1, whereas in ECAS it increases by 0.82 pp yr−1, suggesting that MCSs play an increasingly important role in the regional moisture cycle over ECAS.
For the overall regional trends in MCS-HREs (Fig. 13), all results pass the 95 % confidence level based on the Student's t-test, except for the number of MCS-HREs over BoBCR. In both BoBCR and ECAS, P (HRE|MCS) shows a marked increasing trend; in particular, over ECAS, P (HRE|MCS) increases by 0.065 pp yr−1, equivalent to an average annual relative increase of 2.77 % in the probability of HRE occurrence under MCS conditions. In BoBCR, P (HRE|MCS) increases by about 1 % yr−1, indicating a gradual intensification of MCS-related heavy-rainfall potential. At the same time, declining MCS activity offsets the effect of the increase in P (HRE|MCS), resulting in no significant trend in MCS-HRE occurrences in BoBCR.
A similar analysis is conducted to assess their regional trends in the mean MCS-SWEs across meteorological stations and P (SWE|MCS) in ECAS during 2008–2022 (Fig. 14). Both MCS-SWE frequency and P (SWE|MCS) exhibit significant increasing trends, passing the 95 % confidence level based on the Student's t-test. The regional mean annual increase in MCS-SWE frequency is 0.072 d, while P (SWE|MCS) rises by an average of 0.060 pp yr−1, equivalent to an average annual relative increase of 3.11 % in the probability of SWE occurrence under MCS conditions. These results indicate that the influence of MCSs on SWEs in ECAS has been gradually intensifying.
To assess the sensitivity of the results to MCS identification thresholds, we compared the interannual trends of the key metrics listed in Table 1 across ECAS among MCS databases constructed using different threshold settings. The results (Figs. S2–S3 and Tables S1–S2) indicate that the increasing trends identified in this study are generally robust to the choice of MCS identification thresholds: although the trend magnitudes differ among threshold settings, all metrics consistently show positive trends. In addition, MCSs with lower cloud-top temperatures and longer durations tend to show stronger increasing trends in their precipitation impacts.
Based on the globally merged IR Tb data, this study establishes an MCS database spanning 2001–2023 over the AMR study domain (15–45° N, 70–125° E), which encompasses a major subtropical-to-midlatitude continental sector of the AMR and its adjacent seas. Using this database together with ground meteorological station records, hail and tornado records from the Chinese mainland, as well as IMERG Final Precipitation V07 data, this study investigates the spatial distributions and long-term changes in MCS activity and MCS-related severe weather hazards within the AMR study domain. The results primarily apply to the AMR study domain, while providing regional evidence for understanding the spatiotemporal variability of both MCS activity and MCS-related weather hazards across the broader AMR.
The separate analyses indicate that the relationships between MCSs and different hazard types exhibit distinct characteristics. Heavy rainfall shows a particularly close relationship with MCSs, whereas severe wind exhibits greater spatial heterogeneity, and the results for hail and tornadoes are subject to greater uncertainty due to reporting biases and spatial aggregation. MCS-HREs predominantly occur along coastlines and windward mountain slopes, with the Bay of Bengal coast experiencing far more frequent events than the South China Sea coast. Inland areas generally show high MCS-HRE fractions, often exceeding 70 %, whereas oceanic regions – particularly the South China Sea – exhibit lower fractions. P (HRE|MCS) is highest along coastal regions and areas of orographic uplift, especially around the Bay of Bengal. Meanwhile, P (HRE|MCS) displays strong seasonal variation, with warm-season dominance and a marked southward retreat in the cold season. MCS-SWEs account for nearly half of all recorded SWEs across China, with marked spatial variability. Northern and western China exhibit high P (SWE|MCS) values – often above 10 % – while southeastern China shows much lower probabilities, despite a high fraction of SWEs associated with MCSs. Relatively high values of P (SWE|MCS) are observed in areas with pronounced topographic transitions, such as mountainous margins or complex coastlines. A large fraction of severe convective weather events recorded across China occur on MCSDs under the spatiotemporal matching criterion used in this study. Approximately 82 % of hail days and 72 % of tornado days co-occur with MCS activity. Hail days are concentrated along pronounced topographic transition zones, where P (Hail|MCS) ranges from 3 % to 14 %, depending on the local area. In contrast, tornado days show a more scattered spatial distribution, with P (Tornado|MCS) reaching approximately 0.6 %–1.2 % in tornado-prone areas.
The trends of MCS activity in the AMR study domain showed a clear regional contrast, with statistically significant declines extending from western China to the Bay of Bengal and marked increases over ECAS from 2001 to 2023. In BoBCR, despite the decreasing trend in MCS activity, P (HRE|MCS) increased at an average annual rate of 1.00 %, indicating an increasing likelihood of HRE occurrence during MCSs. In ECAS, P (HRE|MCS) and P (SWE|MCS) have been increasing at average annual rates of 2.77 % (2001–2023) and 3.11 % (2008–2022), respectively, indicating that the combined growth of the MCS activity and associated hazard potential has increased the likelihood of MCS-related heavy-rainfall and strong-wind hazards in this region.
The approach adopted in this study to assess associations between MCSs and different types of weather-related hazards (Sect. 2.2.4) is relatively simplified, which may result in an overestimation of these associations. The potential influence of such bias – or, more generally, differences in statistical criteria – on the overall trend estimates of MCS-related hazard occurrence and P (Hazard|MCS) remains to be further investigated. Meanwhile, with advancements in observational technologies, including diversified methods such as high-resolution radar networks, the integration of satellite remote sensing data, and improvements in the density and accuracy of ground-based meteorological station networks, the associations between MCSs and various natural hazards are expected to be better elucidated. These efforts are crucial for deepening our understanding of the hazardous characteristics of MCSs and enhancing quantitative assessments of their impacts, ultimately supporting more effective disaster prevention and mitigation strategies.
The globally merged IR brightness temperature data (https://doi.org/10.5067/P4HZB9N27EKU, Janowiak et al., 2017) and the IMERG Final Precipitation V07 data (https://doi.org/10.5067/GPM/IMERG/3B-HH/07, Huffman et al., 2023) are obtained from the NASA Goddard Earth Sciences Data and Information Services Center. The surface meteorological observations are obtained from the National Meteorological Information Center of the China Meteorological Administration. The reports of hail and tornadoes are obtained from the Yearbook of Meteorological Disasters in China (Song, 2022) published by CMA. The radar reflectivity images from 2009 to 2015 are obtained from the Hong Kong Observatory (Shi et al., 2017). Access to the dataset requires the submission of a data application form to HKO (swirls@hko.gov.hk), after which the files can be downloaded. The MCS database developed in this study (Duan et al., 2025) is openly accessible at Zenodo (https://doi.org/10.5281/zenodo.17131300).
The supplement related to this article is available online at https://doi.org/10.5194/nhess-26-5691-2026-supplement.
JF: Writing – original draft, data curation, formal analysis, investigation, methodology, validation, visualization. ZD: writing – review and editing, conceptualization, funding acquisition, project administration, resources, supervision. JY: data curation.
The contact author has declared that none of the authors has any competing interests.
Publisher's note: Copernicus Publications remains neutral with regard to jurisdictional claims made in the text, published maps, institutional affiliations, or any other geographical representation in this paper. The authors bear the ultimate responsibility for providing appropriate place names. Views expressed in the text are those of the authors and do not necessarily reflect the views of the publisher.
This research was supported by National Key Research and Development Program of China (grant no. 2023YFC3805203), Guangdong Provincial Key Laboratory of Intelligent and Resilient Structures for Civil Engineering (grant no. 2023B1212010004), Shenzhen Natural Science Foundation (grant no. JCYJ20240813110504007). We acknowledge the NASA Goddard Earth Sciences Data and Information Services Center for providing open access to the globally merged IR brightness temperature data and precipitation data. We also acknowledge the China Meteorological Administration for making surface meteorological station data publicly available and for compiling and publishing the Yearbook of Meteorological Disasters in China. We are grateful to the Hong Kong Observatory for providing open access to radar echo data. We further extend our sincere thanks to Prof. Yi Deng and Mr. Yuehua Peng for their constructive suggestions and valuable assistance on this study.
This research has been supported by the National Key Research and Development Program of China (grant no. 2023YFC3805203), the Guangdong Provincial Key Laboratory of Intelligent and Resilient Structures for Civil Engineering (grant no. 2023B1212010004), and the Shenzhen Natural Science Foundation (grant no. JCYJ20240813110504007).
This paper was edited by Ankit Agarwal and reviewed by three anonymous referees.
Chen, D., Guo, J., Yao, D., Lin, Y., Zhao, C., Min, M., Xu, H., Liu, L., Huang, X., Chen, T., and Zhai, P.: Mesoscale convective systems in the Asian monsoon region from advanced Himawari imager: algorithms and preliminary results, J. Geophys. Res.-Atmos., 124, 2210–2234, https://doi.org/10.1029/2018JD029707, 2019.
Chen, D., Guo, J., Yao, D., Feng, Z., and Lin, Y.: Elucidating the life cycle of warm-season mesoscale convective systems in eastern China from the Himawari-8 geostationary satellite, Remote Sens., 12, 2307, https://doi.org/10.3390/rs12142307, 2020.
Chen, X., Leung, L. R., Feng, Z., Song, F., and Yang, Q.: Mesoscale convective systems dominate the energetics of the south Asian summer monsoon onset, Geophys. Res. Lett., 48, e2021GL094873, https://doi.org/10.1029/2021GL094873, 2021.
Cheng, T. F., Dong, Q., Dai, L., and Lu, M.: A dual regime of mesoscale convective systems in the east Asian monsoon annual cycle, J. Geophys. Res.-Atmos., 127, e2022JD036523, https://doi.org/10.1029/2022JD036523, 2022.
Coniglio, M. C., Hwang, J. Y., and Stensrud, D. J.: Environmental factors in the upscale growth and longevity of MCSs derived from rapid update cycle analyses, Mon. Weather Rev., 138, 3514–3539, https://doi.org/10.1175/2010MWR3233.1, 2010.
Davies-Jones, R.: A review of supercell and tornado dynamics, Atmos. Res., 158–159, 274–291, https://doi.org/10.1016/j.atmosres.2014.04.007, 2015.
Dong, Q., Cheng, T. F., Dai, L., and Lu, M.: A 20-year database of MCSs in eastern China, Zenodo [data set], https://doi.org/10.5281/zenodo.6534163, 2022.
Duan, Z. D., Feng, J., and Yang, J.: A database of MCSs over the Asian monsoon region (2001∼2023), Zenodo [data set], https://doi.org/10.5281/zenodo.17131300, 2025.
Durkee, J. D. and Mote, T. L.: A climatology of warm-season mesoscale convective complexes in subtropical South America, Int. J. Climatol., 30, 418–431, https://doi.org/10.1002/joc.1893, 2010.
Feng, Z., Leung, L. R., Hagos, S., Houze, R. A., Burleyson, C. D., and Balaguru, K.: More frequent intense and long-lived storms dominate the springtime trend in central US rainfall, Nat. Commun., 7, 13429, https://doi.org/10.1038/ncomms13429, 2016.
Feng, Z., Leung, L. R., Houze, R. A., Hagos, S., Hardin, J., Yang, Q., Han, B., and Fan, J.: Structure and evolution of mesoscale convective systems: sensitivity to cloud microphysics in convection-permitting simulations over the United States, J. Adv. Model. Earth Syst., 10, 1470–1494, https://doi.org/10.1029/2018MS001305, 2018.
Feng, Z., Houze, R. A., Leung, L. R., Song, F., Hardin, J. C., Wang, J., Gustafson, W. I., and Homeyer, C. R.: Spatiotemporal characteristics and large-scale environments of mesoscale convective systems east of the Rocky Mountains, J. Clim., 32, 7303–7328, https://doi.org/10.1175/JCLI-D-19-0137.1, 2019.
Feng, Z., Leung, L. R., Liu, N., Wang, J., Houze, R. A., Li, J., Hardin, J. C., Chen, D., and Guo, J.: A global high-resolution mesoscale convective system database using satellite-derived cloud tops, surface precipitation, and tracking, J. Geophys. Res.-Atmos., 126, e2020JD034202, https://doi.org/10.1029/2020JD034202, 2021.
Fiolleau, T. and Roca, R.: An algorithm for the detection and tracking of tropical mesoscale convective systems using infrared images from geostationary satellite, IEEE Trans. Geosci. Remote Sens., 51, 4302–4315, https://doi.org/10.1109/TGRS.2012.2227762, 2013.
Fritsch, J., Kane, R., and Chelius, C.: The contribution of mesoscale convective weather systems to the warm-season precipitation in the United States, J. Appl. Meteorol. Climatol., 25, 1333–1345, https://doi.org/10.1175/1520-0450(1986)025<1333:TCOMCW>2.0.CO;2, 1986.
Gahtan, J., Knapp, K. R., Schreck, C. J., Diamond, H. J., Kossin, J. P., and Kruk, M. C.: International best track archive for climate stewardship (IBTrACS) project, version 4r01, NOAA National Centers for Environmental Information, https://doi.org/10.25921/82ty-9e16, 2024.
Guo, Y., Fu, Q., Leung, L. R., Na, Y., and Lu, R.: Trends in warm season mesoscale convective systems over Asia in 2001–2020, J. Geophys. Res.-Atmos., 128, e2023JD038969, https://doi.org/10.1029/2023JD038969, 2023.
Haberlie, A. M. and Ashley, W. S.: A radar-based climatology of mesoscale convective systems in the United States, J. Clim., 32, 1591–1606, https://doi.org/10.1175/JCLI-D-18-0559.1, 2019.
He, Z., Zhang, Q., and Sun, J.: The contribution of mesoscale convective systems to intense hourly precipitation events during the warm seasons over central east China, Adv. Atmos. Sci., 33, 1233–1239, https://doi.org/10.1007/s00376-016-6034-x, 2016.
Hong, B. and Zhang, J.: Long-term trends of sea surface wind in the northern South China sea under the background of climate change, J. Mar. Sci. Eng., 9, 752, https://doi.org/10.3390/jmse9070752, 2021.
Houze, R. A.: Mesoscale organization of springtime rainstorms in Oklahoma, Mon. Weather Rev., 118, 613–654, https://doi.org/10.1175/1520-0493(1990)118<0613:MOOSRI>2.0.CO;2, 1990.
Houze, R. A.: 100 years of research on mesoscale convective systems, Meteor. Mon., 59, 11–17, https://doi.org/10.1175/AMSMONOGRAPHS-D-18-0001.1, 2018.
Hu, H., Leung, L. R., and Feng, Z.: Understanding the distinct impacts of MCS and non-MCS rainfall on the surface water balance in the central United States using a numerical water-tagging technique, J. Hydrometeorol., 21, 2343–2357, https://doi.org/10.1175/JHM-D-20-0081.1, 2020.
Hu, L., Deng, D., Gao, S., and Xu, X.: The seasonal variation of Tibetan convective systems: satellite observation, J. Geophys. Res.-Atmos., 121, 5512–5525, https://doi.org/10.1002/2015JD024390, 2016.
Huang, X., Hu, C., Huang, X., Chu, Y., Tseng, Y., Zhang, G. J., and Lin, Y.: A long-term tropical mesoscale convective systems dataset based on a novel objective automatic tracking algorithm, Clim. Dyn., 51, 3145–3159, https://doi.org/10.1007/s00382-018-4071-0, 2018.
Huffman, G. J., Stocker, E. F., Bolvin, D. T., Nelkin, E. J., and Tan, J.: GPM IMERG Final Precipitation L3 Half Hourly 0.1 degree × 0.1 degree V07, Greenbelt, MD, Goddard Earth Sciences Data and Information Services Center (GES DISC) [data set], https://doi.org/10.5067/GPM/IMERG/3B-HH/07, 2023.
Janowiak, J., Joyce, B., and Xie, P.: NCEP/CPC L3 Half Hourly 4km Global (60S–60N) Merged IR V1, edited by: Savtchenko, A., Greenbelt, MD, Goddard Earth Sciences Data and Information Services Center (GES DISC) [data set], https://doi.org/10.5067/P4HZB9N27EKU, 2017.
Jirak, I. L., Cotton, W. R., and Mcanelly, R. L.: Satellite and radar survey of mesoscale convective system development, Mon. Weather Rev., 131, 2428–2449, https://doi.org/10.1175/1520-0493(2003)131<2428:SARSOM>2.0.CO;2, 2003.
Kim, M. H., Lee, J., and Lee, S.: Hail: mechanisms, monitoring, forecasting, damages, financial compensation systems, and prevention, Atmosphere, 14, 1642, https://doi.org/10.3390/atmos14111642, 2023.
Knapp, K. R., Kruk, M. C., Levinson, D. H., Diamond, H. J., and Neumann, C. J.: The International Best Track Archive for Climate Stewardship (IBTrACS): Unifying tropical cyclone best track data, Bull. Amer. Meteorol. Soc., 91, 363–376, https://doi.org/10.1175/2009bams2755.1, 2010.
Kukulies, J.: Observing and modeling precipitation in the Tibetan Plateau region-from large-scale processes to convective storms, University of Gothenburg, Sweden, https://hdl.handle.net/2077/75117 (last access: 15 May 2025), 2023.
Kurosaki, Y. and Kimura, F.: Relationship between topography and daytime cloud activity around Tibetan Plateau, J. Meteorol. Soc. Jpn., 80, 1339–1355, https://doi.org/10.2151/jmsj.80.1339, 2002.
Li, T. and Ju, J. H.: Comparison of climate features between the southwest summer monsoon of the Bay of Bengal and the South China Sea summer monsoon, Chinese J. Geophys., 56, 27–37, https://doi.org/10.6038/cjg20130103, 2013 (in Chinese).
Li, P., Moseley, C., Prein, A. F., Chen, H., Li, J., Furtado, K., and Zhou, T.: Mesoscale convective system precipitation characteristics over east Asia. Part I: regional differences and seasonal variations, J. Clim., 33, 9271–9286, https://doi.org/10.1175/JCLI-D-20-0072.1, 2020.
Li, P., Song, F., Chen, H., Li, J., Prein, A. F., Zhang, W., Zhou, T., Zhuang, M., Furtado, K., Muetzelfeldt, M., Schiemann, R., and Li, C.: Intensification of mesoscale convective systems in the east Asian rainband over the past two decades, Geophys. Res. Lett., 50, e2023GL103595, https://doi.org/10.1029/2023GL103595, 2023.
Liu, N., Leung, L. R., and Feng, Z.: Global mesoscale convective system latent heating characteristics from GPM retrievals and an MCS tracking dataset, J. Clim., 34, 8599–8613, https://doi.org/10.1175/JCLI-D-20-0997.1, 2021.
Liu, W., Shi, N., and Wang, H.: Evolution of the Western North Pacific subtropical high and impact of Asian precipitation from spring to summer, Atmos. Res., 315, 107909, https://doi.org/10.1016/j.atmosres.2025.107909, 2025.
Lu, X., Yu, H., Ying, M., Zhao, B., Zhang, S., Lin, L., Bai, L., and Wan, R.: Western North Pacific tropical cyclone database created by the China Meteorological Administration, Adv. Atmos. Sci., 38, 690–699, https://doi.org/10.1007/s00376-020-0211-7, 2021.
Machado, L. A. T., Rossow, W. B., Guedes, R. L., and Walker, A. W.: Life cycle variations of mesoscale convective systems over the Americas, Mon. Weather Rev., 126, 1630–1654, https://doi.org/10.1175/1520-0493(1998)126<1630:LCVOMC>2.0.CO;2, 1998.
Maddox, R. A.: Mesoscale convective complexes, Bull. Amer. Meteorol. Soc., 1374–1387, https://www.jstor.org/stable/26221473 (last access: 15 May 2025), 1980.
Mai, Z., Fu, S., Sun, J., Hu, L., and Wang, X.: Key statistical characteristics of the mesoscale convective systems generated over the Tibetan Plateau and their relationship to precipitation and southwest vortices, Int. J. Climatol., 41, E875–E896, https://doi.org/10.1002/joc.6735, 2021.
Marshall, J. S., Langille, R. C., and Palmer, W. M. K.: Measurement of rainfall by radar, J. Atmos. Sci., 4, 186–192, https://doi.org/10.1175/1520-0469(1947)004<0186:MORBR>2.0.CO;2, 1947.
Meng, Y., Sun, J., Zhang, Y., and Fu, S.: A 10-year climatology of mesoscale convective systems and their synoptic circulations in the southwest mountain area of China, J. Hydrometeorol., 22, 23–41, https://doi.org/10.1175/JHM-D-20-0167.1, 2021.
Morel, C. and Senesi, S.: A climatology of mesoscale convective systems over Europe using satellite infrared imagery. I: methodology, Q. J. R. Meteorol. Soc., 128, 1953–1971, https://doi.org/10.1256/003590002320603485, 2002a.
Morel, C. and Senesi, S.: A climatology of mesoscale convective systems over Europe using satellite infrared imagery. II: characteristics of European mesoscale convective systems, Q. J. R. Meteorol. Soc., 128, 1973–1995, https://doi.org/10.1256/003590002320603494, 2002b.
Nastos, P. T. and Zerefos, C. S.: Decadal changes in extreme daily precipitation in Greece, Adv. Geosci., 16, 55–62, https://doi.org/10.5194/adgeo-16-55-2008, 2008.
Nekkali, Y. S. and Osuri, K. K.: Changes in the characteristics of mesoscale convective systems over the Indian monsoon region: Recent decadal variability, Theor. Appl. Climatol., 157, 463, https://doi.org/10.1007/s00704-026-06360-2, 2026.
Nesbitt, S. W., Cifelli, R., and Rutledge, S. A.: Storm morphology and rainfall characteristics of TRMM precipitation features, Mon. Weather Rev., 134, 2702–2721, https://doi.org/10.1175/MWR3200.1, 2006.
Oh, S., Park, J., Lee, S., and Suh, M.: Assessment of the RegCM4 over East asia and future precipitation change adapted to the RCP scenarios, J. Geophys. Res.-Atmos., 119, 2913–2927, https://doi.org/10.1002/2013JD020693, 2014.
Rickenbach, T. M.: Cloud-top evolution of tropical oceanic squall lines from radar reflectivity and infrared satellite data, Mon. Weather Rev., 127, 2951–2976, https://doi.org/10.1175/1520-0493(1999)127<2951:CTEOTO>2.0.CO;2, 1999.
Roca, R., Fiolleau, T., and Bouniol, D.: A simple model of the life cycle of mesoscale convective systems cloud shield in the tropics, J. Clim., 30, 4283–4298, https://doi.org/10.1175/JCLI-D-16-0556.1, 2017.
Schumacher, R. and Rasmussen, K.: The formation, character and changing nature of mesoscale convective systems, Nat. Rev. Earth Environ., 1, 300–314, https://doi.org/10.1038/s43017-020-0057-7, 2020.
Shi, X., Gao, Z., Lausen, L., Wang, H., Yeung, D., Wong, W., and Woo, W.: Deep learning for precipitation nowcasting: a benchmark and a new model, Adv. Neur. Inf., 30, 5617–5627, https://proceedings.neurips.cc/paper_files/paper/2017/hash/a6db4ed04f1621a119799fd3d7545d3d-Abstract.html (last access: 15 May 2025), 2017.
Smith, B. T., Thompson, R. L., Grams, J. S., Broyles, C., and Brooks, H. E.: Convective modes for significant severe thunderstorms in the contiguous United States. Part I: storm classification and climatology, Weather Forecast., 27, 1114–1135, https://doi.org/10.1175/WAF-D-11-00115.1, 2012.
Song, L. (Ed.): Yearbook of meteorological disasters in China (2004–2021), China Meteorological Press, Beijing, https://oversea.cnki.net/knavi/yearbooks/YQXZH/detail?language=ENG&uniplatform=OVERSEA (last access: 7 November 2026), 2022 (in Chinese).
Sun, Y., Solomon, S., Dai, A., and Portmann, R. W.: How often will it rain?, J. Clim., 20, 4801–4818, https://doi.org/10.1175/JCLI4263.1, 2007.
Taylor, C. M., Beluić, D., Guichard, F., Parker, D. J., Vischel, T., Bock, O., Harris, P. P., Janicot, S., Klein, C., and Panthou, G.: Frequency of extreme sahelian storms tripled since 1982 in satellite observations, Nature, 544, 475–478, https://doi.org/10.1038/nature22069, 2017.
Trenberth, K. E., Dai, A., Rasmussen, R. M., and Parsons, D. B.: The changing character of precipitation, Bull. Amer. Meteorol. Soc., 84, 1205–1217, https://doi.org/10.1175/bams-84-9-1205, 2003.
Valdés-Manzanilla, A.: A provisional climatology of the mesoscale convective systems in the Yucatan Peninsula in summer, Nat. Hazards, 110, 207–223, https://doi.org/10.1007/s11069-021-04943-y, 2022.
Vicente, G. A., Scofield, R. A., and Menzel, W. P.: The operational GOES infrared rainfall estimation technique, Bull. Amer. Meteorol. Soc., 79, 1883–1898, https://doi.org/10.1175/1520-0477(1998)079<1883:togire>2.0.co;2, 1998.
Wang, J., Fan, J., and Feng, Z.: Climatological occurrences of hail and tornadoes associated with mesoscale convective systems in the United States, Nat. Hazards Earth Syst. Sci., 23, 3823–3838, https://doi.org/10.5194/nhess-23-3823-2023, 2023.
Weber, B. L. and Wuertz, D. B.: Comparison of rawinsonde and wind profiler radar measurements, J. Atmos. Ocean. Technol., 7, 157–174,https://doi.org/10.1175/1520-0426(1990)007<0157:CORAWP>2.0.CO;2, 1990.
Yang, X., Fei, J., Huang, X., Cheng, X., Carvalho, L. M. V., and He, H.: Characteristics of mesoscale convective systems over China and its vicinity using geostationary satellite FY2, J. Clim., 28, 4890–4907, https://doi.org/10.1175/JCLI-D-14-00491.1, 2015.
Ying, M., Zhang, W., Yu, H., Lu, X., Feng, J., Fan, Y., Zhu, Y., and Chen, D.: An overview of the China Meteorological Administration tropical cyclone database, J. Atmos. Ocean. Technol., 31, 287–301, https://doi.org/10.1175/JTECH-D-12-00119.1, 2014.
You, Z. and Deng, Y.: A hierarchical dissection of multiscale forcing on the springtime mesoscale convective systems in the United States, J. Clim., 36, 39–54, https://doi.org/10.1175/JCLI-D-22-0150.1, 2023.
Zhang, X., Shen, W., Zhuge, X., Yang, S., Chen, Y., Wang, Y., Chen, T., and Zhang, S.: Statistical characteristics of mesoscale convective systems initiated over the Tibetan Plateau in summer by Fengyun satellite and precipitation estimates, Remote Sens., 13, 1652, https://doi.org/10.3390/rs13091652, 2021.