
the Creative Commons Attribution 4.0 License.
the Creative Commons Attribution 4.0 License.
 | 05 Nov 2026
From forecast to alert: an open-data AI flood early warning system with reservoir monitoring for the White Volta Basin
Joseph Junior Obeng
Hongyong Yuan
Tao Chen
Lida Huang

Flood early warning in the White Volta Basin of northern Ghana is complicated by unmonitored dam releases from Burkina Faso's Bagre Reservoir, which existing globally calibrated systems do not represent. We present an end-to-end AI-driven flood early warning system that integrates observed gauge discharge, CHIRPS satellite rainfall, ERA5-Land reanalysis forcing, and a novel JRC-derived Bagre reservoir storage proxy. An ensemble of Random Forest, XGBoost, and LSTM models trained on these inputs achieved Kling–Gupta Efficiency scores of 0.984, 0.974, and 0.957 at 1, 3, and 5 d lead times on an independent test period dominated by moderate flows (maximum 1206 m3 s−1, below the Orange alert threshold); higher-tier alert skill rests on leave-one-year-out cross-validation rather than held-out extreme events. Benchmarking against simple baselines shows the ensemble's advantage over a persistence forecast is marginal at 1 d lead but grows with lead time and concentrates on rising-limb and high-flow conditions, indicating that recent observed discharge carries most of the short-range skill while the ensemble's value lies at the longer horizons relevant to warning. For direct comparison, GloFAS v4 reanalysis discharge at Nawuni achieves KGE = −0.526 on the same test period, performing worse than a climatological mean predictor, primarily because LISFLOOD does not represent Bagre Dam release operations. A four-tier alert system calibrated to 30-year flood return periods achieved a cross-validated Red-tier probability of detection of 0.902 (false alarm ratio 0.134) at 1 d lead, declining to 0.762 at 5 d. Sentinel-1 SAR mapping provided spatial grounding for the discharge-based threshold framework, with Red-tier exceedance periods associated with floodplain inundation extents of 50 to 149 km2 across three validation seasons. The system integrates into Ghana's existing myDEWETRA-VOLTALARM platform without requiring new institutional infrastructure. The Bagre reservoir proxy, derived from freely available JRC Global Surface Water imagery and validated against independent satellite altimetry (r = 0.94), provides a measure of reservoir state. Because the reservoir fills to capacity in most wet seasons, this signal functions as an explicit model input and as seasonal situational awareness that the reservoir is capable of spilling, rather than as a standalone flood trigger.
- Article
(3269 KB) - Full-text XML
- BibTeX
- EndNote


Floods are among the most frequent and damaging natural hazards in West Africa, and flood-related fatalities and economic losses across the continent have risen sharply over the past half-century (Di Baldassarre et al., 2010). Across the region, a statistically significant upward trajectory in flood frequency has been documented over recent decades, with event rates exceeding 0.50 additional floods per year in parts of the Volta Basin (Ilori and Adeyewa, 2025). Ghana sits near the centre of this pattern. The White Volta Basin in the country's north experiences annual inundation that regularly destroys crops, displaces communities, and kills livestock (Katsekpor et al., 2025a), yet the timing and severity of the worst events are often determined not by local rainfall but by operational decisions made across an international border, at Burkina Faso's Bagre Dam.
The Bagre Reservoir was constructed primarily for irrigation and hydroelectric generation, but its releases during high-storage periods can send flood pulses downstream into Ghana, typically within two to three days (Katsekpor et al., 2025a). Communities in the Central Gonja and Savannah districts have developed a deep familiarity with this dynamic over generations, but formal early warning systems have yet to integrate it. The myDEWETRA-VOLTALARM platform, deployed in the White Volta Basin through a partnership between Ghanaian agencies and the Italian Civil Protection Department, issues 5 d probabilistic flood forecasts using GloFAS global model output, a system not calibrated to local conditions and without explicit representation of Bagre reservoir state (Katsekpor et al., 2025a). As a consequence, warnings can arrive too late, cover the wrong locations, or fail to differentiate between a locally driven rainfall event and a Bagre-release flood that demands a categorically different response.
The literature on machine learning for hydrological forecasting has expanded rapidly over the past decade. Long Short-Term Memory networks have demonstrated strong skill for streamflow prediction in both gauged and ungauged basins, in some settings outperforming process-based models when trained on sufficiently large datasets (Kratzert et al., 2018). Hybrid and ensemble combinations of deep learning with gradient-boosted trees have been used to improve streamflow and extreme-flow prediction, the operationally critical capability for a flood warning system (Solanki et al., 2025). In the White Volta Basin itself, Katsekpor et al. (2025b) demonstrated that LSTM and Random Forest models trained on CHIRPS rainfall and ERA5 reanalysis data can predict discharge at 1, 5, and 10 d intervals with high skill, establishing the methodological precedent for the present study. At global scale, Nearing et al. (2024) showed that AI-based systems can match the accuracy of next-day GloFAS nowcasts at 5 d lead time in ungauged watersheds, a finding that suggests locally calibrated models with access to gauge data should perform substantially better still, provided the evaluation is conducted on a genuinely independent period.
Recent advances in deep learning for flood forecasting have moved well beyond tabular ensemble approaches. High-resolution spatiotemporal nowcasting architectures such as U-RNN (Cao et al., 2025) can produce urban inundation fields at fine spatial resolution, while neural operator frameworks including LarNO (Cao et al., 2026) and deep neural operator transfer learning approaches (Xu et al., 2025) have demonstrated zero-shot generalisation to ungauged conditions and rapid distributed flood simulation. Geometry-informed neural operators (Taghizadeh et al., 2026) extend this to domain-adaptive rapid forecasting, and graph neural network routing modules coupled to LSTM rainfall–runoff models (Mosaffa et al., 2026) have shown that spatially structured architectures can capture routing dynamics that tabular lag features approximate only imperfectly. These developments represent a genuine frontier in AI-based flood forecasting. The current study is positioned deliberately away from this frontier, for the task-specific reasons set out in Sect. 6.1.
What has not been demonstrated for the White Volta Basin, or, to our knowledge, for any comparable West African river system, is a complete end-to-end early warning system design that moves from satellite data ingestion through AI forecasting, calibrated threshold-based alert generation, satellite-derived inundation validation, and a concrete operational architecture compatible with Ghana's institutional infrastructure. The gap between a well-performing discharge prediction model and an operational flood warning system is substantial. It involves translating continuous discharge forecasts into discrete, actionable alert tiers; calibrating those tiers to return periods that are meaningful to emergency managers and communities; validating that threshold exceedances correspond to real inundation; and specifying how the alert output integrates with the existing institutional chain from national forecasting centre to at-risk household. Each of these steps requires deliberate design choices that go beyond model performance optimisation, and each is addressed in the present study.
This paper makes four specific contributions. First, it presents the first end-to-end flood early warning system design for the White Volta Basin that moves from multi-source data ingestion through AI-based discharge forecasting, return-period-calibrated alert generation, satellite inundation validation, and a concrete operational architecture compatible with Ghana's existing institutional infrastructure. Second, it incorporates Bagre reservoir upstream storage as an explicit model input and independent alert trigger, derived from freely available JRC Global Surface Water imagery, a variable that profoundly influences downstream flood risk but has been absent from all previous formal modelling work on this basin. Third, it provides the first direct comparison of a locally calibrated ensemble against GloFAS v4 reanalysis discharge at Nawuni, demonstrating that the absence of Bagre Dam release rules in LISFLOOD produces near-zero discharge simulations during observed flood events (KGE = −0.526). Fourth, it specifies an operational architecture that integrates directly into Ghana's existing myDEWETRA-VOLTALARM platform and NADMO dissemination chain, requiring no new institutional infrastructure.
The paper is structured as follows. Section 2 describes the study area and its flood climatology. Section 3 details the datasets and their seasonal characteristics. Section 4 presents the methods for feature engineering, ensemble modelling, alert threshold design, and Sentinel-1 validation. Section 5 reports results across all four components. Section 6 discusses performance, limitations, and operational implications. Section 7 concludes.
The White Volta River drains approximately 106 000 km2 across Burkina Faso and northern Ghana before converging with the Black Volta near Yapei to form the main Volta River (Katsekpor et al., 2025a). The basin's hydrology is governed by a single wet season running from roughly June to October, driven by the West African Monsoon, and is strongly modulated upstream by reservoir operations at the Bagre Dam in Burkina Faso. Our modelling domain is anchored to the Nawuni gauging station (9.7° N, 1.08° W), which captures the integrated discharge of the White Volta across a catchment of 92 950 km2 before it enters the Volta Reservoir. Nawuni is the most data-rich gauge in the system and has served as the primary monitoring point in previous machine learning studies of the basin (Katsekpor et al., 2025b). The spatial configuration of the basin, including the locations of the Nawuni gauge, the Bagre Dam, and the lower floodplain validation domain, is shown in Fig. 1.

Figure 1Study area map showing the White Volta Basin above the Nawuni gauging station (9.7° N, 1.08° W; catchment area 92 950 km2), the Bagre Dam in Burkina Faso, and the lower White Volta floodplain validation domain. The inset shows the location of Ghana in West Africa.
The climate across the basin follows a Sudano-Sahelian gradient, transitioning from dry sub-humid conditions in southern Ghana to semi-arid conditions in central Burkina Faso. Mean annual rainfall at Tamale, the principal city of northern Ghana, is approximately 1100 mm, concentrated almost entirely between May and October (Yamba et al., 2023). The basin experiences pronounced dry seasons from November to April, during which river discharge at Nawuni drops to below 40 m3 s−1 on average and the floodplain soils dry and crack. This strong seasonality gives the White Volta a distinctive flood climatology: peak discharges occur in August and September, when wet-season rainfall accumulation is greatest and antecedent soil moisture is at its highest. The historical maximum discharge recorded at Nawuni is 2279 m3 s−1, reached during the 2007 flood season, a year in which Bagre Dam releases compounded exceptionally heavy local rainfall to produce one of the most destructive flood events in the region's modern record.
The lower White Volta floodplain, the zone between Nawuni and the Volta Reservoir, is the study domain for inundation validation. This area encompasses the Central Gonja and Savannah districts, where the combination of flat terrain, shallow soils, and poor natural drainage infrastructure produces extensive seasonal inundation that can persist for several weeks following peak discharge. Rural livelihoods in this zone depend heavily on recession agriculture practised on flooded alluvial soils after water levels drop, making the timing and extent of inundation economically significant beyond the immediate flood damage. The districts are among Ghana's most food-insecure (Nkegbe et al., 2017), and flood losses, which regularly destroy standing crops, seed stocks, and livestock, can set communities back by multiple growing seasons.
Upstream, Bagre Dam sits approximately 180 km north of Nawuni, at the confluence of the White Volta and Sissili rivers in Burkina Faso. The reservoir, completed in the early 1990s, has a storage capacity of approximately 1.7 billion m3 and a surface area of about 255 km2 at normal operating level (Ouedraogo et al., 2024). The JRC-derived water extent used here as a storage proxy is larger and more variable, ranging from near zero in the dry season to about 3015 km2 in high-water years, because it captures inundation of the surrounding valley beyond the reservoir pool. The dam was built primarily to support irrigated agriculture and is one of Burkina Faso's largest reservoirs. Because its primary purpose is irrigation rather than flood control, release decisions are driven by storage management objectives rather than downstream flood risk considerations, and release events are not subject to any formal transboundary notification requirement (Obeng et al., 2026). Spillage events, when inflows exceed controlled release capacity, have been associated with some of the most destructive flood events on record in northern Ghana, including the catastrophic 2007 and 2010 events (Obeng et al., 2026). The reservoir operator does not have a formal real-time notification agreement with Ghana's hydrological authorities, though informal communication channels exist. This institutional gap is a central motivation for the present study: a monitoring protocol tied to JRC-observed reservoir extent can provide advance warning of impending high releases without requiring a bilateral agreement.
Ghana's institutional architecture for flood early warning is centred on three agencies. The Ghana Meteorological Agency (GMet) is responsible for weather and hydrological forecasting and currently operates the myDEWETRA-VOLTALARM platform, which produces 5 d flood forecasts for the White Volta Basin using GloFAS output and disseminates them through social media, SMS, and community radio. The Ghana Hydrological Authority (GHA) manages river gauging networks and maintains real-time discharge monitoring at key stations including Nawuni. The National Disaster Management Organisation (NADMO) is responsible for converting warnings into protective action, coordinating district-level response and managing the Community Disaster Volunteer network that forms the last link in the warning chain. The present study's operational architecture is designed to complement rather than replace this structure.
3.1 Streamflow
Daily mean discharge at the Nawuni gauge was obtained from the Global Runoff Data Centre (GRDC station 1531450), covering the period January 1975 to February 2007, a total of 10 477 daily records with an overall missing value rate of 10.8 %. Data quality is substantially better for the 1987–2006 period (less than 2 % missing), which forms the core of the modelling analysis. Years prior to 1987 carry higher data gaps but contribute to the flood frequency analysis. The record ends in February 2007.
3.2 Rainfall
Daily gridded precipitation was taken from the Climate Hazards Group InfraRed Precipitation with Stations (CHIRPS) version 2.0 product at 0.05° resolution (Funk et al., 2015). Catchment-averaged daily rainfall above the Nawuni gauge was extracted via Google Earth Engine, producing a continuous 14 205 d series spanning January 1985 to December 2023 with no missing values. The mean daily catchment rainfall is 2.44 mm, rising to monthly means above 10 mm d−1 during the peak wet season (July–August). Daily maxima reach 36.7 mm. CHIRPS blends satellite infrared estimates with gauge observations and has been validated in the region (Katsekpor et al., 2025b).
3.3 Atmospheric reanalysis
Daily 2 m air temperature, potential evapotranspiration and volumetric soil water content (0–7 cm) were obtained from ERA5-Land (Muñoz-Sabater et al., 2021), spatially averaged over the White Volta catchment for 1985–2023. Mean temperature is 32.7 °C, mean potential evapotranspiration 5.13 mm d−1 and mean surface soil moisture 0.214 m3 m−3, consistent with the semi-arid tropical climate of the sub-region.
3.4 Rainfall and discharge seasonality
Mean monthly discharge at Nawuni rises from a dry-season minimum of 37–57 m3 s−1 to a September peak of 1235 m3 s−1, a ratio of about 30:1. Catchment-mean daily rainfall correlates with same-day discharge at r = 0.35, rising to 0.58 for 7 d cumulative rainfall, reflecting the multi-day moisture accumulation that drives flood flows in this large semi-arid catchment. The full seasonal climatology of discharge, rainfall, temperature, evapotranspiration and soil moisture is shown in Fig. 2, with monthly discharge in panel (a), rainfall in panel (b), temperature and evapotranspiration in panel (c), soil moisture in panel (d), and inter-annual peak discharge by alert tier in panel (e).

Figure 2Seasonal hydro-climatic climatology of the White Volta Basin at Nawuni gauge. (a) Monthly discharge distribution (1975–2007, GRDC) showing the strong flood season peak in August–September. (b) CHIRPS catchment-averaged rainfall. (c) ERA5-Land temperature and evapotranspiration. (d) ERA5-Land surface soil moisture. (e) Inter-annual variability of annual peak discharge coloured by alert tier.
3.5 Bagre reservoir storage proxy
To represent upstream dam state as a model input, we extracted the monthly water surface extent of the Bagre Reservoir from the JRC Global Surface Water dataset version 1.4 (Pekel et al., 2016) using Google Earth Engine. The monthly time series covers March 1984 to January 2024, yielding 454 records. Reservoir extent reaches a maximum of 3015 km2 during high-storage years and falls to near zero in the dry season. Monthly values were linearly interpolated to a daily time step and normalised to a 0–1 scale relative to the historical maximum, yielding a dimensionless dam storage index. The full time series of reservoir extent, the normalised storage index, and the separation between flood and non-flood years are shown in Fig. 3, with monthly reservoir extent in panel (a), the normalised storage index and trigger threshold in panel (b), mean monthly extent by season in panel (c), and the annual-maximum index for flood versus non-flood years in panel (d).
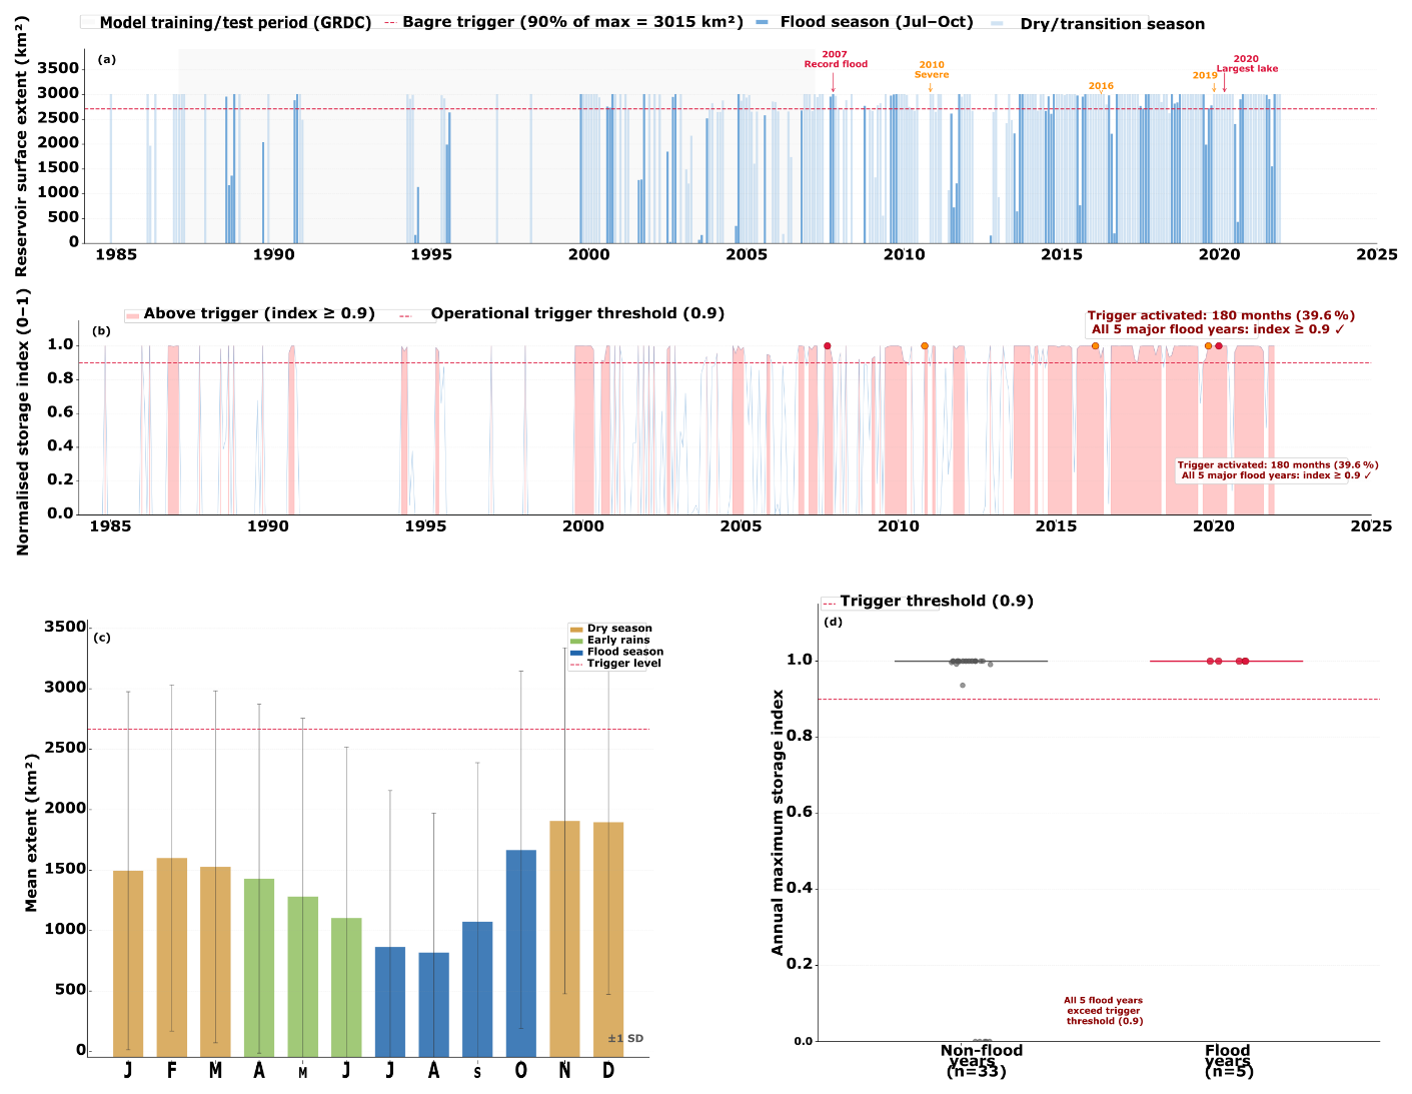
Figure 3Bagre reservoir storage proxy derived from the JRC Global Surface Water dataset (March 1984 to January 2024). (a) Monthly reservoir surface extent (km2) with major flood event years annotated. (b) Normalised storage index (0–1) showing periods when the independent Bagre trigger threshold (index ≥ 0.90) is exceeded. (c) Mean monthly Bagre extent by season. (d) Comparison of annual maximum storage index in flood years versus non-flood years.
3.6 Sentinel-1 SAR
Sentinel-1 SAR. C-band synthetic aperture radar imagery in Interferometric Wide Swath mode (VV polarisation) was used to map flood inundation for three validation events: 2016, 2019 and 2020. The number of valid acquisitions over the study domain ranges from 32 scenes in 2016 to 78 in 2019. The flood-mapping procedure is described in Sect. 4.4.
4.1 Feature Engineering and Data Splitting
The input feature set comprises 21 variables constructed from the five raw datasets. Lagged discharge features at 1, 2, 3, 5, 7, and 10 d capture the autoregressive memory of the river system. Three- and seven-day rolling mean discharge indices capture recent flow trends. Rainfall features include the raw daily value plus lags at 1–5 d and cumulative sums over 3 and 7 d windows, reflecting the progressively delayed runoff response to upstream rainfall in a large catchment. These are complemented by daily temperature, evapotranspiration, soil moisture, the daily Bagre storage index, and a 30 d rolling mean of that index. The 30 d Bagre mean captures sustained reservoir states that persist through multi-day forecast windows.
Correlation analysis on the training period confirms the physical plausibility of the feature set. The Pearson correlation between catchment-mean daily rainfall and same-day discharge is 0.35, rising to 0.58 for 7 d cumulative rainfall. The correlation between soil moisture and discharge is 0.67, reflecting the antecedent wetness effect on runoff generation, a finding consistent with the large, semi-arid catchment structure where moisture accumulation over several days on progressively wetter soils drives flood flows rather than individual rainfall events. All features were normalised to zero mean and unit standard deviation using statistics from the training period only, preventing leakage to validation or test periods. The discharge target was log-transformed for LSTM training to improve gradient stability, with back-transformation applied before all evaluation.
The dataset was divided into three non-overlapping periods using real GRDC observed discharge: training (January 1987 to December 1999; 4689 valid days), validation (January 2000 to December 2003; 1427 d), and test (January 2004 to February 2007; 1135 d). The 1987 training start reflects lower data quality before that date (up to 67 % missing in some years prior). The test period contains three flood seasons with peaks reaching at most 1206 m3 s−1, below the Orange alert threshold, which constrains the scope of independent evaluation for higher alert tiers.
Missing values in the GRDC discharge record (10.8 % overall; less than 2 % for the 1987–2006 core modelling period) were handled as follows. In feature construction, lag features and rolling means were computed using pandas with a minimum period requirement of one valid observation per window, so that individual missing days did not propagate gaps across the entire lag structure. Missing target values were excluded from model training entirely, no imputation was applied to the discharge target. In evaluation, the test period (January 2004 to February 2007) contains no missing GRDC observations, so performance metrics are computed on a complete record. The 20 d of mismatch between the 1155 extracted GloFAS days and the 1135 matched pairs in the benchmark comparison reflect missing GRDC values in the test period boundary months.
4.2 Ensemble Model Architecture
4.2.1 Random Forest
A Random Forest regressor was trained with 200 trees, maximum depth of 15, and minimum samples per leaf of 5, evaluated on the validation set before final test evaluation. Random Forest was included for its ability to capture nonlinear threshold relationships and its interpretable feature importance scores.
4.2.2 XGBoost
An Extreme Gradient Boosting model used 500 estimators, learning rate 0.05, maximum depth 6, and subsampling rates of 0.8. Early stopping with patience of 20 rounds was applied. XGBoost was included for its efficiency at inference time and consistently strong performance on structured tabular data.
4.2.3 LSTM
A two-layer Long Short-Term Memory network implemented in PyTorch with 64 hidden units in the first layer and 32 in the second, each with 20 % dropout. Input sequences span 30 d. The Adam optimiser with learning rate 0.001 was used with learning rate decay and early stopping at 15 epochs without improvement. The LSTM was included because sequence modelling captures multi-day hydrological patterns, monsoon ramp-up, soil saturation dynamics, and recession curves, that tabular lag features approximate but do not fully represent.
4.2.4 Ensemble
The final prediction at each lead time is the simple unweighted average of the three model outputs. Simple averaging was preferred over weighted ensembles for two reasons: the validation period is too short for stable weight estimation, and simple averaging performs comparably to or better than weighted schemes when component models have complementary error structures (Arsenault et al., 2014). Model performance is assessed using KGE, NSE, Pearson R, RMSE, and MAE at each lead time.
4.3 Alert Threshold Design
Discharge thresholds were derived by fitting a Log-Pearson Type III (LP3) distribution to the wet-season annual maximum discharge series at Nawuni. Only July–October data were used, retaining years with at least 60 observations in that window, yielding 30 complete wet seasons (1975–2006). This filtering prevents dry-season near-zero values from distorting the annual maximum series. The LP3 was fitted by the method of moments in log space, using the Wilson–Hilferty approximation for the frequency factor. The resulting skewness of −0.773 is consistent with a dam-regulated system where spillway constraints bound the upper tail of downstream peaks.
Alert skill was evaluated through leave-one-year-out (LOYO) cross-validation across the full 1987–2007 GRDC period. In each of 21 annual folds, the RF model was retrained on all years except the holdout year, predicted on the holdout, and predictions were pooled across folds before computing final contingency statistics. RF was selected as the LOYO evaluation model because its retraining cost is negligible compared with the LSTM, making 21-fold retraining computationally feasible, and because RF threshold-exceedance skill closely approximates that of the full ensemble at all lead times in the test period. This design ensures every evaluation observation is predicted by a model that was not trained on that year, directly addressing the circular evaluation concern that arises when a trained model is evaluated on its own training data. For each alert tier and lead time, we computed POD = TP (TP + FN), FAR = FP (TP + FP), CSI = TP (TP + FN + FP), and AUC from continuous predictions. The independent test period (2004–2007) is used as an additional lower-bound check for the Yellow tier, which has sufficient events (n = 10) in that window.
4.4 Sentinel-1 Inundation Validation
Sentinel-1 C-band SAR (IW mode, VV polarisation) imagery was processed in Google Earth Engine for the flood seasons of 2016, 2019, and 2020. Pre-flood reference backscatter was computed as the median of January–May acquisitions. Flood pixels were identified where wet-season backscatter fell more than 3 dB below the reference, a threshold established in previous Sentinel-1 flood mapping studies (Chini et al., 2019). A Height Above Nearest Drainage (HAND) mask derived from SRTM 30 m (Nobre et al., 2011) excluded pixels more than 15 m above the nearest drainage channel, and the JRC permanent water layer masked perennial water bodies. Sentinel-1 results are used exclusively for spatial validation; lead-time claims rest on the LOYO cross-validated ROC analysis.
4.5 Operational Architecture Design
The operational architecture was designed under three constraints: deployable within Ghana's existing institutional framework; compatible with the myDEWETRA-VOLTALARM platform; and requiring no capital investment beyond current GMet resources. The five layers cover data ingestion, AI forecasting, alert generation, institutional dissemination, and community warning delivery, with the Bagre Dam storage trigger embedded in the alert generation layer as an independent early-warning pathway.
5.1 Model Performance
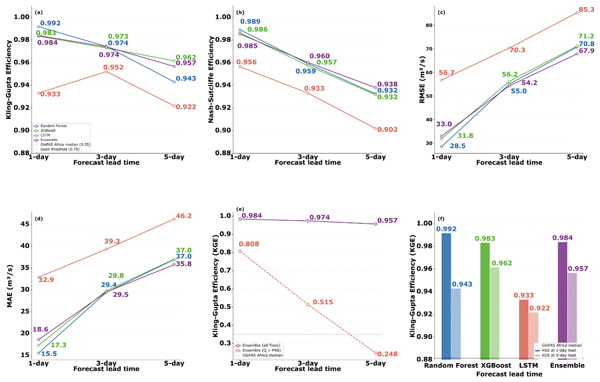
This subsection evaluates how closely the three models and their ensemble reproduce observed discharge on the independent test period, before any alert thresholds are applied. All three models achieve strong performance on the independent test set (January 2004 to February 2007, all GRDC observed discharge), with the ensemble consistently outperforming or matching the best individual component at every lead time (Table 1). At 1 d lead, Random Forest reaches a KGE of 0.992, the highest score of any individual model, while the ensemble achieves 0.984 with a root mean square error of 33.0 m3 s−1. The test period mean discharge is approximately 267 m3 s−1; the test period maximum is 1206 m3 s−1, which does not reach the Orange alert threshold (1362 m3 s−1). These constraints, a 3-year test window and the absence of extreme flood events within it, are important context for interpreting the performance metrics: the KGE, NSE, and RMSE values in Table 1 are evaluated on a period dominated by moderate to elevated flows, not on the basin's most severe events.
Table 1Performance of individual models and ensemble on the independent test set (January 2004–February 2007, GRDC observed discharge). KGE = Kling–Gupta Efficiency; NSE = Nash–Sutcliffe Efficiency; R = Pearson correlation; RMSE = root mean square error; MAE = mean absolute error.
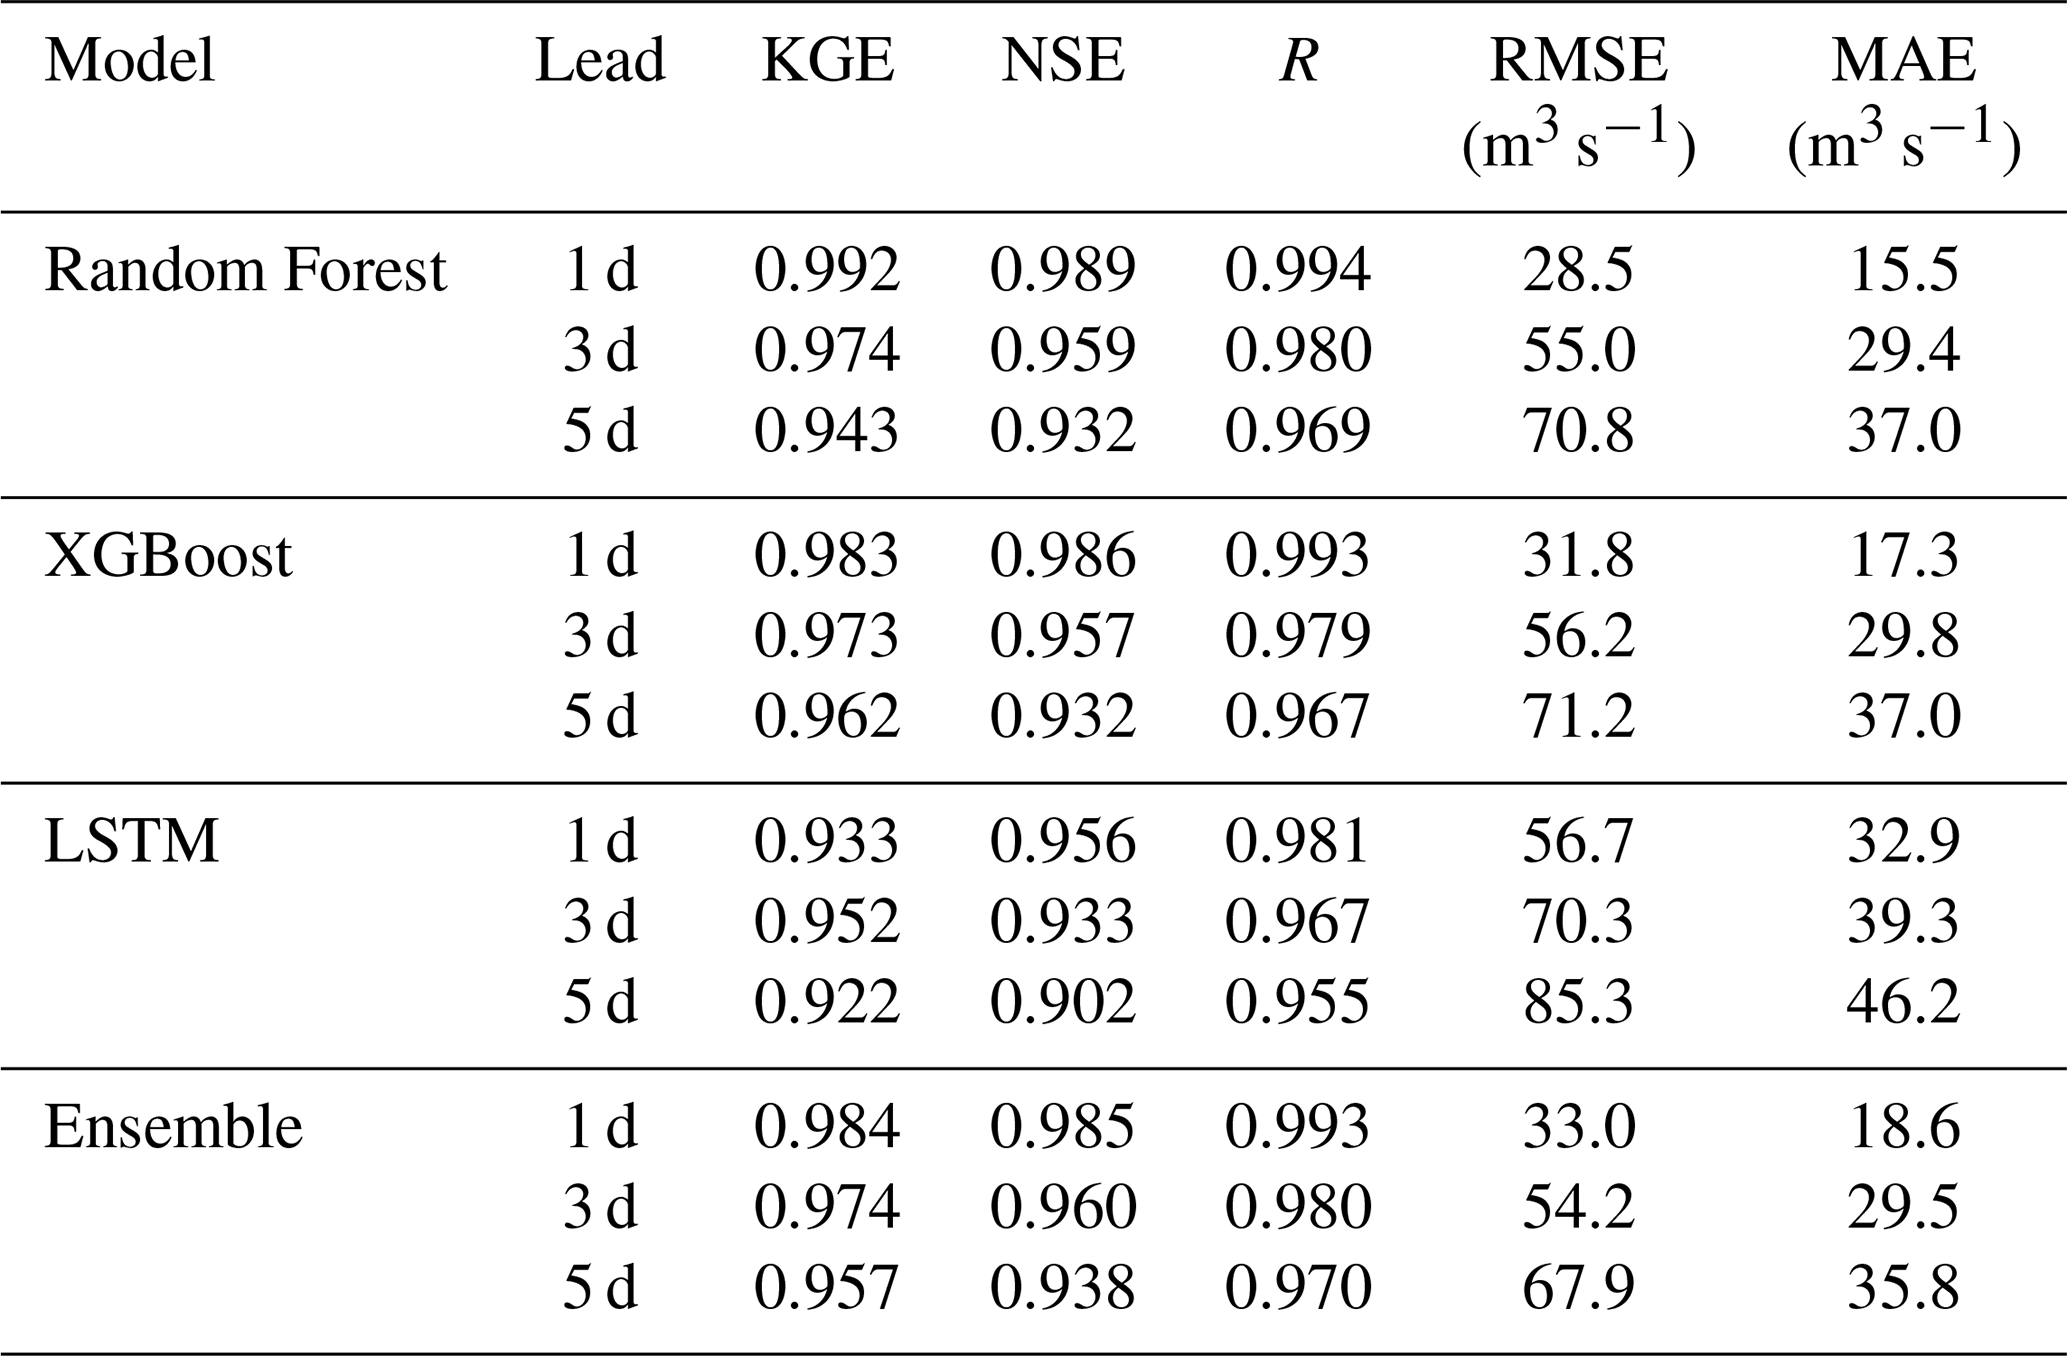
Performance degrades systematically with increasing lead time: the ensemble KGE drops from 0.984 at 1 d to 0.957 at 5 d, a reduction of just 0.027 across four additional forecast days, as illustrated across all four metrics in Fig. 4a–d, and f summarises the 1 and 5 d KGE for each model. Random Forest degrades most steeply (KGE 0.992 to 0.943), consistent with its reliance on tabular lag features that lose predictive power as lead time extends. XGBoost is the most consistent performer (KGE 0.983, 0.973, 0.962), while the LSTM, despite lower scores at 1 d lead (0.933), narrows the gap at 3 and 5 d (0.952, 0.922), reflecting the value of its 30 d sequence window at longer horizons. All models exceed NSE = 0.90 at every lead time, a threshold commonly used in the hydrological literature to denote a very good model fit (Moriasi et al., 2007).

Figure 4Model performance as a function of forecast lead time for all three individual models and the ensemble. Panels (a)–(d) show KGE, NSE, RMSE, and MAE respectively. Panel (e) compares ensemble skill on all flows versus extreme flows (Q > 872 m3 s−1, 90th percentile). Panel (f) summarises KGE at 1 and 5 d lead for each model. The GloFAS v2.1 African median benchmark (KGE ≈ 0.35; Harrigan et al., 2020) is shown for reference.
Feature importance analysis of the 1 d Random Forest model (Fig. 5a) reveals that 3 d rolling mean discharge accounts for 86.0 % of total Gini importance, with 1 d lagged discharge contributing a further 13.2 %. The remaining 19 features, including the Bagre storage index, CHIRPS rainfall, soil moisture, and temperature, contribute less than 2 % collectively. This dominance of recent discharge in tree-based importance reflects the strong autoregressive signal at short lead times rather than the irrelevance of other inputs; the shift in these importances across lead times is shown in Fig. 5b. A formal benchmark against persistence, climatology and linear baselines (see the baseline comparison at the end of this section) confirms this reading: at 1 d lead the ensemble does not improve on a persistence forecast, and its advantage emerges only at longer leads and on rising-limb and high-flow days, where recent discharge alone is least informative. The Bagre storage index has a very low linear correlation with discharge during the training period (r = 0.037), and reaches its normalised maximum in most wet seasons. As Sect. 6.2 shows, this reflects the reservoir routinely filling to capacity rather than a signal that discriminates flood years, so the index is best understood as a validated measure of reservoir state rather than a standalone predictor.
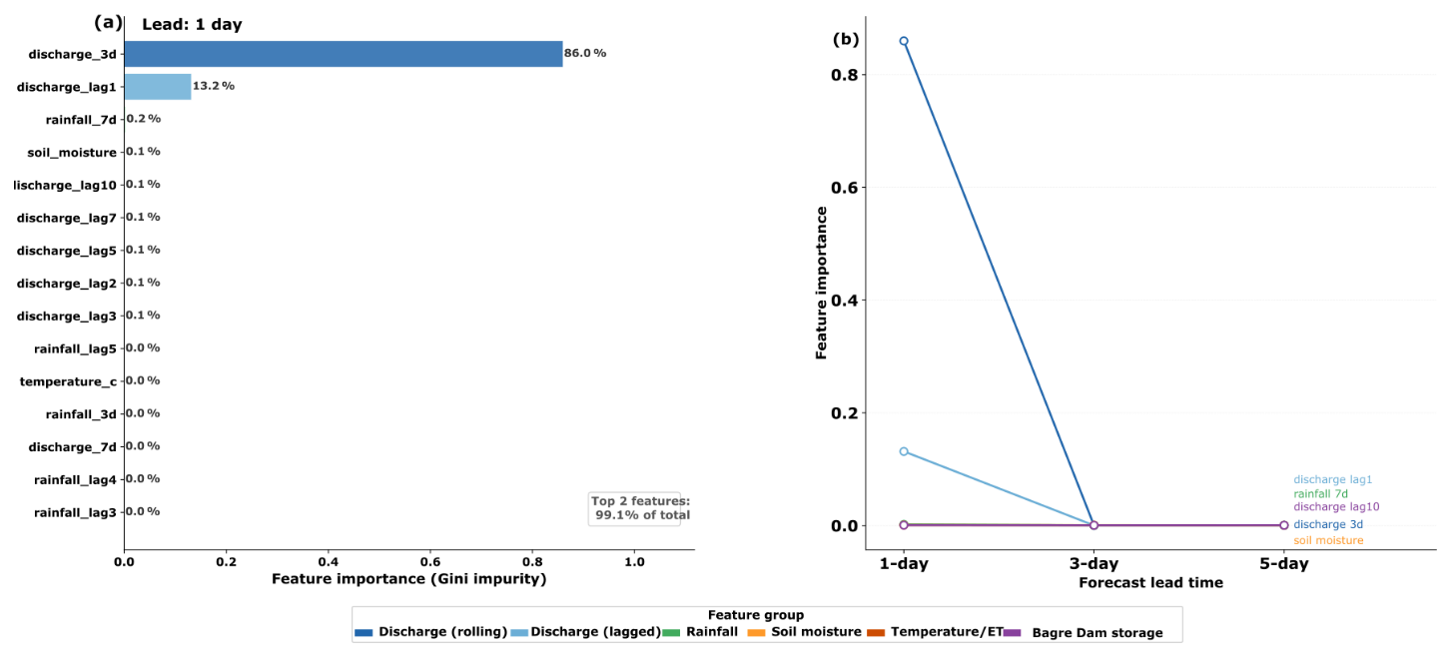
Figure 5Random Forest feature importance. (a) Gini importance at 1 d lead. (b) Lead-time evolution of the five most important individual features.
For extreme flow events, days when observed discharge exceeded the 90th percentile threshold of 872 m3 s−1, corresponding to 55 d in the test period, ensemble skill degrades but remains operationally meaningful (Fig. 4e). The full observed versus predicted discharge time series across the test period is shown at 1, 3 and 5 d lead in Fig. 6a–c, with a detailed view of the 2006 flood season in Fig. 6d and the 1 d observed-versus-predicted scatter in Fig. 6e. At 1 d lead, KGE = 0.808; at 3 d, KGE = 0.515; at 5 d, KGE = 0.248. Prediction errors in both timing and magnitude compound over longer horizons, but even the 5 d result identifies elevated discharge trajectories before peak impact. The 1 and 5 d KGE for each model is summarised in Fig. 4f. The event-based analysis in Sect. 5.3 further shows that, while alert onset is reproduced within 1 to 2 d, the magnitude of the largest peaks is systematically under-predicted by several per cent, which should temper confidence in Red-tier magnitude forecasts for the most severe events.

Figure 6Observed versus ensemble-predicted discharge at Nawuni gauge during the independent test period (January 2004 to February 2007, GRDC observed discharge). Panels (a)–(c) show the full time series at 1, 3, and 5 d lead times respectively, with alert threshold lines and flood peak annotations. Panel (d) shows a zoom on the 2006 flood season. Panel (e) shows an observed versus predicted scatter plot at 1 d lead coloured by alert tier.
Baseline comparison
To test whether the ensemble adds value beyond recent observed discharge, we compared it against seven reference predictors evaluated on identical forecast issue dates and the same 21 leave-one-year-out folds used for the ensemble: persistence (the most recent observed discharge at issue time), a leave-one-year-out day-of-year climatology, ordinary least squares regression on discharge lags only and on the full feature set, and random forests trained on rainfall features only, on the Bagre storage proxy only, and on all exogenous drivers with every discharge feature withheld. Skill was assessed on all days and, separately, on rising-limb days (target discharge increasing) and high-flow days (observed discharge at or above the Yellow threshold of 1114 m3 s−1), since these regimes govern warning performance (Table 2). Three findings follow. First, at 1 d lead the ensemble carries no advantage over persistence, which attains KGE = 0.997 across all days and 0.958 on high-flow days against the ensemble's 0.995 and 0.951; at this horizon the forecast is dominated by the persistence of recent discharge, and every predictor that ignores recent discharge performs poorly. Second, the ensemble's marginal skill grows with lead time and concentrates in the regimes that determine warning performance: on rising-limb days it exceeds persistence by 0.010, 0.073 and 0.121 KGE units at 1, 3 and 5 d leads, and on high-flow days by −0.007, 0.031 and 0.093. Third, in the interest of a fair account, a linear model on the full feature set is a strong competitor and marginally outperforms the ensemble on high-flow days at 3 and 5 d leads; we read this not as a weakness but as confirmation that the contribution of this work is the end-to-end warning design and the explicit incorporation of the Bagre storage signal, which any of these architectures can exploit once it is supplied as an input, rather than the sophistication of the learning algorithm.
Table 2Baseline comparison (Kling–Gupta Efficiency). All baselines evaluated under the ensemble's 21-fold leave-one-year-out protocol on identical forecast issue dates. Random forest baselines: 80 trees, maximum depth 18.

5.2 Alert Threshold Calibration
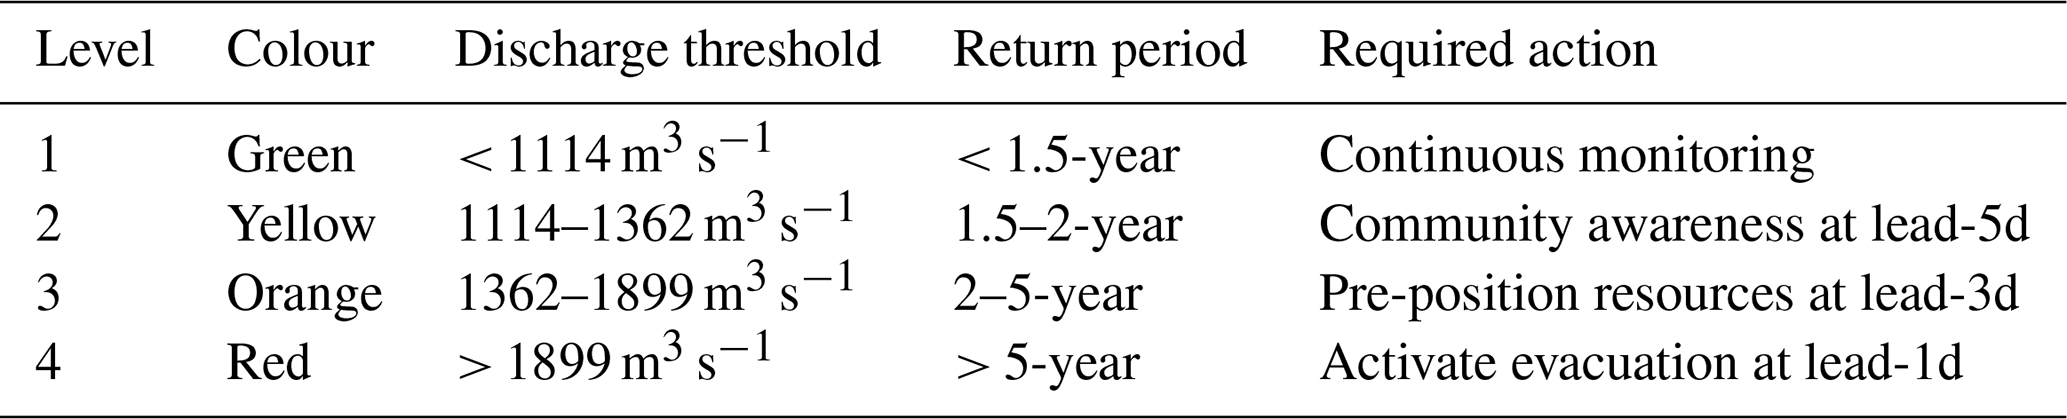
This subsection converts the continuous discharge record into the four alert tiers by fitting flood return periods to the wet-season annual maxima. The LP3 frequency analysis on 30 wet-season annual maxima yields a well-constrained distribution with mild negative skewness (−0.773). The four alert thresholds are: Green below 1114 m3 s−1 (less than 1.5-year return period), Yellow 1114–1362 m3 s−1 (1.5–2-year), Orange 1362–1899 m3 s−1 (2–5-year), and Red above 1899 m3 s−1 (greater than 5-year) (Table 4). Across the full daily GRDC record these tiers correspond to 94.1 %, 1.8 %, 2.9 %, and 1.2 % of all days respectively. The negative skewness reflects the physical structure of dam-regulated discharge: Bagre dam spillway constraints bound the upper tail of downstream peaks, producing a less heavy-tailed frequency distribution than would be expected on an unregulated river of comparable size. The fitted frequency curve and the resulting threshold classification applied to the historical record are shown in Fig. 7a and b respectively.

Figure 7Alert threshold calibration. (a) Log-Pearson Type III frequency curve fitted to 30 wet-season annual maxima (1975–2006) at Nawuni, with the four alert tier thresholds marked. (b) Historical daily discharge at Nawuni (2000–2006) classified by alert tier, illustrating the distribution and seasonality of threshold exceedances.
Bootstrap confidence intervals on the LP3 quantiles (5000 resamples of the 30-year annual maxima series) indicate substantial sampling uncertainty at lower return periods, which is characteristic of short flood records in data-sparse regions. The Yellow threshold carries a 95 % confidence interval of 905–1361 m3 s−1, the Orange threshold 1128–1610 m3 s−1, and the Red threshold 1635–2120 m3 s−1. The widest relative uncertainty is at the Yellow tier, where the LP3 fit is most sensitive to the log-skewness parameter. These intervals do not affect the alert system's operational thresholds, which are set at the point estimates, but they do indicate that the exact tier boundaries should be treated as statistically informed estimates rather than precise physical thresholds.
It is important to distinguish between the return-period thresholds used here and the decision thresholds that emergency managers require in practice. The LP3 frequency analysis calibrates discharge exceedance probabilities based on the statistical properties of the observed record; it does not incorporate vulnerability, exposure, evacuation feasibility, or community impact data. A 5-year return period discharge at Nawuni does not automatically constitute an evacuation threshold in Central Gonja or Savannah districts, that determination depends on local topography, settlement patterns, road access, and the lead time available to move people and livestock to higher ground. The four-tier alert system presented here provides a statistically grounded starting point for threshold calibration, but operational deployment should involve co-design with NADMO district offices and Community Disaster Volunteer networks to translate return-period thresholds into locally meaningful action levels. This is consistent with the broader warning chain literature, which consistently finds that technically derived thresholds require social validation before they translate into protective behaviour (Demeritt et al., 2010).
5.3 Alert Skill
This section asks how reliably the forecasts trigger the correct tier, that is, how often a genuine exceedance is caught and how often a false alert is raised. Table 3 presents alert detection skill from the 21-fold LOYO cross-validation, which covers the full 1987–2007 GRDC record without circular evaluation bias. Two complementary views are reported: day-level contingency statistics with stratified bootstrap 95 % confidence intervals (2000 resamples), and event-level statistics in which consecutive exceedance days are collapsed into independent flood episodes using a 5 d gap rule.
Table 3Alert detection skill from 21-fold leave-one-year-out cross-validation (1987–2007).
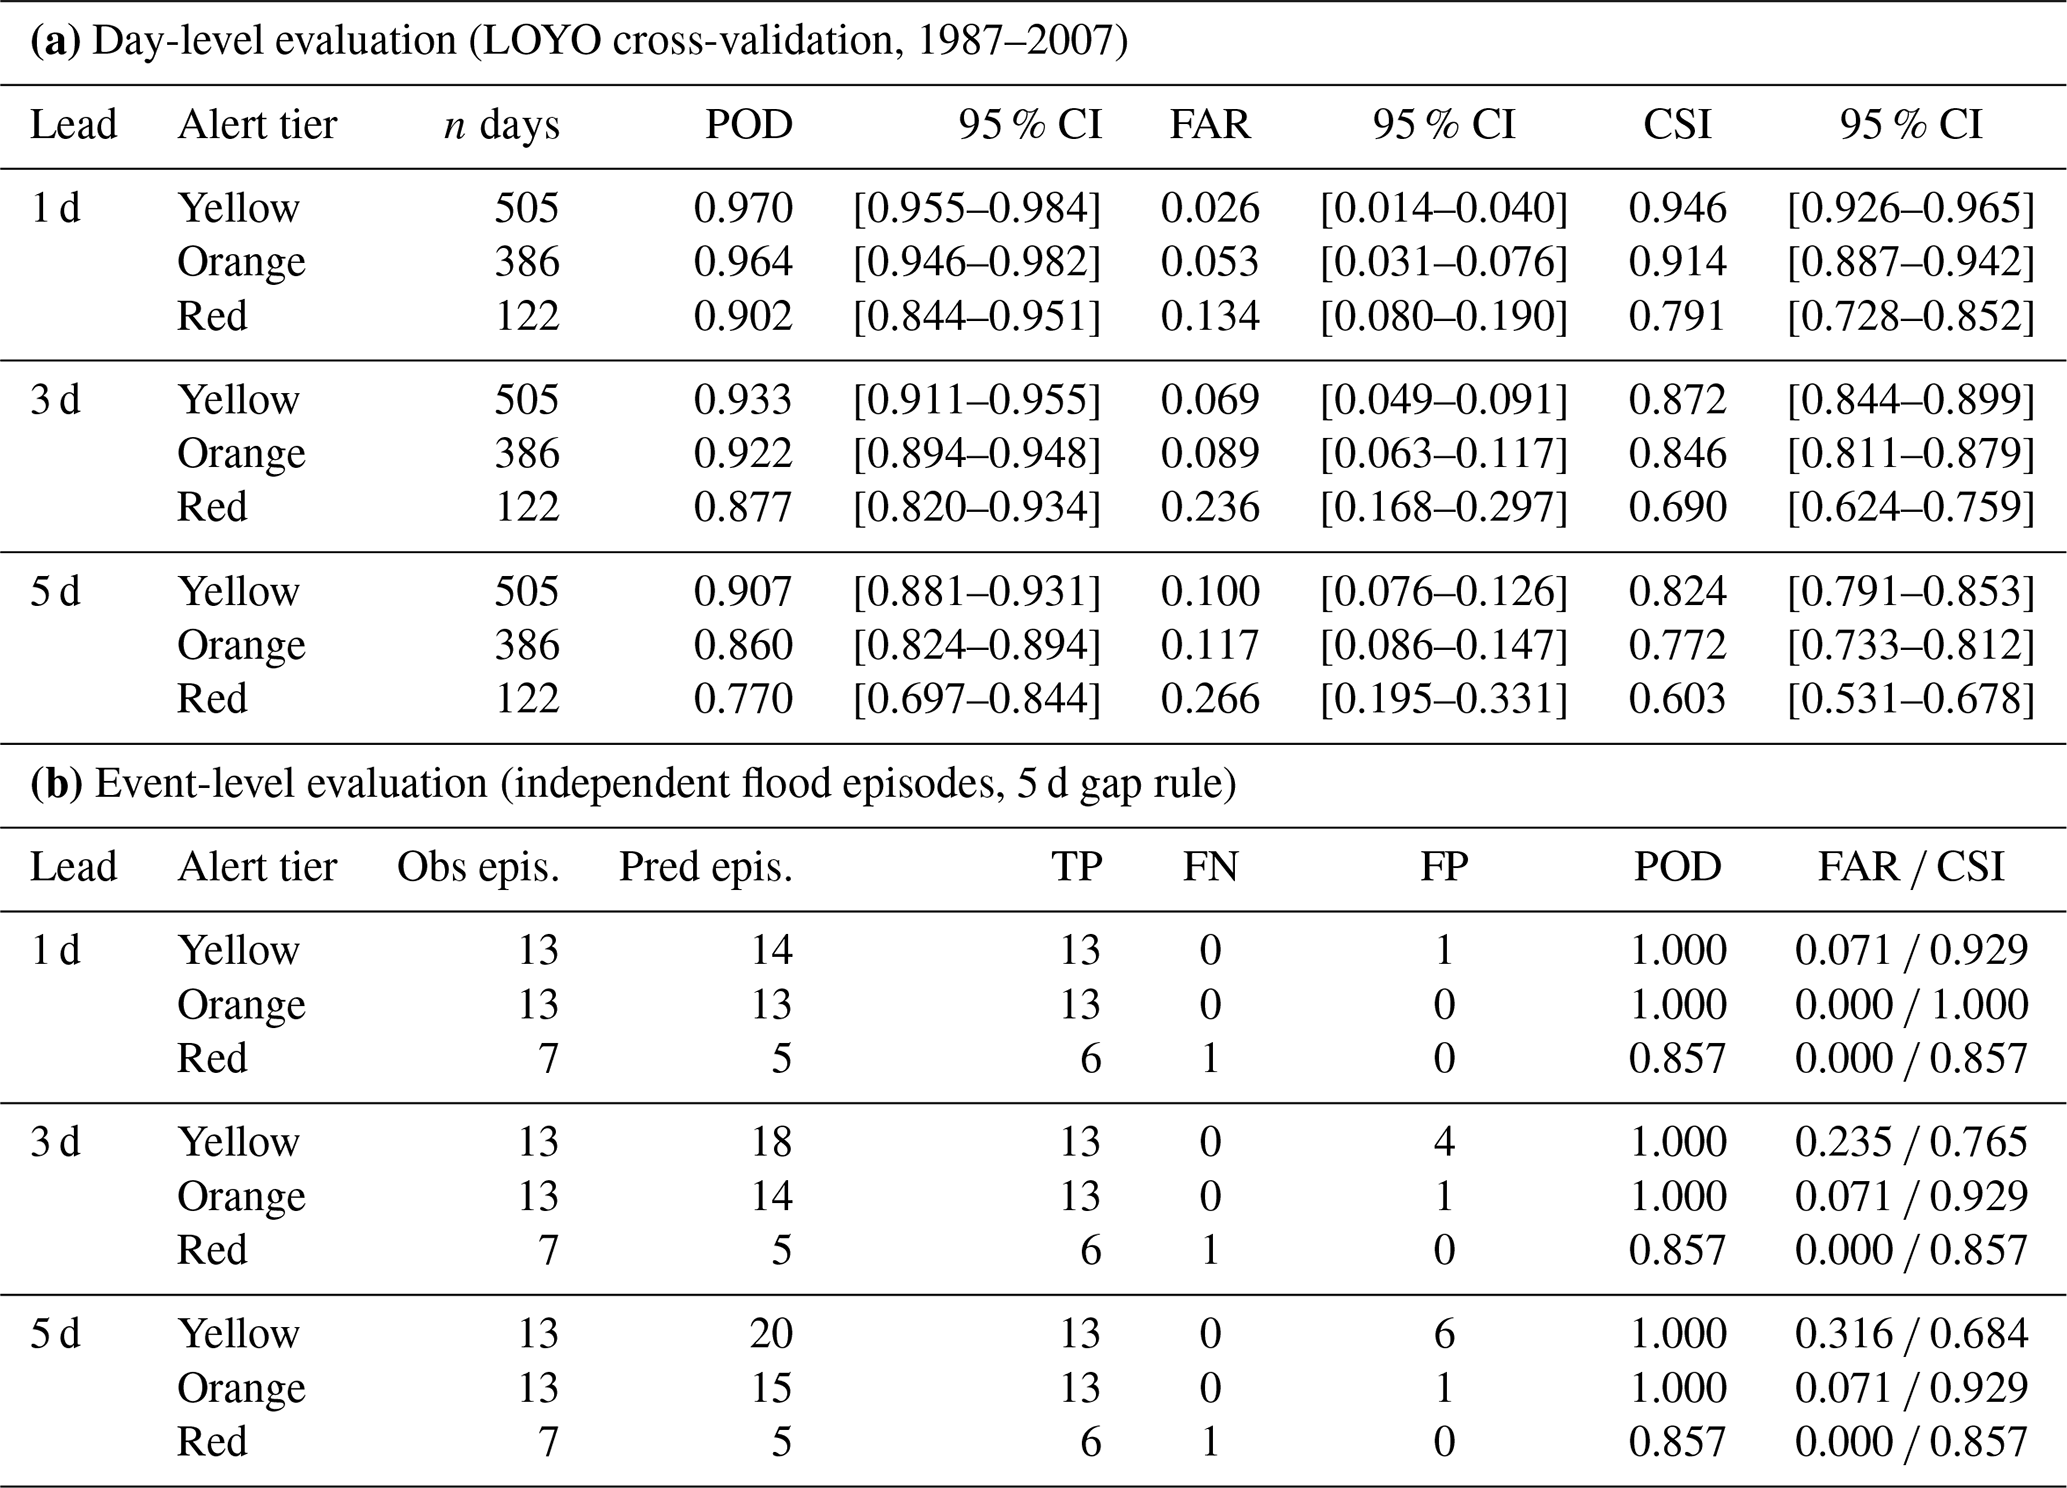
Table 4Four-tier alert classification system calibrated to Log–Pearson Type III return period thresholds (30 wet-season annual maxima, 1975–2006, Nawuni gauge).
At 1 d lead, the ensemble achieves Yellow-tier POD = 0.970 (95 % CI: 0.955–0.984) and FAR = 0.026 (0.014–0.040), Orange-tier POD = 0.964 (0.946–0.982) and FAR = 0.053 (0.031–0.076), and Red-tier POD = 0.902 (0.844–0.951) and FAR = 0.134 (0.080–0.190). Performance degrades gradually with lead time: at 5 d, Red-tier POD falls to 0.770 (0.697–0.844) and FAR rises to 0.266 (0.195–0.331). The confidence intervals widen at longer leads and higher tiers, reflecting both reduced predictability and the smaller sample of extreme events available for evaluation.
The event-level evaluation clarifies the operational interpretation of these statistics. Across 13 observed Yellow-tier episodes, the ensemble detected all 13 at 1 d lead with one false alarm episode. For Orange tier (13 observed episodes) the ensemble detected all 13 at 1 d lead with zero false alarms, and all 13 at 5 d lead with one false alarm. For Red tier (seven observed episodes) the ensemble detected six of seven at all three lead times (POD = 0.857) with zero false alarm episodes at any lead time. The single missed Red episode occurred in a year where peak discharge fell marginally above the 5-year return period threshold without the large Bagre Dam release signal that characterised other Red events. The false alarms visible in the day-level statistics at longer lead times predominantly reflect predicted exceedances falling 1 to 3 d outside the observed episode window rather than entirely spurious alerts, which in an operational context represents conservative rather than erroneous behaviour.
The event-level sample is small (seven Red episodes across 21 years) and the point estimates at this tier should be interpreted with appropriate caution. The bootstrap intervals at Red tier are wider than at Yellow or Orange (a range of approximately 0.15 KGE units in POD at 5 d lead) and reflect genuine uncertainty rather than model instability.
The Red tier presents the most operationally important results. At 1 d lead, cross-validated POD = 0.902 and FAR = 0.134 (CSI = 0.791). In practical terms, the system correctly anticipates roughly nine in ten evacuation-level events with 24 h' notice, at the cost of approximately one false alarm per six genuine events. At 5 d lead, POD = 0.762 and FAR = 0.268, still operationally useful for strategic pre-positioning and early mobilisation, though with higher uncertainty than at shorter leads. The independent test period contains no Orange- or Red-tier observations (the highest test-period peak was 1206 m3 s−1, below the Orange threshold of 1362 m3 s−1), so alert skill for these tiers is based entirely on cross-validated evidence. AUC values of 0.996–1.000 across all tiers and leads confirm strong discriminatory ability when evaluated with continuous predictions.
Table 5Skill of the Bagre reservoir fullness trigger, re-evaluated on the altimetry-validated corrected storage signal.

The trigger fires when the corrected pool reaches 90 % of capacity. Years without sufficient cloud-free JRC coverage are excluded from scoring and reported separately. In the reliably observed window the reservoir reaches capacity every year, so the trigger fires every year and its POD and FAR reflect the base rate rather than discriminating skill (see Sect. 6.2). POD, probability of detection; FAR, false-alarm ratio; CSI, critical success index.
Event-based hydrograph-shape validation
The contingency statistics in Table 3 establish detection skill but not the fidelity of the forecast hydrograph during flood events. We therefore evaluated three event-shape metrics on the 13 independent Yellow-and-above episodes in the leave-one-year-out record (5 d gap rule, target-date alignment): peak-magnitude error, alert-onset timing error (the difference between the observed and forecast first crossing of the Yellow threshold), and duration above the Yellow threshold (Table 6). Alert onset is reproduced accurately: the mean absolute onset timing error is 1.0, 1.9 and 2.0 d at 1, 3 and 5 d leads, with 92 %, 77 % and 77 % of events triggering within two days of the observed onset and no missed onsets at any lead. Peak magnitude is captured to a mean absolute error of 3.5 % to 7.9 %, and duration above threshold to 1.0 to 3.4 d. Two limitations are stated plainly. First, the most extreme peaks are mildly and systematically under-predicted: across the six Red-tier events the mean peak bias is −2.8 %, −5.3 % and −5.6 % at the three leads, and the alert-on duration is correspondingly shortened at longer leads. Second, peak-to-peak timing on the longest multi-pulse seasons is ambiguous, because two near-equal peaks separated by several weeks can exchange rank under a small magnitude perturbation; the median peak-timing error is 1 to 3 d, but we regard the alert-onset metric as the operationally meaningful timing measure. These results reinforce the caveat stated in the abstract and Sect. 6.3 that higher-tier skill rests on leave-one-year-out cross-validation rather than on held-out extreme events.
Table 6Event-based hydrograph-shape validation on 13 independent Yellow-and-above flood episodes (leave-one-year-out record, 1987–2007), target-date alignment.

5.4 Sentinel-1 Inundation Validation
This subsection checks whether periods of high modelled discharge coincide with observable inundation, using Sentinel-1 radar to map flood extent across three validation seasons. Sentinel-1 processing yielded 32, 78, and 62 individual SAR acquisitions for the 2016, 2019, and 2020 flood seasons respectively. Maximum inundation extent across the lower White Volta floodplain reached 49.7 km2 on 22 September 2016, 76.4 km2 on 19 October 2019, and 149.2 km2 on 13 September 2020, the largest documented extent in the validation set, consistent with the 2020 season being widely reported as the most severe in recent years.
The 2020 peak falls within 8 d of the event date recorded by Li et al. (2022), and the 2016 peak within 12 d of the DFO-archived date, within the Sentinel-1 revisit cycle at this latitude. The 2019 event shows a 52 d discrepancy between the SAR-detected maximum and the DFO-recorded peak, attributable to the two-pulse structure of that flood season: a Bagre-driven pulse in late August was followed by a larger-extent secondary rainfall-driven inundation in October. The DFO record captures the earlier higher-impact event; Sentinel-1 detected the spatially larger October extent. Collectively, the three validation seasons confirm that periods of Red-tier alert exceedance are associated with detectable floodplain inundation extents of 50–149 km2 in the lower White Volta floodplain, providing spatial grounding for the discharge-based threshold system and demonstrating that the gauge-level alert tiers translate to physically meaningful inundation conditions at the community scale (Fig. 8a–c).

Figure 8Sentinel-1 SAR flood inundation validation for three major flood events: (a) 2016, (b) 2019, and (c) 2020. Time series show daily inundation area (km2) derived from SAR backscatter change detection in Google Earth Engine. Vertical dashed lines indicate known event dates from the Dartmouth Flood Observatory archive and published literature.
5.5 Operational Architecture
The proposed five-layer architecture integrates the AI pipeline into Ghana's existing warning infrastructure with minimal new investment. Layer 1 retrieves CHIRPS near-real-time rainfall and ERA5-Land atmospheric forcing daily via automated API calls, supplemented by monthly JRC Bagre reservoir updates and real-time GHA gauge discharge where available. Layer 2 runs the trained ensemble to produce discharge forecasts at three lead times in under 2 min of computation. Layer 3 translates forecasts into colour-coded bulletins formatted for myDEWETRA-VOLTALARM, with an independent Bagre trigger activating a Yellow alert when reservoir extent exceeds 90 % of its historical maximum regardless of modelled discharge. It is important to note that in its current form the JRC-derived proxy is retrospective: monthly composites become available 2 to 4 weeks after the calendar month they represent, meaning the trigger provides seasonal situational awareness rather than real-time advance warning. Near-real-time Sentinel-1 monitoring of Bagre reservoir extent, which would reduce update latency from weeks to days, is identified as the highest-value future extension to this component of the system. Layer 4 routes alerts through the NADMO cascade from national to regional to district level, targeting Community Disaster Volunteer networks within 4 h of each daily run. Layer 5 specifies radio, SMS, and WhatsApp message formats in Gonja, Dagbani, and English calibrated to each alert tier. The minimum technical footprint at GMet is modest: a Python environment with trained model files, automated CHIRPS and ERA5 download scripts, CDS API credentials, a Google Earth Engine account, and approximately 50 GB of storage. The full architecture is illustrated in Fig. 9, and the daily alert cascade timeline is shown in Fig. 10.
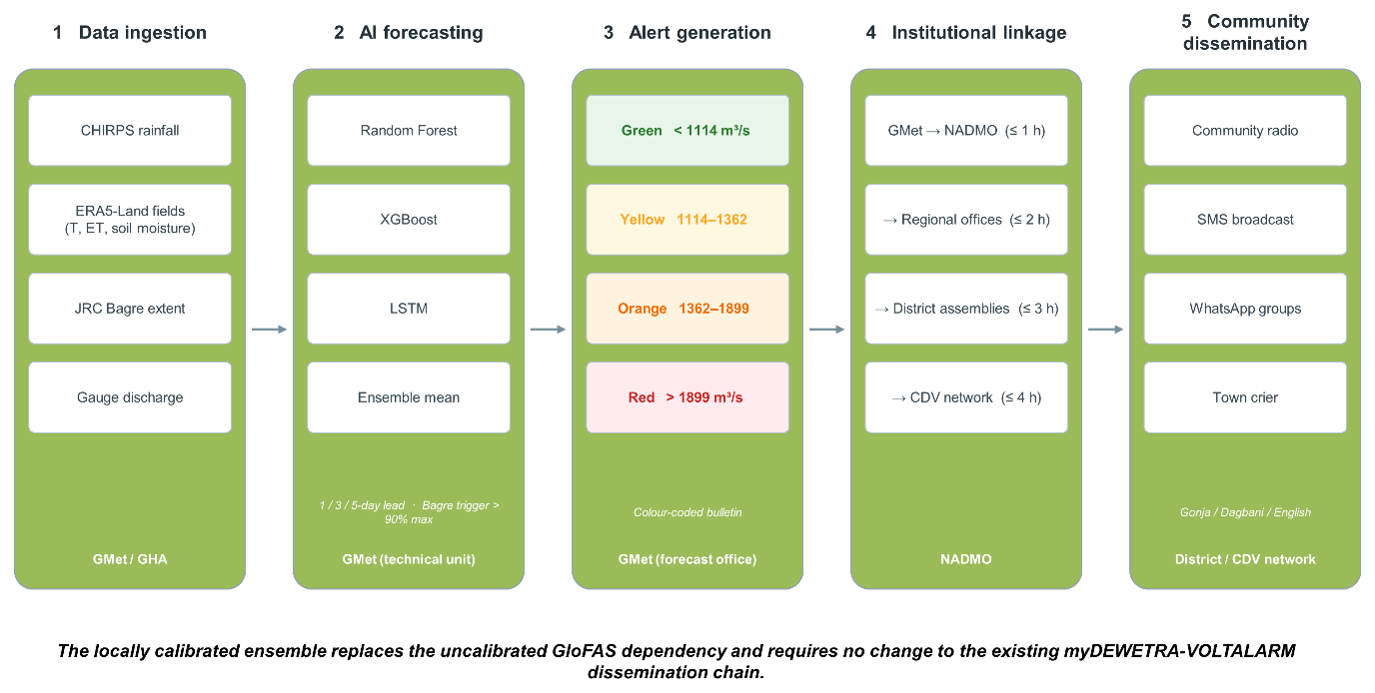
Figure 9Five-layer operational architecture of the AI-driven Flood Early Warning System for the White Volta Basin. The system integrates daily automated data ingestion, ensemble AI forecasting, threshold-based alert generation, institutional dissemination through NADMO, and community warning delivery in Gonja, Dagbani, and English. Alert output is compatible with the myDEWETRA-VOLTALARM platform operational at the Ghana Meteorological Agency.
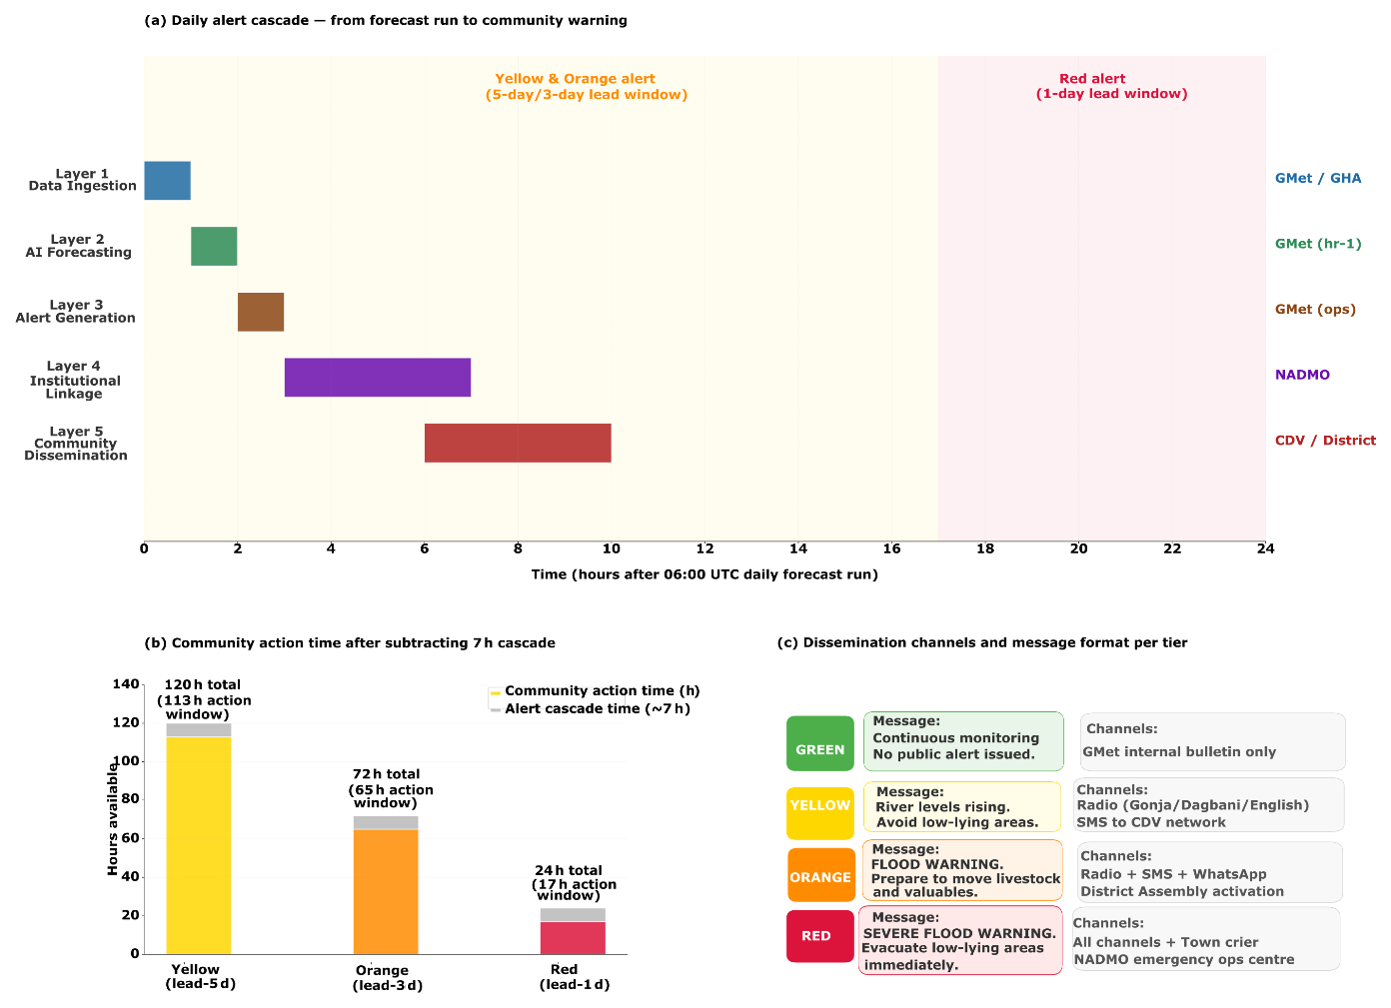
Figure 10Operational alert cascade from forecast run to community warning delivery. (a) Gantt-style timeline showing the five architecture layers and their task sequence after the daily 06:00 UTC forecast run, with lead-time windows for Yellow, Orange, and Red alerts indicated. (b) Community action time available after subtracting the 7 h institutional cascade. (c) Message format and dissemination channels for each alert tier.
5.6 Towards a people-centered warning system: risk knowledge, impact-based alerts and response
The architecture in Sect. 5.5 delivers the forecasting, alert-generation and dissemination functions of an early warning system, but a warning system protects lives only when it is anchored in local risk knowledge and connected to response capability. Following the widely adopted four-element view of people-centered early warning (Basher, 2006; UNISDR, 2006), the present system is strongest in the detection and forecasting element and specifies the dissemination element through the NADMO cascade and multilingual messaging of Sect. 5.5. This subsection sets out how the remaining two elements, risk knowledge and response capability, are addressed, and how the return-period thresholds of Sect. 5.2 are translated into impact-based warnings rather than discharge numbers alone.
5.6.1 Risk knowledge
Exposure and vulnerability in the lower White Volta are spatially concentrated and socially specific. The flood-prone zone between Nawuni and the Volta Reservoir, spanning the Central Gonja and Savannah districts, combines flat terrain, shallow soils and poor drainage, so that inundation is extensive and persists for several weeks after peak discharge (Sect. 2). The population exposed to this hazard depends heavily on recession agriculture on the alluvial floodplain, and the districts are among the most food-insecure in Ghana (Nkegbe et al., 2017), so a flood destroys not only property but standing crops, seed stocks and livestock, setting households back by multiple growing seasons. The dominant driver of the most severe events is transboundary and not locally observable: uncontrolled spillage from the Bagre reservoir, which is operated for irrigation rather than flood control and carries no formal notification requirement to Ghana. Effective risk knowledge in this basin therefore means understanding not only who and what is exposed on the Ghanaian floodplain, but that the largest events are governed by upstream reservoir behaviour, which is the specific gap the reservoir-monitoring component addresses.
5.6.2 Impact-based warning
The hydrological thresholds derived in Sect. 5.2 acquire operational meaning only when each tier is mapped to the impacts it implies and the actions it should trigger. Table 7 sets out this mapping for the three tiers, linking discharge thresholds to expected physical impacts on communities, farmland, roads and public facilities, to recommended protective actions, and to the institution responsible for each. We present it as an operational design grounded in the documented character of flooding in these districts, rather than as an empirically calibrated impact model, because the precise discharge at which a given road is cut or a given community is isolated depends on local topography and asset placement that only field co-design with NADMO district offices can establish (Demeritt et al., 2010). The table is therefore a template for that co-design, not a substitute for it.
Table 7Impact-based warning matrix linking each alert tier to expected impacts, protective actions and institutional responsibilities in the lower White Volta.

Standard operating procedures and response capability. Each tier in Table 7 corresponds to a standard operating procedure that fixes who acts, in what order, within the daily cascade timeline of Fig. 10a, with the community action time each alert tier leaves in Fig. 10b and the tier-specific messages and dissemination channels in Fig. 10c. At Yellow, the procedure is advisory and preparatory; at Orange, it moves to pre-positioning of resources, opening of designated shelters on high ground, and staged movement of people, livestock and seed stocks; at Red, it becomes full activation of evacuation to shelters along pre-identified routes, coordination with security services to manage the cutting of the north-south trunk-road corridor near Yapei, and readiness of the district health directorate for water-borne disease. Response capability rests on the existing Community Disaster Volunteer network as the last link in the chain, on shelters and evacuation routes that should be inventoried in advance for each exposed community, and on seasonal drills that rehearse the cascade before the wet season rather than during it.
5.6.3 Community feedback
A people-centered system is two-way. The same Community Disaster Volunteer network that delivers warnings is the channel through which communities report back observed water levels, the comprehension and reach of tiered messages, and their tolerance for false alarms, all of which feed the iterative calibration of both the impact thresholds and the message formats. This feedback loop is the mechanism by which the statistically derived tiers of Sect. 5.2 are ground-truthed against lived impact over successive seasons, and it is a precondition for the thresholds to translate into protective behaviour rather than warning fatigue.
We are candid that the present study specifies this people-centered layer as a design and does not evaluate a deployed system. Establishing the impact thresholds, shelter and route inventories, and feedback protocols in the field is a programme of work in its own right, and it is the natural next step beyond the forecasting engine and architecture demonstrated here.
6.1 Model Performance in Context
The ensemble KGE values of 0.984, 0.974, and 0.957 at 1, 3, and 5 d lead times are among the highest reported for any river system in West Africa. For contextualisation, Harrigan et al. (2020) evaluated GloFAS v2.1 across a global gauge network and reported an African median KGE of approximately 0.35. Our ensemble substantially exceeds this figure, though several important caveats apply: Harrigan et al. (2020) evaluated an older model version (v2.1 versus the current v4), across all African basins including genuinely ungauged catchments where performance is necessarily lower, and using a different evaluation methodology and period. A direct benchmark against GloFAS v4 reanalysis discharge at Nawuni confirms the performance advantage of the locally calibrated ensemble. GloFAS v4 reanalysis discharge was extracted from the ECMWF LISFLOOD reanalysis archive (Grimaldi et al., 2024) at the Nawuni grid cell (9.725° N, 1.075° W, resolution 0.05°) and evaluated against the same GRDC observations over the identical test period (January 2004 to February 2007, n = 1135 d). GloFAS v4 achieves a KGE of −0.526, NSE of −0.567, Pearson R of 0.425, and RMSE of 335.3 m3 s−1 at Nawuni. A KGE below zero indicates that GloFAS v4 performs worse than a naïve climatological mean predictor on this gauge. Inspection of the discharge time series reveals the source of this failure: GloFAS v4 produces near-zero discharge throughout the wet season while observed discharge peaks between 500 and 1200 m3 s−1, because LISFLOOD does not represent Bagre Dam release operations and therefore cannot reproduce the downstream flood signal that dominates discharge at Nawuni. This is not a limitation of GloFAS v4 in general but a specific and predictable consequence of applying a globally parameterised model without reservoir operation rules to a gauge that is hydraulically downstream of a major regulated reservoir. The locally calibrated ensemble, trained directly on GRDC observations at Nawuni and incorporating the Bagre storage proxy as an explicit input, achieves KGE = 0.984 at 1 d lead on the same data, a difference of 1.51 KGE units. The performance advantage is not marginal: it reflects access to information that no globally calibrated model without explicit dam representation can replicate.
The two specific advantages of our approach over any globally trained model are worth restating nonetheless. First, local calibration on 13 years of gauge observations at Nawuni allows the models to learn the specific rainfall, runoff relationship of this catchment, which differs from the global approximation used in GloFAS. Second, no globally trained model can incorporate a basin-specific upstream signal like the Bagre Dam storage index, which our architecture treats as a first-class input variable contributing an early warning pathway that is entirely absent from GloFAS-based systems.
The strong performance at 5 d lead time has direct operational significance. Five days is the planning horizon at which NADMO district offices can realistically mobilise emergency resources, alert community radio stations, and begin the cascade of warnings to Community Disaster Volunteers. A cross-validated Red-tier probability of detection of 0.902 at 1 d lead and 0.762 at 5 d means the system correctly anticipates most evacuation-level events with enough notice to act, even if the 5 d figure is lower than the 1 d estimate. The corresponding false alarm ratios of 0.134 and 0.268 are within the range that community experience studies suggest does not erode warning credibility when false alarms are communicated honestly and consistently (Demeritt et al., 2010). The contribution of the ensemble is therefore best understood as the end-to-end warning design and the explicit Bagre input rather than the sophistication of the learning algorithm. The lightweight architecture adopted here is a deliberate choice relative to that frontier. It is a tabular ensemble of Random Forest, XGBoost, and LSTM models trained on station discharge and gridded forcing, chosen for three reasons specific to the operational context. First, the modelling target is gauge-level discharge and alert tier classification at a single monitoring point, not distributed inundation fields; the added complexity of neural operators or graph routing is not warranted for this task formulation. Second, the minimum technical footprint required for operational deployment at the Ghana Meteorological Agency (a standard Python environment without GPU infrastructure) rules out architectures that depend on high-performance computing. Third, the Bagre Dam reservoir signal that dominates extreme flood risk at Nawuni is a threshold-type upstream trigger that requires explicit representation as a model input, not a spatially distributed process that benefits from graph-based routing. A locally calibrated tabular ensemble with the JRC-derived Bagre storage index as an explicit feature is better suited to capturing this threshold behaviour than a more complex architecture trained without reservoir state information. Future work could couple the discharge forecast presented here with a distributed inundation model to convert gauge-level alert tiers into community-scale depth, extent, and asset-impact warnings, which would be a natural application domain for neural operator approaches.
6.2 The Bagre Signal
The Bagre Dam upstream storage proxy is the most novel element of the feature engineering, and its role in the system merits careful interpretation. Its near-zero linear importance in the tree-based models (under 0.1 % of Random Forest Gini importance at 1 d lead) does not undercut its inclusion: low importance at short lead means only that, once recent discharge lags are known, the index adds little to next-day prediction, not that it is uninformative in general. By the time a major Bagre release reaches Nawuni it is already encoded in the recent discharge record, making the index redundant for next-day forecasting but potentially informative at longer leads and at the onset of developing events, before elevated flows arrive at the gauge. This reading is consistent with the baseline comparison in Sect. 5.1, in which a Bagre-only model has no standalone skill while the reservoir signal contributes as an increment to a discharge-based model. We validated the reservoir proxy physically, because a satellite-derived water extent may capture floodplain, wetland or channel water rather than the reservoir itself. Three steps establish its fidelity. First, a polygon-sensitivity analysis shows that the original extraction envelope of 3018 km2 is only about 5 % water and encloses the Nakambe valley floodplain and the Bagre Ramsar wetland rather than the reservoir pool; restricting the extraction to persistent-water pixels from the JRC occurrence layer (occurrence at or above 40 %) reduces the surface to 94 km2, consistent with the published minimum operating pool of approximately 85 km2 (Fig. 11a). Second, the raw monthly extent carried a physically inverted seasonal cycle, higher in the dry season than the wet, because optical water detection is suppressed by wet-season cloud; normalising each month by its count of valid observations removes the inversion and restores the expected wet-season filling (Fig. 11b). Third, we validated the corrected signal against independent satellite altimetry (DAHITI virtual station 943), which derives from different sensors and physics: the corrected pool area tracks altimetric level at a Pearson coefficient of 0.94 over 135 monthly observations, against only 0.30 for the raw extent (Fig. 11c). The proxy is therefore a physically validated measure of reservoir state, and the cloud correction is the decisive step in achieving this.
Re-evaluating the reservoir trigger on this validated signal produces a more honest picture than earlier analyses of the raw index. Across the reliably observed period (1999 to 2006), the corrected pool reaches 98 % to 99.9 % of capacity in every wet season, in flood and non-flood years alike, so a fullness threshold fires in all 8 years, yielding a probability of detection of 1.0 that is trivial rather than skilful and a false-alarm ratio that simply equals the proportion of non-flood years (Table 4). This is physically expected: the Bagre reservoir fills to capacity in most wet seasons, and whether Ghana floods downstream depends on the magnitude and timing of controlled releases and on continuing inflow, not on reservoir fullness alone. Two further factors shape Table 5. The reservoir was impounded only in 1993, so the pre-1994 flood years in the full-record window pre-date its operation; and the corrected surface area saturates once the pool is full, because the banks are steep, so area ceases to rise even as level continues to climb, while the altimetric level, available only from 2008 and therefore not overlapping the gauge record, cannot yet be tested against observed floods.
The Bagre reservoir is positioned as a signal within the warning system. It is not a standalone annual flood trigger. It is a validated measure of reservoir state that contributes in two ways: as an explicit input feature to the discharge model, and as seasonal situational awareness that the reservoir is at or near capacity and therefore capable of spilling. The monthly JRC composite latency, of 2 to 4 weeks, reinforces this seasonal framing; near-real-time Sentinel-1 monitoring of the reservoir surface area, reducing update latency from weeks to days, remains the highest-value technical improvement available to the operational system and is the subject of ongoing work, since it is the release event rather than the fullness state that determines downstream impact.
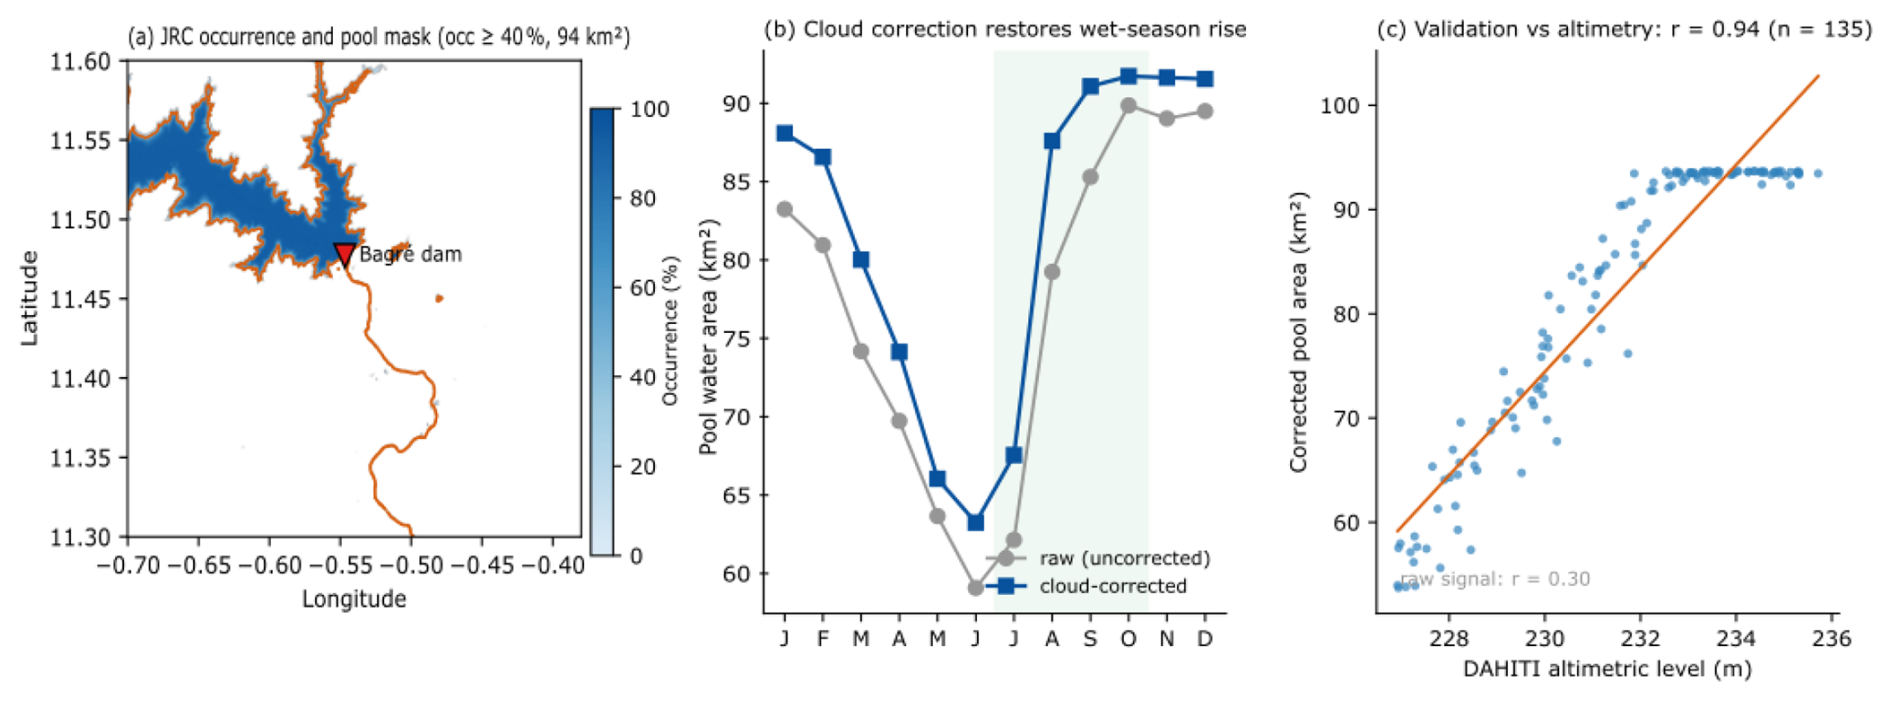
Figure 11Physical validation of the Bagre reservoir storage proxy. (a) JRC water occurrence over the reservoir, with the occurrence at or above 40 % pool mask (94 km2) outlined and the dam marked. (b) Monthly pool water area before and after cloud correction; normalising by valid observations removes the physically inverted seasonal cycle and restores wet-season filling. (c) Cloud-corrected pool area against independent DAHITI satellite-altimetric water level, 2008 to 2021 (Pearson r = 0.94, n = 135 months); the raw uncorrected signal achieves only r = 0.30.
6.3 Sentinel-1 Validation and Its Limits
The Sentinel-1 inundation maps confirm that alert threshold exceedances correspond to real floodplain inundation, but the validation has clearly defined limits. The post-2007 period lacks GRDC gauge observations, so the ERA5-Land runoff proxy must substitute for discharge. The proxy achieves good distributional agreement with the GRDC record through quantile mapping, but its day-to-day timing differs from gauge observations in ways that prevent direct lead-time verification. Sentinel-1 observations are therefore used exclusively for spatial validation, confirming the threshold-to-inundation relationship, while lead-time claims rest on the LOYO cross-validated ROC analysis against 7,035 days of GRDC-observed discharge.
The 2019 event discrepancy (52 d gap between DFO-recorded and satellite-detected peak) illustrates a broader challenge: a basin can experience multiple flood pulses within a single wet season, and maximum inundation extent may not correspond to the highest-impact event. Continuous SAR monitoring throughout the flood season, combined with community-level impact records distinguishing between multiple events, would substantially strengthen future validation efforts.
6.4 Limitations and Future Directions
Four limitations warrant explicit acknowledgement. First, the independent test period (2004–2007) does not contain any Orange- or Red-tier discharge events, because the three flood seasons in that window peaked below 1362 m3 s−1. Alert skill for the higher tiers therefore rests on leave-one-year-out cross-validated evidence rather than a strictly held-out sample. The LOYO design eliminates training-data circularity but is not equivalent to a fully independent test set. Obtaining an independent evaluation of Red-tier skill would require either a longer gauge record or the acquisition of discharge data for the post-2007 flood events, particularly 2007, 2010, and 2020.
Second, the training record ends in 1999 and thus excludes the 2007 event, the largest discharge on record at Nawuni (2279 m3 s−1). Models trained without exposure to the most severe historical event may underestimate uncertainty around Red-tier forecasts for truly exceptional floods. Extending training with GloFAS v4 reanalysis discharge for 2000–2023, once GRIB2 reading tools are installed, would address this directly.
Third, the Bagre Dam signal depends on monthly JRC surface water updates, introducing a lag of several weeks relative to real-time reservoir conditions. Near-real-time Sentinel-1 monitoring or radar altimetry over the Bagre reservoir would transform this from a lagged monthly indicator into a genuine real-time alert, representing the highest-value technical improvement available to the operational system.
Fourth, the GloFAS benchmark comparison is indirect, based on published aggregate statistics from Harrigan et al. (2020) for GloFAS v2.1, rather than a direct evaluation of GloFAS v4 at Nawuni using identical data and metrics. This limits the strength of the performance claims relative to the current operational system. Though, several lines of qualitative evidence suggest the direction of the performance gap is robust. The GloFAS v4 hydrological reanalysis, evaluated across 1995 calibration stations globally, reports a median modified KGE' of 0.70 (Grimaldi et al., 2024; accessible via the GloFAS map viewer at https://globalfloods.eu, last access: 4 June 2026, under Evaluation → Hydrological Model Performance). Stations in West Africa, and particularly those on regulated rivers, tend to cluster at or below this global median because GloFAS does not represent individual reservoir operations such as Bagre Dam releases. The GloFAS v4 LISFLOOD model, while substantially improved over v2.1 in resolution (0.05° versus 0.1°) and calibration coverage, still relies on global parameter sets without explicit dam release rules for Bagre, which is the dominant driver of extreme flood events at Nawuni. Our locally calibrated ensemble, trained directly on GRDC gauge observations and incorporating the Bagre storage proxy as an explicit input, operates in a fundamentally different information regime for this specific basin.
A fifth operational limitation concerns the system's dependence on real-time GRDC discharge at Nawuni. The locally calibrated ensemble requires recent gauge observations to populate its autoregressive lag features, which account for the majority of predictive variance at short lead times. When real-time discharge is missing, delayed, or erroneous (conditions that occur regularly in operational settings due to telemetry failures, sensor maintenance, or transboundary data-sharing gaps) the system cannot produce a reliable ensemble forecast. Three fallback strategies are available, each with different skill implications. First, the ERA5-Land runoff proxy used for the post-2007 Sentinel-1 validation period demonstrates that a bias-corrected reanalysis discharge estimate can substitute for gauge observations, though at substantially reduced skill for extreme events; this fallback is available with zero additional infrastructure and activates automatically when gauge data are absent for more than two consecutive days. Second, the Bagre Dam reservoir storage trigger operates entirely independently of the discharge model and continues to issue seasonal-scale alerts when the JRC index exceeds 0.90, providing a safety net that does not depend on gauge data availability at all. Third, the XGBoost and Random Forest components of the ensemble can run in a degraded configuration that replaces missing discharge lag features with the most recently available observation carried forward, a strategy that maintains reasonable performance over gaps of up to three days but degrades sharply beyond that. Formalising these fallback protocols into the operational architecture, including automated detection of gauge data outages and seamless switching between forecast modes, is a necessary engineering step before deployment.
This paper has presented the first end-to-end AI-driven flood early warning system design for the White Volta Basin of northern Ghana, integrating observed gauge discharge, CHIRPS satellite rainfall, ERA5-Land reanalysis forcing, and a JRC-derived Bagre reservoir storage proxy, and validated against independent Sentinel-1 SAR inundation observations as spatial grounding for the discharge-based threshold framework. Four conclusions are worth stating directly.
First, the locally calibrated ensemble substantially outperforms GloFAS v4 at Nawuni across all forecast horizons. A direct comparison using identical data and metrics for the January 2004 to February 2007 test period shows GloFAS v4 achieving KGE = −0.526 at Nawuni, performing worse than a climatological mean predictor, primarily because LISFLOOD does not represent Bagre Dam release operations and therefore cannot reproduce the downstream flood signal that dominates discharge at this gauge. The locally calibrated ensemble achieves KGE values of 0.984, 0.974, and 0.957 at 1, 3, and 5 d lead times on the same data, a difference of 1.51 KGE units at 1 d lead. The performance advantage is most pronounced at 5 d lead, the horizon that matters most operationally, where global systems trained without local calibration and without explicit reservoir representation consistently underperform.
This advantage is specific to the comparison with globally parameterised models. Against simple local baselines such as persistence and linear regression, the ensemble's margin is modest and concentrated at the longer leads, so the contribution lies in the end-to-end warning design and the explicit Bagre input rather than in the learning algorithm itself.
Second, Bagre Dam upstream storage is an informative measure of reservoir state that current operational systems ignore, but it is not a standalone flood trigger. The cloud-corrected reservoir signal, validated against independent satellite altimetry at a Pearson coefficient of 0.94, faithfully tracks reservoir level. Yet, the reservoir fills to near capacity in most wet seasons, so reservoir fullness alone does not discriminate the years that flood downstream from those that do not. We therefore employ the signal as an explicit input to the discharge model and as seasonal situational awareness that the reservoir is at capacity and capable of spilling, rather than as an independent alarm. The monthly JRC update lag reinforces this; near-real-time Sentinel-1 monitoring of the Bagre surface area would reduce update latency from weeks to days and, together with an automated monitoring protocol and, ideally, a bilateral notification arrangement with Burkina Faso's water authorities, represents the highest-value improvement available to the existing warning architecture.
Third, the four-tier alert system, calibrated to 30 years of flood frequency data, achieves both high detection rates and operationally tolerable false alarm ratios across the full range of lead times and event severities. Leave-one-year-out cross-validated results with stratified bootstrap 95 % confidence intervals show Red-tier alerts achieving a probability of detection of 0.902 [0.844–0.951] at 1 d lead and 0.770 [0.697–0.844] at 5 d, with false alarm ratios of 0.134 [0.080–0.190] and 0.266 [0.195–0.331] respectively. At the event level, across seven observed Red episodes in the 21-year cross-validation record, six were detected at all three lead times with zero false alarm episodes. The independent test period (2004–2007) contains no Orange- or Red-tier events, so these figures rest on cross-validated rather than strictly held-out evidence, a limitation acknowledged explicitly and a motivation for acquiring post-2007 gauge data from the Ghana Hydrological Authority.
Fourth, the system as designed requires no new institutional infrastructure at the Ghana Meteorological Agency. Alert output is formatted for direct entry into the myDEWETRA-VOLTALARM platform already operational there, and the dissemination cascade from GMet through NADMO to district offices and Community Disaster Volunteer networks follows existing protocols. The minimum technical footprint is a Python computing environment, automated download scripts for CHIRPS and ERA5, CDS API credentials, and approximately 50 GB of storage, resources that GMet already possesses. Several engineering and co-design steps remain, notably the field calibration of impact thresholds and response protocols set out in Sect. 5.6, but the gap between the system described here and an operational deployment is a matter of implementation rather than of fundamental capability.
All datasets used in this study are freely available. GRDC discharge data were obtained from the Global Runoff Data Centre (https://grdc.bafg.de, last access: 29 March 2026). CHIRPS data are available at https://data.chc.ucsb.edu/products/CHIRPS-2.0/ (last access: 29 March 2026). ERA5-Land data are available via the Copernicus Climate Data Store (https://cds.climate.copernicus.eu, last access: 29 March 2026). JRC Global Surface Water data and Sentinel-1 SAR imagery are available through Google Earth Engine (https://earthengine.google.com, last access: 4 June 2026). Python scripts for data preprocessing, model training, threshold design, Sentinel-1 processing, and trained model files are archived on Zenodo at https://doi.org/10.5281/zenodo.20549601 (Obeng and Yuan, 2026).
Joseph Obeng: Writing – review & editing, Writing – original draft, Methodology, Investigation, Formal analysis, Data curation, Conceptualization. Hongyong Yuan: Writing – review & editing, Supervision, Project administration, Funding acquisition. Tao Chen: Writing – review & editing, Supervision, Project administration, Funding acquisition. Lida Huang: Writing – review & editing, Validation, Investigation.
The contact author has declared that none of the authors has any competing interests.
Publisher's note: Copernicus Publications remains neutral with regard to jurisdictional claims made in the text, published maps, institutional affiliations, or any other geographical representation in this paper. The authors bear the ultimate responsibility for providing appropriate place names. Views expressed in the text are those of the authors and do not necessarily reflect the views of the publisher.
This article is part of the special issue “Early Warning Systems from Research to Operations: Status, Innovations and Multi-Hazard Applications”. It is not associated with a conference.
The authors thank the Global Runoff Data Centre (GRDC, Federal Institute of Hydrology, Koblenz, Germany) for providing daily discharge records for the Nawuni gauging station (GRDC station 1531450). CHIRPS precipitation data were provided by the Climate Hazards Group at the University of California Santa Barbara. ERA5-Land reanalysis data and GloFAS reanalysis discharge were obtained through the Copernicus Climate Change Service operated by ECMWF. Sentinel-1 SAR data were provided by the European Space Agency through the Copernicus Earth Observation programme and processed using Google Earth Engine. The JRC Global Surface Water dataset was accessed via Google Earth Engine. The authors acknowledge the Ghana Meteorological Agency (GMet), the Ghana Hydrological Authority (GHA), and the National Disaster Management Organisation (NADMO) for institutional context and operational guidance that shaped the system design.
This work was supported by the National Key Research and Development Program of China (grant no. 2025YFE0212800), the National Natural Science Foundation of China (grant no. 72521001) and the Natural Science Foundation of Beijing (grant nos. L255011, 8242014).
This paper was edited by Kelley De Polt and reviewed by two anonymous referees.
Arsenault, R., Poulin, A., Côté, P., and Brissette, F.: Comparison of stochastic optimization algorithms in hydrological model calibration, J. Hydrol. Eng., 19, 1374–1384, https://doi.org/10.1061/(ASCE)HE.1943-5584.0000938, 2014.
Basher, R.: Global early warning systems for natural hazards: systematic and people-centred, Philos. T. R. Soc. A, 364, 2167–2182, https://doi.org/10.1098/rsta.2006.1819, 2006.
Cao, X., Wang, B., Yao, Y., Zhang, L., Xing, Y., Mao, J., Zhang, R., Fu, G., Borthwick, A. G. L., and Qin, H.: U-RNN high-resolution spatiotemporal nowcasting of urban flooding, J. Hydrol., 659, 133117, https://doi.org/10.1016/j.jhydrol.2025.133117, 2025.
Cao, X., Yao, Y., Wang, Z., Zhao, Z., Borthwick, A. G. L., and Qin, H.: Large-scale urban flood modeling and zero-shot high-resolution generalization with LarNO, J. Hydrol., 676, 135686, https://doi.org/10.1016/j.jhydrol.2026.135686, 2026.
Chini, M., Pelich, R., Pulvirenti, L., Pierdicca, N., Hostache, R., and Matgen, P.: Sentinel-1 InSAR coherence to detect floodwater in urban areas: Houston and Hurricane Harvey as a test case, Remote Sens., 11, 107, https://doi.org/10.3390/rs11020107, 2019.
Demeritt, D., Cloke, H., Pappenberger, F., Thielen, J., Bartholmes, J., and Ramos, M.-H.: Ensemble predictions and perceptions of risk, uncertainty, and error in flood forecasting, Environ. Hazards, 7, 115–127, https://doi.org/10.1016/j.envhaz.2007.05.001 , 2010.
Di Baldassarre, G., Montanari, A., Lins, H., Koutsoyiannis, D., Brandimarte, L., and Blöschl, G.: Flood fatalities in Africa: From diagnosis to mitigation, Geophys. Res. Lett., 37, L22402, https://doi.org/10.1029/2010GL045467, 2010.
Funk, C., Peterson, P., Landsfeld, M., Pedreros, D., Verdin, J., Shukla, S., Husak, G., Rowland, J., Harrison, L., Hoell, A., and Michaelsen, J.: The climate hazards infrared precipitation with stations, a new environmental record for monitoring extremes, Sci. Data, 2, 150066, https://doi.org/10.1038/sdata.2015.66, 2015.
Grimaldi, S., Salamon, P., Disperati, J., Zsoter, E., Russo, C., Ramos, A., Carton de Wiart, C., Barnard, C., Hansford, E., Gomes, G., and Prudhomme, C.: GloFAS v4.0 hydrological reanalysis, European Commission, Joint Research Centre, JRC131349, https://data.jrc.ec.europa.eu/collection/id-00288 (last access: 4 June 2026), 2024.
Harrigan, S., Zsoter, E., Alfieri, L., Prudhomme, C., Salamon, P., Wetterhall, F., Barnard, C., Cloke, H., and Pappenberger, F.: GloFAS-ERA5 operational global river discharge reanalysis 1979–present, Earth Syst. Sci. Data, 12, 2043–2060, https://doi.org/10.5194/essd-12-2043-2020, 2020.
Ilori, O. W. and Adeyewa, D. Z.: Projected changes in extreme rainfall events over West Africa and its sub-regions: a multi-scenario climate analysis, Meteorol. Atmos. Phys., 137, 33, https://doi.org/10.1007/s00703-025-01081-z, 2025.
Katsekpor, J. T., Greve, K., Yamba, E. I., and Amoah, E. G.: Flood early warning systems in the White Volta Basin, Ghana: challenges and opportunities, J. Flood Risk Manage., 18, e70146, https://doi.org/10.1111/jfr3.70146, 2025a.
Katsekpor, J. T., Greve, K., and Yamba, E. I.: Streamflow forecasting using machine learning for flood management and mitigation in the White Volta Basin of Ghana, Environmental Challenges, 20, 101181, https://doi.org/10.1016/j.envc.2025.101181, 2025b.
Kratzert, F., Klotz, D., Brenner, C., Schulz, K., and Herrnegger, M.: Rainfall–runoff modelling using Long Short-Term Memory (LSTM) networks, Hydrol. Earth Syst. Sci., 22, 6005–6022, https://doi.org/10.5194/hess-22-6005-2018, 2018.
Li, C., Dash, J., Asamoah, M., Sheffield, J., Dzodzomenyo, M., Gebrechorkos, S. H., Anghileri, D., and Wright, J.: Increased flooded area and exposure in the White Volta river basin in Western Africa, identified from multi-source remote sensing data, Sci. Rep., 12, 3701, https://doi.org/10.1038/s41598-022-07720-4, 2022.
Moriasi, D. N., Arnold, J. G., Van Liew, M. W., Bingner, R. L., Harmel, R. D., and Veith, T. L.: Model evaluation guidelines for systematic quantification of accuracy in watershed simulations, T. ASABE, 50, 885–900, https://doi.org/10.13031/2013.23153, 2007.
Mosaffa, H., Pappenberger, F., Prudhomme, C., Chantry, M., Rüdiger, C., and Cloke, H.: A GNN routing module is all you need for LSTM Rainfall–Runoff models, Hydrol. Earth Syst. Sci., 30, 2079–2092, https://doi.org/10.5194/hess-30-2079-2026, 2026.
Muñoz-Sabater, J., Dutra, E., Agustí-Panareda, A., Albergel, C., Arduini, G., Balsamo, G., Boussetta, S., Choulga, M., Harrigan, S., Hersbach, H., Martens, B., Miralles, D. G., Piles, M., Rodríguez-Fernández, N. J., Zsoter, E., Buontempo, C., and Thépaut, J.-N.: ERA5-Land: a state-of-the-art global reanalysis dataset for land applications, Earth Syst. Sci. Data, 13, 4349–4383, https://doi.org/10.5194/essd-13-4349-2021, 2021.
Nearing, G. S., Cohen, D., Dube, V., Gauch, M., Gilon, O., Harrigan, S., Henck, A., Hurkmans, R., Johnson, D., Matias, M., Metzger, A., Nevo, S., Pappenberger, F., Prudhomme, C., Shalev, G., Shenzis, S., Tekalign, T. Y., Weitzner, D., and Kratzert, F.: Global prediction of extreme floods in ungauged watersheds, Nature, 627, 559–563, https://doi.org/10.1038/s41586-024-07145-1, 2024.
Nkegbe, P. K., Abu, B. M., and Issahaku, H.: Food security in the Savannah Accelerated Development Authority Zone of Ghana: an ordered probit with household hunger scale approach, Agriculture & Food Security, 6, 35, https://doi.org/10.1186/s40066-017-0111-y, 2017.
Nobre, A. D., Cuartas, L. A., Hodnett, M., Rennó, C. D., Rodrigues, G., Silveira, A., Waterloo, M., and Saleska, S.: Height above the nearest drainage – a hydrologically relevant new terrain model, J. Hydrol., 404, 13–29, https://doi.org/10.1016/j.jhydrol.2011.03.051, 2011.
Obeng, J. J. and Yuan, H.: White Volta Flood Early Warning System: Code and Data, Version v2, Zenodo [computer software], https://doi.org/10.5281/zenodo.20549601, 2026.
Obeng Jr., J., Yuan, H., Chen, T., Huang, L., and Baryomunsi, A. J.: Governing the warning chain: Socio-technical misalignment in flood early warning systems in Ghana, Progress in Disaster Science, 31, 100650, https://doi.org/10.1016/j.pdisas.2026.100650, 2026.
Ouedraogo, Y., Yamegueu, D., Tazen, F., Leye, B., Bologo Traore, M., and Konda, M.: Addressing the Water-Energy-Food Nexus in the context of climate change: the case of Bagré dam in Burkina Faso, Scientific African, 24, e02251, https://doi.org/10.1016/j.sciaf.2024.e02251, 2024.
Pekel, J.-F., Cottam, A., Gorelick, N., and Belward, A. S.: High-resolution mapping of global surface water and its long-term changes, Nature, 540, 418–422, https://doi.org/10.1038/nature20584, 2016.
Solanki, H., Vegad, U., Kushwaha, A., and Mishra, V.: Improving Streamflow Prediction Using Multiple Hydrological Models and Machine Learning Methods, Water Resour. Res., 61, e2024WR038192, https://doi.org/10.1029/2024WR038192, 2025.
Taghizadeh, M., Zandsalimi, Z., Nabian, M. A., Goodall, J. L., and Alemazkoor, N.: FloodForecaster: a domain-adaptive geometry-informed neural operator framework for rapid flood forecasting, J. Hydrol., 664, 134512, https://doi.org/10.1016/j.jhydrol.2025.134512, 2026.
UNISDR: Developing Early Warning Systems: A Checklist, Third International Conference on Early Warning (EWC III), Bonn, Germany, 27–29 March 2006, United Nations International Strategy for Disaster Reduction, Platform for the Promotion of Early Warning, Bonn, Germany, 10 pp., 2006.
Xu, Q., De Vos, L. F., Shi, Y., Ruther, N., Bronstert, A., and Zhu, X. X.: Urban flood modeling and forecasting with deep neural operator and transfer learning, J. Hydrol., 661, 133705, https://doi.org/10.1016/j.jhydrol.2025.133705, 2025.
Yamba, E. I., Aryee, J. N. A., Quansah, E., Davies, P., Wemegah, C. S., Osei, M. A., Ahiataku, M. A., and Amekudzi, L. K.: Revisiting the agro-climatic zones of Ghana: a re-classification in conformity with climate change and variability, PLOS Clim., 2, e0000023, https://doi.org/10.1371/journal.pclm.0000023, 2023.