
the Creative Commons Attribution 4.0 License.
the Creative Commons Attribution 4.0 License.
 | 05 Nov 2026
Towards improved integration of hydrological uncertainty and hydraulic model sensitivity in flood hazard mapping

Jasna Donevska
Matjaž Mikoš
The study presents a novel framework for integrating hydrological uncertainties and the related sensitivity of the hydrodynamic modelling results into flood hazard mapping. Uncertainties in flood frequency analysis (FFA), including anticipated impact of climate change and sensitivity to channel and floodplain roughness, were examined through selected scenario ensembles. The study area is the lower Vipava river, a transboundary catchment shared between Slovenia and Italy with variable floodplain topography. Sensitivity analysis revealed that uncertainty in FFA and river channel roughness significantly influenced the inundation spatial extent and inundation depth, the impact of floodplain roughness appears to be limited. The analysis shows that natural successional changes in river channel roughness substantially impact the results of a 10 year return period (RP) event, increasing flood extent by 45 %. The increase in inundated areas is less pronounced for 100 and 500 year RP floods, with increases of 15 % and 11 %, respectively. The weighted exceedance probability of inundation (WEPI) based on scenario ensembles provided an informative identification of areas most susceptible to potential changes in flood hazard. Our results highlight the value of targeted scenario ensembles that incorporate FFA uncertainty and hydraulic roughness sensitivity, thereby producing more informative flood hazard mapping that can complement deterministic mapping approaches and support more adaptive future land use planning.
- Article
(13988 KB) - Full-text XML
-
Supplement
(750 KB) - BibTeX
- EndNote


Floods are complex natural hazards characterized by highly variable magnitude, spatial extent and flow dynamics, often resulting in substantial impacts on communities, infrastructure, and economic activities (Kundzewicz et al., 2019; Maranzoni et al., 2023). Flood hazard mapping is widely used to reduce pre-impact flood risk and to guide spatial development in potentially exposed areas. Different tools and modelling approaches are used to elaborate flood hazard maps which are then integrated into spatial planning through various administrative measures. However, flood hazard mapping is subjected to significant uncertainties and is sensitive to spatial and temporal variation in hydrological and hydraulic processes, changes in land use, alterations in river channels characteristics, limited knowledge about the physical properties of the system, as well as the inevitable problem of data availability. These factors pose huge challenges for flood risk management (Alfonso et al., 2016; Winter et al., 2018; Stephens and Bledsoe, 2020; Nogherotto et al., 2022; Herrera et al., 2022; Mishra et al., 2022; Paulik et al., 2024; Yu et al., 2025).
Flood hazard maps that are derived deterministically, without considering potential uncertainties, have often been shown to provide inaccurate and potentially misleading estimates of the inundation extension. Furthermore, deterministic flood boundaries may obscure areas where exposure can increase under plausible hydrological and hydraulic conditions, potentially leading to inadequate risk zoning and maladaptive land use decisions. Due to the limitations of the deterministic approach to flood hazard assessment, it is crucial to quantify related uncertainties and analyse the sensitivity of resulting flood hazard mapping to hydraulic model input data (Glas et al., 2016; Smart, 2018; Stephens and Bledsoe, 2020; Bates, 2022; Hashimoto et al., 2023). Flood hazard maps that account for uncertainty in input data and sensitivity in simulation results provide a more robust basis for decision making and flood risk management (Simões et al., 2015; Zahmatkesh et al., 2021; Maranzoni et al., 2023). However, a significant knowledge gap persists in the practical consideration of uncertainty and sensitivity aspects. This is mainly because systematic methods to quantify uncertainty and sensitivity are still lacking (Apel et al., 2008; Dimitriadis et al., 2016; Zhou et al., 2021; Aitken et al., 2024).
Given the ability to perform multiple simulation runs under varying input data and parameter settings, hydrodynamic models have been applied to assess various sources of uncertainties affecting flood hazard and flood risk assessments (Bates, 2022). Although advances in computing infrastructure and efficient modelling strategies have made large ensembles of hydrodynamic simulations increasingly feasible, running numerous detailed hydrodynamic simulations for extensive river reaches with complex topography remains computationally demanding and may still limit their routine use in practical flood hazard assessment (Yang et al., 2022; Aitken et al., 2024). Furthermore, flood hazard maps that depict uncertainty in inundation extent can be challenging to interpret, as the way uncertainty is depicted may strongly influence users' hazard perception and decision making (Lim et al., 2024; Pavesi et al., 2024). We argue that the integration of uncertainty and sensitivity into flood hazard mapping can be strengthened through predefined, process informed scenario ensembles selected to represent boundary conditions associated with the dominant hydrological and hydraulic controls on flood extent.
In this study, we introduce a systematic yet operational framework that integrates hydrological input uncertainty and hydrodynamic model sensitivity through the analysis of flood inundation extent and flood hazard classification across plausible ranges of flood peak estimates and hydraulic roughness conditions. The methodological advance lies in combining process informed scenario selection with weighted exceedance probability of inundation mapping, thereby translating uncertainty and sensitivity information into spatially explicit indicators of recurrent and uncertain flood exposure. Unlike computationally intensive probabilistic approaches or isolated sensitivity tests, the proposed framework provides an interpretable and transferable workflow that can be implemented using a limited number of targeted scenario ensembles while still capturing key sources of variation relevant for flood hazard zoning and adaptive land use planning. The research objectives of the study were the following:
-
Evaluate the impact of uncertainty in FFA on hydrodynamic simulation results and the spatial extent of inundated areas using HEC-RAS hydrodynamic model.
-
Analyse the sensitivity of the hydrodynamic modelling results to successional changes in river channel roughness conditions and the potential floodplain roughness changes associated with land use classes.
-
Use global sensitivity analysis to identify the key drivers of inundation extent and derive the weighted exceedance probability of inundation (WEPI) from scenario ensembles to support more informative flood hazard maps.
2.1 Study area description
The Vipava river is a transboundary river that flows through western Slovenia and northeast Italy. This study focuses on the lower Vipava river valley (Fig. 1), which comprises the last 21 km of the river in Slovenia before it enters Italy. The total length of the Vipava river is 49 km, with 45 km of it located in Slovenia. It flows into the Soča river near the Municipality of Savogna d'Isonzo after entering Italy. The region has prevailing sub-Mediterranean climate characteristics with hot summers and mild winters (Magjar et al., 2016). The average annual precipitation in the headwater parts of the catchment surpasses 2000 mm, whereas the lower region receives approximately 1500 mm annually. The Vipava river catchment area is characterized by karst hydrology in most of its eastern and northeastern highland parts, while the central, southern, and southeastern parts are dominated by the torrential characteristics of the Vipava river tributaries (Rusjan et al., 2012).
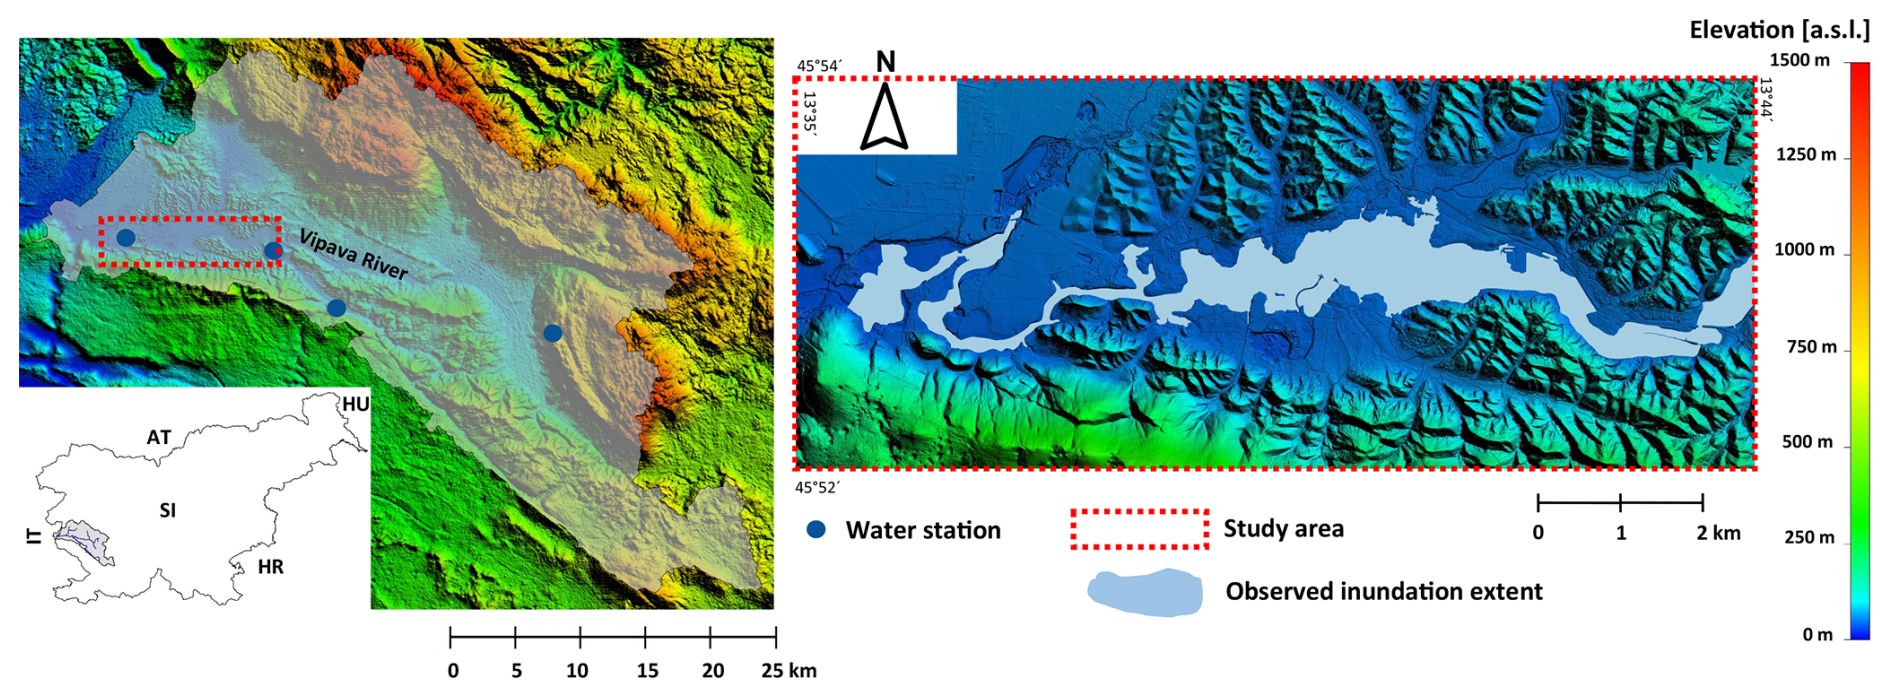
Figure 1(left) Location of the Vipava river catchment and the study reach. (right) Detailed topography of the study reach. Light blue polygons represent the observed inundation extent in 2010 flood event.
The area is particularly interesting for studying the uncertainty and sensitivity aspects of flood hazard assessment due to heterogeneous hydrological response of the catchment (Jelovčan and Šraj, 2022) and highly variable floodplain areas extension (Fig. 1). In some sections of the Vipava river, the width of the inundated areas can exceed 1 km, whereas in other sub-sections, the inundated areas are constrained to the width of the main river channel due to the narrow river valley. The floodplain areas extending along the studied Vipava river reach have been significantly impacted by human interventions in the past, with the aim of acquiring agricultural land. These interventions have resulted in changes to the Vipava river channel's hydromorphological characteristics through river engineering works, as well land use alterations (Magjar et al., 2016). Recurrent flooding occurs along the studied lower Vipava river valley due to the complex interplay of the catchment's hydrological and topographic characteristics, as well as land use patterns in the floodplain areas. Major flood events occurred in 1998, 2009, 2010, and 2012, with peak discharge RPs ranging from approximately 20–100 years (ARSO, 2009, 2010, 2012; Kobold, 2011). During the flood of September 2010, with the highest discharge ever measured at the lowest water station Miren (437 m3 s−1), the towns of Renče and Miren, which are the most exposed to the flood hazard in the study area, were completely cut off from the valley. The RP for this flood event was assessed to range between 50–100 years (lower part of the study reach) and 20–50 years (upper part of the study reach). In recent decades, flood-related issues have worsened due to the expansion of bult-up areas in floodplains and changes in hydraulic conditions in the Vipava river channel. This is mainly caused by the intensive successive overgrowth of the river channel by riparian vegetation. Structural flood protection measures were generally implemented at a local level, addressing specific community needs. The overall effectiveness of these interventions remains highly constrained.
2.2 Methodological framework
The methodology for exploring the uncertainty and sensitivity aspects in flood hazard mapping is presented in Fig. 2. The framework was structured into three phases: (1) data acquisition; (2) hydrodynamic model setup with the incorporation of uncertainty and sensitivity analysis; and (3) inundated area extension and flood hazard mapping analysis based on the hydrodynamic model results (inundation depths and flow velocities).
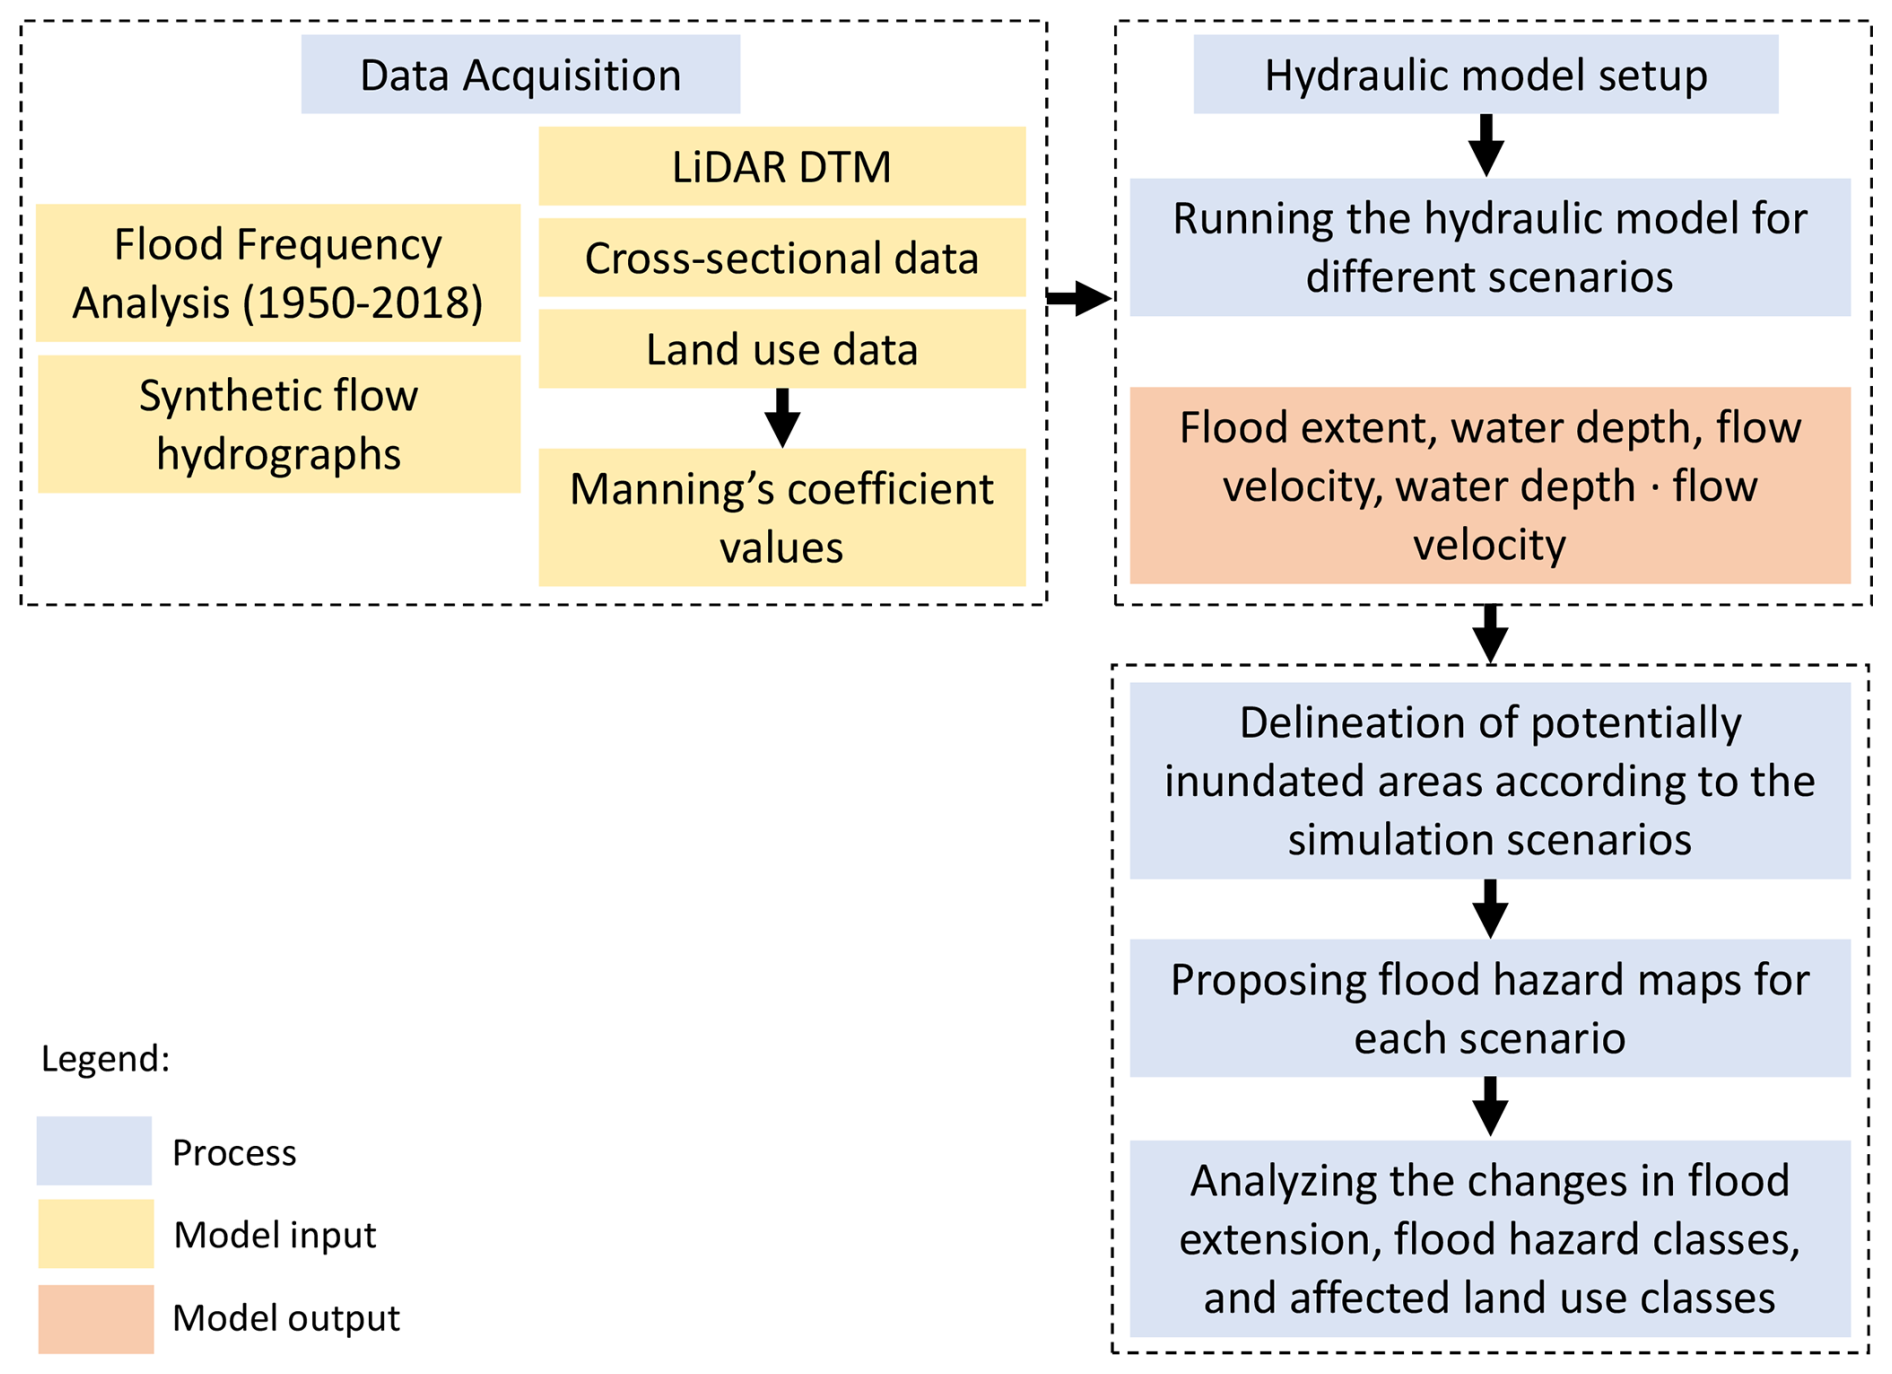
2.2.1 Overview of the input data
The data were obtained from various governmental entities in the Republic of Slovenia, Table 1 provides a summary of the basic information for the datasets. To simulate flood propagation over the floodplain area, a high-resolution digital elevation model (DTM) based on LIDAR scanning data was utilized. River channel cross-section data were obtained through classical geodetic survey. The hydrological data were summarized following flood frequency analyses (FFA) for the two water stations in the studied river reach operated by the Slovenian Environmental Agency (ARSO) and previous hydrological studies. The discharge records used in FFA were based on sub-daily measurements, generally available at 15 min recording intervals and subsequently aggregated at 30 min or hourly intervals. Pearson III, Log-Pearson III, and GEV distributions were considered (Piry, 2020; Šraj et al., 2025; Šraj and Bezak, 2025). The distribution parameters were estimated using the method of L-moments (Hosking and Wallis, 1993; Bezak et al., 2014). The Akaike Information Criterion (AIC) was considered for goodness-of-fit assessment and selection of the best-fitted distribution (Šraj and Bezak, 2025). Additionally, the Kolmogorov–Smirnov test was used to check (at selected significance level 0.05) whether the selected distribution function adequately described the measured data on flood peaks (Šraj et al., 2025; Šraj and Bezak, 2025). Confidence intervals of the design flood quantiles were estimated using a parametric bootstrap procedure (Meylan et al., 2012), with 10 000 synthetic samples generated from the fitted distribution, and further used to derive confidence intervals for the selected RPs quantiles. According to AIC, the GEV distribution was considered for estimation of discharge RP and confidence intervals. Detailed FFA results for the two water stations in the studied Vipava river reach are provided in supplementary material SM1. To account for the uncertainty in the FFA, we considered different values of peak discharge (10 %, mean (design) value, and 90 % confidence intervals – CI) for the selected 10, 100 and 500 year RP. Hydraulic simulations utilized a 48 h SCS dimensionless hydrograph. In general, the characteristics of the 48 h SCS hydrograph approximate well the Vipava river catchment characteristics as evaluated in previous hydrological studies (D. Anzeljc: Hydrological study of the Vipava river catchment, Ministry for the Environment and Spatial Planning of the Republic of Slovenia, unpublished internal report, in Slovenian). To place the uncertainty in FFA in the context of foreseen climate change, the estimated changes in flood characteristics driven by climate change were summarized from official reports prepared by the Slovenian Environmental Agency (ARSO) on the Climate Change Assessment for Slovenia in the 21st Century (ARSO, 2018). The analysis considered RCP 2.6, RCP 4.5, and RCP 8.5 scenarios following the IPCC guidelines. The flood peaks for the Vipava river are generally expected to rise by 5 % (RCP 2.6 scenario), 10 % (4.5 RCP scenario) and 20 % (8.5 RCP) scenario for the modelled 30 year time horizons (2011–2040, 2041–2070, and 2071–2100) compared to the reference period of 1981–2010. The comparison with RCP scenarios was used to evaluate the extent to which the hydrological uncertainty captured by the FFA-based scenario ensembles also encompasses moderate climate change signals, rather than to provide a full decomposition of climate change uncertainty.
Table 1Overview of the dataset used in the study (MNVP – Ministry of Natural Resources and Spatial Planning; Geodetska uprava Republike Slovenije (GURS) – Surveying and Mapping Authority; DRSV – Slovenian Water Agency; Ministrstvo za kmetijstvo, gozdarstvo in prehrano (MKGP) – Ministry of Agriculture, Forestry and Food).

* DRSV (Direkcija Republike Slovenije za vode): Geodetic survey of Vipava river cross sections, unpublished internal dataset, Ljubljana, Slovenia.
To assess how hydraulic roughness across floodplain land use classes and potential future changes in roughness affect flood extent and other inundation characteristics, we incorporated detailed land use data (1 m spatial resolution; 21 land use classes) provided by MKGP (2025) into the HE-RAS hydrodynamic model. For each land use class, minimum, maximum, and recommended Manning's roughness coefficients were assigned based on published literature (NOAA, 2016; USACE, 2022a; USDA-NRCS, 2016). These values were used to define the roughness ranges applied in the floodplain sensitivity analysis. The Manning roughness coefficients are listed in Table 2. In the study area, there are various agricultural land uses that do not significantly differ in terms of hydraulic roughness. Therefore, different land use classes may have relatively similar Manning's roughness values, as reported in the literature and listed in Table 2. Generally, the land use in the study areas is highly fragmented (Fig. 3 – upper map). For illustrative purposes, the lower map in Fig. 3 shows the reclassified land use classes grouped into four characteristic categories. The majority of the investigated area is covered by forest (44 %), primarily on the hillsides surrounding the lowland, flat areas in the Vipava river valley. Agricultural land covers 43 % of the area, mostly in the low-lying area along the river and its tributaries. The built-up areas, which constitute approximately 11 % of the total area, are less dominant and highly spatially dispersed.
Table 2Manning's coefficients for selected floodplain land use classes (MKGP, 2008; NOAA, 2016; USACE, 2022b; USDA-NRCS, 2016).

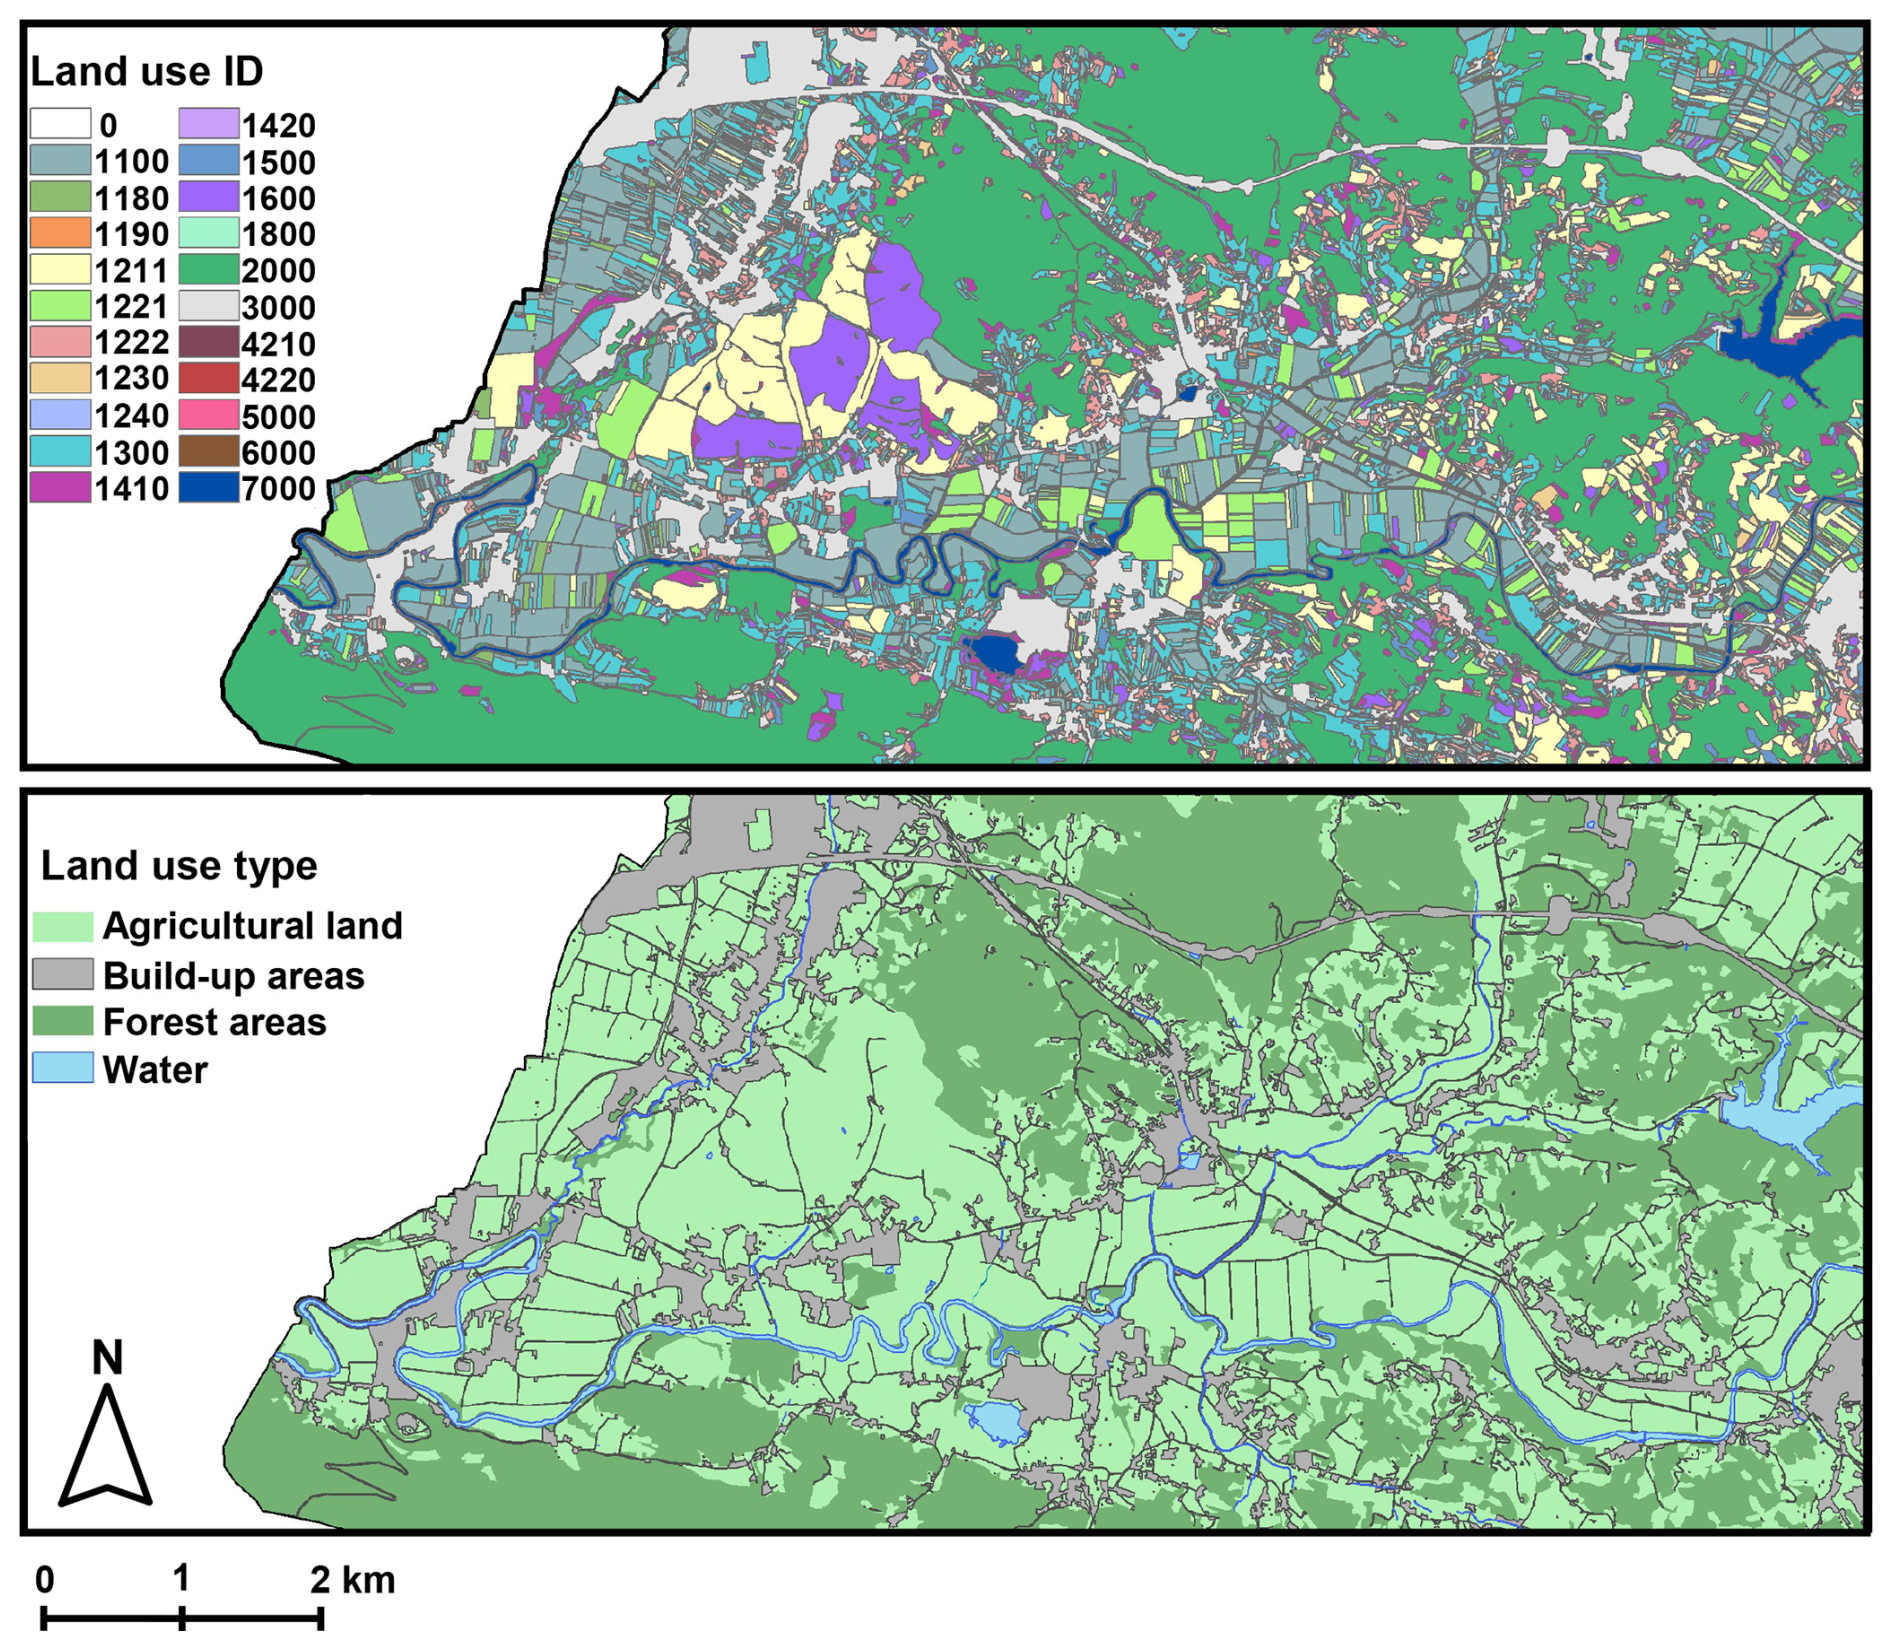
Figure 3(upper map) – Fragmented land use in the study area (land use codes for the main land use classes: forest: land use ID 2000, built-up areas: land use ID 3000, water bodies: land use class 7000, different agricultural land uses: land use IDs 1000–1800); (lower map) – Grouped land use classes. Data source: © MKGP, 2026.
2.2.2 Hydrodynamic model setup
The data presented in the previous section were used in hydrodynamic modelling to run the flood simulations and derive the flood inundation and hazard maps. HEC-RAS 6.5 was used to perform coupled 1D/2D flood simulations under the heterogeneous topographic conditions of the studied Vipava River reach. The 1D/2D approach considers lateral interactions between the river channel (1D) and the floodplain (2D), allowing for a more detailed and accurate representation of flood characteristics (Pasquier et al., 2019). The 1D numerical solution was obtained using the Finite Difference method, while the 2D computational domain was solved using the Diffusion Wave equation. The use of the diffusion wave formulation in the 2D domain may simplify the representation of locally complex hydraulic processes, such as rapidly varied flow, momentum driven effects, and flow interactions near hydraulic structures (USACE, 2022a). In the present application, however, these effects are expected to have a spatially limited influence on the simulated inundation extent. In topographically heterogeneous settings such as the ones along the Vipava river study reach, simulation results are sensitive to terrain representation, grid resolution, and roughness parameterization, particularly in wider and lower gradient floodplain areas. Different 2D grid cell sizes (5–100 m) were tested, smaller grid cell sizes considerably prolonged the simulation times. A 20 m cell size was identified as optimal in view of impact of 2D grid cell resolution on the difference in the modelled water level elevations and the inundated area extension. To ensure simulation stability and minimize percent error (USACE, 2022b), an adjustable time step based on the Courant number (0.45–1) was employed. To ensure comparability among simulations, the same numerical settings and channel geometry were used for all simulation runs, hydromorphological changes of the river channel were not considered (Donevska, 2022). The hydrodynamic model calibration was achieved through the adjustment of the river channel and floodplain roughness coefficients to align the modelled flood extension and water levels with the observed flood extension during 2010 flood event (Fig. 1). The Manning's roughness coefficient values for the Vipava river channel were calibrated against observed water levels during lower RP flood events. The hydrodynamic model validation, based on few additional lower magnitude flood events with available data on water levels at specific locations and inundation extent at specific sections along the Vipava river study area, demonstrated a satisfactory agreement with the observed data. The mean difference between the modelled and observed inundated area extension was 6 % (standard deviation of 3 %), which could be regarded as a general indicator of the uncertainty in the extent of the modelled inundation areas.
Although advances in computing infrastructure have made large ensembles of hydrodynamic simulations increasingly feasible, applying numerous simulations to extensive river reaches remains computationally demanding and can still limit their routine use in practical flood hazard assessment. In this instance, each simulation with the selected model parameters required approximately 3–5 h to complete. To limit the challenge posed by numerous simulations runs, we focused on targeted boundary scenario ensembles to evaluate the influence of model input data and parameters. These factors were generally identified in literature as critical for flood hazard assessment (e.g., Beven et al., 2014; Annis et al., 2020). The selected scenario ensembles aimed to consider the boundary conditions in terms of hydrological and hydraulic input data, such as the worst (e.g. by considering upper limits of the peak discharge confidence intervals and high roughness coefficients values) and the best-case scenarios (lower limits of the peak discharge confidence intervals and low values of roughness coefficients). Accordingly, three groups of scenario ensembles were defined to consider the following aspects. Scenario ensemble S1 addresses the impact of hydrological uncertainty associated with FFA for assessing discharge peaks. 10 % and 90 % CI and the design peak discharge values were considered. Scenario ensemble S2 examines the epistemic sensitivity of simulation results to ranges of floodplain hydraulic roughness coefficients. Scenario ensemble S3 focuses on the impact of temporal (successional) changes in the hydraulic roughness of the Vipava river channel. The original designed channel Manning's coefficient of 0.035, specified during the river regulation works in the 1970 s (scenario S3I), was compared with the calibrated channel Manning's coefficient range of 0.04–0.08 derived from past flood events (scenario S3II). Table 3 lists the 8 examined scenarios.

The flood hazard maps were elaborated in accordance with the national legislation of the Republic of Slovenia, which considers flood peaks with RP of 10, 100, and 500 years. The flood hazard classes were defined based on the combination of flood peak RP, water depth and the flow depth-velocity product, which are the most common criteria used for mapping flood hazard in many EU countries (Polese et al., 2024). The flood hazard classes criteria that were considered in the analysis are summarized in Table 4. The flood hazard maps were prepared by exporting water depth and the depth-velocity product raster data to GIS software to prepare the flood hazard maps. The most relevant criteria for defining spatial extension of flood hazard classes for the scenario ensembles was the inundation depth. According to the flood hazard class criteria, the depth-velocity product was the prevailing flood hazard criteria only in spatially constrained areas along the main Vipava river channel where channel banks or levees were intensively overtopped during specific flood scenario.

2.2.3 Global sensitivity analysis and weighted exceedance probability of inundation (WEPI)
Global sensitivity analysis of the hydrodynamic simulation results was conducted using a surrogate-assisted Morris method, a computationally efficient screening approach that perturbs one parameter at a time along randomized trajectories in the parameter space and evaluates resulting changes in model output (Herman et al., 2013; Nabi et al., 2021). The method produces two diagnostic indices: the mean absolute elementary effect (μ*), indicating overall importance, and the standard deviation of effects (σ), indicating nonlinear behaviour or interactions among factors. Because the Morris method demands fewer model simulations than variance-based approaches, it is an attractive choice for hydrologic and hydrodynamic modelling when computational resources are limited but dependable parameter sensitivity analysis is required (Li et al., 2023). This efficiency makes the Morris method particularly valuable in flood risk mapping workflows, where uncertainties in hydrodynamic model input data and sensitivity of the models strongly influence inundation patterns (Rebolho et al., 2018). The surrogate-assisted Morris screening analysis was applied to three uncertain input factors: peak discharge Qp, floodplain roughness (nfloodplain) and channel roughness (nchannel). The parameter ranges were defined from the simulation ensemble, with Qpsampled between 323 and 522 m3 s−1, nfloodplain between 0.035 and 0.120 and nchannel between 0.030 and 0.080. The roughness coefficients were spatially variable in the coupled 1D/2D hydrodynamic model, the spatial variability in roughness was reduced to domain-level scalar descriptors for the surrogate analysis. For the 1D channel, nchannel was represented by the arithmetic mean of the roughness coefficients assigned within the channel domain, whereas nfloodplain was represented by the area-weighted mean of the roughness coefficients across the 2D floodplain computational domain. Consequently, the analysis represents the influence of changes in the overall roughness characteristics of the floodplain and channel domain, rather than sensitivity to the spatial variability in roughness characteristics.
Morris analysis was implemented using linear surrogate models fitted to the 24 hydraulic simulations (8 for each discharge RP). Because the available hydrodynamic simulations were not generated along formal randomized Morris trajectories, linear surrogate models were fitted to the available simulations and subsequently evaluated at the Morris design points. For each response variable Y, the surrogate model was formulated as follows:
where Y represents the hydraulic simulation response metric (inundation extent and maximum inundation depth), β0 is the intercept, β1, β2, β3 are fitted regression coefficients, and ϵ denotes the residual error. The surrogate formulation included no nonlinear or interaction terms. Surrogate evaluations were restricted to the parameter ranges represented by the original hydraulic simulation ensemble to avoid extrapolation beyond the training domain.
A one-at-a-time Morris design with 40 trajectories, 8 grid levels, and a step size of 2 grid levels was applied to the surrogate models, corresponding to 160 surrogate model evaluations for three parameters. After trajectory filtering, 39 valid trajectories were retained, corresponding to 156 effective Morris evaluations. Surrogate performance to reproduce the hydrodynamic simulations was evaluated before interpretation of the Morris indices using the coefficient of determination (R2), root-mean-square error (RMSE), and mean absolute error (MAE). Predictive performance was additionally assessed using leave-one-out cross-validation (LOOCV), in which each of the 24 hydraulic simulations were successively excluded from model fitting and predicted using the remaining simulations.
The resulting Morris indices were interpreted as surrogate-assisted screening measures rather than as direct elementary effects of the hydrodynamic model. Emphasis was placed on μ* as a measure of relative factor influence. The σ values were interpreted more cautiously because the linear surrogate formulation cannot explicitly represent nonlinear responses or parameter interactions that may occur in the underlying hydrodynamic model. The sensitivity analysis based on the surrogate model is consistent with recent flood inundation uncertainty studies that use response surface or emulator approaches to reduce the computational burden of hydrodynamic model uncertainty propagation (Herman et al., 2013; Aitken et al., 2024; Fraehr et al., 2024; Siripatana et al., 2025), as well as with applications of Morris screening to 2D flood inundation modelling, where roughness and hydraulic boundary conditions are key uncertain parameters (Ullah et al., 2024).
Assessing inundation probabilities offers valuable insight into the likelihood and spatial distribution of flood events, enabling a more nuanced understanding of flood risk (Merz et al., 2014). The weighted exceedance probability of inundation (WEPI) was calculated through two step procedure. Firstly, for a raster cell x and simulation i, inundation was defined using the binary indicator
where hi,T(x) is the simulated inundation depth at cell x and hthr is simulated inundation depth threshold, which was set to 0.01 m. It should be noted that the use of a low inundation depth threshold may increase sensitivity in the delineation of flooded cells. However, in the wide and low gradient floodplain areas along the studied reach, small variations in simulated water depth can lead to appreciable changes in local inundation extent; therefore, the selected threshold was retained to capture marginal inundation patterns.For each return period T, the scenario ensemble inundation probability Pens,T(x) was calculated independently as:
where NT is the number of simulations for return period T, and wi,T is the is the conditional weight assigned to simulation i. Because no independent likelihoods were assigned to the individual flood peak and roughness variants, all 8 scenarios within a given return period T were assigned equal weights (). Second, the composite weighted exceedance probability of inundation (WEPI) was calculated as:
where is the annual exceedance probability (AEP) weight assigned to return period T. The composite WEPI thereby emphasizes more frequent events (e.g., Q10) relative to rarer extremes (e.g., Q500). For the scenario ensembles considered in this study, the maximum attainable sum of the weights is 0.112 corresponding to a cell inundated in all scenarios within every considered RP (Q10, Q100 and Q500). For visualization and relative spatial comparison, the WEPI raster was additionally normalized to a 0–1 scale by dividing each cell value by the maximum attainable sum of the weights. A normalized WEPI value of 0 indicates no inundation in any simulation, whereas a value of 1 indicates inundation in all scenario ensembles across all considered RP classes. By aggregating inundated areas detected within the scenario ensembles using AEP-weighted procedure, WEPI provides comprehensive information on inundation occurrence across the considered flood RPs. Because the flood RP classes represent nested rather than mutually exclusive events, composite WEPI should be interpreted as an AEP-weighted inundation occurrence index under the selected scenario ensemble, rather than as a direct annual exceedance probability of inundation.
3.1 Uncertainty in hydrological input data
Uncertainty in the magnitude of the design discharge peak is generally a statistical issue that requires the selection of a specific probability distribution in the FFA (Rahman et al., 2013; Machado et al., 2015; Šraj and Bezak, 2025). In our case, the impact of the uncertainty in the estimation of the peak discharge (considered through the 10 % and 90 % CI of the FFA) expresses considerable influence on the simulation results of the hydrodynamic model. Comparing the results associated with the 10 % CI value and the design discharge peak values, the difference in the flood inundation area is 5 %–6 %, while the difference in the flood extent between the design discharge value and the 90 % CI value is in the range 4 %–7 %. The difference in the flood extent between the 10 % and the 90 % CI values is 11 %, 9 %, and 12 % for 10, 100, and 500 year RP, respectively. This is further reflected in the spatial distribution of the flood hazard classes (Fig. 4). It should be noted that differences in inundation extent of only a few percent are generally within the uncertainty range of the simulated inundation extent when compared with observed inundation extent.
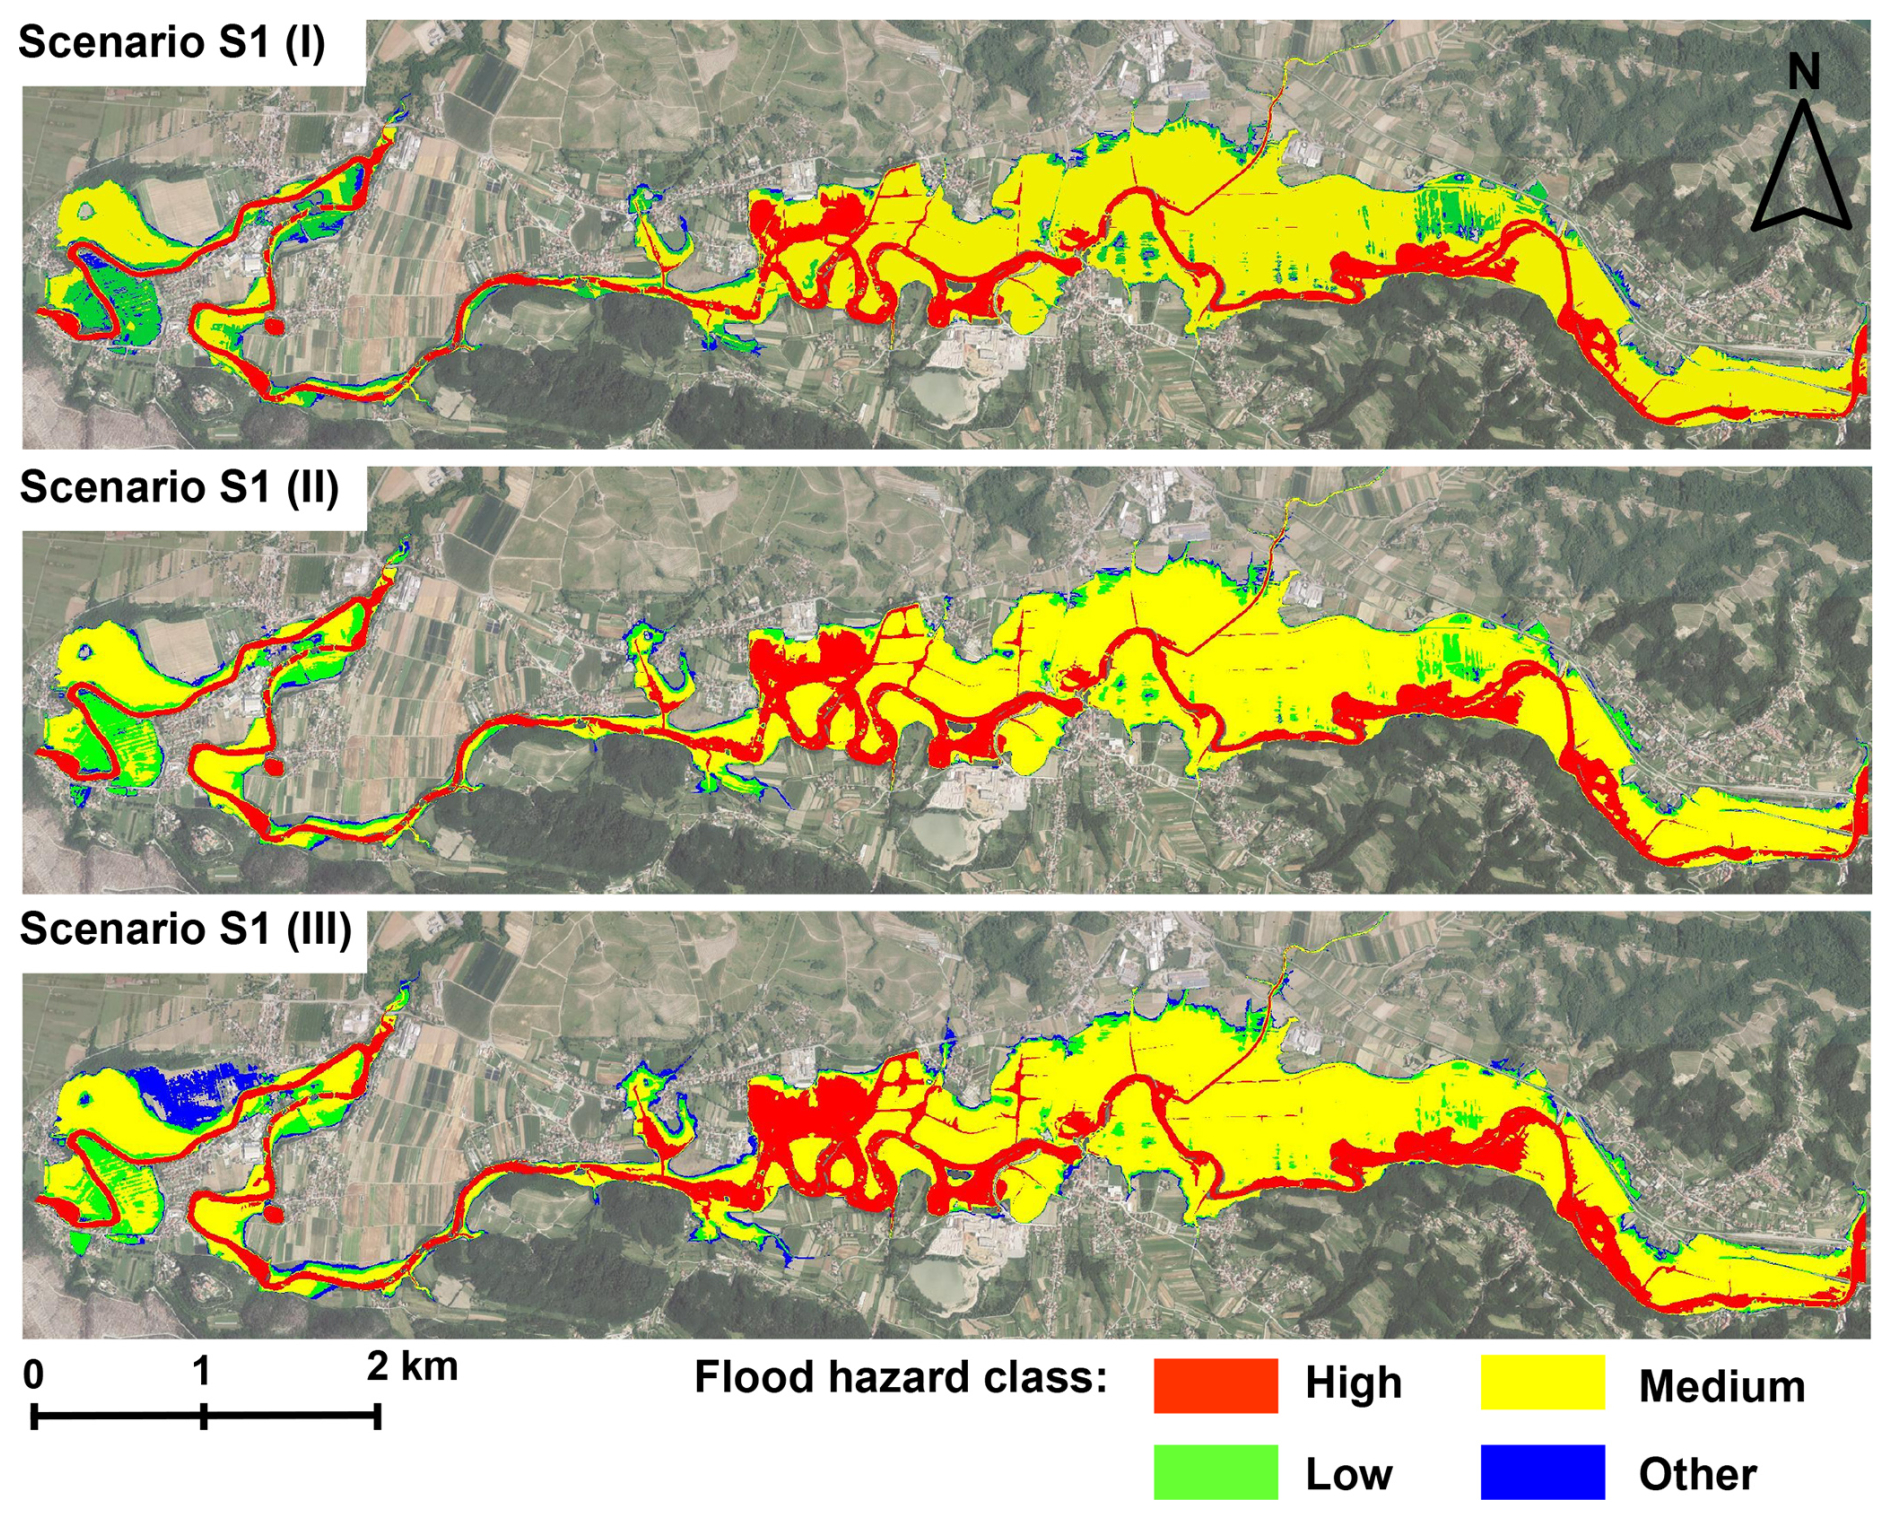
Figure 4Flood hazard class spatial extension for scenario ensemble S1 - uncertainty in peak discharge estimation. (upper map): 10 % CI; (middle map): design discharge peak value; (lower map): 90 % CI. Imagery source: © GURS, 2025.
The increase in the total flood prone area caused changes in the spatial extent of the high flood hazard class (an increase of approx. 30 %) when comparing the 10 % and 90 % CI discharge values (Fig. 5). The area of the medium flood hazard class also increases slightly, while the area of the low hazard class decreases at the expense of the higher hazard classes expansion. The spatial expansion of the other flood hazard class significantly increases with the peak discharge (60 % when comparing the design discharge and the 90 % CI values), visually evident mainly along the right bank in the downstream part of the studied Vipava river reach where the floodplain is relatively flat (Fig. 4). This area is mostly used for intensive agriculture (orchards), in smaller parts also urbanized.
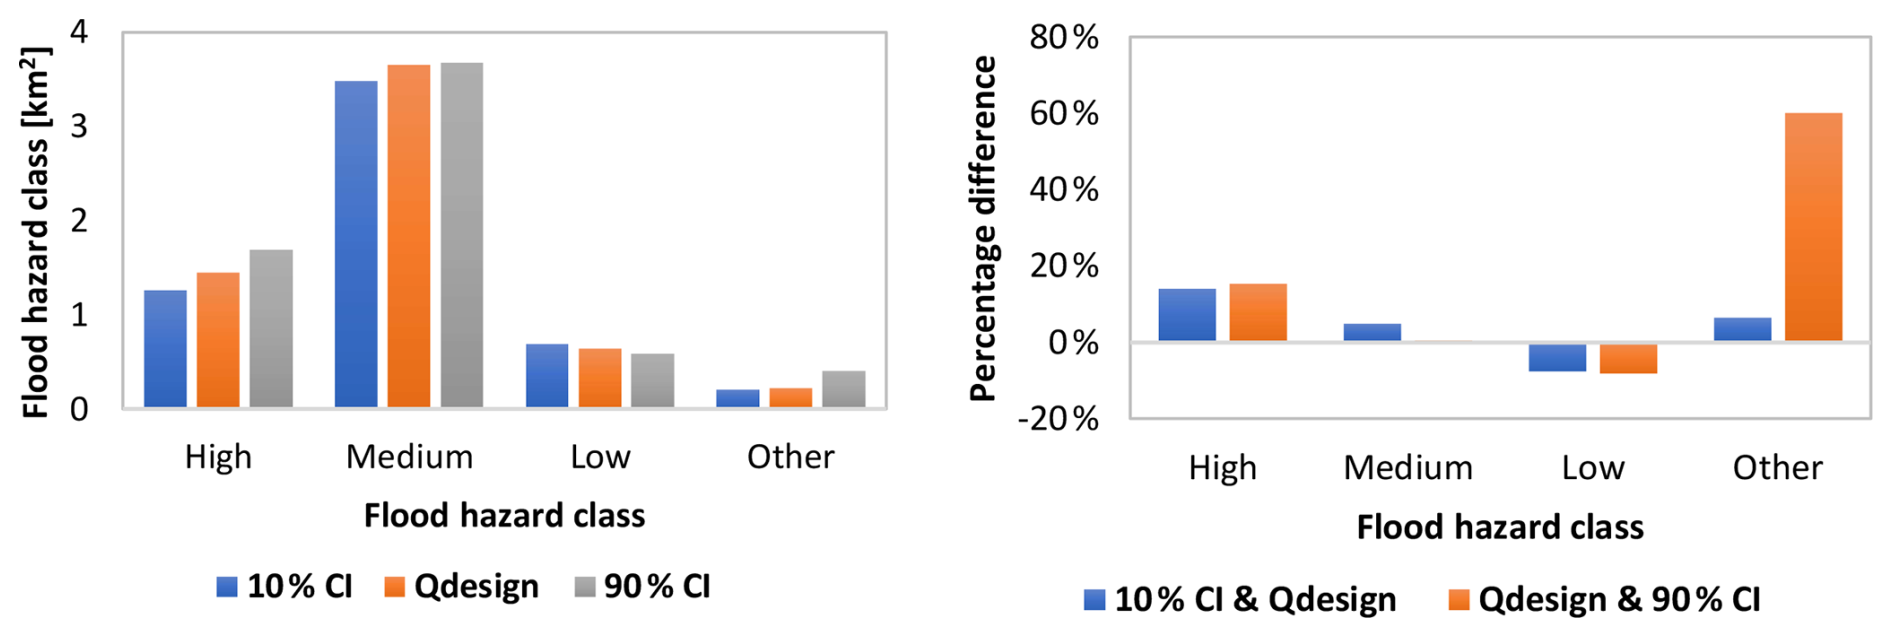
Figure 5Comparison of the spatial extension of flood hazard classes for scenario ensemble S1 – uncertainty in peak discharge estimation.
3.2 Sensitivity of the flood hazard mapping on the hydraulic roughness characteristics
The problem of selecting the appropriate hydraulic roughness coefficient for the floodplains considered as the 2D computational domain in the hydrodynamic model simulations has been discussed by several authors (e.g., Casas et al., 2010; Wright et al., 2017; Zahidi et al., 2018). The sensitivity analysis of the varying floodplain Manning's roughness coefficients of the particular land use patterns in the studied floodplain areas overall expresses increase in the inundation extent. However, the results indicate that the Manning's roughness coefficients of the floodplain areas have a relatively limited influence on the flood extent from the spatial perspective of the analysed Vipava river reach. The difference in the inundation extent when comparing the scenarios of minimum and maximum Manning's values is about 6 % for the 10 year RP flood and around 4 % for the 100 and 500 year RP floods. The variability in the extension of the inundated areas and consequent extension of flood hazard areas is more noticeable in the areas with gentle slopes, mostly along the right bank of the Vipava river channel, where the floodplains are wider (Fig. 6).
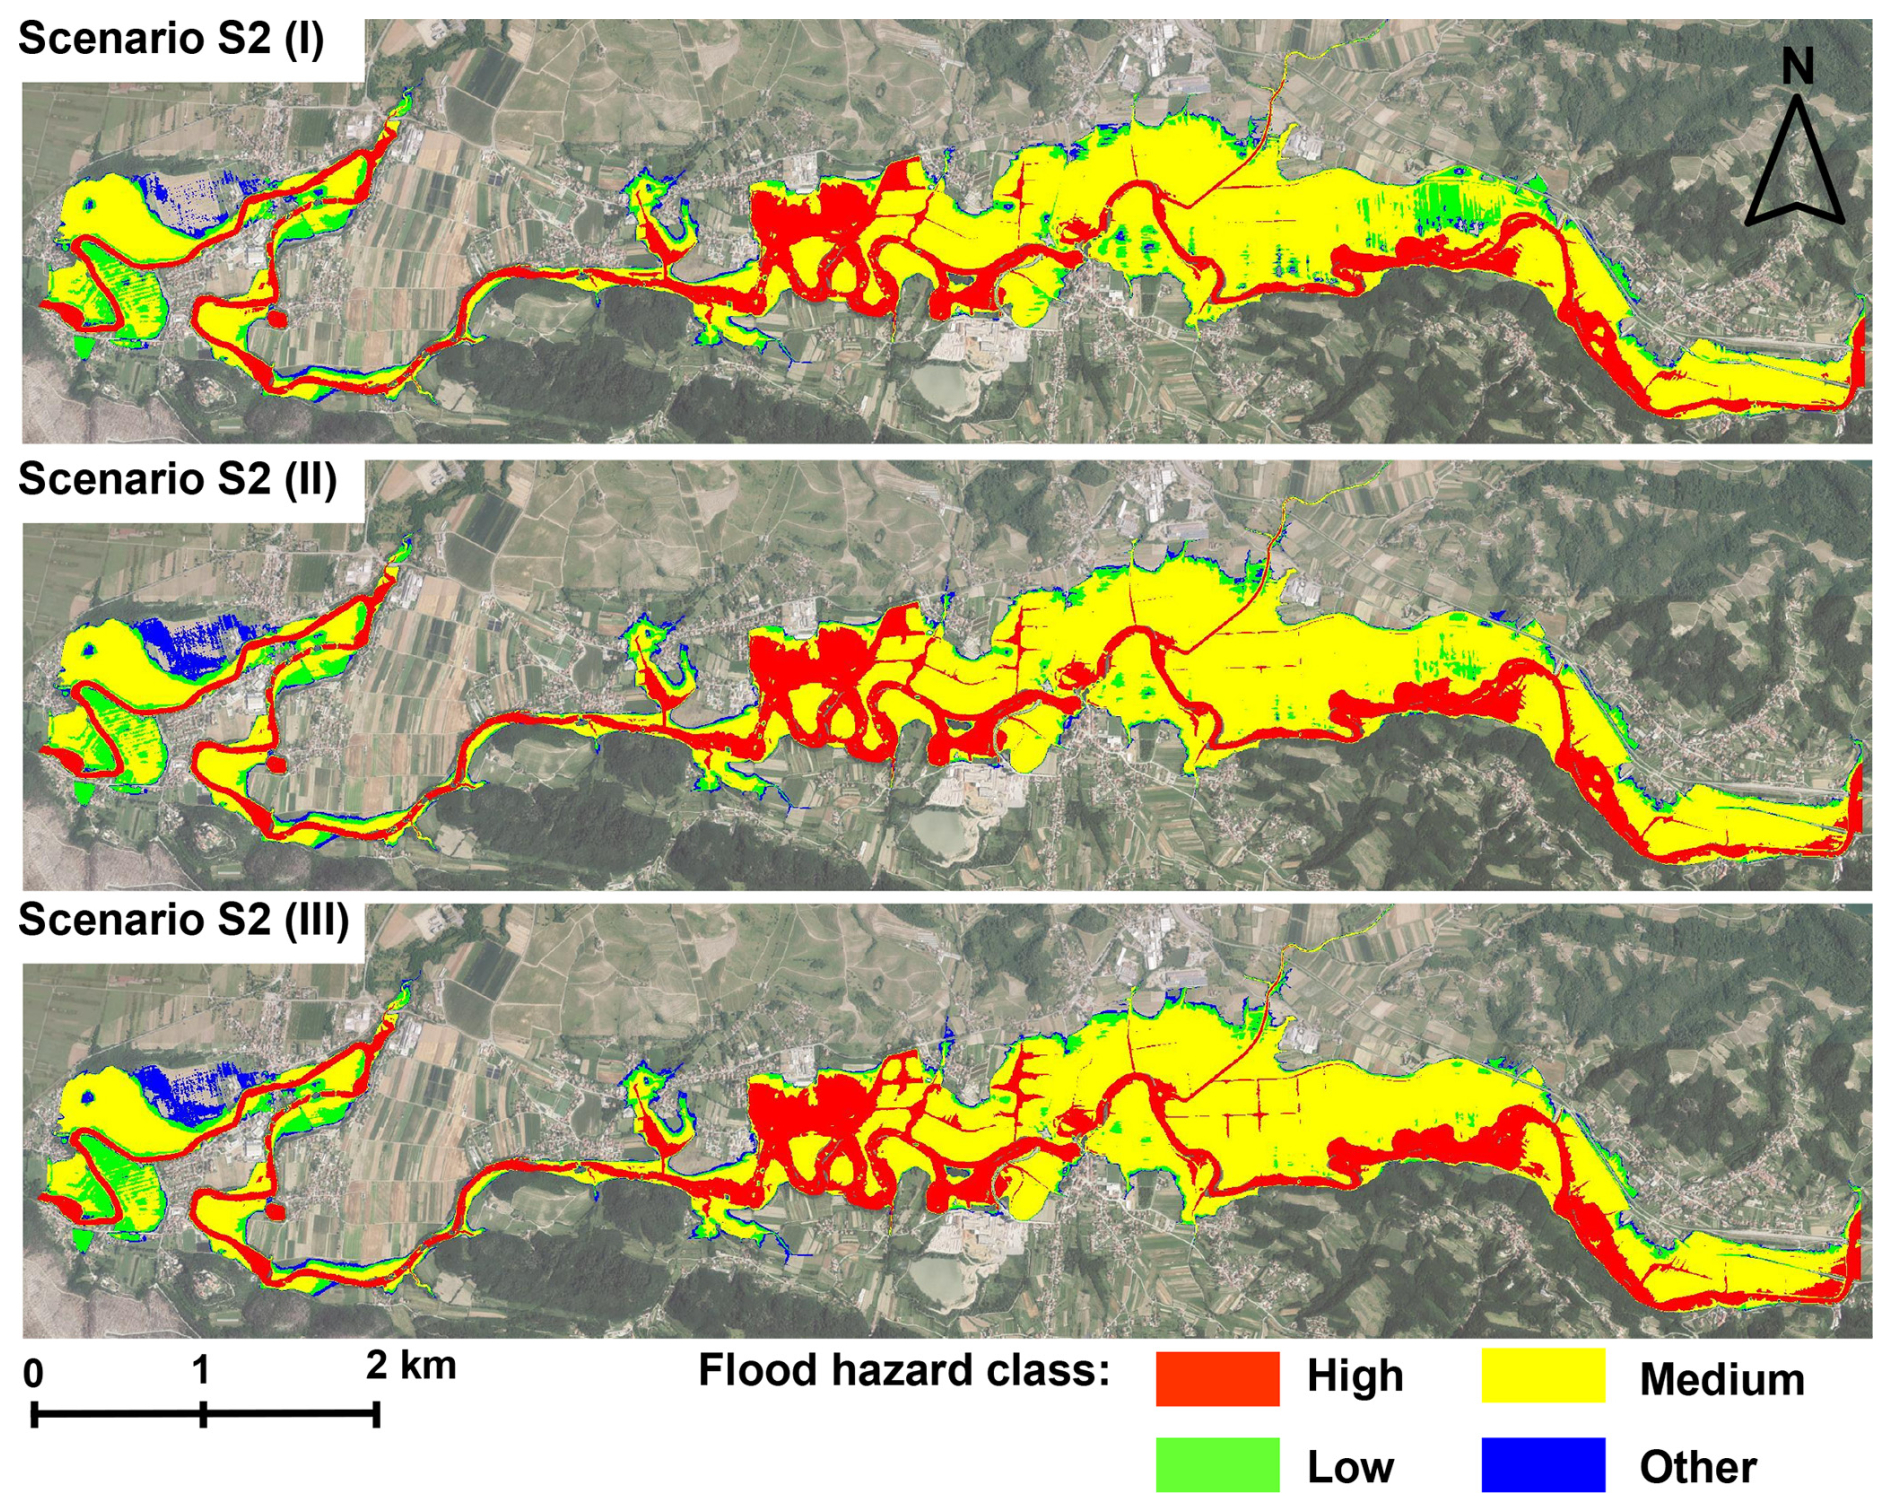
Figure 6Flood hazard class spatial extension for scenario ensemble S2 – different floodplain roughness characteristics. (upper map): low floodplain roughness; (middle map): recommended floodplain roughness; (lower map): high floodplain roughness. Imagery source: © GURS, 2025.
In this respect, the influence of varying floodplain roughness coefficient appears to be limited. However, some interesting shifts in the flood hazard class extension could be observed. The highest variability in the spatial extent was observed for the low flood hazard class, which amounted to a total decrease in the spatial extent for approx. 25 % when comparing the scenarios of minimum and maximum roughness coefficients of the floodplain areas (Fig. 7). Some parts of the flood inundation area that were assigned to the lower hazard class when considering lower Manning's coefficient values were assigned to the higher hazard class when considering increased Manning's coefficient values.
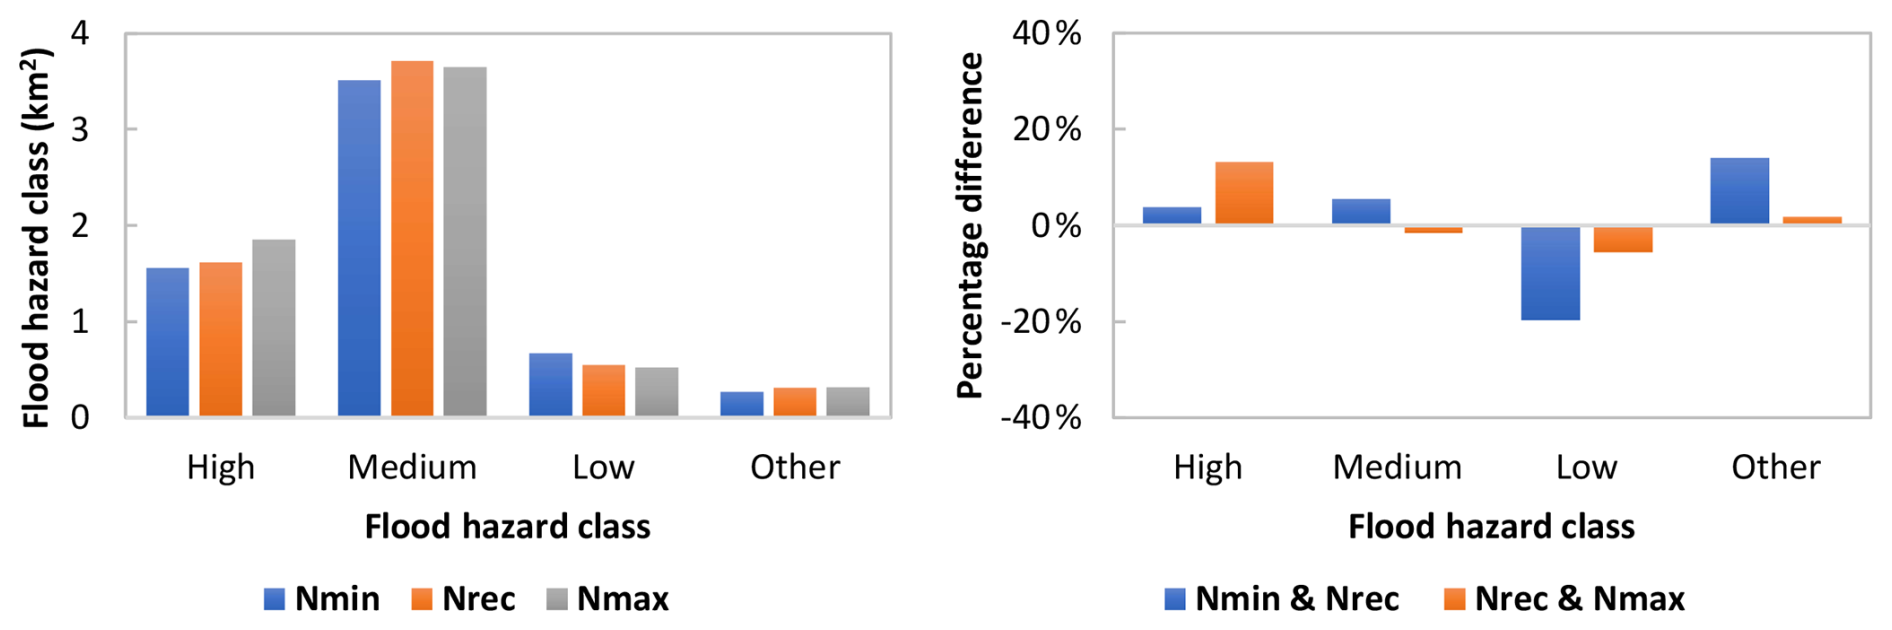
Figure 7Comparison of the spatial extension of flood hazard classes for scenario ensemble S2 – different floodplain roughness characteristics.
When several sections of the Vipava river channel were regulated and widened in the 1970s and 1980s, the designed Manning's values of the river channel were in the range of 0.030–0.035 and the designed hydraulic conveyance was in the range of 10–20 year flood RP. However, in recent decades, the channel cross-section has been successively heavily overgrown by the riparian vegetation, and recent flood events have shown a significant increase in the channel area hydraulic roughness. The inundation and flood hazard classes extension obtained from the simulation using the designed channel Manning's coefficient value and the calibrated values based on past flood events were compared. A significant increase in the flood inundation area for a 10 year RP flood could be detected demonstrating a high sensitivity of simulated inundation area expansion to channel roughness coefficients. Higher main channel roughness coefficients significantly reduce the hydraulic conductivity of the Vipava River channel, causing the flow to overtop the channel banks intensively even during peak flows with a lower RP (e.g., Q10). Changes in the channel roughness coefficient causes a considerable increase in the inundation extent and spatial extent of higher flood hazard classes (Fig. 8). When comparing the simulation results associated with the designed and the calibrated channel Manning's roughness coefficients (the values close to maximum recommended), the overall increase in the inundated area was approx. 45 % for a 10 year flood RP. For 100 and 500 year RP events, the increase in the flood extent was 15 % and 11 %, respectively.
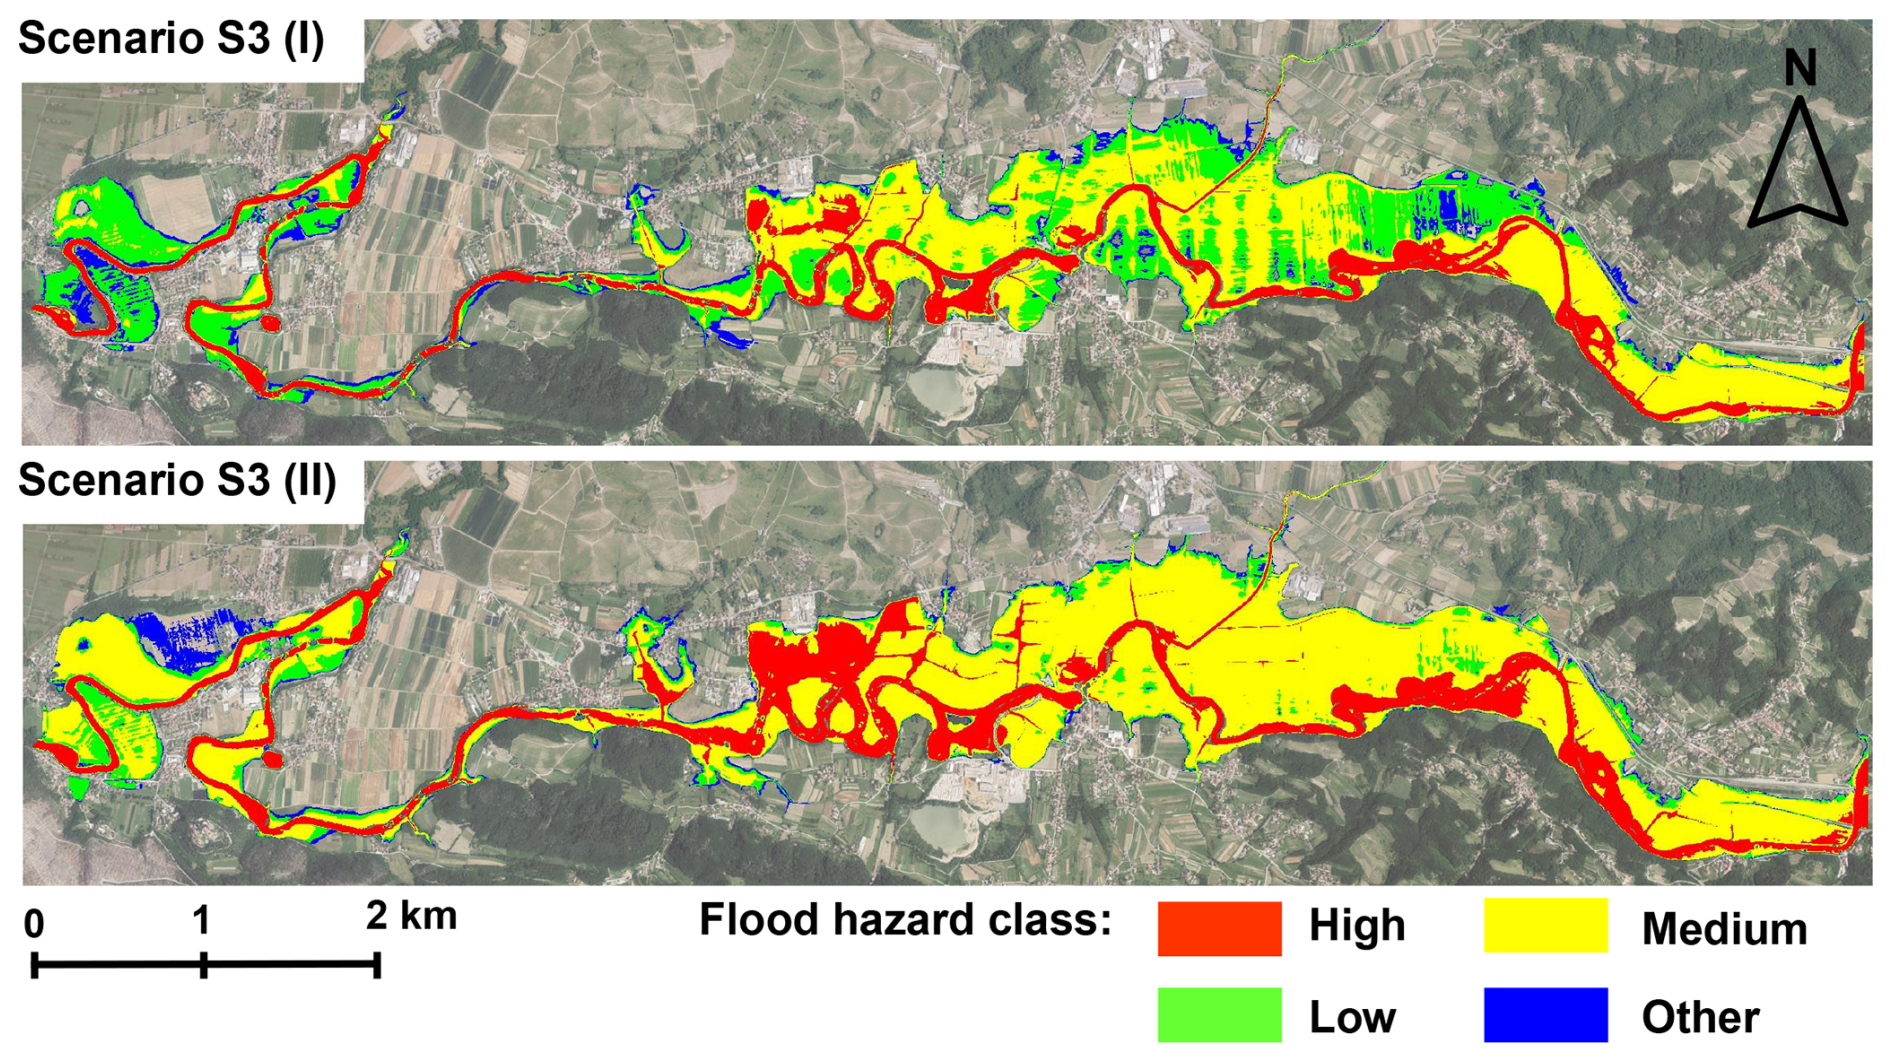
Figure 8Simulation results for scenario ensemble S3 – different river channel roughness characteristics. (upper map): design channel roughness; (lower map): calibrated channel roughness. Imagery source: © GURS, 2025.
The spatial extent of the high and medium flood hazard classes shows an increase of approx. 40 %, while the low and other flood hazard classes show a decrease of approx. 90 % and 40 %, respectively (Fig. 9). It should be noted that the expansion of the higher flood hazard classes causes a decrease in the expansion of inundated areas previously classified in the low and other flood hazard classes.
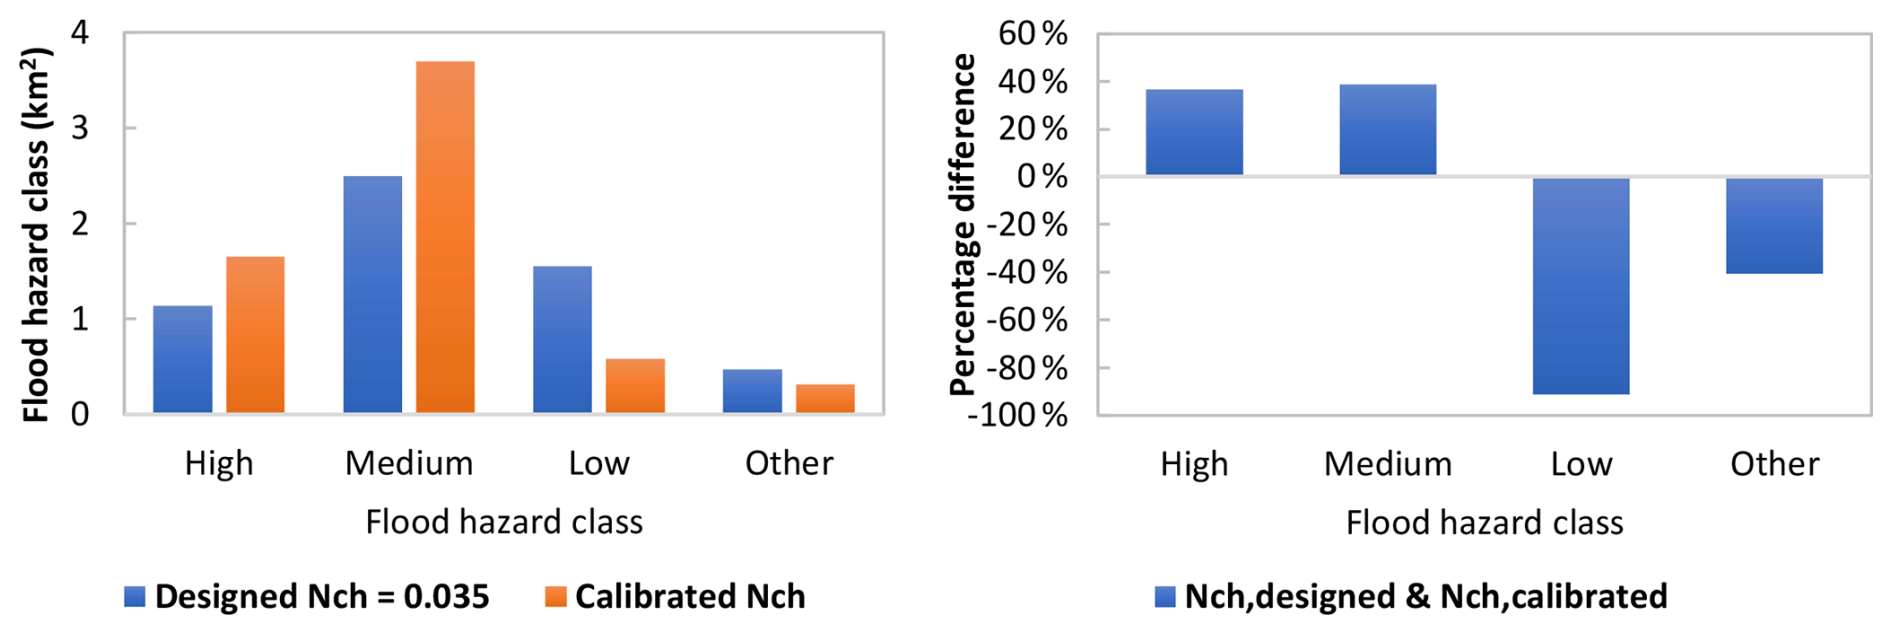
Figure 9Comparison of the spatial extension of flood hazard classes for scenario ensemble S3 – different river channel roughness characteristics.
3.3 Sensitivity analysis of inundation extent and maximum inundation depths
The linear surrogate models reproduced the hydrodynamic model responses with good accuracy within the parameter ranges represented by the 24 hydraulic simulations. For inundation area and maximum inundation depth, the fitted surrogates yielded R2 values of 0.92 and 0.97, RMSE values of 0.21 km2 and 0.08 m, and MAE of 0.15 km2 and 0.06 m. LOOCV yielded values of 0.81 and 0.92, with RMSELOOCV values of 0.32 km2 and 0.10 m, and MAELOOCV of 0.20 km2 and 0.08 m for inundation area and maximum inundation depth, respectively. The cross-validation results indicate satisfactory predictive performance for observations omitted individually during model fitting, although the lower cross-validated performance for inundation area indicates greater surrogate uncertainty than for maximum inundation depth. Given the limited sample size and the absence of independent validation data, the diagnostics support use of the surrogate models for screening-level Morris sensitivity analysis within the sampled parameter domain.
The results of the Morris method sensitivity analysis for inundation extent and maximum inundation depth are shown in Fig. 10. The results indicate that the inundation area is primarily controlled by variations in channel roughness and peak discharge, which exhibited the largest μ* values and thus the strongest main effects. In contrast, floodplain roughness appears to contribute marginally to variations in inundation extent. For maximum inundation depth, peak discharge emerged as the dominant driver, while channel roughness showed a secondary but appreciable influence. σ values were generally low, primarily reflecting the additive linear structure of the surrogate models. They should therefore not be interpreted as evidence that the underlying hydrodynamic model is free of nonlinear responses or parameter interactions. Overall, these results indicate that uncertainty in peak discharge estimate and sensitivity to channel roughness should receive particular attention when selecting hydrodynamic scenario ensembles for flood hazard mapping.
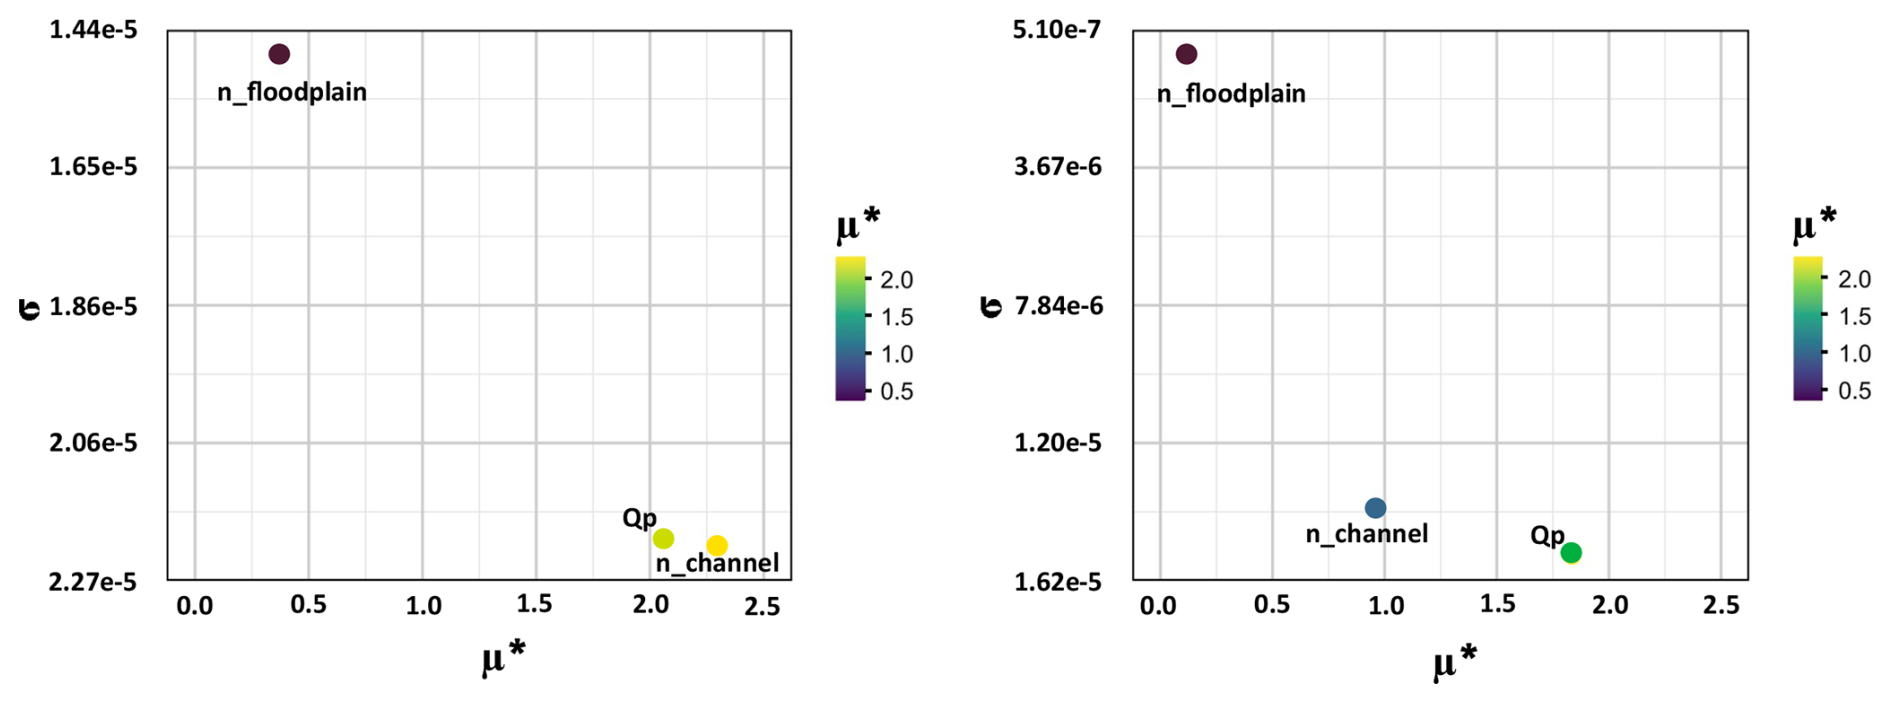
Figure 10Results of the Morris method sensitivity analysis for inundation extent (left) and maximum inundation depth (right).
The observed changes in spatial extension of inundated areas appears to be conditioned especially by the specific topography of the area, FFA uncertainty and roughness characteristics of the Vipava river channel. The topography of the floodplain affects the extension of the inundated areas for different RP, as it limits the increase in inundated area extent in some parts of the floodplains. The differences in the spatial extent of the inundated areas are smaller in the narrower parts of the floodplain. On the contrary, the wider floodplain sections extending along the right bank show more pronounced spatial variability of flood extent and hazard classes.
3.4 Weighted exceedance probability of inundation in view of the critical land use classes
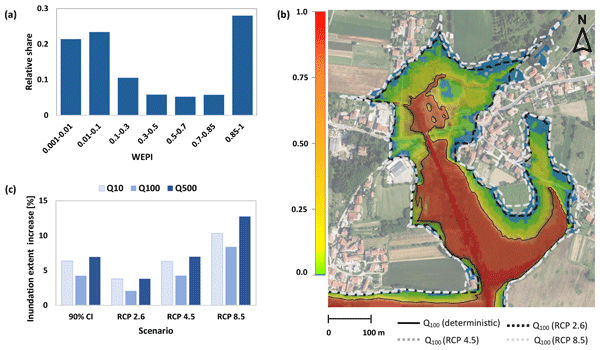
The main purpose of flood hazard maps elaboration is to steer the future spatial planning and restrict the unwise (e.g. build-up or intensive agriculture) land use in areas potentially exposed to flood hazard. In the three analysed scenario ensembles, the area of potentially inundated agricultural land ranges from 2.35–4.94 km2. The flood-prone built-up areas only cover a small portion of the inundated areas (0.06–0.25 km2). Due to the high spatial fragmentation, only a few larger built-up areas have high flood risk. The differences in the affected agricultural land use areas lies in the ranges up to 55 % for a 10 year flood, up to 20 % for a 100 year flood, and up to 15 % for a 500 year RP flood event. The difference in the extent of inundated built-up areas ranges up to 70 % for a 10 year flood event and up to 50 % for 100 and 500 year RP events, respectively. Figure 11 shows a map of WEPI spatial distribution along the studied Vipava River reach. By identifying areas that are repeatedly inundated across the considered scenario ensembles (elevated normalised WEPI values, e.g. >0.5), consideration of inundation probability could support the precautionary principle, whereby land use decisions are informed by the potential inundation probability conditioned by uncertain future conditions.
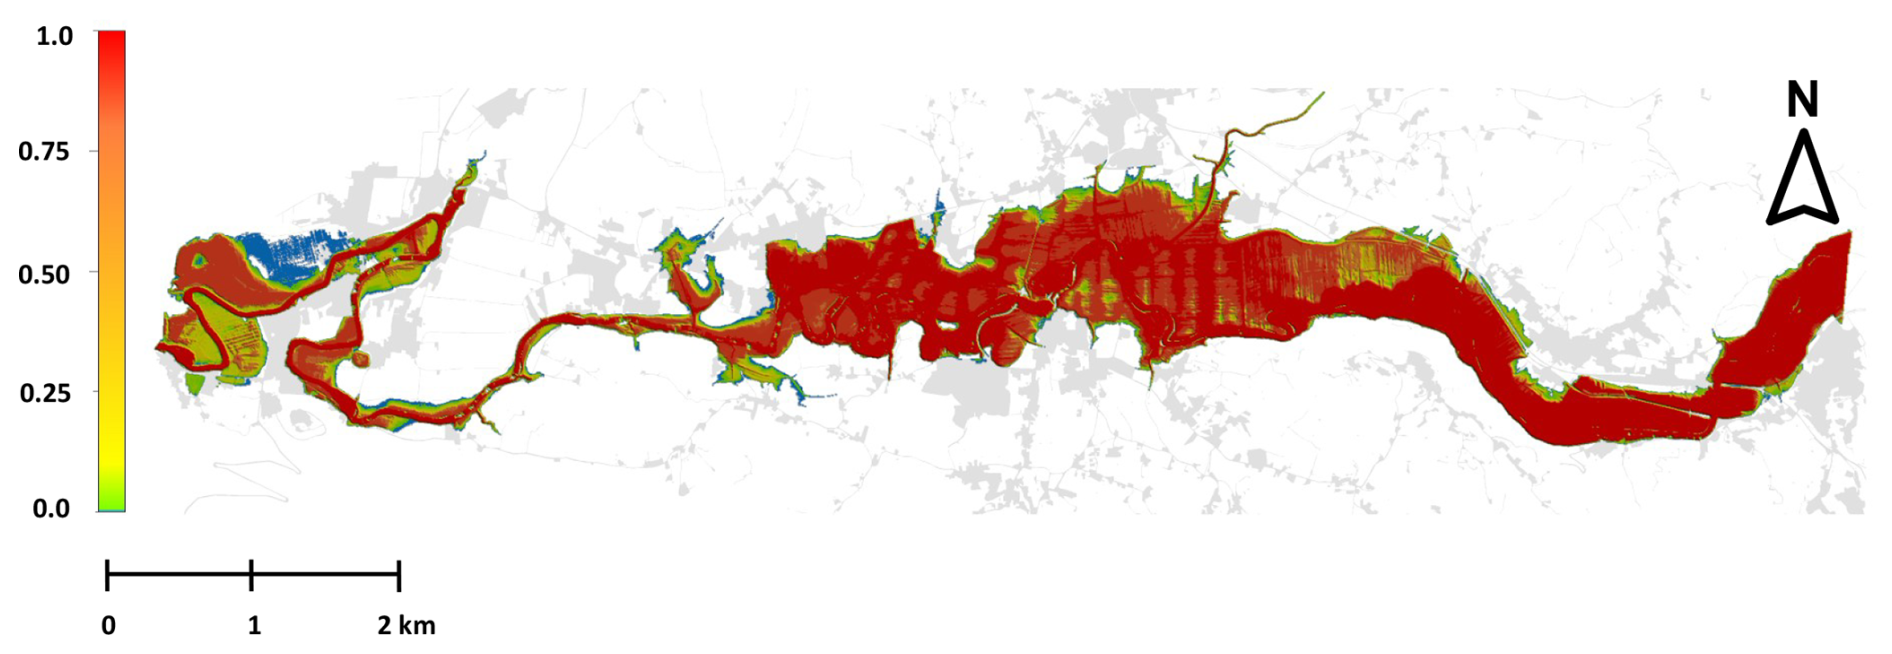
Figure 11Normalised values of weighted exceedance probability of inundation (WEPI) for the considered scenario ensembles. Gray shaded polygons indicate build-up areas.
Figure 12a shows WEPI over bult-up areas expressed as relative shares of inundated areas. Interestingly, approx. 40 % of the build-up areas are positioned in areas of elevated WEPI (normalised WEPI values>0.5) according to the considered scenario ensembles. This suggests that, under the precautionary principle, built-up areas with elevated WEPI should be treated as potentially flood prone even where deterministic boundaries may appear less restrictive to avoid future development into locations exposed to uncertain flood hazard. Large proportion of build-up areas falling into high WEPI (normalised WEPI values>0.85) is related to road infrastructure crossing the floodplain areas.
Figure 12b compares the WEPI with the deterministic inundation extent of the Q100 RP design flood event as regulatory flood hazard boundary and the Q100 inundation extents for the RCP 2.6, RCP 4.5, and RCP 8.5 scenarios. Figure 12c shows the increases in inundation extent for the FFA 90 % confidence interval representing hydrological uncertainty and the RCP scenarios relative to the deterministic Q10, Q100, and Q500 design flood events under the same hydrodynamic model settings. The RCP 8.5 scenario produces greater increases in flood extent than the FFA 90 % confidence limits, whereas the increases associated with the FFA 90 % confidence interval used to derive WEPI generally fall within the range projected under RCP 2.6 and RCP 4.5. The comparison of scenario ensembles and the RCP-based inundation extents shown in Fig. 12 is intended as a contextual benchmark rather than as an additional component of the uncertainty analysis. The rationale is that the FFA confidence intervals represent hydrological uncertainty incorporated in WEPI, whereas the simplified RCP-based peak increases introduce additional uncertainty related to climate projections, downscaling or changed hydrological response.
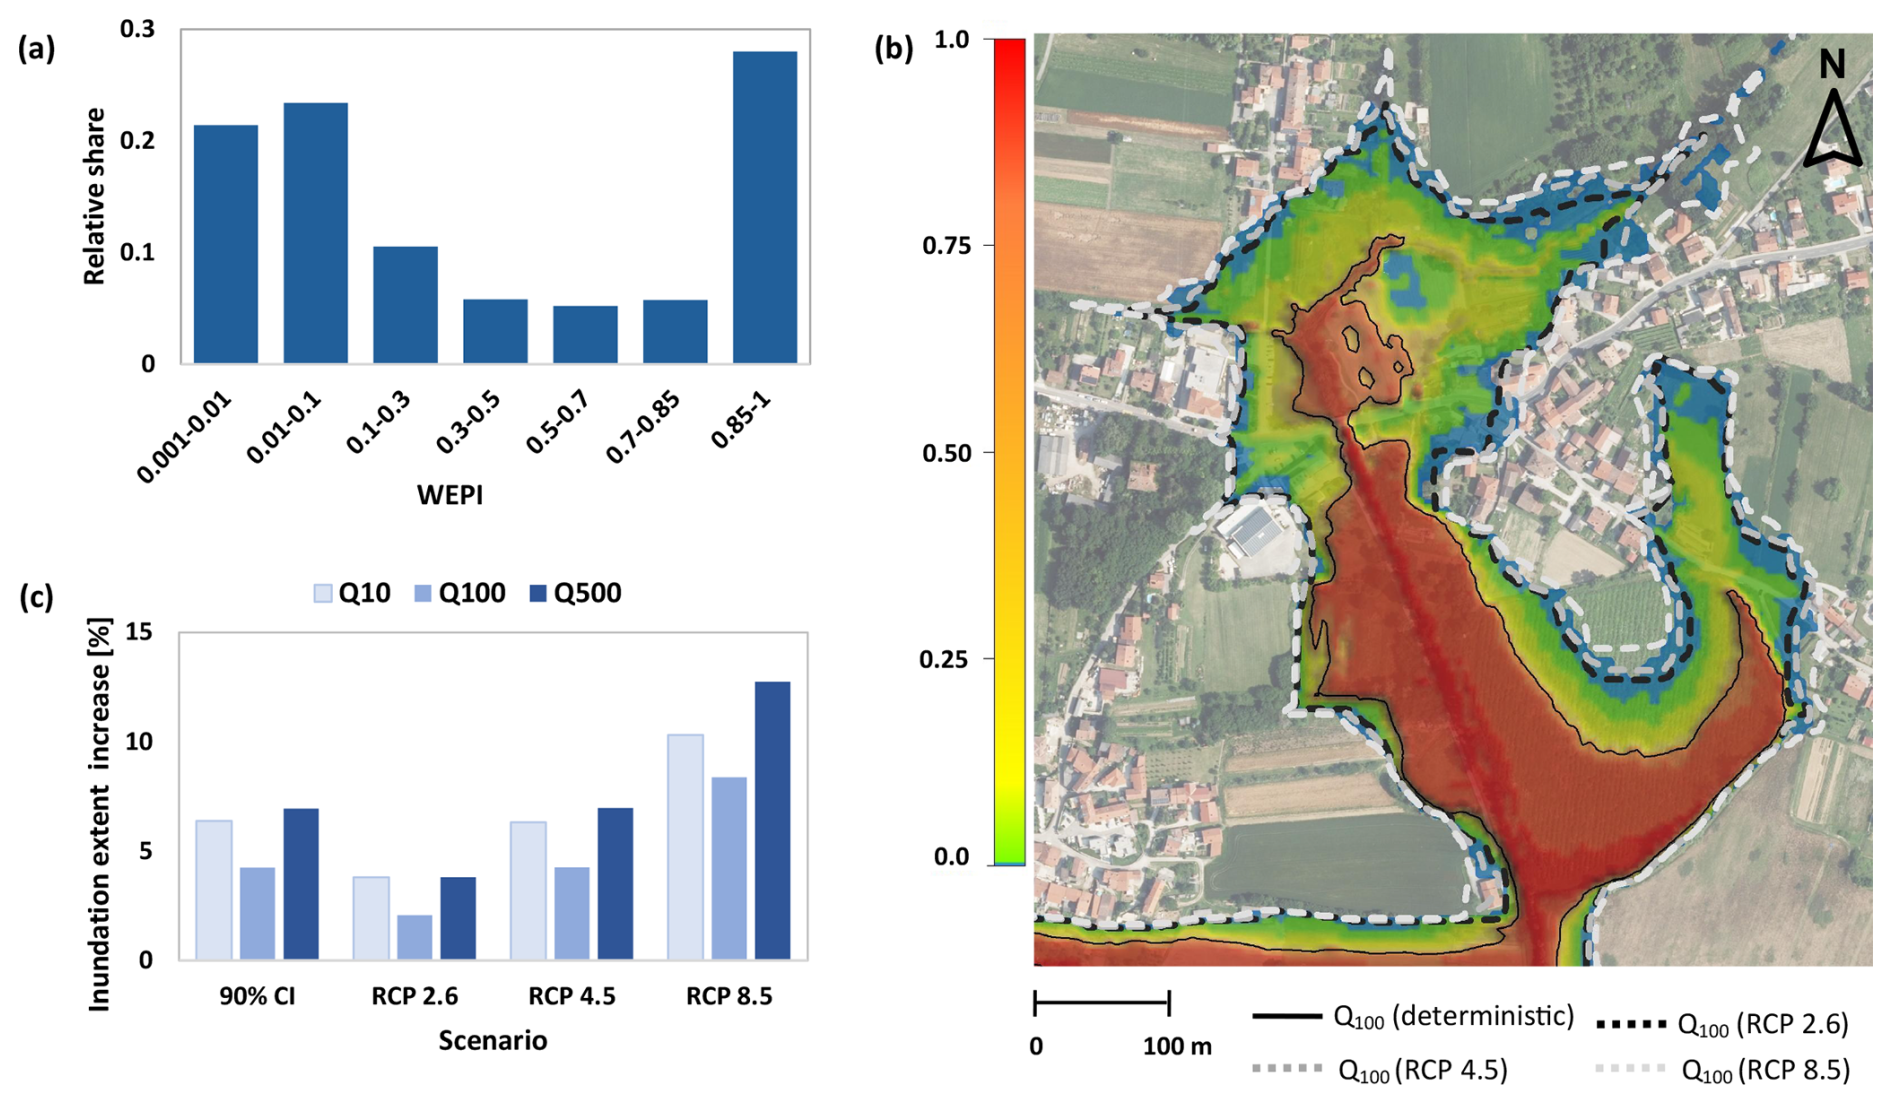
Figure 12(a) WEPI over bult-up areas expressed as relative shares of inundated build-up areas. (b) Comparison of WEPI, the deterministic inundation extent of the Q100 RP design flood event and inundation extent for RCP 2.6, RCP 4.5 and RCP 8.5 scenarios. (c) Increases in inundation extent under the FFA 90 % confidence interval representing hydrological uncertainty and the RCP scenarios relative to the deterministic Q10, Q100, and Q500 design flood events. Imagery source: © GURS, 2025.
The results demonstrate that flood hazard mapping in the studied Vipava River reach is strongly shaped by the combined effects of hydrological input uncertainty and hydraulic roughness sensitivity. Building on these findings, the discussion examines how the use of scenario ensembles and derivation of WEPI could advances flood hazard assessment by translating uncertainty and sensitivity information into spatially explicit indicators that could help researchers, practitioners, and stakeholders responsible for spatial planning to better identify areas where deterministic flood boundaries may underestimate future or recurrent flood exposure.
Natural uncertainty in design flood estimation is an inherent limitation of FFA (Merz and Thieken, 2005), there is no guarantee that any of the statistical methods will always produce design discharges that will match the observed flood peak values. Selecting a single design discharge is problematic because different plausible distributional assumptions, limited discharge record length or rating curve uncertainties can lead to substantially different flood peak estimates for the same RP (Steinbakk et al., 2016; Okoli et al., 2019). Moreover, determining the design discharge for a given RP may be subjected to additional uncertainties related to the non-stationarity of the discharge data and the resulting impact on the analysis of flood magnitude and frequency (Machado et al., 2015; Stephens and Bledsoe, 2020). Interestingly, the confidence intervals of the FFA considered in our study fall within the ranges of the anticipated increase in peak discharge under the RCP 2.6 and 4.5 scenarios, as projected in the climate change assessment for Slovenia until the end of the 21st century (ARSO, 2018). The worst-case RCP 8.5 scenario (anticipated 20 % increase in flood peaks) somewhat exceeds the 90 % FFA confidence intervals for all considered flood peak RP. Therefore, the uncertainty in the FFA considered in this study may partly overlap with the projected increase in flood peaks under the RCP 2.6 and RCP 4.5 scenarios. This suggests a practical link between FFA uncertainty and the projected rise in flood peaks driven by climate change, suggesting that their joint consideration can provide a robust basis for assessing future flood hazards, although it should not be interpreted as a full assessment of climate change uncertainty.
The impact of roughness coefficients in the floodplains on inundation extent is well documented in hydraulic modelling literature, where higher roughness values typically associated with vegetated or urbanized floodplains lead to slower flow velocities and increased water surface elevations. Higher floodplain roughness coefficients may induce local increases in water levels by reducing overbank conveyance, particularly in wider and lower gradient floodplain sections, thereby causing greater lateral expansion of inundation (Mosquera-Machado and Ahmad, 2007; Bhola et al., 2019; Barinas et al., 2024). Warmink et al. (2013) quantified the uncertainty in design water levels due to hydraulic roughness in the River Waal, showing that vegetation roughness in floodplains contributed significantly to the overall uncertainty. Praskievicz et al. (2020) demonstrated that flood extent predictions are highly sensitive to both topographic resolution and Manning's n values, especially in floodplains where land cover is variable. The selection of the higher floodplain roughness conditions could effectively account for the future changes in floodplain land use on the inundation extent. However, in the studied Vipava River reach, the influence of varying floodplain roughness coefficient on inundation area extent and maximum inundation depth appears to be limited when compared to influence in peak discharge estimates variations and changes in channel roughness. This may indicate that the floodplain roughness primarily affects local flow redistribution and associated shifts between flood hazard classes rather than the overall inundation extent.
Further, our results suggest that overlooking the potential influence of successional changes in channel roughness may be extremely dangerous, especially with respect to more frequent flood events. Changes in channel roughness can substantially alter flood stages, conveyance, and inundation extent, particularly where reduced channel conveyance promotes earlier bank overtopping during lower magnitude floods (Khosh Bin Ghomash et al., 2025; Praskievicz et al., 2020). This mechanism is clearly reflected in the studied Vipava River reach, where increased channel roughness associated with riparian vegetation overgrowth produced a pronounced expansion of inundation extent for the 10 year RP flood event. The effect was less pronounced for the 100 and 500 year events, suggesting that channel roughness is most influential when floodplain activation is still controlled by main channel conveyance. Reduced channel conveyance can therefore lead to a larger relative expansion of inundation extent during lower RP floods, whereas its relative influence decreases during higher magnitude events once floodplain activation is already widespread (Lamichhane and Sharma, 2018; Mehedi et al., 2024). In this context, sensitivity testing of hydrodynamic simulation workflows, particularly with respect to succession changes in river channel roughness, could substantially enhance the robustness of flood hazard assessment. The resulting expansion of high and medium flood hazard class, which in many countries imposes considerable restrictions on spatial planning, should therefore be more explicitly incorporated in flood risk mitigation strategies as discussed by Greiving et al. (2025) and Bodoque et al. (2023).
Stephens and Bledsoe (2023) show that flood hazard maps that do not account for uncertainty may substantially underestimate exposure to future flooding and provide a false sense of protection. Probabilistic flood hazard mapping has been shown to reveal spatial patterns of hidden or transitional risk that are not captured by deterministic flood boundaries, making it particularly suitable for risk zoning and development of decision support systems in flood-prone areas (Van der Most et al., 2018; Stephens and Bledsoe, 2020; Sun et al., 2022; Sanchez et al., 2023). Nevertheless, such maps are often difficult to interpret, particularly for end users who are less familiar with probabilistic flood hazard information. The indices such as WEPI could complement deterministic regulatory flood maps by identifying areas where recurrent exposure remains plausible under uncertain future conditions. The results shown in Fig. 12 clearly demonstrate that spatial development near “deterministic” flood hazard boundaries combined with potential compounding impacts of changed hydraulic conditions in the river channel, uncertainty related to the FFA or anticipated changes in flood peaks due to climate change, have a high potential to considerably increase the flood risk of built-up areas. From a spatial planning perspective, areas with elevated WEPI could be prioritized for precautionary zoning, stricter development control, and targeted safeguarding of critical infrastructure and evacuation routes, while periodic updates of the probability maps could support revisions of local land use plans as new hydrological, climatic, or channel hydraulic condition information becomes available (Dimond et al., 2025). Additionally, mapping inundation in such way could be found crucial to identify the most vulnerable sections of critical road infrastructure (e.g. for evacuation routes), enabling targeted mitigation and protection measures against flood hazards. Road failures induced by floods propagate far beyond inundated segments through network bottlenecks and interdependencies, highlighting the need for integrated flood hazard assessments for transport systems (Arrighi et al., 2021). Therefore, the suggested approach could strengthen the treatment of uncertainty in flood hazard classification and provide a more robust basis for adaptive land use planning in potentially exposed floodplain areas. This also highlights the need to guide future spatial planning towards flood compatible land uses in recurrently exposed areas, thereby limiting further concentration of vulnerable development while retaining or restoring space for more resilient land uses (Agopian et al., 2024).
Finally, our results demonstrate that uncertainty and sensitivity in flood hazard mapping are not merely theoretical issues, they have practical consequences for spatial planning and risk mitigation in topographically complex landscapes with highly dispersed land use, such as the studied Vipava River reach.
Due to the numerous sources of uncertainty in hydrological input data and the sensitivity of hydrodynamic modelling results to input parameters, various questions about reliability and validity inevitably arise during flood hazard assessment. Our study aimed to systematically address and quantify hydrological uncertainty and the sensitivity of hydrodynamic simulations, as well as highlight the evident lack of information when depicting flood hazards as only discrete boundaries. The proposed approach considers possible changes of the flood hazard situation, e.g., due to successional hydraulic roughness changes and hydrological uncertainty by considering the FFA confidence intervals. The analysed scenario ensembles demonstrate that the extension of inundated areas is significantly sensitive to river channel roughness, especially for more frequent floods. Any alterations to the river channel that affect its hydraulic roughness must be thoroughly evaluated and included in flood hazard assessments. Uncertainty analysis could be expanded by generating additional uncertain model inputs/parameters and performing multiple simulation runs (e.g., by considering additional scenario ensembles), which could provide more detailed inundation probability information for specific areas. However, despite ongoing advances in IT infrastructure and the development of more computationally efficient hydrodynamic modelling workflows, analyses and interpretation of numerous simulations runs remain a considerable challenge in many practical applications. Nevertheless, we believe that the results obtained by analysing limited set of “boundary” scenario ensembles are adequate for quantifying the sensitivity of inundation extent and identifying sources of uncertainty affecting flood inundation and hazard maps.
Our approach highlights the importance of incorporating uncertainty and sensitivity analyses into standard flood hazard mapping practices. This integration is crucial for safeguarding vulnerable land uses and critical infrastructure against the evolving challenges posed by climate change. These results could improve the communication of the uncertainty and sensitivity aspects of flood hazard mapping to stakeholders involved in spatial planning. This could provide a more nuanced understanding of potential changes in flood hazard, supporting proactive and adaptive management strategies tailored to fragmented land use contexts.
The datasets used in the study are freely available. The observed flood inundation extents and hydrodynamic modelling results used in this study are publicly available from the Zenodo repository at: https://doi.org/10.5281/zenodo.22275184 (Rusjan and Donevska, 2026).
The supplement related to this article is available online at https://doi.org/10.5194/nhess-26-5647-2026-supplement.
SR and MM conceptualized the methodology; JD built the hydrodynamic model and performed the simulations. SR and JD write the original manuscript. MM acquired funding and conducted project administration. SR validated the simulation results, SR and MM supervised the research.
The contact author has declared that none of the authors has any competing interests.
Publisher's note: Copernicus Publications remains neutral with regard to jurisdictional claims made in the text, published maps, institutional affiliations, or any other geographical representation in this paper. The authors bear the ultimate responsibility for providing appropriate place names. Views expressed in the text are those of the authors and do not necessarily reflect the views of the publisher.
We sincerely thank the editor and reviewers for their constructive comments and valuable contributions to improving the manuscript.
This research has been supported by the Slovenian Research and Innovation Agency (grant nos. V2-2371 and P2-0180) and the Slovenian Ministry of Education, Science and Youth under UNESCO's Intergovernmental Hydrological Programme (Contract No. C3360-24-456016).
This paper was edited by Kai Schröter and reviewed by Michael Nones and Antonio Annis.
Agopian, A., Hino, M., Siders, A. R., Samoray, C., and Mach, K. J.: A Nationwide Analysis of Community-Level Floodplain Development Outcomes and Key Influences, Earth's Future, 12, e2024EF004585, https://doi.org/10.1029/2024EF004585, 2024.
Aitken, G., Beevers, L., and Christie, M. A.: Advanced Uncertainty Quantification for Flood Inundation Modelling, Water, 16, 1309, https://doi.org/10.3390/w16091309, 2024.
Alfonso, L., Mukolwe, M., and Di Baldassarre, G.: Probabilistic Flood Maps to support decision-making: Mapping the Value of Information, Water Resour. Res., 52, 1026–1043, https://doi.org/10.1002/2015wr017378, 2016.
Annis, A., Nardi, F., Volpi, E., and Fiori, A.: Quantifying the relative impact of hydrological and hydraulic modelling parameterizations on uncertainty of inundation maps, Hydrol. Sci. J., 65, 507–523, https://doi.org/10.1080/02626667.2019.1709640, 2020.
Apel, H., Merz, B., and Thieken, A. H.: Quantification of uncertainties in flood risk assessments, Int. J. River Basin Manag., 6, 149–162, https://doi.org/10.1080/15715124.2008.9635344, 2008.
Arrighi, C., Pregnolato, M., and Castelli, F.: Indirect flood impacts and cascade risk across interdependent linear infrastructures, Nat. Hazards Earth Syst. Sci., 21, 1955–1969, https://doi.org/10.5194/nhess-21-1955-2021, 2021.
ARSO: Report on the high-water situation from 29–31 March 2009, National Hydrological Service of the Republic of Slovenia, Environmental Agency of the Republic of Slovenia, Ljubljana, 2009 (in Slovenian).
ARSO: Hydrological report on the flood event from 17–21 September 2010, National Hydrological Service of the Republic of Slovenia, Environmental Agency of the Republic of Slovenia, Ljubljana, 2010 (in Slovenian).
ARSO: Hydrological report on the floods between 27 and 28 October 2012, National Hydrological Service of the Republic of Slovenia, Environmental Agency of the Republic of Slovenia, Ljubljana, 2012 (in Slovenian).
ARSO: Assessment of climate change in Slovenia until the end of the 21st century, Environmental Agency of the Republic of Slovenia, 152 pp., ISBN 978-961-6024-80-8, 2018 (in Slovenian).
Barinas, G., Good, S. P., and Tullos, D.: Continental scale assessment of variation in floodplain roughness with vegetation and flow characteristics, Geophys. Res. Lett., 51, e2023GL105588, https://doi.org/10.1029/2023GL105588, 2024.
Bates, P.: Flood Inundation Prediction, Annu. Rev. Fluid Mech., 54, 287–315, https://doi.org/10.1146/annurev-fluid-030121-113138, 2022.
Beven, K., Leedal, D., and McCarthy, S.: Framework for assessing uncertainty in fluvial flood risk mapping, CIRIA Report C721, CIRIA, London, UK, ISBN 978-0-86017-724-1, 2014.
Bezak, N., Brilly, M., and Šraj, M.: Comparison between the peaks-over-threshold method and the annual maximum method for flood frequency analysis, Hydrol. Sci. J., 59, 959–977, https://doi.org/10.1080/02626667.2013.831174, 2014.
Bhola, P. K., Leandro, J., and Disse, M.: Reducing uncertainties in flood inundation outputs of a two-dimensional hydrodynamic model by constraining roughness, Nat. Hazards Earth Syst. Sci., 19, 1445–1457, https://doi.org/10.5194/nhess-19-1445-2019, 2019.
Bodoque, J. M., Esteban-Muñoz, Á., and Ballesteros-Cánovas, J. A.: Overlooking probabilistic mapping renders urban flood risk management inequitable, Commun. Earth Environ., 4, https://doi.org/10.1038/s43247-023-00940-0, 2023.
Casas, A., Lane, S. N., Yu, D., and Benito, G.: A method for parameterising roughness and topographic sub-grid scale effects in hydraulic modelling from LiDAR data, Hydrol. Earth Syst. Sci., 14, 1567–1579, https://doi.org/10.5194/hess-14-1567-2010, 2010.
Dimitriadis, P., Tegos, A., Oikonomou, A., Pagana, V., Koukouvinos, A., Mamassis, N., and Efstratiadis, A.: Comparative evaluation of 1D and quasi-2D hydraulic models based on benchmark and real-world applications for uncertainty assessment in flood mapping, J. Hydrol., 534, 478–492, https://doi.org/10.1016/j.jhydrol.2016.01.020, 2016.
Dimond, J., Roose, W., and Beevers, L.: Making Different Decisions: Demonstrating the Influence of Climate Model Uncertainty on Adaptation Pathways, Water, 17, 1366, https://doi.org/10.3390/w17091366, 2025.
Donevska, J.: Analysis of uncertainties in the process of flood hazard maps elaboration, MSc thesis, University of Ljubljana, Faculty of Civil and Geodetic Engineering, Ljubljana, https://repozitorij.uni-lj.si/IzpisGradiva.php?id=141740&lang=slv (last access: 12 April 2026), 2022.
Fraehr, N., Wang, Q. J., Wu, W., and Nathan, R.: Assessment of surrogate models for flood inundation: The physics-guided LSG model vs. state-of-the-art machine learning models, Water Res., 2024, https://doi.org/10.1016/j.watres.2024.121202, 2024.
Geodetska uprava Republike Slovenije (GURS): Ortofoto (DOF025), https://podatki.gov.si/dataset/ortofoto (last access: 16 October 2026), 2025.
Glas, H., Deruyter, G., De Maeyer, P., Mandal, A., and James-Williamson, S.: Analyzing the sensitivity of a flood risk assessment model towards its input data, Nat. Hazards Earth Syst. Sci., 16, 2529–2542, https://doi.org/10.5194/nhess-16-2529-2016, 2016.
Greiving, S., Wolf, S., Michalski, D., and Fleischhauer, M.: Flood Risk Mitigation by Spatial Planning – Lessons Learned From Municipal Consultation, J. Flood Risk Manag., 18, e70066, https://doi.org/10.1111/jfr3.70066, 2025.
Hashimoto, M., Kawaike, K., Deguchi, T., Haque, S., Paul, A., Salehin, M., and Nakagawa, H.: Multi-scale flooding hazards evaluation using a nested flood simulation model: case study of Jamuna River, Bangladesh, Int. J. River Basin Manag., 21, 167–179, https://doi.org/10.1080/15715124.2021.1935977, 2023.
Herman, J. D., Kollat, J. B., Reed, P. M., and Wagener, T.: Technical Note: Method of Morris effectively reduces the computational demands of global sensitivity analysis for distributed watershed models, Hydrol. Earth Syst. Sci., 17, 2893–2903, https://doi.org/10.5194/hess-17-2893-2013, 2013.
Herrera, P. A., Marazuela, M. A., and Hofmann, T.: Parameter estimation and uncertainty analysis in hydrological modeling, Wiley Interdiscip. Rev., 9, e1569, https://doi.org/10.1002/wat2.1569, 2022.
Hosking, J. R. M. and Wallis, J. R.: Some statistics useful in regional frequency analysis, Water Resour. Res., 29, 271–281, https://doi.org/10.1029/92WR01980, 1993.
Jelovčan, M. and Šraj, M.: Comprehensive low-flow analysis of the Vipava river, Acta Geogr. Slov., 62, 7–22, https://doi.org/10.3986/AGS.9399, 2022.
Khosh Bin Ghomash, S., Yeste, P., Apel, H., and Nguyen, V. D.: Monte Carlo-based sensitivity analysis of the RIM2D hydrodynamic model for the 2021 flood event in western Germany, Nat. Hazards Earth Syst. Sci., 25, 975–990, https://doi.org/10.5194/nhess-25-975-2025, 2025.
Kobold, M.: Comparison of the September 2010 flood with documented historical flood events, Ujma, 25, 31–37, 2011 (in Slovenian).
Kundzewicz, Z. W., Su, B., Wang, Y., Wang, G., Wang, G., Huang, J., and Jiang, T.: Flood risk in a range of spatial perspectives – from global to local scales, Nat. Hazards Earth Syst. Sci., 19, 1319–1328, https://doi.org/10.5194/nhess-19-1319-2019, 2019.
Lamichhane, N. and Sharma, S.: Effect of input data in hydraulic modeling for flood warning systems, Hydrol. Sci. J., 63, 938–956, https://doi.org/10.1080/02626667.2018.1464166, 2018.
Li, D., Ju, Q., Jiang, P., Huang, P., Xu, X., Wang, Q., Hao, Z., and Zhang, Y.: Sensitivity analysis of hydrological model parameters based on improved Morris method with the double-Latin hypercube sampling, Hydrol. Res., 54, 220–232, https://doi.org/10.2166/nh.2023.109, 2023.
Lim, N. J., Brandt, S. A., and Seipel, S.: Assessment of how uncertainty representation in flood maps can affect geographic-based decisions, Discover Water, 4, 120, https://doi.org/10.1007/s43832-024-00170-1, 2024.
Machado, M. J., Botero, B. A., López, J., Francés, F., Díez-Herrero, A., and Benito, G.: Flood frequency analysis of historical flood data under stationary and non-stationary modelling, Hydrol. Earth Syst. Sci., 19, 2561–2576, https://doi.org/10.5194/hess-19-2561-2015, 2015.
Magjar, M., Suhadolnik, P., Šantl, S., Vrhovec, Š., Krivograd Klemenčič, A., and Smolar-Žvanut, N.: Vipava River Basin Adaptation Plan, BeWater project, Institute for Water of the Republic of Slovenia, Ljubljana, Slovenia, Zenodo, https://doi.org/10.5281/zenodo.439502, 2016.
Maranzoni, A., D'Oria, M., and Rizzo, C.: Quantitative flood hazard assessment methods: A review, J. Flood Risk Manag., 16, https://doi.org/10.1111/jfr3.12855, 2023.
Mehedi, M. A. A., Saki, S., Patel, K., Shen, C., Cohen, S., Smith, V., Rajib, A., Anagnostou, E., Bindas, T., and Lawson, K.: Spatiotemporal variability of channel roughness and its substantial impacts on flood modeling errors, Earth's Future, 12, https://doi.org/10.1029/2023EF004257, 2024.
Merz, B., Aerts, J., Arnbjerg-Nielsen, K., Baldi, M., Becker, A., Bichet, A., Blöschl, G., Bouwer, L. M., Brauer, A., Cioffi, F., Delgado, J. M., Gocht, M., Guzzetti, F., Harrigan, S., Hirschboeck, K., Kilsby, C., Kron, W., Kwon, H.-H., Lall, U., Merz, R., Nissen, K., Salvatti, P., Swierczynski, T., Ulbrich, U., Viglione, A., Ward, P. J., Weiler, M., Wilhelm, B., and Nied, M.: Floods and climate: emerging perspectives for flood risk assessment and management, Nat. Hazards Earth Syst. Sci., 14, 1921–1942, https://doi.org/10.5194/nhess-14-1921-2014, 2014.
Merz, B. and Thieken, A. H.: Separating natural and epistemic uncertainty in flood frequency analysis, J. Hydrol., 309, 114–132, https://doi.org/10.1016/j.jhydrol.2004.11.015, 2005.
Meylan, P., Favre, A.-C., and Musy, A.: Predictive Hydrology: A Frequency Analysis Approach, CRC Press, Boca Raton, USA, 180 pp., https://doi.org/10.1201/b11832, 2012.
Ministrstvo za kmetijstvo, gozdarstvo in prehrano (MKGP): Evidenca dejanske rabe kmetijskih in gozdnih zemljišč (RABA), https://rkg.gov.si/vstop/ (last access: 16 October 2026), 2025.
Mishra, A., Mukherjee, S., Merz, B., Singh, V. P., Wright, D. B., Villarini, G., Paul, S., Kumar, D. N., Khedun, C. P., Niyogi, D., Schumann, G., and Stedinger, J. R.: An overview of flood concepts, challenges, and future directions, J. Hydrol. Eng., 27, 03122001, https://doi.org/10.1061/(ASCE)HE.1943-5584.0002164, 2022.
MKGP: Rules on the register of actual agricultural and forest land use, Ministry of Agriculture, Forestry and Food of the Republic of Slovenia, Ljubljana, Slovenia, Official Gazette of the Republic of Slovenia, No. 122/08, 2008 (in Slovenian).
MKGP: Register of actual agricultural and forest land use, Ministry of Agriculture, Forestry and Food of the Republic of Slovenia, Ljubljana, Slovenia, https://rkg.gov.si/vstop/, last access: January 2026.
Mosquera-Machado, S., Ahmad, S. Flood hazard assessment of Atrato River in Colombia, Water Resour. Manag., 21, 591–609, https://doi.org/10.1007/s11269-006-9032-4, 2007.
Nabi, S., Ahanger, M. A., and Dar, A. Q.: Investigating the potential of Morris algorithm for improving the computational constraints of global sensitivity analysis, Environ. Sci. Pollut. R., 28, 60900–60912, https://doi.org/10.1007/s11356-021-14994-0, 2021.
NOAA: Office for Coastal Management. C-CAP Regional Land Cover and Change, https://coast.noaa.gov/digitalcoast/data/ccapregional.html (last access: 22 February 2026), 2016.
Nogherotto, R., Fantini, A., Raffaele, F., Di Sante, F., Dottori, F., Coppola, E., and Giorgi, F. A combined hydrological and hydraulic modelling approach for the flood hazard mapping of the Po river basin, J. Flood Risk Manag., 15, https://doi.org/10.1111/jfr3.12755, 2022.
Okoli, K., Mazzoleni, M., Breinl, K., and Di Baldassarre, G.: A systematic comparison of statistical and hydrological methods for design flood estimation, Hydrol. Res., 50, 1665–1678, https://doi.org/10.2166/nh.2019.188, 2019.
Pasquier, U., He, Y., Hooton, S., Goulden, M., and Hiscock, K. M.: An integrated 1D–2D hydraulic modelling approach to assess the sensitivity of a coastal region to compound flooding hazard under climate change, Nat. Hazards, 98, 915–937, https://doi.org/10.1007/s11069-018-3462-1, 2019.
Paulik, R., Zorn, C., Wotherspoon, L., and Harang, A.: Model parameter influence on probabilistic flood risk analysis, Int. J. Disast. Risk Re., 100, 104215, https://doi.org/10.1016/j.ijdrr.2023.104215, 2024.
Pavesi, L., Volpi, E., and Fiori, A.: Flood risk assessment through large-scale modeling under uncertainty, Nat. Hazards Earth Syst. Sci., 24, 4507–4522, https://doi.org/10.5194/nhess-24-4507-2024, 2024.
Piry, M.: Analysis of design discharge considering uncertainty, MSc thesis, University of Ljubljana, Faculty of Civil and Geodetic Engineering, Ljubljana, Slovenia, thesis no. 70/II. VOI, https://repozitorij.uni-lj.si/IzpisGradiva.php?id=123334&lang=slv (last access: 22 October 2026), 2020 (in Slovenian).
Polese, M., Tocchi, G., Babič, A., Dolšek, M., Faravelli, M., Quaroni, D., Borzi, B., Rebora, N., Ottonelli, D., Wernhart, S., Pejovic, J., Serdar, N., Lebar, K., Rusjan, S., Masi, R., Resch, C., Kern, H., Cipranic, I., Ostojic, M., and Prota, A.: Multi-risk assessment in transboundary areas: A framework for harmonized evaluation considering seismic and flood risks, Int. J. Disast. Risk Re., 101, 104275, https://doi.org/10.1016/j.ijdrr.2024.104275, 2024.
Praskievicz, S., Carter, S., Dhondia, J., and Follum, M.: Flood-inundation modeling in an operational context: sensitivity to topographic resolution and Manning's n, J. Hydroinform., 22, 1338–1350, https://doi.org/10.2166/hydro.2020.005, 2020.
Rebolho, C., Andréassian, V., and Le Moine, N.: Inundation mapping based on reach-scale effective geometry, Hydrol. Earth Syst. Sci., 22, 5967–5985, https://doi.org/10.5194/hess-22-5967-2018, 2018.
Rahman, A. S., Haddad, K., Ahsan, A., Imteaz, M. A., and Monzur Zaman, M. A.: A study on selection of probability distributions for at-site flood frequency analysis in Australia, Nat. Hazards, 69, 1803–1813, https://doi.org/10.1007/s11069-013-0775-y, 2013.
Rusjan, S. and Donevska, J.: Observed inundation and hydrodynamic simulation data, Zenodo [data set], https://doi.org/10.5281/zenodo.22275184, 2026.
Rusjan, S., Vidmar, A., and Brilly, M.: The transboundary Soča and Vipava river flood problems, 4th EGU Leonardo Conference: Hydrology and Society, Torino, Italy, 14–16 November 2012, 2012.
Sanchez, G. M., Petrasova, A., Skrip, M. M., Collins, E. L., Lawrimore, M. A., Vogler, J. B., Terando, A., Vukomanovic, J., Mitasova, H., and Meentemeyer, R. K.: Spatially interactive modeling of land change identifies location-specific adaptations most likely to lower future flood risk, Sci. Rep., 13, 18869, https://doi.org/10.1038/s41598-023-46195-9, 2023.
Simões, N., Ochoa-Rodríguez, S., Wang, L.-P., Pina, R., Marques, A., Onof, C., and Leitão, J.: Stochastic Urban Pluvial Flood Hazard Maps Based upon a Spatial–Temporal Rainfall Generator, Water 7, 3396–3406, https://doi.org/10.3390/w7073396, 2015.
Siripatana, A., Wilson, A. L., and Beevers, L.: Uncertainty quantification for multi-input fluvial flood inundation using GPR- and PCE-based surrogates, Water Resour. Res., 61, e2024WR039668, https://doi.org/10.1029/2024WR039668, 2025.
Smart, G. M.: Improving flood hazard prediction models, Int. J. River Basin Manag., 16, 449–456, https://doi.org/10.1080/15715124.2017.1411923, 2018.
Steinbakk, G. H., Thorarinsdottir, T. L., Reitan, T., Schlichting, L., Hølleland, S., and Engeland, K.: Propagation of rating curve uncertainty in design flood estimation, Water Resour. Res., 52, 6897–6915, https://doi.org/10.1002/2015WR018516, 2016.
Stephens, T. A. and Bledsoe, B. P.: Probabilistic mapping of flood hazards: Depicting uncertainty in streamflow, land use, and geomorphic adjustment, Anthropocene, 29, 100231, https://doi.org/10.1016/j.ancene.2019.100231, 2020.
Stephens, T. A. and Bledsoe, B. P.: Flood Protection Reliability: The Impact of Uncertainty and Nonstationarity, Water Resour. Res., 59, e2021WR031921, https://doi.org/10.1029/2021WR031921, 2023.
Sun, Q., Fang, J., Dang, X., Xu, K., Fang, Y., Li, X., and Liu, M.: Multi-scenario urban flood risk assessment by integrating future land use change models and hydrodynamic models, Nat. Hazards Earth Syst. Sci., 22, 3815–3829, https://doi.org/10.5194/nhess-22-3815-2022, 2022.
Šraj, M. and Bezak, N.: Modifying Design Standards: The 2023 Extreme Flood's Impact on Design Discharges in Slovenia, Water, 17, 2198, https://doi.org/10.3390/w17152198, 2025.
Šraj, M., Bezak, N., Begelj, Ž., and Lebar, K.: Expert basis related to the preparation of flood-frequency analysis (FFA): final report, University of Ljubljana, Faculty of Civil and Geodetic Engineering, Chair of Hydrology and Hydraulic Engineering, Ljubljana, Slovenia, 59 pp., COBISS.SI-ID 246512899, 2025 (in Slovenian).
Ullah, A., Haider, S., and Farooq, R.: Sensitivity analysis of a 2D flood inundation model. A case study of Tous Dam, Environ. Earth Sci., 83, 213, https://doi.org/10.1007/s12665-024-11500-w, 2024.
USACE: HEC-RAS 2D User's Manual, https://www.hec.usace.army.mil/confluence/rasdocs/r2dum/latest (last access: 8 August 2025), 2022a.
USACE: HEC-RAS User's Manual, https://www.hec.usace.army.mil/confluence/rasdocs/rasum/latest (last access: 8 August 2025), 2022b.
USDA-NRCS: Manning's n values for various land covers to use for dam breach analyses by NRCS in Kansas, U.S. Department of Agriculture, Natural Resources Conservation Service, Kansas, USA, https://rashms.com/wp-content/uploads/2021/01/Mannings-n-values-NLCD-NRCS.pdf (last access: 28 June 2026), 2016.
Van der Most, H., Asselman, N., and Slager, K.: Experiences in developing and applying decision support systems for strategic flood risk management, Int. J. River Basin Manag., 16, 371–378, https://doi.org/10.1080/15715124.2017.1411925, 2018.
Warmink, J. J., Straatsma, M. W., and Huthoff, F.: The effect of hydraulic roughness on design water levels in river models, in: Comprehensive Flood Risk Management: Research for Policy and Practice, edited by: Klijn, F. and Schweckendiek, T., Taylor & Francis Group, London, UK, 157–164, ISBN 978-0-415-62144-1, 2013.
Winter, B., Schneeberger, K., Huttenlau, M., and Stötter, J.: Sources of uncertainty in a probabilistic flood risk model, Nat. Hazards, 91, 431–446, https://doi.org/10.1007/s11069-017-3135-5, 2018.
Wright, K. A., Goodman, D. H., Som, N. A., Alvarez, J., Martin, A., and Hardy, T. B.: Improving hydrodynamic modelling: An analytical framework for assessment of two-dimensional hydrodynamic models, River Res. Appl., 33, 170–181, https://doi.org/10.1002/rra.3067, 2017.
Yang, Q., Wu, W., Wang, Q. J., and Vaze, J.: A 2D hydrodynamic model-based method for efficient flood inundation modelling, J. Hydroinform., 24, 1004–1019, https://doi.org/10.2166/hydro.2022.133, 2022.
Yu, J., Li, Y., Huang, X., and Ye, X.: Data quality and uncertainty issues in flood prediction: a systematic review, Int. J. Digit. Earth, 18, 2495738, https://doi.org/10.1080/17538947.2025.2495738, 2025.
Zahidi, I., Yusuf, B., Cope, M., Ahmed Mohamed, T., and Mohd Shafri, H. Z.: Effects of depth-varying vegetation roughness in two-dimensional hydrodynamic modelling, Int. J. River Basin Manag., 16, 413–426, https://doi.org/10.1080/15715124.2017.1394313, 2018.
Zahmatkesh, Z., Han, S., and Coulibaly, P.: Understanding Uncertainty in Probabilistic Floodplain Mapping in the Time of Climate Change, Water, 13, 1248, https://doi.org/10.3390/w13091248, 2021.
Zhou, X., Ma, W., Echizenya, W., and Yamazaki, D.: The uncertainty of flood frequency analyses in hydrodynamic model simulations, Nat. Hazards Earth Syst. Sci., 21, 1071–1085, https://doi.org/10.5194/nhess-21-1071-2021, 2021.