
the Creative Commons Attribution 4.0 License.
the Creative Commons Attribution 4.0 License.
 | 02 Nov 2026
Unravelling information on impactful geo-hydrological hazard events with HazMiner, a multilingual text mining method developed through a global scale coverage application
Bram Valkenborg

Olivier Dewitte
I Wayan Gita Krishna Dananjaya
Benoît Smets
The incidence and impacts of geo-hydrological hazards such as floods, flash floods and landslides are changing globally due to anthropogenic environmental changes and increased exposure driven by population growth. Reliable datasets on geo-hydrological hazards are essential to deepen our understanding of these hazards and their impacts. However, existing geo-hydrological hazard datasets contain data gaps leading to biased interpretations, especially in low- and lower-middle-income countries where populations are commonly the most impacted. Text mining offers new opportunities in documenting geo-hydrological hazards by automatically extracting information from large text corpora. Despite its potential, current methodologies are not adapted to improve documentation in data-scarce contexts. We introduce HazMiner, a paragraph-based text mining method designed to document the location, timing and impact of geo-hydrological hazards through transformer-based natural language processing models across multiple languages and at various scales. Applied here globally on 6 366 905 news articles published from 2017 through 2024 in 58 languages, HazMiner extracted 15 313 flood, 6836 landslide and 2258 flash flood events with a known location and time information and, in some cases, impact data. Compared to existing hazard datasets, HazMiner significantly improved hazard documentation, reducing the data gaps in many regions, especially in low- and lower-middle-income countries. This new versatile multilingual method and its dataset advance the accessibility and use of text mined natural hazard data.
- Article
(9879 KB) - Full-text XML
- BibTeX
- EndNote


Floods, landslides, and flash floods are geo-hydrological hazards that can occur in many regions across the world, sometimes at a very high frequency, often sharing similarities in the climatic and geo-environmental drivers (Gill and Malamud, 2014). Geo-hydrological hazard events usually make the news when they lead to disastrous impacts on people and infrastructure (Avcıoğlu et al., 2025; Fetzer and Garg, 2026; Madruga De Brito et al., 2025a). The impacts of these hazards are driven by population growth and increased exposure (Ferrer et al., 2024; Mawe et al., 2025; Merz et al., 2021; Muñoz-Torrero Manchado et al., 2021; Tellman et al., 2021). In addition, their incidence is modified by climate change and anthropogenic landscape transformation (Depicker et al., 2021b; IPCC, 2022; Ozturk et al., 2022). The documentation of geo-hydrological hazards is key to further improve our understanding of their spatiotemporal variation, trends, and impacts. These datasets contribute, for example, to the creation and evaluation of susceptibility and hazard models (Stanley and Kirschbaum, 2017; Van Den Eeckhaut and Hervás, 2012), to the understanding of exposure, vulnerability and risk of communities (Emberson et al., 2020; Nsabimana et al., 2023; Smith et al., 2019; Ward et al., 2020), and to the elaboration of early warning systems (Borga et al., 2011; Guzzetti et al., 2020). This makes them a valuable source of information for actors involved in land management and disaster risk reduction (Kreibich et al., 2022; Maes et al., 2017; Schlögl et al., 2021; UNDRR, 2015).
Hazard and disaster datasets cover local to global scale (De Bruijn et al., 2019; Delforge et al., 2025; Froude and Petley, 2018; Gourley et al., 2013; Kirschbaum et al., 2015, 2010; Nsabimana et al., 2023). They come with various levels of detail and accuracy, depending on their purpose and on the approaches used for their creation. However, a significant amount of hazard events remains unreported, especially the less impactful but more frequent ones (Guzzetti et al., 2012). In addition, studies on geo-hydrological hazard events and their datasets are strongly biased towards high-income countries (Stein et al., 2024). This results in data gaps, particularly in low- and lower-middle-income countries (Kanyiginya et al., 2024; Monsieurs et al., 2018; Stein et al., 2024) where rates of – often vulnerable – population growth are the highest and where anthropogenic landscape transformation is rapid (Depicker et al., 2021a; Mawe et al., 2025; Ozturk et al., 2022).
Traditional approaches to document geo-hydrological hazard events are framed around remote sensing and field-based investigations (Casagli et al., 2023; Guzzetti et al., 2012). Spaceborne remote sensing is a key approach to map the spatial extent of geo-hydrological hazard events, especially through optical imagery (Casagli et al., 2023; Deijns et al., 2024). It also allows to assess the timing of their occurrence, with a clear added value of using radar information (Deijns et al., 2022). However, even in the best cases of minimal cloud cover and high revisit time, the maximum accuracy about the timing is limited to a few days (Burrows et al., 2019; Deijns et al., 2024). In theory, remote sensing would allow for global application mapping, especially with the progress made in Artificial Intelligence (AI) (Sun and Scanlon, 2019). But it comes with constraints such as high computational demands that limit the focus to local and regional scale applications (Deijns et al., 2024). Furthermore, remote sensing often misses events with limited spatial coverage and its capabilities to document the human impact are low (Casagli et al., 2023).
Alternatively, in-situ observations from the field result in a higher precision compared to remote sensing and allows to document events at all sizes, even the very small ones (Sekajugo et al., 2022), but it is labour-intensive, focused on local documentation, and is difficult to implement in remote areas. Recently, field-based approaches have been tested with the involvement of citizen networks that can report directly on geo-hydrological hazard events (Jacobs et al., 2019). Although promising and offering unprecedented accuracy in estimating the time of occurrence, an aspect particularly relevant for rainfall threshold definition and early warning strategies (Kanyiginya et al., 2024; Kirschbaum et al., 2015), the information collected from such networks remains biased toward impactful events and easily accessible locations (Sekajugo et al., 2022).
Text mining, which involves analysing textual sources, allows the extraction of data on the location, timing, and impact of geo-hydrological hazard events (Kirschbaum et al., 2010). It is suggested as a promising approach to further complement the abovementioned traditional data collection methods (Cervone et al., 2016; Wiegmann et al., 2021). Various sources can be used, such as historical archives for generating long time series (Devoli et al., 2007; Rossi et al., 2010) or social media for near real-time information (Li et al., 2021; Ofli et al., 2023; Rossi et al., 2018). News articles are mostly used to document impactful events sometime after their occurrence and are presented as more reliable, as they mostly, compared to social media posts, contain verified information (Allcott and Gentzkow, 2017).
Through text mining, the information can be extracted manually (Delforge et al., 2025; Guzzetti et al., 1994) or automatically (Avcıoğlu et al., 2025; Battistini et al., 2013; Fan et al., 2020; Franceschini et al., 2022; Sodoge et al., 2023). Automatic extraction often relies on Natural Language Processing (NLP) (Sodoge et al., 2023; Tounsi and Temimi, 2023; Valero et al., 2009). The steps in automatically creating datasets from text mining include: (1) selecting the text corpora, (2) filtering irrelevant text from the dataset, and (3) extracting information such as the location, time and impact of natural hazard events documented in its text (Avcıoğlu et al., 2025; De Bruijn et al., 2019). These steps can be performed using various NLP tasks, including text classification, named entity recognition (NER), Question Answering (Q&A), text generation or translation (Avcıoğlu et al., 2025; Fu et al., 2022; Rogers et al., 2023). The performance of these tasks significantly improved with the introduction of transformer-based models (Vaswani et al., 2017), such as BERT (Bidirectional Encoder Representations from Transformers) (Devlin et al., 2019) or with the introduction of large language models (LLMs), such as GPT (Generative Pre-trained Transformer) (Radford and Narasimhan, 2018).
One recent development is the use of text generating LLMs, such as GPT, for non-text generating NLP tasks, such as text classification, NER, or Q&A, often referred to as prompt engineering (Mayo et al., 2026). This method gained popularity as it does not rely on task-specific fine-tuning and therefore does not require annotated data. However, these non-text generating NLP tasks, do not necessarily require text generating LLMs and can also be performed more efficiently by much smaller fine-tuned encoder models, such as BERT (Rogers et al., 2020). BERT, compared to LLMs, can run locally on commonly available computers without sharing copyrighted text data through Application Programming Interfaces (APIs).
Furthermore, current text mining methods for hazard documentation are focused on higher-income countries, where texts are more easily available, or they focus exclusively on text written in widely spoken international languages, suited for most NLP models (Franceschini et al., 2024; Taylor et al., 2015; Valenzuela et al., 2017). As a result, automatic text mining approaches documenting geo-hydrological hazard events are poorly adapted to low- and lower-middle-income countries (Delforge et al., 2025; Gall et al., 2009). Therefore, text mining methodologies must include diverse linguistic and contextual settings, especially when analyses are conducted across large regions or even at a global scale (De Bruijn et al., 2019; Kirschbaum et al., 2015; Mayo et al., 2026).
Given these research and knowledge limitations, we develop HazMiner, a versatile multilingual text mining method designed for application from the regional to the global scale. It leverages the full extent of textual sources to extract natural hazard event-related information such as location, timing and impact (Sect. 2). Within this research, we use HazMiner to generate a global dataset on geo-hydrological hazards by applying it to the Global Dataset on Events, Language and Tone (GDELT – The GDELT Project, 2025), with the specific aim to improve their documentation, especially for regions that are typically under-documented such as low- and lower-middle-income countries (Sect. 3). To assess the performance of the method and dataset, we evaluate HazMiner at the global scale against a manually generated reference dataset and compare it to other hazard datasets such as the Global Landslide Catalog (GLC – Kirschbaum et al., 2015), the Emergency Event Database (EM-DAT – Delforge et al., 2025) and the Global Flood Monitor (GFM – De Bruijn et al., 2019) (Sect. 3). Before using the dataset, readers are strongly encouraged to consult the evaluation and limitations of HazMiner, as its automated approach may result in false-positive events and other biases. Taking these limitations into account, we finally discuss the added value of the HazMiner dataset providing new insights in the geo-hydrological hazard distribution globally, and suggest avenues for future research, discussing the versatility of HazMiner and its integration with other hazard detection methods (Sect. 4).
HazMiner processes online news articles at the paragraph level through a workflow that consists of four main steps, each applying different NLP tasks to extract hazard-related information. These steps are: (1) text preprocessing, (2) paragraph filtering, (3) information extraction, and (4) event creation (Fig. 1). HazMiner is designed to use NLP models from the Hugging Face Hub (https://huggingface.co, last access: 17 August 2026), as they are easy to integrate, interchangeable, and open source. Whereas HazMiner is designed to potentially document any type of natural hazard from text sources, in this work, we specifically configured it to extract geo-hydrological hazard events. In this configuration, the output is a dataset on floods, landslides, and flash floods events, where each event is identified through a cluster of geocoded paragraphs.
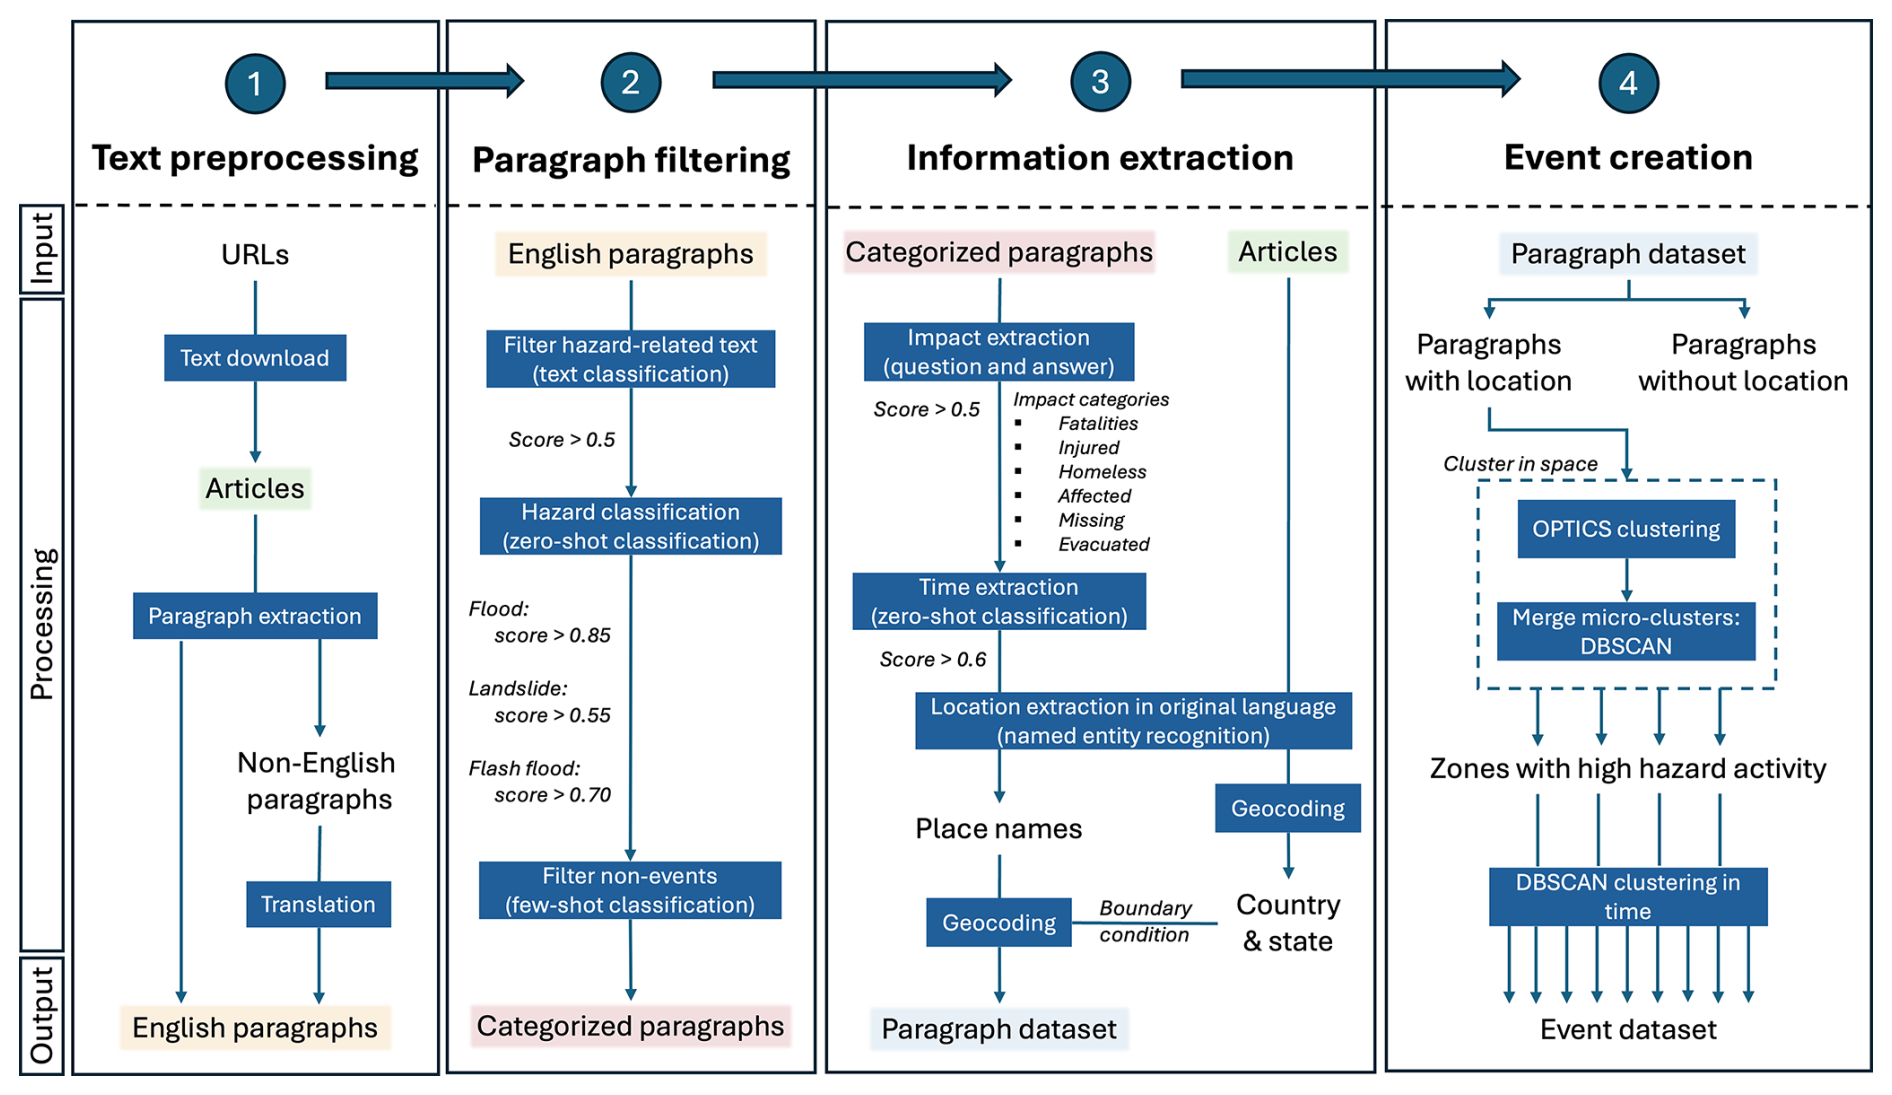
Figure 1The workflow of HazMiner consists of four main steps. Each step is characterised by an input, a processing chain, and an output. Key processing steps are highlighted by blue rectangles. Recurring datasets are marked with the same colour.
In the following sections, we further describe the main steps of the HazMiner methodology (Sect. 2.1–2.4), its evaluation (Sect. 2.5) and its application to GDELT (Sect. 2.6).
2.1 Text preprocessing
Text preprocessing consists of three subtasks: (1) text download, (2) paragraph extraction, and (3) text translation (Fig. 1, step 1). The text of the articles is downloaded from a user-introduced collection of URLs, using the newspaper3 K package (Ou-Yang, 2014), specifically designed for web scraping and parsing news articles. Within our application of HazMiner we specifically used GDELT as a source for URLs (Sect. 2.6). Each article is, then, split into individual paragraphs. A paragraph is defined as a text ending with a new line character (“/n”). Processing at the paragraph level allows for more detailed information extraction, since news articles provide snippets of information through paragraphs. Articles and paragraphs are assigned a unique ID, to preserve the link between the source and the extracted information within the dataset. Finally, HazMiner translates non-English paragraphs into English, relying on two translation models, “Helsinki-NLP/opus-mt-mul-en” (Tiedemann et al., 2024) and “facebook/mbart-large-50-many-to-one-mmt” (Tang et al., 2020), optimised for that purpose (Table A1). Translation is necessary because many NLP models are trained primarily on English data, and the availability of multilingual fine-tuned NLP models remains limited.
2.2 Paragraph filtering
After extraction, paragraphs are filtered for their relevance through three steps: (1) a hazard-related text filter, (2) hazard type classification filter and (3) a non-event filter. Many news articles do not describe actual hazards but contain words that can be associated with hazards in other contexts. For instance, the term “landslide” may denote a natural hazard or, in politics, an overwhelming electoral victory. Many text mining methodologies filter out such non-hazard-related content (De Bruijn et al., 2019; Franceschini et al., 2022, 2024; Sodoge et al., 2023). For this, HazMiner applies a binary classification model (Fig. 1, step 2) based on a fine-tuned version of the distilBERT model (Sanh et al., 2019) (Table A1) as these bidirectional encoder models are particularly suited for classifying short text such as paragraphs (Blomeier et al., 2024).
Next, the paragraphs are classified into three hazards: floods, landslides, and flash floods (Fig. 1, step 2). This step uses zero-shot classification, a method that assigns text to predefined categories by leveraging the semantic relationships encoded in the NLP model's word embeddings (Yin et al., 2019). We apply a fine-tuned multi-label classification DeBERTa model (Laurer et al., 2024) (Table A1), which generates a score for each predefined category. The score reflects the strength of the relationship between the paragraph and the classification term, ranging from zero (no relationship) to one (maximum relationship). HazMiner assigns the hazard class with the highest score to the paragraph, provided the score exceeds empirical thresholds of 0.85 for floods, 0.55 for landslides, and 0.70 for flash floods. These thresholds are chosen based on validation data (see Sect. 2.5). Paragraphs below these thresholds are filtered out as “other” hazard.
A limitation of zero-shot classification is that it relies on word embeddings rather than a precise definition of terms. Furthermore, journalists are often not aware of the correct scientific classification, unintentionally misusing terminology. For instance, a manual evaluation showed that paragraphs containing the word “mudslide” are classified as floods, probably due to the relationship between the words “mud” and “water”. When Hungr et al. (2014) suggested an update of the Varnes classification of landslides, they noted that the British use of “mudslide” is often incorrect in news articles referring to a landslide. We therefore corrected the classification, reassigning “mudslide” paragraphs to the landslide category.
Lastly, non-events are filtered out using few-shot classification (Li et al., 2006). Non-events are paragraphs reporting early warnings or describing only the trigger of a hazard without the hazard event occurring. Like zero-shot classification, few-shot classification assigns classes to text based on the model's embedding space. But few-shot classification, compared to zero-shot classification, is additionally fine-tuned on a limited number of annotated texts. For this, we fine-tuned the “sentence-transformers/all-MiniLM-L12-v2” sentence transformer model (Tunstall et al., 2022; Wang et al., 2020) on 16 positive and 16 negative annotated paragraphs through two epochs using Sentence Transformer Fine-tuning (SetFit – Tunstall et al., 2022).
2.3 Information extraction from paragraphs
The three main types of information that characterise a geo-hydrological hazard event are timing, location, and impact (Fig. 1, step 3). Each type of information has its specifications, which require an adapted extraction method.
2.3.1 Timing
By default, HazMiner considers the publication date of the article as the timing of the hazard. Nevertheless, most articles mention some form of timing; Valenzuela et al. (2017) found that 51 % of landslide-related articles in Northern Spain reported an accurate timing. The dates mentioned in the paragraphs are extracted using the dateparser Python package (Shabir et al., 2025). These include actual dates, indicating a day, month and year, or date references, such as, “yesterday” or “last Wednesday”. Afterwards, these date references are used to calculate the actual date by correcting the article's publication date. For example, a reference date of “yesterday” will result in a date, one day before the publication date.
2.3.2 Location
For the location, we use an innovative geoparsing method, adapted to use the full context of an article to geocode the place names mentioned in a paragraph. Geoparsing is the extraction of a location (latitude and longitude) based on a place name mentioned in a text. A geoparsing algorithm has two steps: (1) extraction of place names from the text and (2) geocoding of the location based on the place name (MacEachren et al., 2011; Middleton et al., 2014). In HazMiner, place names are extracted from the text using an XLM-RoBERTa model (Table A1), fine-tuned for multilingual NER tasks (Conneau et al., 2019). NER is the extraction and categorisation into named entities such as place names, people, or organizations. Place name extraction must be performed on the original text, as they are often altered in translation models.
Each place name extracted from the paragraph is geocoded into one location. Nominatim, an open-source geocoding tool based on OpenStreetMap data (OpenStreetMap contributors, 2017), is used to geocode the place names. The main challenge of geocoding is place names referring to multiple locations. To address this, our geocoding algorithm establishes a boundary condition (Middleton et al., 2018; Middleton and Krivcovs, 2016). This boundary condition is defined by higher-level administrative units (i.e., country and state levels) and is derived from the place names mentioned in their corresponding article. The most frequently occurring country and state defines the boundary condition, limiting all locations to this specific country and state.
Eventually, each paragraph, for which at least one place name is extracted, is assigned one location, which is defined by a latitude, longitude, and bounding box (WGS84). A filter removes locations within one paragraph whose nearest neighbour is further than 250 km, as such distances make it unlikely that these locations refer to the geo-hydrological hazard event and instead suggest issues of place name disambiguation. By assigning one location per paragraph, based on all place names within it, the likelihood of ambiguously geocoding place names is further minimised. The final latitude and longitude of the paragraph are calculated as a weighted average of all remaining locations based on their administrative level, but only for administrative units lower than provinces and higher than streets (Table A2). Points of interest and house numbers get assigned a weight of zero, as those are likely the result of wrongly geocoded place names. The bounding box is defined by the smallest possible rectangle surrounding all used locations of the paragraphs.
2.3.3 Impact
Concerning the impact, HazMiner extracts the information using the RoBERTa model (Table A1), fine-tuned for Q&A tasks (Chan et al., 2020). This specific model answers a given question by extracting text segments directly from the input context, i.e., the paragraphs in the case of HazMiner. HazMiner extracts the number of fatalities, homeless, injured, affected, missing, and evacuated. Questions are short and simple (Table A3). The answer is further analysed to extract numbers based on their different writing styles and for numbers-in-words, which frequently occur in news articles.
2.4 Event creation: clustering paragraphs into events
UNDRR (United Nation office for Disaster Risk Reduction) defines a hazard event as “the manifestation of a hazard in a particular place during a particular period” (United Nations Office for Disaster Risk Reduction, 2017). Similarly, HazMiner defines a hazard event as a collection of paragraphs on one hazard type located in the same region within a certain timeframe. Events are extracted from paragraphs based on a two-stage clustering algorithm (Fig. 1, step 4). In a first stage, the algorithm clusters paragraphs in space; we define these clusters as zones with “high-hazard activity”. A second stage clusters the paragraphs of each high-hazard activity zone in time. Only paragraphs for which a location was extracted (Sect. 2.3.2) are considered in the spatially based event clustering algorithm.
The first stage clusters paragraphs in space using a density-based clustering algorithm called OPTICS (Ordering Points To Identify the Clustering Structure) (Ankerst et al., 1999). OPTICS generates a one-dimensional density-based representation of the dataset, called the reachability plot, which reflects the hierarchical structure present in the data. Specifically, news articles have a spatially strong hierarchical structure, due to the uneven global distribution of media coverage on hazard events (Berlemann and Thomas, 2019; Walter et al., 2016), as hazard events in high-income countries receive more media attention compared to those in low and lower-middle-income countries (Eisensee and Stromberg, 2007; Murthy and Longwell, 2013; Porter and Evans, 2020; Solman and Henderson, 2019). Clusters are identified in the reachability plot through the Xi-algorithm, which detects significant changes in its steepness (Ankerst et al., 1999). For HazMiner, we selected an xi-value of 0.1 as an optimal value at global scale based on visual interpretation of the data. Higher xi-values result in denser clusters, as they require a steep slope in the reachability plot, whereas lower xi-values result in looser clusters. The OPTICS algorithm requires two more parameters: (1) “maximum epsilon”, i.e., the maximum distance between elements within the cluster, and (2) the maximum number of elements per cluster (i.e., paragraphs). Because floods and landslides seem to receive more media attention compared to flash floods (Bailon et al., 2025), we set a higher threshold for event creation, corresponding to at least 10 paragraphs per event for floods and landslides, and five paragraphs for flash flood events. For all three extracted hazard types, the maximum epsilon equals 0.5°, as we perceive paragraphs further away than 0.5° to spatially belong to a different high-hazard activity zone (Gill and Malamud, 2014). Paragraphs that do not meet these requirements are discarded as noise.
The OPTICS algorithm generates many micro-clusters in very dense areas, increasing the likelihood of duplicating events. To prevent this, HazMiner includes an additional step to merge closely spaced OPTICS-based clusters using the DBSCAN (Density Based Spatial Clustering of Application with Noise) algorithm (Ester et al., 1996). DBSCAN requires one parameter, epsilon, defined as the distance between two data points for them to be considered as one cluster. Epsilon is set small enough to detect very dense areas in the OPTICS-based result, equalling 0.2° for floods and 0.05° for landslides and flash floods (Gill and Malamud, 2014). After applying both OPTICS and DBSCAN, the clusters represent zones with a higher number of hazard reports, i.e., high-hazard activity zones.
The second stage of paragraph clustering extracts hazard events by identifying the specific moments in time when hazard events occur. This is achieved by applying DBSCAN clustering over time within each high-hazard activity zone. Periods with a high number of paragraphs are grouped into clusters, representing a single hazard event, while those with few paragraphs are discarded as noise. In this context, epsilon is set to two days, defining the temporal neighbourhood within which paragraphs can be considered part of the same event. However, event boundaries in DBSCAN are determined not only by this temporal threshold but also by the density of paragraphs within the resulting temporal region. Consequently, a later paragraph may not be assigned to the same event if it is insufficiently connected to a sufficiently dense temporal cluster even if the data gap is smaller than epsilon. For the same reason as the first stage of the event creation algorithm, namely that floods receive more media attention compared to landslides or flash floods (Bailon et al., 2025), we set the minimum number of samples, i.e., paragraphs, equal to 10 paragraphs for floods and five paragraphs for landslides and flash floods.
The obtained result is a dataset of events, characterised by their location, timing, and impact. The location is described by latitude, longitude, and a bounding box. The latitude and longitude are expressed in decimal degrees (WGS84) and calculated as the medoid of all paragraph locations within the cluster, while the bounding box is the smallest rectangle encompassing all paragraph locations. The timing is described by the earliest, median, and latest dates found in the cluster of paragraphs, as well as by the duration, which corresponds to the time duration between the earliest and latest dates found. The events' impact is estimated by the median of the paragraphs' impact, for each impact category, namely the number of fatalities, homeless people, injured people, affected people, missing people, and evacuated people. Before calculating the median, two filters are applied: (1) removing outliers based on 1.5 times the interquartile range, and (2) removing impact numbers that are reported fewer than five times. Lastly, for each event an uncertainty of the abovementioned parameters, in location, time and impact, is reported through a bootstrap analysis with 100 cycles.
2.5 Evaluation of HazMiner
HazMiner is evaluated for six intermediate processing steps: the binary classification of the paragraphs into hazard-related text, the classification of paragraphs into different hazard types, the non-event filter, the time extraction, the geocoding algorithm, and the impact extraction. An overview of all sample strategies and sample size for each evaluation step can be found in Table A4. All datasets are sampled independent of each other. The NLP models used in the paragraph filtering step were evaluated based on recall, precision, and F1-score of the positive classes. Evaluation of these steps allowed us to assess the reliability of the extracted information, as they primarily depend on the performance of NLP models.
The classification algorithms are evaluated based on a manual annotation of English and translated paragraphs (Table A4). They are manually annotated until the false-positive rate converged and remained constant with increasing annotation sample size. A total of 750 and 2000 paragraphs were annotated for the classification of hazard-related text and the classification of hazard types, respectively.
HazMiner's time extraction algorithm is evaluated at both the event and paragraph levels, against the two reference datasets; EM-DAT and GFM. Data points between the HazMiner and reference datasets are compared, for the same period as the availability of HazMiner data, based on the best spatiotemporal match, prioritising a spatial match. Both reference datasets report the timing as a period, illustrated by its start and end, which is compared to the start and end at the event level and time at the paragraph level. The datasets are evaluated based on the time difference.
The geoparsing algorithm is evaluated against two reference datasets: (1) GLC and (2) 100 manually geolocated paragraphs. The GLC reports landslide events, each linked to one news article. For comparison, we extracted the event location from the same articles, using HazMiner. As the GLC only covers landslides, we additionally manually geolocated 100 paragraphs in English and non-English that describe floods, landslides, or flash floods. These paragraphs are selected randomly from the collection of paragraphs for which a location was extracted by the NER model. Non-English paragraphs are translated into English with Google Translate, and event locations are identified using Google Maps. For both evaluations, the reference locations (GLC or manual) are compared to HazMiner outputs based on the distance between coordinate pairs, calculated with the Haversine formula.
HazMiner's impact extraction is evaluated against EM-DAT's impact data. Two differences should be considered when comparing the datasets. First, EM-DAT reports fatalities, injuries, and affected populations, while HazMiner additionally extracts the number of people missing and homeless. The evaluation is limited to the three common impacts. Second, EM-DAT reports its impact at the country level, while HazMiner provides this information at the event and paragraph level. For events occurring in the same country, the best match between the two datasets is defined as the smallest difference in reported impacts. Furthermore, to account for the evolving nature of media reporting, the comparison is restricted to HazMiner articles and paragraphs published within five days of the EM-DAT event start date. The comparison metric is the difference in impact values between HazMiner and EM-DAT for each matched event.
Finally, we manually reviewed the paragraphs associated with 75 events to assess their relevance, coherence, and consistency with the documented event location, timing and impact. The reviewed events included, according to the HazMiner classification, 24 floods, 24 landslides and 27 flash floods. Their spatial distribution across continents per hazard type can be found in Table A5.
2.6 The global HazMiner dataset: HazMiner applied at the global scale using GDELT
For this manuscript, we specifically applied HazMiner to generate a global dataset on geo-hydrological hazards. URLs of news articles extracted from GDELT were used as input to HazMiner. GDELT is an online database that monitors global events of all kinds by, for example, analysing online news articles (The GDELT Project, 2025). We used the Global Knowledge Graph, consulted through the GDELT API. A keyword-based API request returns news articles published since 2017, containing at least one of the specified keywords. The list of URLs can be consulted in the final dataset (see in section Code and data availability).
The keywords used to generate the HazMiner dataset are geo-hydrological terms related to floods, landslides, and flash floods, often referenced by English newspapers, they are presented to the API as one structured query (Eq. 1), creating one dataset for all three hazard types:
The data was retrieved from the API on 1 July 2024 for the articles published between 1 January 2017 and 31 December 2023, while those published between 1 January 2023 and 1 January 2025 were retrieved on 4 April 2025. The GDELT API provides news articles in 65 languages. We use two fine-tuned translation models (Table A1) that can translate 57 of 65 languages; covering 58 languages (Table A6), including English, excluding Bosnian, Kazakh, Malay, Nepali, Punjabi, Serbian, and Slovak.
Lastly, the global dataset on geo-hydrological hazards is compared to three reference datasets: EM-DAT, the GLC, and the GFM for all events and only extreme events, i.e., events with more than 10 fatalities. HazMiner is compared to the reference dataset in total number of events and in relative variation calculated as:
where nHazMiner is the total number of HazMiner events and nref is the total number of events in the reference dataset. EM-DAT is compared to HazMiner over the same period from 2017 through 2024. The GFM is compared with HazMiner from 2017 to March 2023, corresponding to the temporal overlap between the two datasets. The GLC is compared to HazMiner from 2007 through 2014, including the same number of years as HazMiner but a different period. The comparison is done across the different income classes defined by the World Bank Country Classification from 1 July 2025 until 30 June 2026 (Metreau et al., 2025). Furthermore, the HazMiner dataset is analysed in relation to characteristics of the built and natural environment; including population density (European Commission. Joint Research Centre, 2023), drainage channels with a long-term average discharge larger or equal to 1 m3 s−1(Lehner and Grill, 2013), and landslide susceptibility (Stanley and Kirschbaum, 2017).
3.1 Reported events
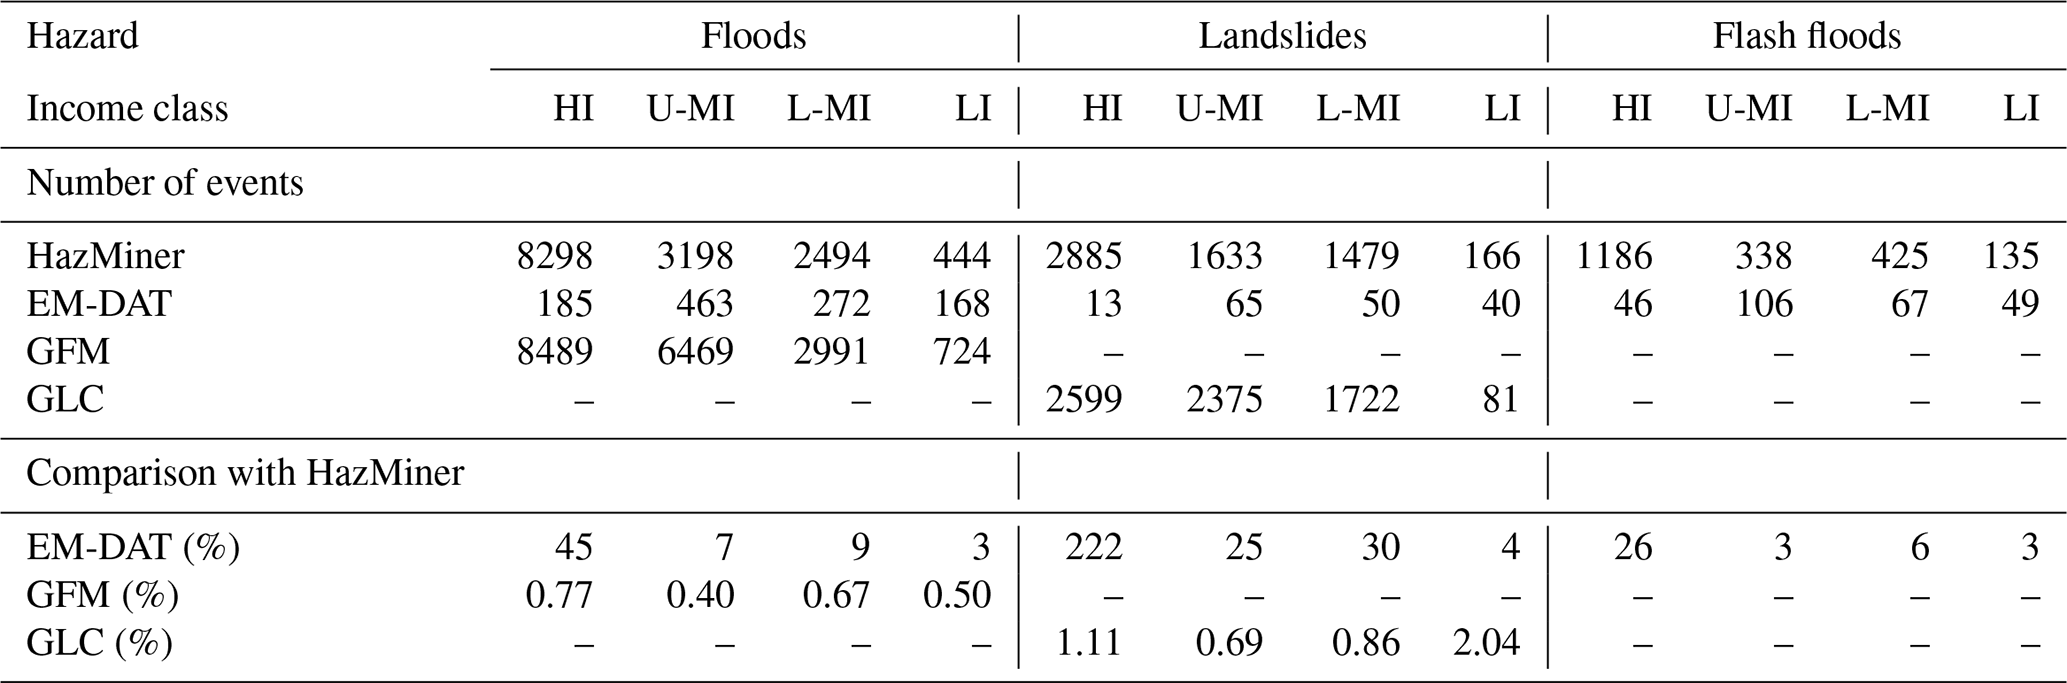
HazMiner processed 6 366 905 articles (end of step 1; text preprocessing, on Fig. 1), comprising of 98 001 284 paragraphs. It documented 24 407 events worldwide over the 2017–2024 period, including 15 313 floods, 6836 landslides, and 2258 flash floods (Table 1). Over the same period, HazMiner documented over four times more events than EM-DAT (Delforge et al., 2025). Overall, the increase of information is the highest for landslides, as well as for high-income countries (Table 1). Compared with the other reference datasets, HazMiner reported more landslide events than GLC in the high- and low-income classes, but fewer flood events than GFM across all income classes.
Table 1Total number of HazMiner events and the relative variations (Eq. 2) in event numbers compared with three reference datasets; EM-DAT, GFM and GLC. The datasets are described and compared per hazard type and over different income classes. EM-DAT is compared with HazMiner over the same period from 2017–2024. GFM is compared with HazMiner from 2017 to March 2023, corresponding to the temporal overlap between the two datasets. GLC is compared to HazMiner from 2007–2014, including the same number of years as HazMiner but a different period. Values greater than one indicate that HazMiner reports more events than the corresponding reference dataset. The four income classes are defined by World Bank (Metreau et al., 2025): High-Income (HI), Upper-Middle-Income (U-MI), Lower-Middle-Income (L-MI), and Low-Income (LI). Backslashes indicate no data, as these datasets do not include these hazards.
In both HazMiner and EM-DAT the highest share of extreme flood and landslide events, i.e. events with more than 10 fatalities, occur in the low-income class (Table 2). However, EM-DAT has a higher share of extreme events with the largest differences in the low- and lower-middle-income classes for landslides.
Table 2Percentage of extreme events in HazMiner and EM-DAT, and their difference in share. Extreme events are defined as events with more than 10 fatalities. The datasets are described and compared per hazard type and over different income classes. The four income classes are defined by World Bank (Metreau et al., 2025): High-Income (HI), Upper-Middle-Income (U-MI), Lower-Middle-Income (L-MI) and Low-Income (LI).

At the country level, HazMiner reports more events in nearly all countries compared to EM-DAT, the most notable variation of this pattern being in Latin America (Fig. 2). HazMiner outperforms EM-DAT not only in countries where EM-DAT reports the highest number of events, but also in countries where EM-DAT does not have data, like with the landslides in Europe and Canada.
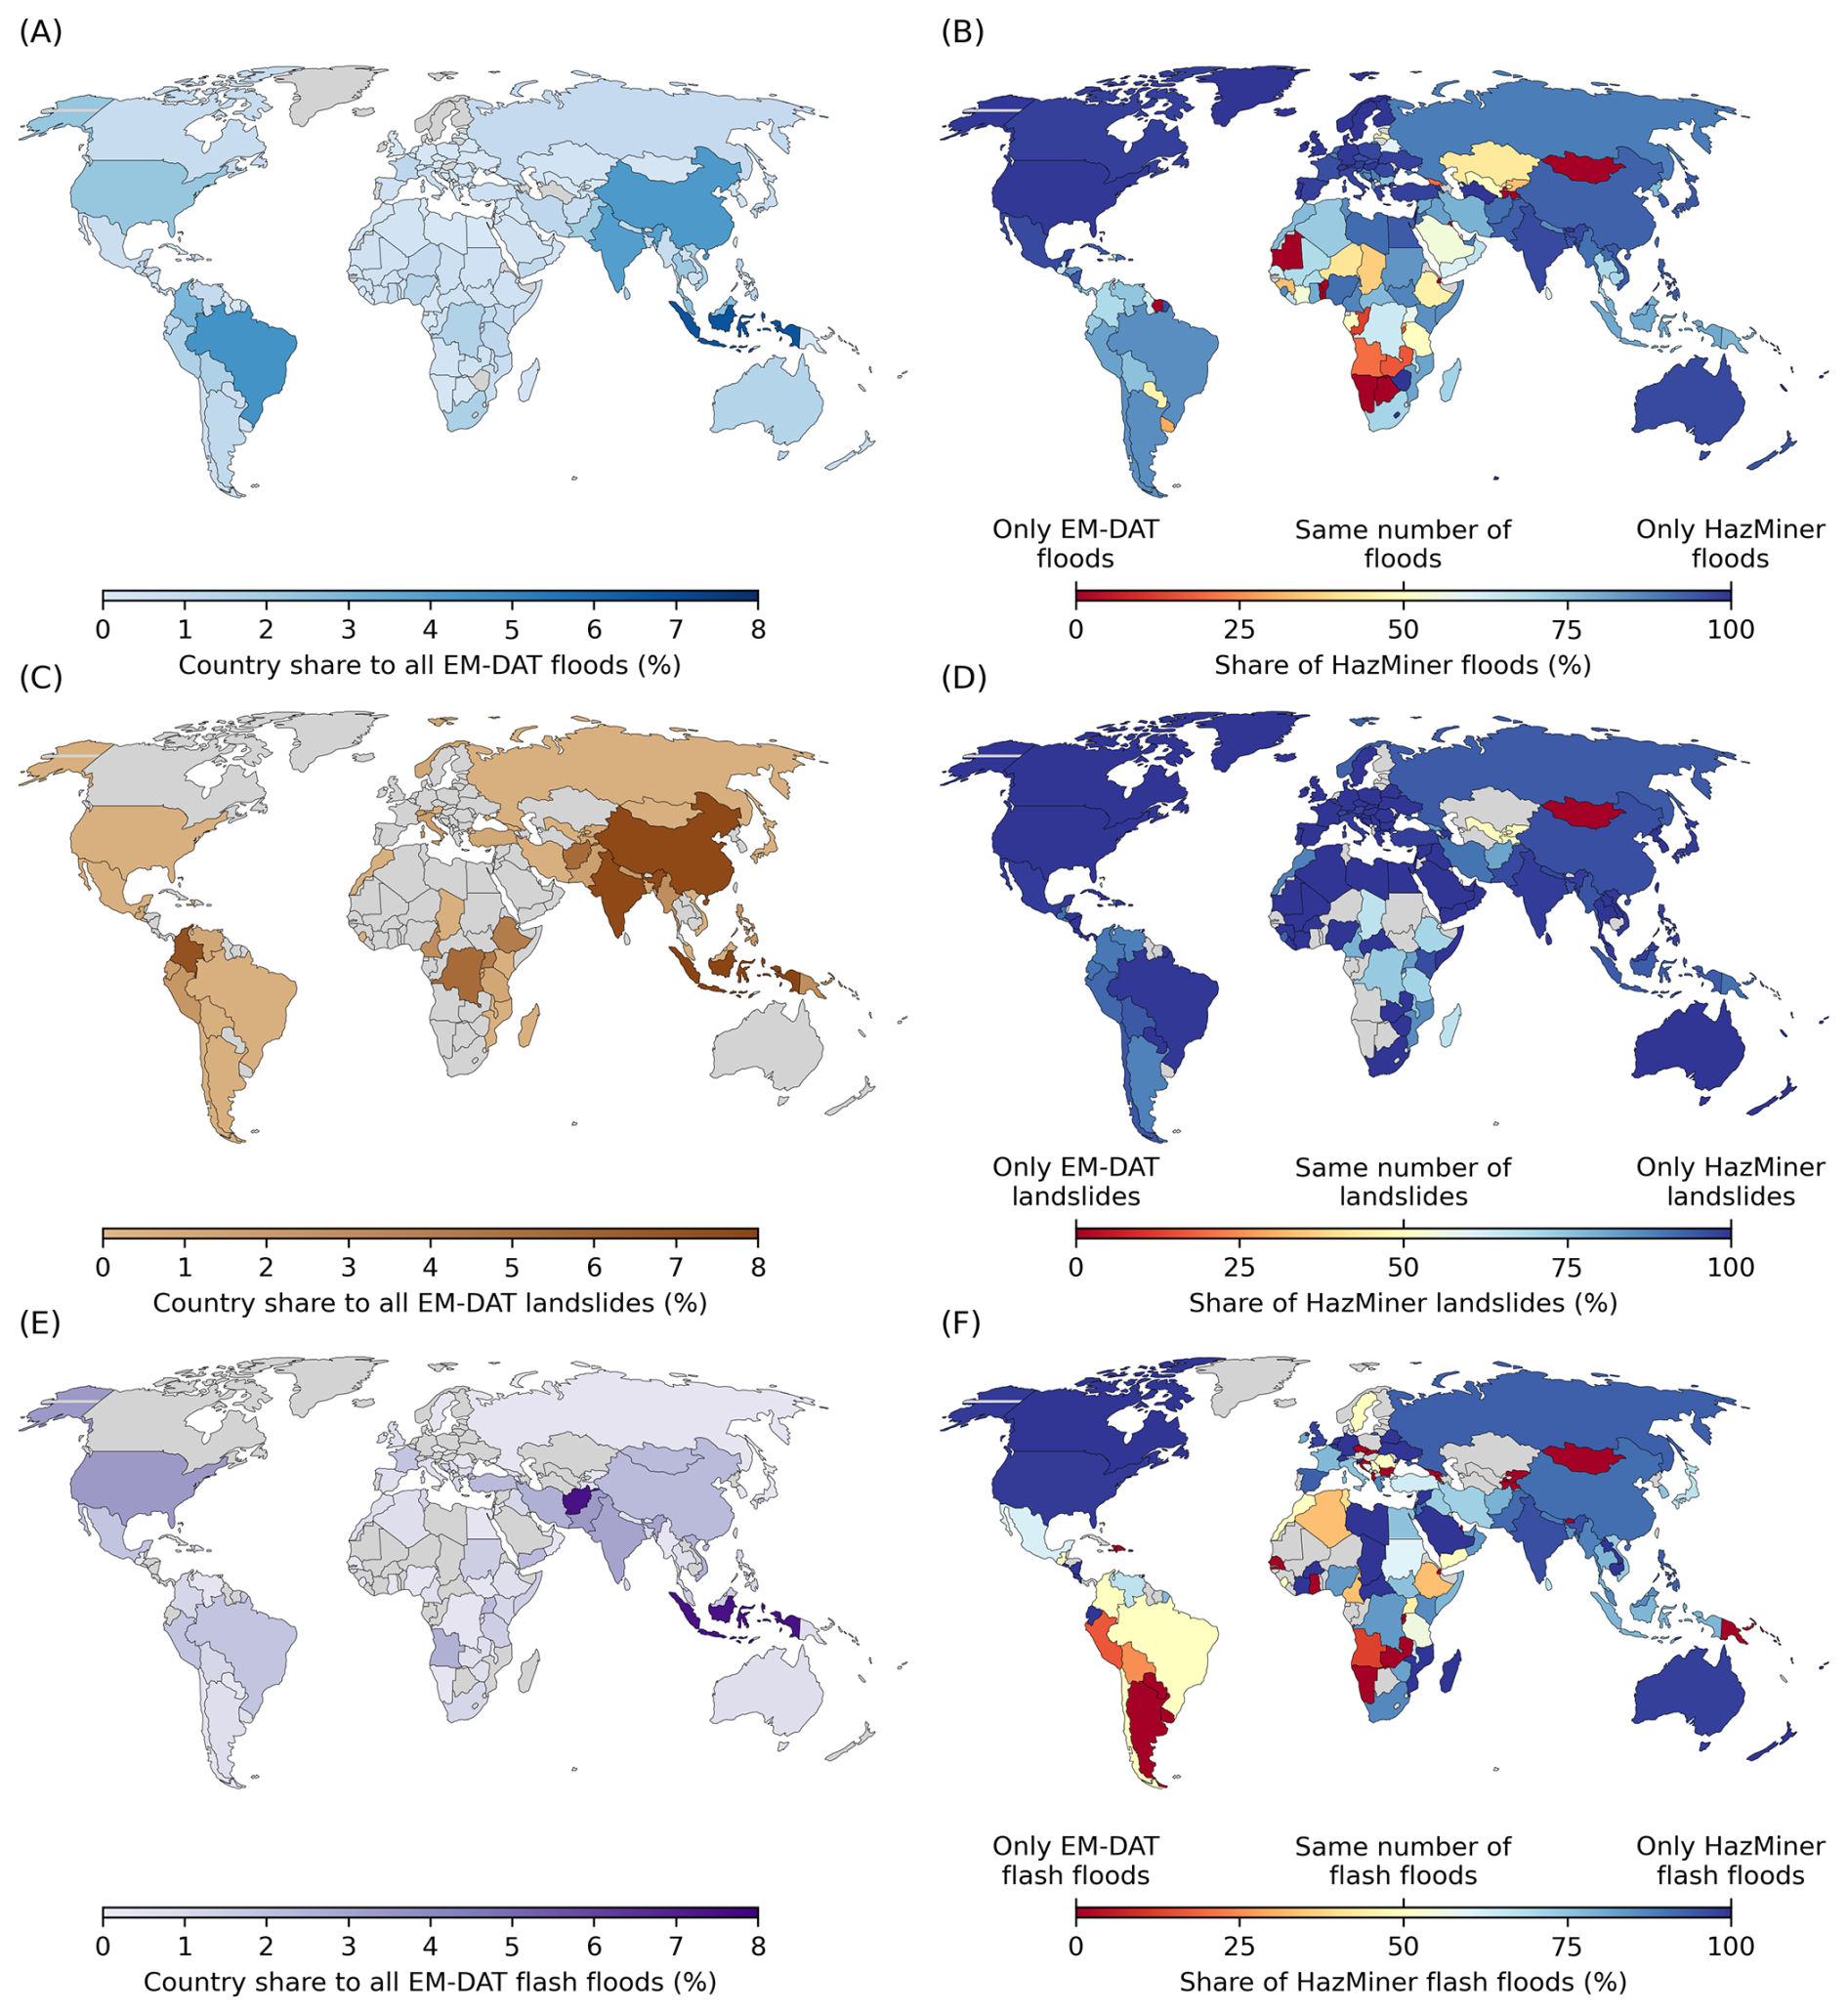
Figure 2Comparison between the HazMiner and EM-DAT event databases at the country level (2017–2024), for floods (A, B), landslides (C, D), and flash floods (E, F). (A), (C) and (E) show the percentage of the total EM-DAT events per country over all EM-DAT events. (B), (D) and (F) show the share of HazMiner, or EM-DAT events, when combining both datasets. Grey countries do not have any data.
3.2 Evaluation of HazMiner
Evaluations of HazMiner included manual assessment (binary filter of hazard-related text, zero-shot hazard classification, non-event filter and event evaluation), and comparison with the GLC (geoparsing), EM-DAT (time and impact extraction) and GFM (time extraction) databases.
As mentioned in Sect. 2.5, the classification of hazard-related text was evaluated against 750 manually classified paragraphs, of which 123 were positively annotated and 627 negatively (Table 3). This resulted in a recall of 0.59 (true positives; Fig. 3C) and precision of 0.61, at the optimal confidence threshold of 0.5. The low recall means that 41 % of true hazard-related paragraphs were missed.
Table 3The F1-score, recall and precision of the positive class for different tasks at a given threshold. For each task the number of positive and negative labels used for the evaluation are reported.

The zero-shot hazard classification was evaluated against 2000 manually classified paragraphs, of which 477 were annotated as floods, 69 as landslides, 60 as flash floods and 1394 as “other hazard” (Table 3). To optimise the zero-shot hazard classification, we calibrated confidence thresholds for each hazard by evaluating the trade-off between true positive rate and false positive rate. For floods, a relatively high threshold (0.85) was selected to reduce the number of false positives, resulting in a false positive rate of 0.16. Lower thresholds were selected for landslides (0.55) and flash floods (0.70).
These thresholds resulted in a classification of floods and landslides characterised by a high recall of 0.78 and 0.73, respectively. This indicates that the model correctly identifies a large proportion of the positively annotated flood- or landslide-related paragraphs. But its low precision results in a considerable proportion of paragraphs predicted as floods (precision of 0.65) or landslides (precision of 0.64), that are in fact not related to these hazards (Table 3). For floods, these false positives paragraphs mostly describe heavy rains, without any flooding (Fig. 3F). The landslide classification has a false positive rate of 0.01; many annotated non-landslide paragraphs are correctly classified as non-landslides. In contrast, the classification of flash floods has a low recall of 0.63, but high precision of 0.92 (Table 3). The low recall can be explained by many flash floods being misclassified as floods (Fig. 3F). However, when the model predicts a flash flood, the prediction is generally correct.
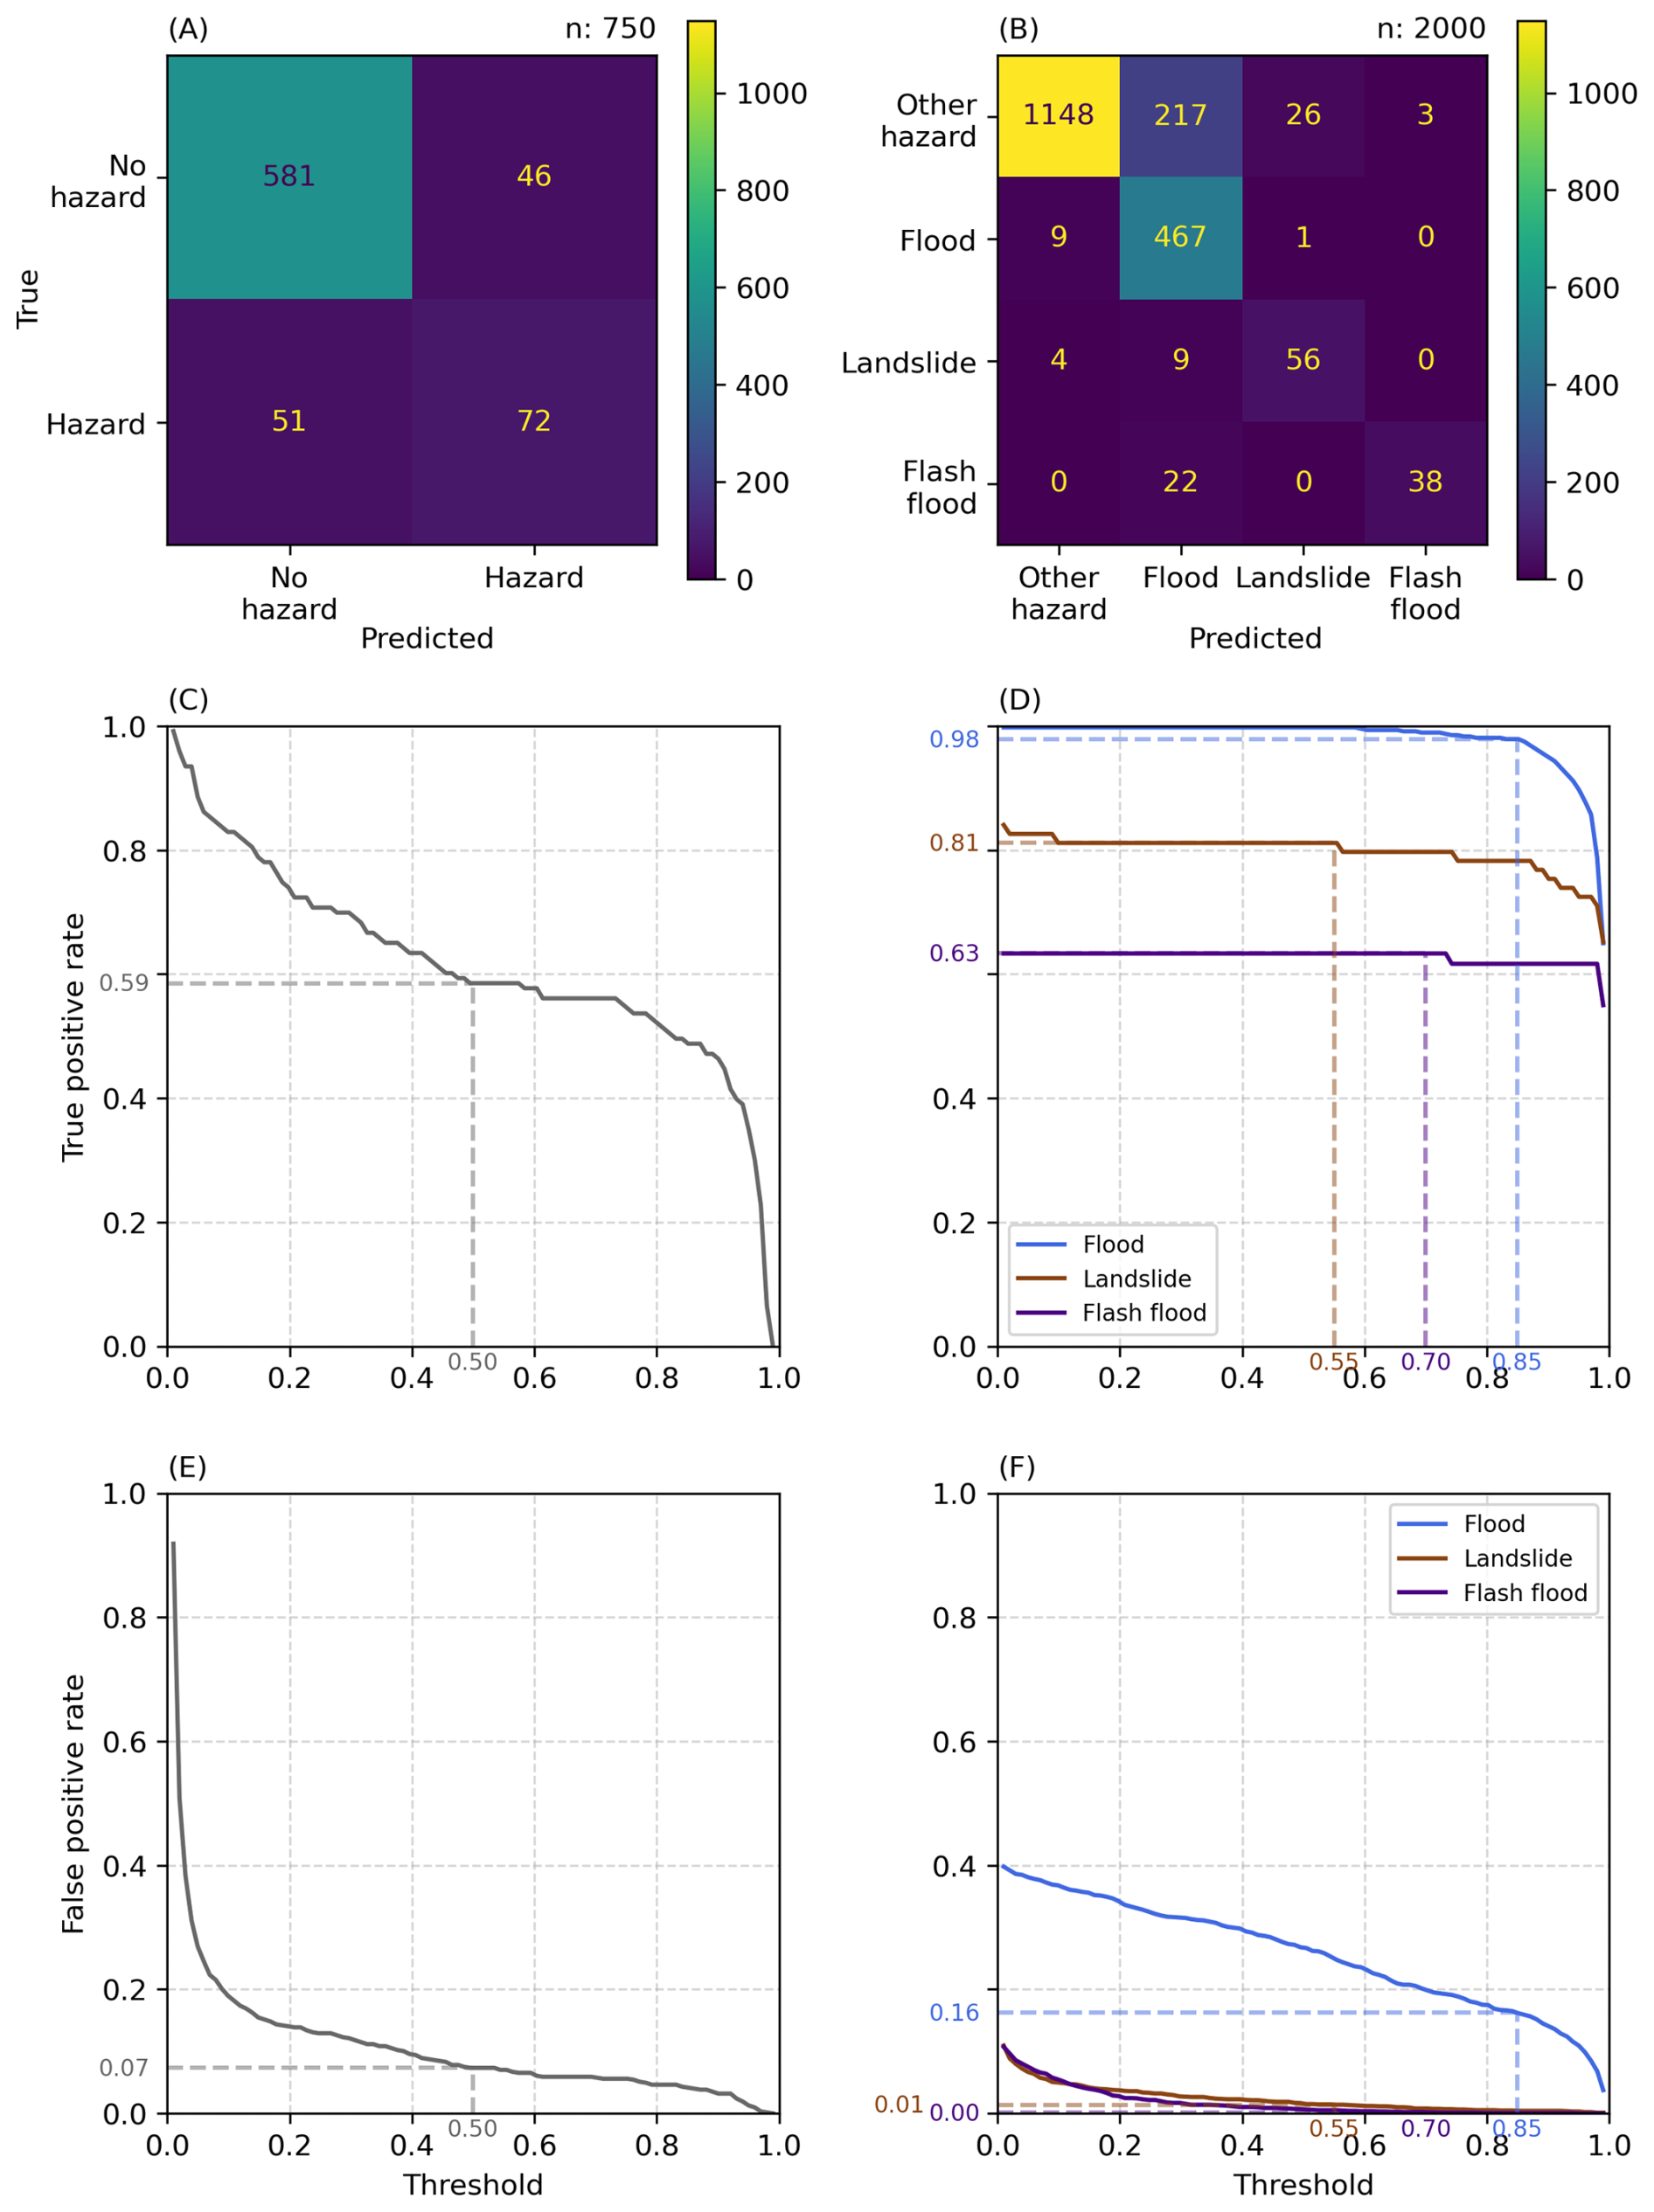
Figure 3Evaluation of HazMiner's two filtering steps: (A, C, E) hazard-related text filter and (B, D, F) zero-shot hazard classification. Plots (A) and (B) show confusion matrices, plots (C) and (D) show true positive rate across different thresholds, and plots (E) and (F) show false positive rates across different thresholds.
Non-events are filtered out by the “ValkB/all-MiniLM-L12-v2_HazMiner_nonevents” NLP model (Valkenborg et al., 2026) with a F1-score of 0.74, a recall of 0.78 and precision of 0.71. This step was evaluated against 89 positive and 79 negative annotated paragraphs (Table 3). The confusion matrix can be consulted in the appendix (Fig. A1).
The classification of hazard-related text, and the flood classification steps are characterised by a low precision. Nevertheless, the propagation of this low precision over HazMiner is limited due to sequential filtering; many false positives are filtered out at a later stage. For example, from the 750 paragraphs evaluated for the hazard-related text classification, 46 were falsely classified as hazard-related text (Fig. 3A). Of these 46 false positives, only six were subsequently classified as either flood, landslide or flash flood by the zero-shot hazard classification step. The other 40 false positive paragraphs were removed from the HazMiner dataset by the zero-shot hazard classification step. Similarly, 248 paragraphs, evaluated for zero-shot hazard classification, were falsely classified as floods (Fig. 3B). In the subsequent non-event filter, 110 out of these 248 false positives were correctly identified as non-events and excluded from the final HazMiner dataset.
Table 4Evaluation of HazMiner's time extraction algorithm based on EM-DAT (n=1308) and GFM (n=18 719) reference datasets. For the best spatiotemporal match, differences between the reference dates and the dates extracted by HazMiner were calculated for the start and end dates at the event and paragraph levels. Summary statistics of these differences are reported as the minimum (Min.), 25th percentile (Q25), median, 75th percentile (Q75), and maximum (Max.). A negative value indicates that HazMiner provides a later start or end.
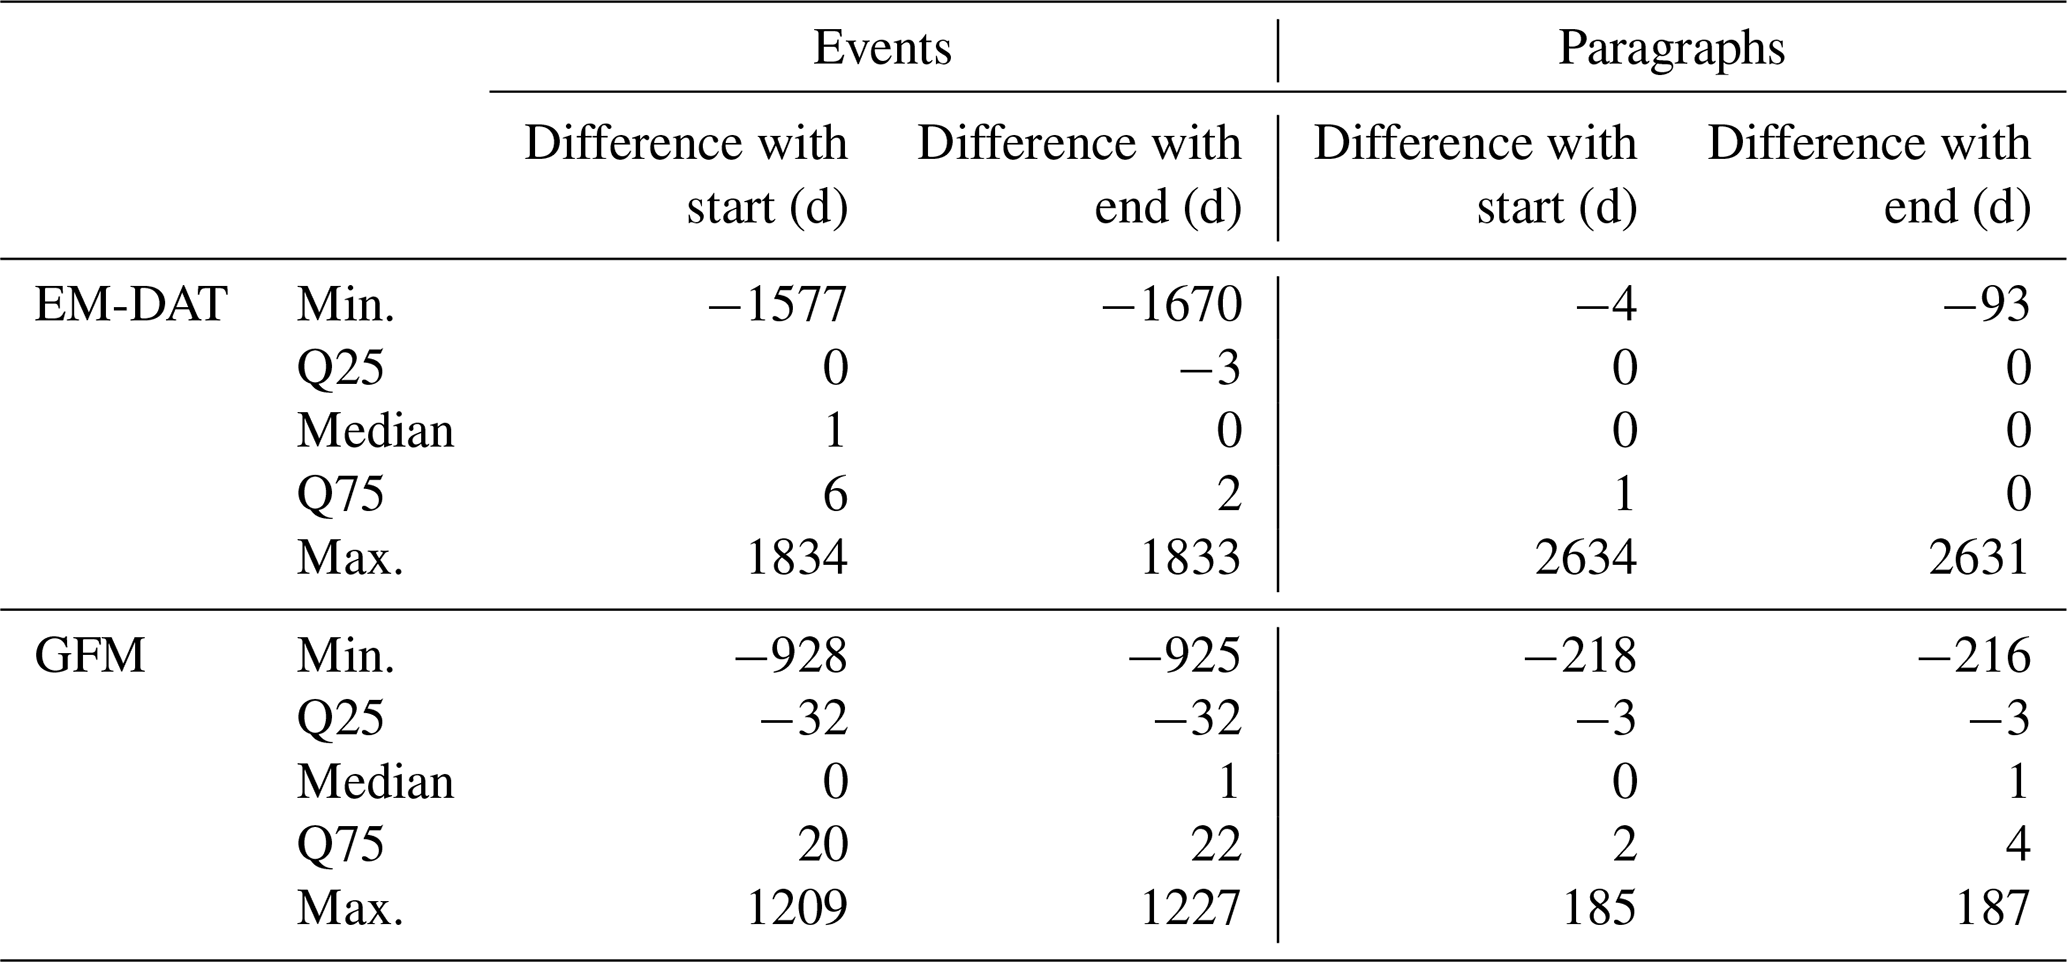
The timing of HazMiner events and paragraphs was evaluated against the timing of two reference datasets; EM-DAT and GFM (Table A4). Around 50 % of the HazMiner events have a time difference of minimum 0 to maximum 6 d with the start of the EM-DAT event and −3 to 2 d with the end of the EM-DAT event. These results suggest that HazMiner generally reports a later start compared to EM-DAT. Similar results are reported for the GFM but with a wider range (for the start between −32 and 20 d, and for the end between −32 and 22 d) (Table 4). Paragraphs have a smaller difference in timing between the reference dataset and HazMiner, which is probably due to the many paragraphs available in HazMiner, increasing the likelihood of a temporal match.
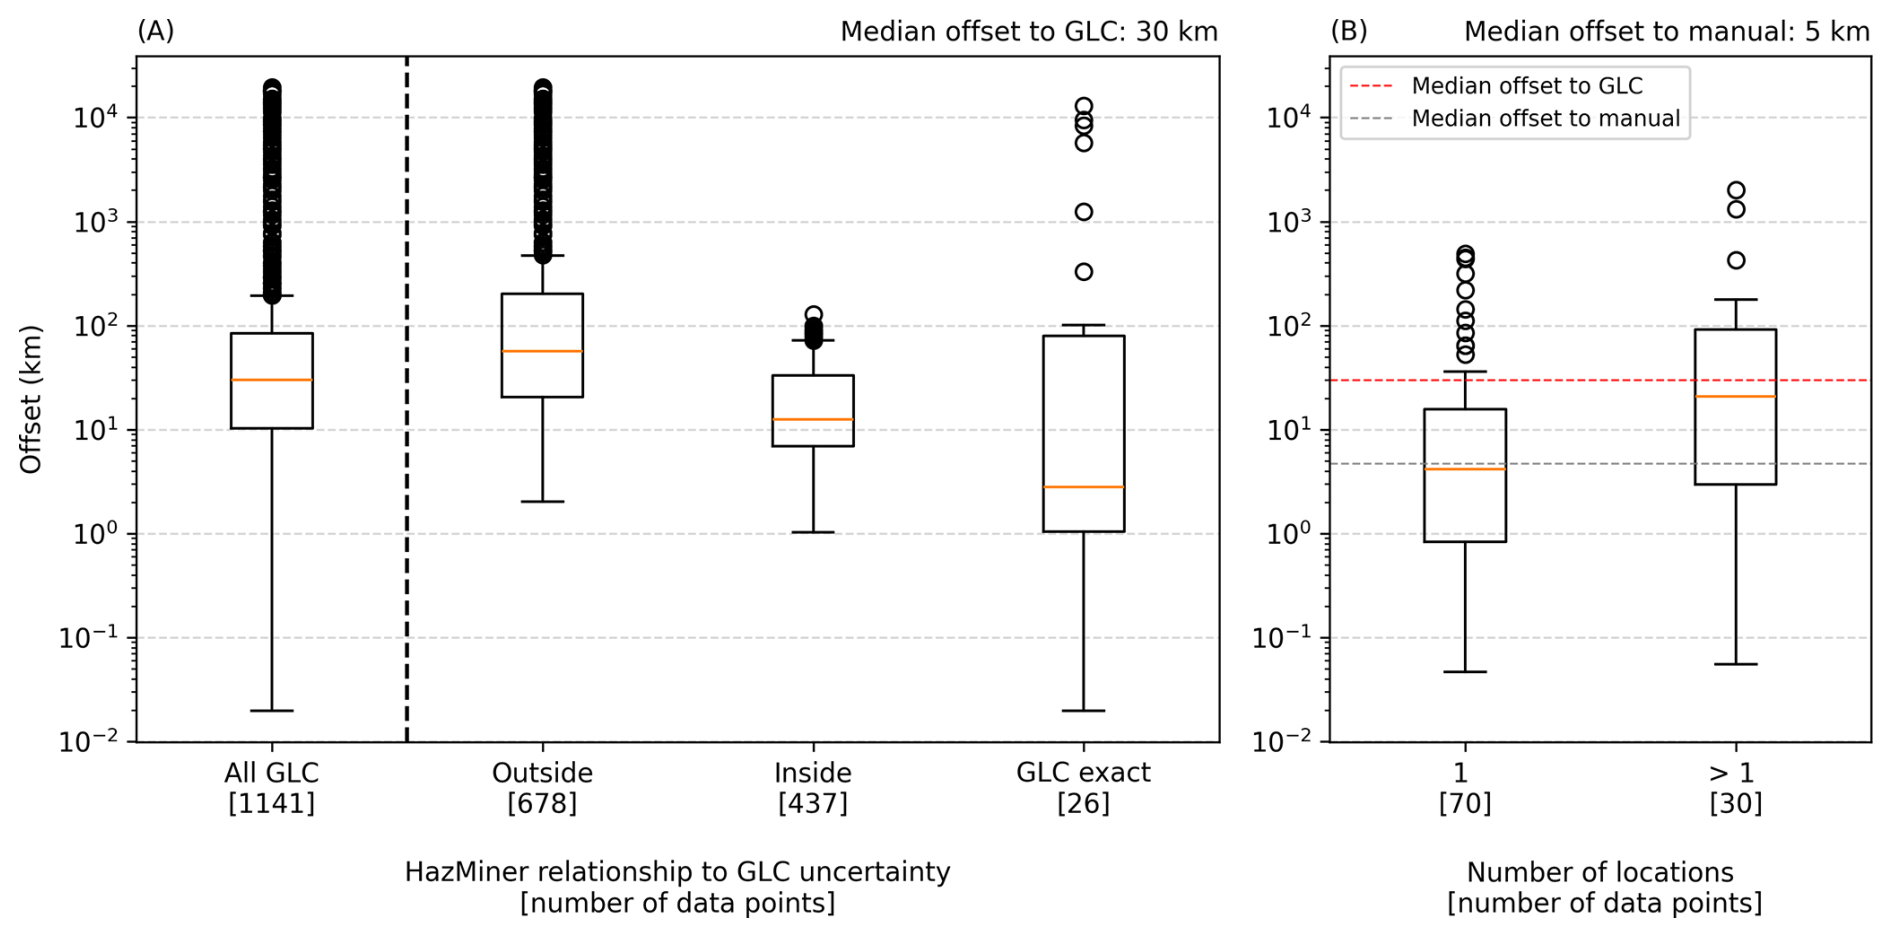
Figure 4Evaluation of the HazMiner geoparsing algorithm to (A) the GLC and (B) manually geolocated paragraphs.
To evaluate the geoparsing algorithm, HazMiner was applied to the articles included in the GLC (Table A4), the locations extracted by HazMiner were compared with the corresponding locations reported in the GLC (Fig. 4A). This resulted in a median difference of 30 km between a GLC location and the HazMiner location for the same article. The GLC additionally reports an uncertainty with each location, ranging from 0–100 km. The majority of HazMiner locations (59 %) were located outside the GLC uncertainty. The exact location of the GLC event is known for 26 paragraphs for which the median distance between the GLC's exact location and the HazMiner location is 3 km.
Additionally, we manually located 100 randomly selected paragraphs based on the location description of the hazard event and evaluated them against the geoparsed HazMiner location (Fig. 4B). The median distance between HazMiner and the manual evaluation point is 4 km (n=70 paragraphs). For the manual evaluation, the median distance to the event is larger for the HazMiner locations when the location relies on multiple place names in the paragraph.
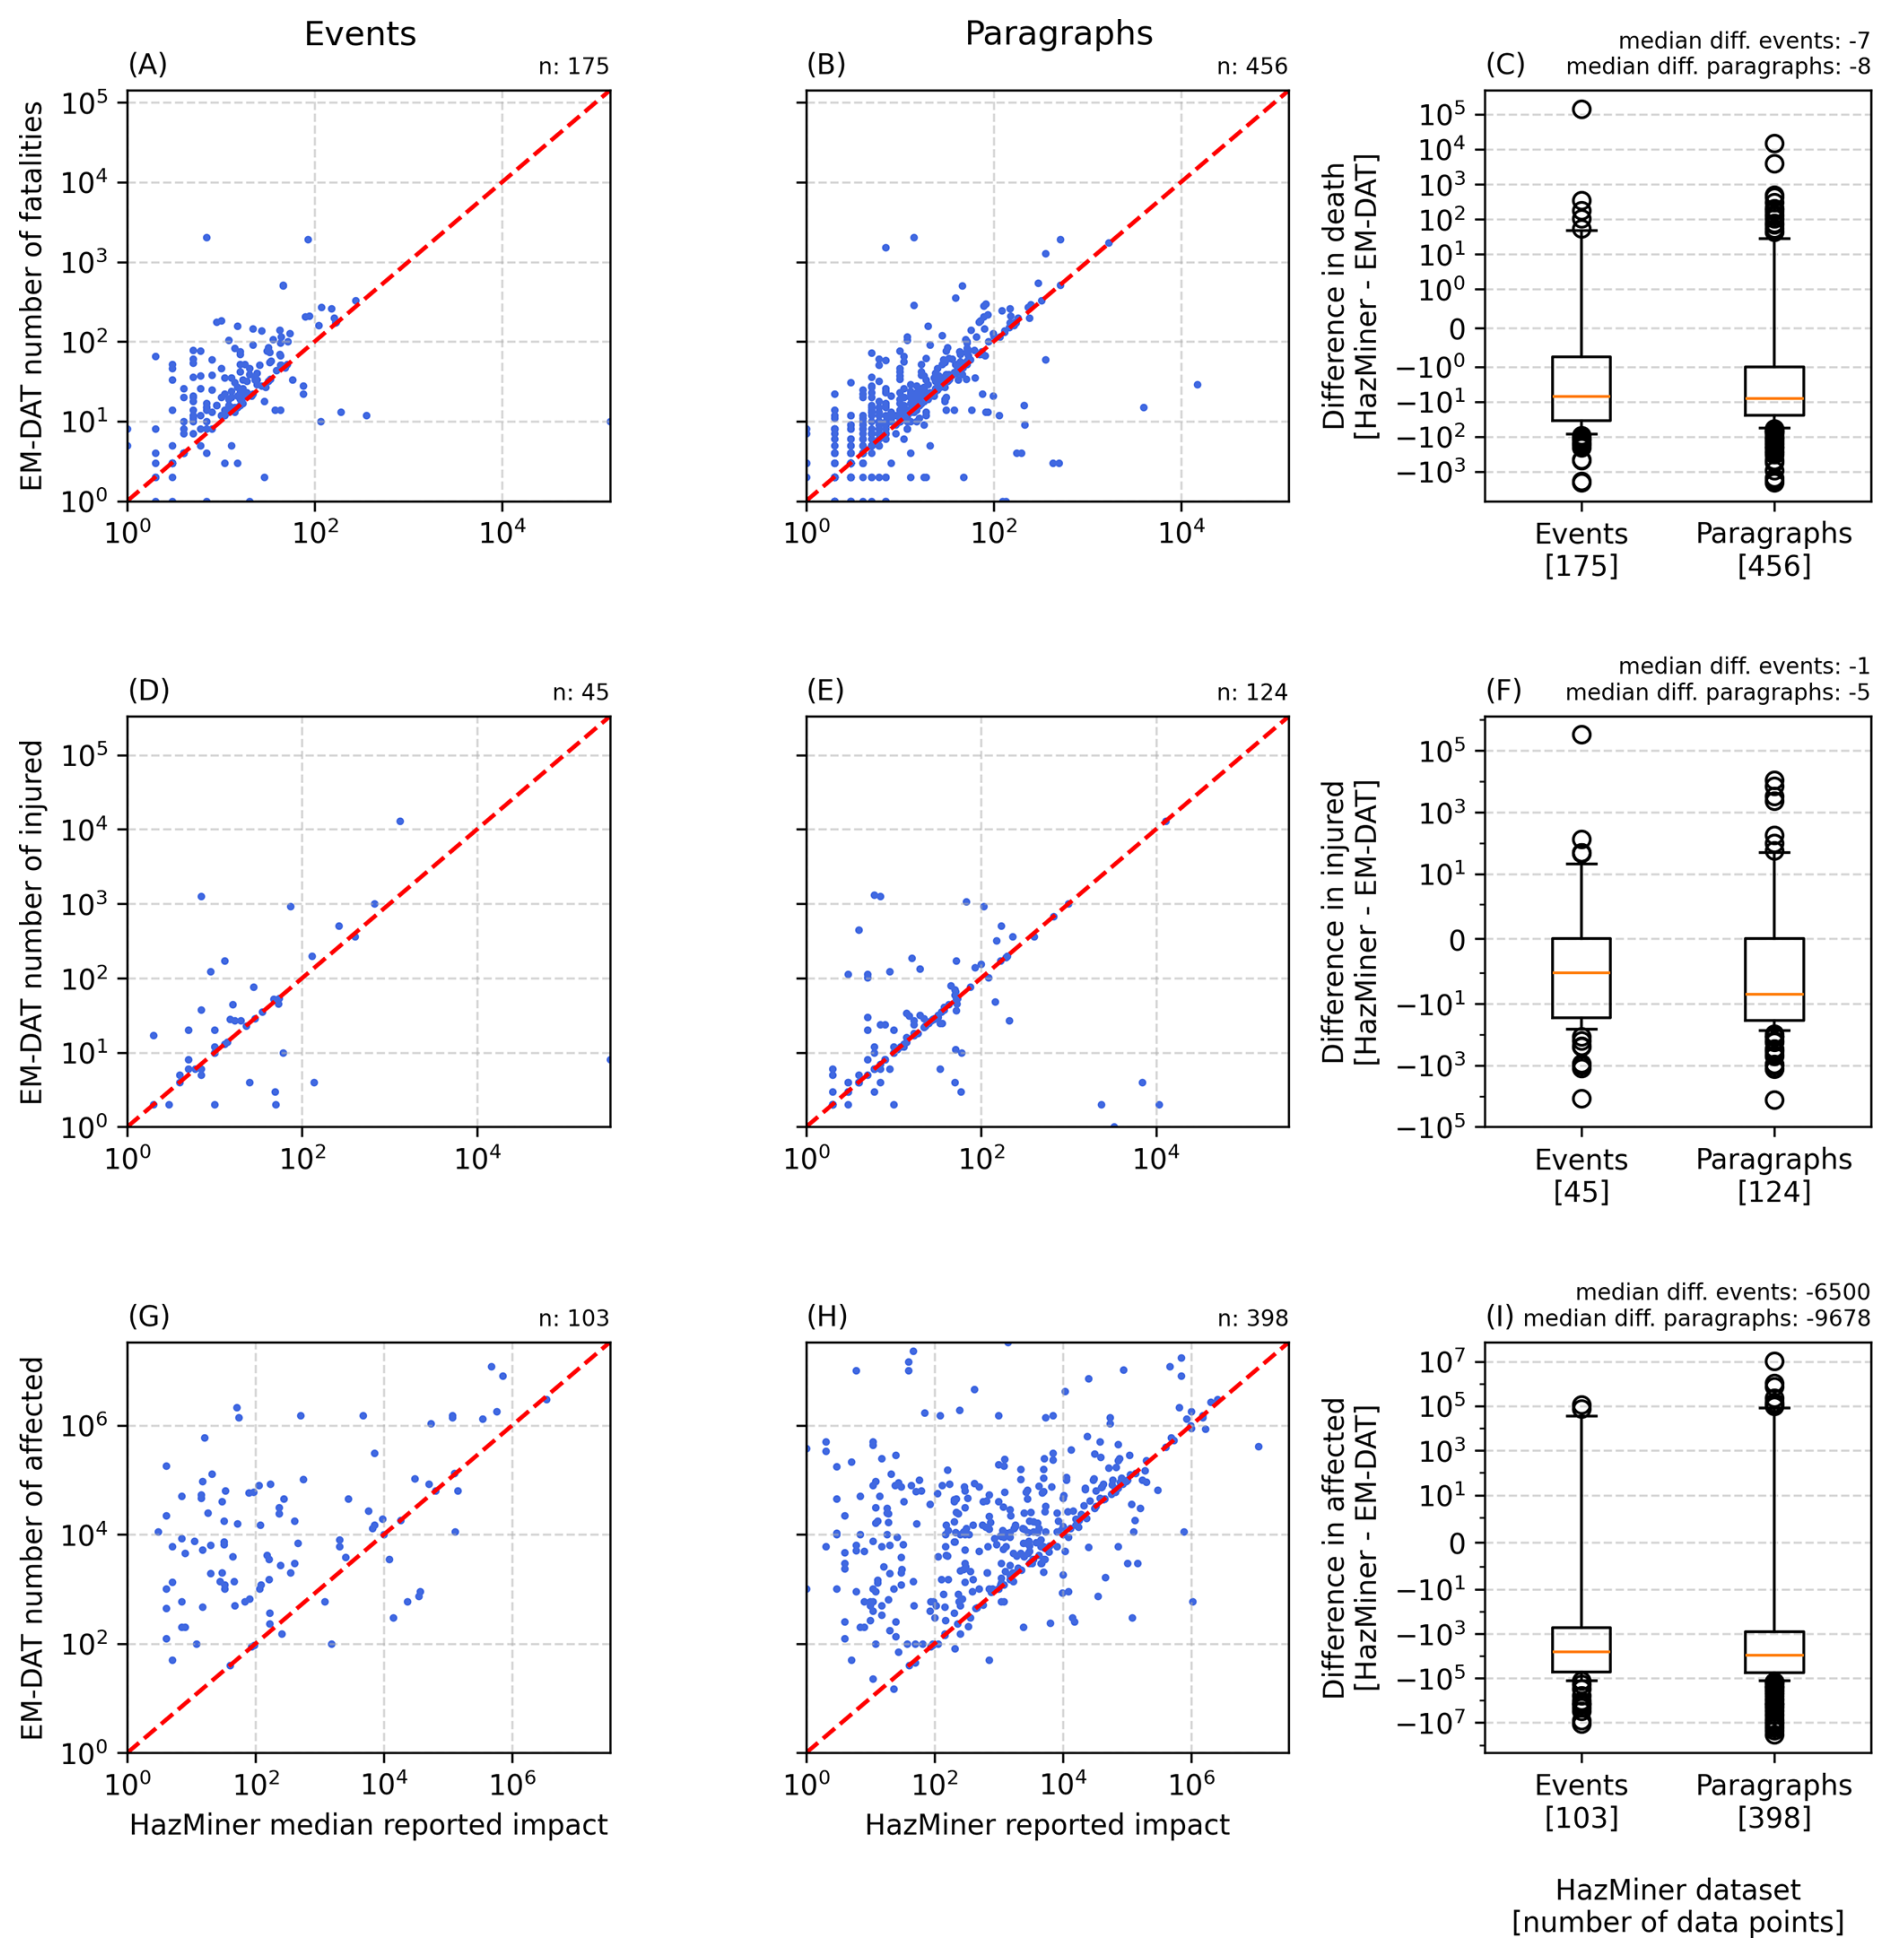
Figure 5Evaluation of HazMiner impact extraction through a comparison with EM-DAT data. Plots (A)–(C) show fatalities, (D)–(F) injuries, and (G)–(I) affected populations. For each impact type, HazMiner values are compared to EM-DAT at the event level (A, D, G) and paragraph level (B, E, H), with the red dashed line indicating the 1:1 relationship. Plots (C), (F), and (I) display the differences between HazMiner and EM-DAT for both event- and paragraph-level data.
HazMiner's impact extraction algorithm was evaluated against the impacts of disasters documented by EM-DAT (Table A4). For each EM-DAT event, the best matching HazMiner record is identified at both the paragraph and event levels. A match is defined as a HazMiner data point occurring in the same country (as EM-DAT only reports their impacts at the country level), and with the smallest difference in reported impact. Overall, HazMiner tends to underestimate EM-DAT values for all three extracted impact types, with the largest underestimation observed for the number of affected people (Fig. 5I).
Based on a manual inspection, we noticed that translation might influence impact extraction. For instance, the Turkish sentence: “Yapılan açıklamada, 1,6 milyonu çocuk olmak üzere 4 milyon kişi, ani selde mahsur kaldı” was translated by the HazMiner translation model as “4 million people lost their lives”. However, a native Turkish speaker translated it as follows: “According to the statement, 4 million people, which 1.6 million are children, are stranded by the flash flood”. Two issues emerge: (1) the impact type is misclassified, with “affected” translated as “fatalities”, and (2) part of the information, “1.6 million children”, is lost. These highlighted limitations are discussed in Sect. 4.5.1.
Of the 75 evaluated events, 70 (93 %) corresponded to an actual geo-hydrological hazard event. The extracted hazard type was correctly identified in the paragraphs for 65 events (87 %), while the paragraphs consistently referred to the same event for 59 events (79 %). In terms of information extraction, the event location was correctly documented for 62 events (83 %). Temporal information was present in at least one paragraph for 52 events (69 %). Among these, the reported timing fell within the documented event duration (i.e., between the recorded start and end dates) for 37 events (71 %). Moreover, for 28 of the 52 events (54 %), at least one paragraph reported a hazard date that exactly matched the extracted event date. HazMiner events appear to under-detect impact information in the text. Although 42 events contained paragraphs describing at least one impact category documented by HazMiner, only 11 events had a reported impact. Detailed results for each impact category are provided in Table A7.
Lastly, the sensitivity of the three clustering parameters – xi-value, minimum number of paragraphs, and maximum epsilon – was evaluated with respect to the number of events, the average number of paragraphs per event, and the average duration. Among these parameters, the minimum number of paragraphs showed the largest influence on the results, whereas the xi-value and maximum epsilon had only a minor effect (Fig. A2).
3.3 Global spatiotemporal distribution of impactful hazard events
At the global scale, a geo-hydrological hazard event extracted from news reporting is characterised by a mean duration of two days and an average size, i.e., the bounding box containing all paragraphs per event, of 1929 km2 and median of 0.009 km2. Generally, geo-hydrological hazard events occur in densely populated areas, with 56 % of events having a population density higher than 61 people per km2, the mean global population density (European Commission. Joint Research Centre, 2023). Flood events contain the most data (average of 89 paragraphs per event), compared to landslides (average of 24 paragraphs per event) or flash floods (average of 20 paragraphs per event).
The temporal distribution of floods, landslides, and flash floods follows a seasonal trend for both hemispheres (Fig. 6). The Northern Hemisphere reaches its maximum from May–September, while the Southern Hemisphere reaches its maximum from January–March, especially for floods and flash floods. These maxima align with seasonal cycles and are even more pronounced at different latitudes, shifting over time for all three hazards (Fig. 7B, D, and F).
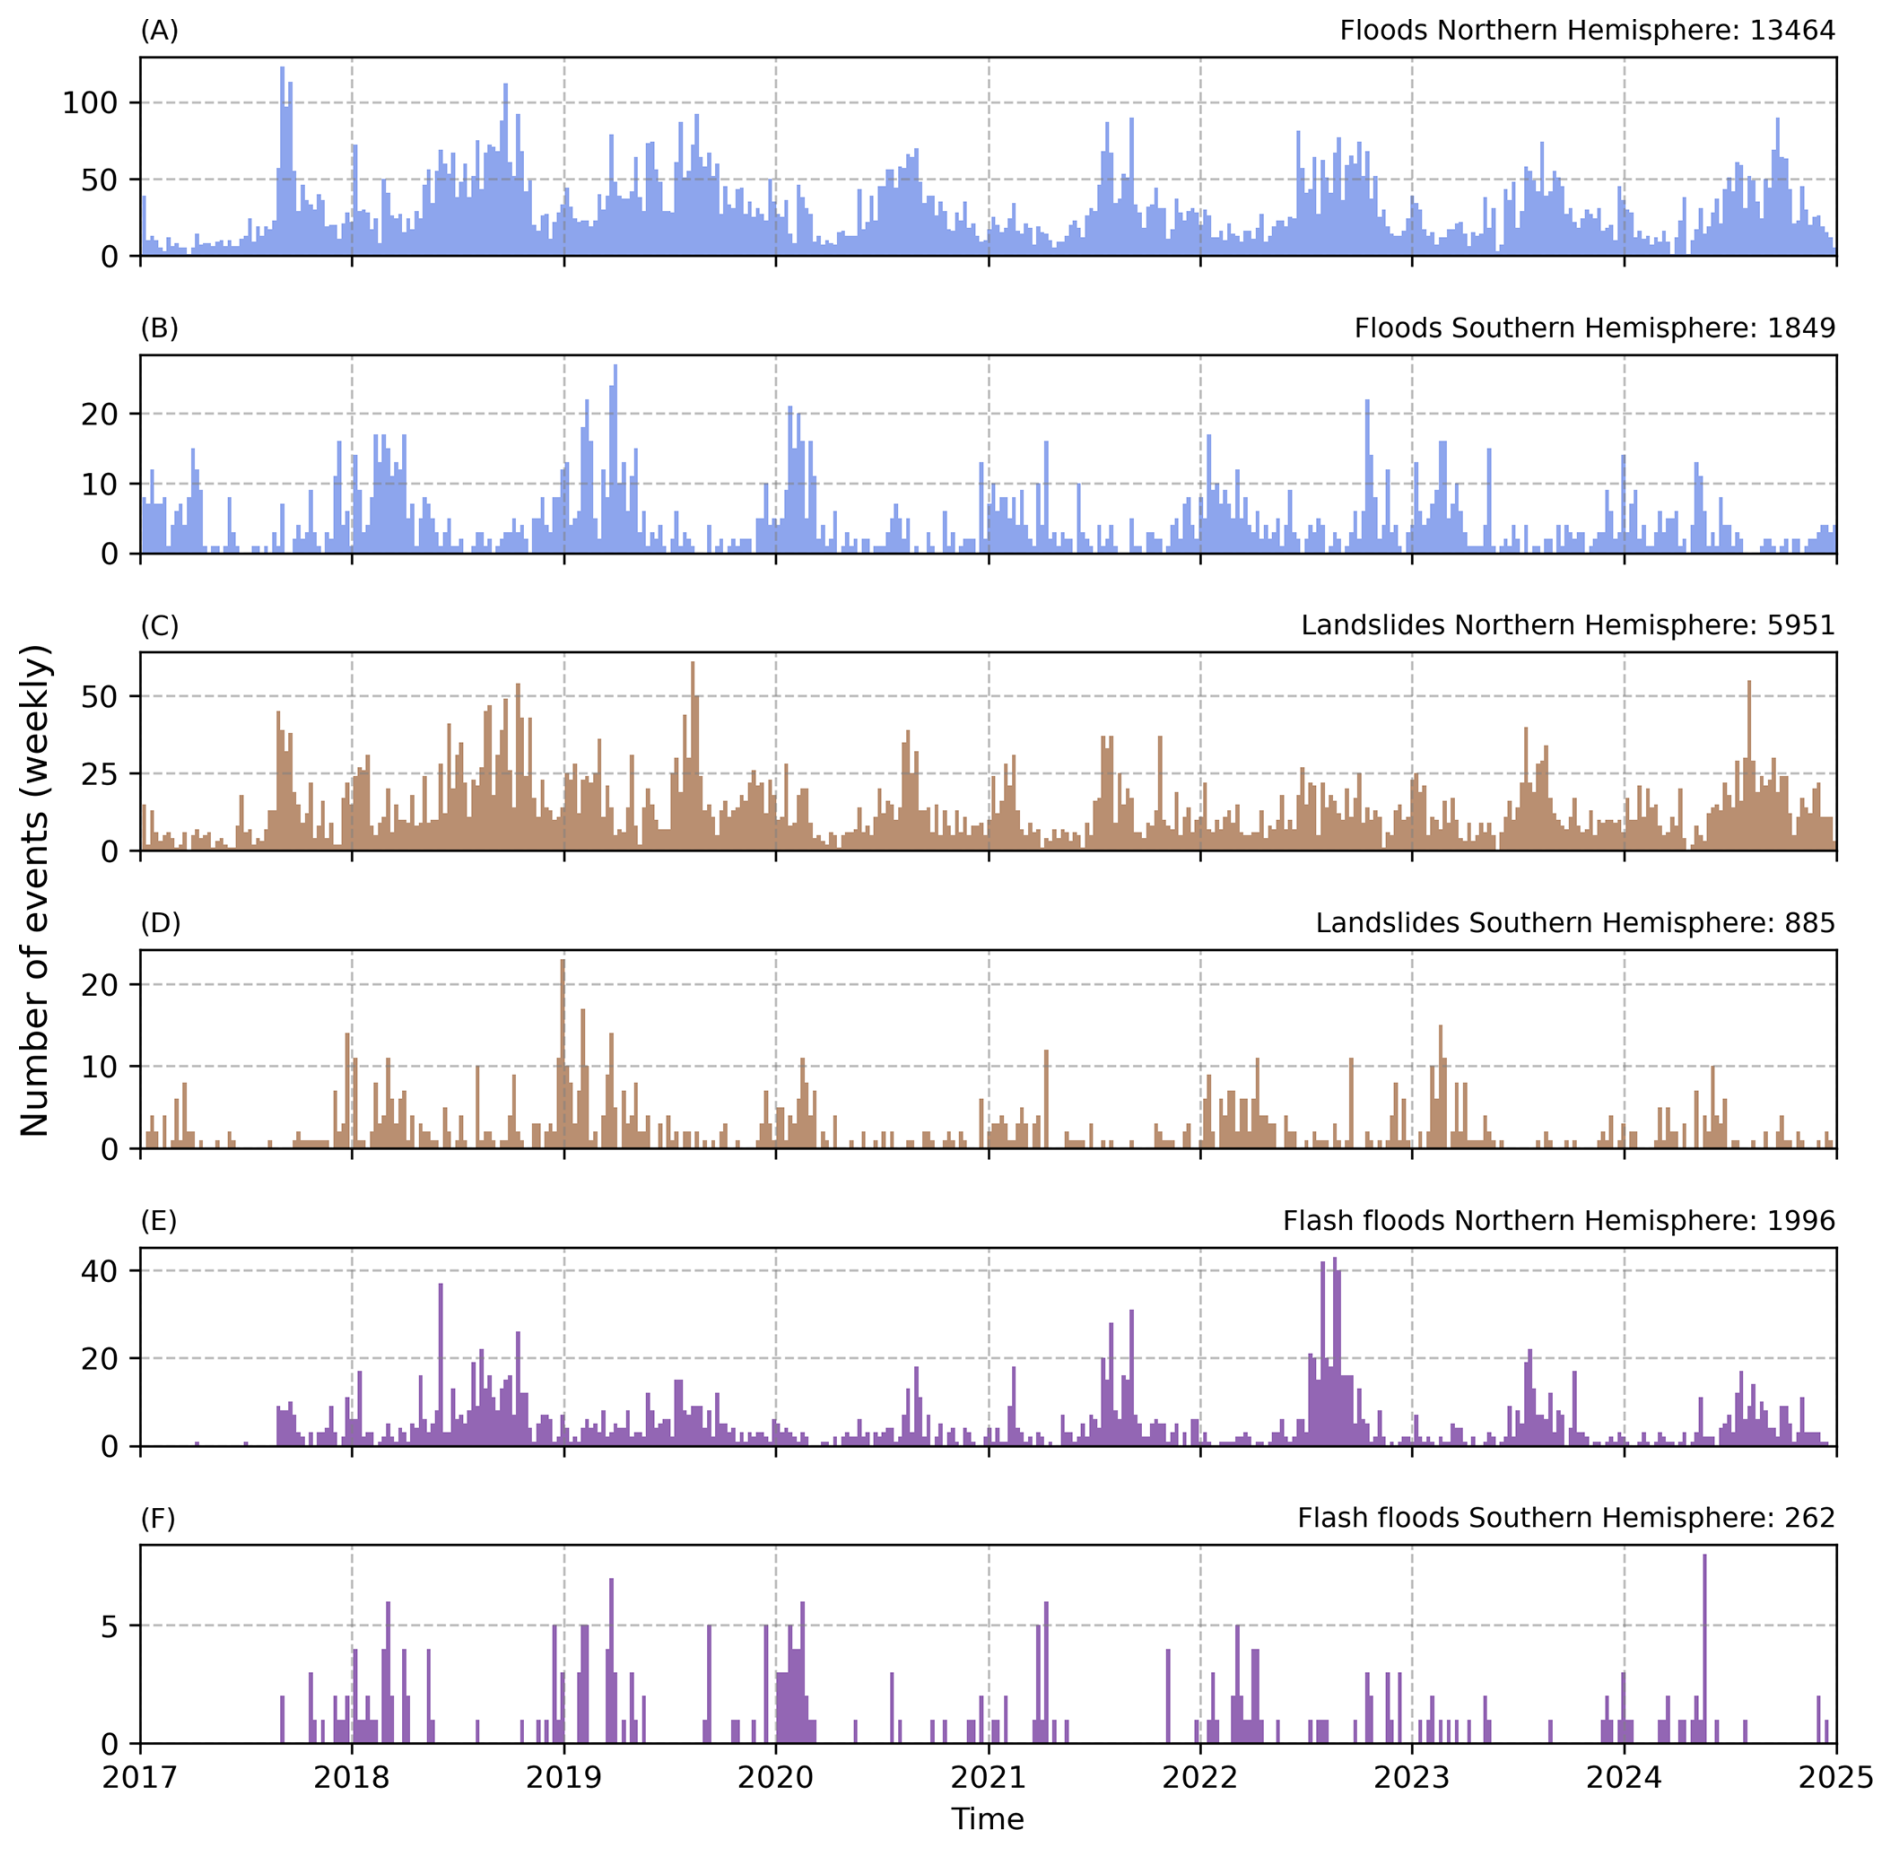
Figure 6Weekly time series of hazard events in HazMiner dataset by type and hemisphere. Plots (A), (B) show flood events, (C), (D) landslide events, and (E), (F) flash flood events, with the (A), (C), (E) plots representing the Northern Hemisphere and the (B), (D), (F) plots the Southern Hemisphere.
When displayed on a world map, the geo-hydrological hazard events reveal spatial patterns that broadly align with expected global trends (Fig. 7). Events mainly concentrate in densely populated areas, along river networks and, especially for landslides and flash floods, around mountainous areas (e.g., the Himalayas, Alps, or Andes). Additionally, floods are almost absent in arid to semi-arid regions (the Sahara or Western Australia).
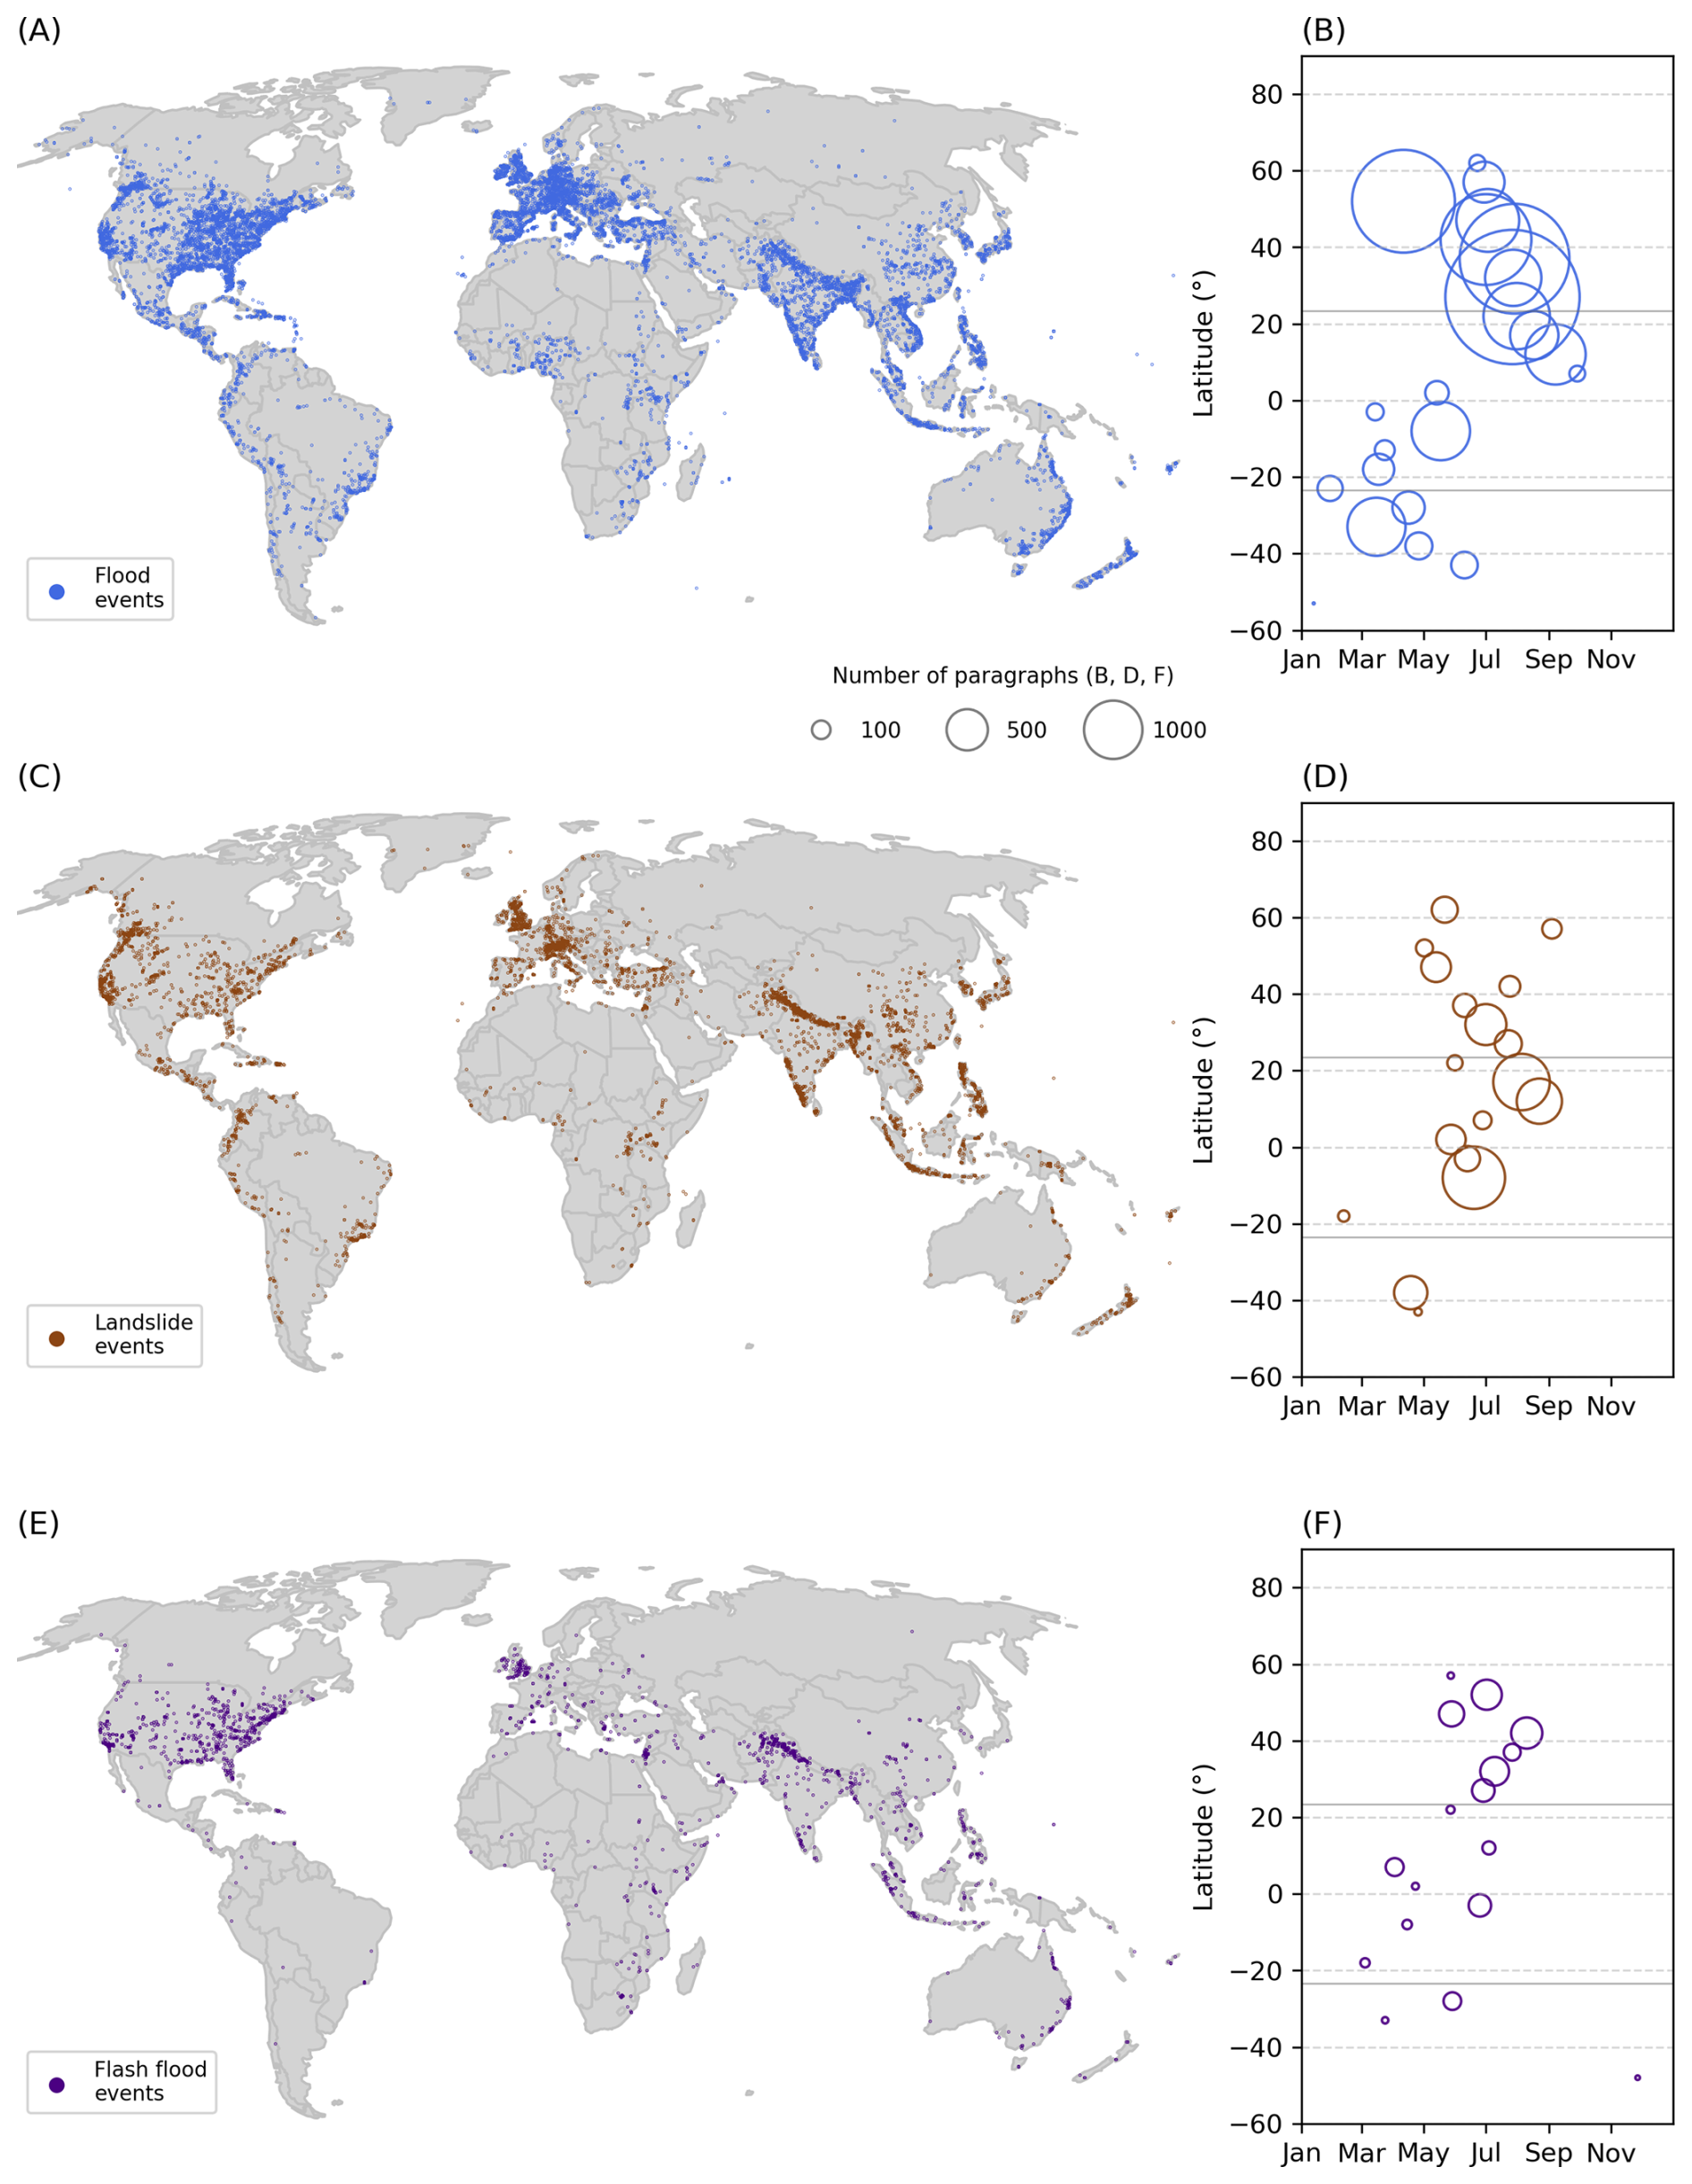
Figure 7Distribution of HazMiner dataset at the global scale. (A, C, E) Global maps of flood, landslide, and flash flood events, respectively. (B, D, F) For each 5°-latitude zone, the temporal occurrence of the yearly maximum number of events for flood, landslide, and flash flood events, respectively. The size of each data point corresponds to the number of paragraphs at the maximum.
However, the spatial distribution of events remains biased towards high-income countries (Table 1). For example, 5795 events are reported in the USA (approximately 9.2 million km2 landmass), i.e., 1.9 times the number of events in the Southern Hemisphere (approximately 49.2 million km2 landmass).
These observations correlate with the fact that the number of paragraphs per event significantly differs between high- and low-income countries, e.g., between the USA (average of 81 paragraphs per event, n: 5795 events) and Africa, containing 21 out of 25 low-income countries (average of 32 paragraphs per event, n: 999 events) (Mann–Whitney U Test, p-value: ).
Nevertheless, HazMiner's multilingual approach significantly reduced spatial biases and increased the amount of information available for event extraction, showing that some events would be missed if only English text was processed. Within the filtered paragraph dataset, 41 % of the news sources related to hazard events are based on non-English text. This resulted in an 18 % increase in the number of events detected globally. It is also worth noting that there are large national differences in the distribution of events coming from non-English text. For example, in Vietnam, Vietnamese text accounts for 81 % of all paragraphs (40 864 paragraphs). For Germany, 80 % of events would be missed if only English text were considered. Overall, it is mostly continental Europe, South and Central America, Africa, and Southeast Asia that highly depend on non-English text for the detection of geo-hydrological hazard events (Fig. 8E and F).
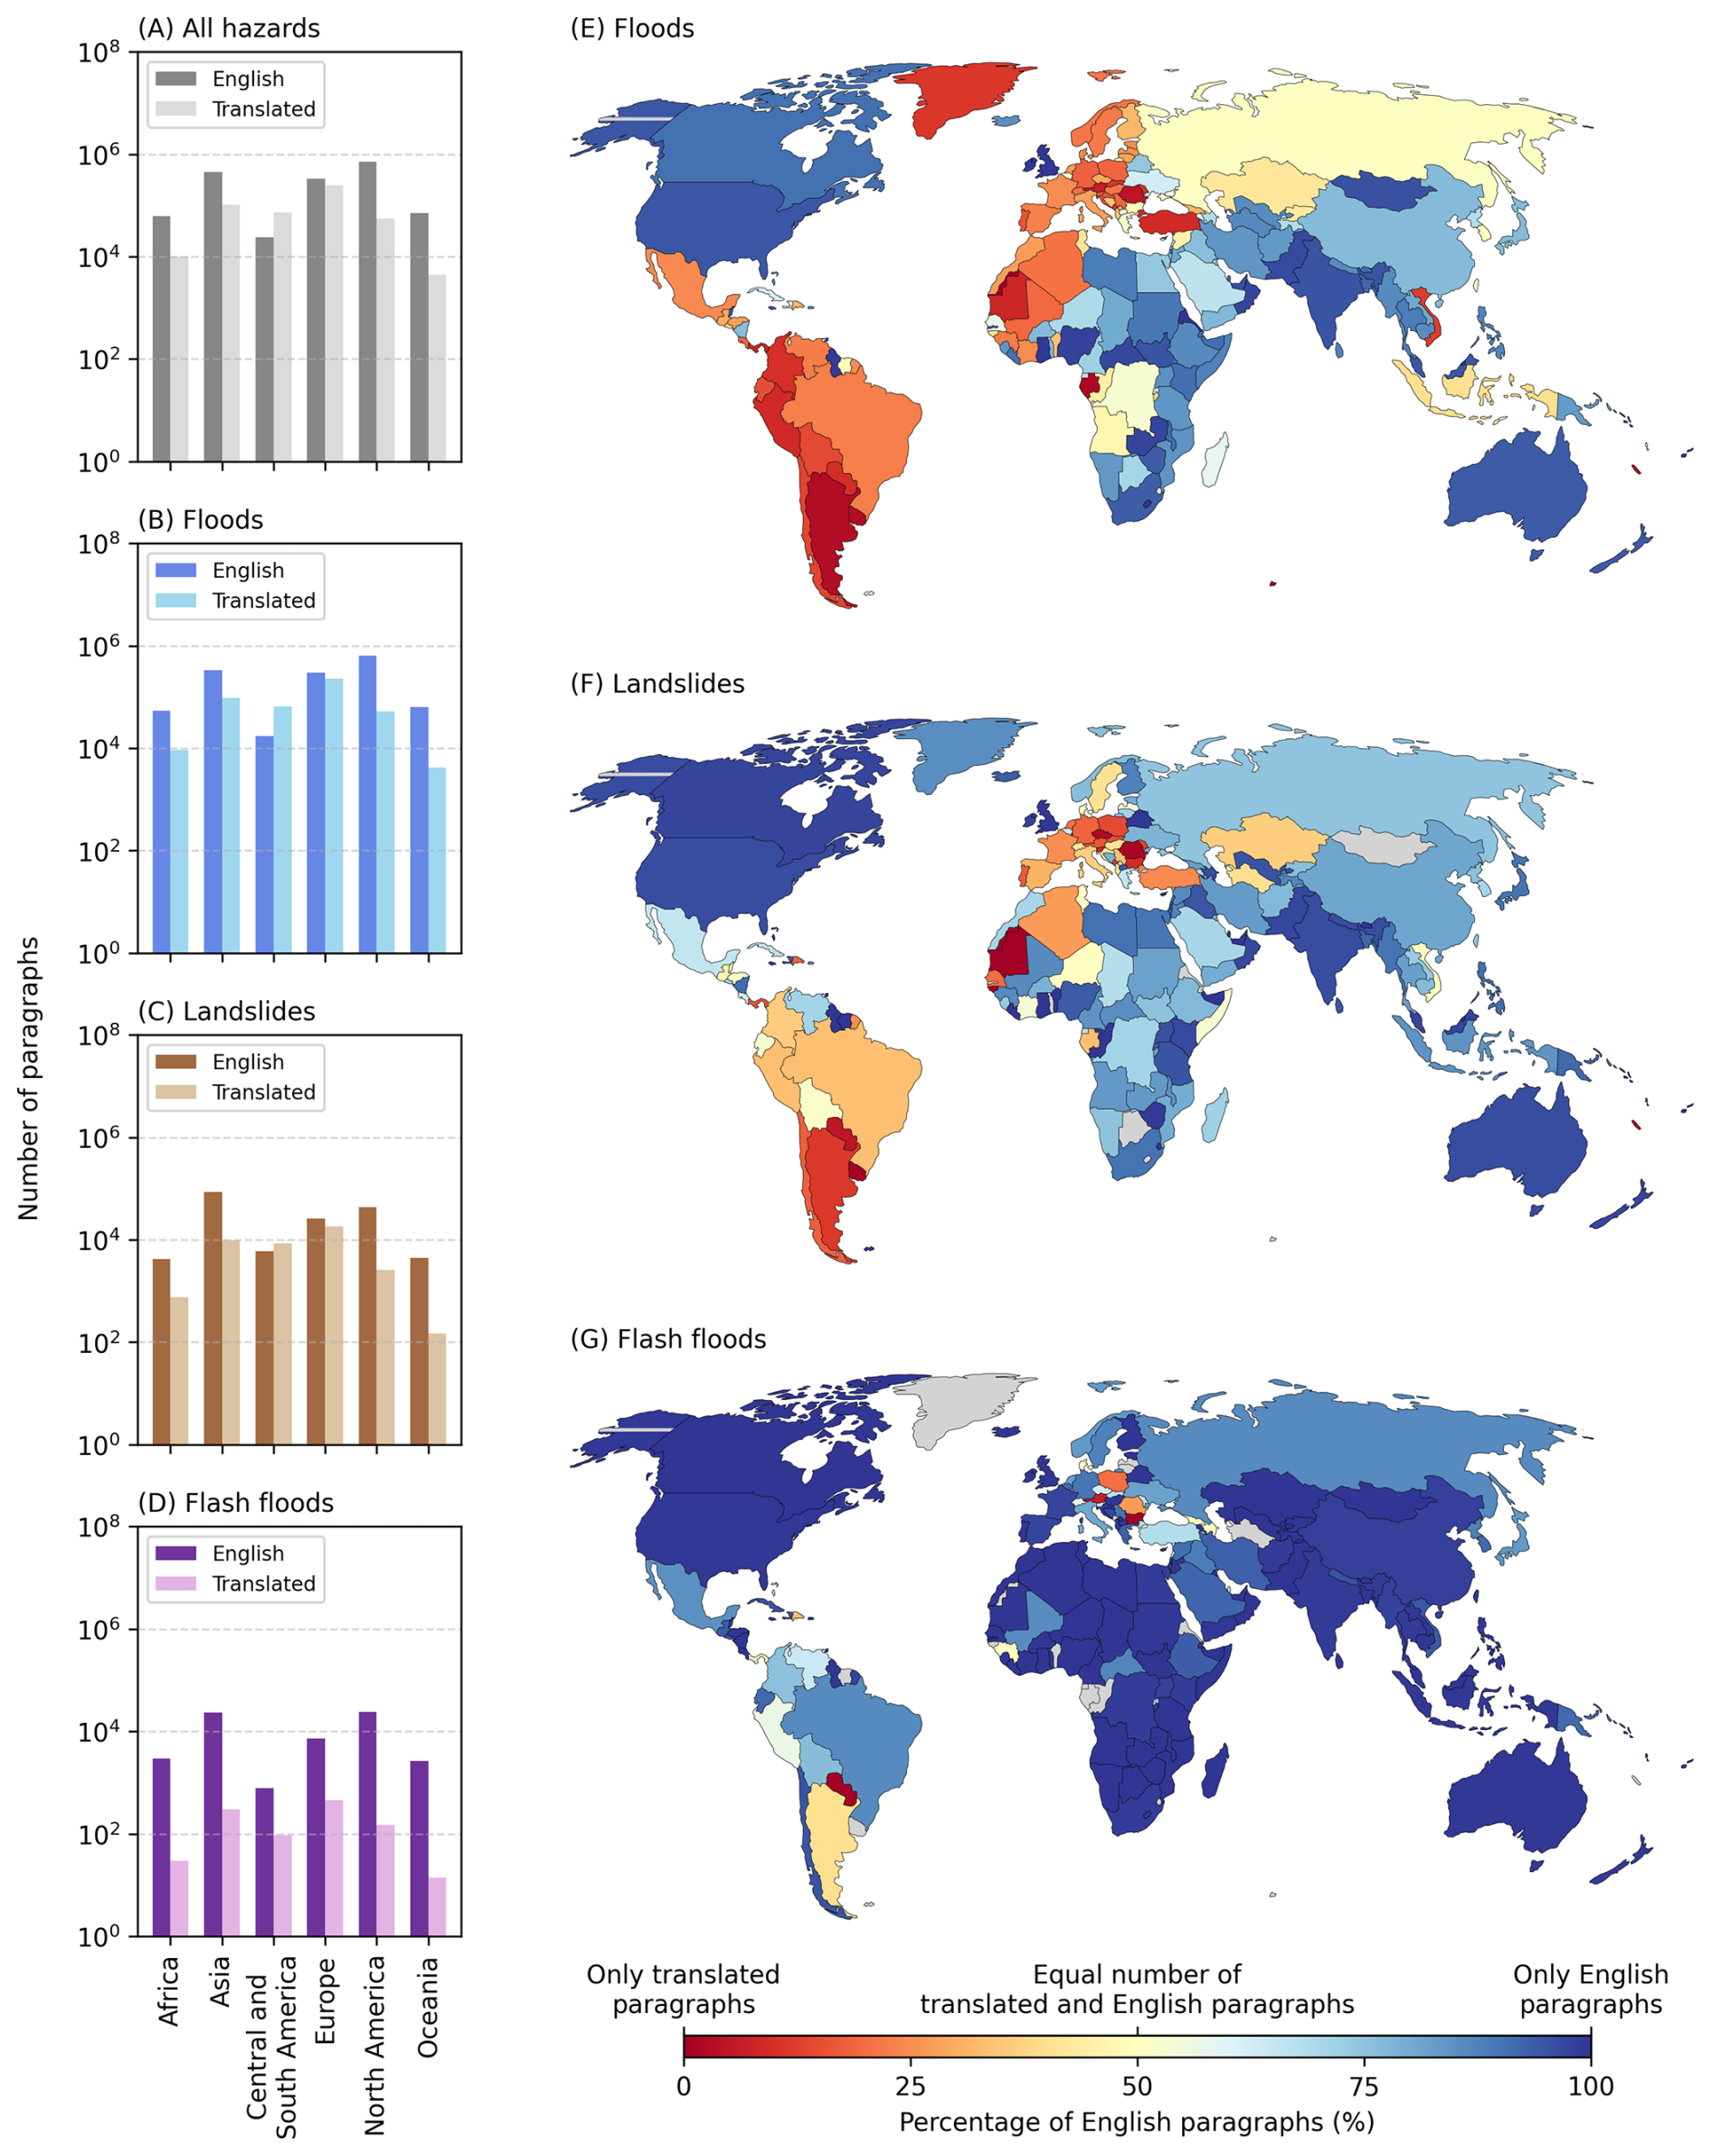
Figure 8Contribution of translated paragraphs to the HazMiner dataset. Plots (A)–(D) show the number of English versus translated paragraphs per continent for (A) all hazards combined, and separately for (B) floods, (C) landslides, and (D) flash floods. Maps (E)–(G) present the percentage of translated versus English paragraphs at the country level for the three hazard types. Grey areas indicate countries without any paragraphs.
The event-level further illustrates how restricting extraction to English sources leads to substantial informational and spatial gaps, as shown by the 14–15 July 2021 flood affecting Germany, Belgium, and the Netherlands (Tradowsky et al., 2023). In Germany and the Netherlands, most paragraphs were non-English (Fig. 9C–E). Languages are regionally bounded, as Dutch paragraphs occur in the Netherlands and German paragraphs in Germany. Furthermore, English text concentrated in certain regions (Fig. 9B), while local language paragraphs (German and Dutch) have a larger spatial distribution. Therefore, focusing only on English text would result in information loss, in the number of paragraphs but also spatially. Yet, English text remains crucial in regions for which text or NLP models in local languages are sparse. For example, Africa contains 110 detected flash flood events despite having only 30 translated flash-flood paragraphs (Fig. 8D), likely because of its large quantity of English paragraphs on flash floods (2976 paragraphs).
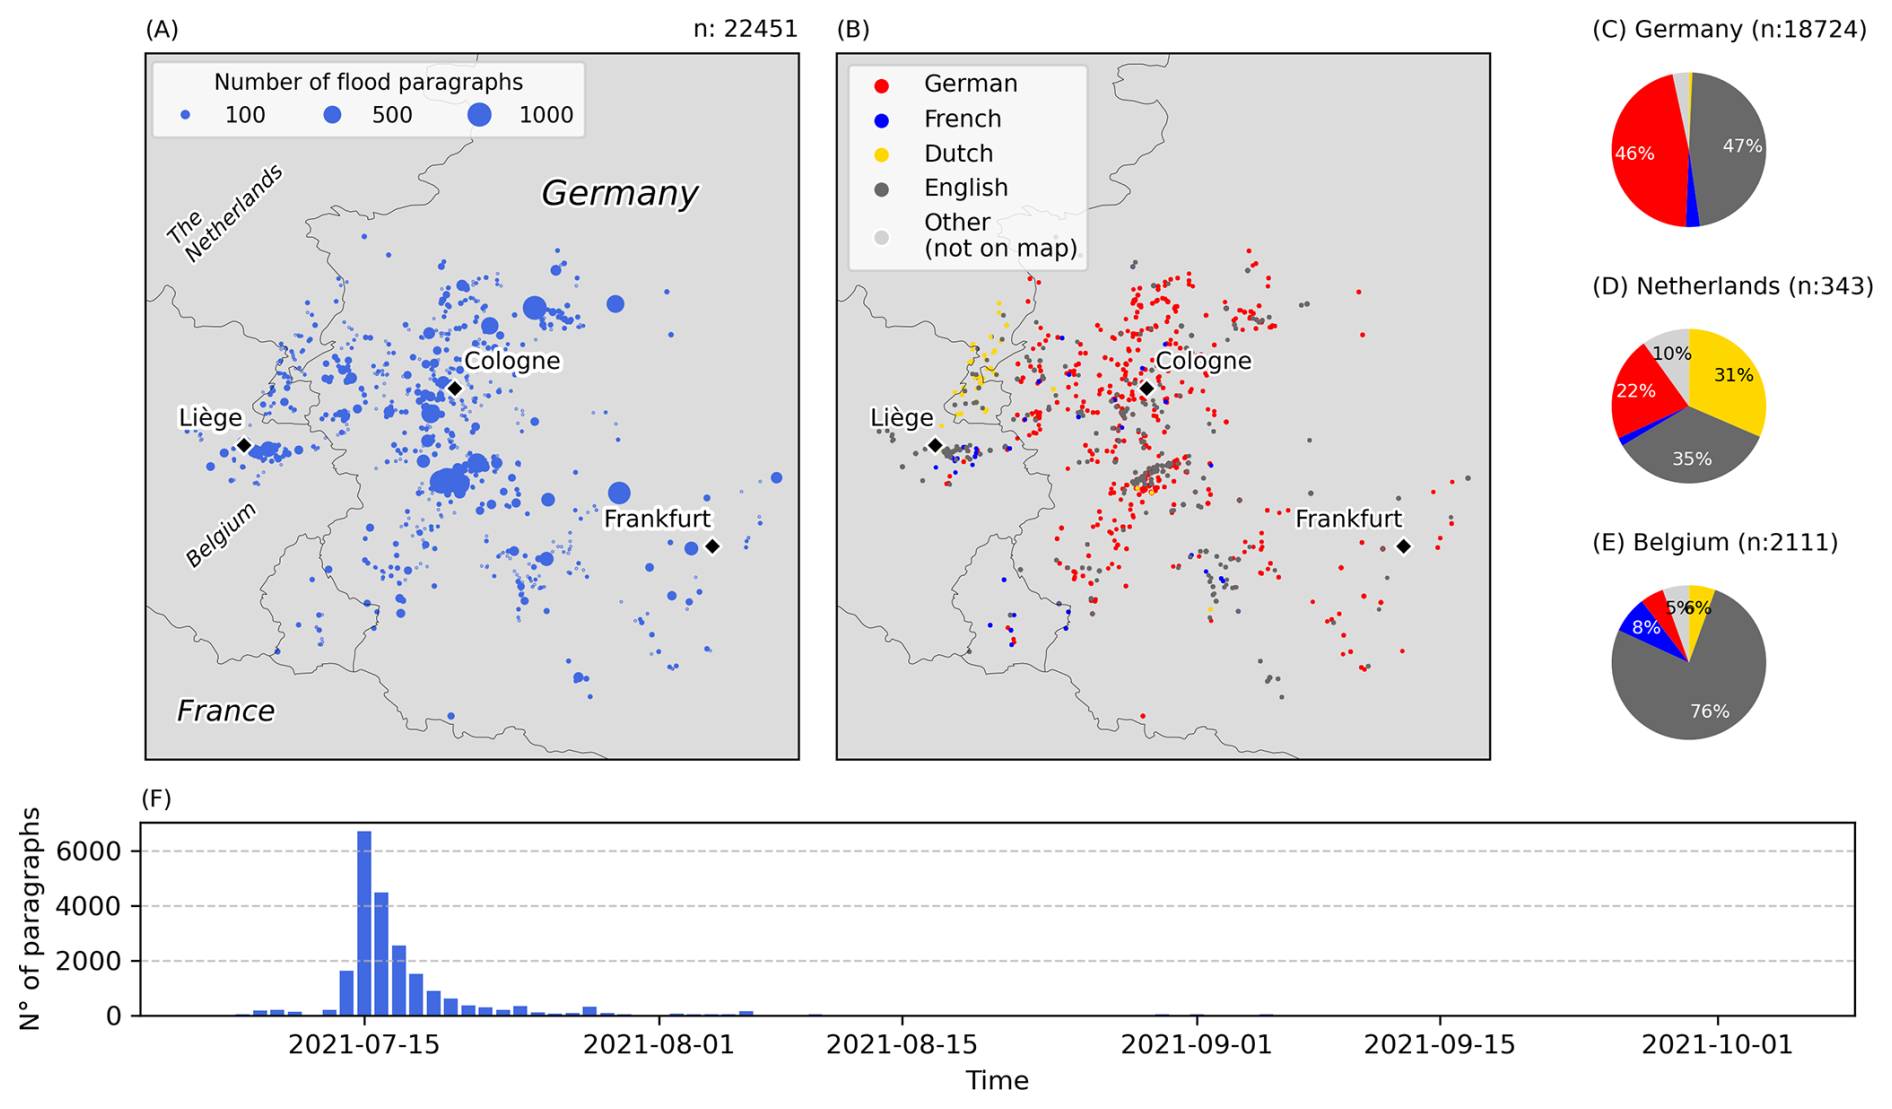
Figure 9Spatiotemporal distribution of paragraphs for one HazMiner flood event in Germany, Belgium and the Netherlands on 14–15 July 2021. Maps (A)–(B) show maps of flood paragraphs with (A) the density of flood paragraphs, and (B) the language distribution. Plots (C)–(E) show the distribution of languages for Germany, the Netherlands and Belgium, respectively. Plot (F) shows a time series of the number of paragraphs at a daily resolution.
Despite the added value of multilingual sources, the translation complicates zero-shot hazard classification, especially for flash floods (Fig. 8G and D). First, translated paragraphs are more often filtered out (72 % reduction) than English ones (54 % reduction), which may underrepresent regions relying on translated data. Second, this underrepresentation depends on the hazard classes. Data on flash floods from translated text is limited (2 %) compared to other hazards (i.e., 19 % for floods and 14 % for landslides).
3.4 Paragraph-based extraction results in detailed regional documentation
Paragraph-based processing of news articles resulted in a new dataset containing information on the occurrence and impact of geo-hydrological hazards at the paragraph level. Focusing on data quantity, the paragraph dataset delivers a more complete documentation compared to traditional datasets. This is illustrated by two hazard-prone regions: the Himalayas and Eastern Africa. For example, EM-DAT requires, among other criteria, that a hazard event results in a minimum of 10 fatalities for it to be included. In the Himalaya, 5 % of all landslide paragraphs – or 62 % of all landslides with fatality information (n=2107) – report at least one death but fewer than 10. In Eastern Africa, flash floods account for the largest share of such cases: 5 % of all flash flood paragraphs, or 52 % of those with fatality information, involve fewer than 10 fatalities.
This increase of information on geo-hydrological hazards is further illustrated by the spatial distribution of paragraphs in these example regions (Fig. 10). In the Himalayas, HazMiner detects 140 734 paragraphs, of which 107 759 describe floods, 24 780 describe landslides, and 8195 describe flash floods. For Eastern Africa, a region that is naturally less prone to geo-hydrological hazards compared to the Himalayas (Stanley and Kirschbaum, 2017): 21 441 paragraphs are detected in total, including 17 305 for floods, 2627 for landslides, and 1509 for flash floods. For both regions, the spatial distributions reflect the underlying geomorphology. Flood-related paragraphs are located along rivers, with an average distance of 13 km in the Himalayas and 3 km in Eastern Africa. Similarly, landslide-related paragraphs are concentrated in susceptible areas: 77 % of Himalayan landslide-related paragraphs and 42 % of those in Eastern Africa fall within zones of moderate to very high landslide susceptibility.
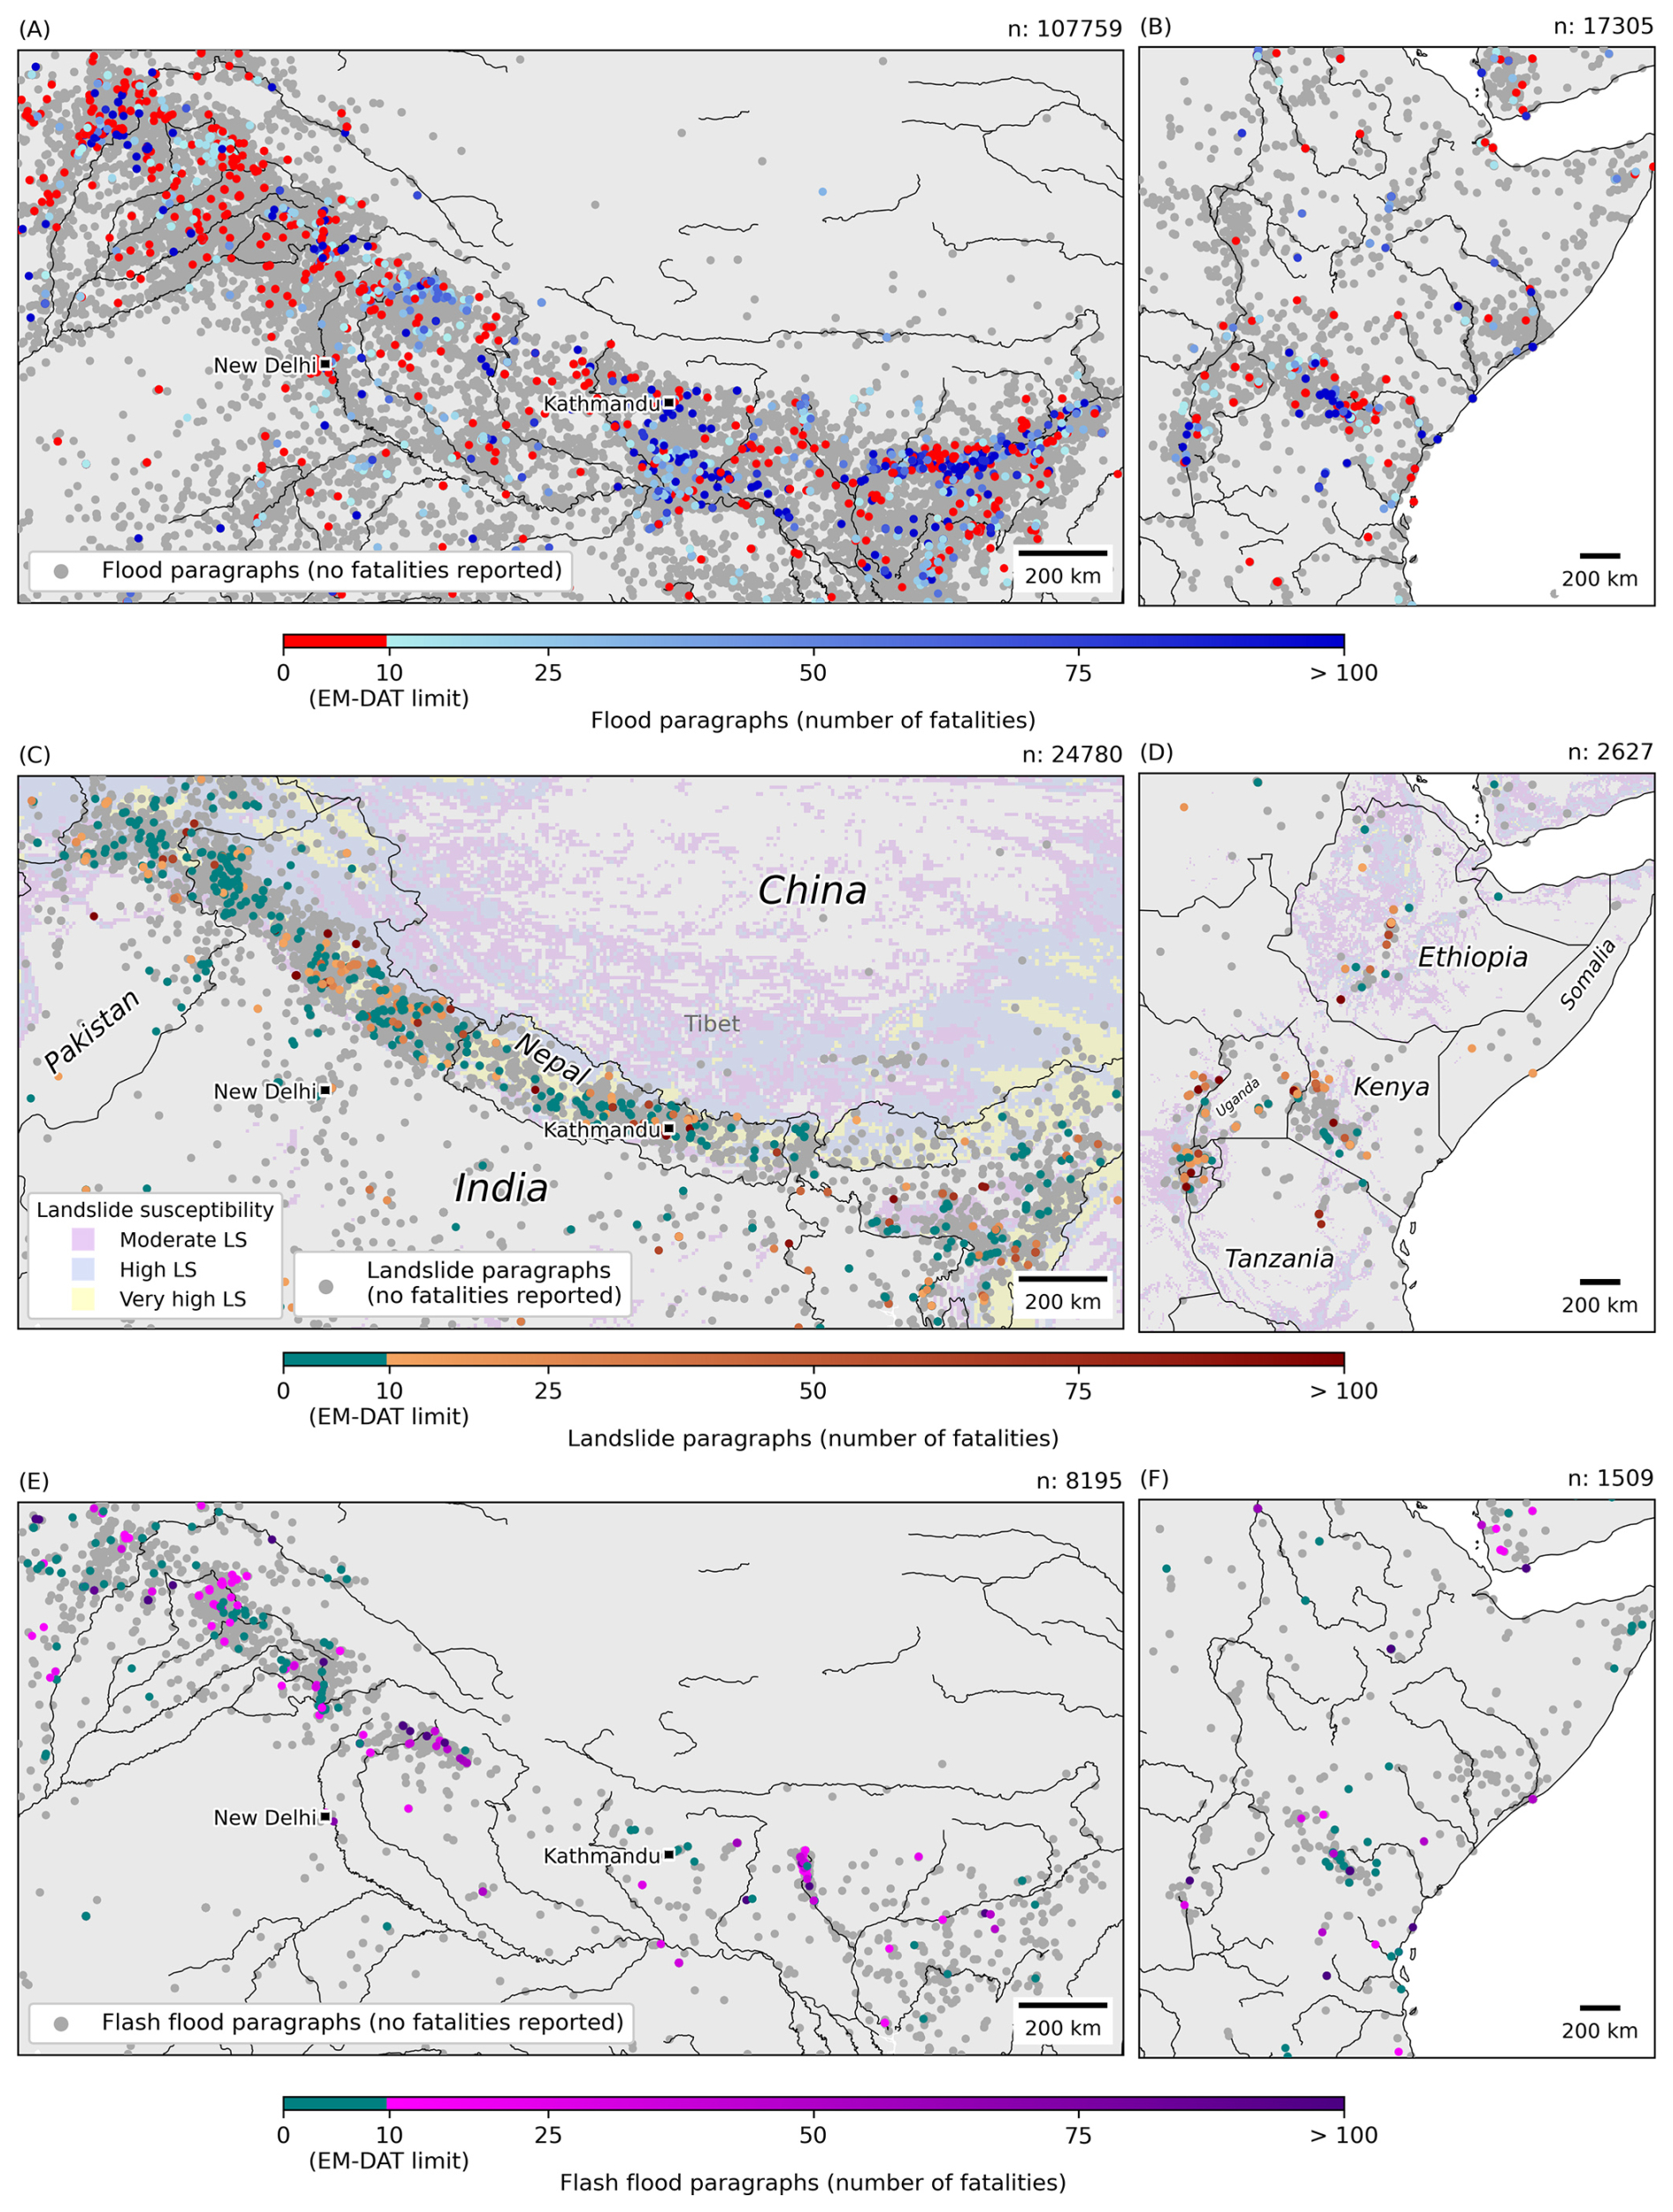
Figure 10Spatial distribution of hazard-related paragraphs in the Himalayas (A, C, E) and Eastern Africa (B, D, F) from 2017 through 2024. Maps (A), (B) show floods, (C), (D) landslides, and (E), (F) flash floods. Paragraphs reporting fewer than 10 fatalities – one of the EM-DAT thresholds for disaster inclusion – are highlighted in red (floods) and green (landslides, flash floods). In maps (A), (B), (E) and (F) black lines represent rivers, while in maps (C), (D) black lines indicate country borders. In (C), (D), the landslide susceptibility values are from Stanley and Kirschbaum (2017).
Furthermore, the paragraph dataset offers new possibilities to study the impact of geo-hydrological hazards, revealing patterns in reported fatalities. For example, in the eastern Himalayas, floods are associated with a higher number of reported fatalities than elsewhere in the region (Fig. 10A).
Despite these consistencies and opportunities, the paragraph dataset contains biases. First, the spatial distribution of landslide-related paragraphs is influenced by country borders. For example, the region of Tibet shows far fewer paragraphs than India or Nepal, although it is landslide-prone, but sparsely populated (Fig. 10C). A similar underrepresentation is observed for Ethiopia compared to neighbouring countries (Fig. 10D).
Lastly, paragraph-based processing provides detailed insights not only at the regional level but also, in some cases, at the level of individual events. For example, for the major flood event of 14–15 July 2021 that occurred at the border between Germany, Belgium and the Netherlands (Tradowsky et al., 2023), HazMiner extracted 22 451 paragraphs (Fig. 9A); illustrating the spatial distribution of the event and which regions are affected. Paragraphs also offer a unique interpretation of temporal evolution of an event, with the highest number of paragraphs being recorded on the day of the flood (Fig. 9F).
The development of HazMiner and the resulting global dataset of geo-hydrological hazard events demonstrate both the potential and the challenges of using text mining for hazard documentation. This new approach focuses on paragraph-based processing in multiple languages.
4.1 New insights into the global distribution of geo-hydrological hazards
HazMiner significantly increases the information available for geo-hydrological hazard documentation. One reason for such a difference between datasets originates from thresholds introduced by methods (Gall et al., 2009). In the case of EM-DAT, the dataset includes disasters with more than 10 fatalities or at least 100 affected people or events with a call for international assistance or an official emergency declaration (Delforge et al., 2025). Our study indicates that these inclusion criteria of EM-DAT result in significant data gaps in low- and lower-middle-income countries. HazMiner records a substantially larger number of less severe events that are absent from EM-DAT (Tables 1) thereby providing a more comprehensive documentation of geo-hydrological hazards in the most vulnerable regions. In high-income countries, HazMiner and EM-DAT have a similar share in events with more than 10 fatalities, one of EM-DAT's inclusion criteria (Table 2); meaning that low-fatality events in high-income countries are also documented in EM-DAT due to the other two thresholds.
The biases are not only in the number of events, but also in their spatiotemporal distributions. For example, the Global Fatal Landslide Database, documenting only fatal landslides (Froude and Petley, 2018), reports fewer events in the UK and North America compared to the HazMiner and GLC datasets, as these regions record fewer fatal landslides. Consequently, impact thresholds influence the interpretation of these datasets. As shown in Sect. 3.4, HazMiner reports fewer deaths per landslide compared with EM-DAT (Gómez et al., 2023). Figure 10 indeed confirms that at the paragraph level, fatality numbers are mostly below the ten-fatality threshold of EM-DAT. Nevertheless, the cumulative impact of these events remains significant (Froude and Petley, 2018) and remains under-estimated in under-documented regions (Kanyiginya et al., 2024).
These findings illustrate the potential of automated text mining algorithms. Compared with EM-DAT, HazMiner extracted significantly more events for all three hazards covered here. Automated text mining in multiple languages increases the number of sources for hazard documentation, reducing their biases. At the regional scale, the potential of text mining for hazard documentation is also important, as studies focusing on regional text often deliver the most detailed information in large quantities (Calvello and Pecoraro, 2018; Domínguez Cuesta et al., 1999; Franceschini et al., 2022; Valenzuela et al., 2017).
4.2 Methodological improvements enhanced geo-hydrological hazard data for low- and lower-middle-income countries
The amount of information extracted in low- and lower-middle-income countries increases when focusing on both national and international sources. Sources of high-income countries publish on hazard events in low- and lower-middle-income countries, especially when there is a special relationship between the reporting and affected countries (Solman and Henderson, 2019) or when there is a significant impact (Fetzer and Garg, 2026). We show here the added value of a global-scale application to increase documentation in countries where information is commonly the most lacking.
In addition to its global application, HazMiner includes three key methodological changes that improved hazard documentation in low- and lower-middle-income countries. First, our results suggest that a multilingual approach can enhance geo-hydrological hazard documentation and help identify hazard information that may be underrepresented in global datasets. This spatial bias especially affects documentation in low- and lower-middle-income countries, where English is not always the main language (Fig. 8). Some regions in these countries have a strong association with one or more languages. Leaving out such languages results in data gaps (Sect. 3.3). Despite this, non-English text still needs to be translated before processing by English fine-tuned NLP models as there are not sufficient fine-tuned multilingual NLP models for hazard specific text mining applications (Ghosh et al., 2022). Furthermore, some languages, such as Swahili, still result in translation errors or have limited support in NLP models (Conneau et al., 2019; Joshi et al., 2020; Robinson et al., 2023). This gap could be addressed by developing more fine-tuned multilingual NLP models or train models only on specific languages.
Second, the paragraph-based processing (Fig. 10) significantly increased the amount of information extracted from news articles, especially for low- and lower-middle-income countries. Nevertheless, there are more paragraphs available per event in high-income countries than in low-income countries (Fig. 7B, D, and F; Sect. 3.3). The density-based clustering analysis in the event creation algorithm mitigated this imbalance in the quantity of news articles. By applying low-threshold criteria for clustering, the method ensured that events with only a few paragraphs were still detected and assigned the same importance as those with more extensive reporting.
Third, an adapted geoparsing algorithm working at the paragraph-level using the full context of the article, with Nominatim for geocoding, likely enhanced the documentation of geo-hydrological hazards. Alternatively, gazetteers are a popular approach for extracting place names (De Bruijn et al., 2019) or geocoding (Battistini et al., 2013; Cervone et al., 2016; Middleton et al., 2014). However, gazetteers are biased and often underrepresent locations in low- and lower-middle-income countries, they are influenced by a country's wealth, Internet access and its policies on open access of national geospatial data (Acheson et al., 2017; Graham and De Sabbata, 2015).
4.3 Methodological limitations of HazMiner
HazMiner has two limitations introduced by the methodology. First, its paragraph-based approach – one of HazMiner's main strengths – introduces a constraint. By treating each paragraph as one standalone unit of information, HazMiner does not share information across multiple paragraphs within the same article. Consequently, paragraphs reporting only timing or impact information without a location are excluded from event creation. Nevertheless, these paragraphs are still processed, and their connection to the full article is maintained through unique identifiers. HazMiner does not use this connection in its event creation algorithm, as sharing information across paragraphs within the same article without an in-depth knowledge of the article's content comes with a risk. Such information sharing would assume that each article describes a single event occurring at a single location, which is often not the case. For example, articles reporting on a storm may include paragraphs mentioning floods on multiple locations with varying impacts. HazMiner's approach of paragraph-based processing extracts the information on floods, i.e., information can be overlooked when processing at the article level. Future research on inter-paragraph relationships is needed to address such overlooked information. Possible solutions could be designing similarity metrics or network-based approaches to model how information is shared across an article.
Second, HazMiner does not currently post-process duplicate reports of the same hazard event across different news sources. Duplicates are especially common at the paragraph level and can result in double-counting of impacts if they are left unfiltered. Methods such as the Jaccard similarity (Vogler et al., 2020) or sentence similarity (Kreuzer and Damm, 2020) could be implemented to detect duplicates of paragraphs and improve impact assessment (Sodoge et al., 2023). Yet, duplicated paragraphs are crucial to HazMiner events as they improve an event's reliability by having multiple sources (De Bruijn et al., 2019). To avoid duplicate events, the HazMiner event creation algorithm ensures that each paragraph is used only once and cannot appear in multiple clusters.
4.4 Biases in the HazMiner dataset originating from using text remain
Text as a source of information remains challenging to process, and biases persist. The HazMiner dataset is affected by five main biases: source, language, systemic, hazard, and translation biases. These five biases affect the spatial distribution of geo-hydrological hazard events. Therefore, users of HazMiner and its dataset should be aware of these biases and interpret the data accordingly. Especially the global application of HazMiner further complicates the source, language, translation, and systemic bias. Many text mining studies for natural hazard documentation avoided these biases by focusing on one event (Li et al., 2021) or by detecting events at the regional to national scale (Avcıoğlu et al., 2025; Domínguez Cuesta et al., 1999; Franceschini et al., 2024; Madruga De Brito et al., 2025a; Sodoge et al., 2023; Valenzuela et al., 2017; Zêzere et al., 2014).
4.4.1 The source bias
The source bias is a result of two elements. First, global news archives, such as GDELT, are known to have inherent limitations. For example, hazard detection with GDELT has a strong spatial bias toward the US (Kwak and An, 2014) (Figs. 7 and A3). Furthermore, they are not exhaustively capturing news articles globally (El Ouadi and Beskow, 2024). Second, specific web domains, even when they are inventoried, might not be reachable due to access restrictions. For example, some websites do not comply with the European GDPR (General Data Protection Regulation), making it impossible to connect from European servers. To reduce the source bias, it is important increase the diversity of sources, preferably in multiple languages, textual and non-textual, such as photographs or videos (De Bruijn et al., 2019; Kanyiginya et al., 2024; Owuor et al., 2020).
4.4.2 The language bias
The language bias originates from (1) the connection between a language and certain regions of the world, (Sect. 4.2) and (2) the complexity and diversity of languages, in particular their vocabulary (Domínguez Cuesta et al., 1999; Ibsen and Brunsden, 1996). For example, flash floods are often generalised as floods by journalists, and the terminology used to describe them can be elaborate, leading to misinterpretation (Hungr et al., 2014) and misclassification by NLP models (Sect. 3.2). Translation additionally complicates terminology, as certain language-specific hazard terminology has no direct translation into English. For example, “flash floods” could be translated into Dutch as “plotselinge overstroming” (Google Translate), which back-translates into “sudden flood”, or the German “Erdrutsch” and “Hangrutsch” both translate to landslide but have a slightly different meaning. Including language-specific terms in the initial set of keywords significantly influences the number of news articles, especially in the case of more local case studies (Kreuzer and Damm, 2020).
4.4.3 The hazard bias
The hazard bias is the imbalance in the documentation between hazards due to the applied methodology, language, or its source. First, certain methodologies tend not to treat each hazard equally. For example, classifying flash floods is complicated when using zero-shot classification, especially for translated text (Sect. 3.3 and Fig. 8G). Second, the above-described language bias results in a hazard bias; the lack of vocabulary in a certain language might underestimate a certain hazard. Third and last, some hazards get reported more in news articles than others (Fetzer and Garg, 2026; Harris and Villeneuve, 2018; Kwak and An, 2014). For example, in the HazMiner dataset, one of the events built from the highest number of paragraphs is the 2018 Krakatau eruption. The eruption triggered several landslides, resulting in a tsunami that caused flooding (Grilli et al., 2019).
4.4.4 The translation bias
The translation bias is methodologically introduced by translating non-English text into English and originates from two elements. First, the performance of translation models varies across languages, influencing the distribution of events for certain regions, particularly non-alphabetic languages (Lai et al., 2025) or African languages (Robinson et al., 2023). For example, Vietnam, which mainly supports Vietnamese – an alphabet-based writing system – for its documentation, contains remarkably more events compared to other Southeast Asian countries (Figs. 7 and 8). Second, translation models can introduce errors (Guerreiro et al., 2023; Ji et al., 2023), adapting important information such as place names and event impacts (Sect. 3.2).
4.4.5 The systemic bias
The systemic bias refers to the influence of society on hazard reporting, i.e., the motivation of a news source to document a geo-hydrological hazard event. There is an imbalance in the reporting of news events between high- and low-income countries (Eisensee and Stromberg, 2007; Porter and Evans, 2020) (Figs. 7B, D, and F, 6 and A3). Newspapers prioritise events that are relatable to their audience, often neglecting certain topics (Joye, 2009; Porter and Evans, 2020; Rodrigo-Ginés et al., 2024; Solman and Henderson, 2019). Additionally, when major global events occur, such as wars (Kwak and An, 2014), hazard events of moderate or minor impact tend to receive less attention in the news (Fetzer and Garg, 2026). Furthermore, newspapers tend to report only hazardous events in populated areas (Domínguez Cuesta et al., 1999; Froude and Petley, 2018), introducing a population bias as they report fewer events in sparsely populated regions, as can be seen for Tibet (Fig. 10C).
4.5 Challenges related to text mining for natural hazard documentation
Beyond the above-mentioned limitations and biases, text mining itself is challenging and requires an in-depth knowledge of the semantics and structure of a language. The evaluation of the HazMiner method revealed that there is room for improvement (Sect. 3.2). In this section, we address challenges that still exist in the text mining field, framed in the context of HazMiner.
4.5.1 A multilingual approach complicates global application
Despite the abovementioned advantages and in addition to the biases it introduces, the multilingual approach complicates text processing due to varying standards across languages. These include different calendar systems and different date and number notations; comma-based, space-based, or point-based. These different annotation styles, often linked to language, are often not processed by translation models. Therefore, they influence information extraction, such as timing and impact (Fig. 5). HazMiner avoids this by limiting impact extraction to real numbers, excluding decimals. Consequently, expanding our Q&A-based extraction to other impacts, such as monetary loss, agricultural impacts, and infrastructure damage, is difficult especially at the global scale.
4.5.2 NLP models still have their limitations
HazMiner mainly relies on NLP models to process and extract information from text, but limitations remain. For example, HazMiner uses zero-shot methods to classify text, which results in misclassifications of complex terminology, such as “mudslides” or “heavy rainfall” in floods, or “thunderstorms” in flash floods (Sect. 2.2). Supervised classification can avoid this behaviour (Franceschini et al., 2024; Li et al., 2021). But this approach is time-consuming, requiring large, labelled datasets for each hazard, and does not allow for a varying set of classes.
Despite these challenges, research in LLMs advances rapidly. Recent developments focus on “chain-of-thought prompting” (Wei et al., 2022a) or tasks based on prompting (Wei et al., 2022b), without the need for fine-tuning (Brown et al., 2020). They have the potential to further improve information extraction, such as the impact of natural hazards (Li et al., 2025). Nevertheless, LLMs threaten the documentation of natural hazards from news articles, as an increasing number of news articles are written by generative AI (Sirén-Heikel et al., 2019), sometimes (purposely) introducing misinformation (Qian et al., 2018).
4.5.3 Geoparsing is challenging for a global application
Challenges related to geoparsing mainly come from (1) locations unrelated to the hazard event and (2) ambiguity in place names. For example, HazMiner extracts and geocodes all place names in the paragraphs, regardless of whether they are linked to the hazard. Fan et al. (2020) used NER to extract locations, but additionally classified the place names to understand their relevance to the information in the text.
HazMiner reduced the influence of ambiguous place names by limiting its search area based on contextual cues in the article. Avcıoğlu et al. (2025) for example, applied a similar method on Turkish news articles, and observed spatial patterns for Turkey comparable to ours, using a different source and a different time. Studies using social media often limit the search area based on the location of the user (Yang et al., 2022). While other studies reported the uncertainty on the location (Calvello and Pecoraro, 2018; Kirschbaum et al., 2015; Valenzuela et al., 2017; Zêzere et al., 2014).
4.5.4 The definition of a hazard event based on text mining data
HazMiner events are detected from a collection of paragraphs in a two-phased clustering approach: first in space and then, in time. Most event detection methods focus on the increased reporting during a hazard event, relying on spatial–temporal thresholds (Cervone et al., 2016), ratios of relevant to non-relevant text (Poblete et al., 2018), time series anomaly detection (Avvenuti et al., 2016; De Bruijn et al., 2019), or graph-based clustering (Fan et al., 2020). But the choice of the event detection method depends on the characteristics of the data and its scale, i.e., global or regional. Threshold-based approaches are not suited for global application, due to uneven media coverage across regions (Eisensee and Stromberg, 2007). Neither does applying a moving window over space or time, as this could generate artificial boundaries. In some cases, temporal anomaly detection may outperform HazMiner's clustering technique. Especially when events follow each other quickly, overlapping media coverage can cause clustering algorithms to merge them into a single event. Anomaly detection could better separate such closely timed events. Nevertheless, anomaly detection requires a baseline, and therefore a large amount of data for a region, limiting its application at the global scale.
4.6 Potential of HazMiner as a versatile method, reshaping text mining for natural hazard documentation
Despite the above-mentioned biases and challenges, HazMiner presents new opportunities for studying natural hazards through automated text mining. HazMiner is designed to be versatile for both the text mining community and for natural hazard research.
HazMiner could be applied to various text sources, such as social media (Li et al., 2021; Wiegmann et al., 2021), scientific literature (Nunes Carvalho et al., 2024; Stein et al., 2024), historical archives (Calcaterra et al., 2003; Ibsen and Brunsden, 1996), Red Cross reports (Madruga De Brito, et al., 2025b), and Wikipedia (Li et al., 2025). As natural language processing is rapidly evolving, the default models in HazMiner could also be interchanged for other more advanced or improved NLP models, if they are provided by the HuggingFace Hub and fine-tuned for the same NLP task. These features make HazMiner a versatile method.
The HazMiner methodology offers the opportunity to rethink some concepts in the text mining community, which could increase transparency and, therefore, the applicability of text mining in natural hazard research. Like remote sensing products, text mining products can be divided into different processing levels. Level 0 would represent the raw data, URLs without any text extracted. Level 1 data contains the extracted articles. Level 2 includes paragraphs with the extracted information: location, timing, and impact. Level 3 is a direct product, resulting from text mining data, in the case of HazMiner: events. Lastly, level 4 combines text mining data with other data sources to generate models, such as susceptibility models. HazMiner and other studies (Battistini et al., 2013; De Bruijn et al., 2019; Fan et al., 2020; Kirschbaum and Stanley, 2018; Kreuzer and Damm, 2020) already, explicitly or implicitly, follow this similar structure. Hazard researchers are generally not trained to process text, as mining text is challenging. Introducing these levels in text mining data reduces these barriers.
Future research should focus on text mining as a complementary and valuable source in natural hazard research. In remote sensing, HazMiner could improve spatiotemporal delineation, as some techniques are limited by clouds or by their return period (Casagli et al., 2023). Compared to field data, whether it comes from monitoring, empirical scientific observations, or even citizen science, text mining techniques such as HazMiner offer a large spatial coverage (Kanyiginya et al., 2024). Li et al. (2021) compares text mining to sensors with an extensive spatial coverage, detecting the spatiotemporal occurrence of a hazard, which can then be explored further using more detailed data collection methods.
Within natural hazard research, HazMiner can document other hazards, such as earthquakes (Li et al., 2021), wildfires (Wang et al., 2016), droughts (Sodoge et al., 2023), and volcanic activity (Harris and Villeneuve, 2018). As HazMiner relies on zero-shot classification, it can classify texts into different natural hazard categories without requiring a fine-tuned NLP model, which would otherwise demand extensive training datasets. Nevertheless, the extracted hazard highly depends on the text source, as it might not be suited for specific hazard types, as can be seen for flash floods detected from news articles (Sect. 3.3).
Over longer periods, combined with other sources, HazMiner can be used to detect global and regional trends, as well as study the evolution of a single hazard event (impact) reporting over time. HazMiner data can also contribute to susceptibility models (Rodrigues et al., 2021; Yagoub et al., 2020), as a detailed inventory is needed to create more accurate regional susceptibility models (Depicker et al., 2020). Lastly, with a more extensive impact detection algorithm and complementary sources, HazMiner can contribute to risk maps.
Current geo-hydrological hazard datasets contain significant data gaps, especially in the most vulnerable regions, resulting in a biased interpretation of their data. As a text mining method, HazMiner introduced key methodological improvements over traditional text mining approaches to effectively reduce these data gaps, particularly in low- and lower-middle-income countries. First, its paragraph-based extraction of information in multiple languages allowed a detailed spatiotemporal documentation of geo-hydrological hazard events from text, resulting in an extensive complementary source of information. Second, location information was used more optimally through an innovative geoparsing algorithm on context-based geocoding using Nominatim. Third, an event creation algorithm gave a more balanced attention to events between low- and lower-middle-income countries and high-income countries, despite them being less documented in news articles. With a global-scale application of HazMiner we increased the amount of information available for geo-hydrological hazard documentation, extracting 24 407 geo-hydrological hazard events worldwide from news articles published between 2017 and 2024 in 58 different languages. The resulting dataset offers avenues for further analyses on geo-hydrological hazard risks, together with potential for awareness and decision-making support, especially in the most vulnerable regions.
As a versatile method, HazMiner could be applied on various text sources or used to document natural hazards other than floods, landslides and flash floods. Future research should focus on the complementarity of text mining with traditional data collection methods, as text mining, especially with the rapid development of LLMs, offers large-scale spatiotemporal coverage and future opportunities to improve hazard inventories, trend analyses, risk and susceptibility modelling alongside remote sensing and field data. Finally, the dataset generated in this specific application of HazMiner provides a more balanced global understanding of hazard occurrence and impacts within a context where the occurrence and intensity of geo-hydrological hazard changes globally.
Table A1Processing steps and the related fine-tuned NLP model (Hugging Face), with its task.
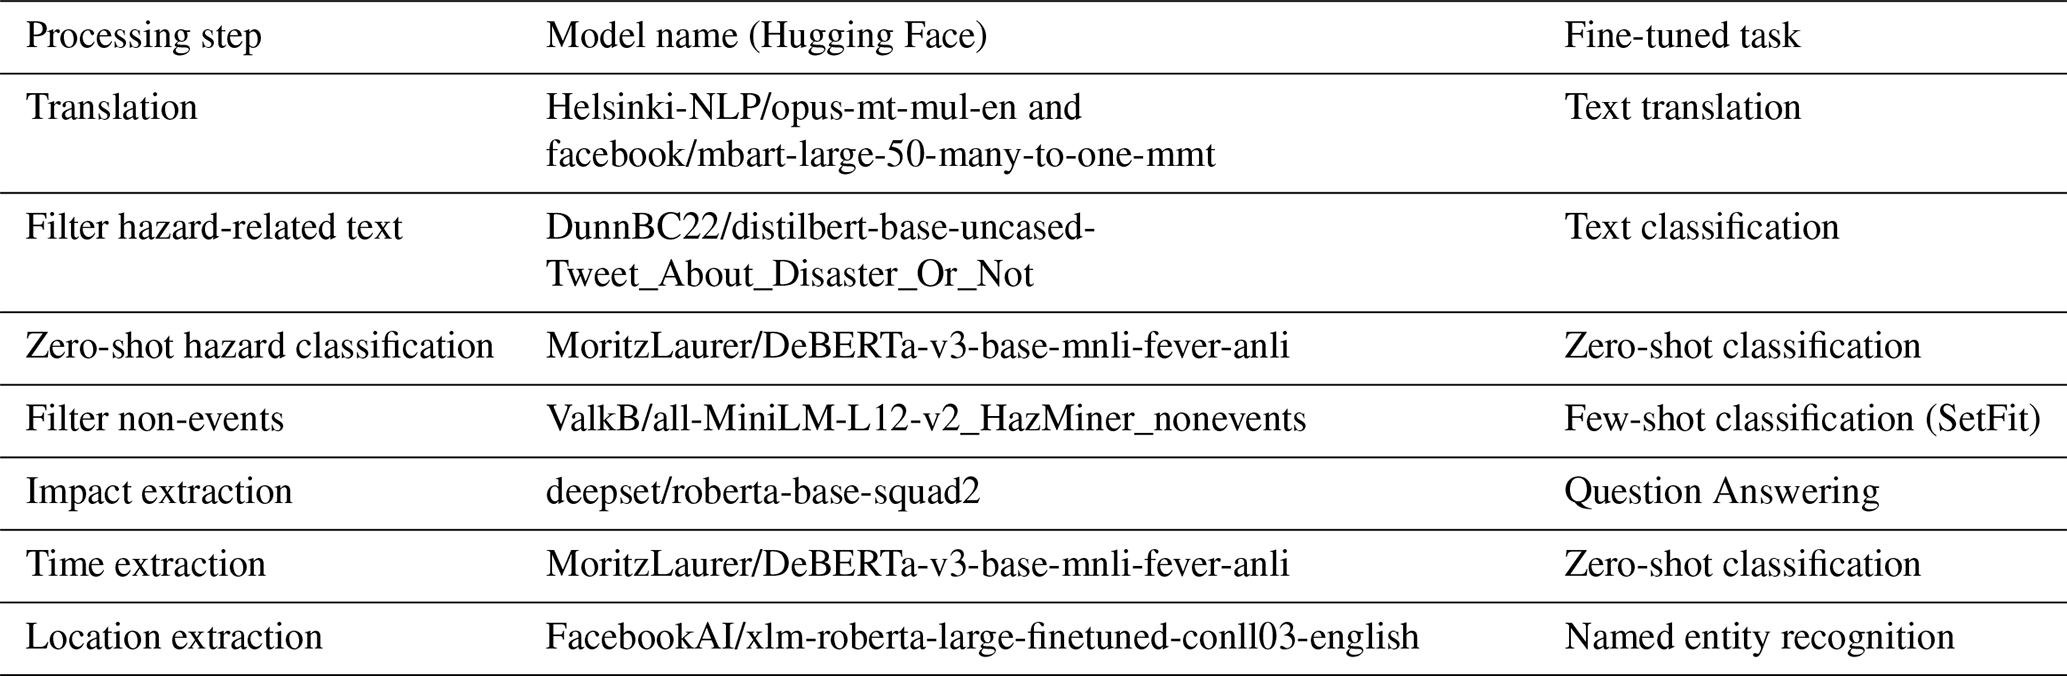
Table A2The different geographical levels with their associated Nominatim rank and their weight in the geoparsing algorithm.
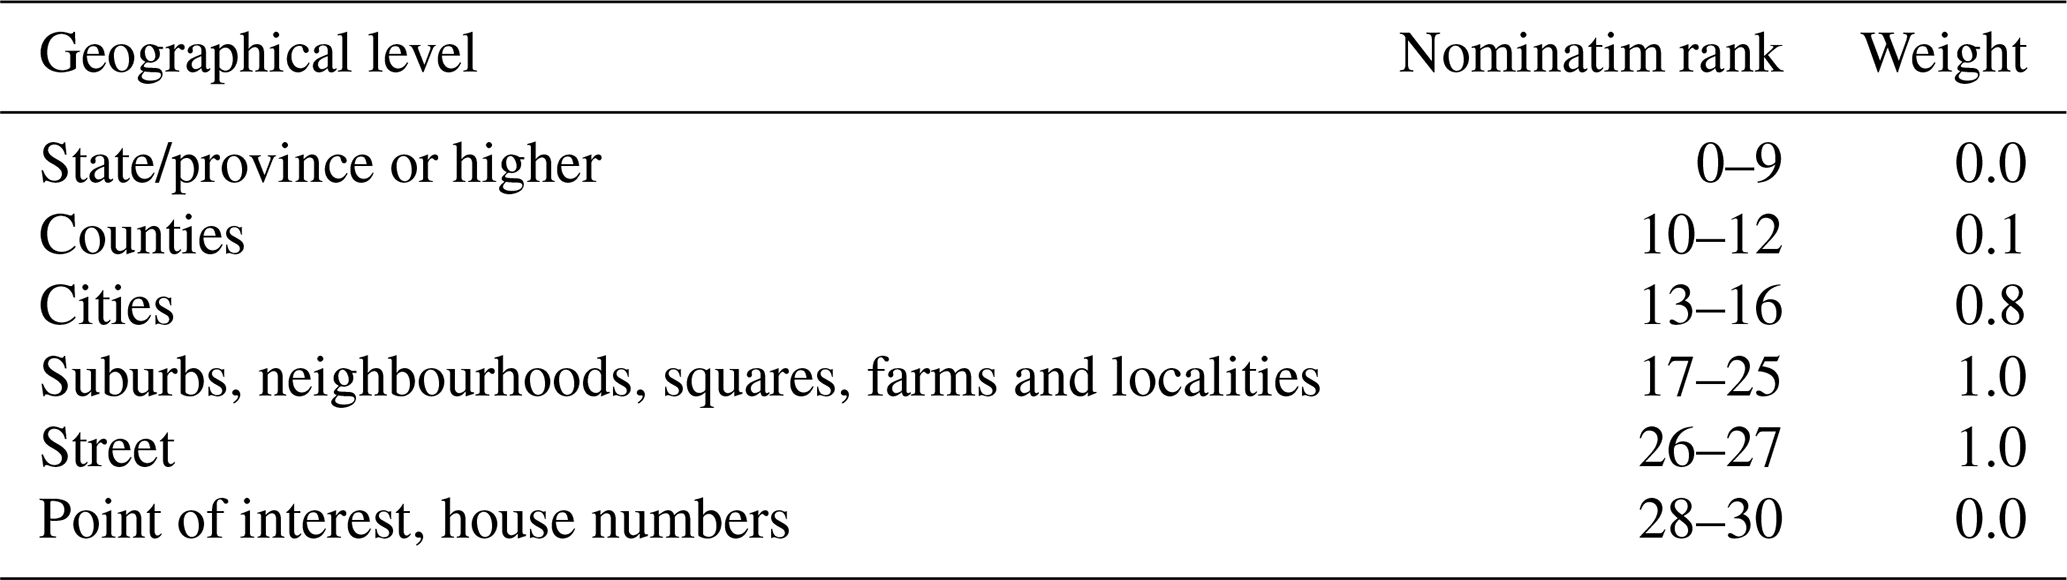
Table A3Questions posed as input to the RoBERTa model for extraction of information on the impact.
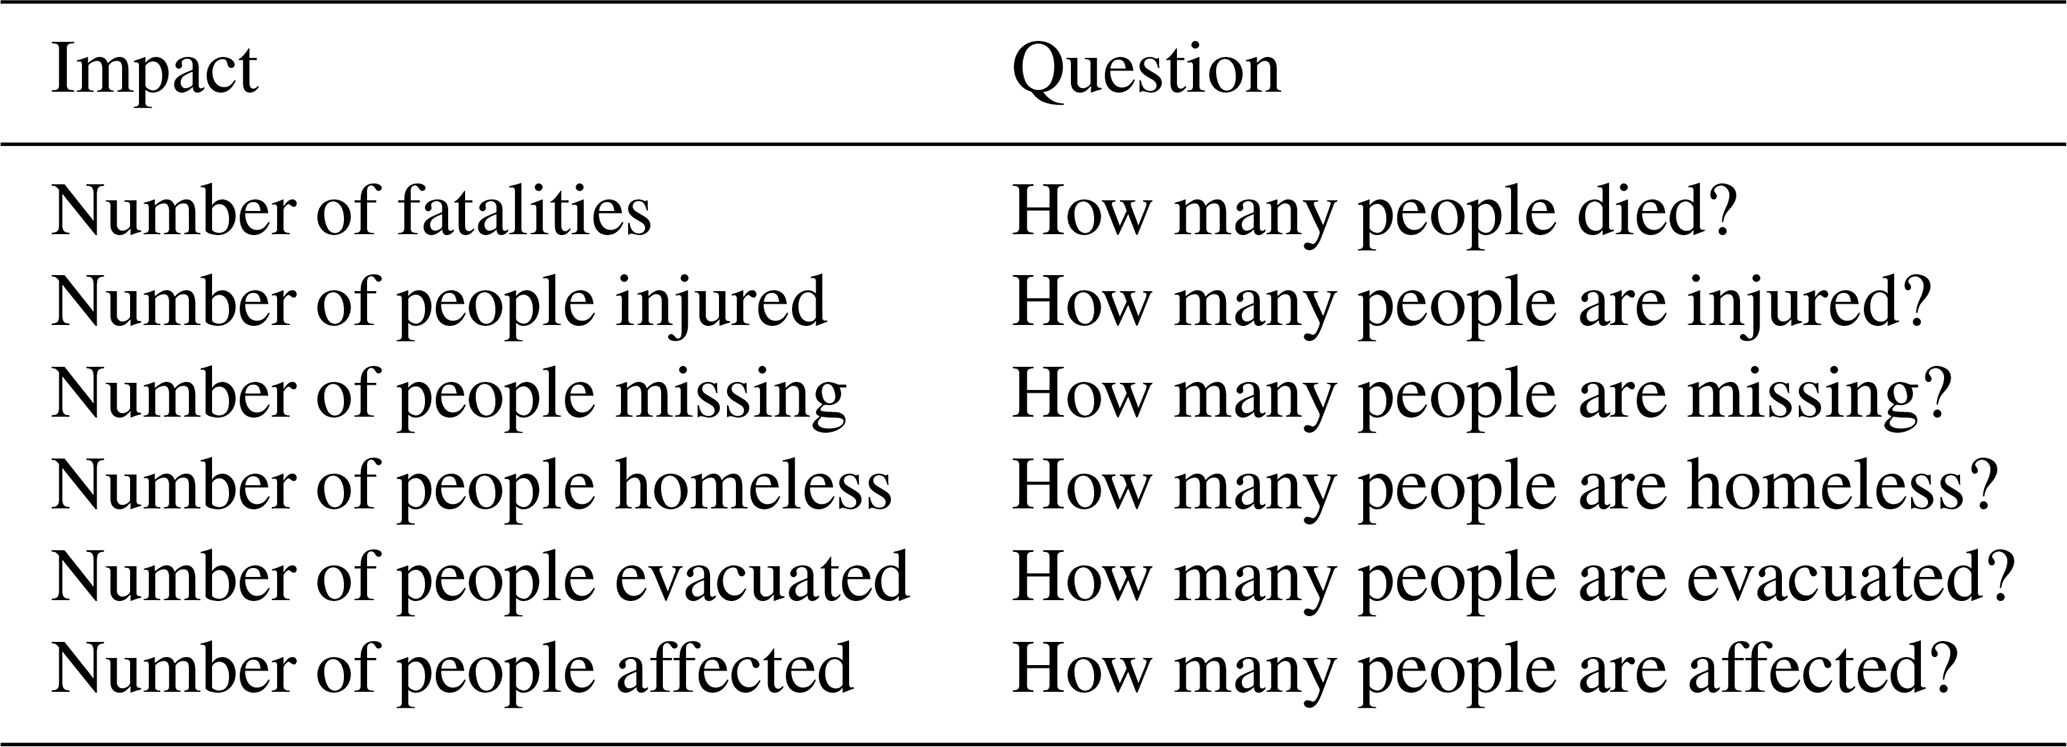
Table A4For each evaluation step an overview of the used dataset for evaluation, its sample size and sample strategy. All datasets were sampled independent of each other.
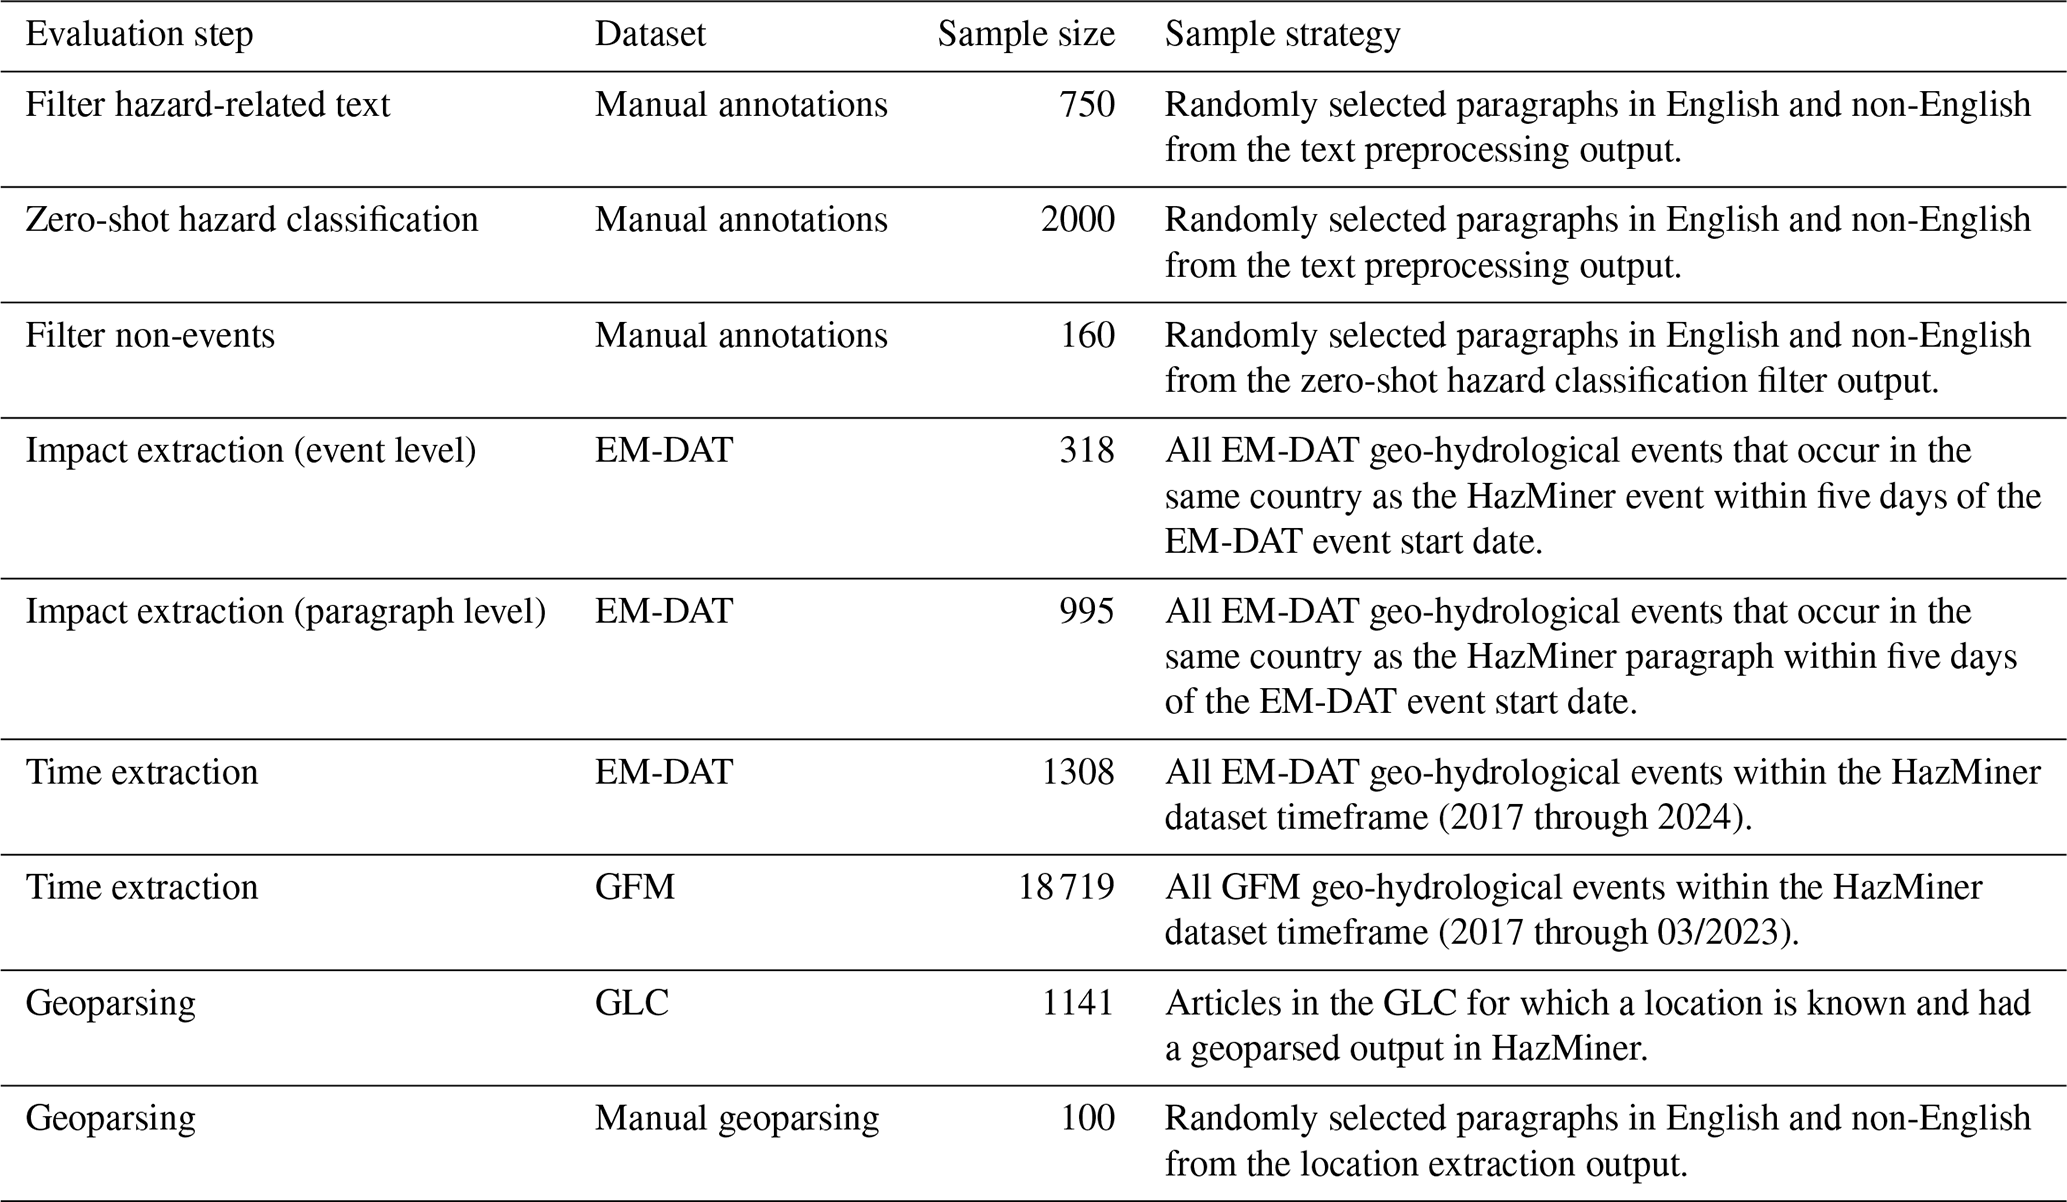
Table A5For each continent and globally the number of evaluated flood, landslide and flash flood events.
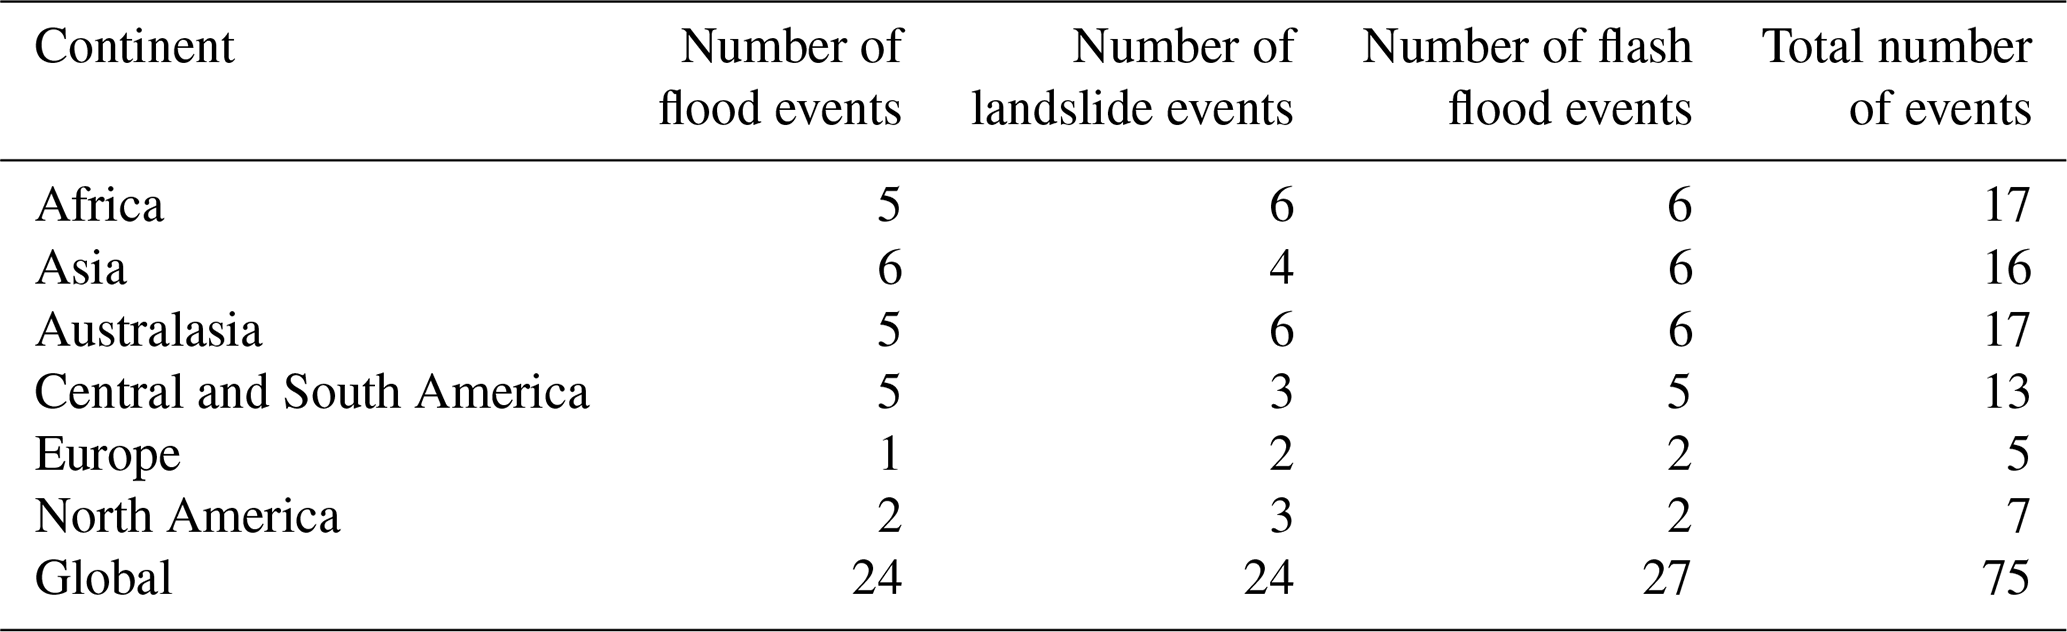
Table A6A list of the language supported in HazMiner (sorted alphabetically), together with the total number of articles extracted from GDELT, and of these the number of articles and paragraphs that are associated with an event. Languages containing zero articles or paragraphs are supported through HazMiner and GDELT but for which no articles were retrieved.
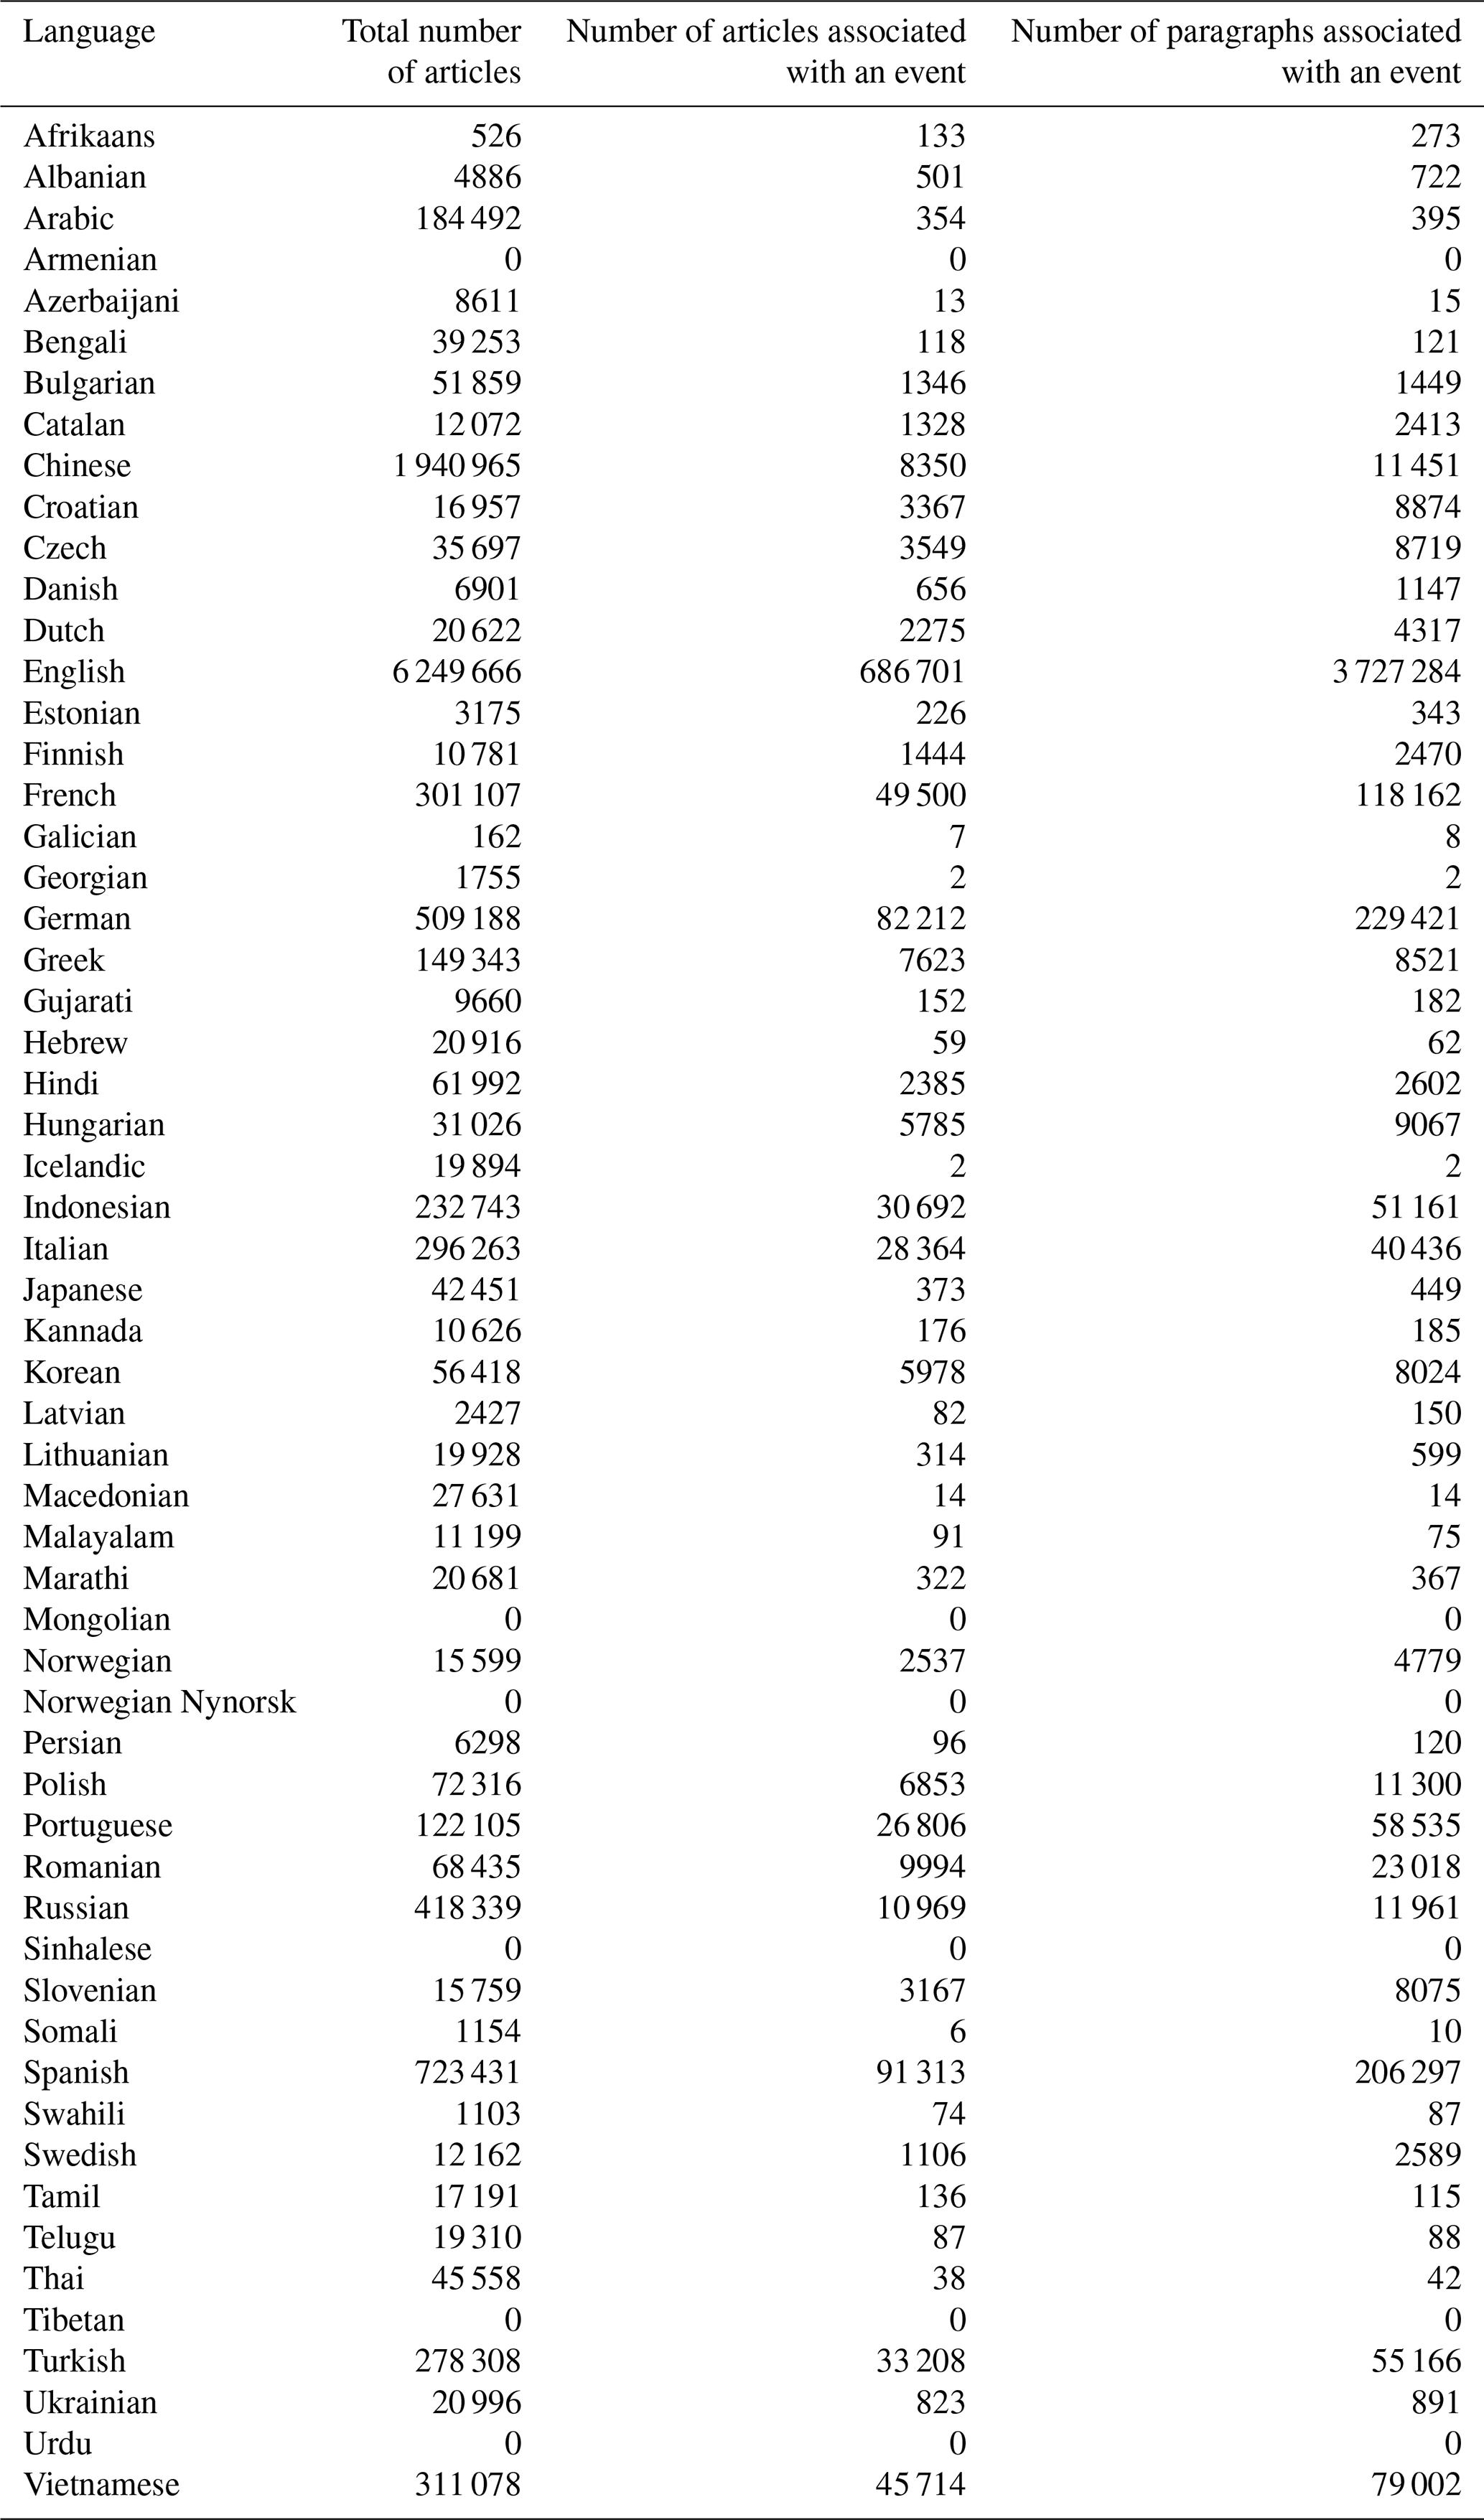
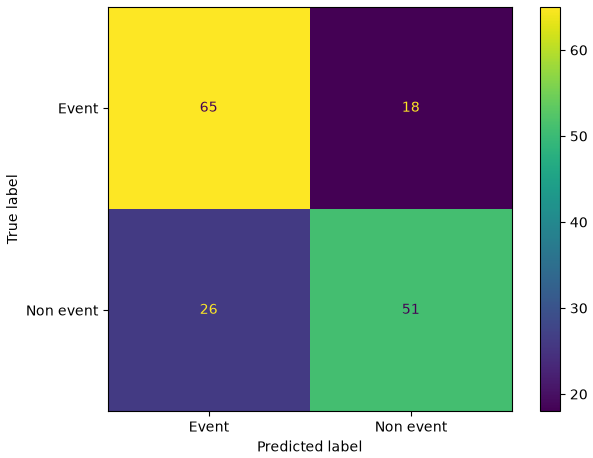
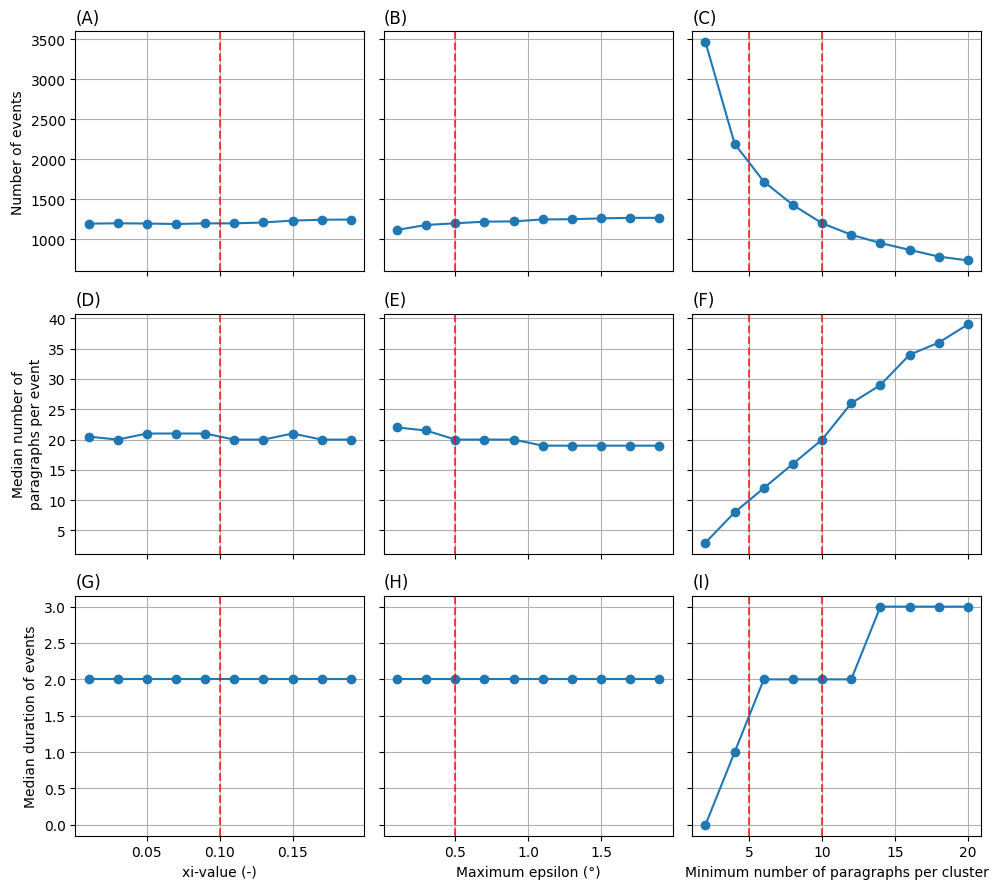
Figure A2The number of events (A–C), the median number of paragraphs per event (D–F) and the median duration of an event (G–I) for the different event-clustering parameters; (A, D, G) xi-value, (B, E, H) the maximum epsilon and (C, F, I) the minimum number of paragraphs per cluster. Red striped lines represent the default settings of HazMiner for each clustering parameter.
Table A7The number of events containing paragraphs with impact information and the number of events for which an impact number was reported in HazMiner for all impact categories.
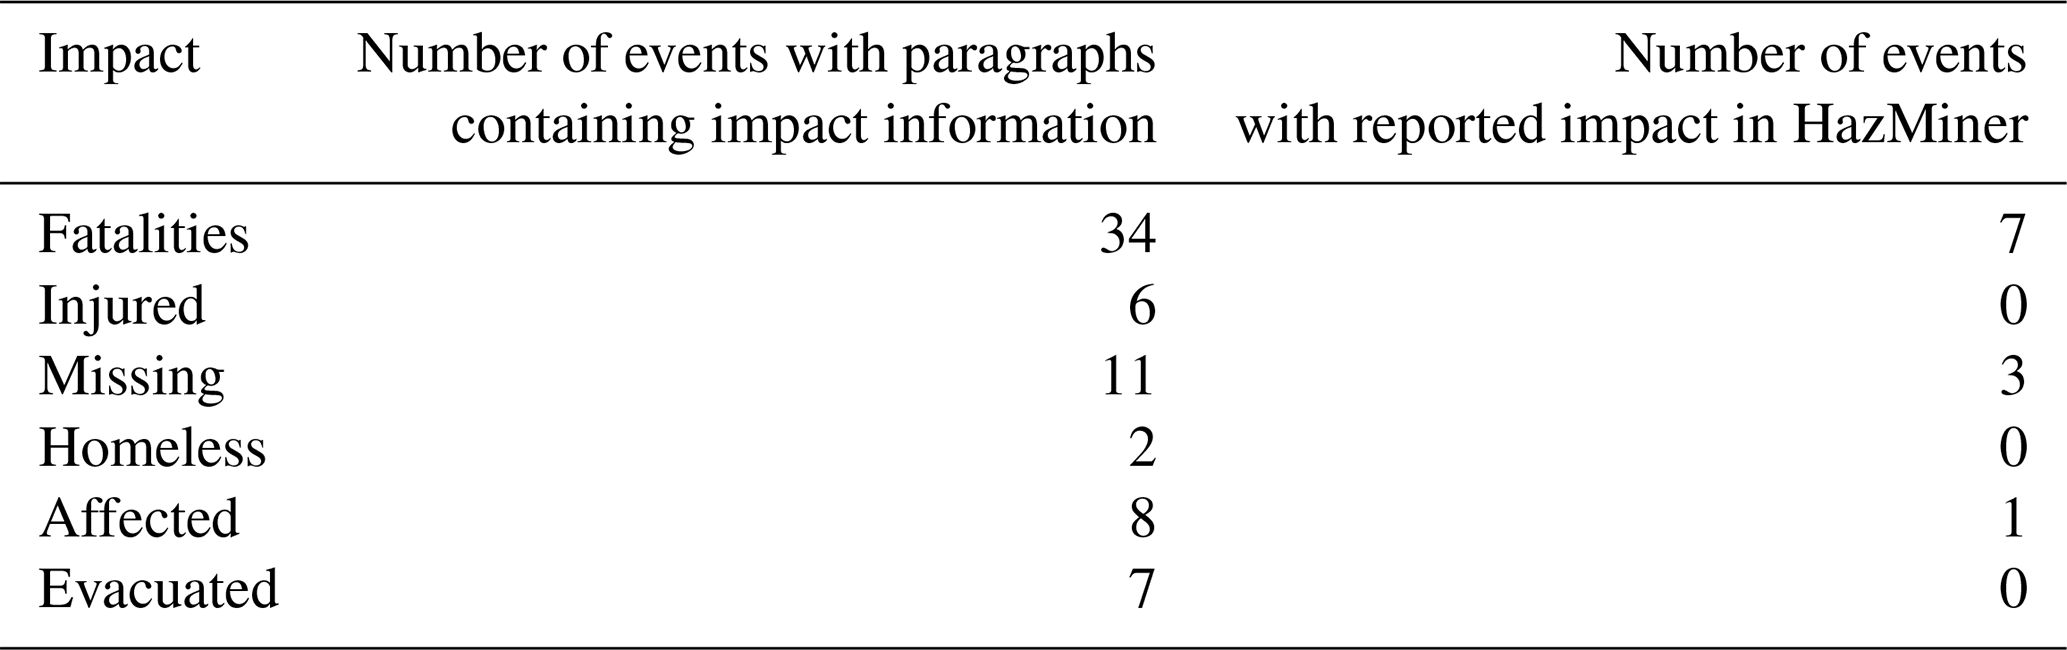
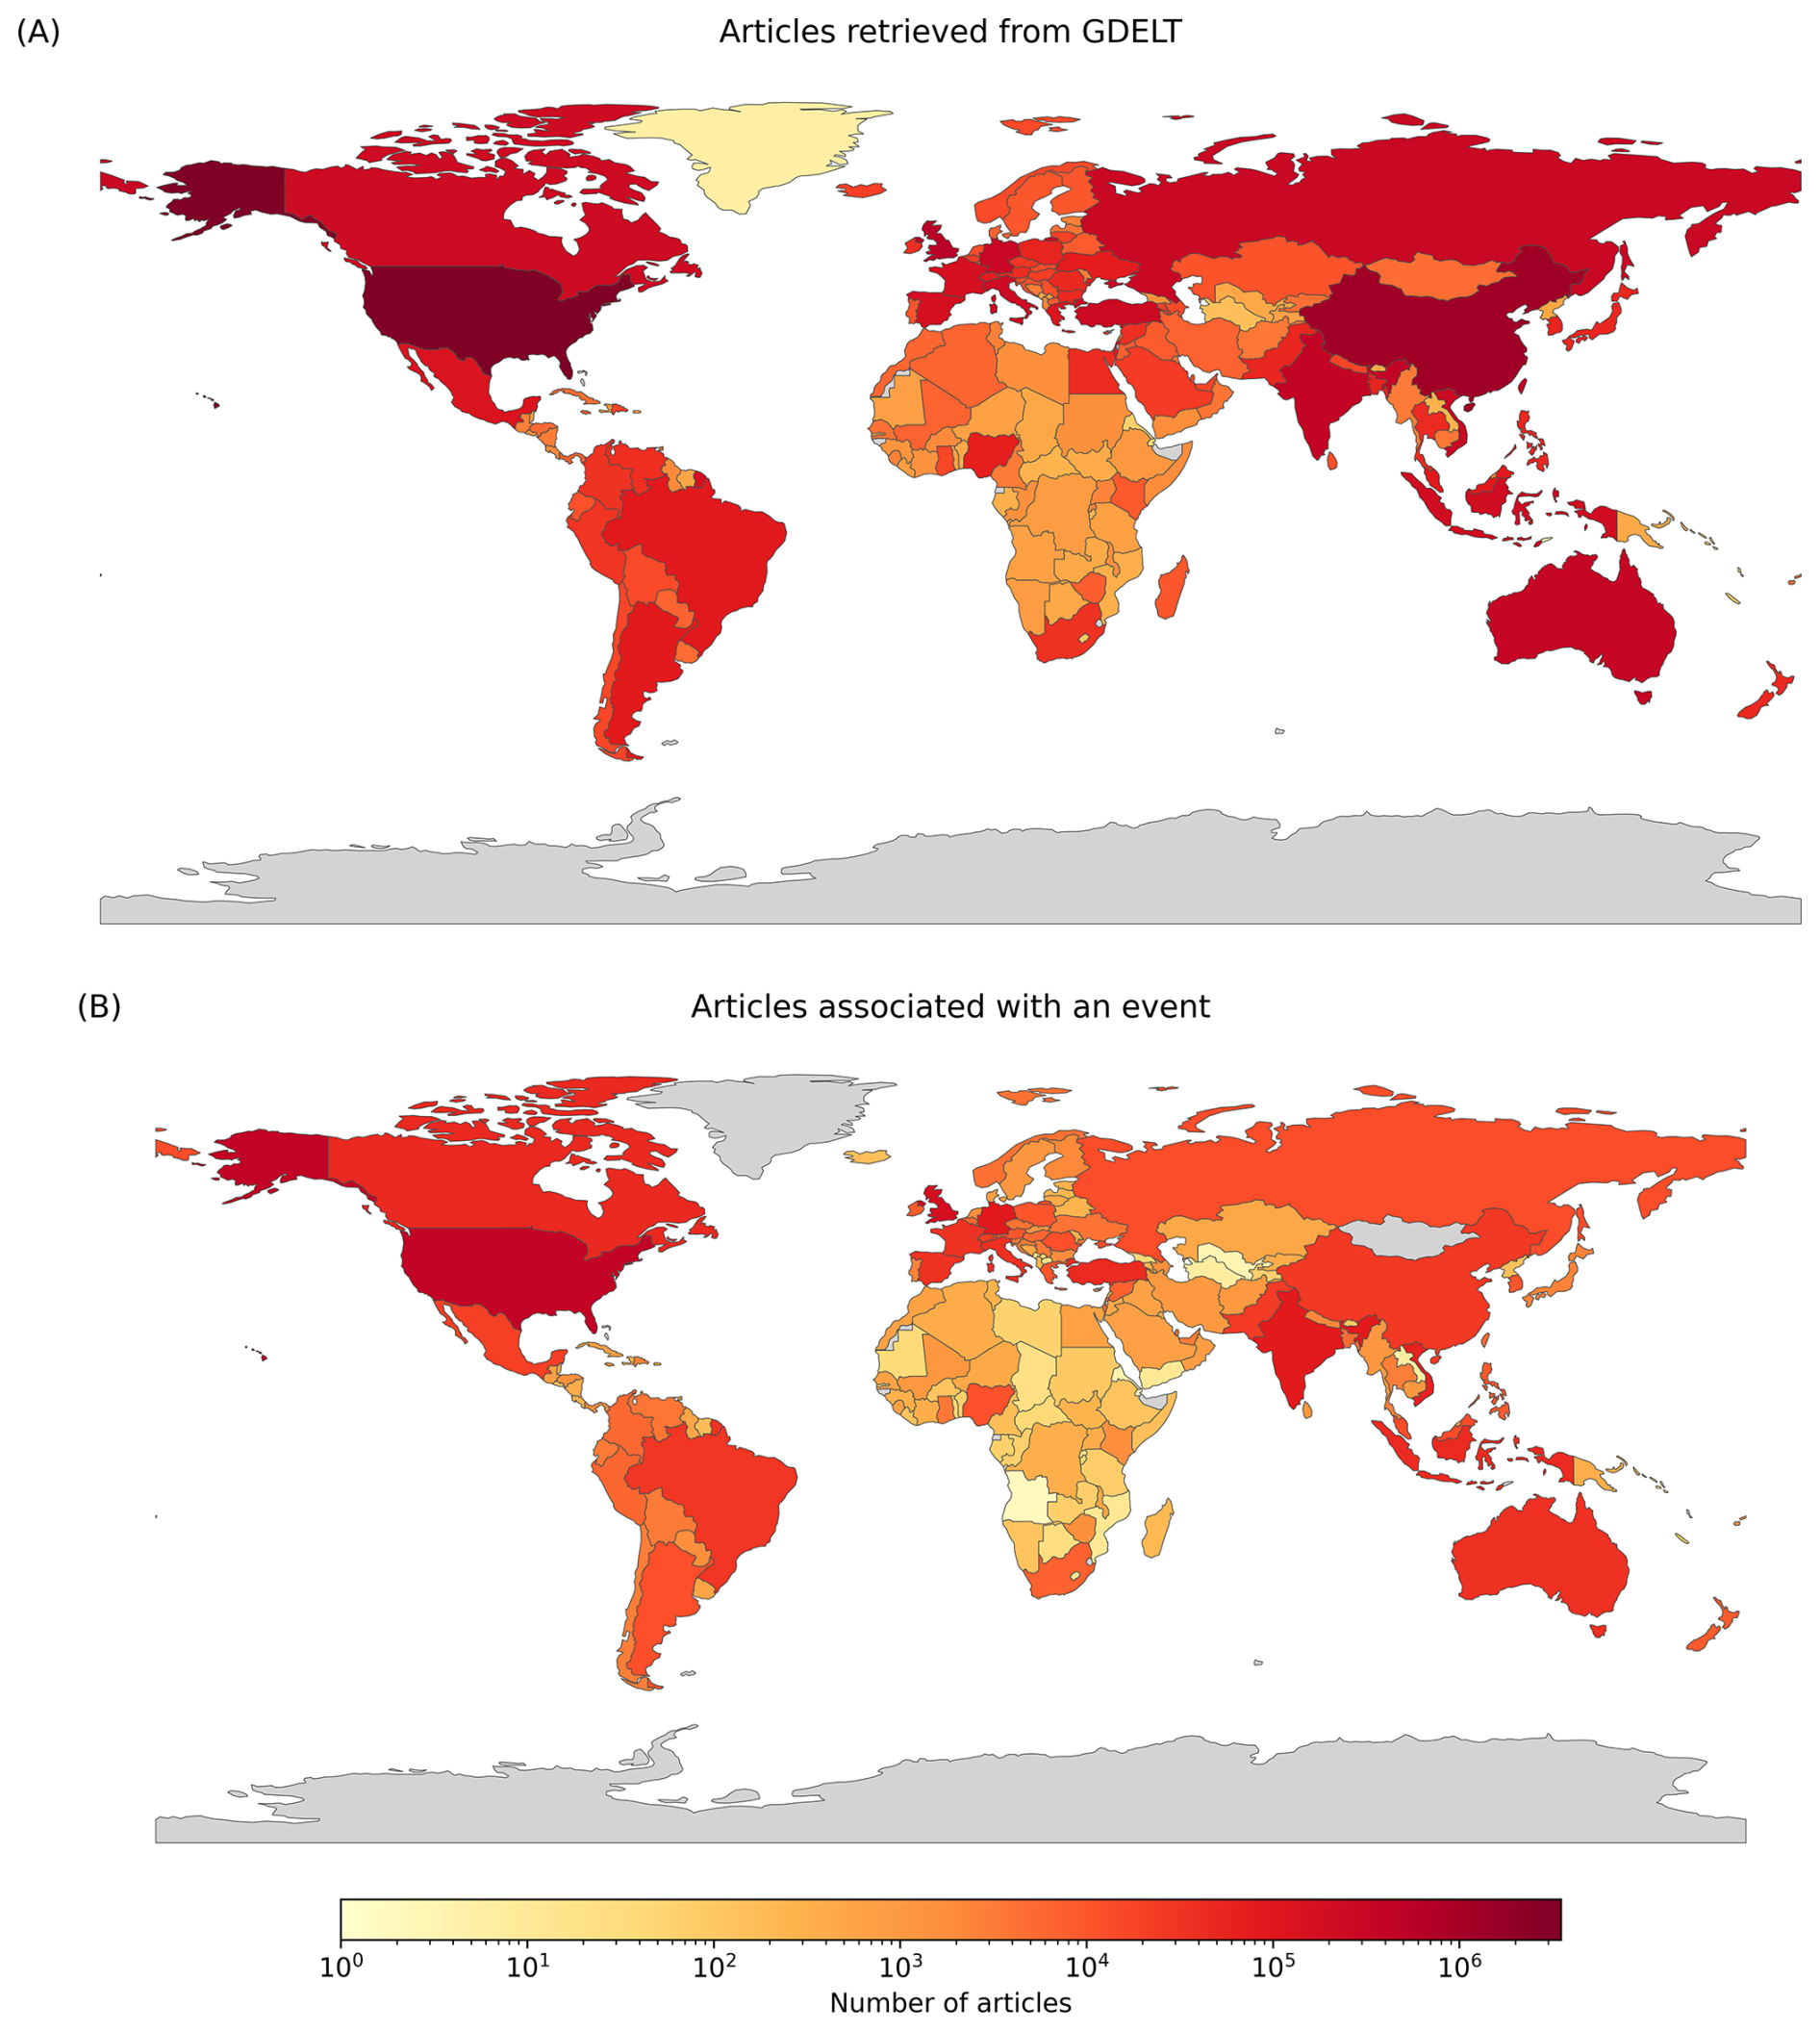
Figure A3The spatial distribution of the number of articles per source country as defined by GDELT for (A) articles extracted from GDELT and (B) articles associated with an event.
The HazMiner dataset can be consulted through Zenodo: https://doi.org/10.5281/zenodo.21965363 (Valkenborg et al., 2026a).
The HazMiner code can be consulted through Zenodo: https://doi.org/10.5281/zenodo.21965339 (Valkenborg et al., 2026b).
The non-event filter model can be consulted through the HuggingFace Hub: https://doi.org/10.57967/HF/9762 (Valkenborg et al., 2026c).
BV developed the methodology and software, carried out the investigation, formal analysis, and data curation, wrote the manuscript (original draft preparation) and created the visualisations. BS and OD contributed to the conceptualization, funding acquisition, supervision, and writing (review and editing) of this publication. IWGKD contributed to the data curation and validation.
At least one of the (co-)authors is a member of the editorial board of Natural Hazards and Earth System Sciences. The peer-review process was guided by an independent editor, and the authors also have no other competing interests to declare.
The HazMiner dataset was created through lawful text and data mining (TDM) in accordance with Article 3 of Directive (EU) 2019/790 on copyright and related rights in the Digital Single Market. All data contained in this dataset are the result of automated extraction and synthesis from lawfully accessible sources, including publicly available news articles indexed in the GDELT dataset. The dataset contains only factual information (e.g., time, location, type of event, reported impacts) and does not reproduce any protected expression or copyrighted content from the original sources.
Publisher's note: Copernicus Publications remains neutral with regard to jurisdictional claims made in the text, published maps, institutional affiliations, or any other geographical representation in this paper. The authors bear the ultimate responsibility for providing appropriate place names. Views expressed in the text are those of the authors and do not necessarily reflect the views of the publisher.
The authors would like to thank Tim Zwiener, who initiated the idea that led to the development of HazMiner and Damien Delforge for his constructive discussions during the development of HazMiner. Lastly, we would like to thank Uğur Öztürk for providing the Turkish translation. Generative AI has been used to improve the writing style of the manuscript and the code.
This research has been developed in the frame of the GuiDANCE project (Belgian Science Policy Office, FED-tWIN Programme, Project Prf-2019-066_GuiDANCE), with the financial support of the Vrije Universiteit Brussel (B. Smets' VUB Starting Bonus), the Royal Museum for Central Africa (internal funds), and the GeoHaTACC project (SCO-France Programme).
This paper was edited by Marleen de Ruiter and reviewed by three anonymous referees.
Acheson, E., De Sabbata, S., and Purves, R. S.: A quantitative analysis of global gazetteers: Patterns of coverage for common feature types, Comput. Environ. Urban, 64, 309–320, https://doi.org/10.1016/j.compenvurbsys.2017.03.007, 2017.
Allcott, H. and Gentzkow, M.: Social Media and Fake News in the 2016 Election, J. Econ. Perspect., 31, 211–236, https://doi.org/10.1257/jep.31.2.211, 2017.
Ankerst, M., Breunig, M. M., Kriegel, H.-P., and Sander, J.: OPTICS: ordering points to identify the clustering structure, SIGMOD Rec., 28, 49–60, https://doi.org/10.1145/304181.304187, 1999.
Avcıoğlu, A., Demir, O., and Görüm, T.: An automated approach for developing geohazard inventories using news: integrating natural language processing (NLP), machine learning, and mapping, Nat. Hazards Earth Syst. Sci., 25, 2421–2435, https://doi.org/10.5194/nhess-25-2421-2025, 2025.
Avvenuti, M., Cimino, M. G. C. A., Cresci, S., Marchetti, A., and Tesconi, M.: A framework for detecting unfolding emergencies using humans as sensors, SpringerPlus, 5, https://doi.org/10.1186/s40064-016-1674-y, 2016.
Bailon, H., Boersma, K., Orellana-Rodriguez, C., and Van Den Homberg, M.: Framing of disaster impact in online news media: a case study from Malawi on flood risk management, Front. Commun., 10, 1519357, https://doi.org/10.3389/fcomm.2025.1519357, 2025.
Battistini, A., Segoni, S., Manzo, G., Catani, F., and Casagli, N.: Web data mining for automatic inventory of geohazards at national scale, Appl. Geogr., 43, 147–158, https://doi.org/10.1016/j.apgeog.2013.06.012, 2013.
Berlemann, M. and Thomas, T.: The distance bias in natural disaster reporting – empirical evidence for the United States, Appl. Econ. Lett., 26, 1026–1032, https://doi.org/10.1080/13504851.2018.1528332, 2019.
Blomeier, E., Schmidt, S., and Resch, B.: Drowning in the Information Flood: Machine-Learning-Based Relevance Classification of Flood-Related Tweets for Disaster Management, Information, 15, 149, https://doi.org/10.3390/info15030149, 2024.
Borga, M., Anagnostou, E. N., Blöschl, G., and Creutin, J.-D.: Flash flood forecasting, warning and risk management: the HYDRATE project, Environ. Sci. Policy, 14, 834–844, https://doi.org/10.1016/j.envsci.2011.05.017, 2011.
Brown, T. B., Mann, B., Ryder, N., Subbiah, M., Kaplan, J., Dhariwal, P., Neelakantan, A., Shyam, P., Sastry, G., Askell, A., Agarwal, S., Herbert-Voss, A., Krueger, G., Henighan, T., Child, R., Ramesh, A., Ziegler, D. M., Wu, J., Winter, C., Hesse, C., Chen, M., Sigler, E., Litwin, M., Gray, S., Chess, B., Clark, J., Berner, C., McCandlish, S., Radford, A., Sutskever, I., and Amodei, D.: Language Models are Few-Shot Learners, arXiv [preprint], https://doi.org/10.48550/arXiv.2005.14165, 2020.
Burrows, K., Walters, R. J., Milledge, D., Spaans, K., and Densmore, A. L.: A New Method for Large-Scale Landslide Classification from Satellite Radar, Remote Sens.-Basel, 11, 237, https://doi.org/10.3390/rs11030237, 2019.
Calcaterra, D., Parise, M., and Palma, B.: Combining historical and geological data for the assessment of the landslide hazard: a case study from Campania, Italy, Nat. Hazards Earth Syst. Sci., 3, 3–16, https://doi.org/10.5194/nhess-3-3-2003, 2003.
Calvello, M. and Pecoraro, G.: FraneItalia: a catalog of recent Italian landslides, Geoenviron. Disasters, 5, 13, https://doi.org/10.1186/s40677-018-0105-5, 2018.
Casagli, N., Intrieri, E., Tofani, V., Gigli, G., and Raspini, F.: Landslide detection, monitoring and prediction with remote-sensing techniques, Nat. Rev. Earth Environ., 4, 51–64, https://doi.org/10.1038/s43017-022-00373-x, 2023.
Cervone, G., Sava, E., Huang, Q., Schnebele, E., Harrison, J., and Waters, N.: Using Twitter for tasking remote-sensing data collection and damage assessment: 2013 Boulder flood case study, Int. J. Remote Sens., 37, 100–124, https://doi.org/10.1080/01431161.2015.1117684, 2016.
Chan, B., Möler, T., Pietsch, M., and Soni, T.: deepset/roberta-base-squad2, https://huggingface.co/deepset/roberta-base-squad2 (last access: 22 May 2025), 2020.
Conneau, A., Khandelwal, K., Goyal, N., Chaudhary, V., Wenzek, G., Guzmán, F., Grave, E., Ott, M., Zettlemoyer, L., and Stoyanov, V.: Unsupervised Cross-lingual Representation Learning at Scale, arXiv [preprint], https://doi.org/10.48550/arXiv.1911.02116, 2019.
De Bruijn, J. A., De Moel, H., Jongman, B., De Ruiter, M. C., Wagemaker, J., and Aerts, J. C. J. H.: A global database of historic and real-time flood events based on social media, Sci. Data, 6, 311, https://doi.org/10.1038/s41597-019-0326-9, 2019.
Deijns, A. A. J., Dewitte, O., Thiery, W., d'Oreye, N., Malet, J.-P., and Kervyn, F.: Timing landslide and flash flood events from SAR satellite: a regionally applicable methodology illustrated in African cloud-covered tropical environments, Nat. Hazards Earth Syst. Sci., 22, 3679–3700, https://doi.org/10.5194/nhess-22-3679-2022, 2022.
Deijns, A. A. J., Michéa, D., Déprez, A., Malet, J.-P., Kervyn, F., Thiery, W., and Dewitte, O.: A semi-supervised multi-temporal landslide and flash flood event detection methodology for unexplored regions using massive satellite image time series, ISPRS J. Photogramm., 215, 400–418, https://doi.org/10.1016/j.isprsjprs.2024.07.010, 2024.
Delforge, D., Wathelet, V., Below, R., Sofia, C. L., Tonnelier, M., Van Loenhout, J. A. F., and Speybroeck, N.: EM-DAT: the Emergency Events Database, Int. J. Disast. Risk Re., 124, 105509, https://doi.org/10.1016/j.ijdrr.2025.105509, 2025.
Depicker, A., Jacobs, L., Delvaux, D., Havenith, H.-B., Maki Mateso, J.-C., Govers, G., and Dewitte, O.: The added value of a regional landslide susceptibility assessment: The western branch of the East African Rift, Geomorphology, 353, 106886, https://doi.org/10.1016/j.geomorph.2019.106886, 2020.
Depicker, A., Jacobs, L., Mboga, N., Smets, B., Van Rompaey, A., Lennert, M., Wolff, E., Kervyn, F., Michellier, C., Dewitte, O., and Govers, G.: Historical dynamics of landslide risk from population and forest-cover changes in the Kivu Rift, Nat. Sustain., 4, 965–974, https://doi.org/10.1038/s41893-021-00757-9, 2021a.
Depicker, A., Govers, G., Jacobs, L., Campforts, B., Uwihirwe, J., and Dewitte, O.: Interactions between deforestation, landscape rejuvenation, and shallow landslides in the North Tanganyika–Kivu rift region, Africa, Earth Surf. Dynam., 9, 445–462, https://doi.org/10.5194/esurf-9-445-2021, 2021b.
Devlin, J., Chang, M.-W., Lee, K., and Toutanova, K.: BERT: Pre-training of Deep Bidirectional Transformers for Language Understanding, arXiv [preprint], https://doi.org/10.48550/arXiv.1810.04805, 2019.
Devoli, G., Morales, A., and Høeg, K.: Historical landslides in Nicaragua – collection and analysis of data, Landslides, 4, 5–18, https://doi.org/10.1007/s10346-006-0048-x, 2007.
Domínguez Cuesta, M. J., Jiménez Sánchez, M., and Rodríguez García, A.: Press archives as temporal records of landslides in the North of Spain: relationships between rainfall and instability slope events, Geomorphology, 30, 125–132, https://doi.org/10.1016/S0169-555X(99)00049-5, 1999.
Eisensee, T. and Stromberg, D.: News Droughts, News Floods, and U. S. Disaster Relief, Q. J. Econ., 122, 693–728, https://doi.org/10.1162/qjec.122.2.693, 2007.
El Ouadi, A. and Beskow, D.: Comparison of Common Crawl News & GDELT, in: 2024 IEEE International Systems Conference (SysCon), 2024 IEEE International Systems Conference (SysCon), 1–3, https://doi.org/10.1109/SysCon61195.2024.10553540, 2024.
Emberson, R., Kirschbaum, D., and Stanley, T.: New global characterisation of landslide exposure, Nat. Hazards Earth Syst. Sci., 20, 3413–3424, https://doi.org/10.5194/nhess-20-3413-2020, 2020.
Ester, M., Kriegel, H.-P., Sander, J., and Xu, X.: A density-based algorithm for discovering clusters in large spatial databases with noise, in: Proceedings of the Second International Conference on Knowledge Discovery and Data Mining, Portland, Oregon, 226–231, 1996.
European Commission. Joint Research Centre.: GHSL data package 2023, Publications Office, LU, https://doi.org/10.2760/098587, 2023.
Fan, C., Wu, F., and Mostafavi, A.: A Hybrid Machine Learning Pipeline for Automated Mapping of Events and Locations From Social Media in Disasters, IEEE Access, 8, 10478–10490, https://doi.org/10.1109/ACCESS.2020.2965550, 2020.
Ferrer, J. V., Samprogna Mohor, G., Dewitte, O., Pánek, T., Reyes-Carmona, C., Handwerger, A. L., Hürlimann, M., Köhler, L., Teshebaeva, K., Thieken, A. H., Tsou, C., Urgilez Vinueza, A., Demurtas, V., Zhang, Y., Zhao, C., Marwan, N., Kurths, J., and Korup, O.: Human Settlement Pressure Drives Slow-Moving Landslide Exposure, Earth's Future, 12, e2024EF004830, https://doi.org/10.1029/2024EF004830, 2024.
Fetzer, T. and Garg, P.: Uneven patterns of cross-border media coverage following natural disasters, Nat. Hum. Behav., https://doi.org/10.1038/s41562-026-02512-6, 2026.
Franceschini, R., Rosi, A., Catani, F., and Casagli, N.: Exploring a landslide inventory created by automated web data mining: the case of Italy, Landslides, 19, 841–853, https://doi.org/10.1007/s10346-021-01799-y, 2022.
Franceschini, R., Rosi, A., Catani, F., and Casagli, N.: Detecting information from Twitter on landslide hazards in Italy using deep learning models, Geoenviron. Disasters, 11, 22, https://doi.org/10.1186/s40677-024-00279-4, 2024.
Froude, M. J. and Petley, D. N.: Global fatal landslide occurrence from 2004 to 2016, Nat. Hazards Earth Syst. Sci., 18, 2161–2181, https://doi.org/10.5194/nhess-18-2161-2018, 2018.
Fu, S., Lyu, H., Wang, Z., Hao, X., and Zhang, C.: Extracting historical flood locations from news media data by the named entity recognition (NER) model to assess urban flood susceptibility, J. Hydrol., 612, 128312, https://doi.org/10.1016/j.jhydrol.2022.128312, 2022.
Gall, M., Borden, K. A., and Cutter, S. L.: When Do Losses Count?: Six Fallacies of Natural Hazards Loss Data, B. Am. Meteorol. Soc., 90, 799–810, https://doi.org/10.1175/2008BAMS2721.1, 2009.
Ghosh, S., Maji, S., and Desarkar, M. S.: GNoM: Graph Neural Network Enhanced Language Models for Disaster Related Multilingual Text Classification, in: 14th ACM Web Science Conference 2022, WebSci '22: 14th ACM Web Science Conference 2022, 55–65, https://doi.org/10.1145/3501247.3531561, 2022.
Gill, J. C. and Malamud, B. D.: Reviewing and visualizing the interactions of natural hazards: Interactions of Natural Hazards, Rev. Geophys., 52, 680–722, https://doi.org/10.1002/2013RG000445, 2014.
Gómez, D., García, E. F., and Aristizábal, E.: Spatial and temporal landslide distributions using global and open landslide databases, Nat. Hazards, 117, 25–55, https://doi.org/10.1007/s11069-023-05848-8, 2023.
Gourley, J. J., Hong, Y., Flamig, Z. L., Arthur, A., Clark, R., Calianno, M., Ruin, I., Ortel, T., Wieczorek, M. E., Kirstetter, P.-E., Clark, E., and Krajewski, W. F.: A Unified Flash Flood Database across the United States, B. Am. Meteorol. Soc., 94, 799–805, https://doi.org/10.1175/bams-d-12-00198.1, 2013.
Graham, M. and De Sabbata, S.: Mapping information wealth and poverty: the geography of gazetteers, Environ. Plann. A, 47, 1254–1264, https://doi.org/10.1177/0308518X15594899, 2015.
Grilli, S. T., Tappin, D. R., Carey, S., Watt, S. F. L., Ward, S. N., Grilli, A. R., Engwell, S. L., Zhang, C., Kirby, J. T., Schambach, L., and Muin, M.: Modelling of the tsunami from the 22 December 2018 lateral collapse of Anak Krakatau volcano in the Sunda Straits, Indonesia, Sci. Rep.-UK, 9, https://doi.org/10.1038/s41598-019-48327-6, 2019.
Guerreiro, N. M., Alves, D. M., Waldendorf, J., Haddow, B., Birch, A., Colombo, P., and Martins, A. F. T.: Hallucinations in Large Multilingual Translation Models, Transactions of the Association for Computational Linguistics, 11, 1500–1517, https://doi.org/10.1162/tacl_a_00615, 2023.
Guzzetti, F., Cardinali, M., and Reichenbach, P.: The AVI project: A bibliographical and archive inventory of landslides and floods in Italy, Environ. Manage., 18, 623–633, https://doi.org/10.1007/BF02400865, 1994.
Guzzetti, F., Mondini, A. C., Cardinali, M., Fiorucci, F., Santangelo, M., and Chang, K.-T.: Landslide inventory maps: New tools for an old problem, Earth-Sci. Rev., 112, 42–66, https://doi.org/10.1016/j.earscirev.2012.02.001, 2012.
Guzzetti, F., Gariano, S. L., Peruccacci, S., Brunetti, M. T., Marchesini, I., Rossi, M., and Melillo, M.: Geographical landslide early warning systems, Earth-Sci. Rev., 200, 102973, https://doi.org/10.1016/j.earscirev.2019.102973, 2020.
Harris, A. J. L. and Villeneuve, N.: Newspaper reporting of the April 2007 eruption of Piton de la Fournaise part 1: useful information or tabloid sensationalism?, J. Appl. Volcanol., 7, 4, https://doi.org/10.1186/s13617-018-0073-1, 2018.
Hungr, O., Leroueil, S., and Picarelli, L.: The Varnes classification of landslide types, an update, Landslides, 11, 167–194, https://doi.org/10.1007/s10346-013-0436-y, 2014.
Ibsen, M.-L. and Brunsden, D.: The nature, use and problems of historical archives for the temporal occurrence of landslides, with specific reference to the south coast of Britain, Ventnor, Isle of Wight, Geomorphology, 15, 241–258, https://doi.org/10.1016/0169-555X(95)00073-E, 1996.
IPCC: Climate Change 2022 – Impacts, Adaptation and Vulnerability: Working Group II Contribution to the Sixth Assessment Report of the Intergovernmental Panel on Climate Change, 1st edn., Cambridge University Press, https://doi.org/10.1017/9781009325844, 2022.
Jacobs, L., Kabaseke, C., Bwambale, B., Katutu, R., Dewitte, O., Mertens, K., Maes, J., and Kervyn, M.: The geo-observer network: A proof of concept on participatory sensing of disasters in a remote setting, Sci. Total Environ., 670, 245–261, https://doi.org/10.1016/j.scitotenv.2019.03.177, 2019.
Ji, Z., Lee, N., Frieske, R., Yu, T., Su, D., Xu, Y., Ishii, E., Bang, Y. J., Madotto, A., and Fung, P.: Survey of Hallucination in Natural Language Generation, ACM Comput. Surv., 55, 1–38, https://doi.org/10.1145/3571730, 2023.
Joshi, P., Santy, S., Budhiraja, A., Bali, K., and Choudhury, M.: The State and Fate of Linguistic Diversity and Inclusion in the NLP World, arXiv [preprint], https://doi.org/10.48550/arXiv.2004.09095, 2020.
Joye, S.: The hierarchy of global suffering: A critical discourse analysis of television news reporting on foreign natural disasters, Journal of International Communication, 15, 45–61, https://doi.org/10.1080/13216597.2009.9674750, 2009.
Kanyiginya, V., Twongyirwe, R., Kagoro-Rugunda, G., Mubiru, D., Sekajugo, J., Mutyebere, R., Deijns, A. A. J., Kervyn, M., and Dewitte, O.: Inventories of natural hazards in under-reported regions: a multi-method insight from a tropical mountainous landscape, African Geographical Review, 43, 827–846, https://doi.org/10.1080/19376812.2023.2280589, 2024.
Kirschbaum, D. and Stanley, T.: Satellite-Based Assessment of Rainfall-Triggered Landslide Hazard for Situational Awareness, Earth's Future, 6, 505–523, https://doi.org/10.1002/2017EF000715, 2018.
Kirschbaum, D. B., Adler, R., Hong, Y., Hill, S., and Lerner-Lam, A.: A global landslide catalog for hazard applications: method, results, and limitations, Nat. Hazards, 52, 561–575, https://doi.org/10.1007/s11069-009-9401-4, 2010.
Kirschbaum, D., Stanley, T., and Zhou, Y.: Spatial and temporal analysis of a global landslide catalog, Geomorphology, 249, 4–15, https://doi.org/10.1016/j.geomorph.2015.03.016, 2015.
Kreibich, H., Van Loon, A. F., Schröter, K., Ward, P. J., Mazzoleni, M., Sairam, N., Abeshu, G. W., Agafonova, S., AghaKouchak, A., Aksoy, H., Alvarez-Garreton, C., Aznar, B., Balkhi, L., Barendrecht, M. H., Biancamaria, S., Bos-Burgering, L., Bradley, C., Budiyono, Y., Buytaert, W., Capewell, L., Carlson, H., Cavus, Y., Couasnon, A., Coxon, G., Daliakopoulos, I., De Ruiter, M. C., Delus, C., Erfurt, M., Esposito, G., François, D., Frappart, F., Freer, J., Frolova, N., Gain, A. K., Grillakis, M., Grima, J. O., Guzmán, D. A., Huning, L. S., Ionita, M., Kharlamov, M., Khoi, D. N., Kieboom, N., Kireeva, M., Koutroulis, A., Lavado-Casimiro, W., Li, H.-Y., LLasat, M. C., Macdonald, D., Mård, J., Mathew-Richards, H., McKenzie, A., Mejia, A., Mendiondo, E. M., Mens, M., Mobini, S., Mohor, G. S., Nagavciuc, V., Ngo-Duc, T., Thao Nguyen Huynh, T., Nhi, P. T. T., Petrucci, O., Nguyen, H. Q., Quintana-Seguí, P., Razavi, S., Ridolfi, E., Riegel, J., Sadik, M. S., Savelli, E., Sazonov, A., Sharma, S., Sörensen, J., Arguello Souza, F. A., Stahl, K., Steinhausen, M., Stoelzle, M., Szalińska, W., Tang, Q., Tian, F., Tokarczyk, T., Tovar, C., Tran, T. V. T., Van Huijgevoort, M. H. J., Van Vliet, M. T. H., Vorogushyn, S., Wagener, T., Wang, Y., Wendt, D. E., Wickham, E., Yang, L., Zambrano-Bigiarini, M., Blöschl, G., and Di Baldassarre, G.: The challenge of unprecedented floods and droughts in risk management, Nature, 608, 80–86, https://doi.org/10.1038/s41586-022-04917-5, 2022.
Kreuzer, T. M. and Damm, B.: Automated digital data acquisition for landslide inventories, Landslides, 17, 2205–2215, https://doi.org/10.1007/s10346-020-01431-5, 2020.
Kwak, H. and An, J.: A First Look at Global News Coverage of Disasters by Using the GDELT Dataset, in: Social Informatics, vol. 8851, edited by: Aiello, L. M. and McFarland, D., Springer International Publishing, Cham, 300–308, https://doi.org/10.1007/978-3-319-13734-6_22, 2014.
Lai, H., Han, S., Li, Y., Yu, Z., and Guo, Z.: Evaluating the Translation Performance of Multilingual Large Language Models: A Case Study on Southeast Asian Languages, in: Communications in Computer and Information Science, Springer Nature Singapore, Singapore, 27–47, https://doi.org/10.1007/978-981-96-2292-4_3, 2025.
Laurer, M., Van Atteveldt, W., Casas, A., and Welbers, K.: Less Annotating, More Classifying: Addressing the Data Scarcity Issue of Supervised Machine Learning with Deep Transfer Learning and BERT-NLI, Polit. Anal., 32, 84–100, https://doi.org/10.1017/pan.2023.20, 2024.
Lehner, B. and Grill, G.: Global river hydrography and network routing: baseline data and new approaches to study the world's large river systems, Hydrol. Process., 27, 2171–2186, https://doi.org/10.1002/hyp.9740, 2013.
Li, F.-F., Fergus, R., and Perona, P.: One-shot learning of object categories, IEEE T. Pattern Anal., 28, 594–611, https://doi.org/10.1109/TPAMI.2006.79, 2006.
Li, L., Bensi, M., Cui, Q., Baecher, G. B., and Huang, Y.: Social media crowdsourcing for rapid damage assessment following a sudden-onset natural hazard event, Int. J. Inform. Manage., 60, 102378, https://doi.org/10.1016/j.ijinfomgt.2021.102378, 2021.
Li, N., Thiery, W., Zahra, S., Madruga De Brito, M., Worou, K., Kurfali, M., Lampe, S., Munoz, P., Flynn, C., Trigoso, C., Nivre, J., Zscheischler, J., and Messori, G.: Wikimpacts 1.0: A new global climate impact database based on automated information extraction from Wikipedia, https://doi.org/10.5194/egusphere-egu25-8954, 2025.
MacEachren, A. M., Jaiswal, A., Robinson, A. C., Pezanowski, S., Savelyev, A., Mitra, P., Zhang, X., and Blanford, J.: SensePlace2: GeoTwitter analytics support for situational awareness, in: 2011 IEEE Conference on Visual Analytics Science and Technology (VAST), 2011 IEEE Conference on Visual Analytics Science and Technology (VAST), 181–190, https://doi.org/10.1109/VAST.2011.6102456, 2011.
Madruga de Brito, M., Sodoge, J., Kreibich, H., and Kuhlicke, C.: Comprehensive Assessment of Flood Socioeconomic Impacts Through Text-Mining, Water Resour. Res., 61, e2024WR037813, https://doi.org/10.1029/2024WR037813, 2025a.
Madruga de Brito, M., Rotaru, A. M., Wang, J., Gesualdo, G., Hasbini, L., Severino, L., and Nunes Carvalho, T. M.: Developing a multi-hazard impact and response dataset for the Global South, EGU General Assembly 2025, Vienna, Austria, 27 Apr–2 May 2025, EGU25-17817, https://doi.org/10.5194/egusphere-egu25-17817, 2025b.
Maes, J., Kervyn, M., De Hontheim, A., Dewitte, O., Jacobs, L., Mertens, K., Vanmaercke, M., Vranken, L., and Poesen, J.: Landslide risk reduction measures: A review of practices and challenges for the tropics, Prog. Phys. Geogr., 41, 191–221, https://doi.org/10.1177/0309133316689344, 2017.
Mawe, G. I., Landu, E. L., Dujardin, E., Imwangana, F. M., Bielders, C., Hubert, A., Michellier, C., Nzolang, C., Poesen, J., Dewitte, O., and Vanmaercke, M.: Mapping urban gullies in the Democratic Republic of the Congo, Nature, 644, 952–959, https://doi.org/10.1038/s41586-025-09371-7, 2025.
Mayo, R., Zlydenko, O., Bootbool, M., Fronman, S., Gilon, O., Hassidim, A., Kratzert, F., Loike, G., Matias, Y., Nakar, Y., Nearing, G., Sayag, R., Sicherman, A., Zemach, I., and Cohen, D.: Groundsource: A Dataset of Flood Events from News, https://doi.org/10.31223/X5RR2K, 10 March 2026, 2026.
Merz, B., Blöschl, G., Vorogushyn, S., Dottori, F., Aerts, J. C. J. H., Bates, P., Bertola, M., Kemter, M., Kreibich, H., Lall, U., and Macdonald, E.: Causes, impacts and patterns of disastrous river floods, Nat. Rev. Earth Environ., 2, 592–609, https://doi.org/10.1038/s43017-021-00195-3, 2021.
Metreau, E., Elizabeth, K., and Eapen, S.: Understanding country income: World Bank Group income classifications for FY26 (1 July 2025–June, 2026), https://blogs.worldbank.org/en/opendata/understanding-country-income–world-bank-group-income-classifica#one (last access: 8 July 2026), 2025.
Middleton, S. E. and Krivcovs, V.: Geoparsing and Geosemantics for Social Media: Spatiotemporal Grounding of Content Propagating Rumors to Support Trust and Veracity Analysis during Breaking News, ACM T. Inform. Syst., 34, 1–26, https://doi.org/10.1145/2842604, 2016.
Middleton, S. E., Middleton, L., and Modafferi, S.: Real-Time Crisis Mapping of Natural Disasters Using Social Media, IEEE Intell. Syst., 29, 9–17, https://doi.org/10.1109/MIS.2013.126, 2014.
Middleton, S. E., Kordopatis-Zilos, G., Papadopoulos, S., and Kompatsiaris, Y.: Location Extraction from Social Media: Geoparsing, Location Disambiguation, and Geotagging, ACM T. Inform. Syst., 36, 1–27, https://doi.org/10.1145/3202662, 2018.
Monsieurs, E., Jacobs, L., Michellier, C., Basimike Tchangaboba, J., Ganza, G. B., Kervyn, F., Maki Mateso, J.-C., Mugaruka Bibentyo, T., Kalikone Buzera, C., Nahimana, L., Ndayisenga, A., Nkurunziza, P., Thiery, W., Demoulin, A., Kervyn, M., and Dewitte, O.: Landslide inventory for hazard assessment in a data-poor context: a regional-scale approach in a tropical African environment, Landslides, 15, 2195–2209, https://doi.org/10.1007/s10346-018-1008-y, 2018.
Muñoz-Torrero Manchado, A., Allen, S., Ballesteros-Cánovas, J. A., Dhakal, A., Dhital, M. R., and Stoffel, M.: Three decades of landslide activity in western Nepal: new insights into trends and climate drivers, Landslides, 18, 2001–2015, https://doi.org/10.1007/s10346-021-01632-6, 2021.
Murthy, D. and Longwell, S. A.: Twitter and disasters: The uses of Twitter during the 2010 Pakistan floods, Information, Communication & Society, 16, 837–855, https://doi.org/10.1080/1369118X.2012.696123, 2013.
Nsabimana, J., Henry, S., Ndayisenga, A., Kubwimana, D., Dewitte, O., Kervyn, F., and Michellier, C.: Geo-Hydrological Hazard Impacts, Vulnerability and Perception in Bujumbura (Burundi): A High-Resolution Field-Based Assessment in a Sprawling City, Land, 12, 1876, https://doi.org/10.3390/land12101876, 2023.
Nunes Carvalho, T. M., Zscheischler, J., Kuhlicke, C., and Madruga de Brito, M.: A global database of natural hazards impacts reported in the scientific literature, EGU General Assembly 2024, Vienna, Austria, 14–19 April 2024, EGU24-19940, https://doi.org/10.5194/egusphere-egu24-19940, 2024.
Ofli, F., Imran, M., Qazi, U., Roch, J., Pennington, C., Banks, V., and Bossu, R.: Landslide detection in real-time social media image streams, Neural Comput. Appl., 35, 17809–17819, https://doi.org/10.1007/s00521-023-08648-0, 2023.
OpenStreetMap contributors: Planet dump retrieved from https://planet.osm.org (last access: 2 November 2025), 2017.
Ou-Yang, L.: Newspaper3k: Article scraping & curation, GitHub repository [code], https://github.com/codelucas/newspaper (last access: 5 September 2025), 2014
Owuor, I., Hochmair, H. H., and Cvetojevic, S.: Tracking Hurricane Dorian in GDELT and Twitter, AGILE GIScience Ser., 1, 1–18, https://doi.org/10.5194/agile-giss-1-19-2020, 2020.
Ozturk, U., Bozzolan, E., Holcombe, E. A., Shukla, R., Pianosi, F., and Wagener, T.: How climate change and unplanned urban sprawl bring more landslides, Nature, 608, 262–265, https://doi.org/10.1038/d41586-022-02141-9, 2022.
Poblete, B., Guzman, J., Maldonado, J., and Tobar, F.: Robust Detection of Extreme Events Using Twitter: Worldwide Earthquake Monitoring, IEEE T. Multimedia, 20, 2551–2561, https://doi.org/10.1109/TMM.2018.2855107, 2018.
Porter, J. J. and Evans, G.: Unreported world: A critical analysis of UK newspaper coverage of post-disaster events, Geogr. J., 186, 327–338, https://doi.org/10.1111/geoj.12353, 2020.
Qian, F., Gong, C., Sharma, K., and Liu, Y.: Neural User Response Generator: Fake News Detection with Collective User Intelligence, in: Proceedings of the Twenty-Seventh International Joint Conference on Artificial Intelligence, Twenty-Seventh International Joint Conference on Artificial Intelligence IJCAI-18, 13–19 July 2018, 3834–3840, https://doi.org/10.24963/ijcai.2018/533, 2018.
Radford, A., Narasimhan, K., Salimans, T., and Sutskever, I.: Improving language understanding by generative pre-training, OpenAI, 12 pp, https://cdn.openai.com/research-covers/language-unsupervised/language_understanding_paper.pdf (last access: 29 October 2025), 2018.
Robinson, N. R., Ogayo, P., Mortensen, D. R., and Neubig, G.: ChatGPT MT: Competitive for High- (but not Low-) Resource Languages, arXiv [preprint], https://doi.org/10.48550/arXiv.2309.07423, 2023.
Rodrigo-Ginés, F.-J., Carrillo-de-Albornoz, J., and Plaza, L.: A systematic review on media bias detection: What is media bias, how it is expressed, and how to detect it, Expert Syst. Appl., 237, 121641, https://doi.org/10.1016/j.eswa.2023.121641, 2024.
Rodrigues, S. G., Silva, M. M., and Alencar, M. H.: A proposal for an approach to mapping susceptibility to landslides using natural language processing and machine learning, Landslides, 18, 2515–2529, https://doi.org/10.1007/s10346-021-01643-3, 2021.
Rogers, A., Kovaleva, O., and Rumshisky, A.: A Primer in BERTology: What We Know About How BERT Works, Transactions of the Association for Computational Linguistics, 8, 842–866, https://doi.org/10.1162/tacl_a_00349, 2020.
Rogers, A., Gardner, M., and Augenstein, I.: QA Dataset Explosion: A Taxonomy of NLP Resources for Question Answering and Reading Comprehension, ACM Comput. Surv., 55, 1–45, https://doi.org/10.1145/3560260, 2023.
Rossi, C., Acerbo, F. S., Ylinen, K., Juga, I., Nurmi, P., Bosca, A., Tarasconi, F., Cristoforetti, M., and Alikadic, A.: Early detection and information extraction for weather-induced floods using social media streams, Int. J. Disast. Risk Re., 30, 145–157, https://doi.org/10.1016/j.ijdrr.2018.03.002, 2018.
Rossi, M., Witt, A., Guzzetti, F., Malamud, B. D., and Peruccacci, S.: Analysis of historical landslide time series in the Emilia-Romagna region, northern Italy, Earth Surf. Proc. Land., 35, 1123–1137, https://doi.org/10.1002/esp.1858, 2010.
Sanh, V., Debut, L., Chaumond, J., and Wolf, T.: DistilBERT, a distilled version of BERT: smaller, faster, cheaper and lighter, arXiv [preprint], https://doi.org/10.48550/arXiv.1910.01108, 2019.
Schlögl, M., Fuchs, S., Scheidl, C., and Heiser, M.: Trends in torrential flooding in the Austrian Alps: A combination of climate change, exposure dynamics, and mitigation measures, Climate Risk Management, 32, 100294, https://doi.org/10.1016/j.crm.2021.100294, 2021.
Sekajugo, J., Kagoro-Rugunda, G., Mutyebere, R., Kabaseke, C., Namara, E., Dewitte, O., Kervyn, M., and Jacobs, L.: Can citizen scientists provide a reliable geo-hydrological hazard inventory? An analysis of biases, sensitivity and precision for the Rwenzori Mountains, Uganda, Environ. Res. Lett., 17, 045011, https://doi.org/10.1088/1748-9326/ac5bb5, 2022.
Shabir, W., Amirov, E., and Sadurski, A.: dateparser: Python parser for human readable dates (1.2.2), https://github.com/scrapinghub/dateparser (last access: 15 October 2025), 2025.
Sirén-Heikel, S., Leppänen, L., Lindén, C.-G., and Bäck, A.: Unboxing news automation: Exploring imagined affordances of automation in news journalism, Nord. J. Med. Stud., 1, 47–66, https://doi.org/10.2478/njms-2019-0004, 2019.
Smith, A., Bates, P. D., Wing, O., Sampson, C., Quinn, N., and Neal, J.: New estimates of flood exposure in developing countries using high-resolution population data, Nat. Commun., 10, https://doi.org/10.1038/s41467-019-09282-y, 2019.
Sodoge, J., Kuhlicke, C., and De Brito, M. M.: Automatized spatio-temporal detection of drought impacts from newspaper articles using natural language processing and machine learning, Weather and Climate Extremes, 41, 100574, https://doi.org/10.1016/j.wace.2023.100574, 2023.
Solman, P. and Henderson, L.: Flood disasters in the United Kingdom and India: A critical discourse analysis of media reporting, Journalism, 20, 1648–1664, https://doi.org/10.1177/1464884918762363, 2019.
Stanley, T. and Kirschbaum, D. B.: A heuristic approach to global landslide susceptibility mapping, Nat. Hazards, 87, 145–164, https://doi.org/10.1007/s11069-017-2757-y, 2017.
Stein, L., Mukkavilli, S. K., Pfitzmann, B. M., Staar, P. W. J., Ozturk, U., Berrospi, C., Brunschwiler, T., and Wagener, T.: Wealth Over Woe: Global Biases in Hydro-Hazard Research, Earth's Future, 12, e2024EF004590, https://doi.org/10.1029/2024EF004590, 2024.
Sun, A. Y. and Scanlon, B. R.: How can Big Data and machine learning benefit environment and water management: a survey of methods, applications, and future directions, Environ. Res. Lett., 14, 073001, https://doi.org/10.1088/1748-9326/ab1b7d, 2019.
Tang, Y., Tran, C., Li, X., Chen, P.-J., Goyal, N., Chaudhary, V., Gu, J., and Fan, A.: Multilingual Translation with Extensible Multilingual Pretraining and Finetuning, arXiv [preprint], https://doi.org/10.48550/arXiv.2008.00401, 2020.
Taylor, F. E., Malamud, B. D., Freeborough, K., and Demeritt, D.: Enriching Great Britain's National Landslide Database by searching newspaper archives, Geomorphology, 249, 52–68, https://doi.org/10.1016/j.geomorph.2015.05.019, 2015.
Tellman, B., Sullivan, J. A., Kuhn, C., Kettner, A. J., Doyle, C. S., Brakenridge, G. R., Erickson, T. A., and Slayback, D. A.: Satellite imaging reveals increased proportion of population exposed to floods, Nature, 596, 80–86, https://doi.org/10.1038/s41586-021-03695-w, 2021.
Tiedemann, J., Aulamo, M., Bakshandaeva, D., Boggia, M., Grönroos, S.-A., Nieminen, T., Raganato, A., Scherrer, Y., Vázquez, R., and Virpioja, S.: Democratizing neural machine translation with OPUS-MT, Lang. Resour. Eval., 58, 713–755, https://doi.org/10.1007/s10579-023-09704-w, 2024.
Tounsi, A. and Temimi, M.: A systematic review of natural language processing applications for hydrometeorological hazards assessment, Nat. Hazards, 116, 2819–2870, https://doi.org/10.1007/s11069-023-05842-0, 2023.
Tradowsky, J. S., Philip, S. Y., Kreienkamp, F., Kew, S. F., Lorenz, P., Arrighi, J., Bettmann, T., Caluwaerts, S., Chan, S. C., De Cruz, L., De Vries, H., Demuth, N., Ferrone, A., Fischer, E. M., Fowler, H. J., Goergen, K., Heinrich, D., Henrichs, Y., Kaspar, F., Lenderink, G., Nilson, E., Otto, F. E. L., Ragone, F., Seneviratne, S. I., Singh, R. K., Skålevåg, A., Termonia, P., Thalheimer, L., Van Aalst, M., Van Den Bergh, J., Van De Vyver, H., Vannitsem, S., Van Oldenborgh, G. J., Van Schaeybroeck, B., Vautard, R., Vonk, D., and Wanders, N.: Attribution of the heavy rainfall events leading to severe flooding in Western Europe during July 2021, Climatic Change, 176, 90, https://doi.org/10.1007/s10584-023-03502-7, 2023.
Tunstall, L., Reimers, N., Jo, U. E. S., Bates, L., Korat, D., Wasserblat, M., and Pereg, O.: Efficient Few-Shot Learning Without Prompts, arXiv [preprint], https://doi.org/10.48550/arXiv.2209.11055, 2022.
UNDRR: Sendai Framework for Disaster Risk Reduction 2015–2030, https://www.undrr.org/publication/sendai-framework-disaster-risk-reduction-2015-2030 (last access: 29 July 2025), 2015.
United Nations Office for Disaster Risk Reduction: The Sendai Framework Terminology on Disaster Risk Reduction, https://www.undrr.org/terminology/hazardous-event (last access: 14 July 2025), 2017.
Valenzuela, P., Domínguez-Cuesta, M. J., Mora García, M. A., and Jiménez-Sánchez, M.: A spatio-temporal landslide inventory for the NW of Spain: BAPA database, Geomorphology, 293, 11–23, https://doi.org/10.1016/j.geomorph.2017.05.010, 2017.
Valero, A. T., Montes, M., Pineda Villaseñor, G., and Pineda Villaseñor, L.: Using Machine Learning for Extracting Information from Natural Disaster News Reports, Computación y Sistemas, 13, 33–44, 2009.
Valkenborg, B., Dewitte, O., and Smets, B.: HazMiner dataset (v2), Zenodo [data set], https://doi.org/10.5281/zenodo.21965363, 2026a.
Valkenborg, B., Dewitte, O., and Smets, B.: HazMiner code (v2), Zenodo [code], https://doi.org/10.5281/zenodo.21965339, 2026b.
Valkenborg, B., Dewitte, O., and Smets, B.: all-MiniLM-L12-v2_HazMiner_nonevents, HuggingFace Hub [code], https://doi.org/10.57967/HF/9762, 2026c.
Van Den Eeckhaut, M. and Hervás, J.: State of the art of national landslide databases in Europe and their potential for assessing landslide susceptibility, hazard and risk, Geomorphology, 139–140, 545–558, https://doi.org/10.1016/j.geomorph.2011.12.006, 2012.
Vaswani, A., Shazeer, N., Parmar, N., Uszkoreit, J., Jones, L., Gomez, A. N., Kaiser, L., and Polosukhin, I.: Attention Is All You Need, arXiv [preprint], https://doi.org/10.48550/arXiv.1706.03762, 2017.
Vogler, D., Udris, L., and Eisenegger, M.: Measuring Media Content Concentration at a Large Scale Using Automated Text Comparisons, Journalism Stud., 21, 1459–1478, https://doi.org/10.1080/1461670X.2020.1761865, 2020.
Walter, D., Sheafer, T., Nir, L., and Shenhav, S.: Not All Countries Are Created Equal: Foreign Countries Prevalence in U. S. News and Entertainment Media, Mass Commun. Soc., 19, 522–541, https://doi.org/10.1080/15205436.2016.1170853, 2016.
Wang, W., Wei, F., Dong, L., Bao, H., Yang, N., and Zhou, M.: MiniLM: Deep Self-Attention Distillation for Task-Agnostic Compression of Pre-Trained Transformers, arXiv [preprint], https://doi.org/10.48550/arXiv.2002.10957, 2020.
Wang, Z., Ye, X., and Tsou, M.-H.: Spatial, temporal, and content analysis of Twitter for wildfire hazards, Nat. Hazards, 83, 523–540, https://doi.org/10.1007/s11069-016-2329-6, 2016.
Ward, P. J., Blauhut, V., Bloemendaal, N., Daniell, J. E., de Ruiter, M. C., Duncan, M. J., Emberson, R., Jenkins, S. F., Kirschbaum, D., Kunz, M., Mohr, S., Muis, S., Riddell, G. A., Schäfer, A., Stanley, T., Veldkamp, T. I. E., and Winsemius, H. C.: Review article: Natural hazard risk assessments at the global scale, Nat. Hazards Earth Syst. Sci., 20, 1069–1096, https://doi.org/10.5194/nhess-20-1069-2020, 2020.
Wei, J., Wang, X., Schuurmans, D., Bosma, M., Ichter, B., Xia, F., Chi, E., Le, Q. V., and Zhou, D.: Chain-Of-Thought Prompting Elicits Reasoning in Large Language Models, in: Advances in Neural Information Processing Systems 35, Adv. Neural Info. Process. Syst. 35, 24824–24837, https://doi.org/10.52202/068431-1800, 2022.
Wei, J., Tay, Y., Bommasani, R., Raffel, C., Zoph, B., Borgeaud, S., Yogatama, D., Bosma, M., Zhou, D., Metzler, D., Chi, E. H., Hashimoto, T., Vinyals, O., Liang, P., Dean, J., and Fedus, W.: Emergent Abilities of Large Language Models, arXiv [preprint], https://doi.org/10.48550/arXiv.2206.07682, 2022b.
Wiegmann, M., Kersten, J., Senaratne, H., Potthast, M., Klan, F., and Stein, B.: Opportunities and risks of disaster data from social media: a systematic review of incident information, Nat. Hazards Earth Syst. Sci., 21, 1431–1444, https://doi.org/10.5194/nhess-21-1431-2021, 2021.
Yagoub, M. M., Alsereidi, A. A., Mohamed, E. A., Periyasamy, P., Alameri, R., Aldarmaki, S., and Alhashmi, Y.: Newspapers as a validation proxy for GIS modeling in Fujairah, United Arab Emirates: identifying flood-prone areas, Nat. Hazards, 104, 111–141, https://doi.org/10.1007/s11069-020-04161-y, 2020.
Yang, T., Xie, J., Li, G., Zhang, L., Mou, N., Wang, H., Zhang, X., and Wang, X.: Extracting Disaster-Related Location Information through Social Media to Assist Remote Sensing for Disaster Analysis: The Case of the Flood Disaster in the Yangtze River Basin in China in 2020, Remote Sens.-Basel, 14, 1199, https://doi.org/10.3390/rs14051199, 2022.
Yin, W., Hay, J., and Roth, D.: Benchmarking Zero-shot Text Classification: Datasets, Evaluation and Entailment Approach, arXiv [preprint], https://doi.org/10.48550/arXiv.1909.00161, 2019.
Zêzere, J. L., Pereira, S., Tavares, A. O., Bateira, C., Trigo, R. M., Quaresma, I., Santos, P. P., Santos, M., and Verde, J.: DISASTER: a GIS database on hydro-geomorphologic disasters in Portugal, Nat. Hazards, 72, 503–532, https://doi.org/10.1007/s11069-013-1018-y, 2014.
The GDELT Project, https://www.gdeltproject.org/, last access: 24 July 2025.