
the Creative Commons Attribution 4.0 License.
the Creative Commons Attribution 4.0 License.
 | 02 Nov 2026
Reducing false alarms in crackmeter-based early warning of small-scale slope deformation via deep learning-driven asynchronous displacement–rainfall data fusion
Shubing Ouyang
Daichao Li

Minjiang Liu
Fengjian Ge
Xia Zheng
Yuan Li
Sheng Wu
Real-time crackmeter-based deformation monitoring systems for small-scale rainfall-affected slopes suffer from high false alarm rates. Across multi-slope monitoring settings, threshold-based alerts are vulnerable to noise, while conventional denoising and prediction-based validation methods remain limited in automated warning discrimination and cross-site generalization. To address this bottleneck, a labeled dataset and a data-driven binary classification framework were developed to distinguish true early warnings from false alarms among threshold-triggered sensor alerts. A multi-source dataset of crack-displacement and rainfall observations was constructed from monitored slopes in Fujian Province, China, with genuine and false alerts labelled based on field investigations and geological expert assessment. A patch-based dual-branch temporally-aware Transformer model was developed to fuse asynchronous multi-rate data, preserve the temporal direction from antecedent rainfall to subsequent displacement, and satisfy stringent real-time decision constraints. By simultaneously capturing long-term rainfall-displacement interactions and high-resolution displacement dynamics, the model outperforms competitive baselines, achieving a precision of 90.32 %, a recall of 89.38 %, and an F2-score of 89.54 % in identifying true early warnings. Interpretability analysis reveals that the model's decisions are primarily driven by localized displacement trends and the relationship between rainfall and displacement, aligning with expert judgment. Analyses of misclassified cases informed additional safeguards to further reduce missed warnings. The proposed framework helps reduce false alarms and supports reliable automated slope hazard monitoring. However, the present validation is limited to the Fujian rainfall-triggered monitoring context, and application to other geological or climatic settings requires further external validation and local adaptation.
- Article
(8330 KB) - Full-text XML
- BibTeX
- EndNote


Real-time monitoring and early warning of geological disasters form the cornerstone of disaster prevention systems, holding strategic importance for the protection of human lives and property (Khan et al., 2020; Quansah et al., 2010). Heavy rainfall frequently acts as a primary influence quantity triggering small-scale slope failures, particularly shallow landslides (Zhuang et al., 2022). According to the classification of the Ministry of Natural Resources of China, small-scale landslides are defined as those with a volume of less than 100 000 m3, whereas small-scale collapses are defined as those with a volume of less than 10 000 m3. These events evolve rapidly, and their precursor signals are often subtle and challenging to detect, which presents significant difficulties for the effectiveness of early warning systems (Qiu et al., 2025). In this context, Internet of Things (IoT)-based sensing systems have become a fundamental engineering approach for continuous and automated monitoring of slope deformation. Among these sensors, crackmeters serve as core nodes within distributed IoT infrastructures, capturing real-time, high-frequency displacement data. These data represent the primary measurand associated with crack evolution, a key precursor to slope instability and structural collapse (Deng et al., 2024; Baroň and Supper, 2013; Klimeš et al., 2012).
Current methodologies for displacement-based early warning primarily rely on displacement values, velocities, or derived indicators for risk assessment. Sun et al. (2024) utilized the Mann–Kendall test to analyze evolutionary trends in fractal dimension parameters of displacement for establishing warning thresholds. Zhang et al. (2024) mapped normalized velocity deformation indices into a normal distribution space to achieve graded warnings. However, the effectiveness of these methods depends heavily on the quality and integrity of the measurement data. In practical engineering scenarios, monitoring data from crackmeters are often contaminated by significant measurement uncertainty arising from environmental interference and inherent instrumental errors. This noise contamination directly contributes to the frequent occurrence of false positive alarms. Moreover, existing warning systems remain predominantly reliant on manual verification processes, exhibiting a lack of automated capabilities to distinguish true early warnings from false alarms. This deficiency considerably increases the demand for human analysis and judgment, imposing a substantial additional workload on monitoring personnel.
The primary challenges associated with ensuring measurement data reliability in these automated systems can be categorized as follows:
- 1.
Signal-to-Noise Interpretation: As a significant source of false alarms, slope displacement noise is commonly mitigated using conventional techniques like simple moving averages or Gaussian-weighted smoothing. These methods enhance data smoothness (Sharifi et al., 2024), but excessive smoothing may diminish the amplitude of critical risk signals (Sharifi et al., 2022a). Furthermore, such methodologies demonstrate limited efficacy and inadequate resilience in mitigating non-stationary, transient spike noise, frequently necessitating its proactive elimination (Sharifi et al., 2022a). Critically, during real-time monitoring, conventional denoising methods encounter difficulties in effectively incorporating the primary triggering factors of slope failures, such as rainfall. This makes it unreliable to determine whether a sudden change in the latest displacement value represents mere noise interference or a genuine deformation-related warning.
- 2.
Limitations of “Prediction-Based” Validation: Given these limitations inherent in automatic noise processing, an alternative approach based on “denoising-prediction-measurement discrepancy” analysis has been proposed for true early warning recognition. This method calculates anomaly scores by quantifying deviations between denoised displacement predictions and measured values. It allows for integration with other triggering factors, and achieves superior identification of transient spike noise, thereby facilitating staged warning implementation. For instance, Shehadeh et al. employed autoregressive models to predict displacement after smoothing the displacement data, computed the statistical discrepancy between these predictions and the measured displacement, and subsequently differentiated genuine displacement events from transient spike noise (Shehadeh et al., 2024). This approach emerges within a broader evolution in landslide displacement prediction methodologies, which has progressed from early physical-mechanical models (Guo et al., 2024; Liu et al., 2024; Wu and Lan, 2019) and traditional time-series models (Li et al., 2021a; Wang et al., 2023) to leveraging deep learning techniques (Nava et al., 2023; Wang et al., 2022; Yang et al., 2019). These advanced techniques have demonstrated an enhanced capability to extract complex nonlinear features from temporal data, significantly improving prediction accuracy. Concurrently, advances in deep learning technology have also improved the capacity of models to characterize the coupling relationships between external driving factors and displacement dynamics. This development has been demonstrated through the successful integration of multiple data sources (e.g. rainfall or reservoir water levels) into the models (Deng et al., 2021; Jiang et al., 2024), providing more substantial support for accurate displacement prediction. However, existing warning methods based on “denoise-predicted-measured discrepancy” still encounter limitations. Firstly, the process of predicting displacement typically necessitates the preliminary processing of raw data using conventional denoising methodologies (Sharifi et al., 2022b). These methods often require manual parameter adjustments to accommodate the distinct characteristics of different multi-crackmeter datasets, which impedes the realization of a fully automated workflow. Secondly, displacement prediction models trained and applied on individual warning curves often demonstrate inadequate generalization capacity across multiple diverse warning curves. The prevailing approach in contemporary deep learning-based displacement prediction research involves training models on individual curves. However, this approach fails to adequately accommodate the heterogeneity of data characteristics across different geological scenarios. This shortcoming becomes particularly evident when multi-crackmeter monitoring sequences are short and lack sufficient regularity, causing models trained on single curves to underperform or fail.
In conclusion, despite the notable advancements made in the field of slope displacement noise filtering and prediction, existing techniques still face challenges in achieving automated classification of “true early warnings” and “false alarms” in multi-crackmeter real-time monitoring scenarios through a pipeline focused on a single displacement curve's “denoise-predicted-measured discrepancy”. Concurrently, a significant research gap persists regarding the development of models capable of real-time, automatic differentiation of true early warnings from false alarms specifically within multi-crackmeter scenarios that are subject to multi-source noise interference. Recently, transformer-based deep temporal models have demonstrated a substantial enhancement in prediction accuracy for complex nonlinear geological displacement by meticulously focusing on critical time steps (Ge et al., 2024; Wu et al., 2025). Notably, the transformer-based PatchTST model (Nie et al., 2022), which adopts a “patch-then-model” strategy, was utilized to mitigate noise through semantic understanding within patches (Niu et al., 2024) while simultaneously learning temporal relationships between different patches. These characteristics appear particularly well-suited to the task of true early warning recognition in multi-crackmeter scenarios. However, the functionality of PatchTST was primarily restricted to the independent extraction of features from isolated temporal channels, without explicitly capturing the cross-variable dependencies between displacement and triggering factors like rainfall. Because robust early-warning recognition requires modelling the relationship between antecedent rainfall and subsequent displacement without allowing information from later displacement observations to leak into earlier time steps, the unrestricted global attention mechanism in standard PatchTST may violate this temporal direction. Additionally, integrating real-time, variable-frequency crackmeter data (up to 1 Hz) with hourly fixed-frequency rainfall measurements posed a significant challenge for the reliable identification of genuine deformation-related warnings.
To address this practical challenge, this study focuses on distinguishing genuine alerts from noise-related false alarms after crackmeter thresholds are exceeded in an operational slope-monitoring network in Fujian Province, China. In this network, crackmeters are installed across rear tension cracks identified through field investigations at sites affected predominantly by small-scale landslides or localized collapses. Geological experts establish a site-specific four-level threshold scheme for each crackmeter based on local geological and environmental conditions. Exceedance of a threshold generates a preliminary device alert rather than confirming that slope failure is imminent. Experts must therefore determine whether the recorded displacement represents genuine slope deformation or interference caused by sensor noise, human or animal disturbance, or other non-slope-related factors. This discrimination must be performed promptly because deformation at some monitored small-scale slopes may accelerate rapidly, while even lower-level alerts may remain relevant when continued or forecast rainfall could further promote crack opening and slope movement. To support this process, this study constructs a field-verified multi-source dataset integrating crackmeter displacement and rainfall measurements from diverse monitored slopes in Fujian Province, China. Building upon this dataset, a patch-based dual-branch temporally-aware Transformer model (PatchDC) is developed to satisfy three critical engineering requirements: (1) the seamless fusion of asynchronous, multi-rate monitoring data; (2) temporal modelling that links antecedent rainfall to subsequent displacement while preventing information from later observations from leaking into earlier time steps; and (3) high-efficiency real-time applicability within operational systems. By concurrently capturing long-term rainfall-displacement interactions and high-resolution displacement dynamics, the model enables robust discrimination between genuine kinematic deformations and noise-induced false alarms. It should be noted that the operational monitoring network comprised 429 crackmeters, whereas field-confirmed true-warning samples were obtained from 52 sensors. Accordingly, the present validation is limited to the rainfall-triggered monitoring context in Fujian Province, and the resulting model should not be assumed to generalize directly to other geological, climatic, or monitoring settings.
The main contributions of this study are as follows: (1) A field-verified multi-source dataset was constructed for true–false warning discrimination across multiple monitored slopes, integrating crackmeter displacement and rainfall observations following threshold-triggered alerts. (2) A temporally aware dual-branch Transformer framework was developed to integrate asynchronous multi-rate rainfall and displacement data for automated warning discrimination. The framework was evaluated under strict sensor-level isolation within the Fujian monitoring network, demonstrating reduced false alarms while retaining sensitivity to field-confirmed true warnings from previously unseen sensors.
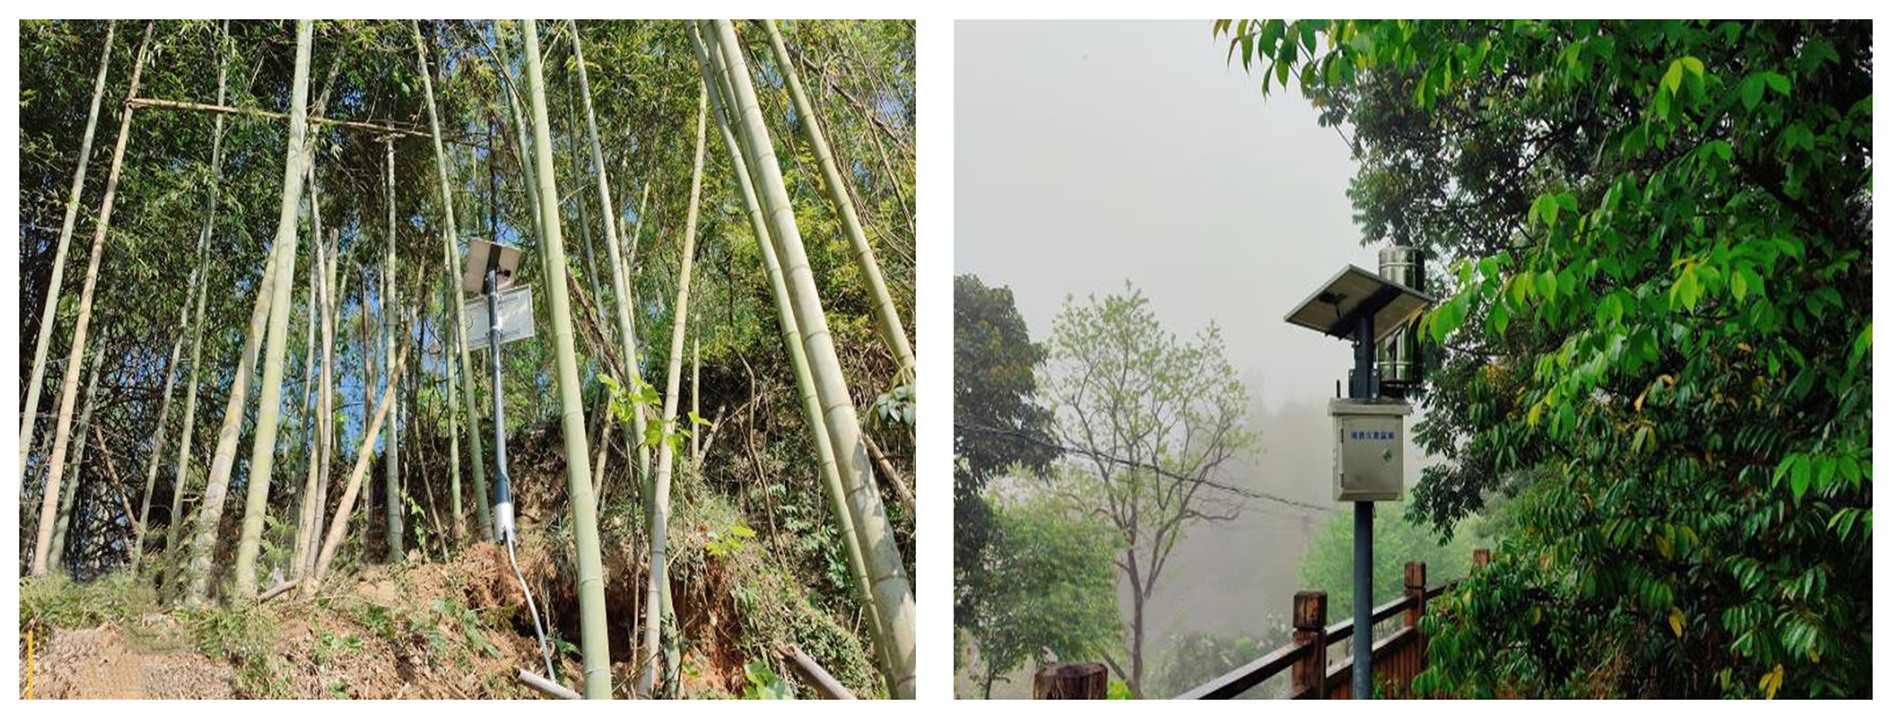
Table 1Summary of device alerts received by the Fujian Provincial Geological Hazard Early Warning Platform.

The study area is located in Fujian Province, China, which is characterized by extensive hilly-mountainous terrain and frequent typhoon-induced rainstorms. Fujian is among China's most geologically hazardous provinces, with disasters typically being small scale, widely distributed, highly sudden, and destructive. Typhoon-rainfall triggered landslides or collapses can progress from initial displacement to failure within minutes to hours. For example, shallow soil landslides in Wuping County (May 2022) occurred due to intense rainfall causing rapid soil saturation and reduced shear strength, leading to slope failure within minutes to hours (Li et al., 2025).
An advanced monitoring and early warning system is essential for geohazard prevention and mitigation. A 5G IoT-based geohazard monitoring and early warning system has been implemented in Fujian (Li et al., 2021b), with crackmeters as a primary monitoring device (Fig. 1). These instruments record crack displacement at variable frequencies with millimeter-level precision, enabling detection of early warning signals. True early warnings from crackmeter device alerts are confirmed only after expert review of crackmeter and rainfall data on the system platform. However, practical applications reveal a high false alarm rate: From 2020 to 2024, the Fujian Provincial Geological Hazard Early Warning Platform received approximately 2.05 million threshold-triggered device alerts. Following expert assessment and field verification, only slightly more than 500 alerts, including slightly more than 100 crackmeter alerts, were validated as true warnings, corresponding to an overall effective warning rate of less than 0.03 % (Table 1).
Table 2Exemplary threshold configurations for True early warning.

The operational monitoring system uses threshold-based trigger rules to support continuous and real-time monitoring, but the thresholds are not applied uniformly across all slopes. Geological experts establish site-specific, four-level thresholds for each crackmeter according to the local geological setting, slope geometry, drainage conditions, interpreted failure mechanism, and monitoring conditions. Two primary threshold approaches are implemented: (1) The comparative analysis employs a predefined site-specific incremental threshold, where displacement values exceeding a prescribed variation limit relative to the corresponding time window of the preceding day trigger alerts. (2) Absolute displacement threshold: A predefined site-specific cumulative displacement limit is established. Exemplary threshold configurations for the four-color warning system (blue, yellow, orange, red) are detailed in Table 2.
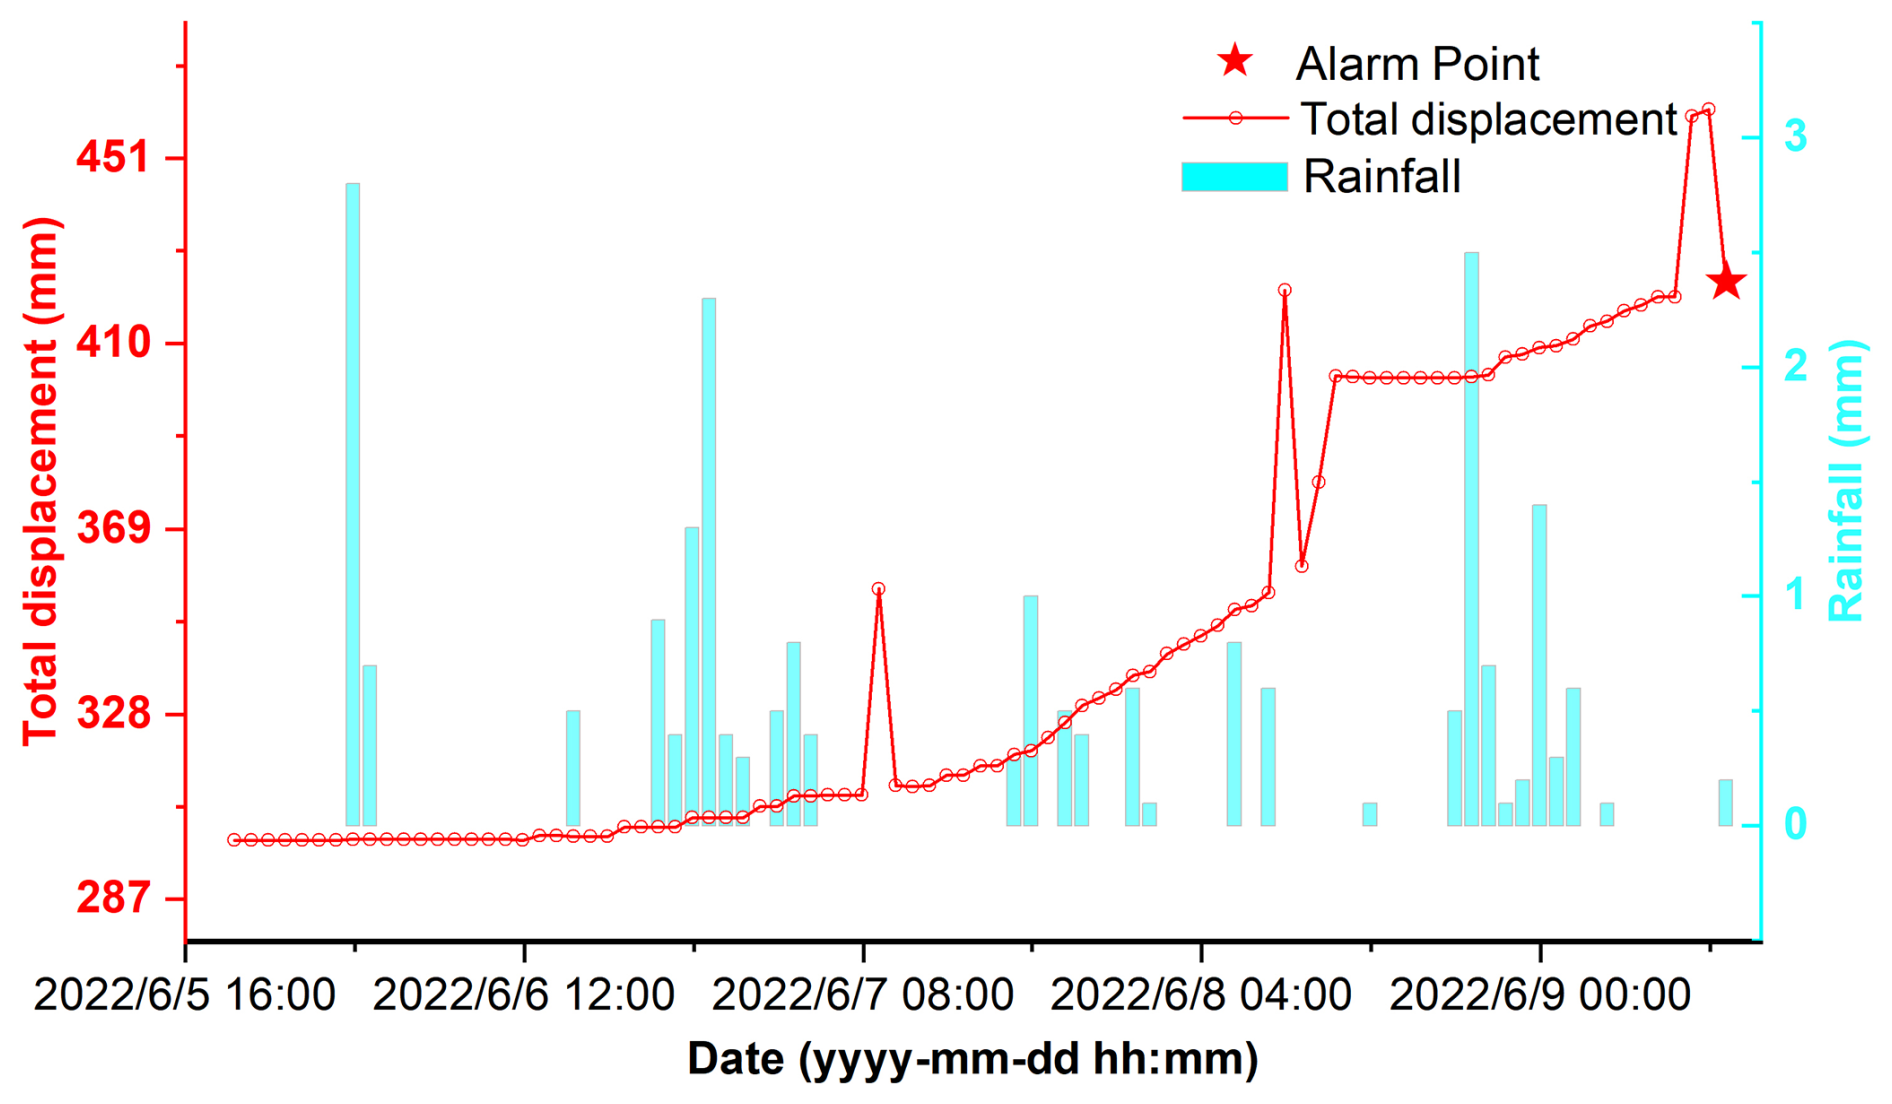
Figure 2True early Warning: Progressive fracture displacement patterns and cumulative rainfall impact mechanisms.
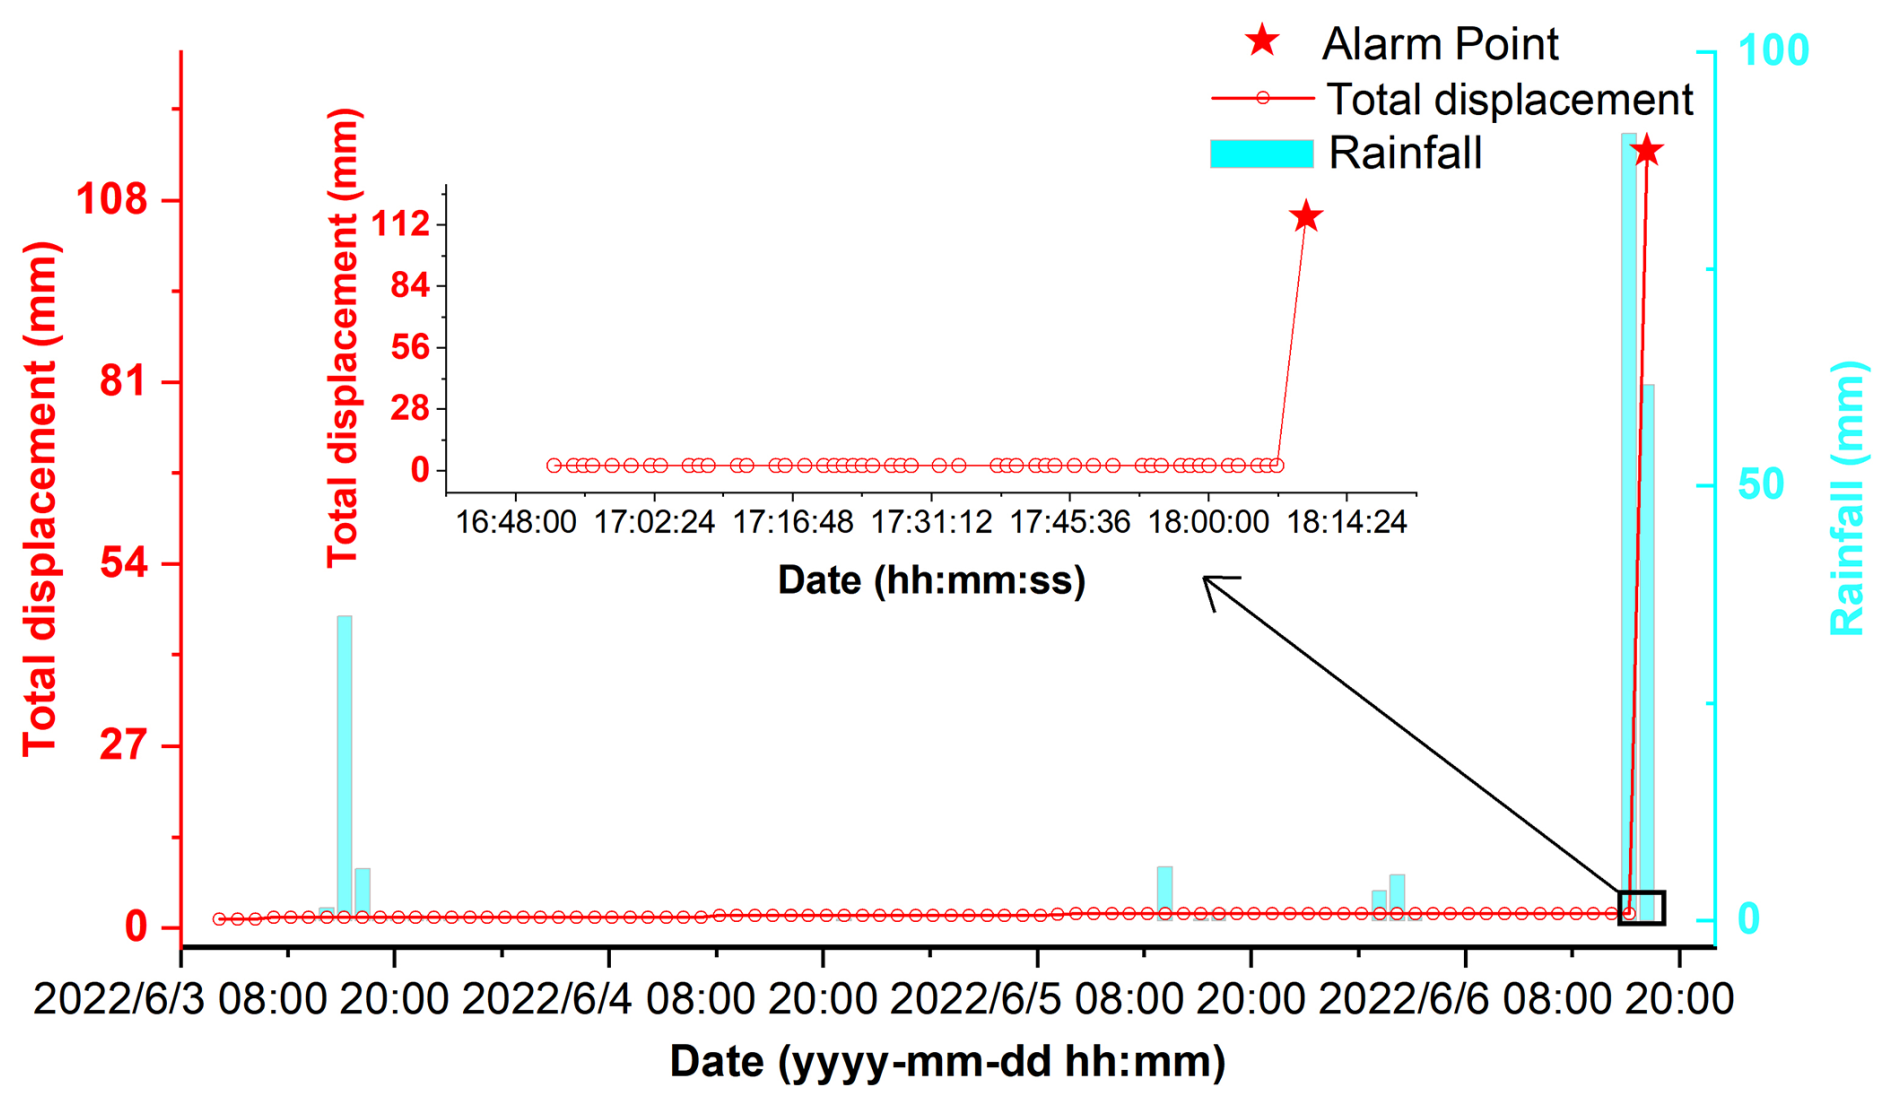
Figure 3True early Warning: Short-term landslide fracture displacement surge induced by torrential rainfall (dramatic change within 3 min).
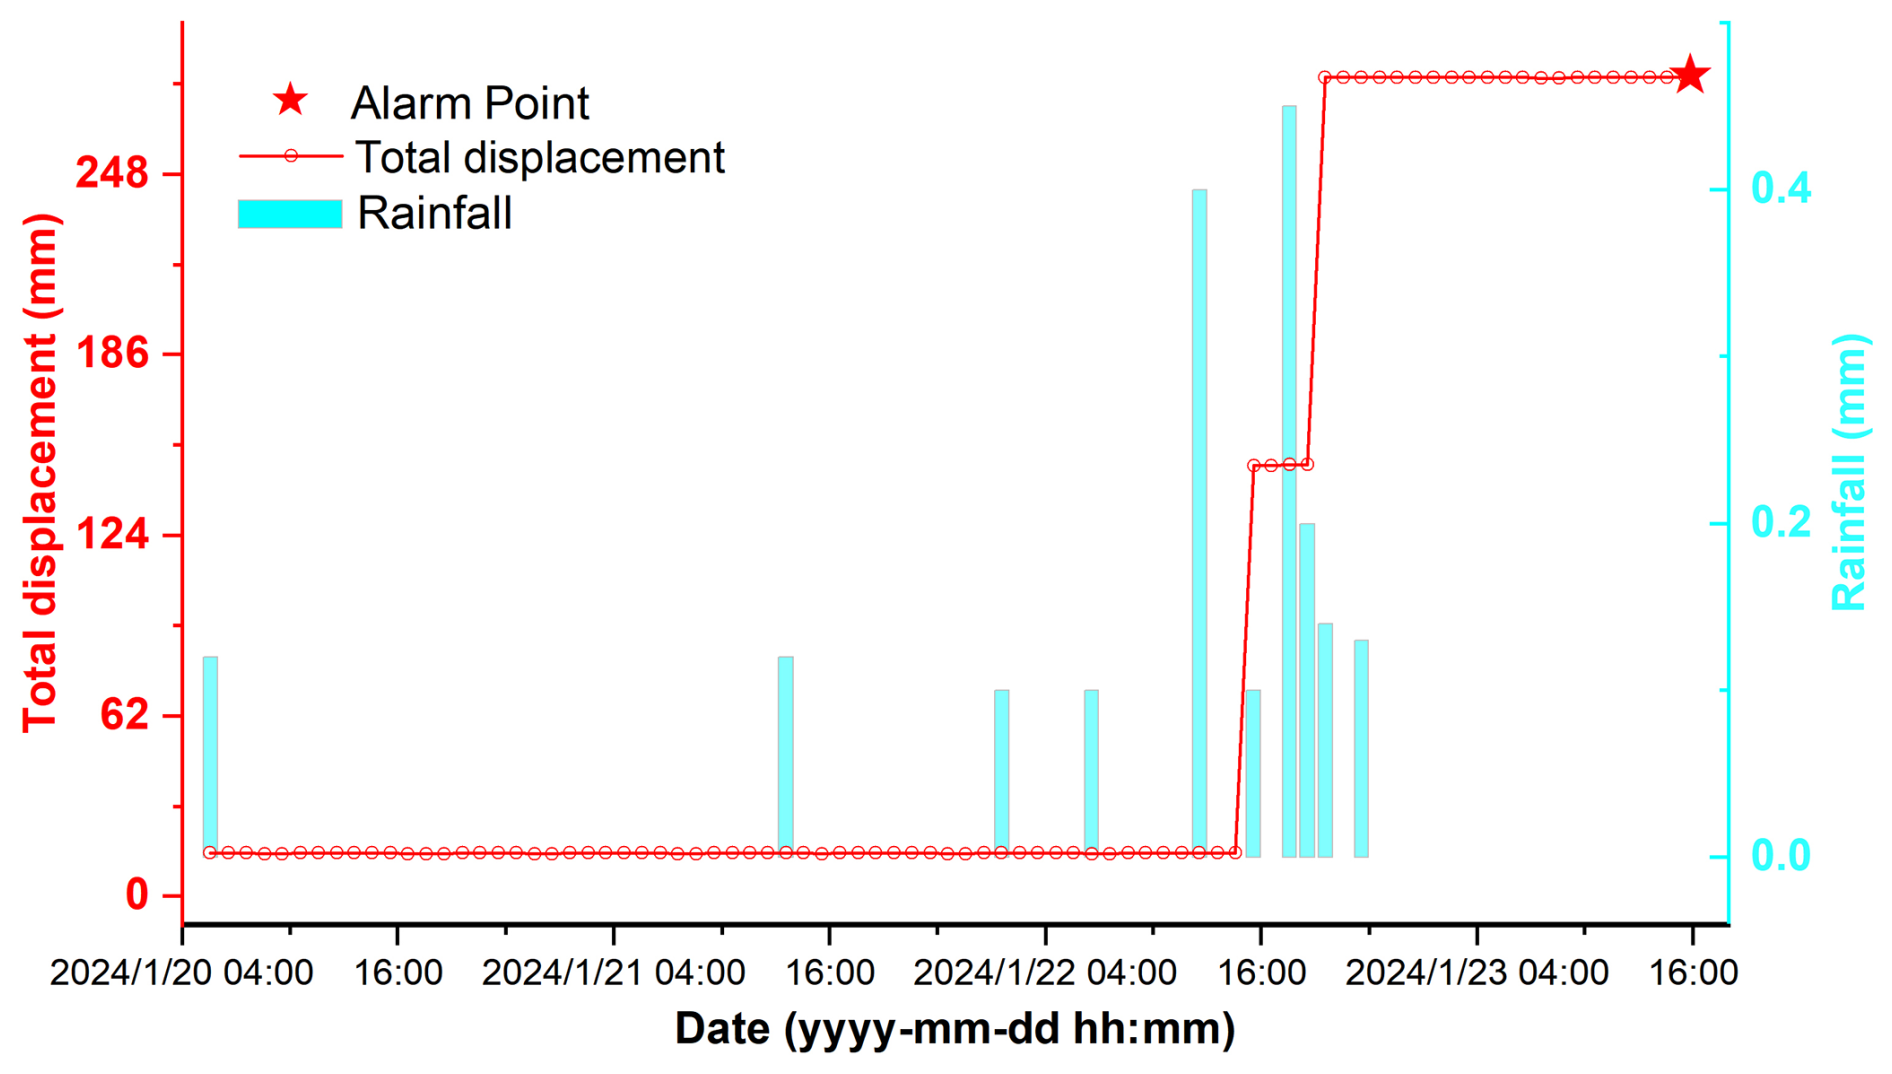
Figure 4Example of a false alert caused by an apparent threshold exceedance that was not validated as genuine rear-crack deformation. Possible causes of this type of response include instrumental anomalies, installation disturbance, and accidental contact by animals or humans.
Preliminary analysis of the confirmed true early warning data reveals that crack displacement typically exhibits two distinct characteristics: (1) a progressive upward trend over time, and (2) the discernible influence of antecedent cumulative rainfall prior to the observed displacement increase (e.g., Fig. 2). These patterns serve as critical indicators for human experts when determining warning accuracy. However, these characteristic signals are not always clearly discernible. True early warning records frequently contain anomalies within the fracture displacement data, such as abrupt noise spikes induced by equipment malfunctions (e.g., Fig. 2). A significantly more complex challenge arises from certain catastrophic events, particularly short-term, rapid landslides. These events can trigger a dramatic surge in crack displacement within minutes to an hour (e.g., Fig. 3). Critically, this abrupt change phenomenon often closely resembles data noise (e.g., Fig. 4), making differentiation based solely on displacement patterns highly problematic. In such instances, incorporating corresponding rainfall data becomes essential supplementary evidence for informed judgment. However, the currently employed threshold-based methods, which rely solely on predefined site-specific displacement thresholds, exhibit significant limitations: they often lack sensitivity to progressive displacement trends, fail to incorporate antecedent rainfall conditions, and struggle to reliably distinguish genuine deformation signals from noise, resulting in high false positive rates. By contrast, their key advantage lies in achieving a high recall rate, ensuring minimal missed detections of critical hazards. This inherent capability to capture essential events despite pervasive noise motivates our exploration of deep learning techniques that build upon the high-recall characteristic of threshold-based approaches. The ultimate goal is to substantially reduce false alarms while maintaining a comparable recall performance.
3.1 Problem Definition and Methodological Framework
The core objective of this study was to utilize historical crack displacement and synchronous rainfall data from integrated crack-rain gauges to assess, in real time, whether an alarm generated by the latest displacement measurement signified a genuine event or a false trigger. Here, the generated alarm explicitly referred to equipment warnings issued automatically by crackmeters using the predefined site-specific threshold method described earlier. Specifically, the task was formulated as a binary classification problem to determine whether the latest displacement observation the latest data point (x1) in the displacement time series, which triggered the device alert, represented a true early warning or a false alert. Exceedance of a crack-opening threshold did not necessarily indicate that slope failure was imminent or would ultimately occur. Nevertheless, because the monitored sites were predominantly small-scale landslides and localized collapses, genuine deformation could develop rapidly under continued or forecast rainfall. Thus, even a lower-level threshold exceedance could retain early-warning significance when it reflected actual rear-crack deformation. Accordingly, the threshold-triggered alerts were classified as follows.
Class 1 (true early warning) referred to an alert for which the recorded displacement change was subsequently confirmed by geological experts, based on professional assessment and field evidence, as genuine physical opening or displacement of the monitored rear tension crack associated with slope activity. A positive label did not require that complete slope failure subsequently occurred.
Class 0 (false alert) referred to an alert for which the apparent threshold exceedance was not confirmed as genuine and reliable deformation of the monitored rear tension crack. Such alerts mainly included abrupt data spikes, abnormal oscillations, sensor or communication malfunctions, accidental mechanical interference caused by animals or human contact, and other anomalous responses unrelated to actual rear-crack deformation.
The classification objective was therefore to reduce false alerts substantially while maintaining a high recall for genuine early warnings, thereby improving operational efficiency without compromising safety.
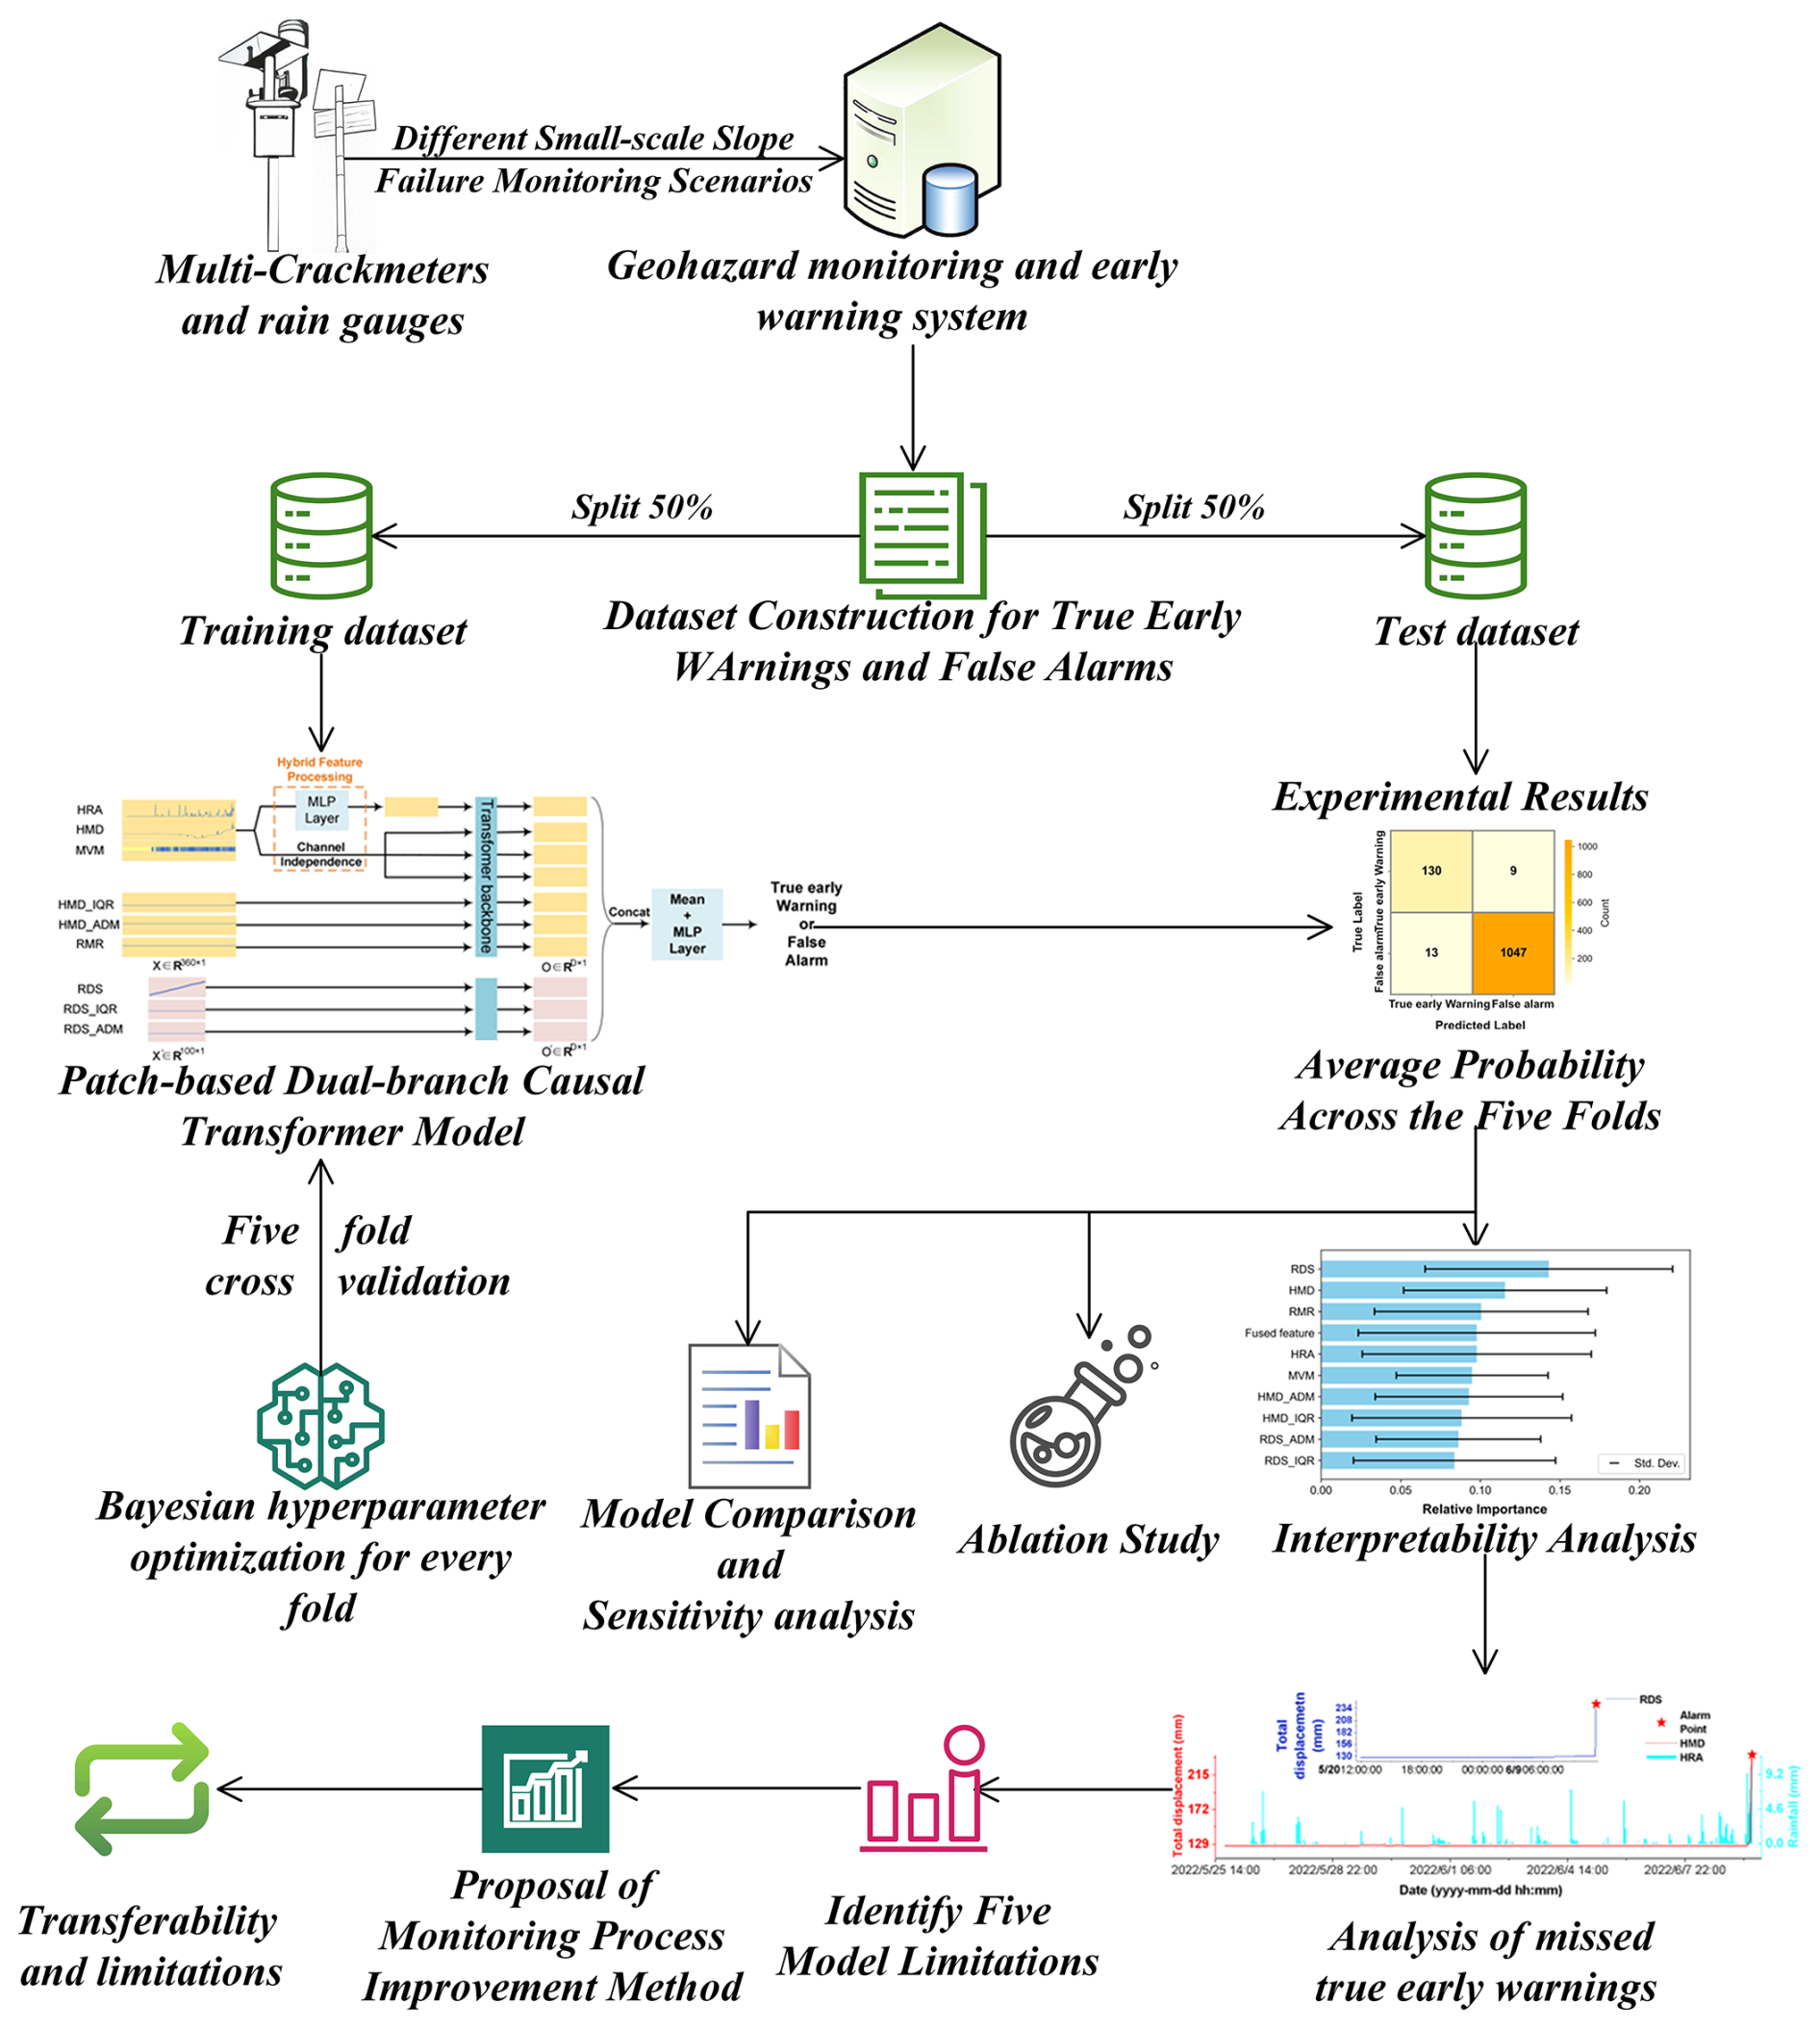
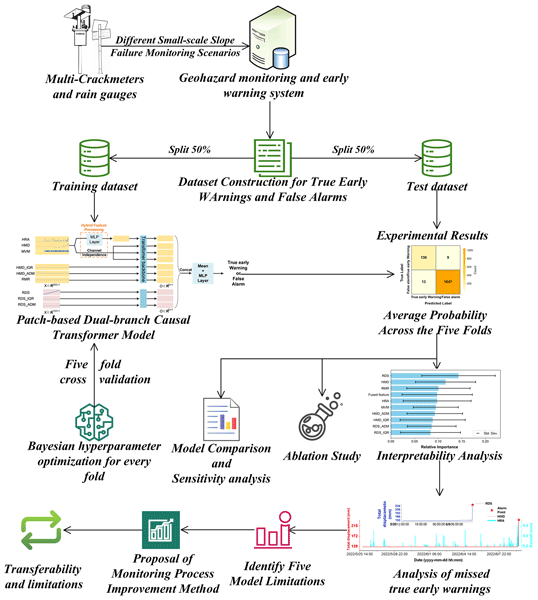
To provide a clear roadmap of this study, Fig. 5 depicts the comprehensive workflow, which is structured into four cohesive phases: (1) Data Preparation and Preprocessing, (2) Model Training and Evaluation, (3) Model Comparison, Sensitivity analysis and Ablation Study, and (4) Interpretability Analysis, Limitations Analysis, Workflow Enhancement and Transferability.
3.2 Dataset Construction
All data were obtained from 345 landslide or collapse masses, with 342 being small-scale slopes. Field investigations confirmed rainfall as the dominant trigger, with 105 identified masses exhibiting thicknesses below 2 m, accounting for 30 % of the total. The data collection and processing procedures consisted of two categories: (1) displacement data from crackmeters, and (2) rainfall data from rain-intensity gauges.
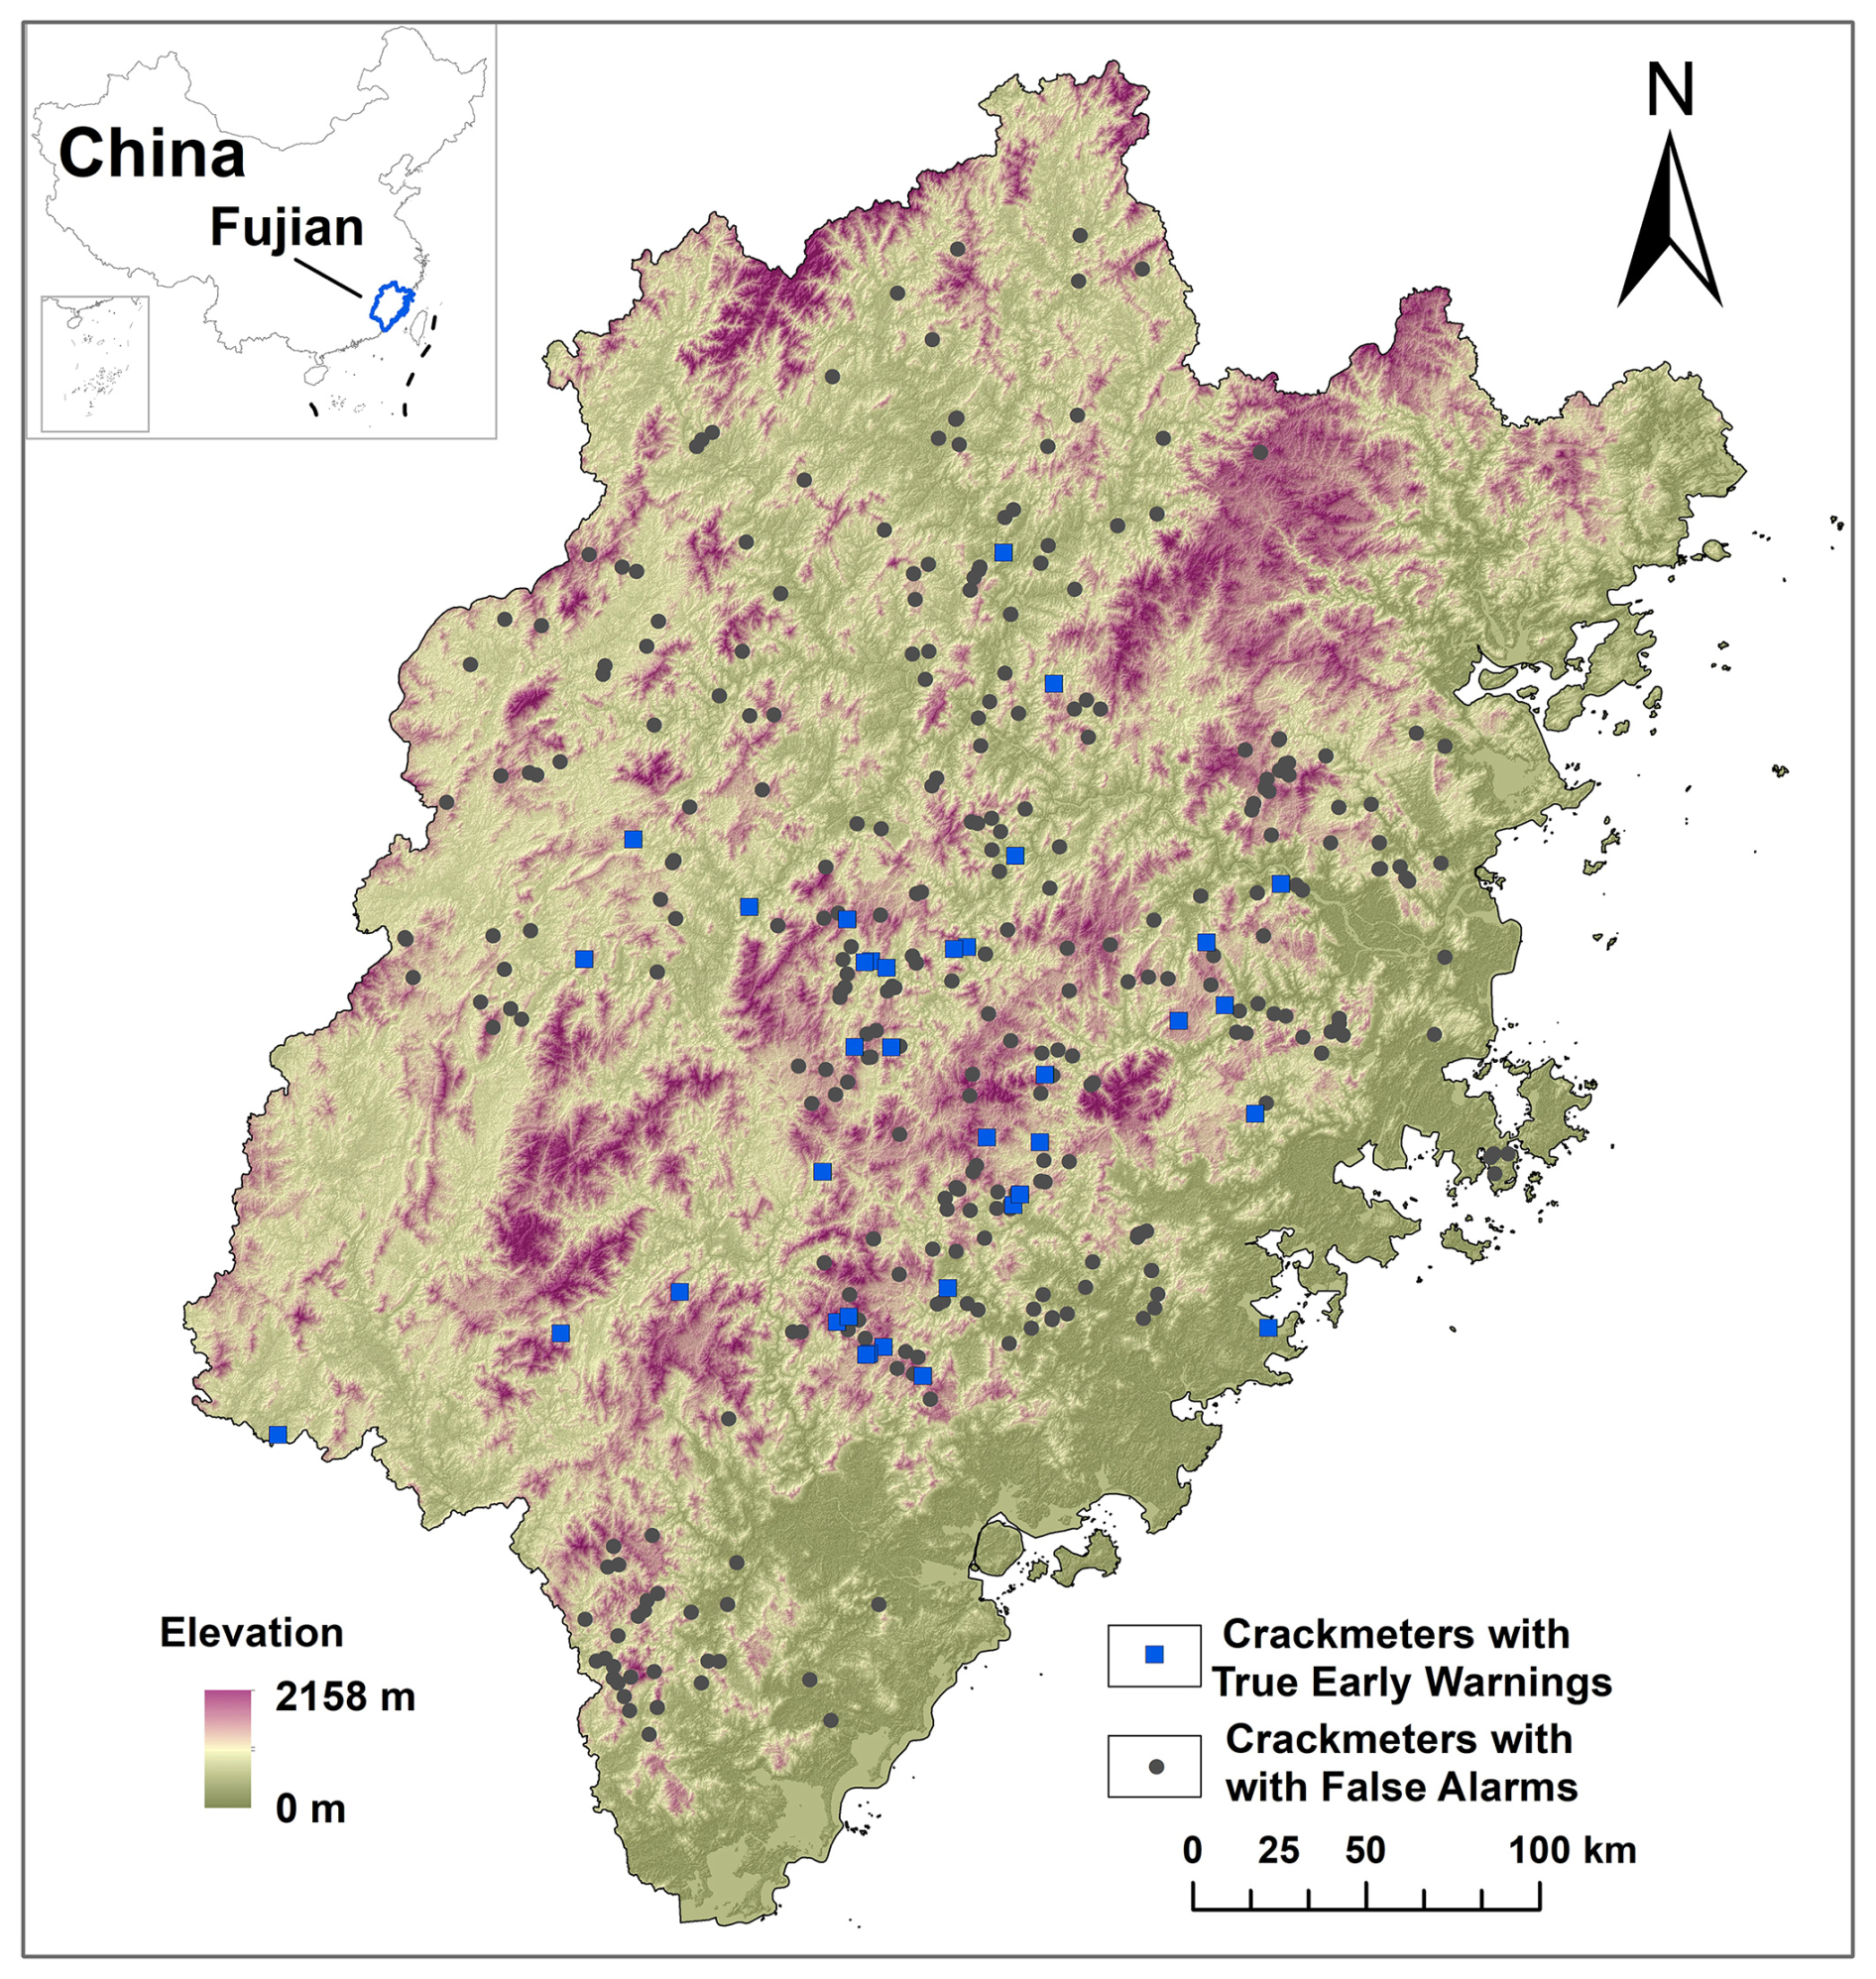
Figure 6Crackmeters Spatial Distribution Map.
(1) Displacement Data
Displacement data were collected from 429 crackmeters deployed across Fujian Province, covering the period from 2021 to 2024 (Fig. 6). These crackmeters featured a measurement resolution of 0.1 mm. Data acquisition employed a variable frequency sampling strategy, with the maximum sampling rate reaching 1 Hz. The sampling frequency was typically elevated automatically during intense rainfall events or upon detection of significant displacement changes. From this continuous monitoring dataset, 380 sensors yielded a large pool of 2142 false alarm instances. Candidate sensors and dates were randomly selected from a list supplied by the data provider, and the corresponding records were included when available in the restricted archive. Conversely, 82 true early warning instances from 52 sensors, some of which contributed to both classes, were strictly confirmed through rigorous on-site field verification. Because this initial quantity was insufficient for robust deep learning model training, and given that device-generated warnings were triggered deterministically by predefined site-specific thresholds (e.g., a displacement change from 50 to 55 mm generating a new warning), data points temporally adjacent to these confirmed events were treated as potential true warnings. Approximately 190 temporally adjacent candidates were initially selected through qualitative visual screening to exclude obvious noise. After review by three geological experts, 173 candidates identified as genuine crack-opening responses were retained. This procedure successfully increased the total number of field-validated true early warning instances to 255, demonstrating high label reliability. Furthermore, to address potential concerns regarding temporal leakage among these highly correlated adjacent samples, all data originating from the same sensor or specific geological event were strictly grouped into either the training or the testing set. This sensor-level isolation prevented highly correlated adjacent segments from cross-contaminating the evaluation phase, thereby preventing sensor-level leakage between the specified partitions.
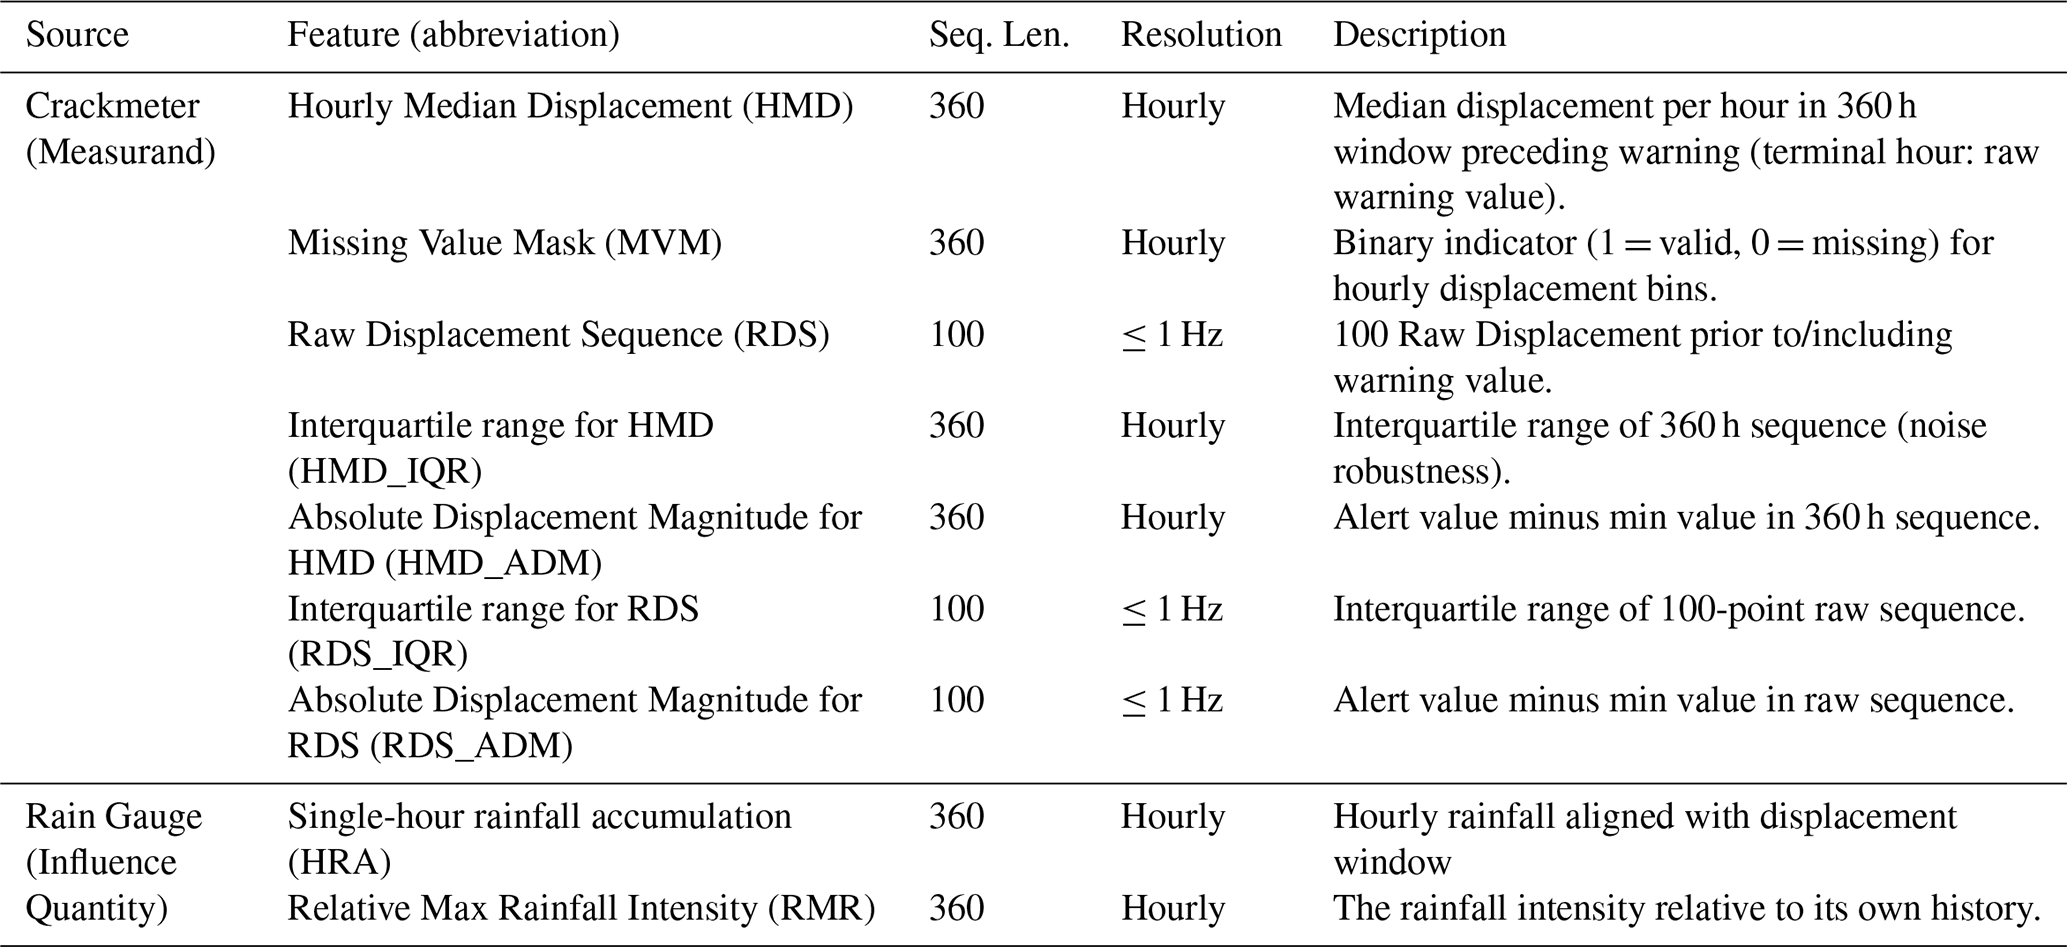
The raw displacement data from crackmeters were processed into the following seven distinct features (Table 3):
Hourly Median Displacement. Previous studies have demonstrated that antecedent rainfall and delayed slope responses may extend over several days to just over a week, although the relevant timescale varies among sites (Dahal and Hasegawa, 2008; Dou et al., 2024; Lee et al., 2021). Such variability is controlled by geomaterial properties, permeability, drainage conditions, antecedent moisture, failure depth, and failure mechanism. Therefore, this study did not assume a universal rainfall-response period. Instead, a 360 h retrospective window preceding each device alert was adopted as a fixed operational input interval. The 15 d duration was selected to encompass the multi-day rainfall effects reported in previous studies while providing additional coverage for delayed responses across heterogeneous monitoring sites. Longer windows of 30 or 60 d were not used because they may include rainfall episodes less directly related to the current alert and dilute the recent rainfall– displacement relationship. Thus, the 15 d window represents a pragmatic modelling choice rather than a universally optimal hydrological response period. To reduce high-frequency noise in the displacement data and ensure temporal alignment with hourly rainfall measurements, the median displacement was calculated for each hourly interval within this window, excluding the final hour. For the terminal hour (the hour containing the warning), the raw sensor-generated warning value was retained instead of the median to preserve the temporal immediacy and raw signal characteristics essential for accurate warning validation. If no valid displacement data existed within a specific hour, the gap was forward-filled using the median value from the most recent preceding valid hourly interval. Furthermore, it was recognized that not all sensors provided continuous data coverage for the full 360 h window; therefore, leading missing segments were filled with the earliest available valid measurement from the respective sensor until the sequence length reached 360 h. Finally, all resulting 360 h displacement sequences underwent mean-centred range normalization prior to being input into the model. To avoid artificial stationarity or signal suppression introduced by backfilling, this work combined explicit uncertainty masking with architectural decoupling. The Missing Value Mask explicitly flagged imputed segments, preventing misinterpretation of flat backfilled intervals as slope stability. Concurrently, the High-Resolution branch preserved raw, non-interpolated displacement data intact. Last-valid-measurement backfilling served only for temporal alignment and never contaminated the high-resolution signal path. Detailed descriptions of these features were provided in the subsequent sections.
Missing Value Mask. A complementary binary mask was generated corresponding directly to the Hourly Median Displacement sequence. This mask indicated data presence (1) or absence (0) for each hourly bin, thereby informing the model where imputed values occurred and potentially aiding its interpretation.
Raw Displacement Sequence. Progressive deformation characteristics are critical for early warning within this sub-hourly timeframe. To preserve this detailed displacement information immediately preceding sensor-triggered alerts, a sequence of 100 consecutive high-resolution raw measurements immediately prior to (and including) the warning displacement value was adopted. Depending on the adaptive sampling frequency, these 100 observations typically covered about 100 min but could represent a shorter or longer period at higher or lower sampling frequencies, respectively. All raw data in this sequence underwent mean-centred range normalization prior to being used.
The interquartile range and the absolute displacement magnitude (four statistical features). To reintroduce valuable physical scale information that was obscured by the prior normalization steps, four statistical features were derived from each input sequence. For the hourly median displacement sequence, these included: (1) the interquartile range (IQR), which mitigated sensitivity to extreme noise values, and (2) the absolute displacement magnitude, calculated as the alert value minus the minimum value within the sequence. Analogous features – IQR and absolute displacement magnitude – were similarly extracted from the high-resolution raw displacement sequence. Each of the four derived statistical features was subsequently normalized using its corresponding maximum value, calculated exclusively from the training subset of each cross-validation fold. To ensure compatibility with the model input format, each normalized statistical feature was replicated to match the length of its corresponding input sequence (360 values for features related to hourly medians; 100 values for raw displacements).
(2) Rainfall Data
Regarding rainfall data, measurements were predominantly obtained from rain gauges installed in proximity to crackmeters. These rain gauges have a measurement resolution of 0.1 mm. The predominant sampling frequency is hourly, although a small proportion of datasets record at sub-hourly intervals. Rainfall data were processed into the following two features:
Single-hour rainfall accumulation. Rainfall values were summed or extracted according to the time period represented by each Hourly Median Displacement value. Before use, the data were subjected to sample-wise maximum normalization.
Relative Maximum Rainfall Intensity. After normalization, the original rainfall data lost its absolute physical meaning, thereby making direct comparisons of rainfall amounts between different regions difficult. Furthermore, evidence suggests that the risk of geological disasters may be significantly higher if the rainfall intensity is substantially increased relative to their own historical levels (Li et al., 2025).
Therefore, to characterize the maximum rainfall intensity for each region within the observational temporal window relative to the historical rainfall conditions of the corresponding region, the following key steps were implemented:
- A.
For each rain gauge time series comprising 360 data points, the maximum value was extracted (Single-hour rainfall_max_i).
- B.
The average annual rainfall (Annual rainfall_i) for the preceding five years for the region corresponding to the individual rain gauge was extracted. These annual rainfall data were calculated based on the high-resolution 1 km monthly precipitation dataset for China (1901–2024), which is provided by National Tibetan Plateau Data Center (https://data.tpdc.ac.cn/zh-hans/data/faae7605-a0f2-4d18-b28f-5cee413766a2/, last access: 7 February 2025) (Peng et al., 2019).
- C.
For each sample, a preliminary relative rainfall index was calculated as Single-hour rainfall_max_i/Annual rainfall_i.
- D.
The preliminary relative rainfall index was normalized using its maximum value calculated from the training subset of each cross-validation fold. The core formula is defined as follows:
Following the aforementioned calculation, Relative Maximum Rainfall Intensity was defined as a dimensionless index characterizing the extremity of the maximum hourly rainfall relative to the local historical rainfall background. The maximum hourly rainfall within each observation window was scaled by the corresponding regional average annual rainfall, thereby emphasizing rainfall anomalies relative to local climatic conditions rather than absolute rainfall magnitude. To ensure compatibility with the model input format, the derived statistical value was expanded into a 360-point sequence by replicating its value, thereby aligning it with the temporal resolution of the single-hour rainfall accumulation data.
4.1 Measurement Data Processing Framework
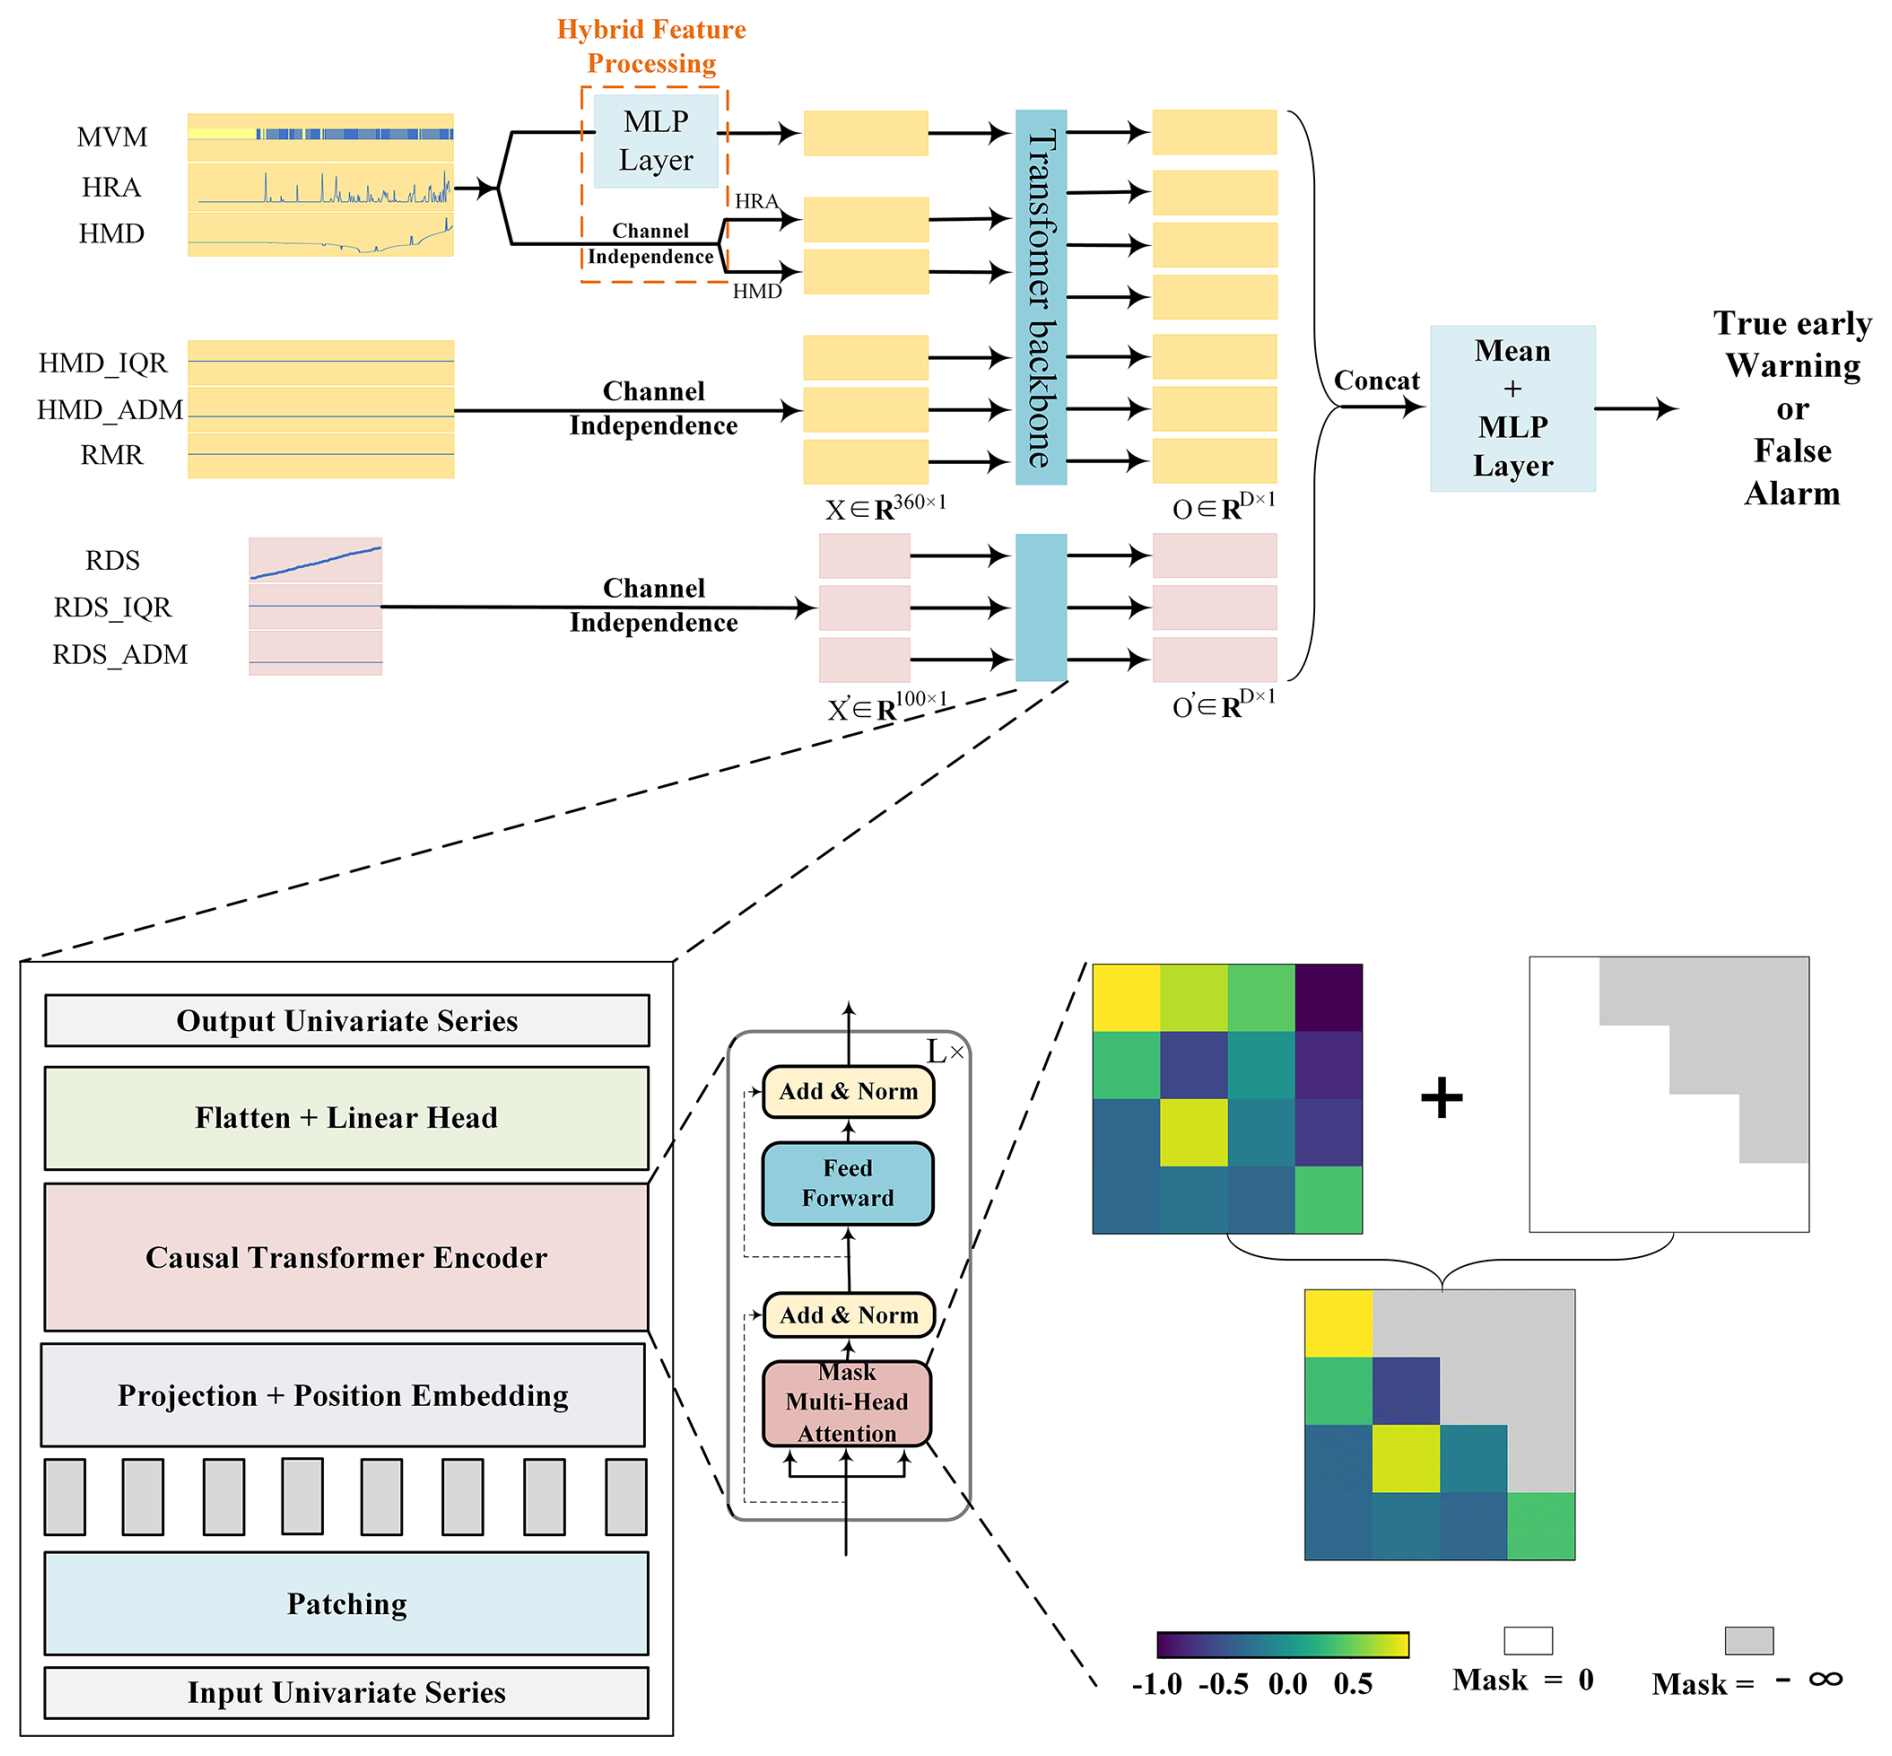
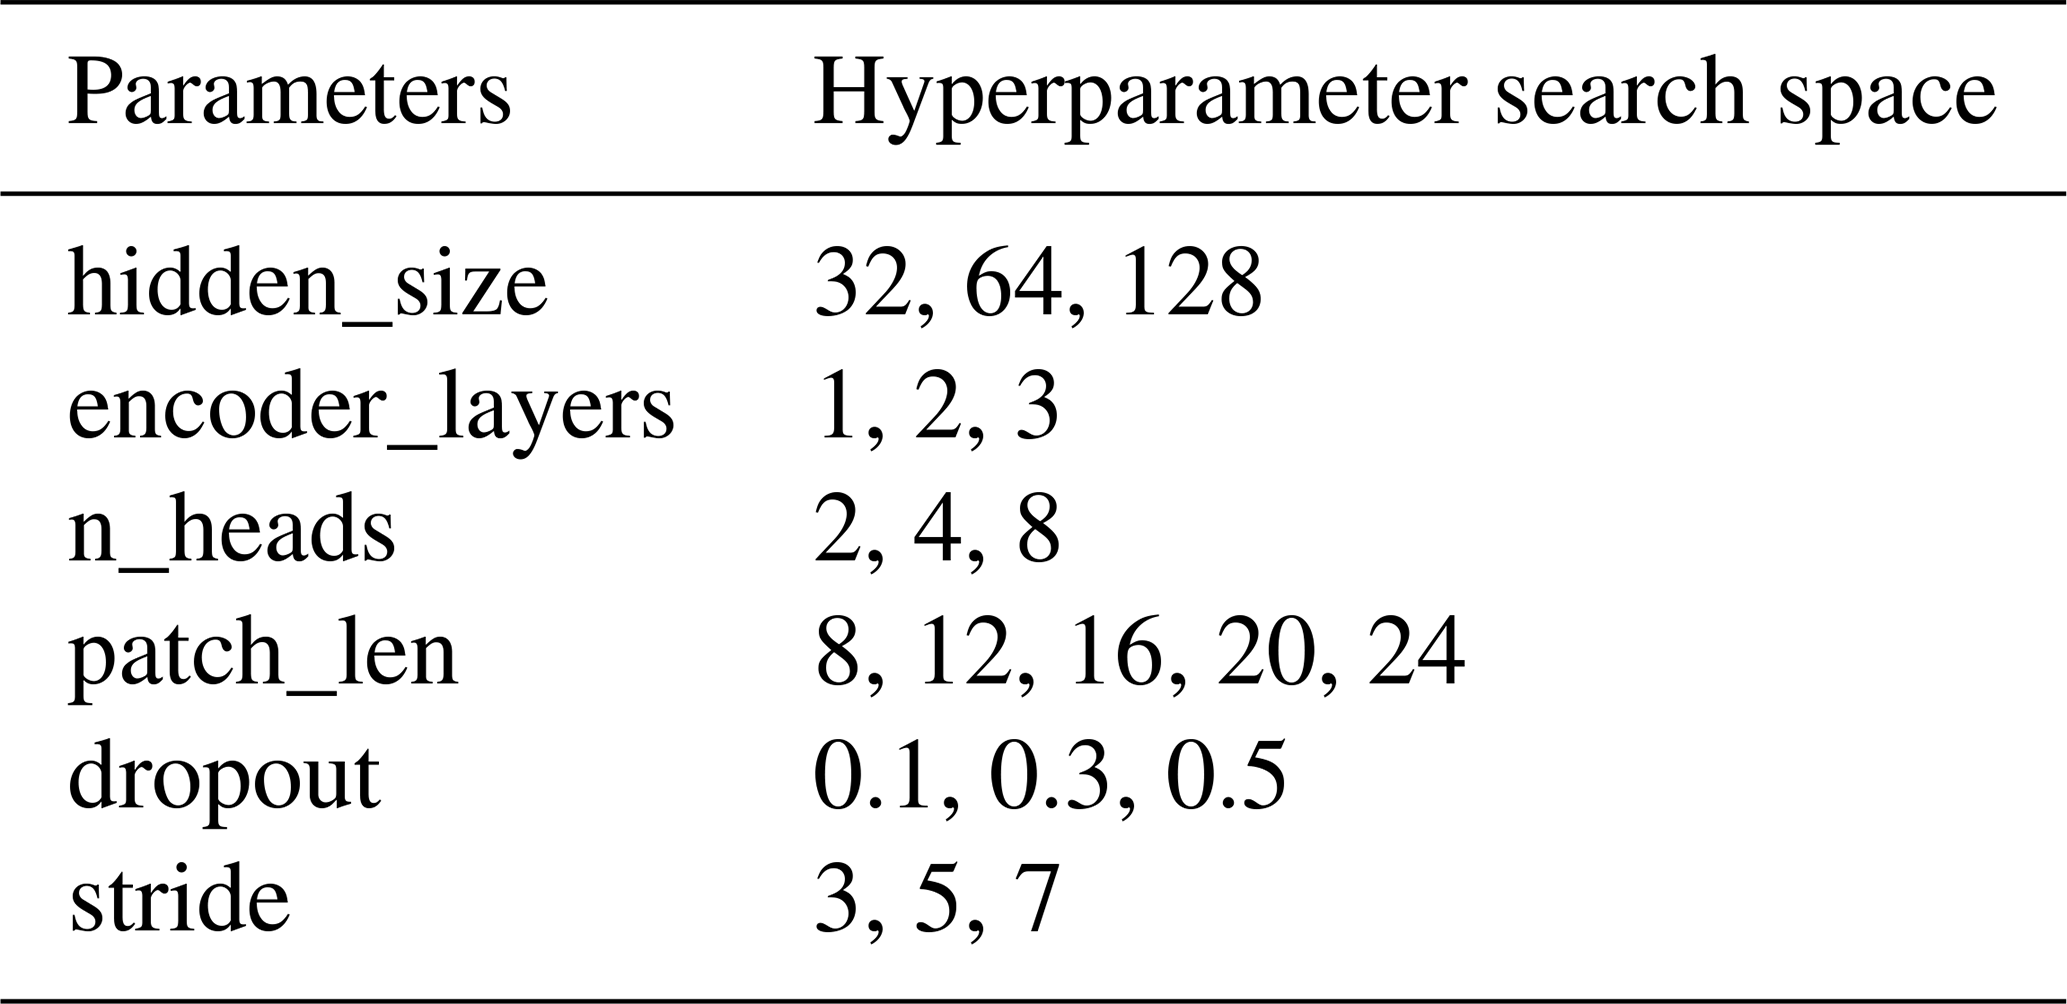
The proposed model employed a dual-branch architecture and leveraged a modified PatchTST structure to address the multi-rate sampling challenge (PatchDC, Fig. 7). The first branch, termed the Long-Term Rainfall-Displacement Modeling Branch, was designed to capture displacement trends and the impact of rainfall on displacement magnitude at relatively long 15 d scales with an hourly resolution. The second branch, the High-Resolution Crack Displacement Branch, was tasked with capturing very fine-grained minute to second-resolution displacement trends directly from raw sensor data. The fused features extracted from both branches were subsequently fed into a classification module to determine the warning category. All hyperparameters of the model were optimized via Bayesian inference. The specific hyperparameters and their optimized values are detailed in Table 4.
(1) Long-Term Rainfall-Displacement Modeling Branch
Its input comprised six features: HMD, MVM, HRA, HMD_IQR, HMD_ADM, RMR (Table 3). The module architecture primarily consisted of a Hybrid Feature Processing module followed by a Transformer Backbone, with technical specifications that were detailed below.
Hybrid Feature Processing. Unlike the original PatchTST model's strict channel-independent processing approach, which treated each time series variable separately while ignoring explicit correlations between variables, this study adopted a simplified correlation strategy specifically between rainfall and displacement. Specifically, three correlated bands (“HRA”, “HMD”, “MVM”) were jointly processed through a shared multilayer perceptron layer (MLP): an initial linear transformation along the channel dimension was followed by rectified linear unit (ReLU) and linear projection, which generated a fused feature representation that captured rainfall-displacement interactions. This integrated feature representation was subsequently combined with the independently processed HRA and HMD features, while MVM was excluded from the single-feature inputs and used only for feature fusion, thereby preserving the model's capacity for univariate pattern recognition () while enhancing its ability to model cross-variable temporal correlations.
Transformer Backbone (Fig. 7). Based on these components, this study further incorporated them into the transformer backbone of the PatchTST method by replacing the bidirectional self-attention with masked self-attention (Vaswani et al., 2017). A crucial modification ensured temporal ordering by architecturally constraining patch attention to historical contexts only, thereby physically respecting the precedence of precursor events (e.g., rainfall) over target phenomena (e.g., landslide displacement) in classification tasks. The transformer backbone of PatchTST and its specific architecture are illustrated in Fig. 7. The core process involved segmenting each univariate time series into patches, followed by temporal feature learning through transformer modules, with a detailed description described below.
A. Patching and Projection. Given a univariate time series taken from one component, a sliding window partitioned X into N overlapping patches:
where P (patch_len, Table 4) denoted patch length, S (stride, Table 4) was the sliding stride, and . The patches were linearly projected into a latent space , where D (hidden_size, Table 4) was the Bayesian-optimized hidden dimension.
B. Positional Embedding. Learnable positional embeddings were element-wise added to the latent space Ep to form representation Zp, enabling the model to explicitly capture the temporal ordering of rainfall and displacement patches.
C. Temporally-aware Transformer Encoder. The encoder stack consisted of L identical layers (encoder_layers, Table 4), each of which implemented a masked multi-head attention mechanism. For each attention head (n_heads, Table 4), the input sequence Zp underwent three linear transformations to generate:
Subsequently, a lower-triangular mask matrix M was added to the scaled attention-score matrix before softmax to enforce temporal ordering. The mask M and the masked self-attention output for each head (headh) were computed as:
The outputs of all attention heads were subsequently processed through a feature transformation block, which consisted of layer normalization, residual connections, and a position-wise feedforward network (FFN). The FFN was composed of two linear layers with a Gaussian Error Linear Unit (GELU) activation function in between. The final output of this block constituted the embeddings of the Temporally-aware Transformer Encoder.
D. Flatten and Linear Head. The encoder embedding results were flattened and projected via a linear head to produce output of univariate series .
(2) High-Resolution Crack Displacement Branch
This high-resolution branch was specifically designed to overcome the primary branch's limitation in detecting sub-hourly variations by processing raw crack displacement signals at their native temporal granularity. Its input comprised three features: RDS, RDS_IQR, RDS_ADM (). It employed the identical Transformer backbone architecture with masked self-attention as described for the primary branch.
(3) Multiscale Feature Fusion Framework
The outputs from both branches were concatenated, followed by dropout regularization (dropout, Table 4) to mitigate overfitting. A mean operation was then performed along the final feature dimension for dimensionality reduction. A fully connected layer then produced two class logits, which were passed directly to the weighted cross-entropy loss; softmax was applied only during inference to obtain class probabilities.
4.2 Training Strategy, Environment and Parameters
Model training employed a five-fold cross-validation strategy. To ensure optimal performance for each fold, Bayesian hyperparameter optimization was independently conducted for every fold using the training data. The optimization utilized the Optuna 3 framework with the Tree-structured Parzen Estimator (TPE) as the sampler. Thirty optimization trials were executed on the training set of each fold, with the validation set F2-score serving as the optimization objective to align with the goal of enhancing recall for true early warnings. The hyperparameter search space for key parameters is detailed in Table 4. Additionally, the learning rate was uniformly sampled in logarithmic space within the range of 1 × 10⁻³ to 1 × 10⁻². The batch size was fixed at 100. To address class imbalance, the positive-class weight in the loss function was calculated separately for each cross-validation fold as the ratio of negative to positive samples in that fold's training subset. This data-driven weighting strategy ensured that the model did not become biased toward the majority class (false alarms), thereby preserving its sensitivity to the rare but critical true early warnings and minimizing the risk of missed detections. Models were trained using the cross-entropy loss function for a maximum of 200 epochs per fold. An early stopping strategy was implemented which monitored the validation set F2-score; training was halted if no improvement greater than Δ = 0.001 was observed for 40 consecutive epochs (patience = 40). All training was performed on an NVIDIA GeForce RTX 3090 GPU (24 GB VRAM) running the Ubuntu 24.04.1 LTS operating system. During the final test phase, the posterior probabilities for the “true early warning” class output by the five independent models (from the five folds) were arithmetically averaged. Test samples were then classified as “true early warning” if this average probability was ≥ 0.5; otherwise, they were classified as “false alarm”. The entire process of training and testing on the five folds was run five separate times with different random seeds to validate the reproducibility and stability of the model's accuracy.
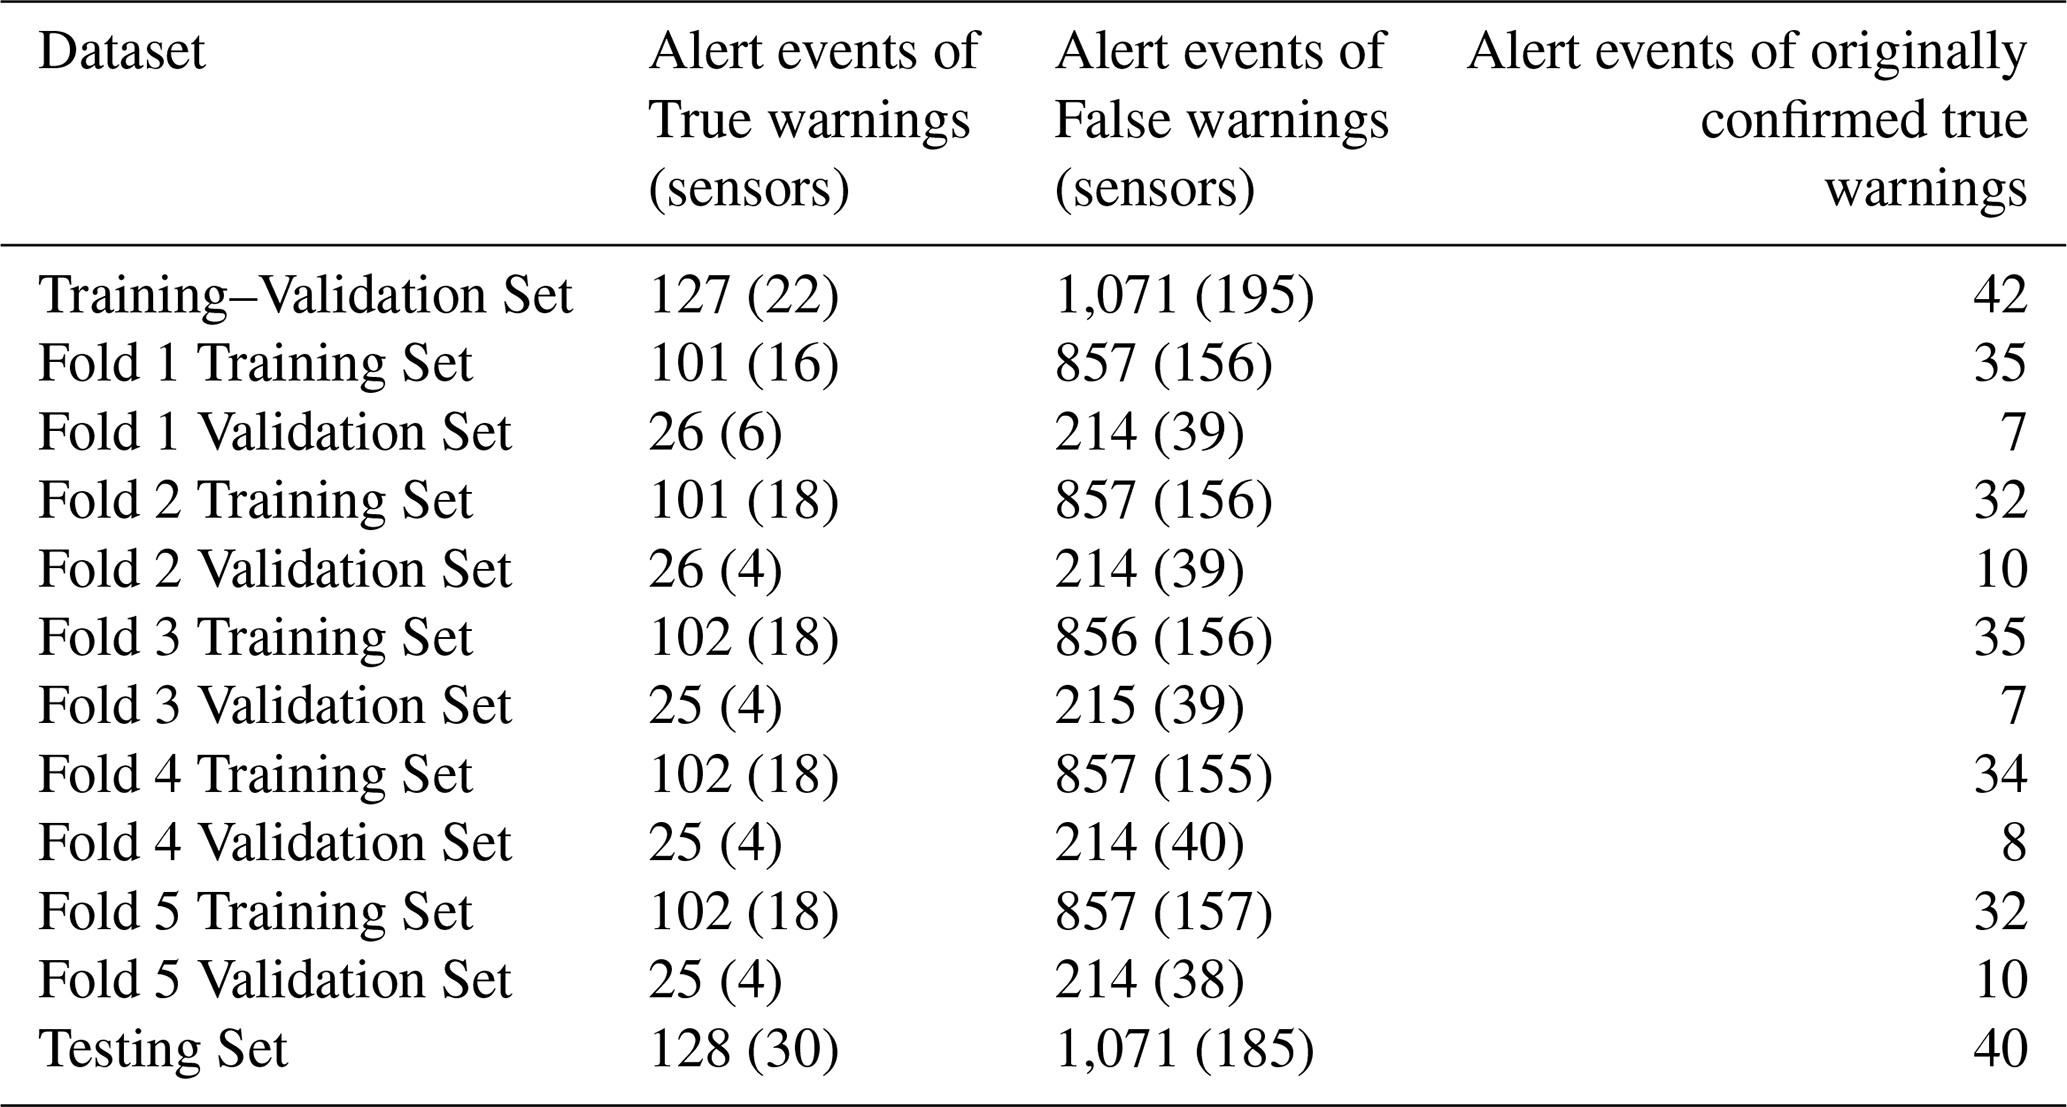
The dataset was split into training-validation and test sets via random sampling, with an approximate ratio of 1:1. All samples, including both true and false alerts, originating from the same sensor were assigned exclusively to either the training–validation set or the test set. Sensors, rather than individual alarm samples or events, were randomly assigned to the two sets, thereby preventing sensor-level data leakage. The same sensor-level isolation constraint was applied to the five-fold cross-validation procedure within the training–validation set, ensuring that, in each fold, no sensor appeared in both the training and validation subsets. Detailed splitting results, including counts per set, are provided in Table 5.
4.3 Evaluation Criteria for Measurement Reliability
In the context of geological safety monitoring, standard classification accuracy is insufficient. We adopt specific metrics to quantify the reliability and trustworthiness of the measurement system:
- 1.
Recall (Recall for the true warning class): This is the most critical metric for safety, measuring the system's ability to correctly identify all genuine slope deformation events (avoiding missed alarms).
- 2.
Precision (Signal Validity): Precision quantifies the proportion of model-issued warnings that correspond to genuine deformation and therefore reflects the operational burden associated with false alerts. High precision implies that when the system issues a warning, it is highly likely to be physically significant, thereby reducing operator fatigue from nuisance alarms.
- 3.
F2-score: A composite metric that weighs Recall higher than Precision, aligning with the “safety-first” principle of geological instrumentation.
- 4.
AUPR (Area Under the Precision-Recall Curve): Used to evaluate the stability of the measurement validation across different decision thresholds, particularly suitable for imbalanced datasets where true warnings are rare events.
Table 6Definition of the handcrafted rainfall–displacement predictors used by the conventional machine-learning baselines.
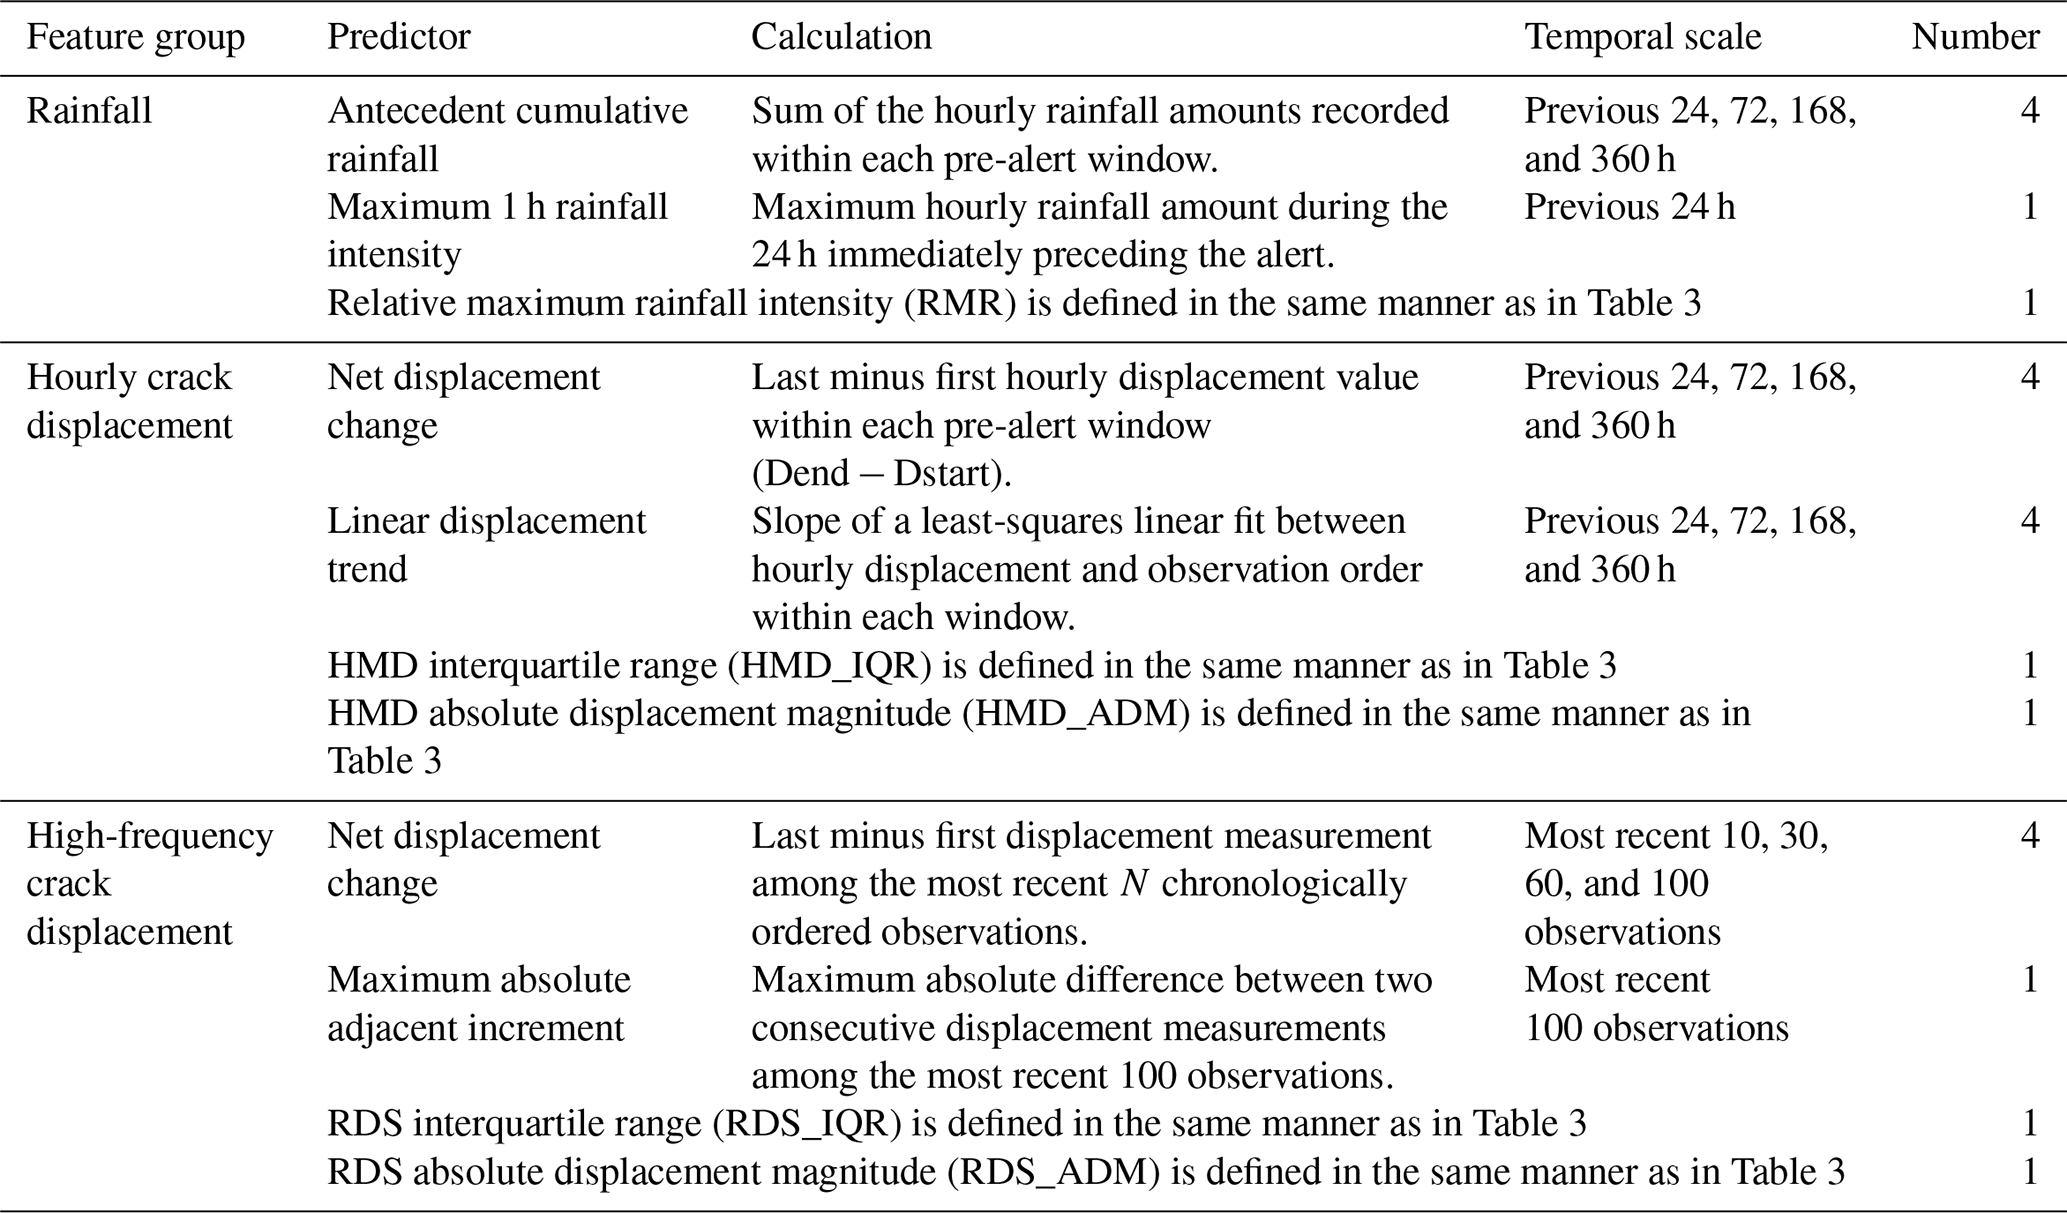
Table 7Accuracy results and hyperparameter search spaces of the evaluated models. The bold values indicate the highest value achieved for each evaluation metric among the compared methods.
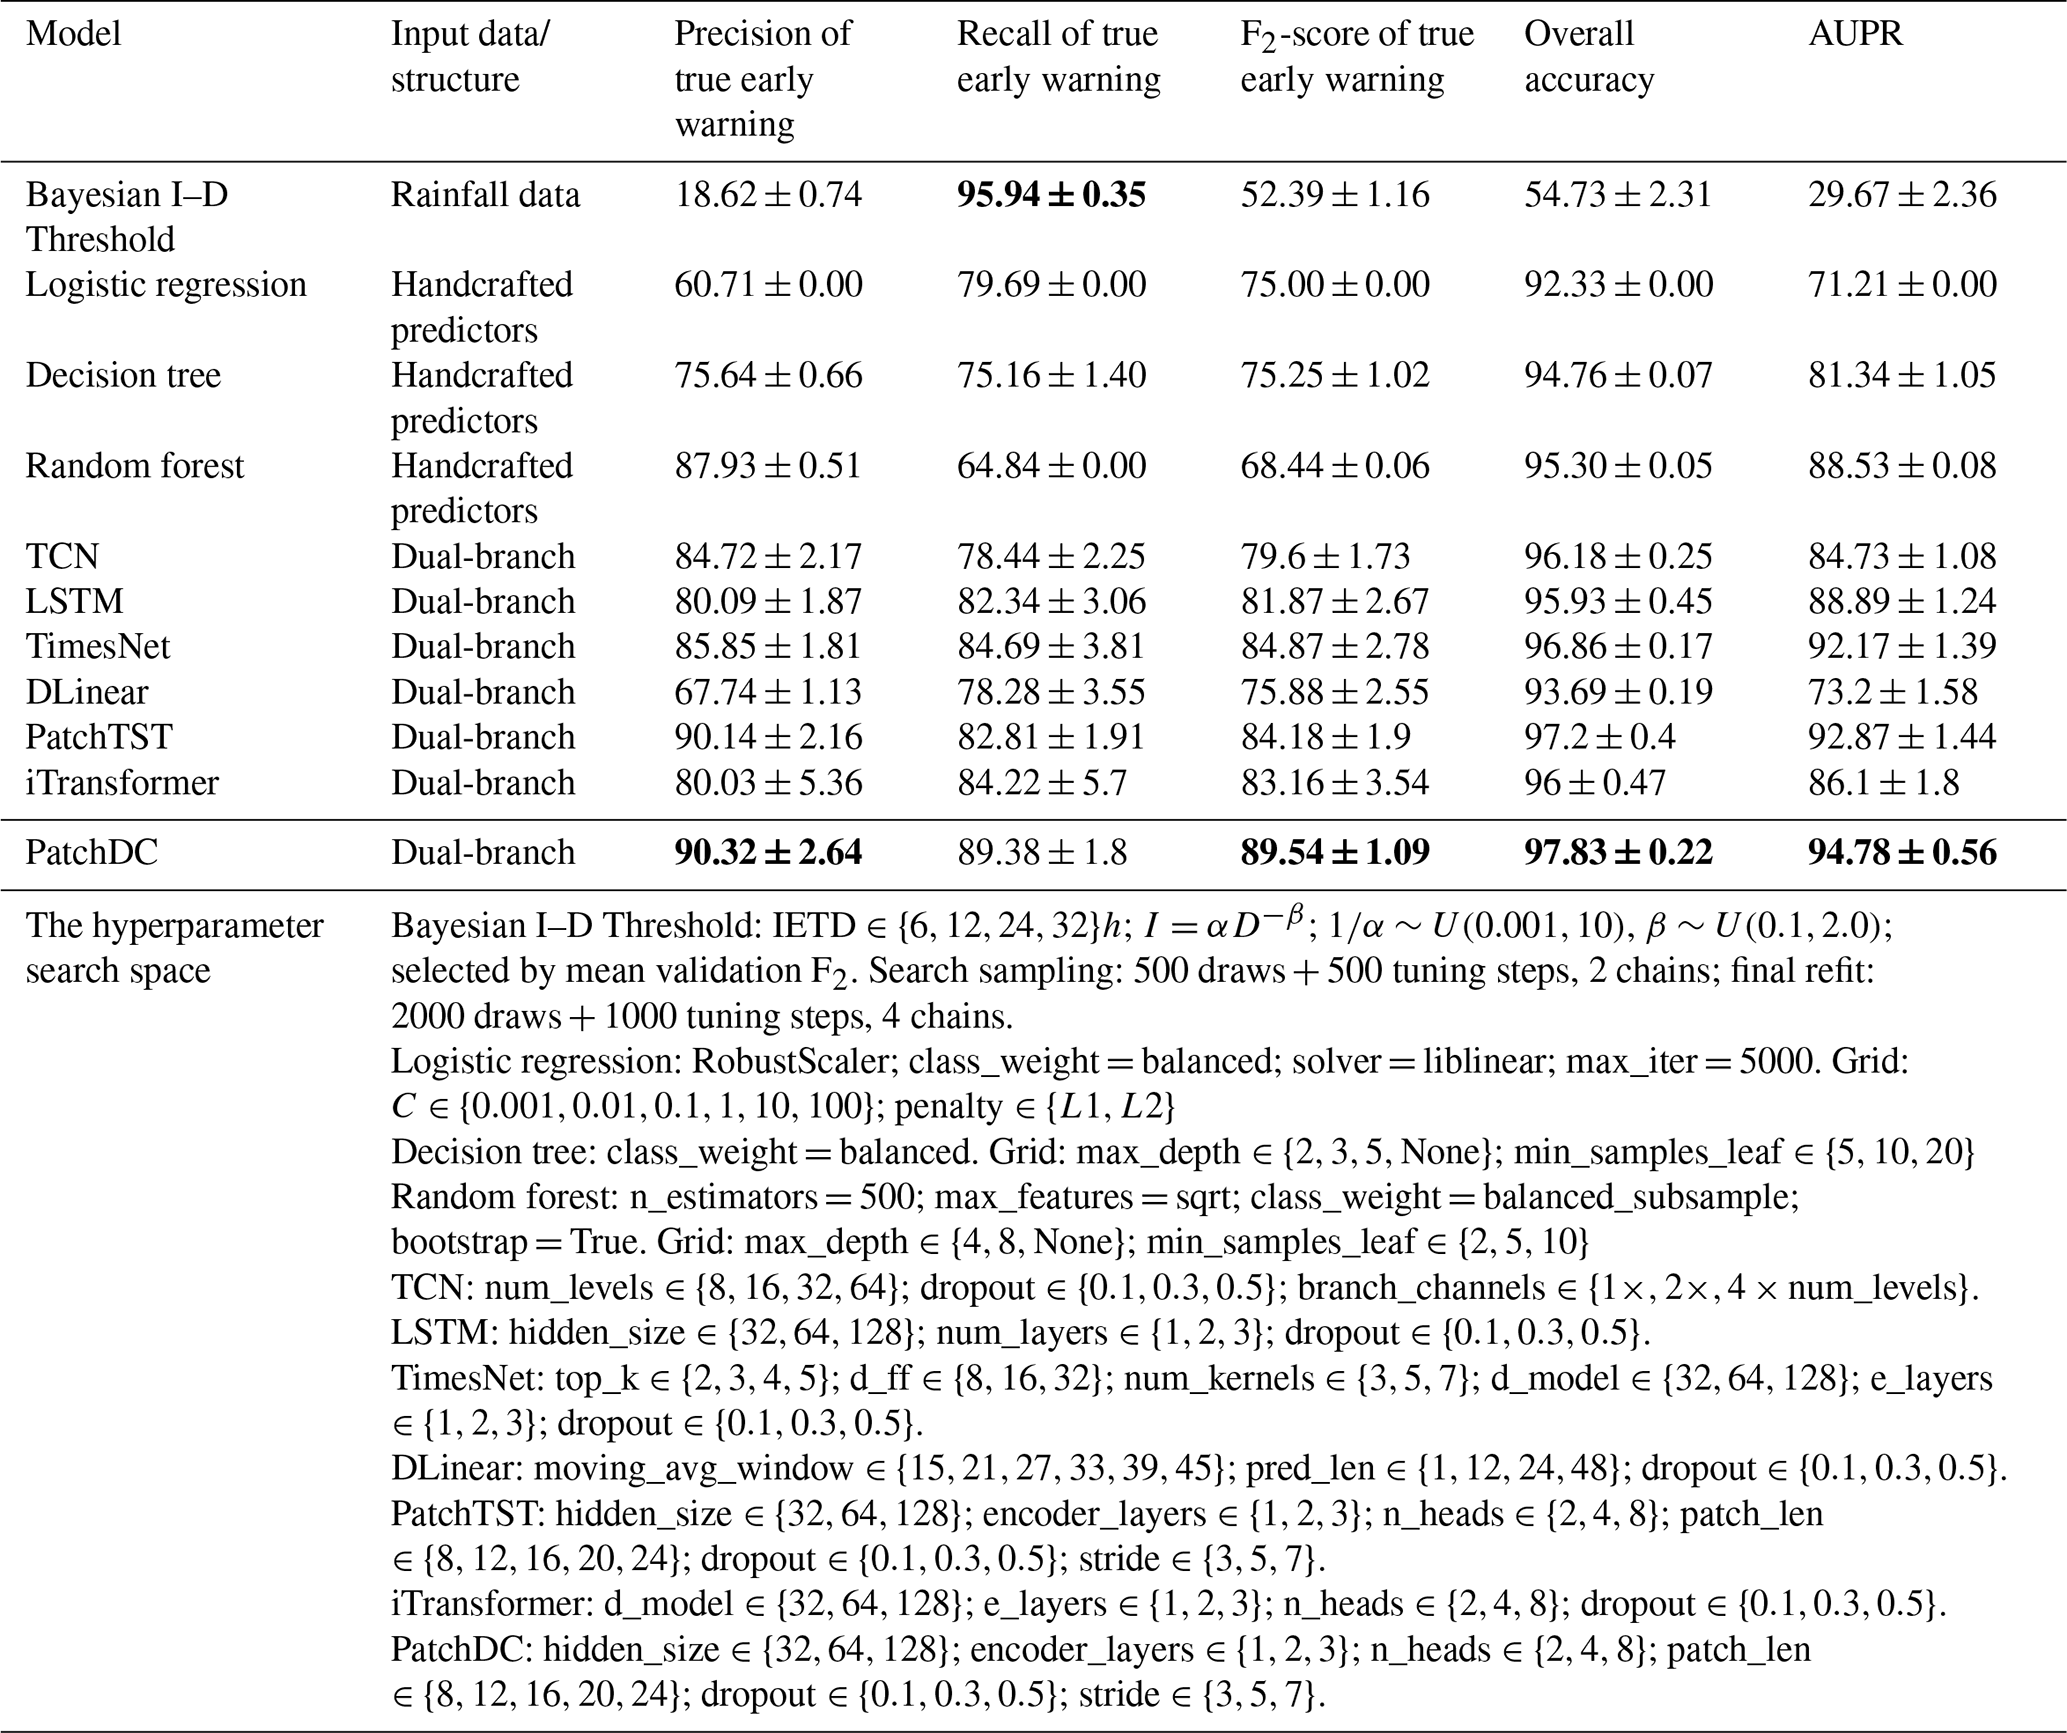
5.1 Comparative Model Accuracy Analysis
To illustrate the performance of PatchDC, this study compared it against multiple models applicable to time series classification. These include: the Bayesian Intensity-Duration (I-D) Threshold, which serves as a traditional empirical baseline by establishing the minimum meteorological conditions (rainfall intensity and duration) necessary to trigger slope failures using objective statistical inference (Guzzetti et al., 2008); Logistic regression, a decision tree, and a random forest were selected as conventional supervised machine-learning baselines. These models used 23 physically interpretable predictors derived from the same 15 d pre-alert hourly rainfall–displacement sequence and 100-point high-frequency displacement sequence provided to PatchDC (Table 6). Missing values for the conventional machine-learning models were imputed using medians estimated only from the corresponding training fold, and logistic regression additionally used robust scaling fitted on that fold. All predefined conventional-model configurations were evaluated on the validation fold and ranked primarily by the positive-class F2-score. Several representative deep-learning models were also evaluated for comparison. Long Short-Term Memory (LSTM), which excels at capturing long-term dependencies in sequences and remains one of the most widely adopted models for landslide displacement prediction (Hochreiter and Schmidhuber, 1997; Zeng et al., 2022; Xu and Niu, 2018); Temporal Convolutional Network (TCN), which emphasizes temporal ordering through causal convolutions for efficient long-sequence processing and has gained significant traction in landslide displacement prediction in recent years (Bai et al., 2018; Luo et al., 2022; Yang et al., 2024); TimesNet, a newer model that transforms time series into the frequency domain for multi-periodicity modeling (Wu et al., 2022); and DLinear, a simple yet efficient architecture that performs forecasting through decomposition into trend and seasonal components (Zeng et al., 2023). Furthermore, this study contrasted recent Transformer-based enhanced models, including PatchTST and iTransformer. PatchTST processes time series by segmenting them into sub-series patches, improving local feature capture while reducing computational complexity (Nie et al., 2022); iTransformer inverts the standard attention mechanism to focus on variable dimensions rather than time steps, which is reported to enhance the accuracy of multivariate time series forecasting (Liu et al., 2023). All comparative models were adapted to employ a dual-branch input structure analogous to PatchDC to ensure a fair comparison. One branch processed the long-term features (HMD, MVM, HRA, HMD_IQR, HMD_ADM, RMR), while the other branch processed the high-resolution features (RDS, RDS_IQR, RDS_ADM). The features from the two branches were simply concatenated, projected through a linear layer, and then forwarded to the loss function. To ensure fair training, Bayesian hyperparameter optimization was employed for each fold and the specific hyperparameters searched for each are detailed in Table 7. The specific training environment and optimization method are described in Sect. 4.2. Each model was trained and evaluated five times, with the mean and standard deviation of the metrics reported as the final results (Table 7).
As shown in Table 7, PatchDC delivered the best overall performance, followed by PatchTST. Relative to PatchTST, PatchDC improved precision, recall, F2-score, overall accuracy, and AUPR by 0.172, 6.562, 5.357, 0.634, and 1.906 percentage points, respectively. The small precision difference indicates that the two models had comparable false-alarm discrimination, whereas PatchDC provided substantially better recall and F2-score. This performance pattern supports the effectiveness of the Hybrid Feature Processing mechanism and masked self-attention module in jointly representing rainfall forcing and displacement responses across different temporal resolutions. TimesNet ranked third overall. Compared with PatchDC, its precision, recall, F2-score, overall accuracy, and AUPR were lower by 4.47, 4.69, 4.67, 0.97, and 2.61 percentage points, respectively. This gap may partly reflect its decomposition of temporal variation into multiple periods, which may not preserve all discriminative local patterns required for short-term warning recognition. iTransformer also trailed PatchDC across the five metrics, with deficits of 10.29, 5.16, 6.38, 1.83, and 8.68 percentage points, respectively. Although both models used Transformer-based architectures, iTransformer emphasized inter-variable relationships in the feature dimension, whereas PatchDC prioritized temporal patterns within individual variables and their interactions across temporal resolutions, which appeared more suitable for this task. LSTM and TCN, which are commonly used for displacement-sequence modeling, showed less balanced performance than PatchDC. LSTM was lower than PatchDC by 10.23, 7.04, 7.67, 1.90, and 5.89 percentage points in precision, recall, F2-score, overall accuracy, and AUPR, respectively. The corresponding gaps for TCN were 5.60, 10.94, 9.94, 1.65, and 10.05 percentage points. These architectures captured useful multivariate temporal dependencies but were less effective at simultaneously preserving detailed univariate temporal characteristics and multi-resolution rainfall–displacement relationships. DLinear showed the weakest overall performance among the deep-learning models. Relative to PatchDC, it was lower by 22.58 percentage points in precision, 11.10 in recall, 13.66 in F2-score, 4.14 in overall accuracy, and 21.58 in AUPR. Its linear decomposition was able to represent general trend information but was less capable of interpreting nonlinear relationships and abrupt local variations. Among the conventional machine-learning baselines, random forest provided strong false-alarm discrimination, with precision only 2.39 percentage points below PatchDC; however, its recall and F2-score were lower by 24.54 and 21.10 percentage points, respectively. Decision tree offered a more balanced precision–recall relationship, although PatchDC still exceeded it by approximately 14 percentage points in precision, recall, and F2-score. Logistic regression favored recall but generated more false positives, with deficits of 29.61 percentage points in precision and 14.54 in F2-score relative to PatchDC. Finally, the rainfall-only Bayesian Intensity–Duration (I–D) threshold achieved recall 6.56 percentage points higher than PatchDC, reflecting a highly conservative warning strategy. Nevertheless, it was lower than PatchDC by 71.70 percentage points in precision, 37.15 in F2-score, 43.10 in overall accuracy, and 65.11 in AUPR. This high false-alarm rate illustrates the limitation of relying solely on rainfall triggers without considering the observed kinematic response of the slope and further highlights the operational value of PatchDC's multi-source, multi-resolution feature-fusion framework.
Table 8Complementary paired comparisons between PatchDC and PatchTST.
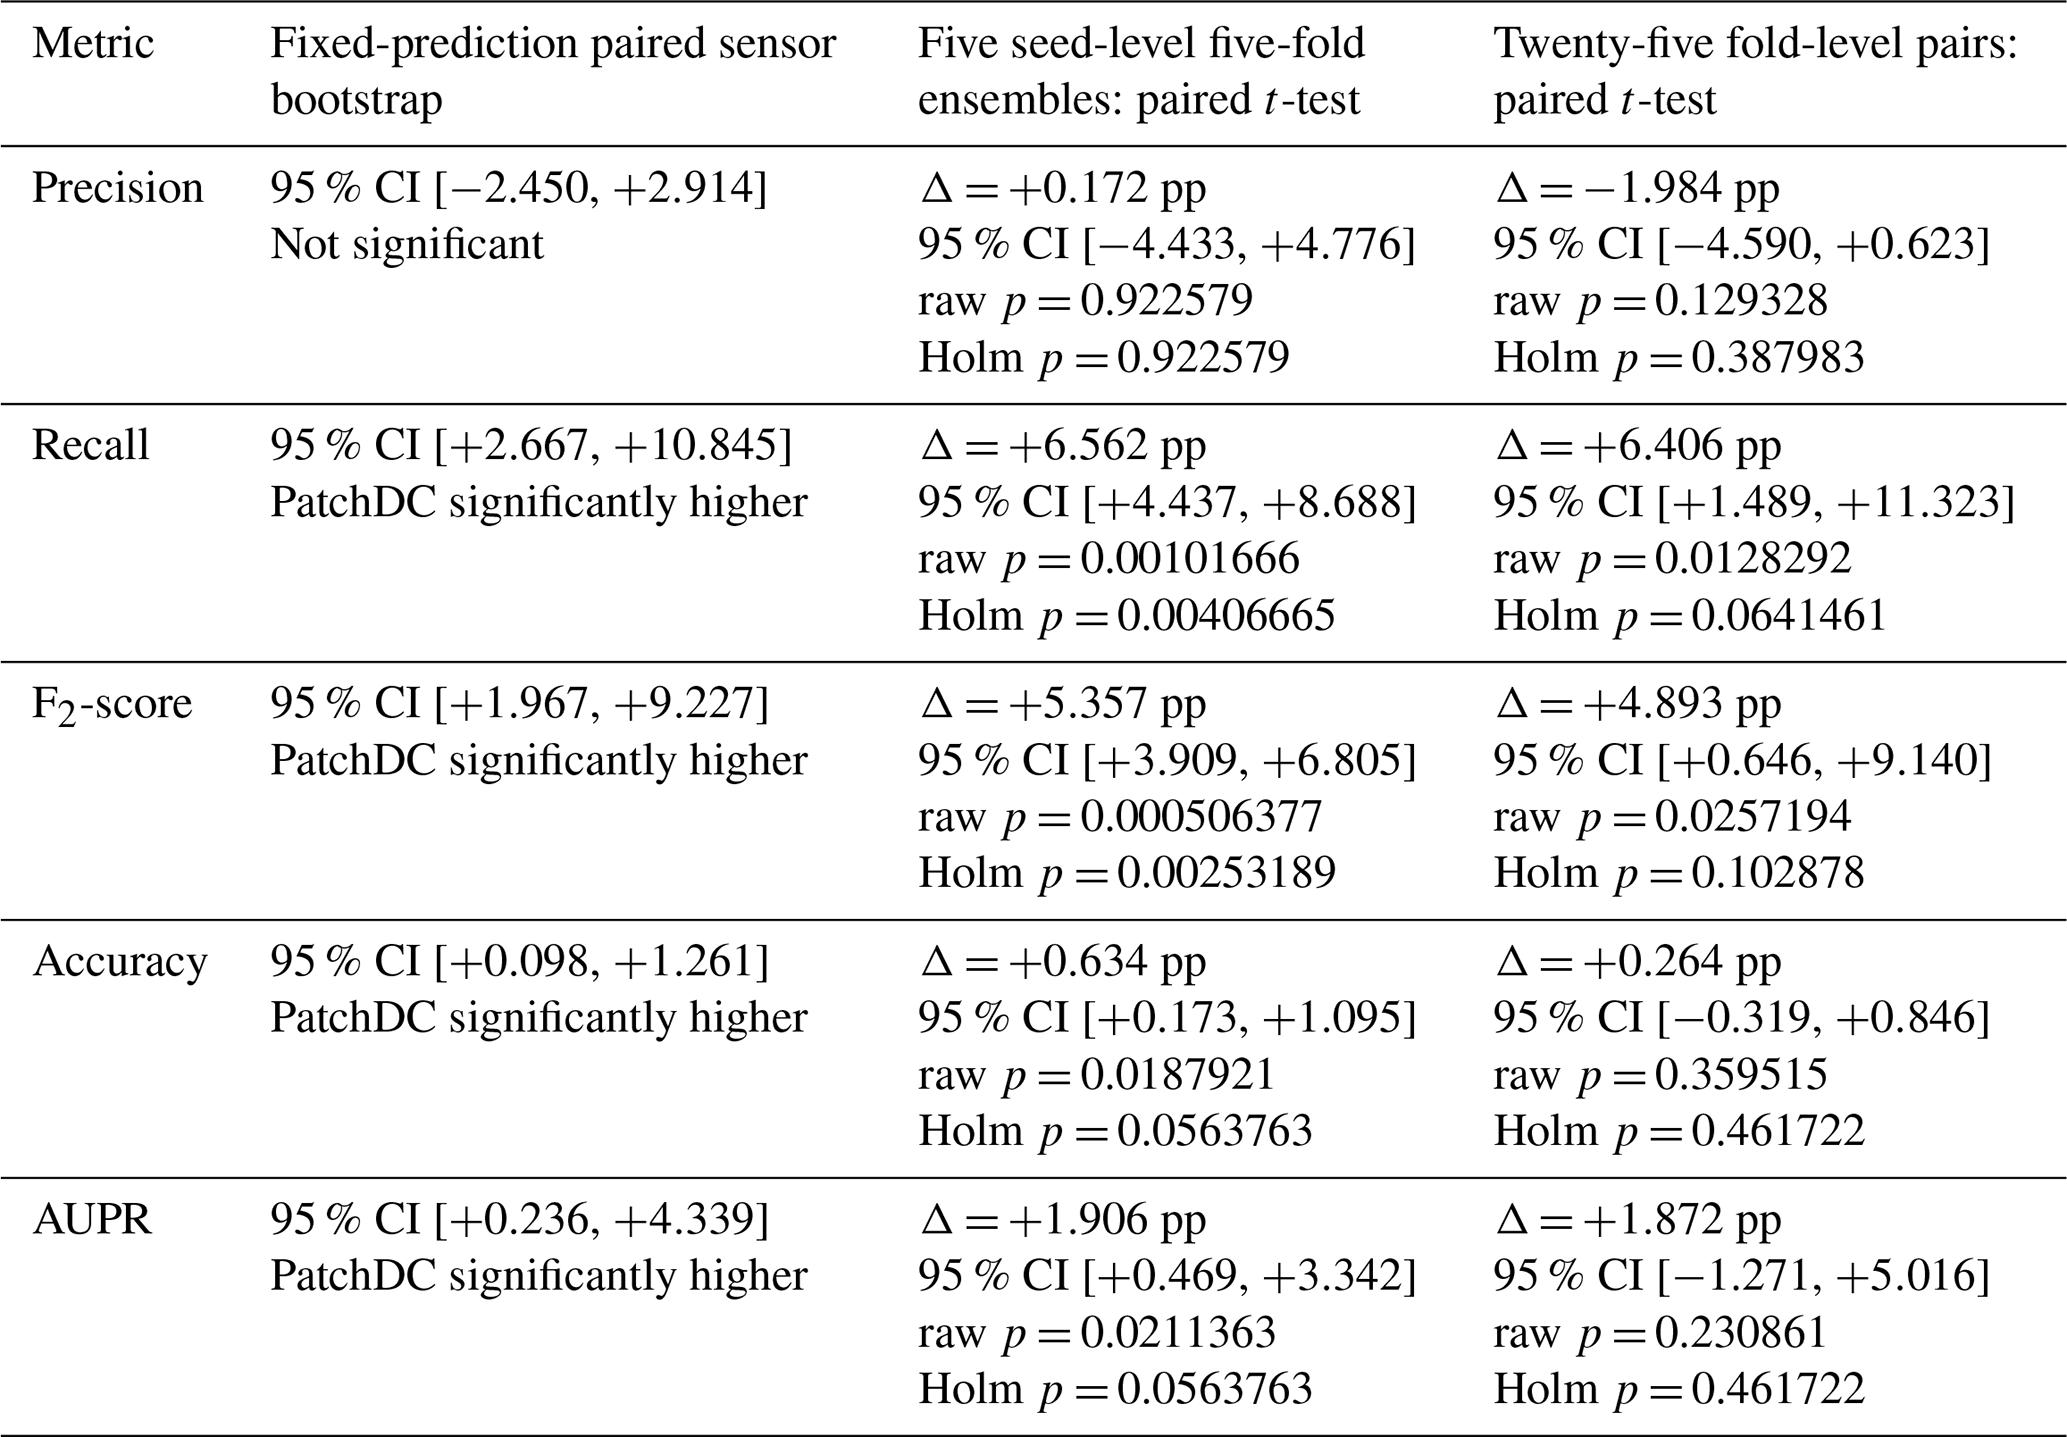
Note: Δ denotes PatchDC minus PatchTST in percentage points. The seed-level analysis uses each seed's final five-fold probability ensemble and is the primary inferential analysis. The sensor bootstrap quantifies uncertainty associated with the sampled test sensors.
To evaluate whether the performance differences between PatchDC and PatchTST were robust to uncertainty in test-sensor composition and model training, three complementary analyses were conducted (Table 8). First, a fixed-prediction paired sensor bootstrap was used to quantify sampling uncertainty associated with the independent test sensors. Second, paired t-tests were applied to the five seed-level final probability ensembles to assess the influence of random initialization on the final prediction results reported in Table 7. Third, paired t-tests were applied to the 25 matched seed–fold results as a sensitivity analysis of individual fold-model variability. Precision, recall, F2-score, overall accuracy, and AUPR were evaluated separately. Holm correction was applied across the five metric-specific t-tests in the seed-level and fold-level analyses, and Holm-adjusted p-values below 0.05 were considered statistically significant. The bootstrap analysis was evaluated using the paired 95 % confidence interval of the performance difference; an interval excluding zero indicated a consistent difference under resampling of the test sensors.
First, a fixed-prediction paired sensor bootstrap was used to quantify uncertainty associated with the independent test set. Sensors, rather than individual warning samples, were resampled with replacement because samples originating from the same sensor were not independent. PatchDC and PatchTST were evaluated using the same resampled sensors in each iteration. PatchDC increased recall by 6.562 percentage points, F2-score by 5.357 percentage points, overall accuracy by 0.634 percentage points, and AUPR by 1.906 percentage points. Because all four intervals excluded zero, these improvements were maintained when the composition of the test sensors was varied. In contrast, the precision difference was only +0.172 percentage points, and its 95 % CI included zero, indicating no reliable precision difference under sensor resampling. Therefore, the bootstrap analysis further demonstrated that, although PatchDC and PatchTST showed comparable performance in distinguishing false alarms, PatchDC was more effective in correctly identifying true warnings.
Second, paired t-tests were conducted using the final probabilities averaged across the five folds for each of the five random seeds. This analysis corresponded directly to the prediction strategy and results reported in Table 7. Compared with PatchTST, PatchDC increased recall from 82.81 % to 89.38 %, an improvement of 6.562 percentage points, with a Holm-adjusted p-value of 0.00406665. It also increased the F2-score from 84.18 % to 89.54 %, an improvement of 5.357 percentage points, with a Holm-adjusted p-value of 0.00253189. The Holm-adjusted p-values for both metrics were below 0.05, making recall and F2-score the only metrics with statistically significant differences after Holm correction. Overall accuracy and AUPR increased by 0.634 and 1.906 percentage points, respectively, but neither improvement remained significant after correction because both Holm-adjusted p-values exceeded 0.05. Mean precision was also similar between PatchDC and PatchTST, at 90.32 % and 90.14 %, respectively, and the difference was not statistically significant after Holm correction. Therefore, the paired t-test results based on the five random seeds showed that the significant advantages of PatchDC were primarily reflected in recall and F2-score, indicating that PatchDC was more effective than PatchTST in correctly identifying true warning cases.
Finally, paired t-tests were conducted on the 25 matched fold-level results obtained from five random seeds and five folds as a sensitivity analysis of variability among the individual fold models. Because all Holm-adjusted p-values exceeded 0.05, none of the fold-level differences was statistically significant after correction. Nevertheless, the Holm-adjusted p-value for recall was 0.0641461, which was below 0.1, while that for the F2-score was 0.102878, which was close to 0.1. These results indicated directional improvements in recall and F2-score, although they did not demonstrate consistent superiority across the individual fold models. Importantly, the fold-level analysis was not equivalent to the final ensemble evaluation because the final metrics were recalculated after averaging the predicted probabilities across the five folds. The directional advantages observed at the fold level may therefore help explain the statistically significant improvements in recall and F2-score achieved by the final five-fold probability ensemble.
Taken together, the three complementary analyses showed that the most robust advantage of PatchDC over PatchTST lay in its ability to identify true warnings. The improvements in recall and F2-score were maintained under sensor resampling and remained statistically significant across the seed-level final ensembles after Holm correction, whereas precision was consistently comparable between the two models. The evidence for improvements in overall accuracy and AUPR was less consistent across the different analyses. Although the fold-level paired t-tests did not identify statistically significant differences after Holm correction, recall and F2-score still showed directional improvements. These findings suggest that five-fold probability averaging helped reduce the influence of individual fold-model variability and produced a more stable advantage for PatchDC in true-warning detection, thereby supporting the robustness of the performance gains reported in Table 7.
The computational complexity of the algorithm was not explicitly analyzed in this study. This is because the displacement data from crack meters and the rainfall data from rain gauges are transmitted to the Fujian Provincial Integrated Geological Disaster Management Platform, where the algorithm can be deployed on computationally powerful infrastructure. Although the Transformer-based model entails higher computational cost and memory usage, the entire process from preliminary data processing to prediction using the trained model requires only a few seconds. This is remarkable despite the fact that the computational resources used for training were more limited than those on the deployment platform. This indicates that PatchDC's performance on the platform is fully adequate to meet the requirements for real-time prediction.
5.2 Sensitivity analysis using only the originally confirmed true warnings
To assess whether the temporally adjacent samples introduced intra-episode homogeneity and caused the model to learn episode-specific signatures, a sensitivity analysis was performed using only the 82 originally field-confirmed true-warning samples as the positive-sample pool for both training and testing. These samples comprised 42 originally confirmed events from the augmented training–validation set and 40 from the augmented test set, with no overlap between the two subsets (Table 5). All temporally adjacent, expert-validated samples were excluded from this analysis. The sensor-disjoint partitioning strategy, model architecture, optimization procedure, and evaluation protocol were identical to those used in the main experiment. For every training split, the normalization parameters were estimated exclusively from the corresponding training set and were subsequently applied, without refitting, to the validation and test sets. Similarly, the positive-to-negative sample weighting in the loss function was recalculated according to the class ratio of the corresponding training set. This ensured that the sensitivity analysis was self-contained and that no information associated with the augmented dataset entered the confirmed-only training process.
Table 9Performance on originally field-confirmed true warnings under confirmed-only and augmented training. The bold values indicate the highest value achieved for each evaluation metric among the compared methods.

As shown in Table 9, compared with the model trained on the augmented dataset and evaluated on the same confirmed-warning test samples, the confirmed-only model showed a precision higher by 1.74 percentage points, whereas its recall, F2-score, and AUPR were lower by 7.50, 5.15, and 3.96 percentage points, respectively. Overall accuracy was essentially unchanged, with the confirmed-only model showing a marginal decrease of 0.07 percentage points. These results show that the model retained substantial early-warning detection capability when the temporally adjacent samples were completely removed, indicating that its predictive performance was not solely dependent on signatures introduced by the augmentation procedure. The higher recall, F2-score, and AUPR obtained with augmented training suggest that the additional samples mainly improved positive-class coverage and sensitivity. The augmented-training configuration also produced smaller standard deviations for recall, F2-score, overall accuracy, and AUPR, consistent with improved model stability resulting from the larger positive training set.
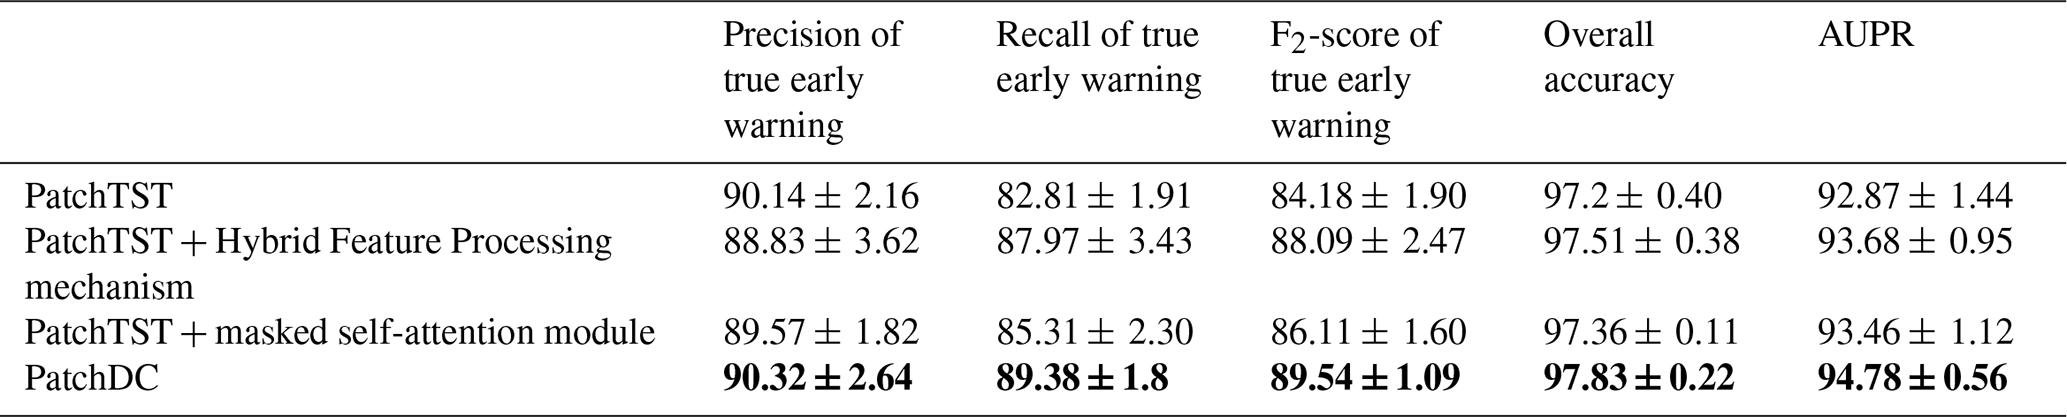
Table 10Accuracy results of Ablation Study for True early Warning recognition. The bold values indicate the highest value achieved for each evaluation metric among the compared methods.
5.3 Ablation Study
To evaluate the contributions of the Hybrid Feature Processing mechanism and the masked self-attention module, an ablation study was conducted using PatchTST without either module as the baseline. As shown in Table 10, adding only the Hybrid Feature Processing mechanism increased recall, F2-score, overall accuracy, and AUPR by 5.16, 3.91, 0.31, and 0.81 percentage points, respectively, although precision decreased by 1.31 percentage points. These results suggest that strengthening the joint representation of rainfall and displacement substantially improved true-warning recognition but introduced a precision trade-off. Adding only the masked self-attention module increased recall, F2-score, overall accuracy, and AUPR by 2.50, 1.93, 0.16, and 0.59 percentage points, respectively, while reducing precision by 0.57 percentage points. This finding indicates that incorporating temporal-order constraints also enhanced true-warning recognition, although its contribution was smaller than that of the Hybrid Feature Processing mechanism. The complete PatchDC model achieved the highest mean values across all five metrics. Compared with the baseline, PatchDC improved precision, recall, F2-score, overall accuracy, and AUPR by 0.18, 6.57, 5.36, 0.63, and 1.91 percentage points, respectively. It also outperformed both single-module variants across all metrics. These results demonstrate the complementary effects of the two modules: the Hybrid Feature Processing mechanism strengthened the joint representation of rainfall forcing and displacement response, while the masked self-attention module enhanced the modeling of temporally consistent dependencies. Their combination improved true-warning detection while restoring precision, thereby producing the best overall performance.
5.4 Interpretability Analysis
To enhance model transparency and facilitate trust in critical decision-making scenarios, it was essential to illustrate the interpretability mechanism. PatchDC inherited the PatchTST backbone and processed input features largely independently through its initial layers. Its final classification layer used a Linear layer to analyze the feature representations from all components and output the prediction results. Therefore, the weight parameters of this linear layer can indirectly reflect the importance assigned by the model to different input features when predicting true early warnings. The layer maps the nine component representations to two class logits. For a binary Softmax classifier, the contribution of each feature to predicting a true warning (the positive class) is determined by the difference between its positive- and negative-class weights, rather than by the positive-class weight alone. Accordingly, for each of the 25 checkpoints (5 seeds × 5 folds), the absolute difference between the two class-specific coefficients for each component was normalized by the sum of the absolute differences across all components.
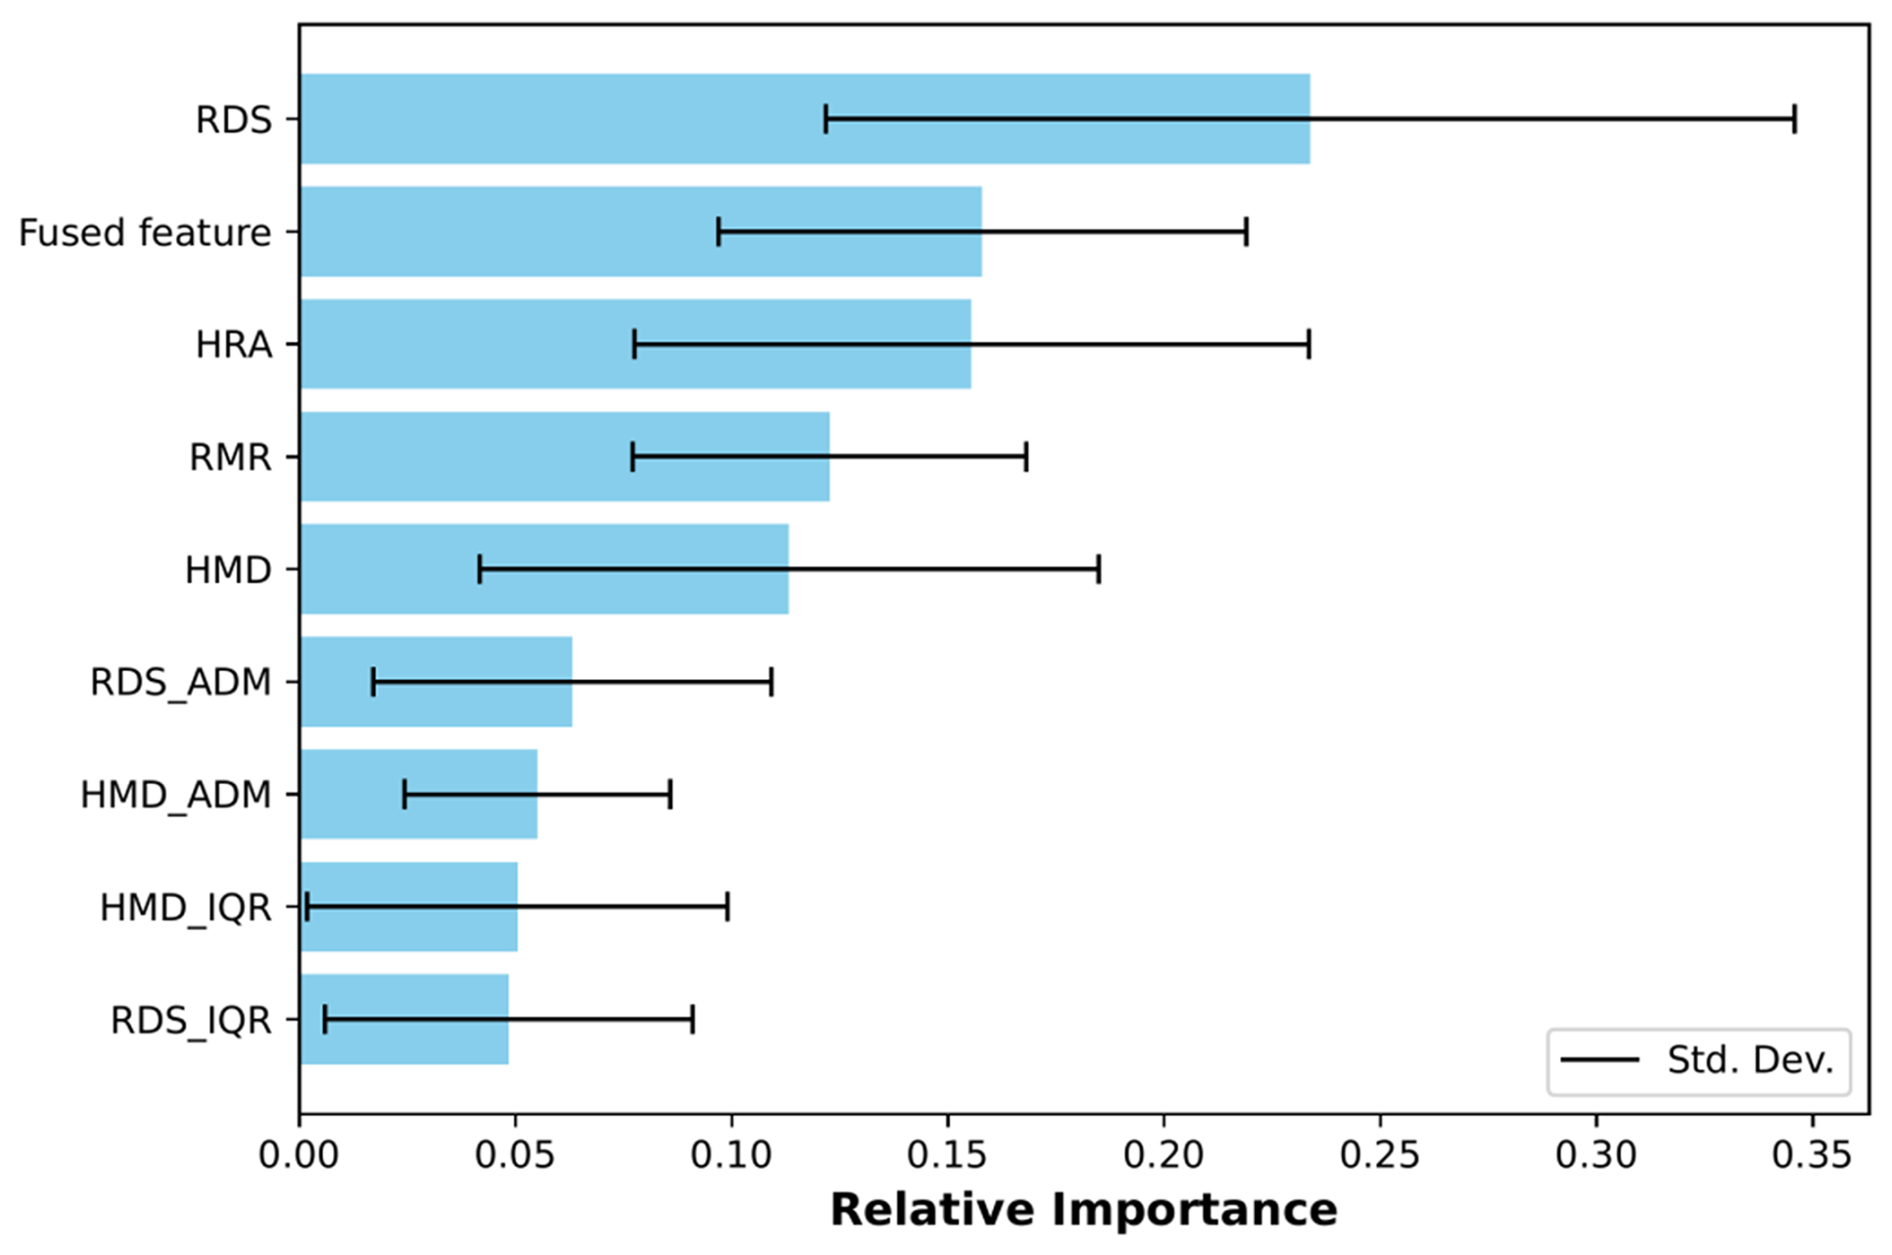
Figure 8Mean normalized absolute Softmax weight contrasts for the nine PatchDC classifier inputs across 25 checkpoints.
(1) Feature Importance by normalized Softmax weight contrasts
Figure 8 presents the mean and standard deviation of the normalized absolute Softmax weight contrasts across the 25 checkpoints. RDS (High-Resolution Raw Displacement Sequence) showed the highest mean relative importance, followed by the fused feature and HRA, whose mean importance values were closely matched. RMR (Relative Max Rainfall Intensity) and HMD (Hourly Median Displacement) ranked fourth and fifth, respectively. This pattern is consistent with the warning-assessment process used by human experts: a clear progressive increase in recent high-resolution displacement provides the primary evidence for identifying a true warning, whereas the learned relationship between rainfall and displacement, represented by the fused feature, provides important complementary information, particularly when the displacement trend alone is less pronounced. The second-place ranking of the fused feature further suggests that the Hybrid Feature Processing mechanism made a meaningful contribution to the final classifier's decisions, although these weight-based results reflect model reliance rather than causal importance.
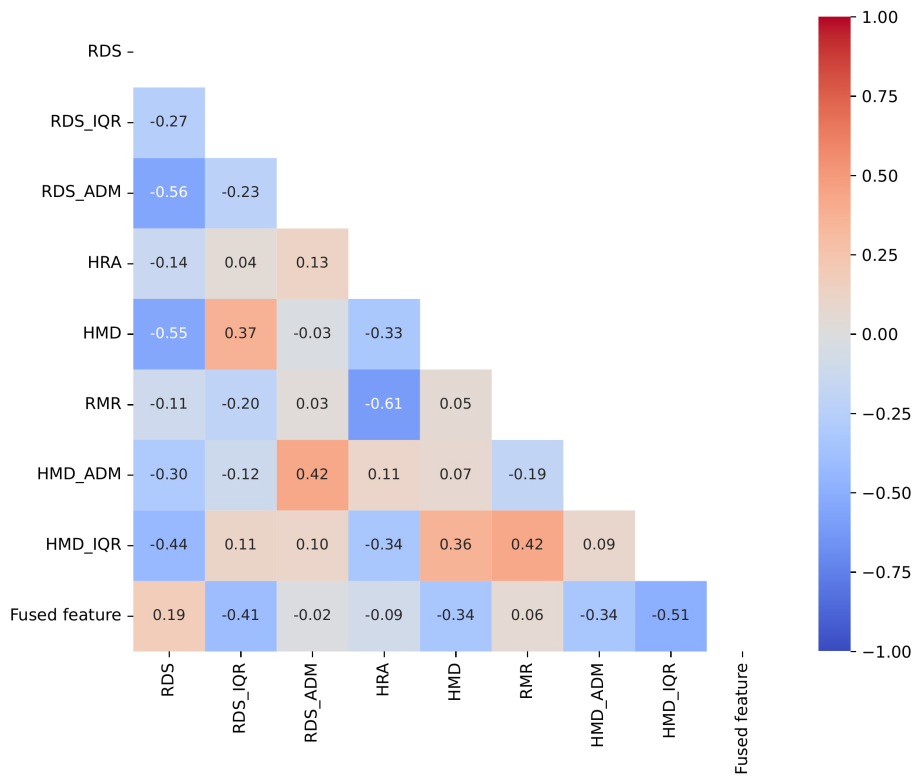
Figure 9Correlation Analysis of Linear Feature Weights for True Early Warning in the PatchDC Model.
(2) Pairwise Associations among Feature-Importance Weights
Figure 8 also reveals that the standard deviations of the feature weights were generally large, indicating variability across training runs. This may be attributed to compensatory relationships among the features regarding their importance for predicting the target variable. To investigate this, pairwise relationships between feature importances (Fig. 9) were analyzed using the Pearson correlation coefficient, calculated from the normalized weight differences across all 25 runs. An absolute Pearson correlation coefficient of 0.7 is commonly used as a heuristic threshold for strong pairwise association (Dormann et al., 2013). None of the observed coefficients reached this threshold, indicating that no strong pairwise linear associations were detected among the feature-importance estimates.
(3) Feature Importance Stability Analysis by Weight Ranking
Given the absence of strong pairwise linear relationships between feature importance weights, the substantial standard deviations of the feature weights may be attributable to the following two factors. Firstly, data heterogeneity was a salient concern, characterized by the presence of distinct temporal feature patterns in training data from different folds. Secondly, model heterogeneity played a role: the optimal configuration (e.g., patch length) was independently determined through hyperparameter search during each training iteration, leading to differences in model structure and feature encoding semantics, which in turn affected the stability of the final linear-layer weights. To further assess the reliability of the feature importance rankings despite this variability, the rank of each feature weight across the 25 training iterations was calculated.
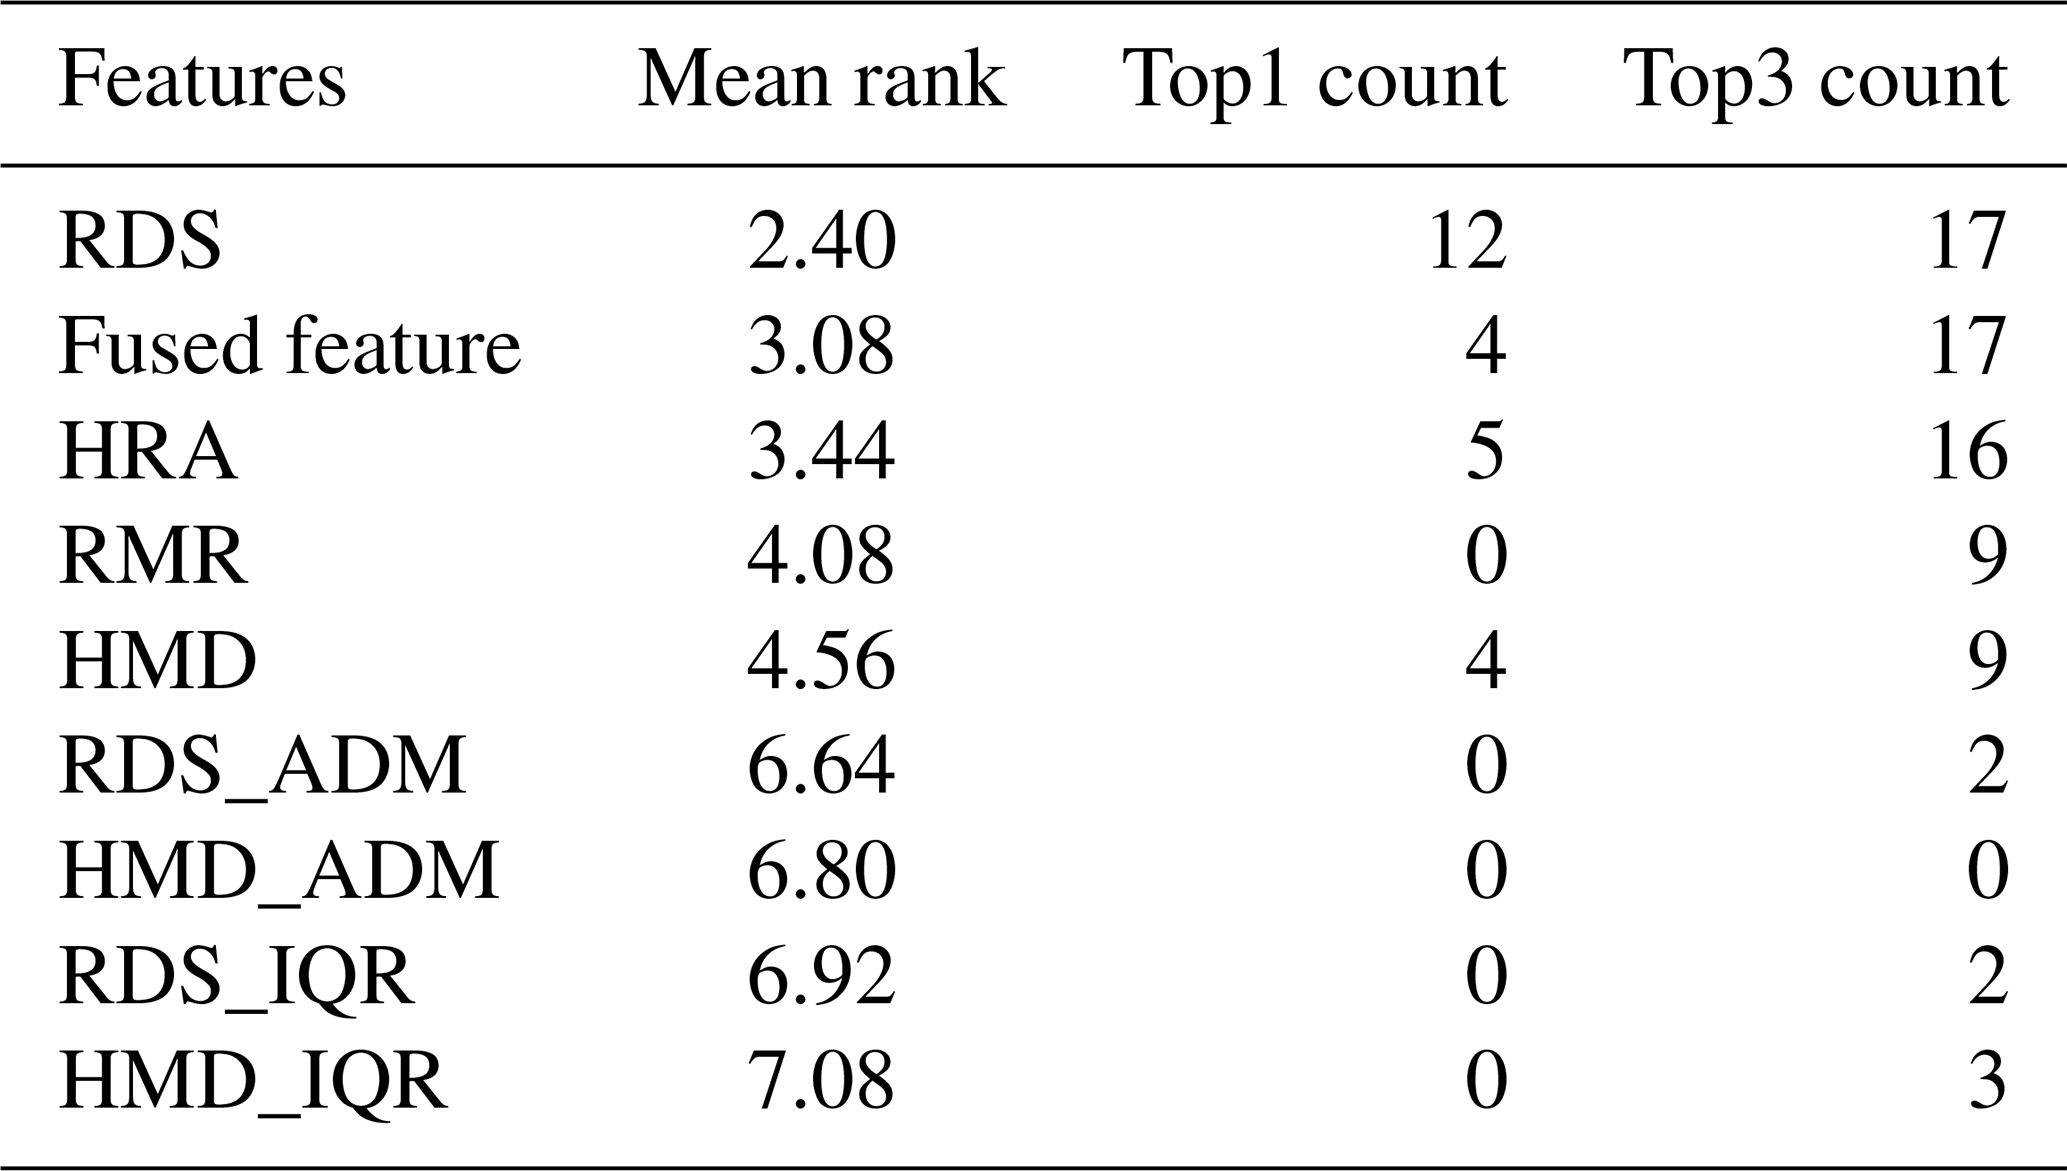
As shown in Table 11, RDS was the most stable high-ranking component, with a mean rank of 2.40; it ranked first in 12 of 25 runs (48 % of runs) and within the top three in 17 runs (68 % of runs). The fused feature ranked second on average, appearing first in 4 runs (16 % of runs) and in the top three in 17 runs (68 % of runs). HRA followed with a mean rank of 3.44 and entered the top three in 16 runs (64 % of runs). RMR and HMD had mean ranks of 4.08 and 4.56, respectively, and each entered the top three in 9 runs (36 % of runs). This ranking pattern is consistent with the mean-importance analysis and with an assessment strategy in which the progressive displacement pattern captured by RDS provides the primary evidence, while rainfall-related information – particularly the learned relationship between rainfall and displacement represented by the fused feature – provides complementary support. In particular, the fused feature's second-place mean ranking and frequent top-three appearances further support the contribution of the Hybrid Feature Processing mechanism to the model's decision-making process.
Table 11Stability of normalized Softmax weight-contrast importance rankings across 25 PatchDC checkpoints.
5.5 Analysis of missed true early warnings and model limitations
To identify the model's blind spots and enhance future early warning reliability, a detailed analysis of false negatives (missed true warnings) was critical. Firstly, cases that were undetected (predicted as false) in ≥ 2 out of the 5 independent training runs were selected for in-depth analysis. A total of sixteen such true early warning instances were identified, distributed across only five sensors. Given the similarity in the underlying causes of false-negative predictions, some representative missed cases were selected from three sensors and comparatively analyzed with correctly predicted warning cases from the same sensors.
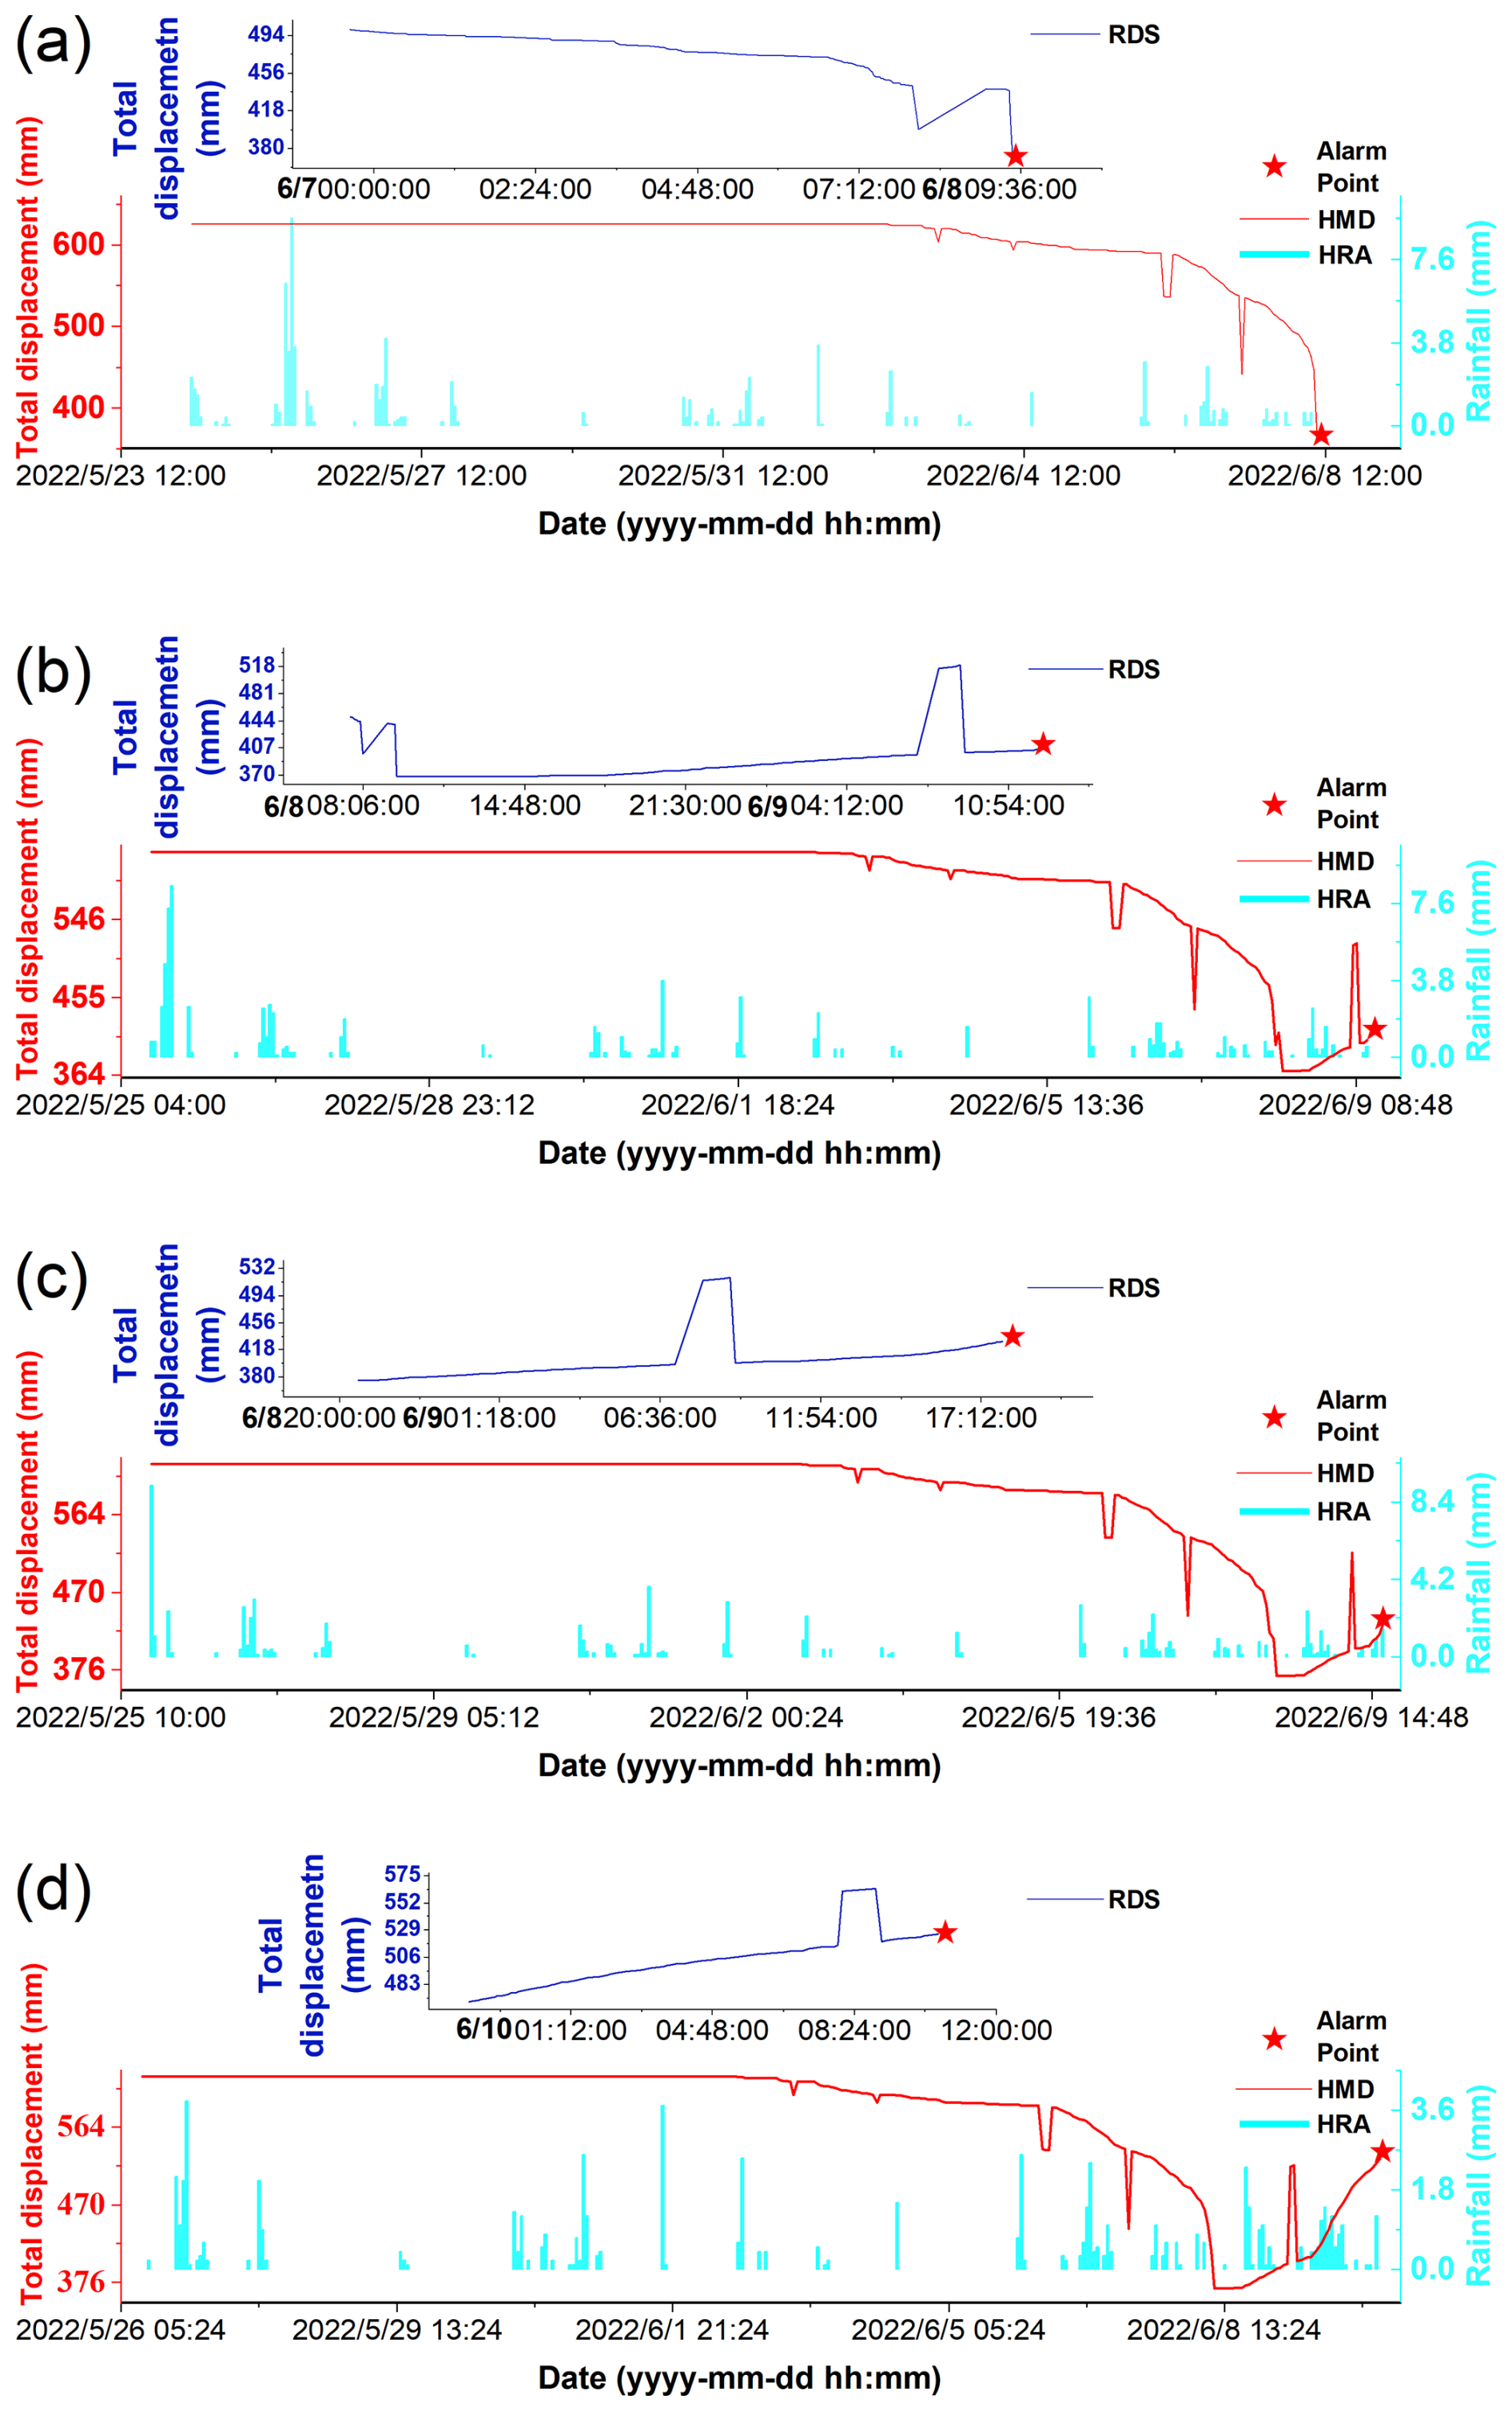
Figure 10Failure cases: the limited reverse displacement detection capability (correct prediction in d) The figures show threshold-based true early warnings but do not indicate that slope failure occurred immediately.
(1) False Negative Analysis for Sensor 1 (Fig. 10a–d, where d is a correctly predicted sample) was as follows. As illustrated in Fig. 10a, clear reverse displacement (contraction) is evident at the sensor's monitoring curve. This phenomenon was likely the result of continuous tensile cracking and subsidence at the landslide rear, as evidenced by the widening cracks observed on the village road. The landslide mass, which was rich in clay, may have encountered resistant strata, such as bedrock, or topographic obstruction downslope, resulting in temporary thrust uplift at the front (toe). It was important to note that such distinct reverse displacement patterns were never observed in the positive training samples available for the model, thereby hindering its ability to recognize them. As illustrated in Fig. 10b, the recent displacement (RDS feature) exhibited a positive (extensional) trend leading to the warning. However, the early reverse displacement distorted the overall RDS pattern, disrupting the overall progressive upward trend that the model learned to associate with true warnings. This reverse displacement signal of RDS was likely to have misled the model, resulting in a very low average positive prediction probability of 0.02 across the five runs. As shown in Fig. 10c, RDS exhibited a more pronounced recent upward trend than that in Fig. 10b, indicating continued landsliding. Consequently, the model's average positive prediction probability increased from 0.02 to 0.07. As displacement progressed further to a state that depicted in Fig. 10d (a state that was correctly predicted), the average probability increased to 0.70. This finding aligned with the results of the interpretability analysis, suggesting that the model placed a premium on RDS features and particularly the recent upward trend in crackmeter displacement. However, Fig. 10c demonstrates that earlier anomalous displacement (reverse displacement) still exerted a significant interfering effect on the model's overall prediction confidence.
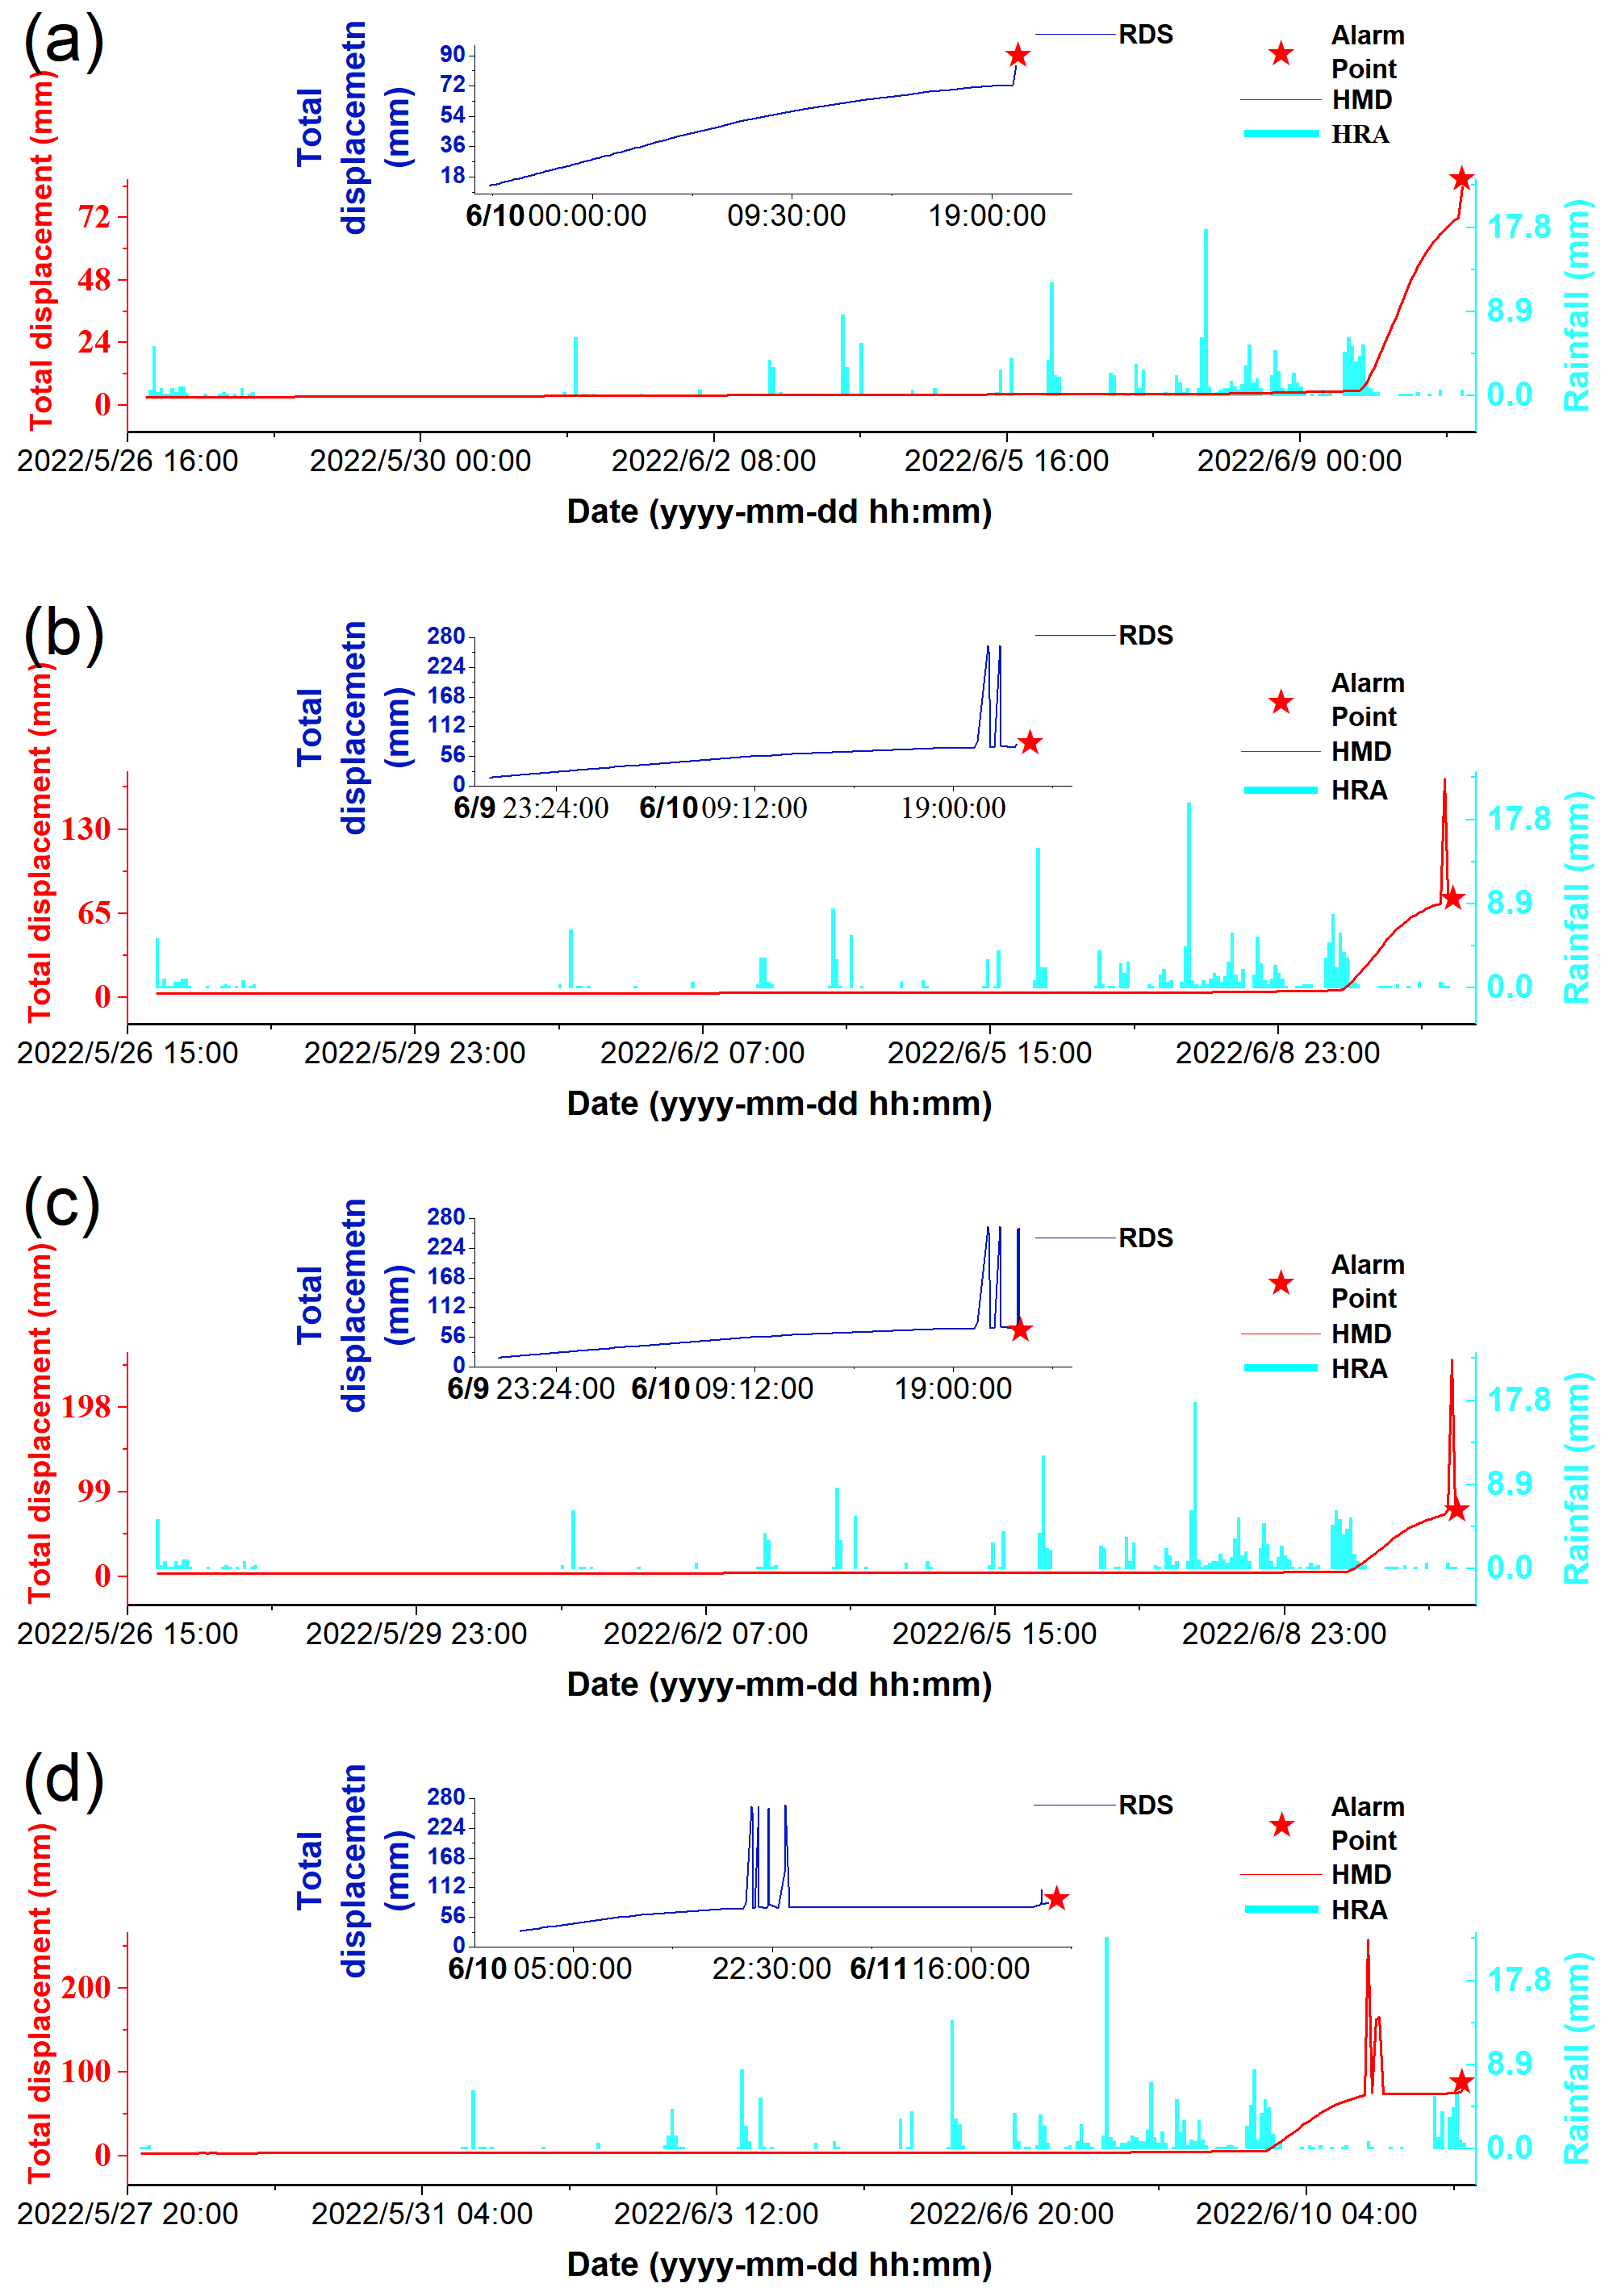
Figure 11Failure Cases: the inadequate robustness against high-amplitude noise that lasts a certain amount of time (correct prediction in a). The figures show threshold-based true early warnings but do not indicate that slope failure occurred immediately.
(2) False Negative Analysis for Sensor 2 (Fig. 11a–d, where a is a correctly predicted sample) was as follows. Missed detections for this sensor may be related to the recent displacement record of the crackmeter, which exhibited high-amplitude noise that lasted for a certain amount of time. The amplitude of these noises significantly exceeded the historical range of true displacement, potentially leading the model to misinterpret the overall trend as an increase followed by a decrease, rather than a continuous upward movement. Specifically, Fig. 11a (an early, correctly predicted case from the same sensor) shows smooth, noise-free displacement data with a clear trend, yielding a mean model prediction probability of 0.91. Following the appearance of significant abnormal noise (Fig. 11b and c), the mean prediction probability decreased substantially to 0.57 and 0.36, respectively, indicating model uncertainty. Figure 11d shows that the absence of a clear recent upward trend following the noise event caused the mean prediction probability to decline further to 0.01. These observations indicated that the model was insufficiently robust against high-amplitude noise that lasts for a certain amount of time. Compared with the correctly predicted case (Fig. 2), which also contained some anomaly, the noise amplitude in Fig. 2 did not exceed the historical true displacement range, which further illustrated the adverse impact of noise amplitude on model judgment. Furthermore, to verify that outlier interference was the primary cause of misclassification, the model was recalculated after manually removing these specific anomalies, resulting in correct predictions for all four cases shown in Fig. 11b–d.
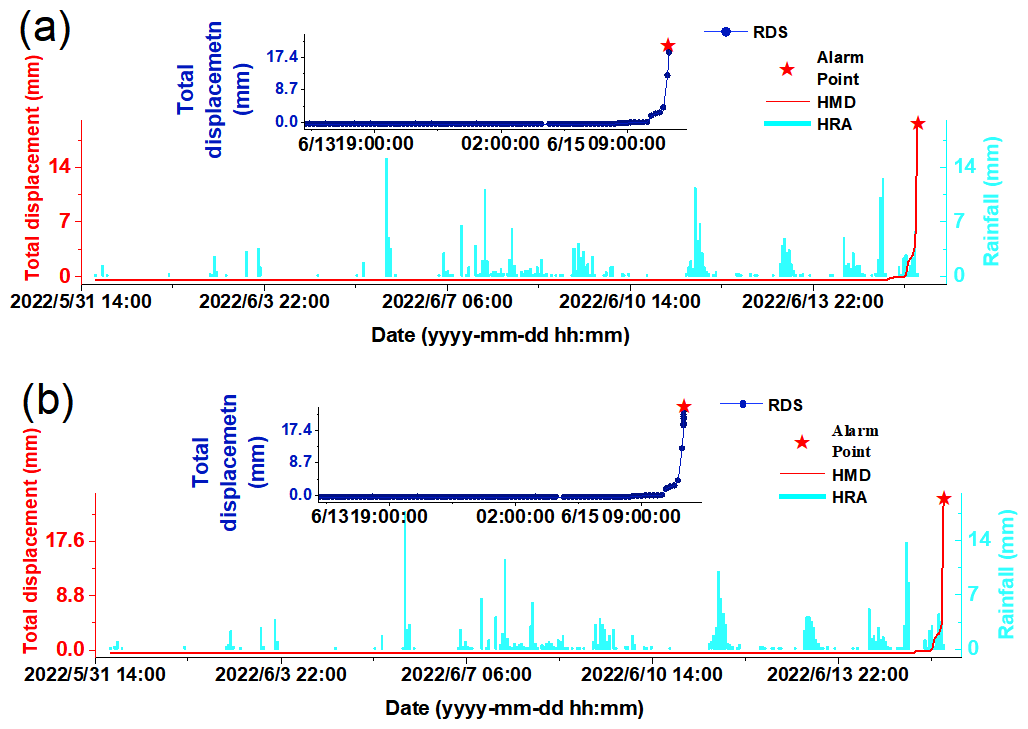
Figure 12Failure case: Limited sensitivity to incipient deformation when rainfall levels are insufficient to provide strong complementary evidence. The figures show threshold-based true early warnings but do not indicate that slope failure occurred immediately.
(3) Figure 12a and b present sequential samples from Sensor 3, with Fig. 12b showing the correctly classified sample. The false negative in Fig. 12a likely occurred because the displacement had only recently initiated, leaving too few observations for the RDS sequence to exhibit a clear progressive trend indicative of genuine deformation. At this early stage, the RDS pattern resembled that of some negative samples characterized by abrupt displacement jumps, thereby increasing classification ambiguity. Meanwhile, the rainfall signal was not sufficiently strong to compensate for the limited displacement evidence. Consequently, the predicted probability of a true warning was initially only 0.47, as shown in Fig. 12a. After two additional observations were collected over the next 3 min, the progressive displacement trend became more evident, and the predicted probability increased to 0.58. Four minutes later, after three further observations had been acquired, the probability rose to 0.80 (Fig. 12b).
In conclusion, the PatchDC model had several key limitations.
- 1.
Limited reverse displacement detection capability: Insufficient representation of actual reverse displacement events in the warning signal samples impeded the model's ability to effectively monitor and correctly interpret such phenomena, which may indeed indicate genuine early warning stages of complex failure mechanics.
- 2.
Inadequate robustness against high-amplitude noise that lasts for a certain amount of time: The model may produce false negatives when there is a high frequency of large-amplitude anomalies in RDS time series data, especially when the amplitude exceeded the range of actual crack displacements.
- 3.
Limited sensitivity to incipient deformation when rainfall levels are insufficient to provide strong complementary evidence: The model exhibited weaker discriminative ability for incipient deformation when only a few displacement observations were available, particularly when the corresponding RDS pattern resembled that of abrupt-jump negative samples. When rainfall levels were insufficient to provide strong complementary evidence, reliable detection could be delayed until a clearer progressive displacement trend emerged.
- 4.
Restricted applicability across triggering mechanisms: The model was primarily designed and trained for rainfall-induced geological hazards. Its effectiveness would be significantly diminished for events triggered by other mechanisms, such as reservoir drawdown operations or anthropogenic engineering activities like excavation.
- 5.
Dependency on paired instrumentation: Operational application of the model mandated the availability of concurrent data from both a crackmeter and a rain gauge. During data collection, frequent gaps occurred where crackmeter measurements lacked corresponding rainfall records (e.g., due to gauge malfunction) or where rain gauge data were missing during the critical warning period, effectively rendering the model inoperative for those events.
5.6 Monitoring Process Improvement Based on Model Limitations
Proactively refining monitoring workflows based on the identified model limitations is crucial for mitigating systemic vulnerabilities and preventing cascading errors.
In the case of limitation 2, if high-amplitude noise occurred for a certain amount of time and a warning point occurred near it, the noise itself would inevitably exceed the threshold and trigger a device warning. The model was then triggered to recognize this noise as a false alarm. Such noise-triggered alerts could be screened as false alarms during operational deployment, whereas noisy samples were retained in the training set because they provided valuable examples of false-alert patterns. Even if the model mistakenly identifies them as genuine warnings, subsequent manual verification can correct the labeling. The improved prediction after outlier removal in Fig. 11 was used only to confirm that noise was the main cause of the original misclassification.
For limitation 1 (actual reverse displacement), if a device issues warnings continuously over an extended period and the model persistently classifies them as false alarms, these persistently false alarms should trigger a mandatory manual verification process. Key areas of investigation should include potential device malfunctions and external interference factors (e.g., signal interference, or actual reverse displacement due to complex slope mechanics). On-site verification may be required to resolve the ambiguity.
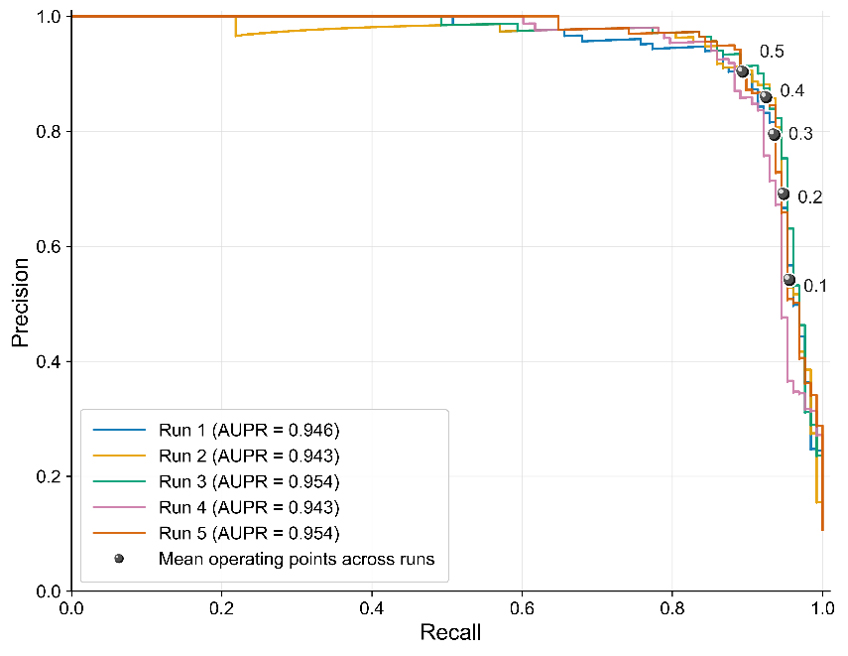
Figure 13Precision–Recall Curves Across Five Independent Runs with Mean Operating Points at Selected Decision Thresholds.
For limitation 3 (Limited sensitivity to incipient deformation), the following strategies can be employed to further reduce the risk of missed detection. First, an ensemble learning strategy can be adopted, which involves using the five fold-specific models within each random-seed run. If at least one of the five fold-specific models assigned a positive-class probability of at least 0.5, the sample was classified as a genuine warning. The one-vote-positive mechanism increased sensitivity to true-warning samples. Across five random-seed runs, it achieved an accuracy of 91.84 ± 2.13 %, precision of 57.72 ± 6.86 %, recall of 95.31 ± 0.78 %, F2-score of 84.13 ± 3.02 %, and AUPR of 91.22 ± 0.77 %. Compared with the mean recall of 89.38 % obtained by five-fold probability averaging mechanism, the “one-vote-positive” mechanism increased recall by 5.93 percentage points, substantially reducing missed detections, albeit at the cost of lower precision and more false alarms. The second strategy is to lower the classification threshold from 0.5 to a lower value, such as 0.4 (Fig. 13). At a threshold of 0.4, the mean recall reaches 92.5 %, which is 3.12 percentage points higher than the recall of 89.38 % obtained at a threshold of 0.5. This will increase the recall (reduce missed alarms) but will also increase the number of false alarms, shifting the operating point on the PR curve. Because this analysis focused on reducing missed alarms, recall was treated as the primary endpoint.
5.7 Transferability and limitations
The potentially transferable contribution of this study lies in its problem formulation and modelling framework rather than in the Fujian-trained model itself. Its broader relevance rests on two considerations. First, displacement at rainfall-triggered slope instability sites in other regions may also exhibit progressive development. Second, the relationship between rainfall and displacement should be explicitly considered when assessing whether crackmeter alerts reflect physically meaningful slope responses. The proposed framework addresses both aspects by integrating rainfall and crack-displacement observations at different temporal resolutions. However, it has currently been validated only at predominantly small-scale, rainfall-triggered landslide and collapse sites in Fujian Province, where crackmeters were installed across field-identified rear tension cracks. Its applicability under different geological, climatic, failure-mechanism, or monitoring conditions therefore remains to be established through locally labelled data, model retraining or recalibration, and independent external validation.
Addressing the critical challenges of high false-alarm rates in crackmeter-based monitoring, substantial manual verification burdens, and difficulties in achieving reliable automated early warning for slope deformation monitoring, this study constructed a specialized dataset combining crackmeter and rain-gauge measurements from different small-scale slope deformation monitoring scenarios for real-time early warning of rainfall-induced small-scale slope deformation monitoring. The proposed PatchDC model enabled real-time discrimination between true and false alarms across multiple crackmeter deployment scenarios. The optimally configured model achieved an F2-score of 89.54 %, demonstrating the efficacy of its dual-branch architecture for complementary long- and short-term multiscale feature extraction. PatchDC integrated a Hybrid Feature Processing mechanism with a Temporally-aware Transformer encoder. Compared with the PatchTST baseline, PatchDC improved precision, recall, F2-score, overall accuracy, and AUPR by 0.18, 6.57, 5.36, 0.63, and 1.91 percentage points, respectively. This demonstrates its enhanced capability in capturing short-term directional temporal dependencies and learning explicit rainfall-displacement relationships. Interpretability analysis reveals that the top three contributing features in PatchDC are the raw displacement sequence (RDS), the fused rainfall–displacement feature, and hourly rainfall accumulation (HRA), which aligns closely with the expert's prioritized criteria for authentic warning identification. To identify the model's blind spots and enhance operational reliability, a systematic case analysis identified five key limitations: (1) Limited identification capacity for true reverse-displacement warnings; (2) Insufficient robustness against high-amplitude noise that lasts a certain amount of time; (3) Limited sensitivity to incipient deformation when rainfall evidence is weak; (4) Primary applicability to rainfall-triggered geological hazards; and (5) Requirement for concurrent crackmeter and rain-gauge data. An improved monitoring workflow was designed to alleviate some limitations, providing a more efficient tool for rainfall-induced small-scale slope deformation monitoring that substantially reduces the expert verification burden. In addition, since all data originated from Fujian Province under relatively consistent monitoring conditions, the current model's applicability is primarily validated within similar geological and instrumentation settings, while its broader generalization requires further exploration. Future work will focus on validating the model across diverse geological settings and sensor configurations, alongside integrating multi-source remote sensing and heterogeneous sensor data to enhance data availability and broaden applicability. Greater attention will also be given to geological conditions by incorporating landslide-susceptibility or hazard maps derived from geological and environmental factors as spatial priors for model prediction.
Due to data-confidentiality restrictions imposed by the data provider, the displacement and rainfall data used in this study cannot be publicly shared. PatchDC's code is available at https://github.com/ShubingOuyangcug/PatchDC (last access: 23 October 2026).
SO developed the methodology and prepared the original draft of the manuscript. DL conceptualized the study, curated the data, acquired the funding, and supervised the research. ML carried out the investigation and contributed to data curation. FG developed the software and visualizations. XZ validated the findings and contributed to reviewing and editing the manuscript. Finally, YL and SW also contributed to reviewing and editing the manuscript.
The contact author has declared that none of the authors has any competing interests.
Publisher's note: Copernicus Publications remains neutral with regard to jurisdictional claims made in the text, published maps, institutional affiliations, or any other geographical representation in this paper. The authors bear the ultimate responsibility for providing appropriate place names. Views expressed in the text are those of the authors and do not necessarily reflect the views of the publisher.
This article is part of the special issue “Early Warning Systems from Research to Operations: Status, Innovations and Multi-Hazard Applications”. It is not associated with a conference.
We gratefully acknowledge the Fujian Geologic Surveying and Mapping Institute for providing the crackmeter and rain-gauge measurements, along with the field-validated labels of true early warnings and false alarms used in this study. We are grateful to OpenAI's ChatGPT and DeepSeek for their assistance with coding and for their suggestions on phrasing and text clarity during the preparation of this work.
This work was supported by the Young Scientists Fund of the National Natural Science Foundation of China (grant no. 42301523).
This paper was edited by Timothy Tiggeloven and reviewed by three anonymous referees.
Bai, S., Kolter, J. Z., and Koltun, V.: An empirical evaluation of generic convolutional and recurrent networks for sequence modeling, arXiv [preprint], https://doi.org/https://doi.org/10.48550/arXiv.1803.01271, 2018.
Baroň, I. and Supper, R.: Application and reliability of techniques for landslide site investigation, monitoring and early warning – outcomes from a questionnaire study, Nat. Hazards Earth Syst. Sci., 13, 3157–3168, https://doi.org/10.5194/nhess-13-3157-2013, 2013.
Dahal, R. K. and Hasegawa, S.: Representative rainfall thresholds for landslides in the Nepal Himalaya, Geomorphology, 100, 429–443, https://doi.org/10.1016/j.geomorph.2008.01.014, 2008.
Deng, B., Xu, Q., Dong, X., Li, W., Wu, M., Ju, Y., and He, Q.: Automatic Method for Detecting Deformation Cracks in Landslides Based on Multidimensional Information Fusion, Remote Sens., 16, 4075, https://doi.org/10.3390/rs16214075, 2024.
Deng, L., Smith, A., Dixon, N., and Yuan, H.: Machine learning prediction of landslide deformation behaviour using acoustic emission and rainfall measurements, Eng. Geol., 293, 106315, https://doi.org/10.1016/j.enggeo.2021.106315, 2021.
Dou, H., Chen, Y., Sun, Y., and Guo, C.: Regional dynamic early warning model for rainfall-induced landslide in Fujian, China, Geomatics Nat. Hazards Risk, 15, 2435510, https://doi.org/10.1080/19475705.2024.2435510, 2024.
Dormann, C. F., Elith, J., Bacher, S., Buchmann, C., Carl, G., Carré, G., García Marquéz, J. R., Gruber, B., Lafourcade, B., Leitão, P. J., Münkemüller, T., McClean, C., Osborne, P. E., Reineking, B., Schröder, B., Skidmore, A. K., Zurell, D., and Lautenbach, S.: Collinearity: a review of methods to deal with it and a simulation study evaluating their performance, Ecography, 36, 27–46, https://doi.org/10.1111/j.1600-0587.2012.07348.x, 2013.
Ge, Q., Li, J., Wang, X., Deng, Y., Zhang, K., and Sun, H.: LiteTransNet: An interpretable approach for landslide displacement prediction using transformer model with attention mechanism, Eng. Geol., 331, 107446, https://doi.org/10.1016/j.enggeo.2024.107446, 2024.
Guo, L., He, K., Liu, H., Meng, F., and Wang, X.: Physical prediction model of compound hydrodynamic unload-load response ratio and its application in reservoir colluvium landslide, J. Earth Sci., 35, 1304–1315, https://doi.org/10.1007/s12583-022-1662-9, 2024.
Guzzetti, F., Peruccacci, S., Rossi, M., and Stark, C. P.: The rainfall intensity–duration control of shallow landslides and debris flows: an update, Landslides, 5, 3–17, https://doi.org/10.1007/s10346-007-0112-1, 2008.
Hochreiter, S. and Schmidhuber, J.: Long short-term memory, Neural Comput., 9, 1735–1780, https://doi.org/10.1162/neco.1997.9.8.1735, 1997.
Jiang, Y., Zheng, L., Xu, Q., and Lu, Z.: Deformation mechanism-assisted deep learning architecture for predicting step-like displacement of reservoir landslide, Int. J. Appl. Earth Obs. Geoinf., 133, 104121, https://doi.org/10.1016/j.jag.2024.104121, 2024.
Khan, A., Gupta, S., and Gupta, S. K.: Multi-hazard disaster studies: Monitoring, detection, recovery, and management, based on emerging technologies and optimal techniques, Int. J. Disaster Risk Reduct., 47, 101642, https://doi.org/10.1016/j.ijdrr.2020.101642, 2020.
Klimeš, J., Rowberry, M., Blahut, J., Briestenský, M., Hartvich, F., Košt'ák, B., Rybář, J., Stemberk, J., and Štěpančíková, P.: The monitoring of slow-moving landslides and assessment of stabilisation measures using an optical–mechanical crack gauge, Landslides, 9, 407–415, https://doi.org/10.1007/s10346-011-0306-4, 2012.
Lee, W. Y., Park, S. K., and Sung, H. H.: The optimal rainfall thresholds and probabilistic rainfall conditions for a landslide early warning system for Chuncheon, Republic of Korea, Landslides, 18, 1721–1739, https://doi.org/10.1007/s10346-020-01603-3, 2021.
Li, J., Wang, W., and Han, Z.: A variable weight combination model for prediction on landslide displacement using AR model, LSTM model, and SVM model: a case study of the Xinming landslide in China, Environ. Earth Sci., 80, 386, https://doi.org/10.1007/s12665-021-09696-2, 2021a.
Li, S., Feng, W., Yi, X., Liu, K., Guo, C., Tang, X., and Wu, Z.: Clustered shallow landslides triggered by heavy rainfall in May 2022 in Wuping County, Fujian Province, China, Bull. Eng. Geol. Environ., 84, 257, https://doi.org/10.1007/s10064-025-04280-5, 2025.
Li, Z., Fang, L., Sun, X., and Peng, W.: 5G IoT-based geohazard monitoring and early warning system and its application, EURASIP J. Wirel. Commun. Netw., 2021, 160, https://doi.org/10.1186/s13638-021-02033-y, 2021b.
Liu, Y., Hu, T., Zhang, H., Wu, H., Wang, S., Ma, L., and Long, M.: iTransformer: Inverted transformers are effective for time series forecasting, arXiv [preprint], https://doi.org/10.48550/arXiv.2310.06625, 2023.
Liu, Y., Long, J., Li, C., and Zhan, W.: Physics-informed data assimilation model for displacement prediction of hydrodynamic pressure-driven landslide, Comput. Geotech., 167, 106085, https://doi.org/10.1016/j.compgeo.2024.106085, 2024.
Luo, W., Dou, J., Fu, Y., Wang, X., He, Y., Ma, H., Wang, R., and Xing, K.: A novel hybrid LMD–ETS–TCN approach for predicting landslide displacement based on GPS time series analysis, Remote Sens., 15, 229, https://doi.org/10.3390/rs15010229, 2022.
Nava, L., Carraro, E., Reyes-Carmona, C., Puliero, S., Bhuyan, K., Rosi, A., Monserrat, O., Floris, M., Meena, S. R., Galve, J. P., and Catani, F.: Landslide displacement forecasting using deep learning and monitoring data across selected sites, Landslides, 20, 2111–2129, https://doi.org/10.1007/s10346-023-02104-9, 2023.
Nie, Y., Nguyen, N. H., Sinthong, P., and Kalagnanam, J.: A time series is worth 64 words: Long-term forecasting with transformers, arXiv [preprint], https://doi.org/10.48550/arXiv.2211.14730, 2022.
Niu, P., Zhou, T., Wang, X., Sun, L., and Jin, R.: Attention as robust representation for time series forecasting, arXiv [preprint], https://doi.org/10.48550/arXiv.2402.05370, 2024.
Peng, S., Ding, Y., Liu, W., and Li, Z.: 1 km monthly temperature and precipitation dataset for China from 1901 to 2017, Earth Syst. Sci. Data, 11, 1931–1946, https://doi.org/10.5194/essd-11-1931-2019, 2019.
Qiu, H., Chen, X., Feng, P., Wang, R., Hu, W., Zhang, L., and Pasuto, A.: Advancing predictive accuracy of shallow landslide using strategic data augmentation, J. Rock Mech. Geotech. Eng., 17, 4273–4287, https://doi.org/10.1016/j.jrmge.2024.09.010, 2025.
Quansah, J. E., Engel, B., and Rochon, G. L.: Early warning systems: a review, J. Terr. Obs., 2, 5, https://docs.lib.purdue.edu/cgi/viewcontent.cgi?article=1072&context=jto (last access: 7 May 2025), 2010.
Sharifi, S., Hendry, M. T., Macciotta, R., and Evans, T.: Evaluation of filtering methods for use on high-frequency measurements of landslide displacements, Nat. Hazards Earth Syst. Sci., 22, 411–430, https://doi.org/10.5194/nhess-22-411-2022, 2022a.
Sharifi, S., Macciotta, R., and Hendry, M. T.: Algorithms to enhance detection of landslide acceleration moment and time-to-failure forecast using time-series displacements, Eng. Geol., 309, 106832, https://doi.org/10.1016/j.enggeo.2022.106832, 2022b.
Sharifi, S., Macciotta, R., and Hendry, M. T.: A reliability evaluation of four landslide failure forecasting methods in real-time monitoring applications, Landslides, 21, 2545–2556, https://doi.org/10.1007/s10346-024-02293-x, 2024.
Shehadeh, A., Alshboul, O., and Almasabha, G.: Slope displacement detection in construction: An automated management algorithm for disaster prevention, Expert Syst. Appl., 237, 121505, https://doi.org/10.1016/j.eswa.2023.121505, 2024.
Sun, X., Su, Y., Yang, C., Tan, J., and Liu, D.: Research on Slope Early Warning and Displacement Prediction Based on Multifractal Characterization, Fractal Fract., 8, 522, https://doi.org/10.3390/fractalfract8090522, 2024.
Vaswani, A., Shazeer, N., Parmar, N., Uszkoreit, J., Jones, L., Gomez, A. N., Kaiser, Ł., and Polosukhin, I.: Attention is all you need, Adv. Neural Inf. Process. Syst., 30, https://proceedings.neurips.cc/paper_files/paper/2017/file/3f5ee243547dee91fbd053c1c4a845aa-Paper.pdf (last access: 20 May 2025), 2017.
Wang, Y., Tang, H., Huang, J., Wen, T., Ma, J., and Zhang, J.: A comparative study of different machine learning methods for reservoir landslide displacement prediction, Eng. Geol., 298, 106544, https://doi.org/10.1016/j.enggeo.2022.106544, 2022.
Wang, Z., Tang, J., Hou, S., Wang, Y., Zhang, A., Wang, J., Wang, W., Feng, Z., Li, A., and Han, B.: Landslide displacement prediction from on-site deformation data based on time series ARIMA model, Front. Environ. Sci., 11, 1249743, https://doi.org/10.3389/fenvs.2023.1249743, 2023.
Wu, D., Zhou, B., and Zimin, M.: Prediction of landslide displacement based on the CA-stacked transformer model, Alexandria Eng. J., 124, 389–403, https://doi.org/10.1016/j.aej.2025.03.140, 2025.
Wu, H., Hu, T., Liu, Y., Zhou, H., Wang, J., and Long, M.: Timesnet: Temporal 2d-variation modeling for general time series analysis, arXiv [preprint], https://doi.org/10.48550/arXiv.2210.02186, 2022.
Wu, Y. and Lan, H.: Landslide Analyst—a landslide propagation model considering block size heterogeneity, Landslides, 16, 1107–1120, https://doi.org/10.1007/s10346-019-01154-2, 2019.
Xu, S. and Niu, R.: Displacement prediction of Baijiabao landslide based on empirical mode decomposition and long short-term memory neural network in Three Gorges area, China, Comput. Geosci., 111, 87–96, https://doi.org/10.1016/j.cageo.2017.10.013, 2018.
Yang, B., Yin, K., Lacasse, S., and Liu, Z.: Time series analysis and long short-term memory neural network to predict landslide displacement, Landslides, 16, 677–694, https://doi.org/10.1007/s10346-018-01127-x, 2019.
Yang, J., Huang, Z., Jian, W., and Robledo, L. F.: Landslide displacement prediction by using Bayesian optimization–temporal convolutional networks, Acta Geotech., 19, 4947–4965, https://doi.org/10.1007/s11440-023-02205-8, 2024.
Zeng, A., Chen, M., Zhang, L., and Xu, Q.: Are transformers effective for time series forecasting?, in: Proceedings of the AAAI Conference on Artificial Intelligence, 11121–11128, https://doi.org/10.1609/aaai.v37i9.26317, 2023.
Zeng, T., Jiang, H., Liu, Q., and Yin, K.: Landslide displacement prediction based on Variational mode decomposition and MIC-GWO-LSTM model, Stoch. Environ. Res. Risk Assess., 36, 1353–1372, https://doi.org/10.1007/s00477-021-02145-3, 2022.
Zhang, J., Tang, H., Li, C., Gong, W., Zhou, B., and Zhang, Y.: Deformation stage division and early warning of landslides based on the statistical characteristics of landslide kinematic features, Landslides, 21, 717–735, https://doi.org/10.1007/s10346-023-02192-7, 2024.
Zhuang, Y., Xing, A., Jiang, Y., Sun, Q., Yan, J., and Zhang, Y.: Typhoon, rainfall and trees jointly cause landslides in coastal regions, Eng. Geol., 298, 106561, https://doi.org/10.1016/j.enggeo.2022.106561, 2022.
- Abstract
- Introduction
- The Engineering Problem: Early Warning Characteristics and System Limitations
- Towards an AI-Driven Solution: Problem Definition and Dataset Construction
- Method
- Discussion
- Conclusion
- Code and data availability
- Author contributions
- Competing interests
- Disclaimer
- Special issue statement
- Acknowledgements
- Financial support
- Review statement
- References
- Abstract
- Introduction
- The Engineering Problem: Early Warning Characteristics and System Limitations
- Towards an AI-Driven Solution: Problem Definition and Dataset Construction
- Method
- Discussion
- Conclusion
- Code and data availability
- Author contributions
- Competing interests
- Disclaimer
- Special issue statement
- Acknowledgements
- Financial support
- Review statement
- References