
the Creative Commons Attribution 4.0 License.
the Creative Commons Attribution 4.0 License.
 | 30 Oct 2026
Multi-data source based quantifying urban flood severity in major Chinese cities (2000–2024) using a hybrid machine-learning weighting framework
Guoqiang Peng
Yujing Sun

Mao Wang
Fengyuan Zhang
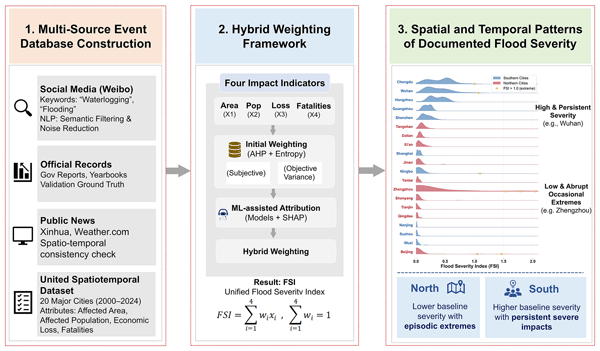
Urban flooding poses a critical challenge to sustainable urban development, yet long-term comparative assessments remain limited by fragmented and heterogeneous disaster records. To address this gap, this study integrates multi-source flood-event data from 20 major Chinese cities during 2000–2024 and develops an impact-based framework for assessing urban flood severity. Official statistics, news reports, and social media records are combined to construct an event-level flood database, which supports the development of a Flood Severity Index (FSI). A hybrid weighting framework that combines conventional weighting schemes with machine-learning-assisted indicator attribution is developed to improve the robustness and interpretability of severity assessment. The results reveal pronounced spatial heterogeneity: southern cities exhibit higher average severity levels and more frequent high-severity events, whereas northern cities generally show lower baseline severity but remain vulnerable to episodic extreme flood impacts. Temporal analysis indicates substantial interannual variability rather than a consistent long-term increasing or decreasing trend. These findings highlight the need for region-specific flood management strategies, including reducing persistent high-severity impacts in southern cities and improving preparedness for abrupt extreme events in northern cities. This study demonstrates the value of integrating fragmented historical records into a comparable framework for urban flood severity assessment.
- Article
(6340 KB) - Full-text XML
-
Supplement
(1435 KB) - BibTeX
- EndNote


Global climate change and rapid urbanization have led to a significant increase in the frequency and intensity of urban flood events (Rentschler et al., 2023). As one of the most destructive natural hazards in urban areas (Bagheri and Liu, 2025), urban flooding has become a major barrier to achieving global sustainable development goals (Xu et al., 2023). Urban flood impacts are jointly driven by hydroclimatic extremes and urban development processes, producing substantial spatial heterogeneity and temporal variability (Yin et al., 2016; Wu et al., 2020; Qi et al., 2024). A comprehensive understanding of the spatial and temporal evolution of flood severity, together with a critical review of existing research, is therefore essential for informing future planning, enhancing disaster prevention and mitigation capacity, and improving urban resilience (Sanders et al., 2023).
In urban flood research, assessment has increasingly adopted a multi-scale framework spanning micro-scale process simulation, macro-scale risk characterization, and near-real-time decision support. At the micro scale, physically based hydrodynamic models (e.g., SWMM and MIKE21) are widely used to reproduce urban inundation dynamics at high spatiotemporal resolution (Bhusal et al., 2024; Yang et al., 2020). Recent work further improves surface routing and backflow representation through coupled frameworks, enhancing simulations of inundation extent, depth, and duration (Yang et al., 2023). At broader spatial scales, from cities to regions, research has expanded from hazard mapping to integrated assessments that jointly consider hazard, exposure, and vulnerability (Wing et al., 2020), often implemented through multi-indicator frameworks combined with GIS and MCDA (Chen et al., 2024). For example, spatiotemporal flood risk in Zhengzhou (2005–2020) has been examined by integrating Random Forest with MCDA (Li et al., 2023b; Wang et al., 2024), whereas flood resilience has been evaluated by combining Random Forest and Support Vector Machine models with the Analytic Hierarchy Process (Hussain et al., 2023). Regional frameworks have also applied hybrid weighting methods to synthesize hazard severity, environmental exposure, and socio-economic vulnerability (Peng and Zhang, 2022), and GIS–MCDA has been used to assess flood susceptibility in data-scarce regions (Ahmad et al., 2025; Xu et al., 2025). Meanwhile, data-driven approaches for flood monitoring, early warning, and emergency response have become major research hotspots. With advances in remote sensing, social media analytics, and artificial intelligence (Dai et al., 2024; Tellman et al., 2021), near-real-time flood monitoring and decision support for emergency management are increasingly feasible (Zhang et al., 2023; Misra et al., 2025). Social media data enable rapid flood classification and post-disaster monitoring (Tan and Schultz, 2021). Moreover, multimodal frameworks fusing remote-sensing imagery with textual data provide more intuitive and quantitative grounded representations of urban flood vulnerability (Duan et al., 2024).
Although large-scale studies have examined flood vulnerability and human–environment interactions (Ban et al., 2023; Rogers et al., 2025), research that uses flood events to reveal inter-city differences in flood responses and their links to divergent urban development patterns remains limited. This gap is underscored by recent catastrophic urban flood events – such as the 2021 Zhengzhou rainstorm–flood and major flood events in Beijing – in which severe inundation contributed to substantial casualties, highlighting the urgency of systematically comparing how different cities experience, absorb, and recover from flood disasters. This gap can be attributed to three main limitations. First, most studies focus on individual river basins (e.g., the Yangtze River, the Pearl River) or megacities (e.g., Beijing, Shanghai), and systematic cross-regional comparisons among cities of different sizes and geographic characteristics are largely lacking. This limitation constrains the identification of universal patterns and regional disparities in urban flood risk (Guo et al., 2021; Jiang et al., 2018; Li et al., 2023a). Second, existing evaluation frameworks for flood severity remain incomplete. Many frameworks primarily emphasize hazard-inducing factors (e.g., extreme rainfall), whereas quantitative analyses of vulnerability – particularly economic losses, affected area, and social impacts – are still insufficient (Li et al., 2025). As a result, the integrated severity of urban flood disasters is not fully captured. Third, long-term disaster datasets remain scarce. Many studies rely on short, fragmented records or simulated events (Zhang et al., 2025), while multi-decadal, event-based urban flood databases that combine official statistics, documentary records, and social media information are still rare (Cao et al., 2022; Romali et al., 2025).
To address these gaps, this study develops a unified framework to evaluate and compare urban flood-event severity across 20 representative cities in northern and southern China during 2000–2024. This study is motivated by three major needs: (1) establishing consistent, long-term, and comparable evidence of urban flood impacts from fragmented historical records; (2) developing a robust and interpretable severity assessment framework that integrates expert knowledge, statistical characteristics, and data-driven indicator contributions beyond conventional linear weighting approaches; and (3) characterizing the spatial and temporal variations of documented flood-event severity among cities with different climatic and urban contexts. The study focuses on constructing an impact-based severity assessment framework and identifying spatiotemporal patterns of documented flood events.
2.1 Study area
To support a north–south comparison of urban flood severity, this study delineates a Northern Urban Region (NUR) (34–41° N, 112–122° E; mainly north of the Qinling–Huaihe Line) and a Southern Urban Region (SUR) (28–32° N, 110–122° E; Yangtze River Delta and surrounding cores). Because total GDP is strongly correlated with population size and urban extent and thus reflects development intensity, the top ten cities by GDP were selected in each region (Hu et al., 2024; Fang et al., 2026). The NUR features a temperate monsoon climate with dry winters and concentrated summer rainfall. Water resources are uneven and generally scarce, placing cities under combined pressures of water scarcity and flood risk (Luo et al., 2023). The northern cities are Beijing, Tianjin, Qingdao, Zhengzhou, Jinan, Xi'an, Yantai, Tangshan, Shenyang, and Dalian. Sponge-city initiatives and drainage upgrades have been promoted, yet coping with climate change–driven extremes remains challenging under rapid urbanization and rigid water constraints (Yin et al., 2021; Liu et al., 2022). The SUR has a subtropical monsoon climate, abundant precipitation, and dense river networks, and is highly exposed to typhoons, torrential rainfall, and basin-scale floods (Wang et al., 2022a), as illustrated by the 2020 Yangtze flooding impacts in Wuhan (Ge and Zhu, 2023). The southern cities are Shanghai, Shenzhen, Guangzhou, Wuxi, Chengdu, Suzhou, Hangzhou, Wuhan, Nanjing, and Ningbo. Despite relatively strong flood-control capacity, long-term pressures persist due to sea-level rise, intensified extremes, surface hardening, and the “rain island effect” (Liang and Ding, 2016). Chongqing (GDP rank 9) was excluded because persistent fog degrades remote-sensing imagery; Wuxi (rank 11) was substituted (Fig. 1).
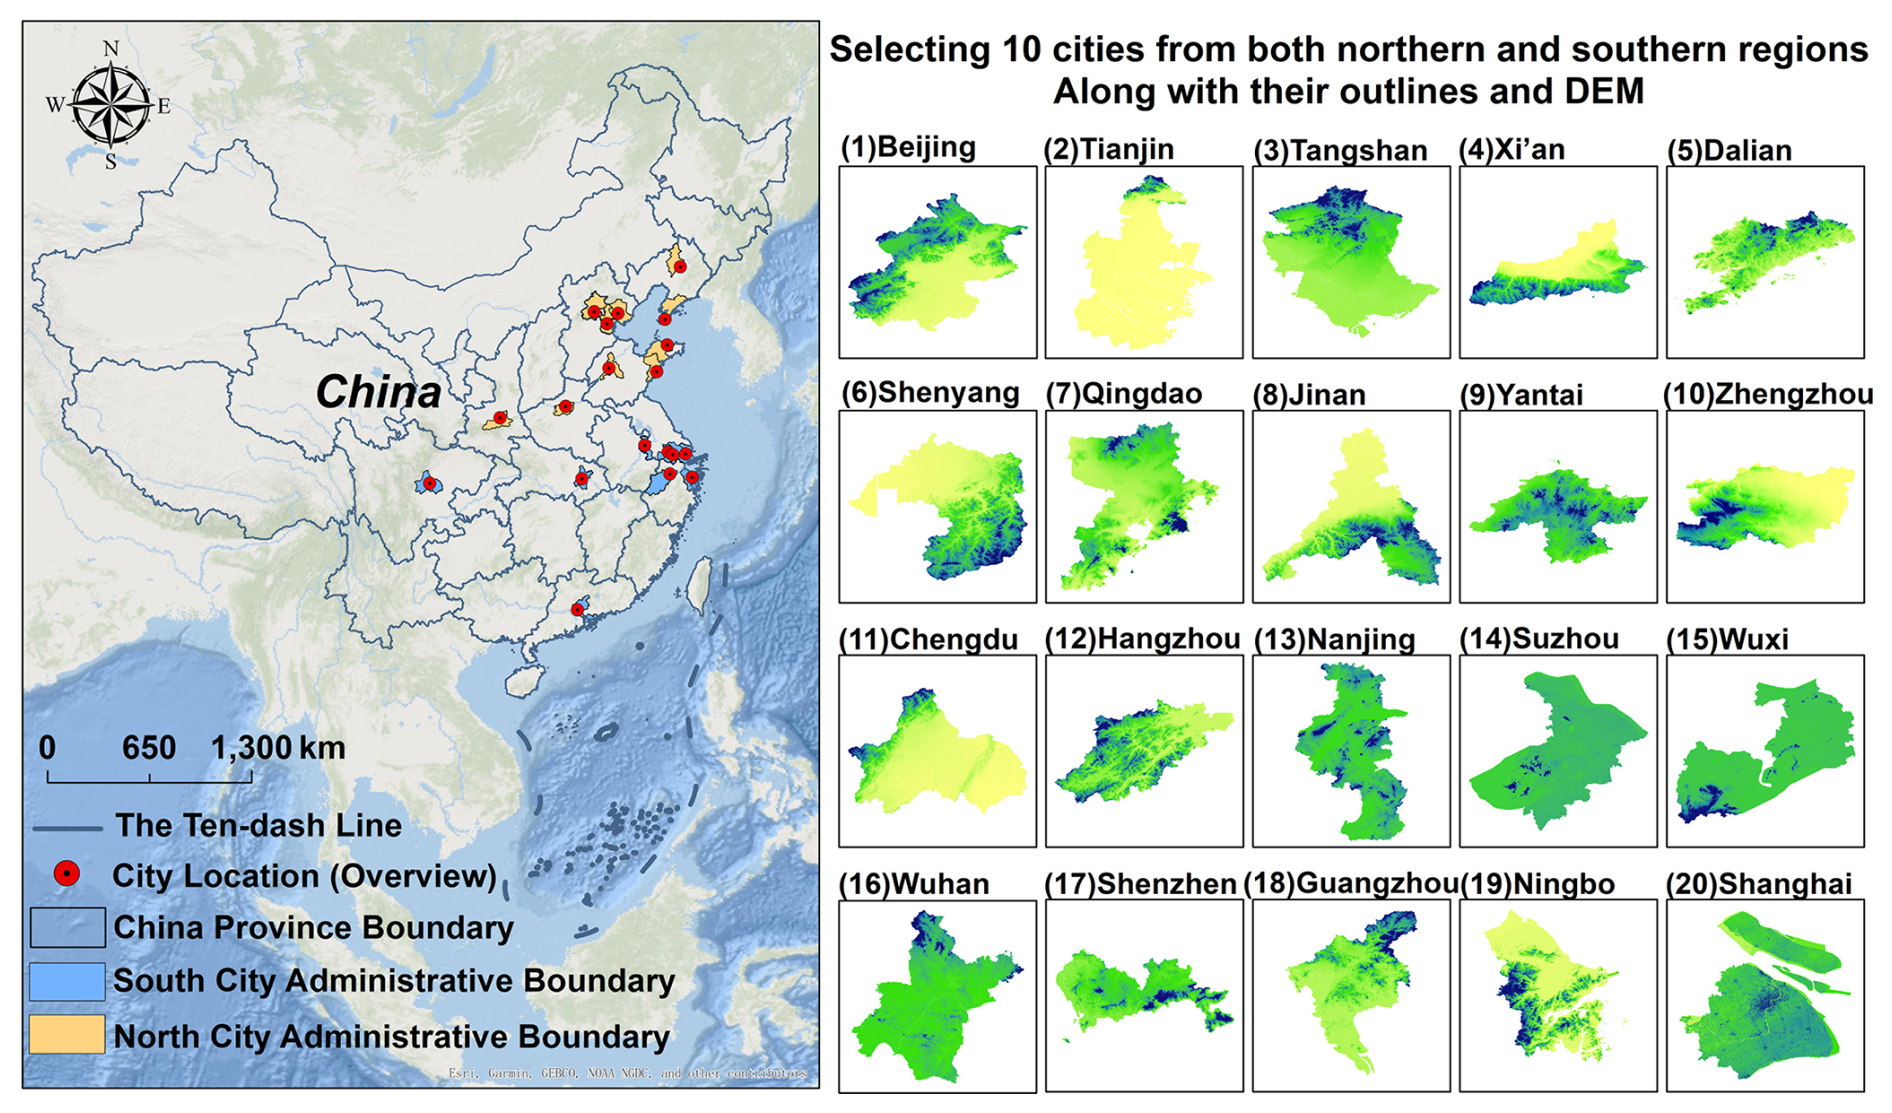
Figure 1Study area and geographical distribution of the 20 sample cities (Esri, Garmin, GEBCO, NOAA NGDC, and other contributors | Powered by Esri).
2.2 Data Sources and Processing
2.2.1 Data sources
The flood disaster data used in this study were primarily obtained from two sources: social media text data and authoritative news reports.
A Python-based web crawler was used to collect flood-related public posts from Sina Weibo for the period 2010–2024. The search combined the names of the 20 study cities with keywords such as “urban waterlogging,” “rainstorm flooding,” “road inundation,” and “drainage congestion.” The collected information included post content, publication time, geographic information, and available user attributes.
A rule-based natural language processing procedure was then applied to screen the collected posts. Text cleaning and Chinese word segmentation were performed using Jieba, after which flood-related keywords and exclusion terms were used to identify relevant posts (Fu et al., 2025). Advertisements, weather forecasts without reported flood impacts, unrelated discussions, duplicate posts, and repeated reposts were removed. Posts reporting the same flood process in the same city and during the same period were merged into one candidate event. The remaining records were manually checked against official government bulletins and authoritative news reports to confirm their occurrence time, location, and reported impacts. Official sources included Statistical Yearbooks, Xinhua News Agency, People's Daily, China Weather Network, and reports issued by local meteorological, flood-control, and emergency-management departments. These sources were used both to verify social-media records and to supplement information on affected population, affected area, fatalities, and direct economic losses. For 2000–2009, when Weibo data were unavailable, flood events were identified mainly from official records and archived news reports. After data cleaning, duplicate removal, cross-source verification, and event consolidation, the final database contained 1157 urban flood event records (including 81 routes in Beijing, 131 routes in Chengdu and so on).
2.2.2 Additional socioeconomic, urban morphology, and validation datasets
To support sensitivity analyses and external validation, additional socioeconomic, urban morphology, and hydroclimatic datasets were collected. Annual population data for the 20 cities from 2000–2024 were obtained from the LandScan global population dataset (https://landscan.ornl.gov, last access: 27 October 2026), which provides spatially distributed population estimates. City-level GDP data during 2000–2024 were compiled from official statistical yearbooks of the corresponding prefecture-level cities. Built-up area data were derived from the China Urban Statistical Yearbook, using prefecture-level urban land-use statistics to represent changes in urban development intensity. These datasets were not used as direct indicators in the construction of the FSI but were applied in sensitivity analyses to evaluate the influence of exposure normalization, including population-normalized affected population, built-up-area-normalized affected area, and GDP-normalized economic losses.
For external validation, independently documented flood events with authoritative severity classifications were collected. Event-level precipitation information, including city-wide mean rainfall and maximum accumulated rainfall (mm), was obtained from the China Meteorological Data Service Centre (https://data.cma.cn, last access: 27 October 2026) and hydrological yearbooks. These rainfall variables were used to support the external consistency evaluation of FSI-derived severity grades and were not included in model training or FSI construction.
The administrative boundary data were derived from Tianditu, the National Platform for Common Geospatial Information Services of China (https://map.tianditu.gov.cn/, last access: 27 October 2026). The DEM data were obtained from the Copernicus DEM GLO-30 dataset available on the Google Earth Engine platform (https://earthengine.google.com/, last access: 27 October 2026), with the dataset ID COPERNICUS/DEM/GLO30 and a spatial resolution of approximately 30 m. In this study, the DEM data were only used for background visualization and topographic description in the study area presentation. They were not incorporated as input variables in the construction of the Flood Severity Index (FSI) or the machine-learning framework.
2.2.3 Dataset construction and interpolation
Based on the above data sources, an integrated urban flood disaster database was constructed for the 20 sample cities. The database records event occurrence time, geographic location, fatalities, affected area, affected population and direct economic losses.
Because the availability of disaster information sources varied over time, potential temporal differences in event detection were considered during database construction. For the period before widespread social-media availability (2000–2009), flood events were mainly identified from official statistical records, government reports, and archived news sources. For the period from 2010–2024, social-media information from Sina Weibo was additionally incorporated to complement official records and authoritative news reports, allowing the identification of more localized flood events and supplementary impact information. Therefore, the temporal variation in the database represents documented flood events rather than a complete record of all flood occurrences, and changes in event numbers or severity distributions should be interpreted considering possible differences in information availability.
To improve the reliability of event identification, social-media-derived records were not directly included as independent events. Candidate events were cross-checked with official records and authoritative reports whenever possible, and records describing the same flood process in the same city and time period were consolidated into a single event.
Among the 1157 documented flood events, only 15 records contained at least one missing attribute, accounting for approximately 1.3 % of the dataset. These missing values were replaced with the global median of the corresponding indicator. Median imputation was selected because the disaster-impact variables were strongly right-skewed and contained several extreme observations, making the median less sensitive to exceptionally severe events than the arithmetic mean. Given the very low missing-data rate, the use of a global median also avoided potentially unstable estimates from city- or period-specific subsets with limited observations. Imputation was applied only to missing attributes of confirmed flood events; it was not used to create events for city-years without documented flood records. Zero values in the fatality variable represented events with no recorded deaths and were retained as observed values rather than treated as missing or imputed observations.
The resulting database integrates multi-source spatiotemporal information and disaster-impact indicators, providing the empirical basis for event-level flood-severity assessment. The potential influence of temporal changes in information availability was further examined through sensitivity analyses in the temporal analysis section.
3.1 Construction of the Impact-Based Flood Severity Index
The revised FSI is designed to quantify the realized consequences of documented flood events. Accordingly, the core index focuses on four direct impact dimensions: affected area, affected population, direct economic losses, and fatalities. To improve comparability among cities with different population sizes, urban extents, and economic scales, three indicators are normalized using corresponding exposure variables. The normalized indicators are defined as:
where Ai, Pi, Li, and Di represent the normalized affected area, affected population, relative economic loss, and fatality indicators for flood event i, respectively (Table S1 in the Supplement). Fatalities are retained as an absolute indicator because human losses represent irreversible consequences whose interpretation is not equivalent to exposure-scaled socioeconomic impacts. A sensitivity analysis using population-normalized fatalities is conducted to examine the robustness of this choice (Table S2).
All indicators are further transformed into comparable dimensionless values using min–max normalization:
where xi denotes the original normalized indicator value and zi represents the transformed indicator used in subsequent weighting procedures.
3.2 Initial Weighting Schemes
Two complementary weighting approaches are used to construct initial FSI representations: the Analytic Hierarchy Process (AHP), representing expert knowledge, and entropy weighting (EWM), representing information variability among observed events. For a given weighting method m, the initial continuous FSI is calculated as:
where represents the initial weight assigned to indicator i under weighting scheme m, and zi is the normalized indicator value.
The resulting AHP-based and entropy-based FSIs are regarded as reference indices for subsequent machine-learning-assisted refinement rather than independent ground-truth severity measures.
3.3 Machine-Learning-Assisted Weight Refinement Framework
The machine-learning component is designed to refine and evaluate the stability of the initial weighting schemes. The continuous AHP-based and entropy-based FSI values are used as regression targets, while the four impact indicators are used as predictors.
Five regression algorithms are evaluated, including Random Forest (RF), Gradient Boosting Decision Tree (GBDT), XGBoost, LightGBM, and Multi-Layer Perceptron (MLP). The models are not intended to independently predict flood severity, but rather to examine whether different algorithms can consistently reconstruct the initial impact-based indices.
3.4 Nested Cross-Validation and SHAP-Based Attribution
To reduce overfitting and information leakage, a nested cross-validation strategy is applied. The outer loop uses 10-fold cross-validation for out-of-sample evaluation, while the inner loop applies five-fold GridSearchCV for hyperparameter optimization (Zhao et al., 2024).
For each outer fold, model parameters are optimized only using the training subset. The selected model is then refitted using the complete training partition and evaluated on the independent held-out fold. Model performance is evaluated using:
where yi and represent observed and predicted initial FSI values.
SHAP values are calculated using an out-of-fold strategy. Each event is explained by a model that was not trained or tuned using that event, providing less biased estimates of indicator contributions.
3.5 Hybrid Weight Construction
The SHAP-derived indicator contributions are normalized and integrated with the initial AHP or entropy weights to obtain hybrid weights:
where qi represents the normalized SHAP contribution of indicator i and α controls the relative contribution of prior weighting knowledge and data-driven attribution. The final continuous Flood Severity Index is calculated as:
The machine-learning framework is therefore interpreted as a data-driven refinement approach rather than an independent discovery of the true flood-severity weights.
3.6 Severity Classification and Independent Evaluation
The continuous FSI values are subsequently categorized into six severity levels (0–5) using quantile-based classification. These categories are used only for visualization and comparison with independently assessed severity grades and are not used during model training or weight estimation.
Independent evaluation is conducted using a subset of documented flood events with authoritative severity assessments. The disaster response levels for these 53 events were completely excluded from all stages of FSI construction and machine-learning analysis, including indicator weighting, model training, hyperparameter optimization, SHAP attribution calculation, and severity-threshold determination. The independently assessed severity grades were used only after the final continuous FSI had been generated to evaluate its external consistency. The agreement between the FSI-derived severity levels and independent assessments was quantified using Spearman rank correlation, weighted Cohen's kappa, exact agreement, and adjacent-level agreement statistics. In addition, rainfall-related variables, including event-associated mean rainfall and maximum cumulative rainfall, were collected for these events to evaluate the hydrometeorological consistency of the resulting FSI. These rainfall variables were not included in the FSI construction or model optimization, but were used only as independent contextual information.
3.7 Severity Research framework
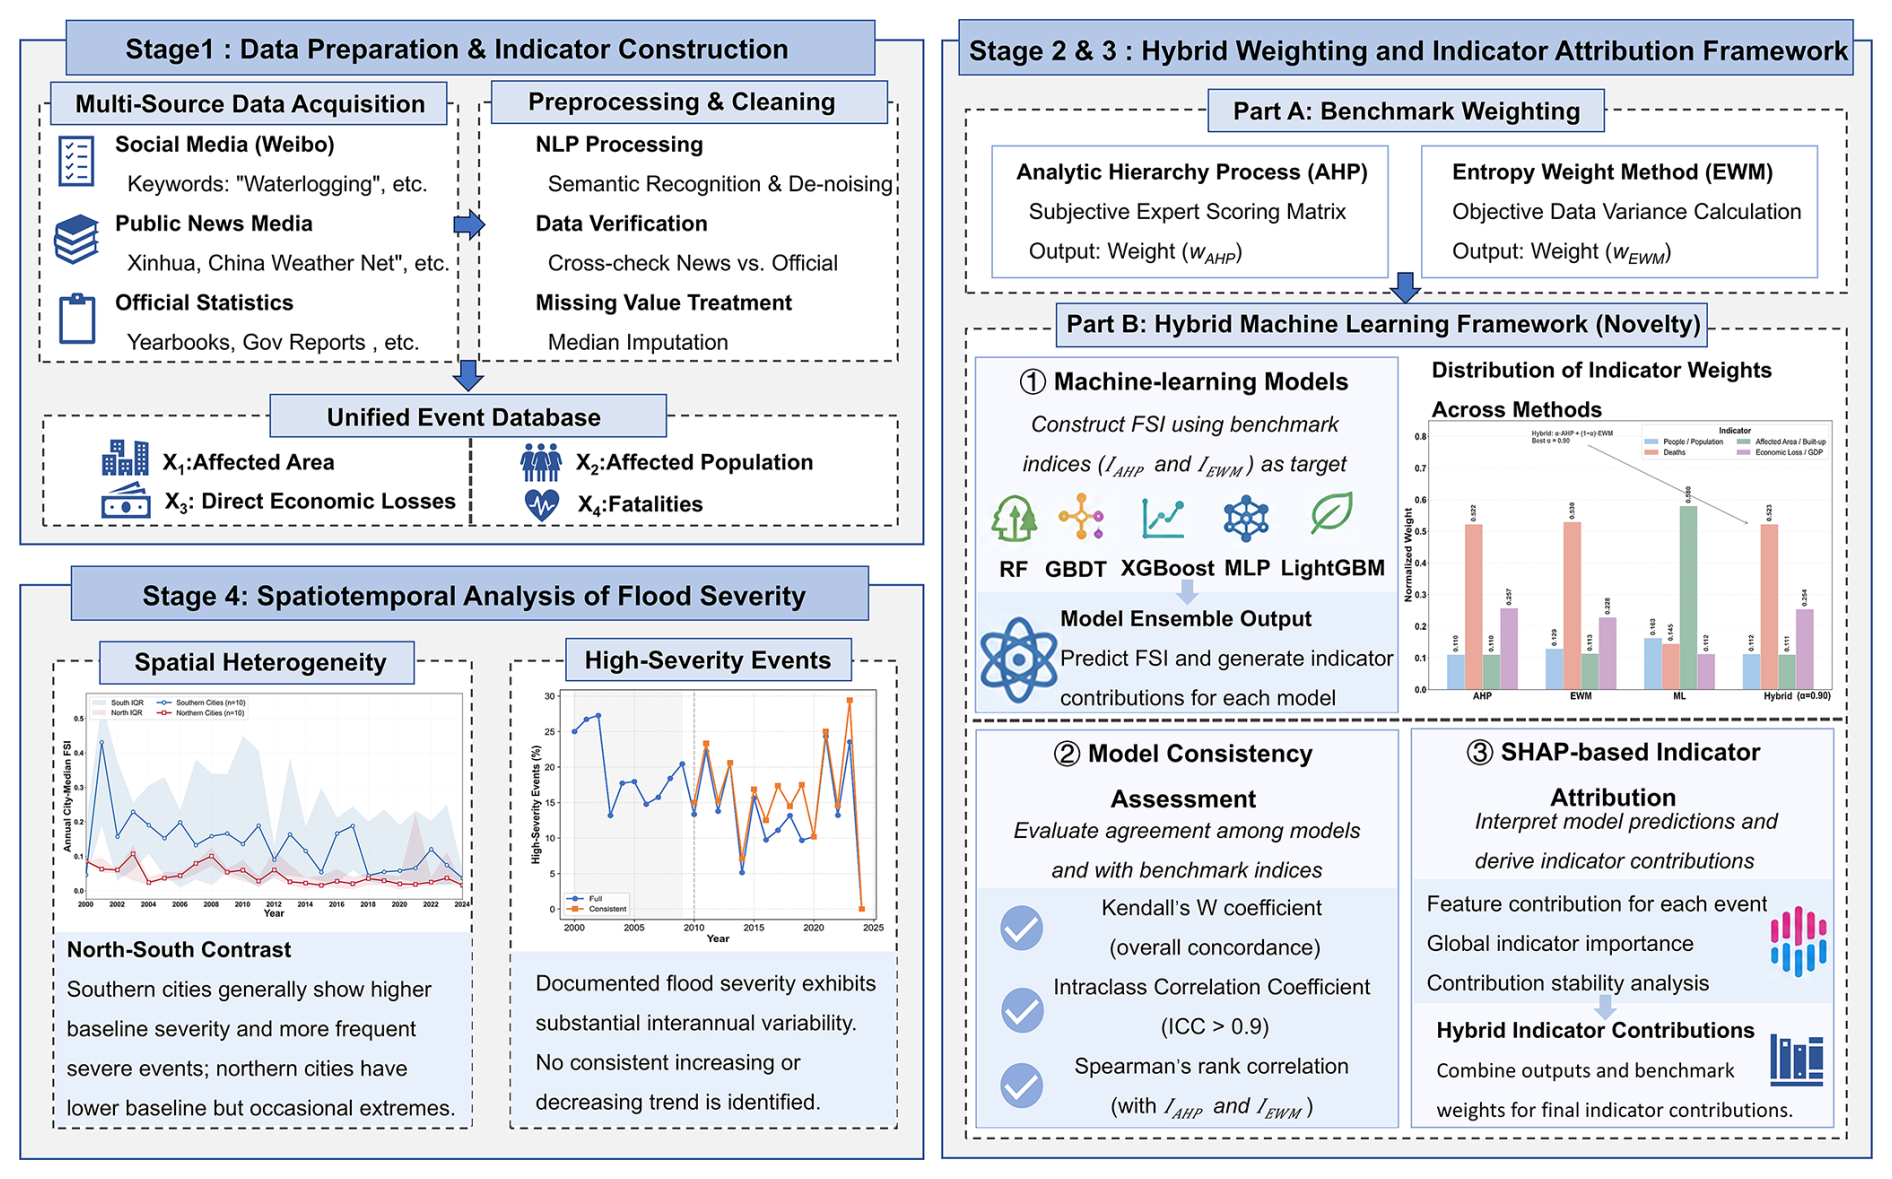
As illustrated in Fig. 2, the proposed framework consists of four sequential stages:
-
Multi-source data preparation and flood severity index construction
Multi-source flood-event records were collected, integrated, and standardized to construct an event-level flood database. Based on four direct-impact indicators, including affected area, affected population, economic losses, and fatalities, a Flood Severity Index (FSI) was developed to provide a comparable measurement of documented flood severity across cities and years.
-
Machine-learning-assisted indicator contribution analysis
Multiple machine-learning algorithms were implemented to examine the contribution patterns of individual indicators within the flood severity assessment framework. The consistency of indicator importance across different algorithms was evaluated through cross-validation and robustness analysis, providing data-driven evidence for identifying stable contribution patterns of severity indicators.
-
Hybrid weighting and interpretability analysis
The machine-learning-derived indicator contributions were integrated with conventional weighting approaches, including AHP and EWM, to construct a hybrid weighting framework. SHAP analysis was further applied to interpret the contribution patterns and directional effects of individual indicators, ensuring that the final weighting structure remained interpretable and consistent with observed flood impacts.
-
Spatiotemporal analysis of urban flood severity
The established FSI framework was applied to evaluate spatial differences and temporal variations in documented flood severity among the 20 cities from 2000–2024. This analysis revealed regional heterogeneity, city-specific severity characteristics, and interannual variability in urban flood impacts.
The proposed framework combines expert-based knowledge, statistical weighting, and machine-learning-assisted attribution to improve the robustness and interpretability of large-scale flood severity assessment. Unlike purely subjective weighting approaches, the framework incorporates data-driven evidence to examine indicator contributions, while maintaining transparency through interpretable weighting schemes and SHAP-based analysis.
4.1 Model performance
The data-driven indicator contributions were derived from five representative machine-learning algorithms (RF, GBDT, XGBoost, LightGBM, and MLP) using out-of-fold SHAP analysis. The resulting SHAP attribution values were normalized to obtain the data-driven contribution weights (wML). Unlike AHP, which incorporates expert knowledge through a predefined weighting structure, and the Entropy Weight Method (EWM), which determines weights according to statistical characteristics of the observed indicators, the machine-learning-based contributions provide additional information regarding the relative importance of each indicator in reconstructing the initial FSI.
Across the evaluated models, the affected-area-to-built-up-area ratio (x1) and affected-population ratio (x2) consistently showed the largest contributions, whereas fatalities (x3) and relative economic losses (x4) provided comparatively smaller contributions. This consistent attribution pattern suggests that spatial extent and demographic impact were the primary dimensions distinguishing documented flood-event severity within the dataset. The results are also consistent with the impact-based definition of flood severity, in which the extent of affected areas and exposed populations represent major dimensions of disaster consequences. These machine-learning-derived contributions were not interpreted as independent discovery of causal weights. Instead, they were used as data-driven information to refine the initial AHP/EWM weighting schemes and construct the final hybrid FSI.
4.1.1 Out-of-sample reconstruction performance and cross-model stability
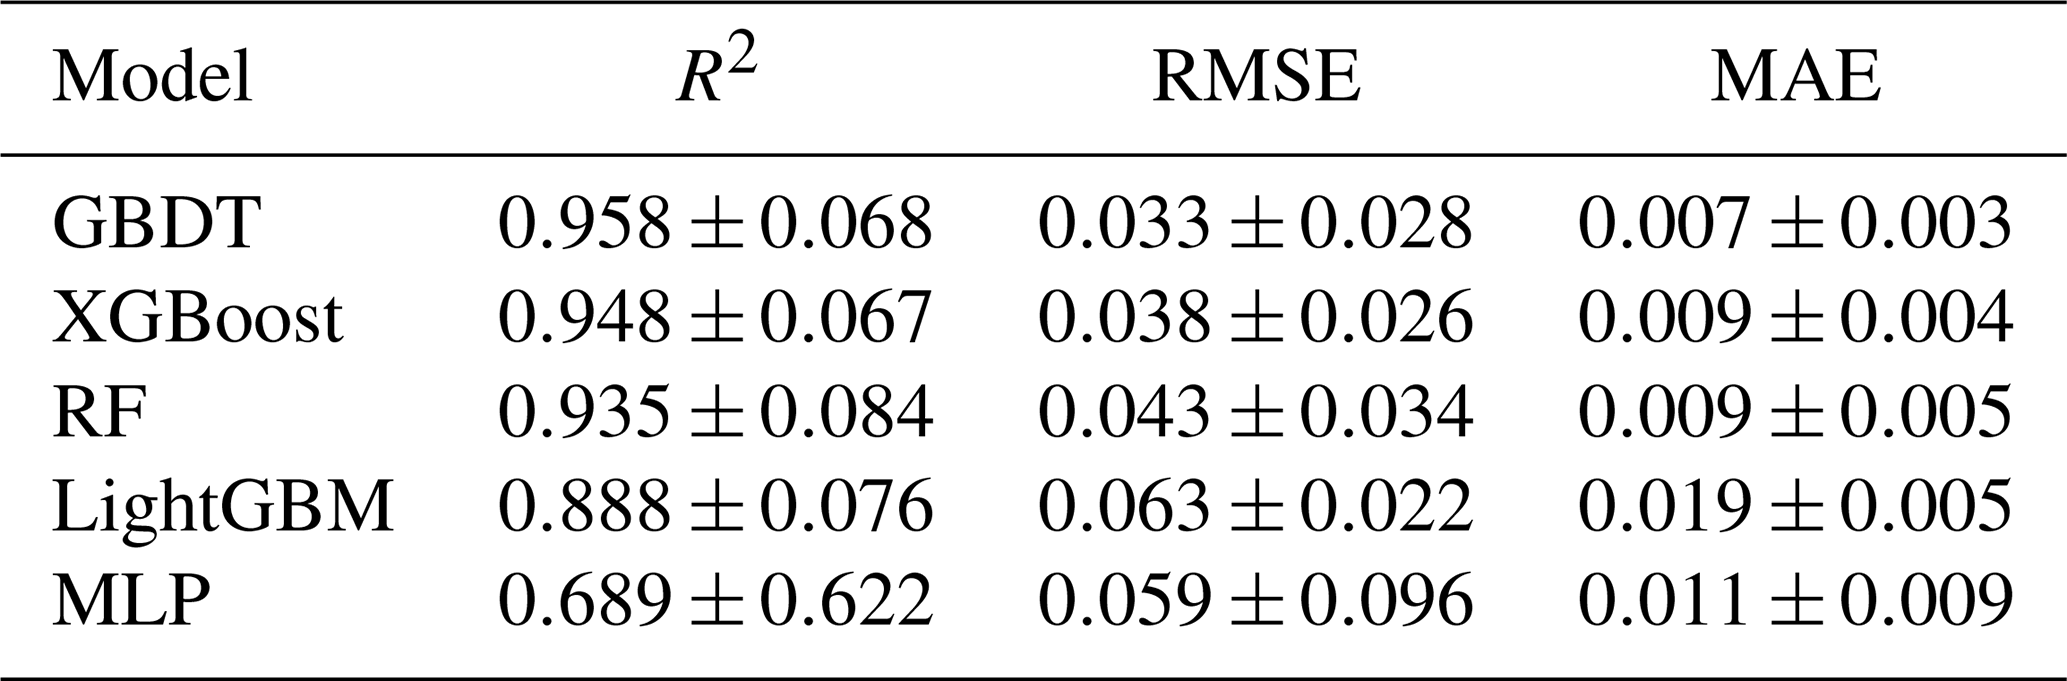
The linear-regression baseline achieved an R2 of 1.000, confirming that each initial reference FSI was a deterministic weighted combination of the normalized impact indicators. The machine-learning results should therefore be interpreted as out-of-sample reconstruction of the AHP- and entropy-based reference indices, rather than prediction of an independently observed measure of flood severity. To ensure reproducible and unbiased model evaluation, nested cross-validation was implemented. Detailed hyperparameter search spaces and optimization procedures are provided in Supplement Material S3 (Table S3). Under nested cross-validation, the tree-based models reproduced the reference indices most consistently. GBDT achieved the highest mean held-out performance (), followed by XGBoost (0.948±0.067) and RF (0.935±0.084). LightGBM produced lower but still positive out-of-sample performance, whereas MLP showed the largest fold-to-fold variability (), indicating sensitivity to sample partitioning.
Table 1Out-of-sample performance of machine-learning models evaluated by nested cross-validation.
The cross-model diagnostics retained the consistency pattern emphasized in the original manuscript. Feature-importance rankings showed significant concordance under both initial weighting schemes (AHP: Kendall's W=0.656, p<0.008; EWM: W=0.600, p<0.013). The average-measure intraclass correlation was also high (, 95 % CI [1.0, 1.0], p<0.001). The pairwise Spearman rank correlations of the predicted severity rankings revealed uniformly high and statistically significant correlations among the five models, demonstrating that the models produce highly consistent severity rankings across the event set, as shown in Fig. 3. These statistics indicate that different algorithmic structures generated similar reconstruction and attribution patterns conditional on the same reference indices. They do not, by themselves, establish the external validity of the FSI.
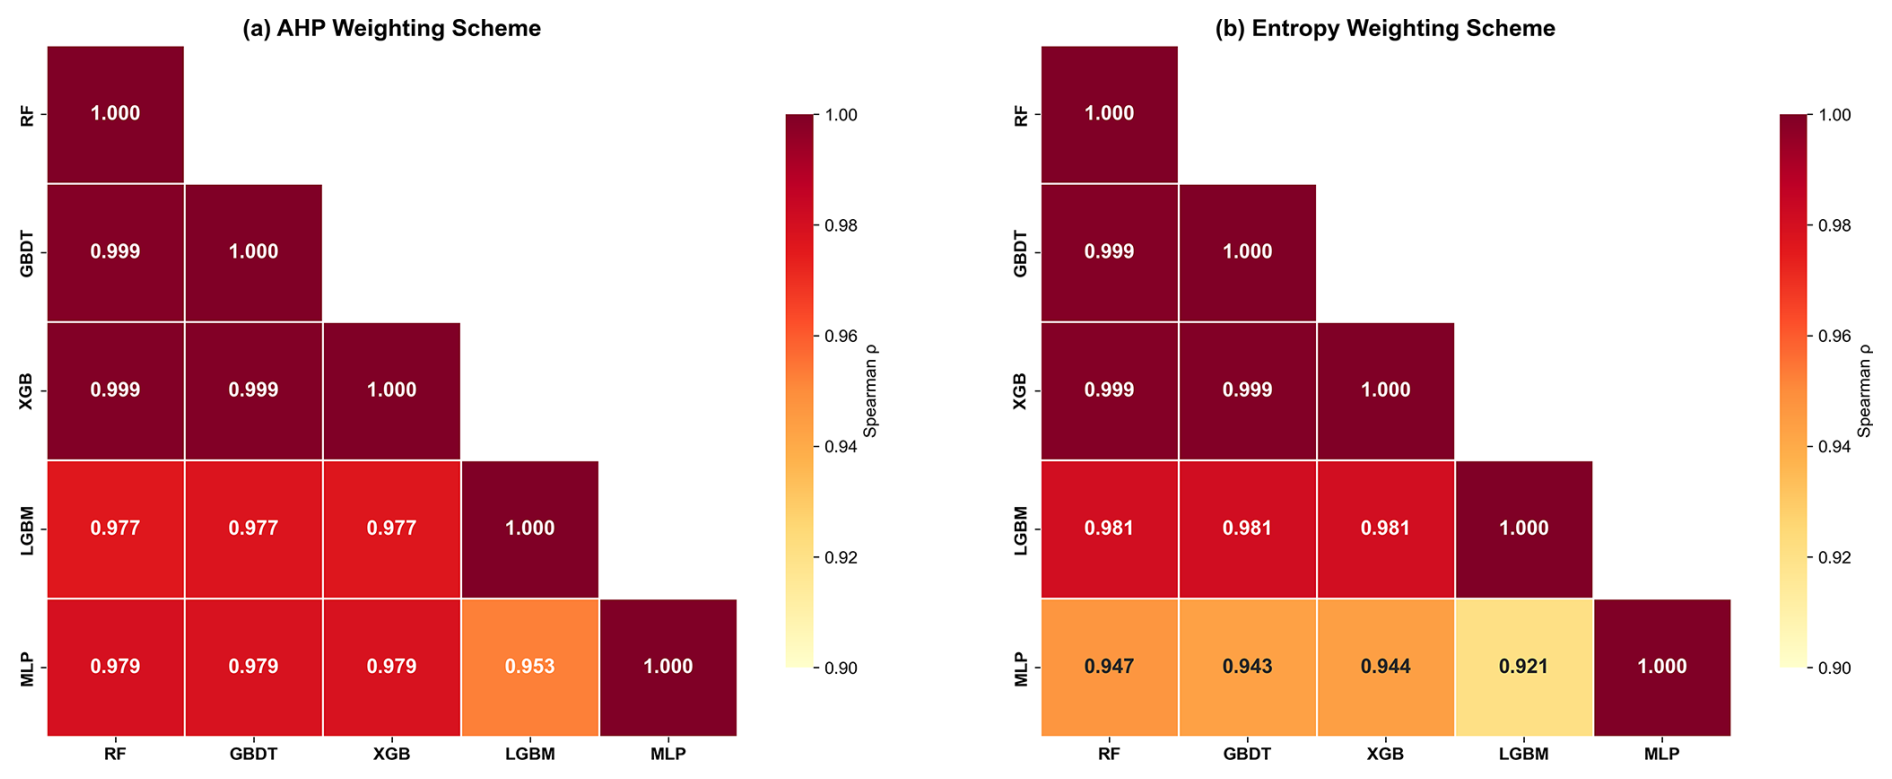
Figure 3Correlation matrix of severity rankings across five machine learning models using AHP and Entropy Weight methods, highlighting the average Spearman rank correlation coefficient
4.1.2 Robustness through multi-model attribution integration
The multi-model integration analysis demonstrated that the SHAP-derived contribution patterns were highly consistent across different algorithms. The aggregated data-driven contributions were therefore used to complement the initial AHP/EWM weights in the hybrid framework. This integration reduces the influence of individual model characteristics and improves the robustness of the resulting weighting scheme.
4.1.3 Out-of-fold indicator attribution and hybrid weighting
Out-of-fold SHAP analysis revealed a consistent contribution hierarchy among the four direct-impact indicators across the evaluated models. The affected-area-to-built-up-area ratio showed the largest average normalized attribution (0.707), followed by the affected-population ratio (0.166), fatalities (0.076), and relative economic loss (0.052). This indicates that spatial impact extent provided the strongest discrimination among documented flood events, while demographic and socioeconomic consequences supplied complementary information.
The dominance of the affected-area ratio does not imply that other indicators are redundant. Instead, it reflects the stronger contribution of spatial impact extent in distinguishing event-level severity within the current dataset.
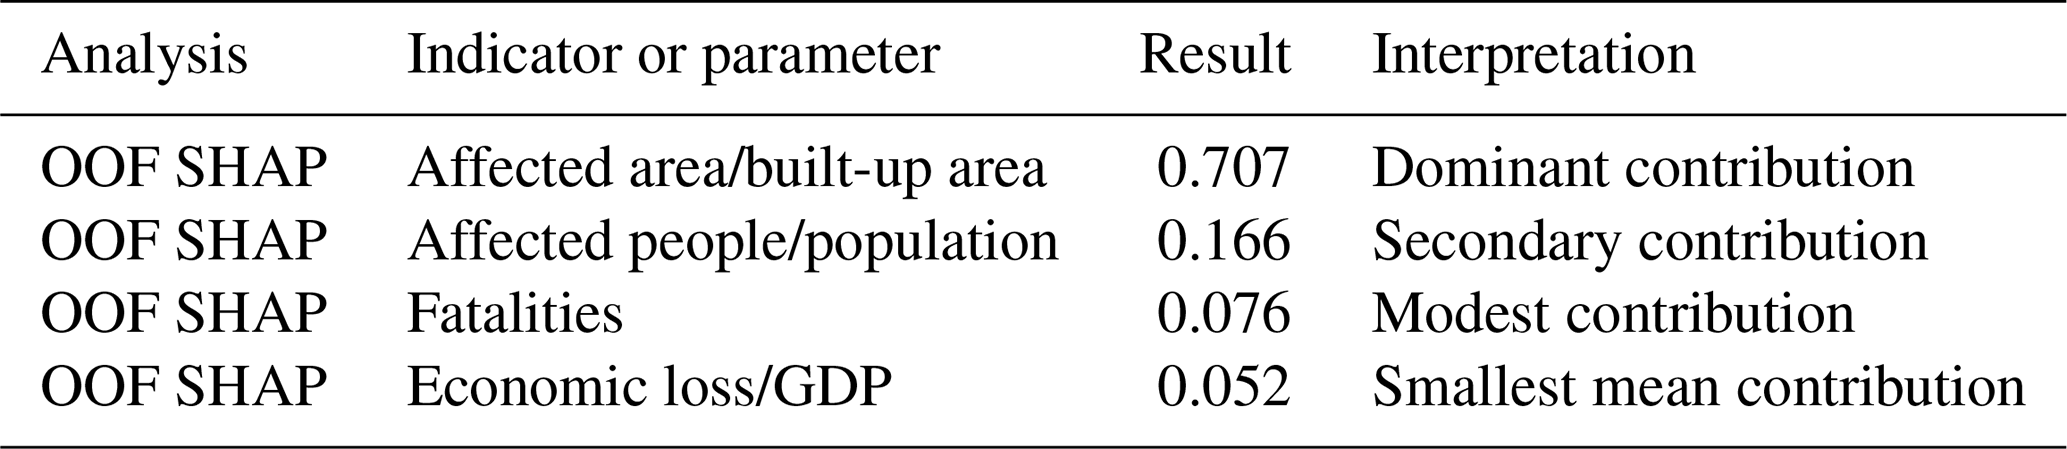
The additional robustness analyses supported this interpretation. Across 200 bootstrap iterations, the RF confidence-interval width for the area contribution was 0.25. In the leave-one-indicator-out analysis, removing the affected-area ratio reduced R2 by approximately 0.20–0.27, a larger deterioration than observed for the other indicators. The mixing-parameter sensitivity analysis selected α=0.90 under the tested hybrid specification, indicating that the expert-based prior remained the principal component while the data-derived information served as a refinement. Accordingly, the hybrid weighting should be interpreted as a constrained update of the initial weighting structure, not as recovery of uniquely true causal weights.

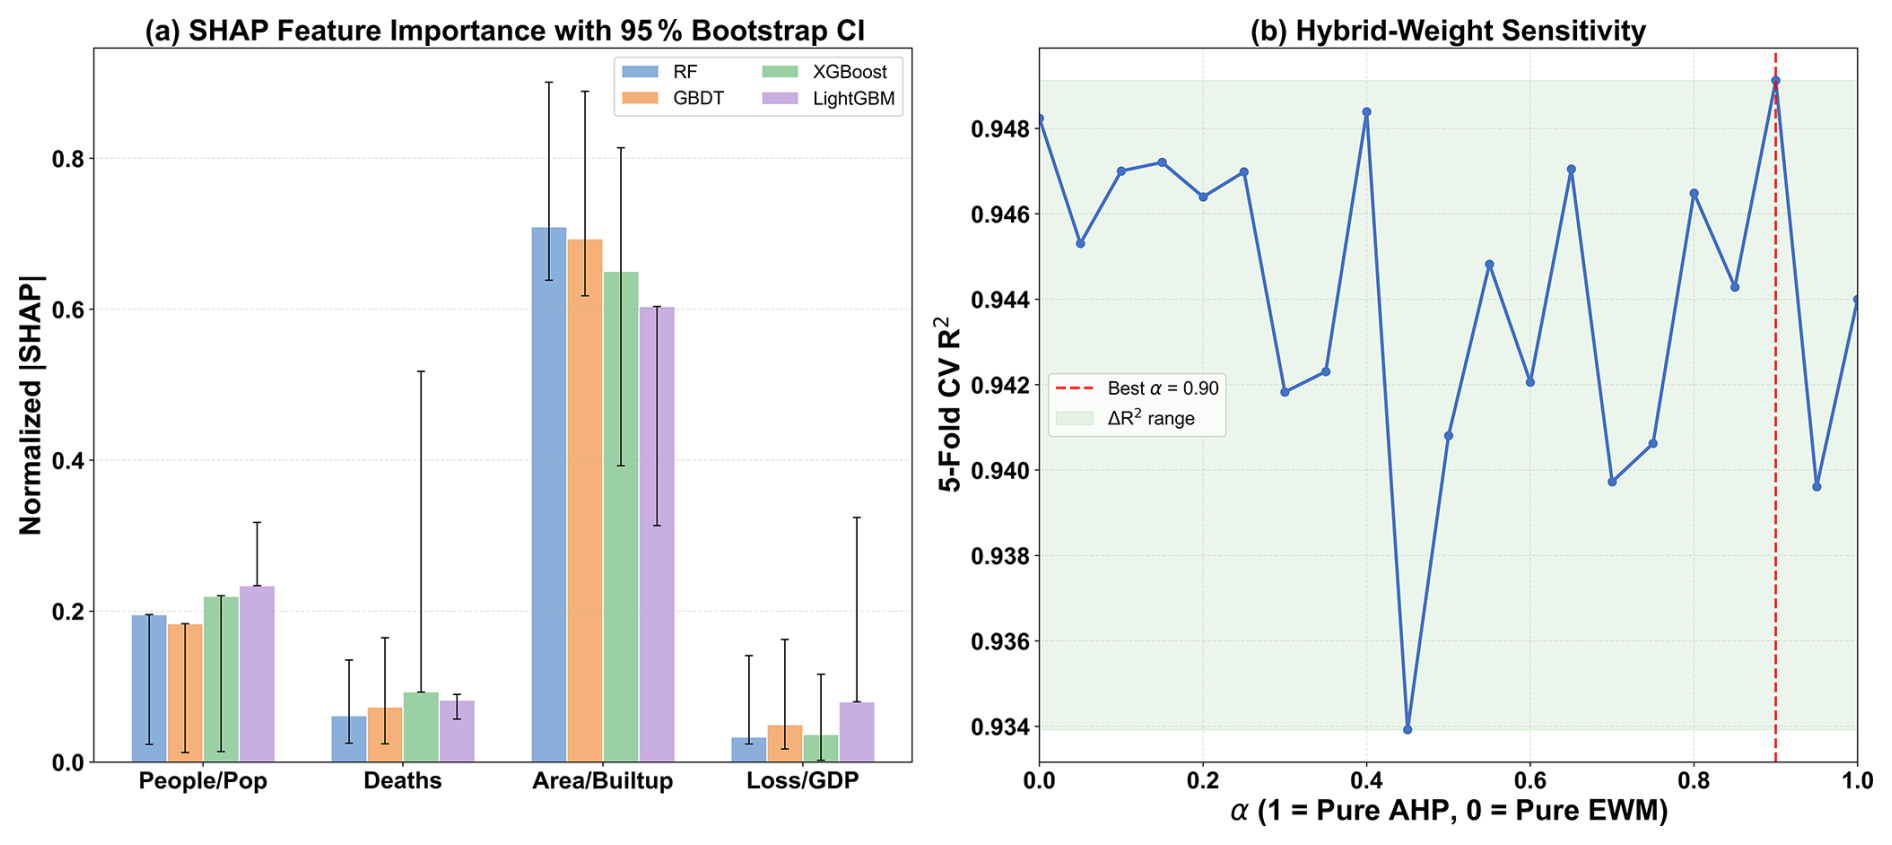
Figure 4Recommended presentation: (a) normalized out-of-fold SHAP contributions with bootstrap intervals; (b) hybrid-weight sensitivity across α.
4.1.4 Independent evaluation against authoritative severity assessments
External consistency was evaluated using 53 documented flood events with independently compiled severity grades derived from authoritative disaster-response classifications and official emergency-management records. These events represented approximately 4.6 % of the complete database and were completely excluded from model training, hyperparameter optimization, SHAP calculation, weight refinement, and severity-threshold determination. The comparison between the final FSI-derived severity grades and the independently assessed grades showed significant positive consistency (Spearman's ρ=0.506, p=0.0001). Weighted Cohen's κ reached 0.497, indicating moderate agreement while considering the ordered nature of the six severity categories. The categorical agreement analysis further demonstrated that most events were assigned comparable severity levels. Among the 53 evaluated events, 20 events (37.7 %) achieved exact agreement (Δ=0), while 21 events (39.6 %) differed by only one severity level (). Overall, 41 events (77.4 %) were classified as identical or adjacent severity levels. Only 12 events (22.6 %) showed larger discrepancies, including 7 events (13.2 %) with a two-level difference, 4 events (7.5 %) with a three-level difference, and 1 event (1.9 %) with a four-level difference.
These results provide evidence that the impact-based FSI captures a meaningful component of the relative severity reflected in independent assessments, while the moderate agreement also indicates that the FSI and official classifications should not be considered interchangeable. This difference is expected because official severity grades may incorporate additional information, including emergency response status, administrative thresholds, qualitative impact descriptions, and hazard-related considerations that are not included in the four direct-impact indicators. Therefore, the external evaluation demonstrates the consistency of the FSI with independently available severity information while also clarifying the conceptual boundary of an impact-based severity index.
4.1.5 Robustness assessment of the revised FSI
Several sensitivity analyses were conducted to examine whether the revised FSI was sensitive to alternative indicator specifications. First, online popularity was excluded from the index because it reflects public attention and information dissemination rather than direct flood impacts. The four-indicator Core FSI showed a negligible correlation with online popularity (, p=0.654), while the event-level ranking remained highly consistent with the original five-indicator specification (ρ=0.979). This result suggests that removing online popularity did not substantially alter the identification of severe flood events but improved the conceptual consistency of the index (Table S4).
Exposure normalization was further evaluated by replacing absolute affected population, affected area, and economic loss with exposure-adjusted indicators. The normalized specification showed a strong agreement with the original formulation (ρ=0.930), although several cities experienced noticeable ranking changes. This indicates that exposure normalization reduces the influence of city scale while preserving the overall spatial pattern of flood severity. The revised FSI therefore adopts exposure-normalized indicators to improve comparability among cities with different socioeconomic and urban extents (Table S4).
Finally, the effect of fatality representation was examined by replacing absolute fatalities with population-normalized fatalities. The two specifications showed nearly identical results, with an event-level rank correlation of 0.9995, consistent city rankings (ρ=0.994), and identical temporal ordering (ρ=1.000). This robustness is expected because fatalities accounted for a relatively small proportion of the hybrid weighting structure and most documented events involved no fatalities.
4.2 Indicator contribution and hybrid weighting results
4.2.1 Distribution of hybrid weights
The weighting results showed substantial consistency between the AHP and entropy-based approaches (Table 4). The two initial weighting schemes produced similar importance patterns, with fatalities and economic losses receiving relatively higher weights, while affected population and affected-area ratio showed lower initial weights. This agreement suggests that expert-based judgments and statistical variability provided comparable evaluations of indicator importance.
Table 4Comparison of indicator weights and data-driven attribution contributions.

Note: AHP and entropy weights represent the initial weighting schemes. The ML column represents the normalized mean SHAP attribution derived from four tree-based models (RF, GBDT, XGBoost, and LightGBM), which reflects the relative contribution of each indicator during FSI reconstruction rather than an independently optimized weight. The hybrid weights were obtained by integrating the initial AHP weights with ML-based attribution under a prior constraint coefficient (α=0.90).
In contrast, the machine-learning-derived contribution pattern differed substantially from the initial weighting schemes. Across the four tree-based models, affected-area ratio showed the largest contribution, accounting for 58.0 % of the averaged data-driven attribution, followed by affected population ratio (16.3 %), fatalities (14.5 %), and economic losses ratio (11.2 %). This indicates that within the reconstructed severity framework, spatial impact extent and population exposure contained stronger discriminatory information for distinguishing flood-event severity.
The final hybrid weights remained close to the AHP weights because the hybrid integration adopted a high prior constraint coefficient (α=0.90). This design retained the interpretability of expert-based weighting while incorporating data-driven information from machine-learning attribution analysis.
4.2.2 SHAP-based indicator contribution analysis
To further evaluate the stability and interpretability of the machine-learning-assisted weighting framework, SHAP analysis was conducted using the out-of-fold predictions of four tree-based models (RF, GBDT, XGBoost, and LightGBM). Although the MLP model was included in the model comparison, it was not included in the SHAP visualization because TreeSHAP was adopted to provide a consistent and computationally efficient attribution analysis for tree-based models. Therefore, the SHAP results were used to evaluate the stability of indicator contribution patterns across tree-based ensemble models rather than to compare attribution results among different model families. The SHAP values were interpreted as relative contributions of individual indicators within the FSI refinement process, rather than causal effects of flood severity determinants.
The SHAP summary plots (Fig. 5) demonstrated highly consistent contribution patterns across the four models. The affected-area ratio consistently ranked as the most influential indicator, followed by the affected-population ratio, while fatalities and economic losses ratio showed relatively smaller contributions. This ranking was maintained across all four algorithms, indicating that the identified contribution structure was not dependent on a specific model architecture.
The direction of SHAP contributions was also consistent with the impact-based definition of flood severity. For affected-area and affected-population ratios, higher indicator values were mainly associated with positive SHAP values, suggesting that larger spatial and demographic impacts increased the reconstructed severity level. Conversely, lower indicator values tended to contribute negatively. These consistent attribution patterns indicate that the machine-learning models captured heterogeneous indicator contributions rather than simply assigning equivalent importance to all input variables.
The agreement between different algorithms provides additional support for the robustness of the machine-learning-assisted refinement procedure. Although the machine-learning component was not used to identify causal determinants of flood severity, it provided an independent assessment of relative indicator contributions and helped refine the initial weighting structure.
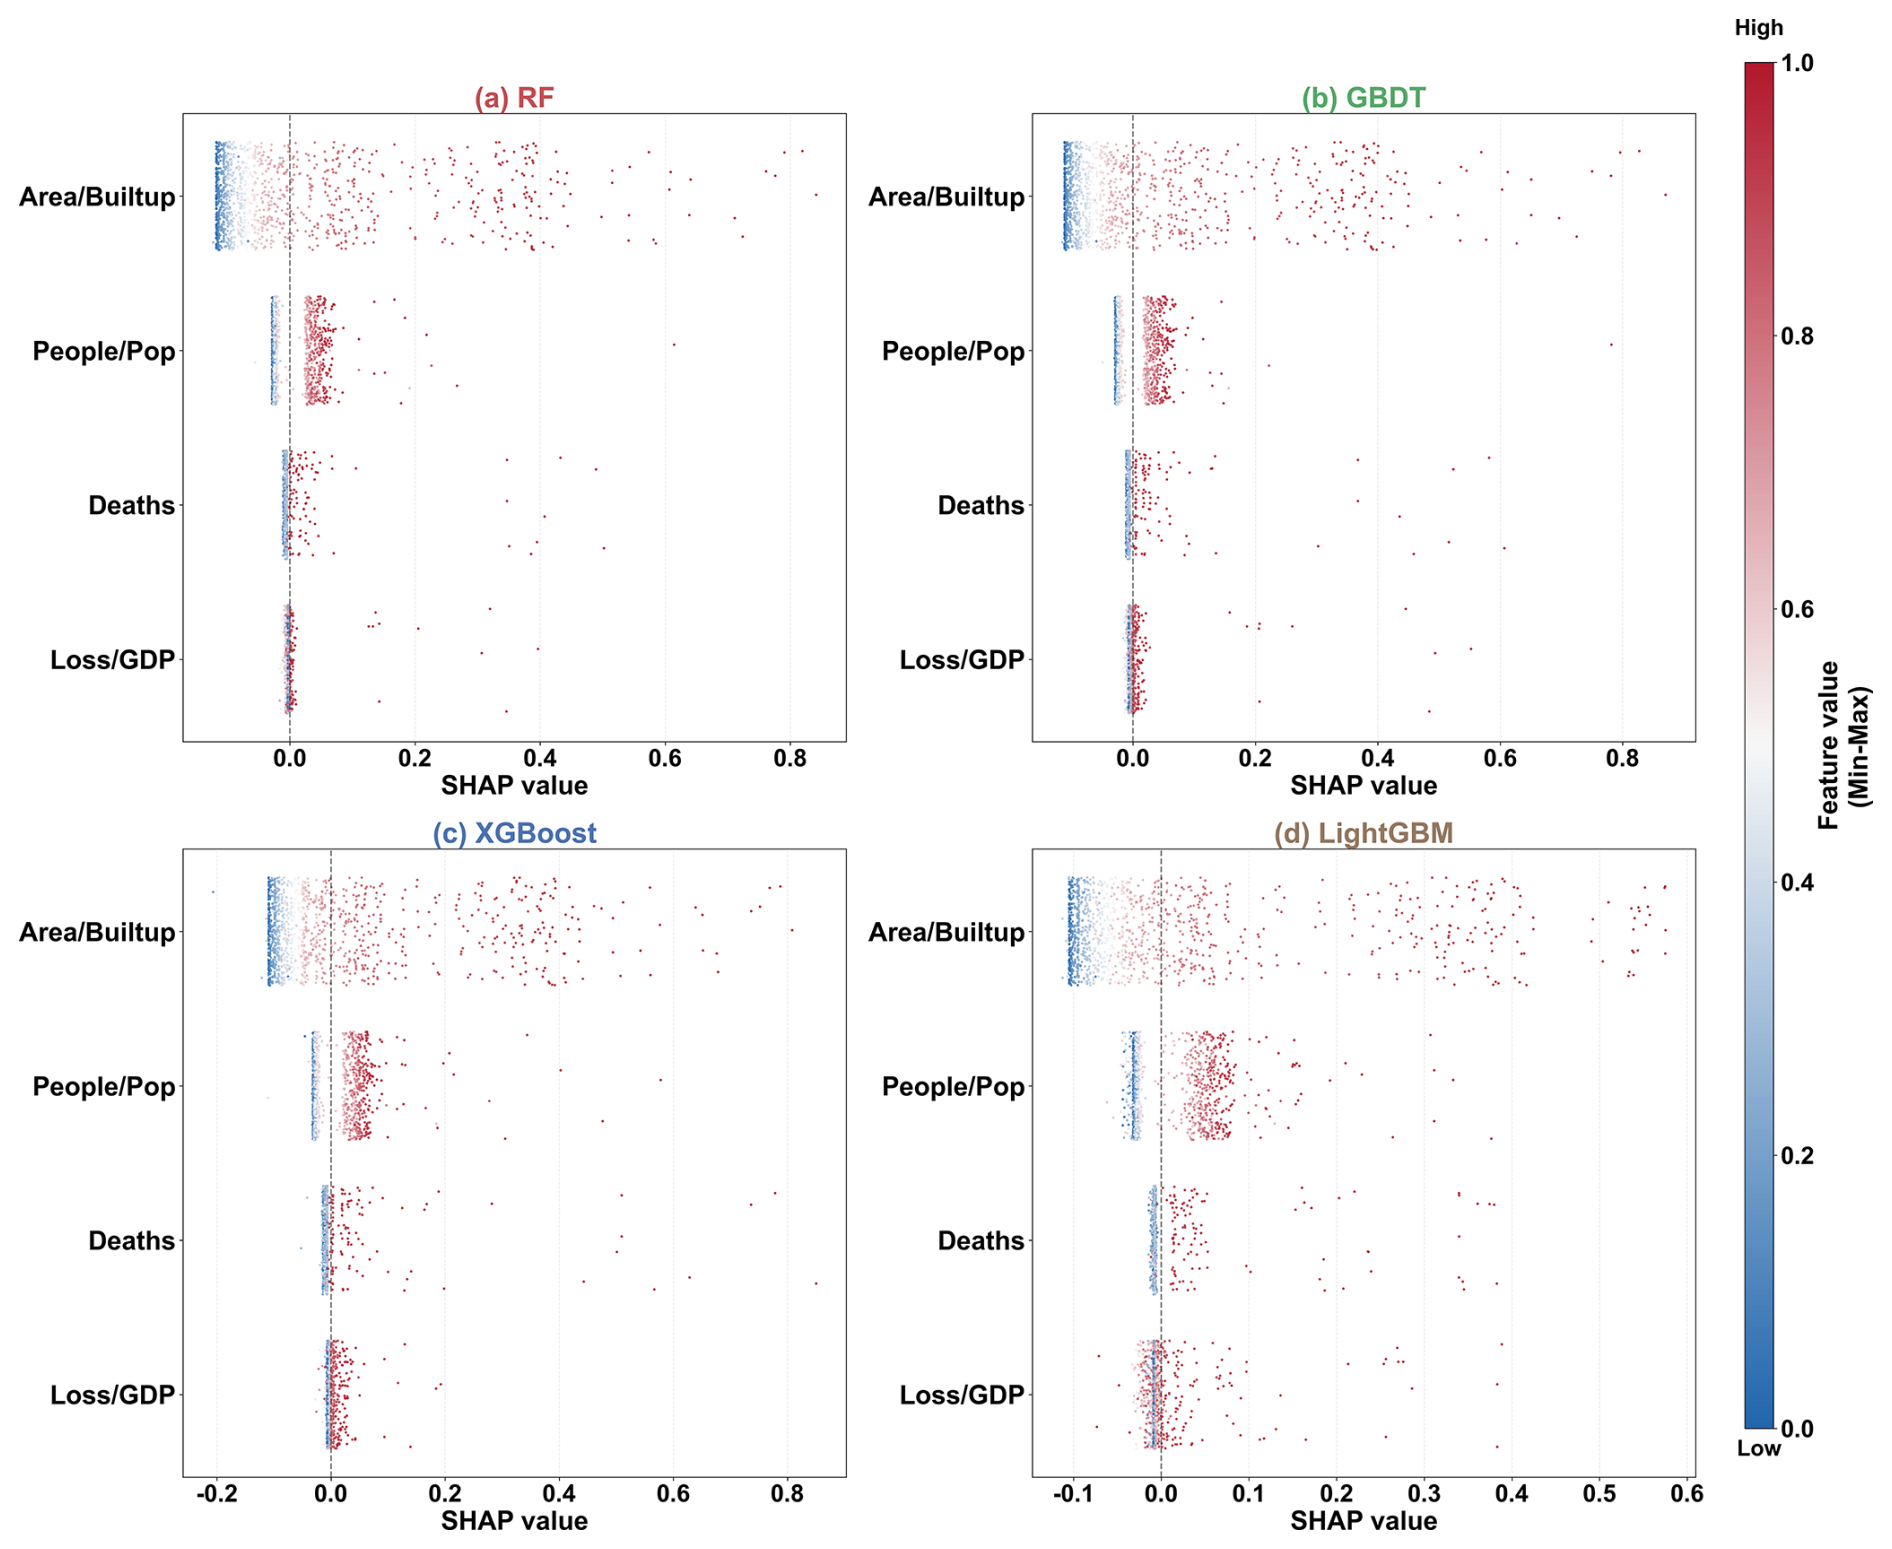
Figure 5SHAP-based contribution patterns of flood-impact indicators across four tree-based models. Note:SHAP analysis was performed using TreeSHAP for Random Forest (RF), Gradient Boosting Decision Tree (GBDT), XGBoost, and LightGBM models. Although the MLP model was included in the model comparison, it was not included in the SHAP visualization because TreeSHAP is specifically designed for tree-based models and provides consistent and efficient feature attribution across these four models. Therefore, the SHAP results are used to evaluate the stability of indicator contribution patterns among tree-based models rather than to compare attribution results across different model families.
4.3 Spatial patterns of urban flood disaster severity
The hybrid-weighting models reveal a highly robust and spatially coherent pattern of urban flood severity across the 20 representative cities. A pronounced north–south gradient emerges, accompanied by clear city-type patterns shaped by hydrometeorological forcing, exposure characteristics, and urban morphological conditions.
4.3.1 North–south differentiation in severity levels
Both weighting schemes consistently indicate that southern riverine and coastal cities experience significantly higher flood severity than northern cities. Wuhan, Guangzhou, Shenzhen, Hangzhou, and Chengdu exhibit persistently elevated severity levels, with most events categorized as high or very high. These cities are influenced by intense monsoonal rainfall, dense river networks, and, in coastal areas, typhoon-induced storm surges, creating multiple pathways for high-impact flooding. In contrast, northern cities such as Shenyang, Tianjin, Yantai, and Dalian are dominated by very low- and low-severity events. Flooding in these cities is typically limited to short-duration waterlogging with modest socioeconomic impacts. Although occasional severe events occur in individual years, the long-term distribution remains skewed toward low and moderate severity (Fig. 6).
Notably, several eastern coastal and riverine cities, such as Ningbo and Wuxi, exhibited a wide range of severity categories, with all six levels represented to varying degrees. These cities are characterized by densely developed urban areas located within complex hydrological environments, where flood impacts may result from the combined effects of intense rainfall, surface runoff accumulation, and local hydrological conditions. Their intermediate-to-high severity rankings suggest a heterogeneous flood-impact pattern shaped by the interaction between hydrometeorological exposure and urban characteristics (Fig. 6).
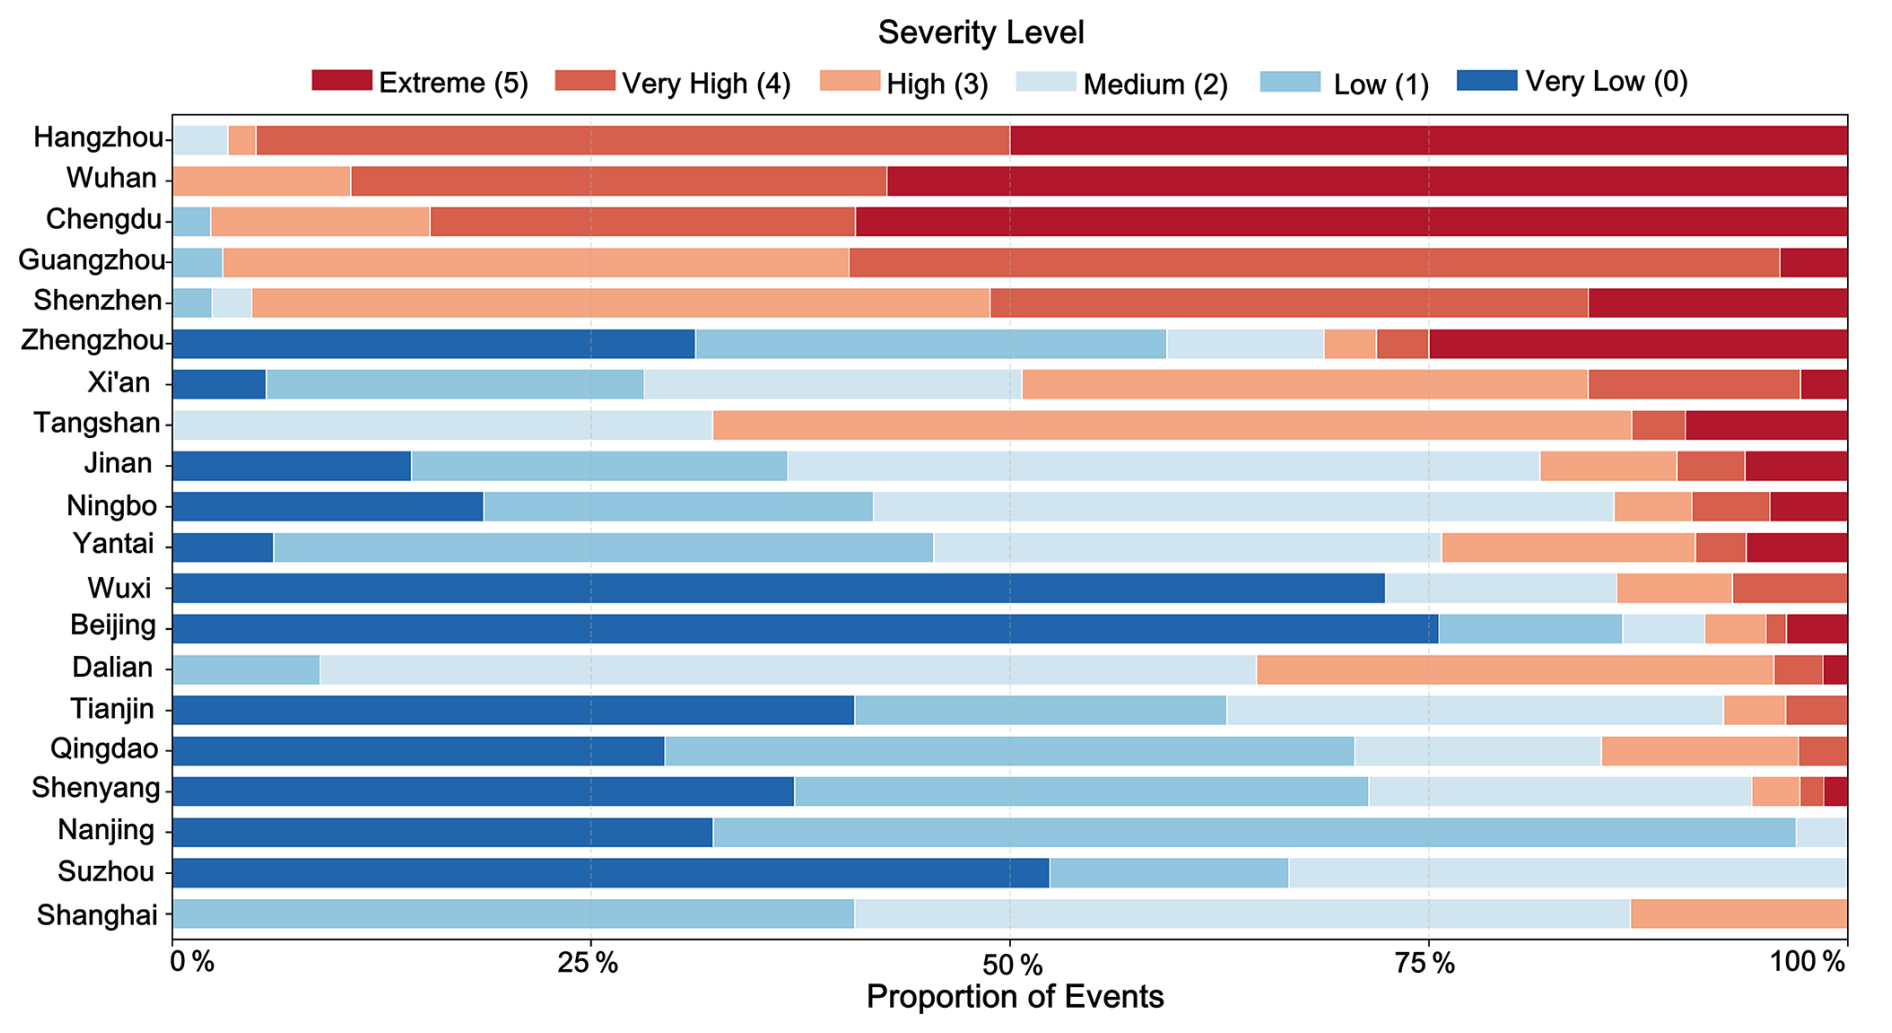
This sharp differentiation demonstrates that southern cities face a chronic high-severity regime, whereas northern cities experience primarily localized, episodic, and lower-intensity flood disturbances.
4.3.2 City-level ranking and typological characteristics
A combined assessment using average severity levels and the proportion of high-severity events provides a clear ranking of flood-prone cities and reveals three distinct city types.
According to the ranking results based on average severity level, several major southern cities, including Wuhan, Guangzhou, Shenzhen, Hangzhou, and Chengdu, were ranked among the highest-severity cities, with average severity levels exceeding 3. These cities generally showed higher proportions of high-severity events compared with other cities, indicating a greater concentration of severe documented flood impacts during the study period. Spatially, these high-severity cities were mainly distributed in regions characterized by dense urban development and complex hydrographic environments, although the relative contributions of climatic and urban factors require further investigation. The frequent occurrence of high-severity events in these cities highlights their importance for urban flood severity assessment (Fig. 7a).
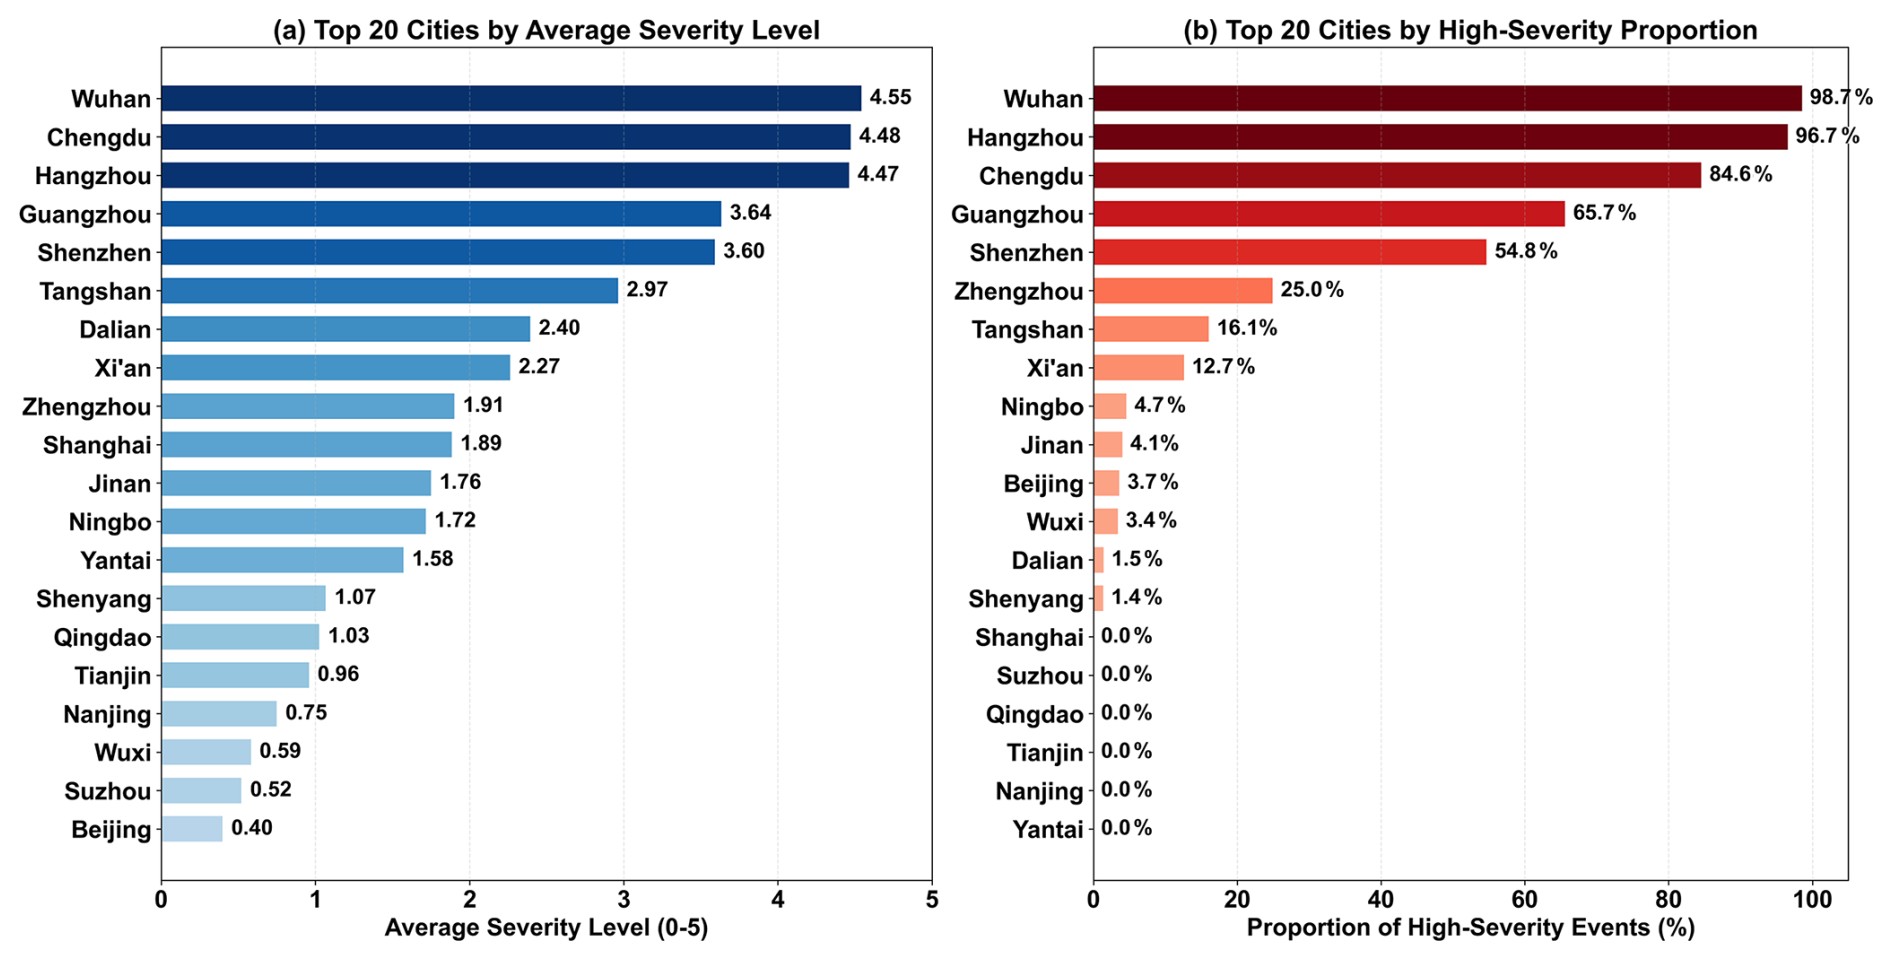
Figure 7(a) Top 20 cities by average severity level and (b) top 20 cities by proportion of high-severity events.
In contrast, northern cities such as Shenyang, Tianjin, and Qingdao ranked relatively lower in terms of average severity, with average severity levels generally below 1.5. A large proportion of documented flood events in these cities fell into the low-to-moderate severity categories, indicating comparatively lower overall flood-impact severity compared with cities characterized by more frequent severe events. Although occasional extreme events occurred in specific years, high-severity events represented a relatively smaller fraction of their documented flood records during the study period (Fig. 7a).
It should be noted that average severity level and the proportion of high-severity events describe different aspects of urban flood impacts. The former represents the overall severity distribution across all documented events, whereas the latter reflects the frequency of extreme flood impacts. Therefore, differences between the two rankings do not indicate inconsistency, but rather reveal complementary characteristics of urban flood severity.
The ranking based on the proportion of high-severity events revealed additional spatial variations among cities (Fig. 7b). Several cities, including Nanjing, Suzhou, Qingdao, and Tianjin, showed no recorded high-severity events during the study period, despite having documented flood events. In contrast, some cities with relatively lower average severity rankings, such as Beijing and Wuxi, still exhibited a considerable proportion of high-severity events. This suggests that these cities experienced fewer severe events overall but remained susceptible to occasional high-impact flood episodes. Together, the two indicators provide complementary perspectives for understanding urban flood severity: average severity reflects the typical impact level of documented events, whereas the proportion of high-severity events emphasizes the occurrence characteristics of extreme flood impacts.
Taken together, the spatial ranking illustrates a stratified urban flood-risk landscape in China, with persistent southern hotspots, stable northern low-risk zones, and mixed-pattern coastal megacities. Synthesizing the above results, three robust spatial findings emerge: (A) a pronounced “strong-south, weak-north” gradient in urban flood severity, with southern riverine and coastal cities forming persistent high-severity hotspots; (B) the existence of a stable low-severity regime in most northern cities, punctuated by only a small share of high-impact events; and (C) the presence of mixed-pattern coastal megacities (e.g., Wuxi, Ningbo) that exhibit diversified severity structures and compound hazard mechanisms. These three city types provide a structural lens for interpreting subsequent temporal trajectories and driving-factor differences.
4.4 Temporal variation of documented flood-event severity
The temporal distribution of documented flood-event severity showed considerable interannual variability across the 20 cities during 2000–2024 (Fig. 8). The annual median FSI values fluctuated throughout the study period, with several years characterized by elevated severity levels due to the occurrence of high-impact flood events, while other years were dominated by low-to-moderate severity events. Overall, the temporal pattern was characterized by substantial year-to-year variability rather than a consistent monotonic change.
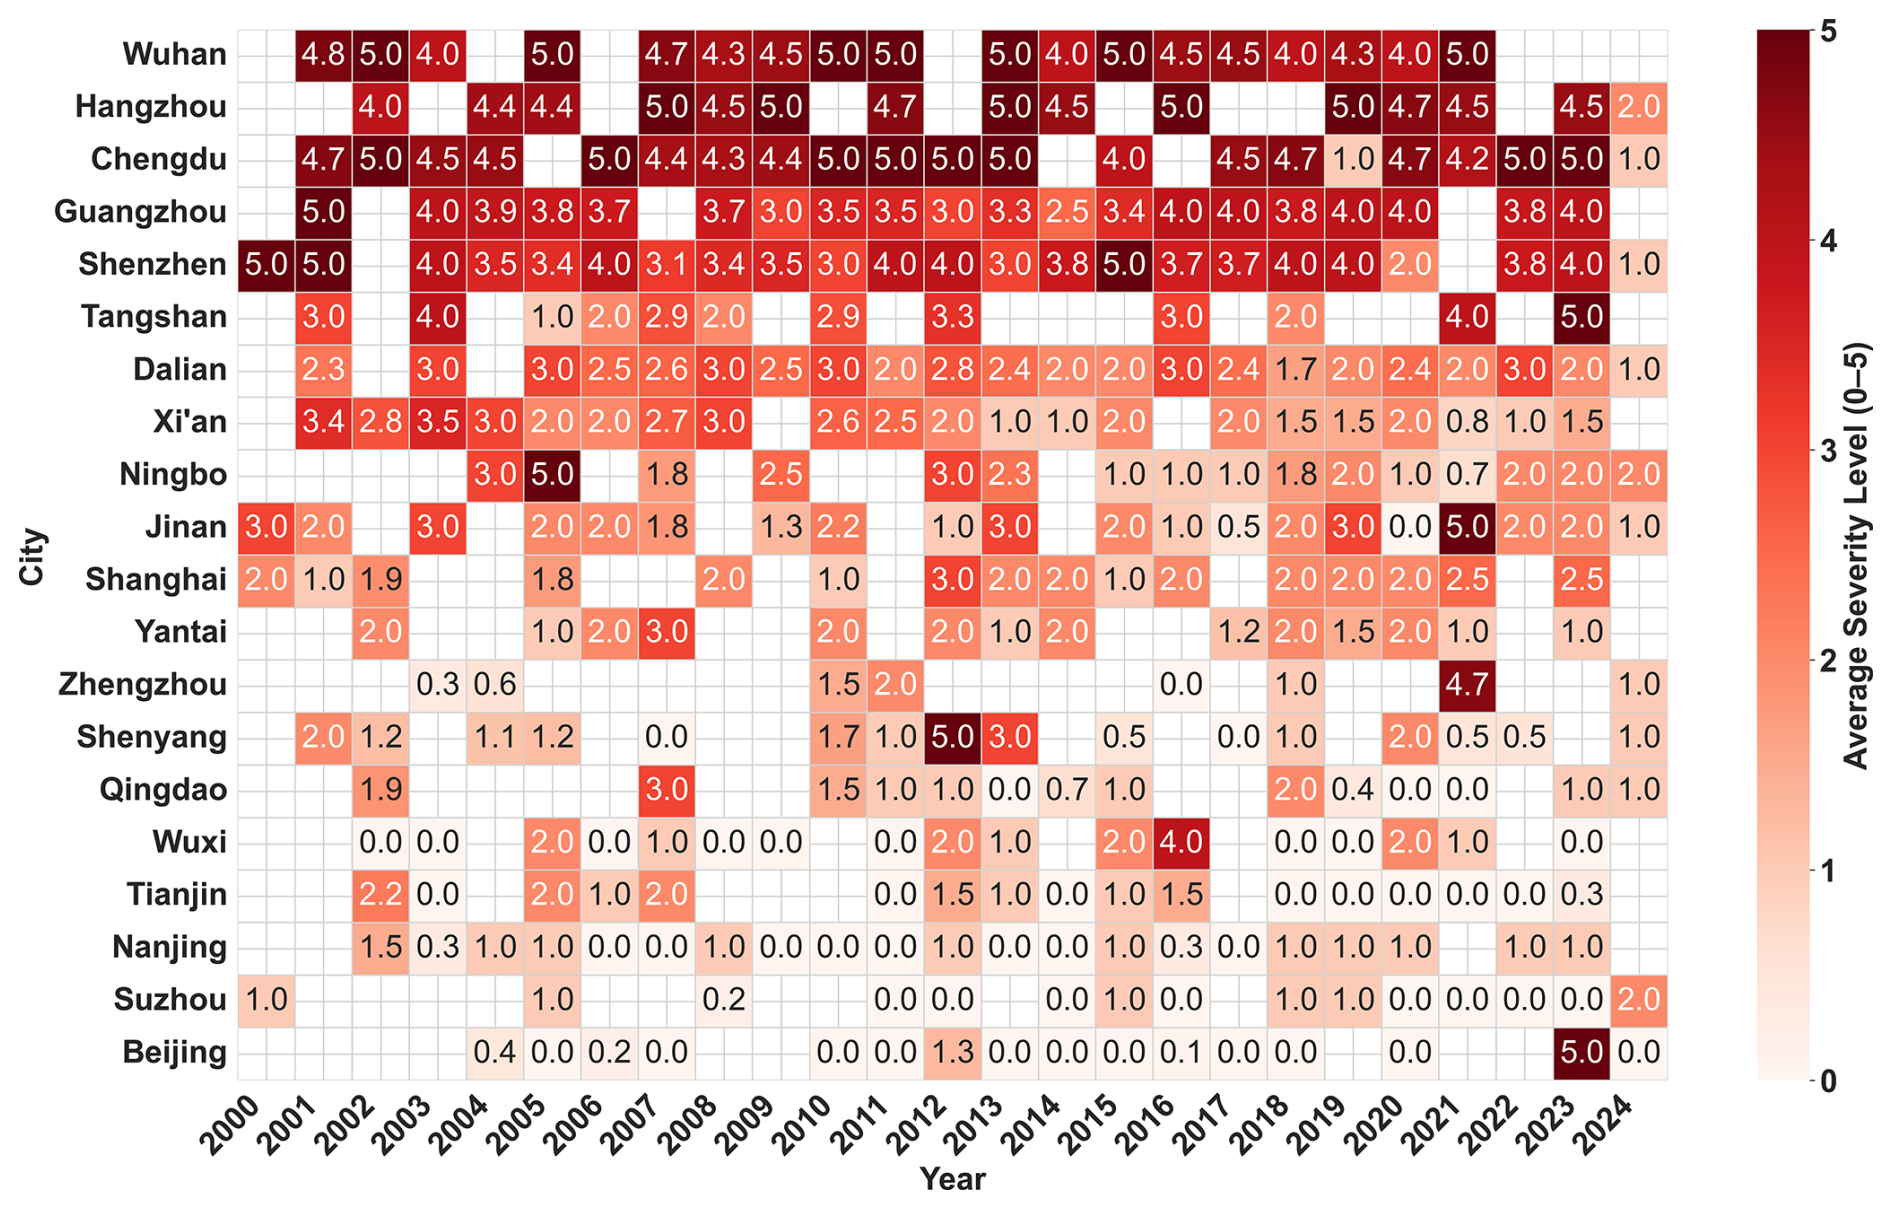
Figure 8Spatiotemporal distribution of documented flood-event severity across the 20 cities during 2000–2024.
The spatiotemporal distribution further indicated that high-severity events occurred intermittently across different cities and years rather than being continuously concentrated within a specific period. Some cities exhibited relatively stable severity levels, whereas others experienced episodic increases associated with individual high-impact flood events. These variations highlight the heterogeneous temporal characteristics of documented urban flood impacts across different cities (Fig. 8).
Temporal interpretation should also consider changes in data availability. The integration of social-media-derived information after 2010 may have improved the identification of localized or less formally documented flood events. Therefore, the observed temporal variations should be interpreted as changes in documented flood-event severity and occurrence characteristics rather than direct evidence of systematic changes in underlying flood hazard intensity. Additional sensitivity analyses considering alternative indicator specifications and data-source consistency are provided in Supplement Material S5.
4.4.1 Regional differences in annual flood severity variations
Trend-line analysis of annual mean flood-event severity revealed heterogeneous temporal patterns among the 20 cities. Rather than showing a uniform temporal trajectory, cities exhibited different combinations of relatively stable conditions, gradual changes, and episodic fluctuations during 2000–2024.
Southern cities generally maintained relatively higher annual mean FSI values throughout the study period. Cities including Wuhan, Guangzhou, Shenzhen, and Hangzhou showed consistently elevated severity levels, with annual values frequently occurring within medium-to-high severity ranges. Chengdu and several other southern cities exhibited similar patterns but with more pronounced year-to-year fluctuations. These results indicate that southern cities experienced a higher concentration of severe documented flood impacts, although the magnitude and temporal direction of changes varied among individual cities (Fig. 9).
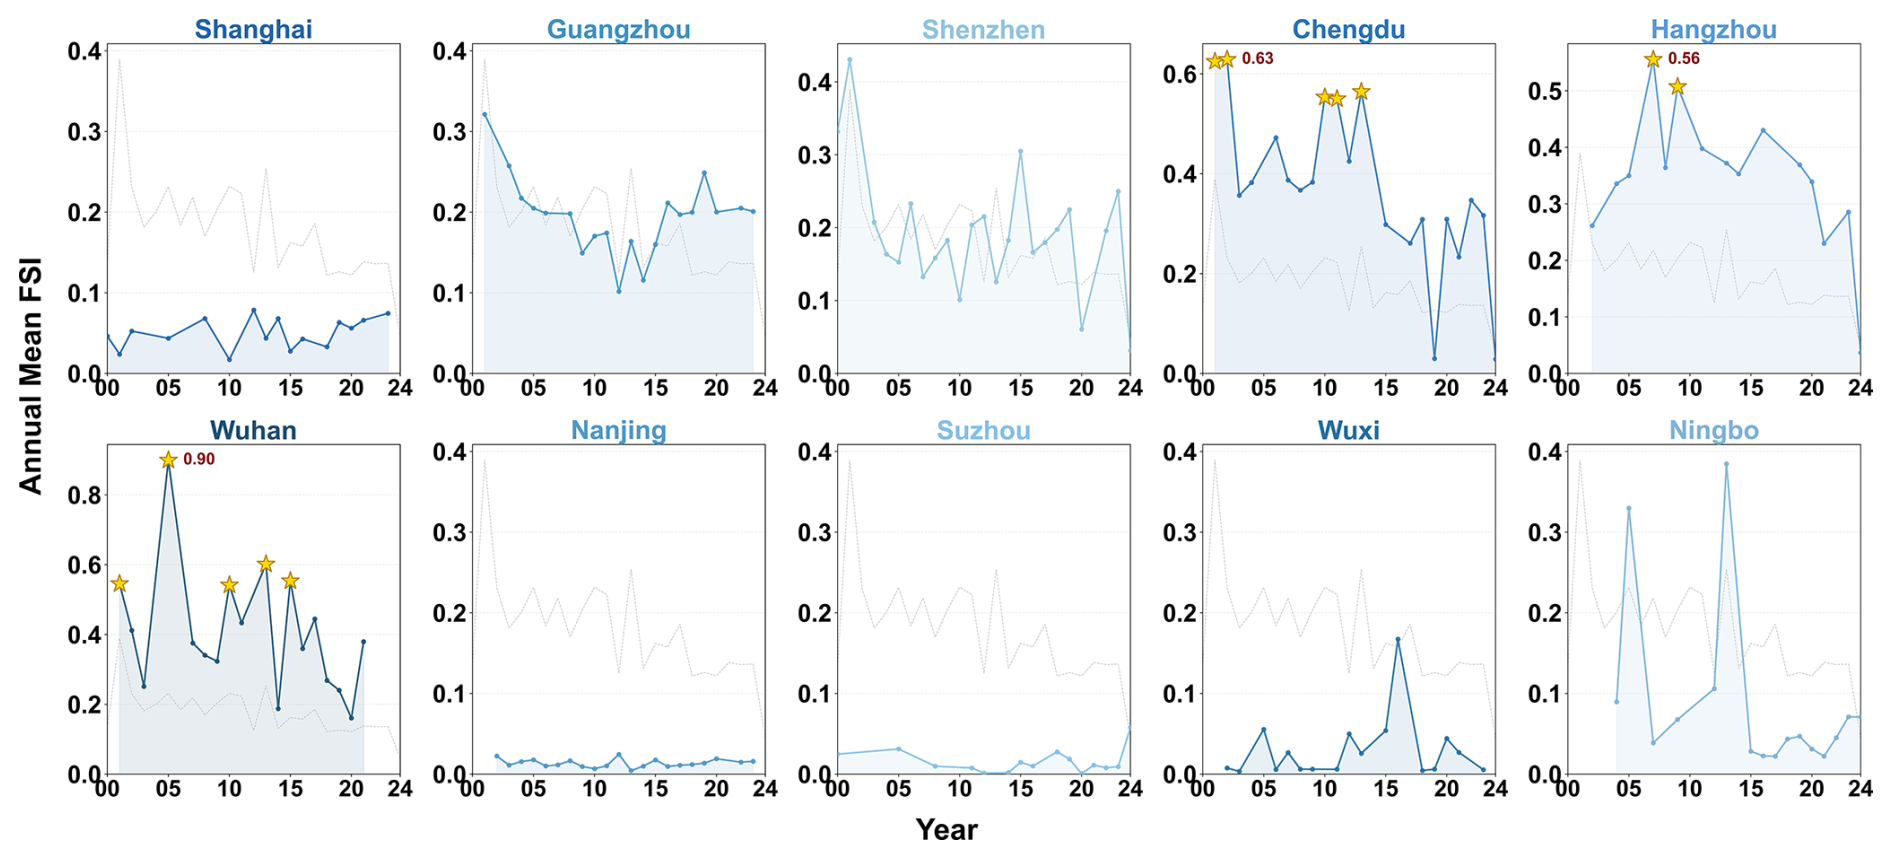
Figure 9Temporal trends of annual mean flood-event severity in southern cities during 2000–2024.
Northern cities generally exhibited lower annual mean FSI values compared with southern cities, but their temporal patterns were more heterogeneous. Cities such as Shenyang, Tianjin, and Qingdao showed relatively stable lower-severity conditions, with most years remaining within low-to-moderate severity ranges. However, occasional increases were observed in some years, reflecting the influence of individual high-impact flood events on annual severity variation (Fig. 10).
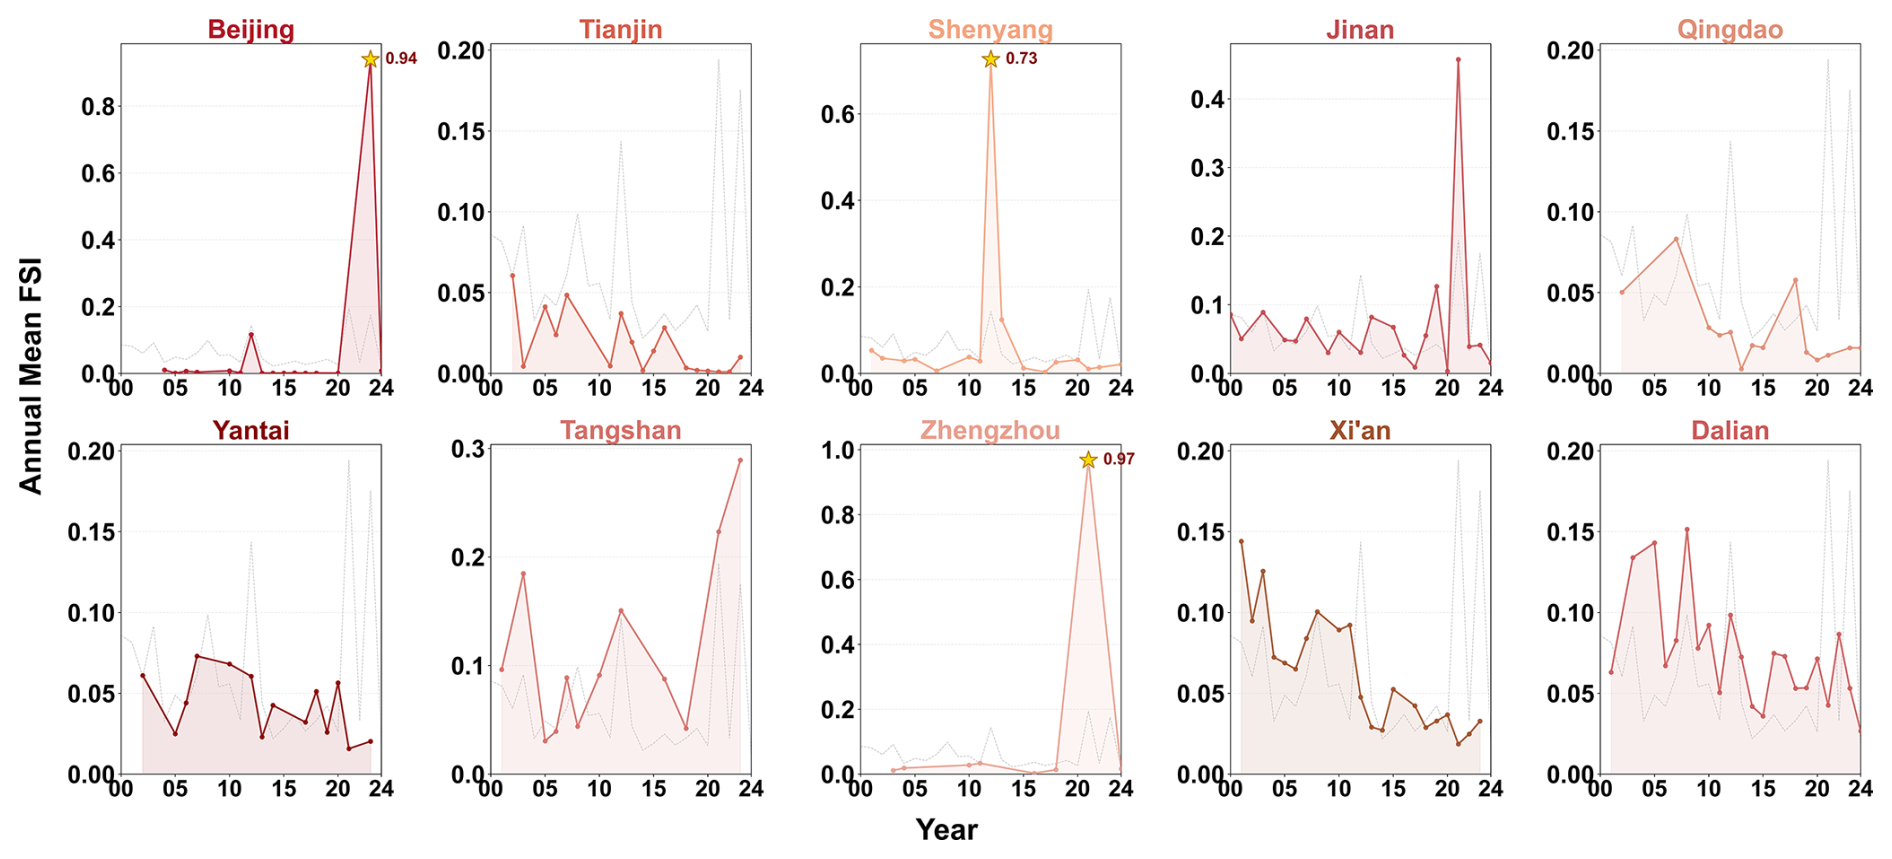
Figure 10Temporal trends of annual mean flood-event severity in northern cities during 2000–2024.
Some cities displayed a combination of a relatively low baseline severity and occasional high-impact events. For example, Beijing and Zhengzhou showed abrupt increases in annual severity during specific years, resulting in stronger fluctuations compared with cities with more stable patterns. These episodic increases demonstrate that cities with generally moderate historical severity may still experience individual high-impact flood events. Zhengzhou's pronounced spike in 2021 illustrates how short-duration, record-breaking storms can expose latent weaknesses in drainage design standards and emergency-response capacity. Similarly, Beijing has experienced occasional upward deviations linked to storm events that exceed historical norms. These episodic extremes indicate that, unlike southern cities where high severity is persistent, northern high-impact events are more contingent on rare but increasingly plausible meteorological conditions under a warming climate.
Overall, the temporal analysis suggests that urban flood-event severity across the 20 cities was characterized by regional heterogeneity and episodic fluctuations rather than a single consistent increasing or decreasing trend. The differences among cities provide complementary information to the spatial severity patterns identified in the previous analysis.
5.1 Spatial mechanisms underlying urban flood severity differentiation
This study draws on long-term disaster time-series data from 20 cities to investigate spatial heterogeneity, temporal variability, and potential factors associated with urban flood severity in China. The observed differences among cities reflect the combined influence of natural environmental conditions, socio-economic structures, urbanization trajectories, and urban morphological characteristics, representing a coupled “nature–society–urban system” framework (Wu et al., 2021).
The spatial differentiation of documented flood severity is closely associated with regional hydroclimatic and urban environmental conditions. Climatic regimes, monsoon characteristics, topographic conditions, and river-network density influence rainfall–runoff processes and contribute to differences in flood impacts among regions (Wu et al., 2020). Southern China is characterized by stronger subtropical monsoon activity, frequent intense rainfall events, dense river networks, and extensive low-lying areas. These conditions increase the likelihood of compound flood impacts involving pluvial flooding, urban waterlogging, and fluvial flooding (Wang et al., 2022b). In contrast, northern cities generally experience lower background precipitation, where severe urban flooding is more commonly associated with localized extreme rainfall events and limitations in drainage capacity (Ali et al., 2025). Therefore, the observed north–south differentiation reflects the interaction between regional hydrometeorological characteristics and urban systems rather than a single controlling factor (Song et al., 2024).
5.2 Influence of urbanization and spatial development patterns
Beyond natural conditions, differences in urban development trajectories also contribute to the heterogeneous distribution of flood severity. Cities with rapid expansion, increasing impervious surfaces, and intensive urban development may experience greater pressure on drainage systems, particularly when extreme rainfall exceeds existing design standards.
The high severity observed in Wuhan, Guangzhou, Chengdu, and Shenzhen may be associated with the combined influence of intense precipitation regimes, rapid urban expansion, increasing impervious surfaces, and complex urban hydrological settings (Chen et al., 2025). These cities have experienced sustained urban growth while being located in regions with relatively high rainfall exposure, resulting in persistent high-impact flood conditions. In comparison, northern cities such as Qingdao, Shenyang, and Tianjin have also undergone substantial urbanization, but their lower precipitation background and continuous improvements in drainage infrastructure may partly explain their relatively lower average severity levels.
However, lower average severity does not indicate the absence of severe flood impacts. Cities such as Beijing and Zhengzhou demonstrate that regions with relatively low baseline severity may still experience abrupt high-impact events when extreme precipitation exceeds historical conditions. Meanwhile, cities such as Wuxi and Ningbo exhibit multiple severity levels, reflecting the complexity introduced by tidal influences, low-lying terrain, dense waterways, and highly developed urban morphology.
5.3 Implications for differentiated urban flood management
The spatial patterns identified in this study provide important implications for differentiated urban flood management. The results suggest that flood management strategies should consider differences in regional environmental settings and severity characteristics rather than adopting uniform approaches.
For southern cities, including Wuhan, Guangzhou, Shenzhen, Hangzhou, and Chengdu, where high-severity events occur more frequently, management priorities should focus on reducing persistent flood exposure through integrated measures such as drainage-system enhancement, sponge-city development, green infrastructure, and improved coordination between urban planning and hydrological management (Kong et al., 2021). These approaches are particularly relevant for cities where repeated flood impacts are associated with the interaction between intense rainfall and complex urban environments.
For northern cities, where average severity is generally lower but episodic extremes may occur, flood management should emphasize preparedness for short-duration extreme events. Improving real-time monitoring, emergency response capacity, and drainage-system resilience is important for reducing the consequences of rare but high-impact floods. The events observed in Beijing and Zhengzhou highlight that low-frequency flood hazards can still generate substantial impacts when extreme conditions exceed existing infrastructure and management capacity (Ghosh et al., 2024).
Overall, the findings emphasize the need to shift from isolated engineering responses toward adaptive and resilience-oriented urban flood management strategies that account for regional differences in flood severity characteristics.
5.4 Limitations and future research directions
Several limitations should be acknowledged. First, although the multi-source datasets used in this study improve the spatiotemporal representation of flood events, data acquisition remains a major challenge. Social media data provide timely updates, but they are spatially biased toward densely populated and digitally active areas, which may lead to underrepresentation of events in less populated regions. News reports are relatively more objective, yet they often suffer from reporting delays and uneven spatial coverage. In addition, historical flood information is frequently incomplete, and missing observations were limited and treated using median imputation in this study, introducing further uncertainty. However, differences in data availability among cities and periods may still introduce uncertainty into long-term comparisons. These issues make it difficult to construct a consistent, comparable, and high-quality urban flood database across cities and over time. Future studies should therefore prioritize more standardized data-collection frameworks and explicitly assess the influence of data uncertainty on model outcomes.
Second, this study focuses on evaluating documented flood-event severity and identifying spatial–temporal patterns rather than establishing causal relationships. Although rainfall conditions, urban expansion, and hydrological characteristics are likely to influence flood impacts, explicitly quantifying their contributions requires additional causal modeling and process-based simulations. Future studies should integrate high-resolution meteorological observations, remote sensing products, and hydrodynamic models to better understand the mechanisms linking environmental changes and urban flood severity.
Third, future research should therefore focus on three directions. One direction is to construct more comprehensive geospatial big-data infrastructures for urban flooding by integrating high-resolution remote sensing, crowdsourced observations, and smart-sensor networks, together with explicit uncertainty quantification for incomplete records and data gaps. A second priority is to extend the current event-level severity framework by incorporating environmental and urban dynamic variables, such as long-term urban water-body changes, land-use transitions, and hydroclimatic variations, to quantitatively investigate their contributions to flood severity. The quantitative assessment of how long-term urban water-body changes influence flood severity is beyond the scope of this study and will be investigated in future research based on the event-level framework established here. Meanwhile, coupling data-driven severity models with process-based hydrological and hydrodynamic simulations would further enable scenario-based assessments under projected climate and urbanization pathways. Finally, extending the analytical scale from city-wide averages to intra-urban functional zones, drainage catchments, and critical infrastructures would allow more refined assessments of exposure, vulnerability, and resilience, providing stronger support for targeted adaptation and resilience planning.
This study integrated multi-source urban flood-event data from 2000–2024 and developed an impact-based flood severity assessment framework using hybrid weighting and machine-learning-assisted attribution methods. By constructing a comparable event-level Flood Severity Index (FSI), this study systematically evaluated spatial heterogeneity and temporal variability of documented flood severity across 20 representative Chinese cities. The main conclusions are summarized as follows:
-
Urban flood severity exhibited pronounced spatial heterogeneity between southern and northern China. Southern cities generally showed higher average severity levels and larger proportions of high-severity events, which are consistent with their stronger monsoonal precipitation, dense river networks, and complex urban hydrological environments. Northern cities generally exhibited lower baseline severity but remained vulnerable to episodic high-impact flood events under extreme precipitation conditions.
-
The structural composition of flood disasters varies significantly across cities. Cities such as Wuhan, Guangzhou, and Shenzhen consistently experience high severity, while cities such as Wuxi and Ningbo display a mix of flood severity levels. In contrast, cities such as Tianjin and Shenyang are primarily affected by localized, low-intensity flooding, and their flood severity evolution is strongly influenced by urban morphology and drainage infrastructure.
-
Temporal variations in urban flood severity were characterized by substantial interannual fluctuations rather than a consistent long-term increasing or decreasing trend. Several years exhibited elevated severity due to individual high-impact flood events, indicating that urban flood impacts were shaped by episodic extremes and heterogeneous temporal patterns rather than a uniform temporal trajectory.
The source code developed for this study and the datasets compiled and processed by the authors are available in the GitHub repository at https://github.com/lianyi732-hue/flood_project (last access: 28 October 2026). The corresponding version (v1.0.0) has been archived on Zenodo and is available at https://doi.org/10.5281/zenodo.23681197 (Peng et al., 2026). Other data generated or analyzed during this study are available from the corresponding author upon reasonable request.
The supplement related to this article is available online at https://doi.org/10.5194/nhess-26-5421-2026-supplement.
GP: Writing – review and editing, Methodology, Conceptualization, Funding acquisition. YS: Writing – original draft, Visualization, Methodology, Formal analysis, Data curation. MW: Methodology, Data curation. MC: Writing – review and editing, Supervision, Conceptualization. FZ: Writing – review and editing, Methodology.
The contact author has declared that none of the authors has any competing interests.
Publisher's note: Copernicus Publications remains neutral with regard to jurisdictional claims made in the text, published maps, institutional affiliations, or any other geographical representation in this paper. The authors bear the ultimate responsibility for providing appropriate place names. Views expressed in the text are those of the authors and do not necessarily reflect the views of the publisher.
We thank editor and reviewers for helping us improving the clarity of the paper.
This research has been supported by the National Natural Science Foundation of China (grant no. 42201517).
This paper was edited by Philip Ward and reviewed by two anonymous referees.
Ahmad, I., Ping, W., Ullah, S., Faqeih, K. Y., Alamri, S. M., Alamery, E. R., Abalkhail, A. A. A., and Bilal Jan, H. M.: Spatiotemporal Mapping of Urban Flood Susceptibility: A Multi-Criteria GIS-Based Assessment in Nangarhar, Afghanistan, Land, 14, 2376, https://doi.org/10.3390/land14122376, 2025.
Ali, Y., Afnan, J., Jannat, M., and Uddin, M. M.: Assessing alteration of urban floodplains using remote sensing and GIS: a three decade analysis (1992–2022), Geol. Ecol. Landsc., 1–16, https://doi.org/10.1080/24749508.2025.2524209, 2025.
Bagheri, A. and Liu, G.-J.: Climate change and urban flooding: assessing remote sensing data and flood modeling techniques: a comprehensive review, Environ. Rev., 33, 1–14, https://doi.org/10.1139/er-2024-0065, 2025.
Ban, J., Sutton, C., Ma, Y. Lin, C., and Chen, K.: Association of flooding exposure with cause-specific mortality in North Carolina, United States, Nat. Water, 1, 1027–1034, https://doi.org/10.1038/s44221-023-00167-5, 2023.
Bhusal, A., Thakur, B., Kalra, A., Benjankar, R., and Shrestha, A.: Evaluating the Effectiveness of Best Management Practices in Adapting the Impacts of Climate Change-Induced Urban Flooding, Atmosphere, 15, 281, https://doi.org/10.3390/atmos15030281, 2024.
Cao, W., Zhou, Y., Güneralp, B., Li, X., Zhao, K., and Zhang, H.: Increasing global urban exposure to flooding: An analysis of long-term annual dynamics, Sci. Total Environ., 817, 153012, https://doi.org/10.1016/j.scitotenv.2022.153012, 2022.
Chen, J., Li, Y., Zhang, L., and Tian, Y.: Impact of Interactions between Different Rainfall Patterns and River Water Levels on Urban Flooding in Inland Plain Cities, Water Resour. Manag., 39, 7515–7539, https://doi.org/10.1007/s11269-025-04306-3, 2025.
Chen, J., Gao, C., Zhou, H., Wang, Q., She, L., Qing, D., and Cao, C.: Urban Flood Risk Assessment Based on a Combination of Subjective and Objective Multi-Weight Methods, Appl. Sci., 14, 3694, https://doi.org/10.3390/app14093694, 2024.
Dai, D., Bo, M., Ren, X., and Dai, K.: Application and exploration of artificial intelligence technology in urban ecosystem-based disaster risk reduction: A scoping review, Ecol. Indic., 158, 111565, https://doi.org/10.1016/j.ecolind.2024.111565, 2024.
Duan, C., Zheng, X., Li, R., and Wu, Z.: Urban flood vulnerability Knowledge-Graph based on remote sensing and textual bimodal data fusion, J. Hydrol., 633, 131010, https://doi.org/10.1016/j.jhydrol.2024.131010, 2024.
Fang, D., Xu, F., Jin, X., Song, C., Gao, P., Sun, L., Wang, D., and Feng, K.: Stress-testing the cascading economic impacts of urban flooding across 306 Chinese cities, Nat. Cities, 3, 89–101, https://doi.org/10.1038/s44284-025-00372-1, 2026.
Fu, S., Schultz, D. M., Lyu, H., Zheng, Z., and Zhang, C.: Creating a national urban flood dataset for China from news texts (2000–2022) at the county level, Hydrol. Earth Syst. Sci., 29, 767–783, https://doi.org/10.5194/hess-29-767-2025, 2025.
Ge, H. and Zhu, L.: Extreme flood levels during the operation of cascade reservoirs: A case study of the Lower Yangtze River in 2020, Water, 15, 851, https://doi.org/10.3390/w15050851, 2023.
Ghosh, P., Sudarsan, J. S., and Nithiyanantham, S.: Nature-Based Disaster Risk Reduction of Floods in Urban Areas, Water Resour. Manag., 38, 1847–1866, https://doi.org/10.1007/s11269-024-03757-4, 2024.
Guo, K., Guan, M., and Yu, D.: Urban surface water flood modelling – a comprehensive review of current models and future challenges, Hydrol. Earth Syst. Sci., 25, 2843–2860, https://doi.org/10.5194/hess-25-2843-2021, 2021.
Hu, Y., Connor, D. S., Stuhlmacher, M., Peng, J., and Turner II, B. L.: More urbanization, more polarization: evidence from two decades of urban expansion in China, npj Urban Sustain., 4, 33, https://doi.org/10.1038/s42949-024-00170-z, 2024.
Hussain, M., Tayyab, M., Ullah, K., Ullah, S., Rahman, Z. U., Zhang, J., and Al-Shaibah, B.: Development of a new integrated flood resilience model using machine learning with GIS-based multi-criteria decision analysis, Urban Clim., 50, 101589, https://doi.org/10.1016/j.uclim.2023.101589, 2023.
Jiang, Y., Zevenbergen, C., and Ma, Y.: Urban pluvial flooding and stormwater management: A contemporary review of China's challenges and “sponge cities” strategy, Environ. Sci. Policy, 80, 132–143, https://doi.org/10.1016/j.envsci.2017.11.016, 2018.
Kong, F., Sun, S., and Wang, Y.: Comprehensive understanding the disaster-causing mechanism, governance dilemma and targeted countermeasures of urban pluvial flooding in china, Water, 13, 1762, https://doi.org/10.3390/w13131762, 2021.
Li, C., Sun, N., Lu, Y., Guo, B., Wang, Y., Sun, X., and Yao, Y.: Review on Urban Flood Risk Assessment, Sustainability, 15, 765, https://doi.org/10.3390/su15010765, 2023a.
Li, G., Liu, J., and Shao, W.: Urban flood risk assessment under rapid urbanization in Zhengzhou City, China, Reg. Sustain., 4, 332–348, https://doi.org/10.1016/j.regsus.2023.08.004, 2023b.
Li, Y., Wang, L., Li, F., Peng, S. G., and Ding, C.: Quantitative estimation of urban flood damage from storm surges for a coastal city, Nat. Hazards, 121, 16915–16934, https://doi.org/10.1007/s11069-025-07456-0, 2025.
Liang, P. and Ding, Y.: The long-term variation of extreme heavy precipitation and its link to urbanization effects in Shanghai during 1916–2014, Adv. Atmos. Sci., 34, 321–334, https://doi.org/10.1007/s00376-016-6120-0, 2017.
Liu, X., Zhou, P., Lin, Y., Sun, S., Zhang, H., Xu, W., and Yang, S.: Influencing Factors and Risk Assessment of Precipitation-Induced Flooding in Zhengzhou, China, Based on Random Forest and XGBoost Algorithms, Int. J. Environ. Res. Public Health, 19, 16544, https://doi.org/10.3390/ijerph192416544, 2022.
Luo, Y., Zhang, J., Yu, M., Liang, X., Xia, R., Gao, Y., Gao, X., and Yin, J.: On the influences of urbanization on the extreme rainfall over Zhengzhou on 20 July 2021: A convection-permitting ensemble modeling study, Adv. Atmos. Sci., 40, 393–409, https://doi.org/10.1007/s00376-022-2048-8, 2023.
Misra, A., White, K., Nsutezo, S. F., Straka III., W., and Lavista, J.: Mapping global floods with 10 years of satellite radar data, Nat. Commun., 16, 5762, https://doi.org/10.1038/s41467-025-60973-1, 2025.
Peng, J. and Zhang, J.: Urban flooding risk assessment based on GIS-game theory combination weight: A case study of Zhengzhou City, Int. J. Disast. Risk Re., 77, 103080, https://doi.org/10.1016/j.ijdrr.2022.103080, 2022.
Peng, G., Sun, Y., Wang, M., Chen, M., and Zhang, F.: lianyi732-hue/flood_project: Code and Data, Version 1.0.0, Zenodo [code, data set], https://doi.org/10.5281/zenodo.23681197, 2026.
Qi, S., Cao, S., Hu, S., and Liu, Q.: Bibliometric analysis on urban flood and waterlogging disasters during the period of 1998–2022, Nat. Hazards, 120, 12595–12612, https://doi.org/10.1007/s11069-024-06710-1, 2024.
Rentschler, J., Avner, P., Marconcini, M., Su, R., Strano, E., Vousdoukas, M., and Hallegatte, S.: Global evidence of rapid urban growth in flood zones since 1985, Nature, 622, 87–92, https://doi.org/10.1038/s41586-023-06468-9, 2023.
Romali, N. S., Sulong, S., and Kawasaki, A.: A Systematic Review of Flood Damage Assessment: Insight for the Data-Scarce Regions, Water Resour. Manag., 39, 4707–4734, https://doi.org/10.1007/s11269-025-04265-9, 2025.
Rogers, J. S., Maneta, M. P., Sain, S. R. Madaus, L. E., and Hacker, J. P.: The role of climate and population change in global flood exposure and vulnerability, Nat. Commun., 16, 1287, https://doi.org/10.1038/s41467-025-56654-8, 2025.
Sanders, B. F., Schubert, J. E., Kahl, D. T., Mach, K. J., Brady, D., AghaKouchak, A., Forman, F., Matthew, R. A., Ulibarri, N., and Davis, S. J.: Large and inequitable flood risks in Los Angeles, California, Nat. Sustain., 6, 47–57, https://doi.org/10.1038/s41893-022-00977-7, 2023.
Song, X., Xu, N., Zhang, J., and He, R.: Urban flooding in China: current status, causes and challenges, Adv. Water Sci., 35, 357–373, https://doi.org/10.14042/j.cnki.32.1309.2024.03.001, 2024.
Tan, L. and Schultz, D. M.: Damage classification and recovery analysis of the Chongqing, China, floods of August 2020 based on social-media data, J. Clean. Prod., 313, 127882, https://doi.org/10.1016/j.jclepro.2021.127882, 2021.
Tellman, B., Sullivan, J. A., Kuhn, C. Kettner, A. J., Doyle, C. S., Brakenridge, G. R., Erickson, T. A., and Slayback, D. A.: Satellite imaging reveals increased proportion of population exposed to floods, Nature, 596, 80–86, https://doi.org/10.1038/s41586-021-03695-w, 2021.
Wang, H., Meng, Y., Xu, H., Wang, H., Guan, X., Liu, Y., Liu, M., and Wu, Z.: Prediction of flood risk levels of urban flooded points though using machine learning with unbalanced data, J. Hydrol., 630, 130742, https://doi.org/10.1016/j.jhydrol.2024.130742, 2024.
Wang, P., Zhu, Y., and Yu, P.: Assessment of Urban Flood Vulnerability Using the Integrated Framework and Process Analysis: A Case from Nanjing, China, Int. J. Environ. Res. Pub. He., 19, 16595, https://doi.org/10.3390/ijerph192416595, 2022a.
Wang, Y., Li, C., Liu, M., Cui, Q., Wang, H., Lv, J., Li, B., Xiong, Z., and Hu, Y.: Spatial characteristics and driving factors of urban flooding in chinese megacities, J. Hydrol., 613, 128464, https://doi.org/10.1016/j.jhydrol.2022.128464, 2022b.
Wing, O. E. J., Pinter, N., Bates, P. D., and Kousky, C.: New insights into US flood vulnerability revealed from flood insurance big data, Nat. Commun., 11, 1444, https://doi.org/10.1038/s41467-020-15264-2, 2020.
Wu, M., Wu, Z., Ge, W., Wang, H., Shen, Y., and Jiang, M.: Identification of sensitivity indicators of urban rainstorm flood disasters: A case study in China, J. Hydrol., 599, 126393, https://doi.org/10.1016/j.jhydrol.2021.126393, 2021.
Wu, Z., Shen, Y., Wang, H., and Wu, M.: An ontology-based framework for heterogeneous data management and its application for urban flood disasters, Earth Sci. Inform., 13, 377–390, https://doi.org/10.1007/s12145-019-00439-3, 2020.
Xu, T., Xie, Z., Jiang, F., Yang, S., Deng, Z., Zhao, L., Wen, G., and Du, Q.: Urban flooding resilience evaluation with coupled rainfall and flooding models: a small area in Kunming City, China as an example, Water Sci. Technol., 87, 2820–2839, https://doi.org/10.2166/wst.2023.149, 2023.
Xu, T., Li, E., Samat, A., Wang, S., and Yu, M.: Evaluation of urban flood-prone regions in Chinese cities based on potential flood hazard assessment model, Nat. Hazards, 121, 18743–18763, https://doi.org/10.1007/s11069-025-07536-1, 2025.
Yang, L., Li, J., Kang, A., Li, S., and Feng, P.: The Effect of Nonstationarity in Rainfall on Urban Flooding Based on Coupling SWMM and MIKE21, Water Resour. Manag., 34, 1535–1551, https://doi.org/10.1007/s11269-020-02522-7, 2020.
Yang, W., Zheng, C., Jiang, X., Wang, H., Lian, J., Hu, D., and Zheng, A.: Study on urban flood simulation based on a novel model of SWTM coupling D8 flow direction and backflow effect, J. Hydrol., 621, 129608, https://doi.org/10.1016/j.jhydrol.2023.129608, 2023.
Yin, D., Chen, Y., Jia, H., Wang, Q., Chen, Z., Xu, C., Li, Q., Wang, W., Yang, Y., Fu, G., and Chen, A. S.: Sponge city practice in China: A review of construction, assessment, operational and maintenance, J. Clean. Prod., 280, 124963, https://doi.org/10.1016/j.jclepro.2020.124963, 2021.
Yin, J., Yu, D., Yin, Z., Liu, M., and He, Q.: Evaluating the impact and risk of pluvial flash flood on intra-urban road network: A case study in the city center of Shanghai, China, J. Hydrol., 537, 138–145, https://doi.org/10.1016/j.jhydrol.2016.03.037, 2016.
Zhang, H., Jia, H., Liu, W., Wang, J., Xu, D., Li, S., and Liu, X.: Spatiotemporal Information Mining for Emergency Response of Urban Flood Based on Social Media and Remote Sensing Data, Remote Sens.-Basel, 15, 4301, https://doi.org/10.3390/rs15174301, 2023.
Zhao, J., Zhang, C., Wang, J., Abbas, Z., and Zhao, Y.: Machine learning and SHAP-based susceptibility assessment of storm flood in rapidly urbanizing areas: a case study of Shenzhen, China, Geomat. Nat. Haz. Risk, 15, https://doi.org/10.1080/19475705.2024.2311889, 2024.
Zhang, Q., Li, C., Wen, D., Kang, J., Chen, T., Zhang, B., Hu, Y., and Yin, J.: Global South shows higher urban flood exposures than the Global North under current and future scenarios, Commun. Earth Environ., 6, 594, https://doi.org/10.1038/s43247-025-02585-7, 2025.