the Creative Commons Attribution 4.0 License.
the Creative Commons Attribution 4.0 License.
 | 26 Jan 2026
Quantifying the influence of coastal flood hazards on building habitability following Hurricane Irma
Benjamin Nelson-Mercer
Tessa Swanson
Seth Guikema
Jeremy Bricker
Appropriate management of coastal flood risk is critical for creating resilient communities. An important part of this is estimating what buildings will become uninhabitable due to a flood event such as a tropical cyclone. To increase the accuracy of these estimations, habitability functions are developed to quantify the relationship between hydrodynamic hazards and the probability of a building becoming uninhabitable following Hurricane Irma. Hazards like maximum flood depths are determined by modeling Hurricane Irma flooding in Delft3D-FM coupled with the wave model SWAN. These modeled hazard levels are then extracted at building locations where Location Based Services (LBS) data provide information on buildings that were uninhabitable following Hurricane Irma. The developed habitability functions provide valuable insights into how different hydrodynamic parameters and regression models perform for estimating building habitability, where maximum unit discharge is generally the best predictor of habitability. Furthermore, we find that while wooden structure habitability is significantly influenced by hazard level, concrete structure habitability is not. These findings provide novel methods for estimating coastal flooding induced building uninhabitability, enhancing how planners can prepare for floods.
- Article
(11719 KB) - Full-text XML
- BibTeX
- EndNote


Coastal flooding caused by tropical cyclones is a significant driver of structural damage, economic loss, and both short-term and long-term migration worldwide. Sea level rise and precipitation intensification resulting from climate change is expected to exacerbate the damage and loss caused by tropical cyclones (Gori et al., 2022; Hughes and Zhang, 2023; Mendelsohn et al., 2012; Woodruff et al., 2013). The number of people living in low-elevation coastal zones is also increasing, with over a billion people expected to be living in these zones by 2060 (Neumann et al., 2015). In the United States, tropical cyclones have resulted in almost 7000 deaths and over USD 1.4 trillion in costs (CPI-Adjusted) since 1980 (Smith, 2020). The significant losses due to tropical cyclones and increased risk posed by climate change highlight the need for improved planning and adaptation for coastal areas subject to tropical cyclones.
Common tools for managing flood risk include damage functions or fragility functions to estimate and predict the structural damage sustained during a flood event (Diaz Loaiza et al., 2022; Pistrika and Jonkman, 2010; Suppasri et al., 2013; Tomiczek et al., 2013; Tsubaki et al., 2016; Xu et al., 2023). Typically, damage functions estimate the percent of a building damaged, while fragility functions estimate the likelihood of a building reaching a specific damaged state. These functions most commonly estimate structural damage as a function of flood depth; however, other hydrodynamic parameters such as flow velocity, unit discharge, and flood duration have also been used to estimate damage due to coastal flooding (Charvet et al., 2015; De Risi et al., 2017; Diaz Loaiza et al., 2022; Nofal et al., 2020; Xu et al., 2023). Many of these functions also incorporate structural components to increase the accuracy of predicting physical damage to buildings (Charvet et al., 2015; De Risi et al., 2017; Paprotny et al., 2021; Tomiczek et al., 2013; Xu et al., 2023).
While damage functions are helpful for predicting structural damage, they are generally applied to derive economic losses following a flood event (Pistrika and Jonkman, 2010). Paul et al. (2024) point out the use of post-disaster economic loss to characterize risk often incorrectly emphasizes wealthier people as being at greater risk from disasters, when previous studies have shown lower income groups are impacted more by natural disasters (Fothergill and Peek, 2004; Hallegatte et al., 2020). Fragility functions offer an improvement over damage functions in this context by predicting what state a building is in following an event such as “no damage”, “moderate damage”, or “complete damage” (Charvet et al., 2015; De Risi et al., 2017), but these functions are still focused only on structural damage. Assessing building habitability rather than building damage following an event is one option for providing a more equitable overview of coastal flood risk and post-disaster recovery (Paul et al., 2024). Different factors such as structural components (number of stories, building material, etc.), power outages, school closures, socioeconomic statuses, and access to other essential services can influence if and when a building becomes habitable (Loos et al., 2023; Paprotny et al., 2021; Paul et al., 2024; Suppasri et al., 2013; Thieken et al., 2005; Yabe et al., 2020). However, physical damage to structures is often the largest factor determining a building's habitability (Paul et al., 2024), showing the importance of flood hazard consideration in predicting post-disaster building habitability.
Efforts have been made to quantify the influence of physical damages on post-disaster recovery (FEMA, 2024a, b; Nofal et al., 2024; Yabe et al., 2020). Yabe et al. (2020) utilized mobile phone data to estimate immediate and long-term household displacement from Hurricane Irma, finding that housing damage rates were strong estimators of household displacement 0 d after Irma and housing damage rates were only weakly correlated with displacement 160 d after Irma. This study relied on the Federal Emergency Management Agency's (FEMA) Individuals and Households Program for estimating housing damage, neglecting the actual flood hazard (Yabe et al., 2020). Furthermore, displacement 0 d from an event is measuring evacuation rates rather than building habitability. Nofal et al. (2024) transformed building fragility curves to functional fragility curves by estimating conditional probabilities of functionality states given different damage states. While habitability is considered a part of the functionality estimated by these curves, the conditional probabilities used are derived from the authors' judgement and are not directly developed from flood depths (Nofal et al., 2024). Hazus, a tool developed by FEMA, is capable of estimating building habitability with hazard information (FEMA, 2024a, b). The Hazus Hurricane Model estimates building habitability with both demographic data and computed structural damage derived from wind hazard information (FEMA, 2024b). While the Hazus Flood Model also incorporates demographic data for estimating habitability, the hazard information used is simply the area of a census tract with nonzero inundation (FEMA, 2024a). This exhibits a significant knowledge gap in how varying levels of flood hazards influence building habitability.
To improve coastal communities' resilience to tropical cyclones, this study aims to uncover the relationship between flood hazards and building habitability following Hurricane Irma. Hurricane Irma made landfall in September 2017 in the Florida Keys as a Category 4 hurricane before reaching southwestern Florida as a Category 3 hurricane (Cangialosi et al., 2021), resulting in approximately USD 64 billion in damages (CPI-Adjusted) (Smith, 2020). In Florida, water elevations reached 1.1 and 1.7 m above mean sea level (MSL) at NOAA tide gages in Key West and Naples, respectively. Overland, the Florida Keys and southwestern Florida experienced maximum flood depths that exceeded 2 m (Cangialosi et al., 2021). In addition to storm surge, Irma caused widespread destruction from wind and wave hazards, displacing millions of people (Issa et al., 2018; Joyce et al., 2019). Through Location Based Services (LBS) data collected from cell phones, we know if and when many buildings were once again occupied following Hurricane Irma (Swanson and Guikema, 2024). Combining this LBS dataset with an integrated hydrodynamic-wave model of Hurricane Irma, we draw upon previous methods for developing damage and fragility functions and apply them to develop habitability functions. These habitability functions offer new estimates of the probability of buildings being uninhabitable following tropical cyclones, advancing current approaches to quantifying flood-induced building uninhabitability.
2.1 Flood model development for Hurricane Irma
Coastal flooding caused by Hurricane Irma is modeled with D-Flow Flexible Mesh (D-Flow FM) coupled with SWAN (Simulating WAves Nearshore). Hydrodynamics are simulated by D-Flow FM, which implements a finite volume solver to calculate unsteady flow with the non-linear shallow water equations to simulate storm tide resulting from tidal and meteorological forcings (Deltares, 2022a). The depth-averaged approach is used for this study. SWAN is a phase-averaged wave model that simulates wave evolution (Deltares, 2022b). These models are integrated together in the Delft3D Flexible Mesh modeling suite via online coupling, enabling hydrodynamic parameters from D-Flow FM and wave parameters from SWAN to be exchanged every coupling timestep.
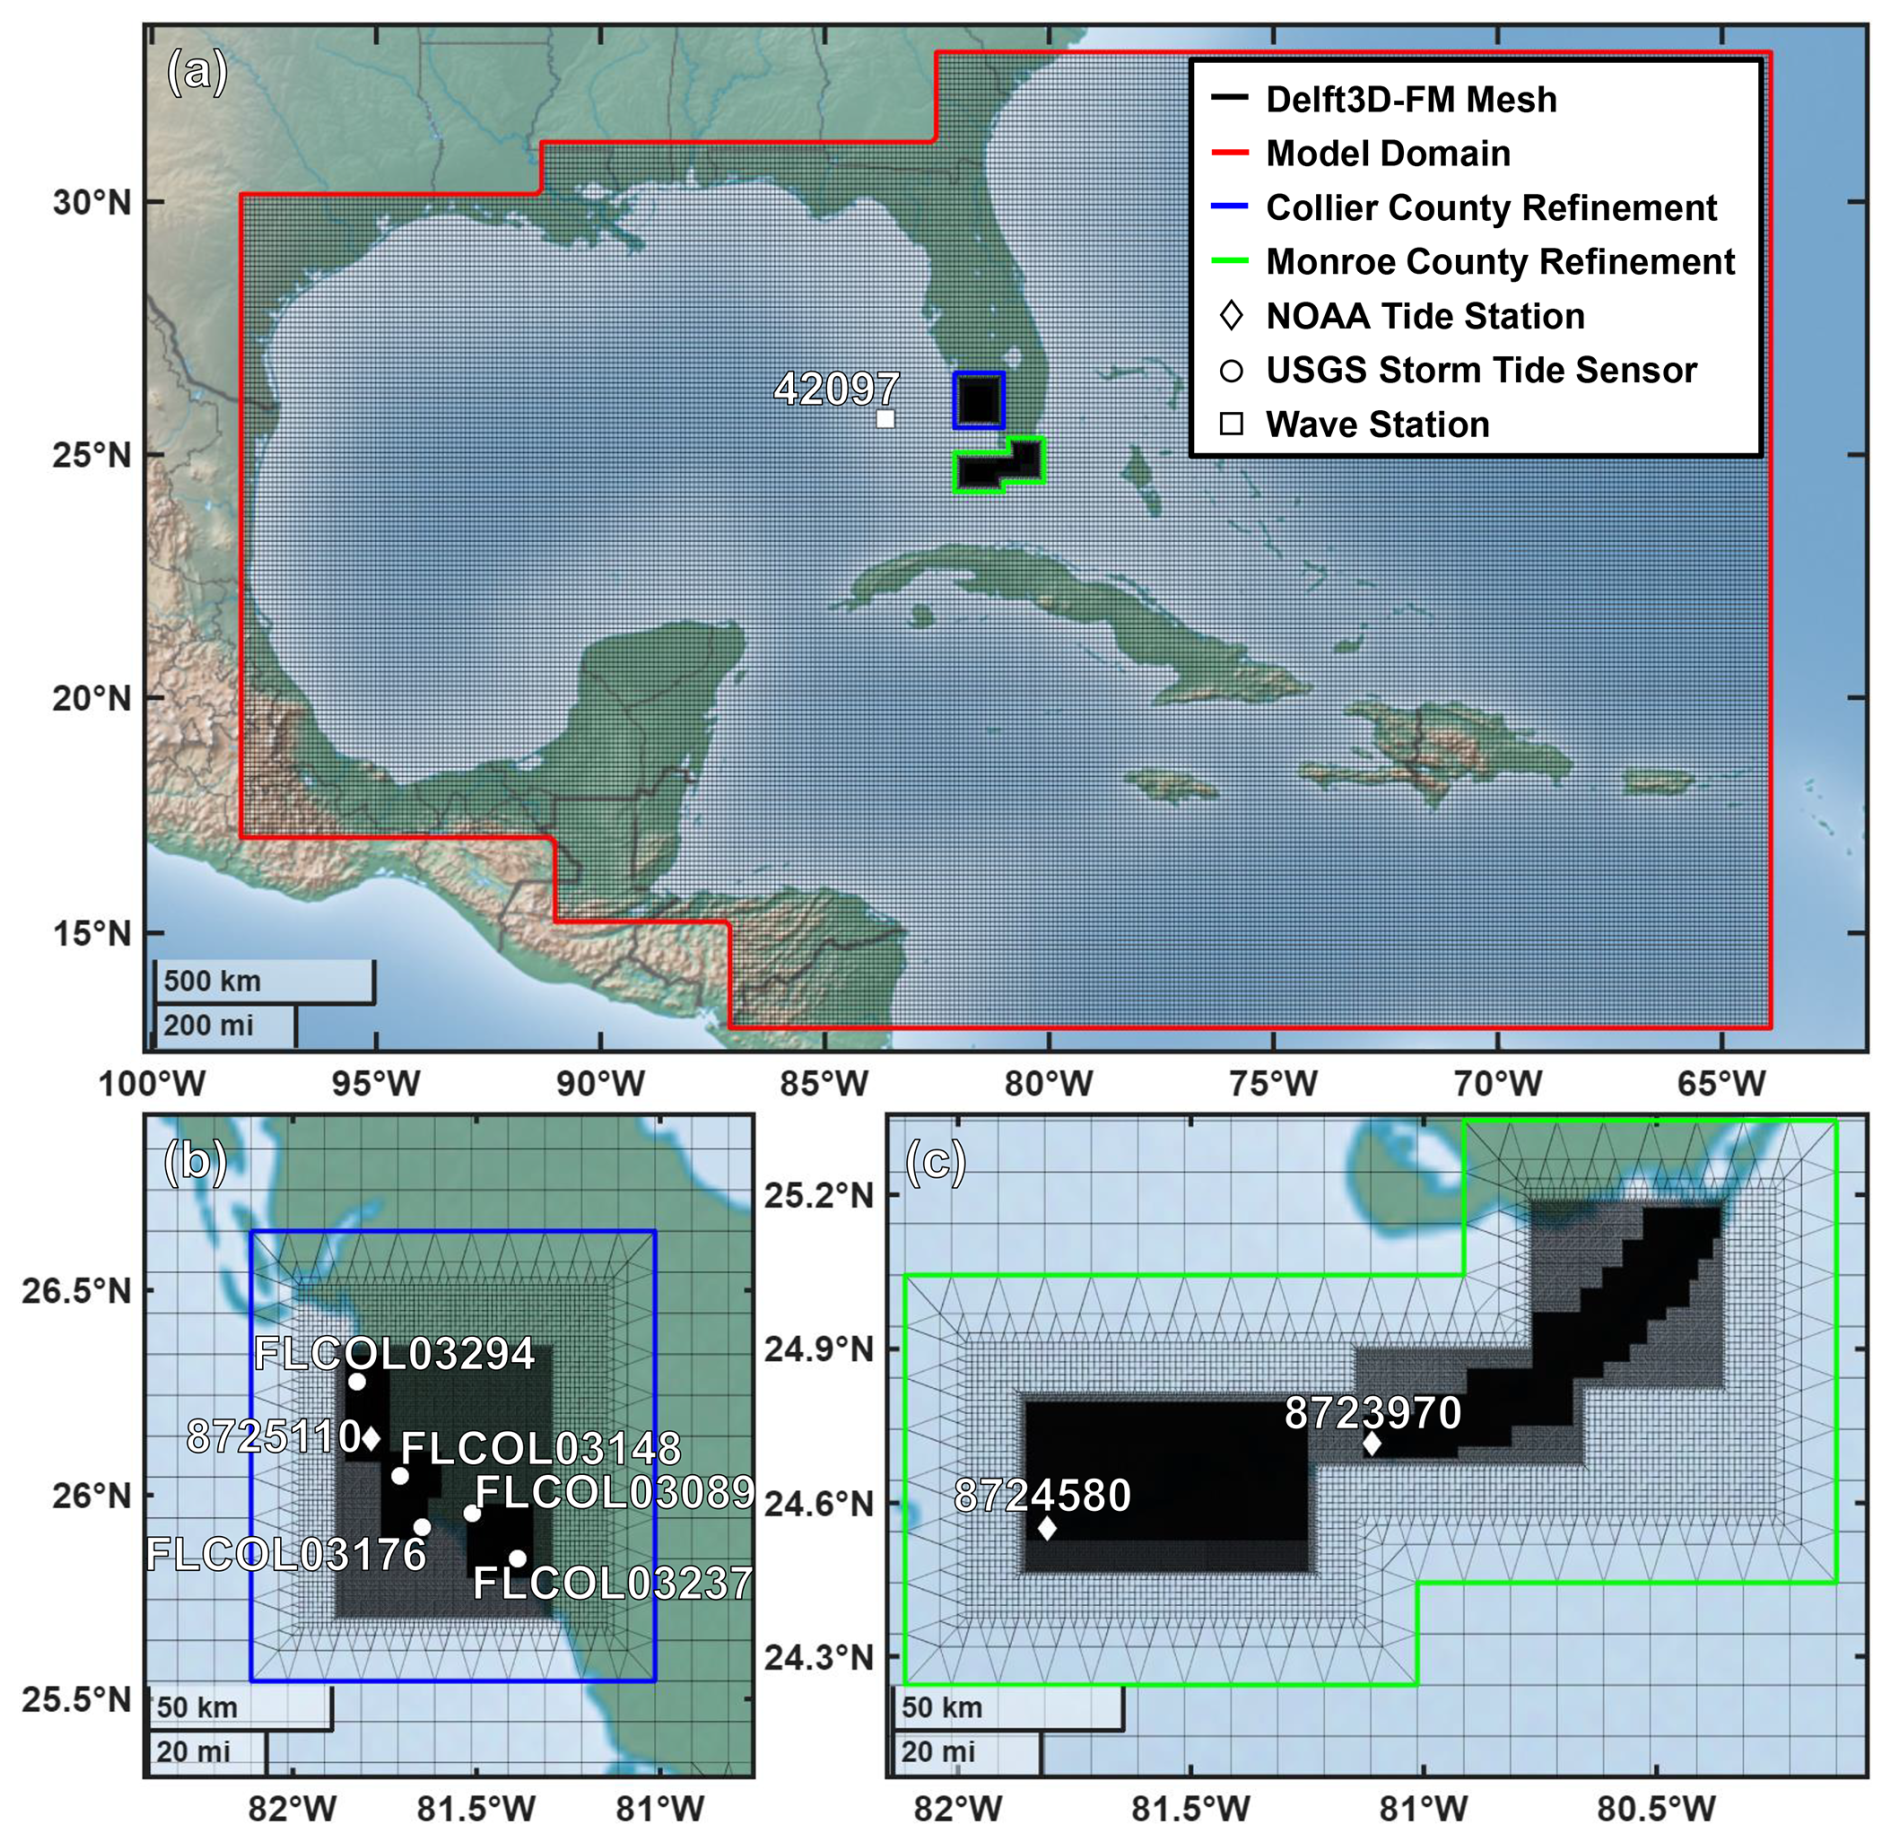
Figure 1Overview of the entire model domain (a) and two locations of refinement for Collier (b) and Monroe (c) Counties. NOAA tide and wave stations are indicated with diamonds and squares, respectively. USGS storm tide sensors are indicated with circles.
The model developed for this study includes both Collier and Monroe Counties. The extent of the model is from 12.94 to 32.84° N and 98.01 to 63.91° W (Fig. 1a). D-Flow FM enables the use of an unstructured mesh for simulations. The unstructured mesh created for this modeling has a coarse resolution of 10 km and is refined to 80 m in areas with both coastal flooding during Irma's landfall and LBS data (Fig. 1b, c). For wave modeling, SWAN requires nested structured meshes. Our SWAN model has a coarse 10 km resolution mesh spanning the entire domain with nested meshes down to a refinement of 80 m for the same areas refined in the D-Flow FM model.
Digital elevation models (DEMs) used for this flood modeling come from NOAA's National Centers for Environmental Information's (NCEI) DEM Global Mosaic and the General Bathymetric Chart of the Oceans (GEBCO). The refined areas of the flood model utilize 3 and 1 arcsec DEMs from the NCEI's DEM Global Mosaic (NOAA NCEI, 2022). The coarser portions in the model use GEBCO's 15 arcsec dataset (GEBCO, 2023).
Spatially varying Manning's coefficients of roughness are used to account for bed friction in the model. These values are derived from the 2019 National Land Cover Database (NLCD) for the Contiguous United States (Dewitz and USGS, 2024). These NLCD land cover values are then converted to Manning's roughness coefficients by taking the corresponding minimum Manning's value listed in the Hydrologic Engineering Center's River Analysis System (HEC-RAS) 2D User's Manual (Hydrologic Engineering Center, 2021).
Meteorological forcings used for the flood model are wind and atmospheric pressure fields. These fields are generated with the Holland model (Holland, 2008; Holland et al., 2010), which requires information on a tropical cyclone's path such as the coordinates of the eye's path, maximum wind speeds, and radius of maximum winds. The necessary Hurricane Irma best track data come from the National Hurricane Center's revised Atlantic hurricane database (HURDAT2) (Landsea and Franklin, 2013), supplemented by the Tropical Cyclone Extended Best Track Dataset (EBTRK) that provides radius to maximum winds information (Demuth et al., 2006). Together, these datasets and the Holland model are used to develop a symmetric profile of Irma as a spiderweb grid. Spiderweb grids convey the atmospheric pressures, wind velocity magnitudes, and wind directions used in the flood model on a polar grid, where the origin of the grid represents the eye of the hurricane at each timestep (Deltares, 2022a). A second Irma profile is also created to account for asymmetries in the hurricane profile. This was done by incorporating a dependency on the azimuthal angle into the Holland model used (Xie et al., 2006), enabling an asymmetric Irma profile to be generated.
The default wind drag coefficient formulation in D-Flow FM is utilized for determining the shear stress on the flow due to wind forcings. This drag coefficient is based on the Smith and Banke (1975) relationship, where the drag coefficient varies linearly from 0.00063 to 0.00723 for wind speeds from 0 to 100 m s−1. It was determined that the default SWAN drag coefficient profile, which relies on the Wu (1982) relationship, is insufficient for this modeling, producing unreasonably low wave heights and periods. Therefore, an increased drag coefficient profile is needed. For SWAN, the increased drag coefficient relationship used is as follows:
where CD is the drag coefficient and U10 is the wind speed 10 m above the surface in m s−1 (Deltares, 2022b; Wu, 1982). Due to the difficulty in prescribing a new drag profile in SWAN, implementing this increased drag profile was instead done by increasing the wind speed values by 25 % in the spiderweb grids used by SWAN. This 25 % increase to the wind speeds corresponds to the same wind wave growth due to the increased drag profile described by Eq. (1).
Tidal boundary conditions for the Atlantic Ocean and Gulf of Mexico are located around the northern, eastern, and southern boundaries of the domain where the bed elevation is below mean sea level. Tidal constituents at these boundaries are generated from the Oregon State University Tidal Inversion Software (Egbert and Erofeeva, 2002), which are then used as astronomical forcings at the boundaries.
2.2 Model validation
The validity of the model is assessed using water level measurement from three NOAA tide stations and five USGS storm tide sensors (Fig. 1), which have all been previously used when validating Hurricane Irma models (Asher and Luettich, 2025; Dobbelaere et al., 2022; Li et al., 2021; Musinguzi et al., 2022). The measurements from the USGS sensors are converted from NAVD88 to MSL using NOAA's VDatum tool (http://vdatum.noaa.gov, last access: 30 October 2025). Two USGS sensors (FLCOL03148 and FLCOL03089) are located outside valid tidal areas and are instead converted to MSL using the nearest valid tidal area in VDatum. Additionally, modeled wave parameters are compared to significant wave heights and peak wave periods measured at the National Data Buoy Center (NDBC) station 42097. First the tidal boundary conditions are validated by comparing the modeled water levels without meteorological forcings against the predicted water levels. Then the developed Irma wind and pressure fields are implemented into the model and the resulting water levels and wave parameters are validated against observations (Fig. 2). Four combinations of the symmetric and asymmetric Irma profiles are compared: the symmetric profile is used for both D-Flow FM and SWAN (M1), the asymmetric profile is used for both D-Flow FM and SWAN (M2), the symmetric profile is used for D-Flow FM and the asymmetric profile is used for SWAN (M3), and the asymmetric profile is used for D-Flow FM and the symmetric profile is used for SWAN (M4). The root mean square error (RMSE) between modeled and observed water levels and wave parameters is determined for each model at each of the locations shown in Fig. 1 (Table 1). To remain consistent with the 30 min time resolution of the model output, RMSE is calculated using observed data for each half hour. The difference between maximum modeled and maximum observed water levels and wave parameters is also determined at each station (Table 1).
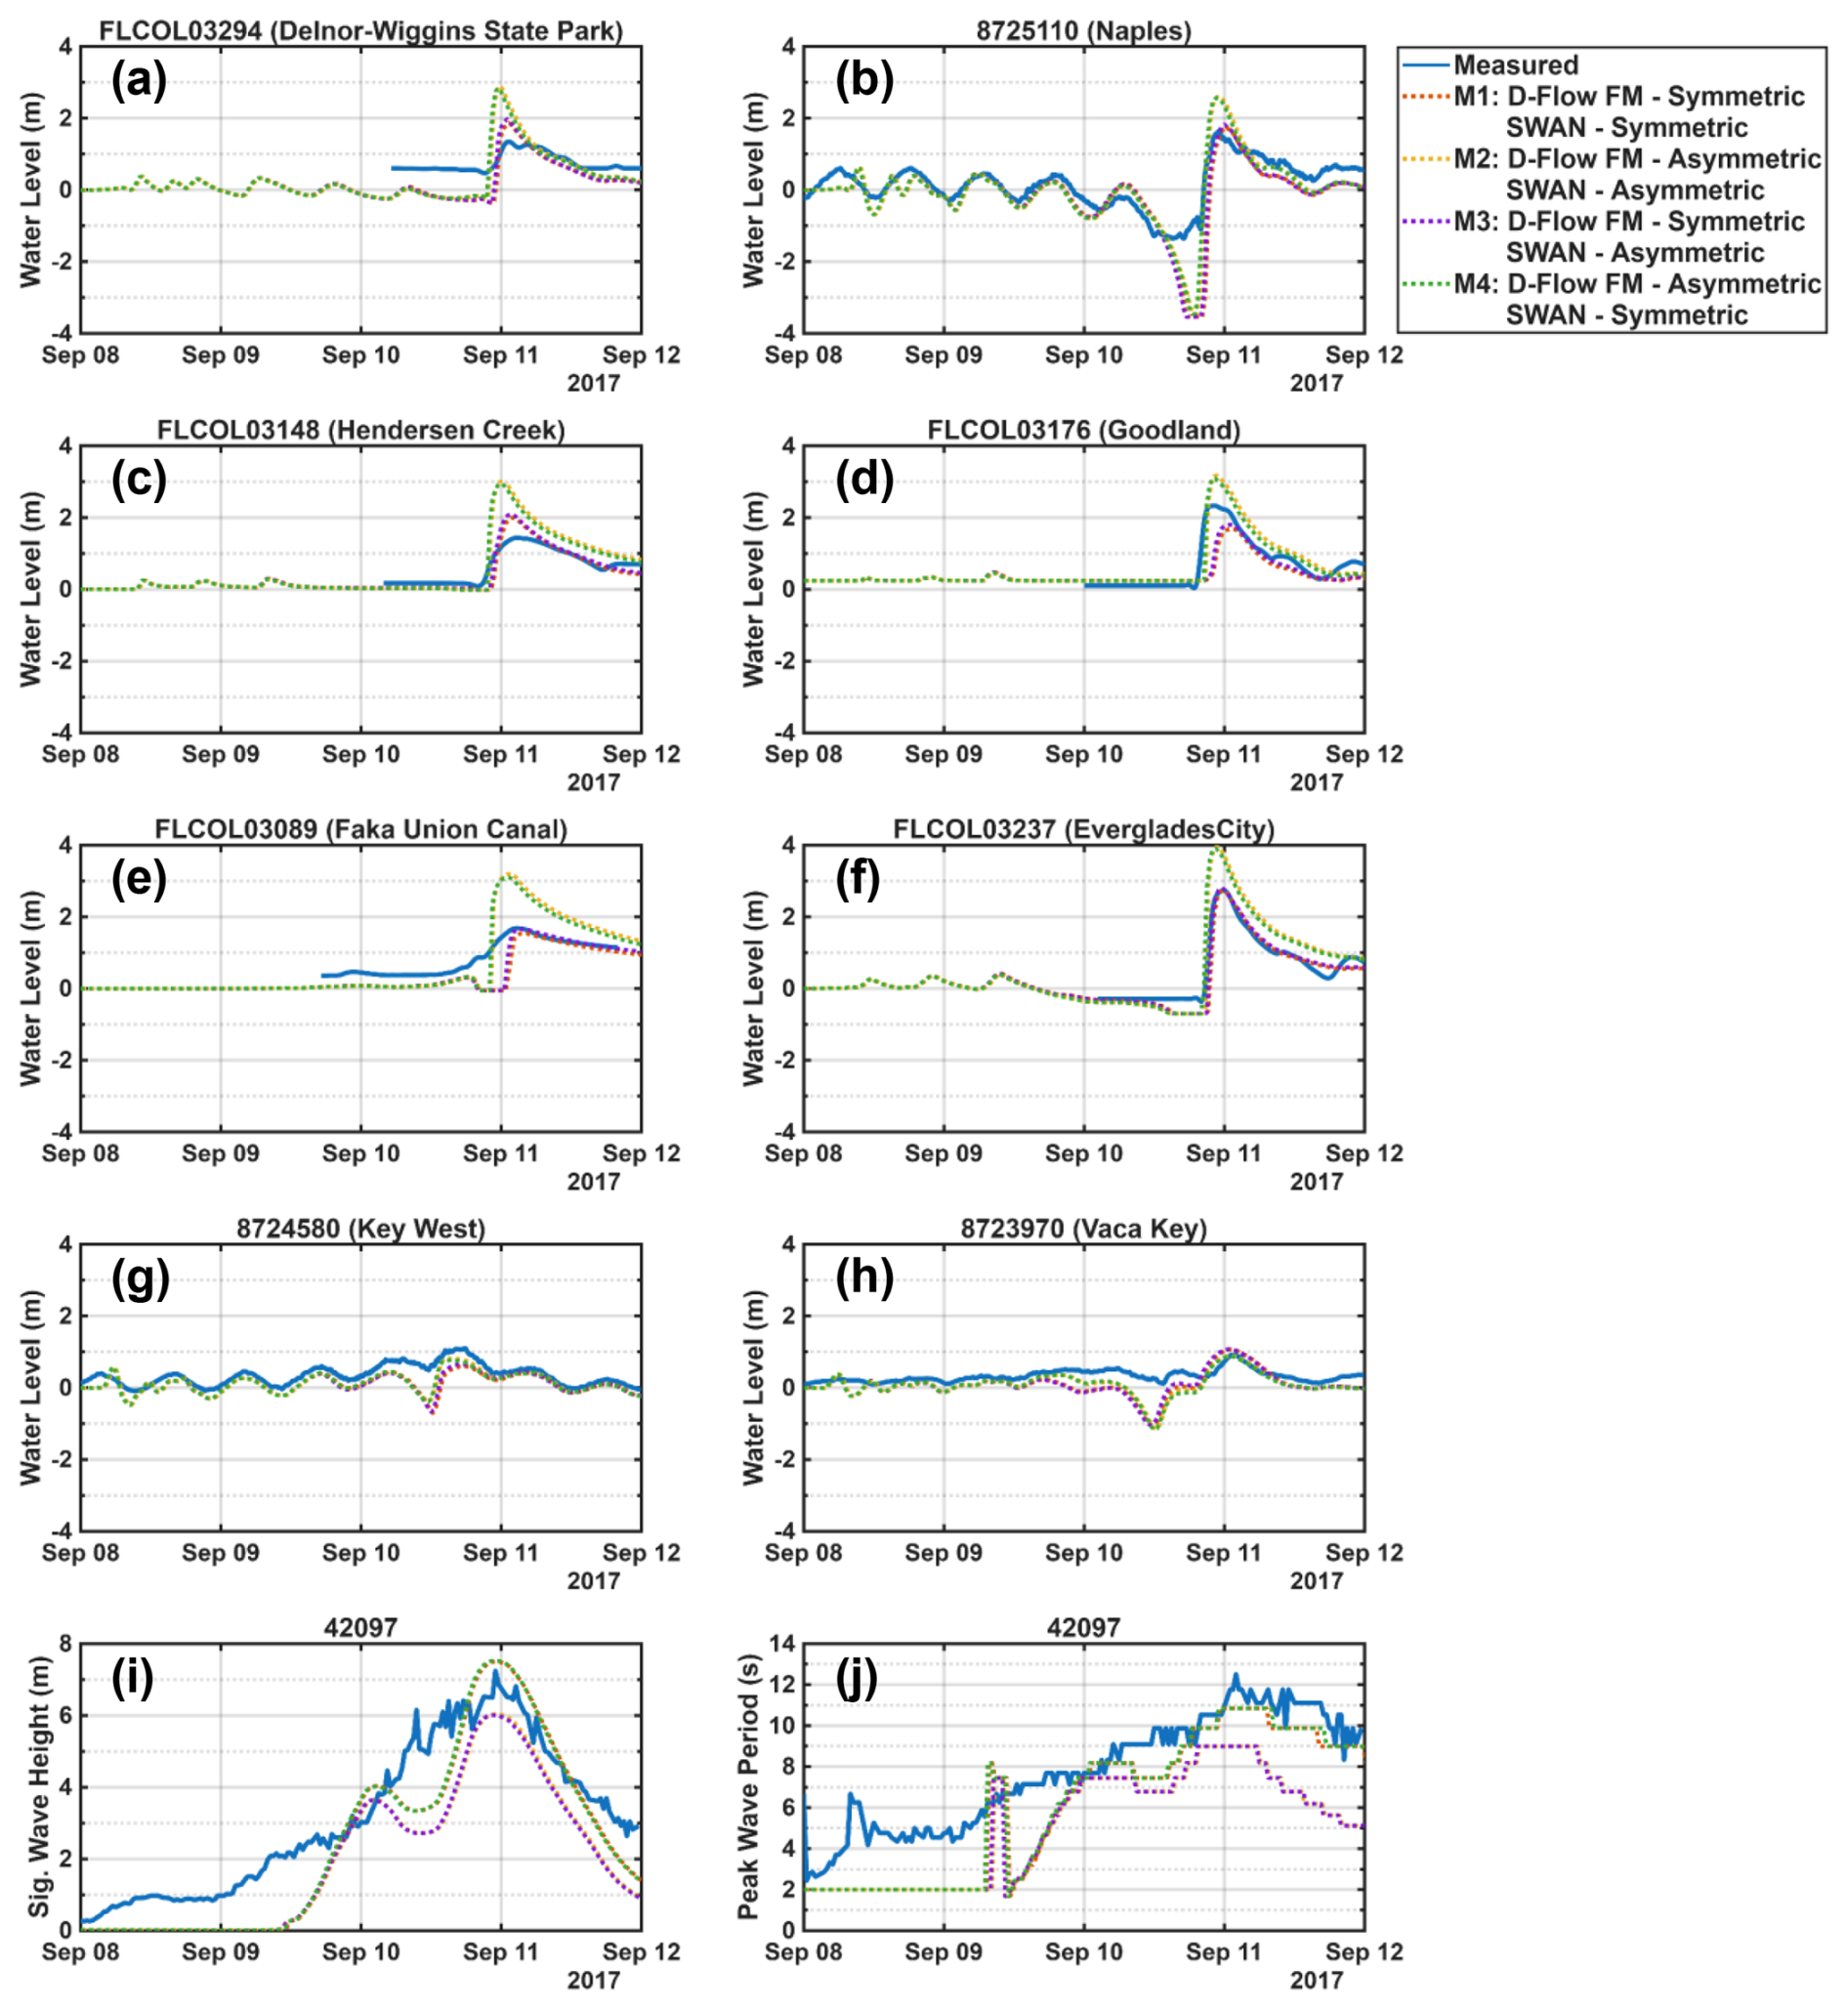
Figure 2Storm tide comparisons between the measured and modeled water levels relative to MSL (a–h). Comparisons between the measured and modeled significant wave heights (i) and peak wave periods (j).
Table 1Goodness of fit for different combinations of symmetric and asymmetric Irma wind profiles.
Comparison of the four different models clearly shows the symmetric Irma profile performs the best for modeling wave parameters, where the two models that utilize a symmetric profile for SWAN (M1 and M4) have the lowest RMSE and differences in maximum modeled and maximum observed significant wave height and peak wave period (Table 1). For the six locations compared in Collier County, M1 and M3 have the strongest agreement between maximum modeled and observed water level. M1 and M3 also perform best in terms of RMSE at the six Collier County locations, with the exception of the Naples station. At the Key West and Vaca Key stations, M2 and M4 perform the best for both metrics analyzed.
Two models are selected for developing habitability functions based on these performance metrics. The M1 model is used for Collier County and the M4 model is used for Monroe County. The M2 and M3 models are not considered for developing the habitability functions because the symmetric Irma profile performed significantly better than the asymmetric profile for modeling wave parameters in SWAN. Since the habitability functions are developed using maximum values of the model output, M1 is selected for Collier County to minimize the difference between the maximum modeled and maximum observed water levels at the six Collier County locations. Between M1 and M4, the M4 model performed better for the Key West and Vaca Key stations, which is why the M4 model is used for developing habitability functions for Monroe County.
2.3 Determining building habitability following Irma
Whether or not a building was habitable directly following Hurricane Irma is determined using Location Based Services (LBS) and CoreLogic property data. LBS data are provided by Veraset LLC and consists of “pings” that represent exchanges between mobile phones and a cellular network or Wi-Fi. Each ping includes an anonymized user identification number, latitude, longitude, and timestamp, as well as estimates of horizontal accuracy and device type. Pings are filtered and aggregated based on frequently visited locations and time of day to identify each user's home and workplace (Swanson, 2023; Washington et al., 2024). The LBS data utilized span 1 August 2017, until 3 October 2017. In total, there are 18 505 identified home and work locations available for Collier and Monroe Counties, where 16 769 of these are for Collier County and 1736 are for Monroe County.
The recovery period for each user following Hurricane Irma is determined using a Bayesian belief network (BBN) in combination with anomaly detection methods (Swanson, 2023). The BBN incorporates contextual knowledge and time-series data of each user's daily location visits to estimate the joint probability of a user's presence at home or work on a given day prior to Hurricane Irma's landfall. By considering dependencies – such as the day of the week, prior appearances, and visits to other locations on the same day – the model identifies probabilistic patterns for all Florida users and refines these priors with individual user data to create personalized models of each user's “typical” behavior. Anomaly detection methods are applied to user data during the period surrounding Hurricane Irma's landfall to identify anomalous patterns of behavior, such as being absent from home or work or exclusively staying at home, that differ from their previously typical appearance behavior. Recovery is defined as the date when a user's anomalous behavior ends and their visit patterns resemble their pre-landfall behavior for at least three consecutive days. Greater details on identifying recovery periods from LBS data are available in Swanson (2023). Locations where users did not recover their previous visit patterns by the end of 28 September 2017, 18 d after Irma's landfall in Florida, are assumed to be uninhabitable due to damages caused by Irma since essential services such as power and schools were recovered by this date (Hodge and Lee, 2017; Mitsova et al., 2018; Swanson and Guikema, 2024). This assumes that the reason a user did not return to a location is solely because that location was damaged by Irma beyond habitability. This assumption does not account for other socioeconomic factors that may influence if and when someone returns to a location. From this method for estimating habitability, we find that 13.5 % of the users in Monroe County and 6.0 % of the users in Collier County are identified as having uninhabitable homes by the end of 28 September 2017.
Each location derived from the LBS data is then approximated to the nearest building by assigning it to the nearest CoreLogic coordinate, representing the center point of a property. This ensures each LBS datapoint corresponds to an actual building and provides information on the building material. In some instances, this results in multiple LBS datapoints being linked to the same building. For these buildings with multiple LBS datapoints, a building is assumed habitable if at least one LBS user returned to the building by the end of September 2017. A building is assumed uninhabitable if all corresponding LBS users did not return to the building by the end of September 2017. LBS datapoints farther than 0.001 decimal degrees from the nearest CoreLogic coordinate are excluded.
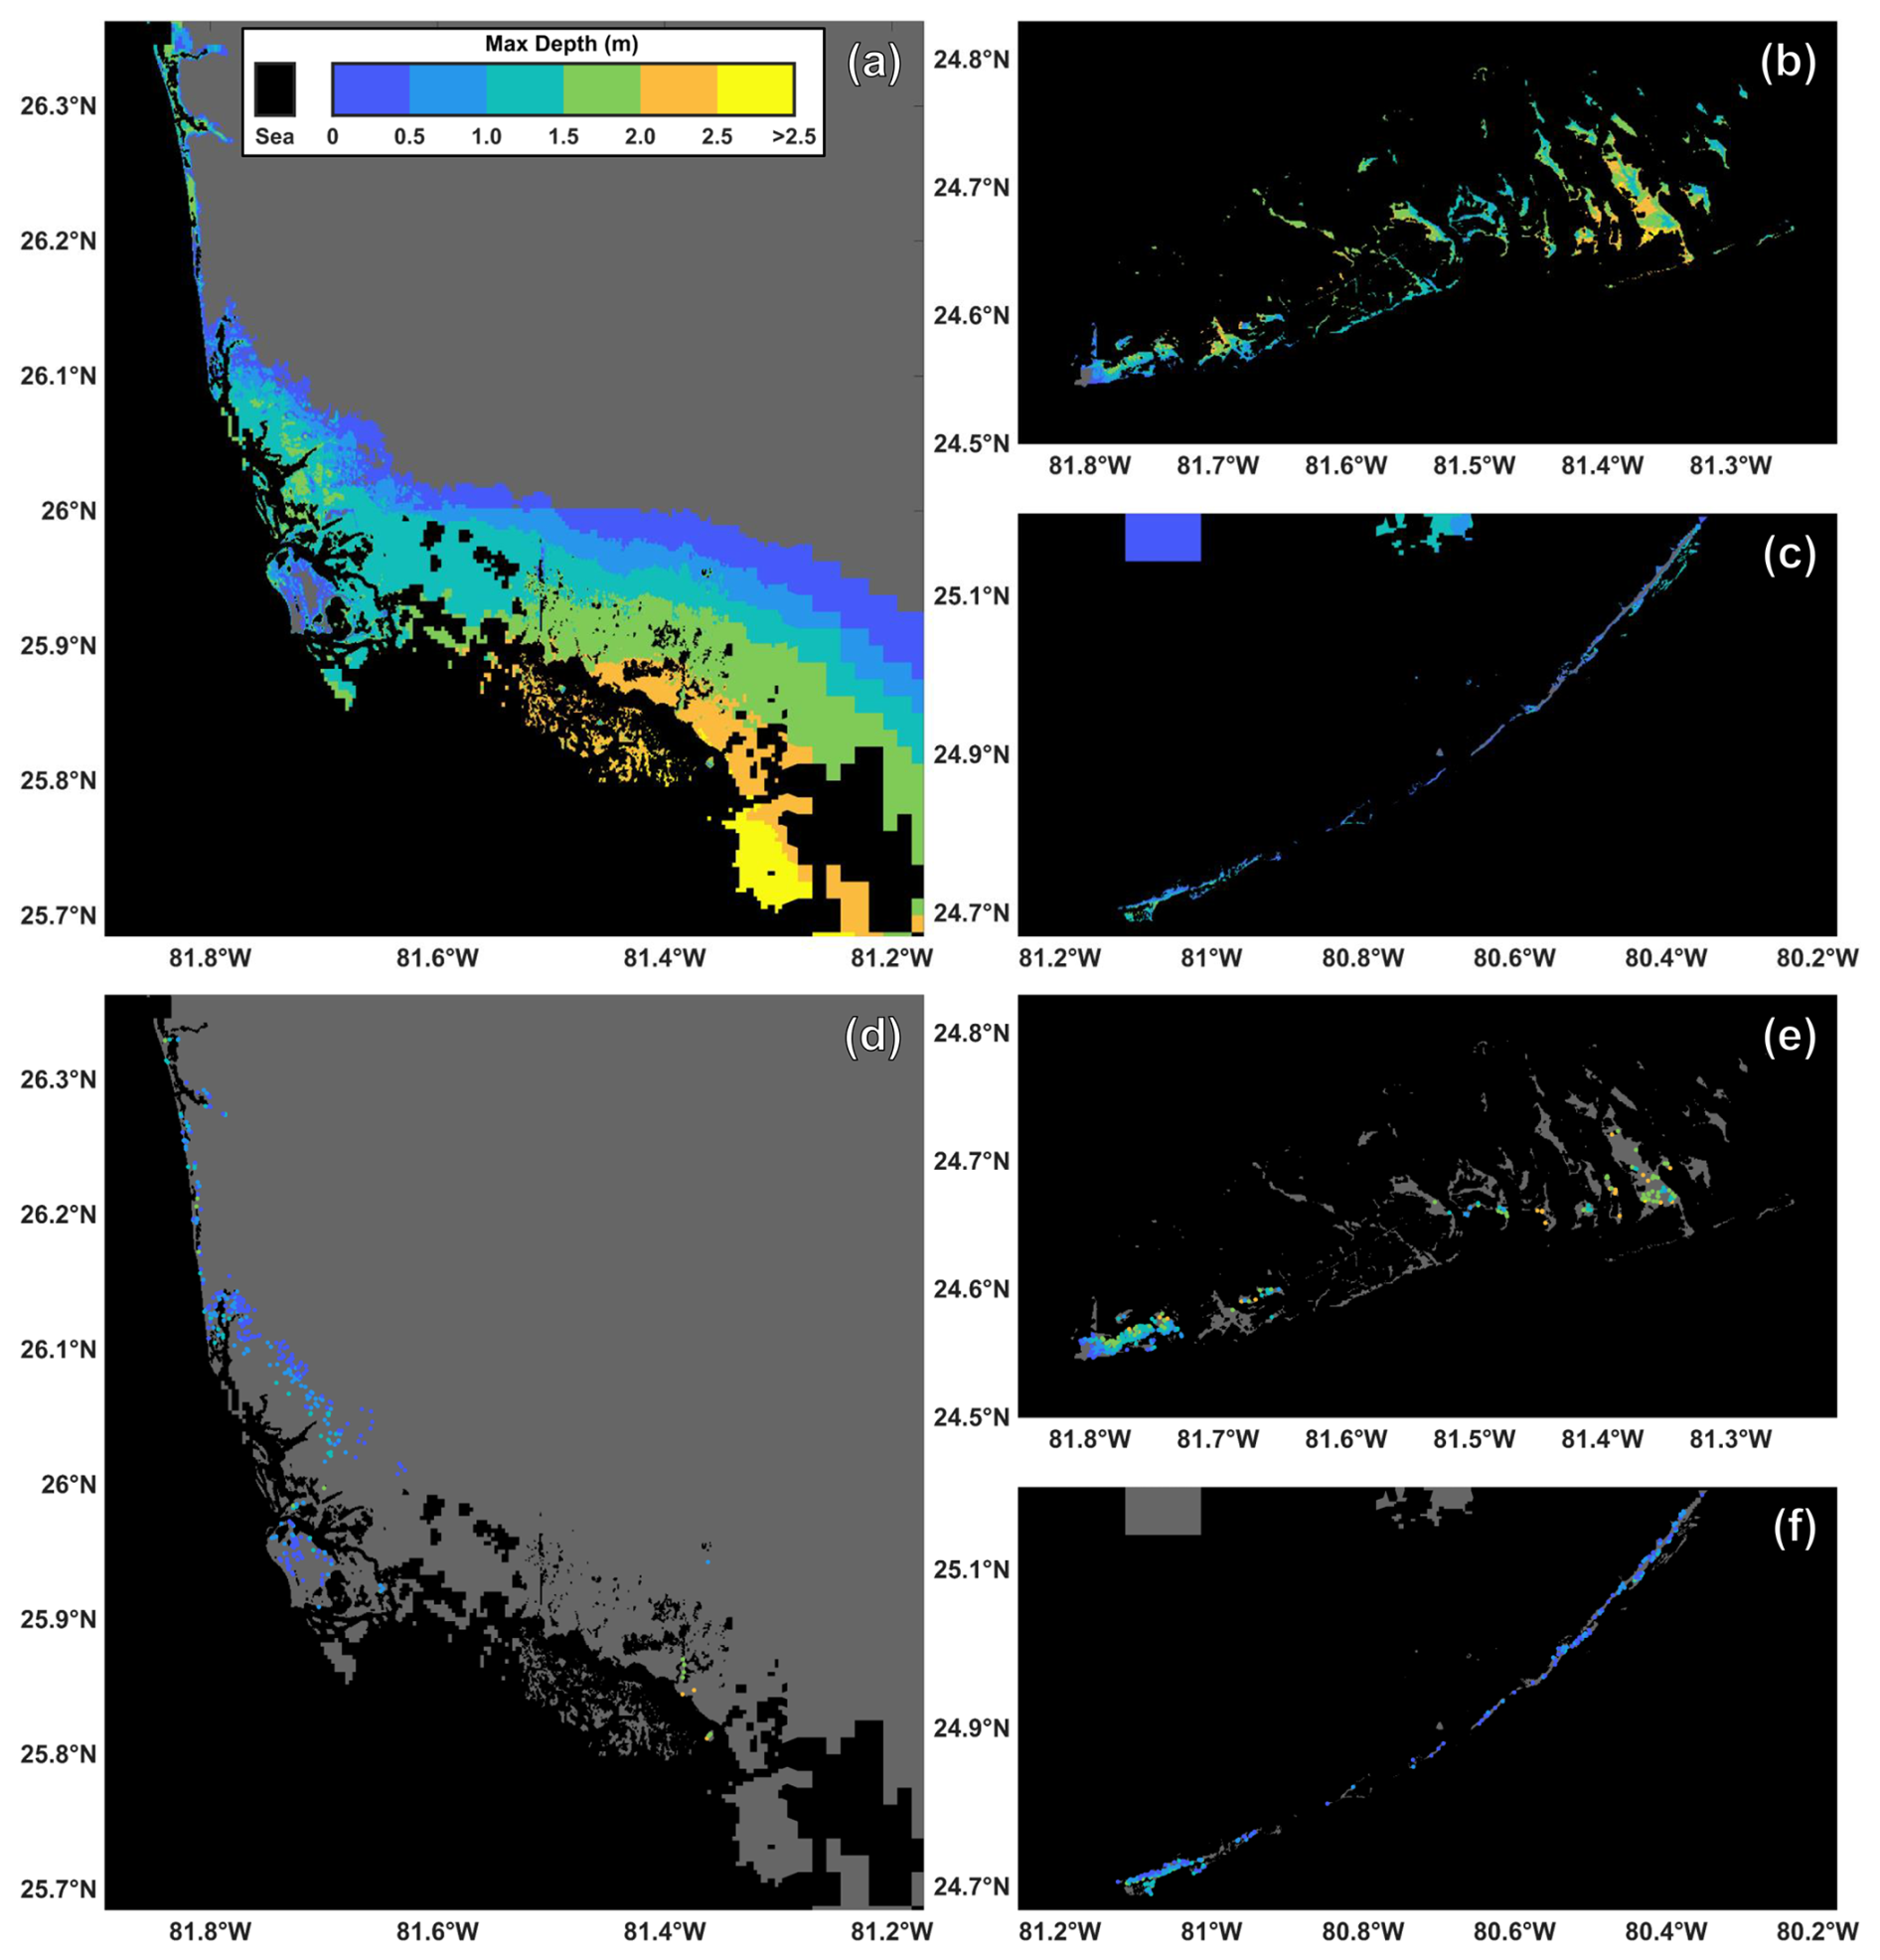
Figure 3Maximum modeled flood depths for Collier County (a) and the western (b) and eastern (c) regions of Monroe County. Building locations and associated maximum flood depths used for habitability functions (d–f). To preserve privacy the exact building locations are not identified.
For each CoreLogic property location that has a habitable or uninhabitable designation from the LBS data analysis, the maximum depth, velocity, and significant wave height experienced are determined by matching each building's latitude and longitude to the nearest cell in the computational mesh of the flood model (Figs. 3 and A1–A2). If a building's coordinate is inundated at the initialization of the model, indicating its corresponding mesh cell's bed level is below mean sea level, the building is excluded from our analysis. Additionally, buildings with a maximum depth of zero, determined from the hydrodynamic model, are removed. After these exclusions, there are 1067 locations with assigned hydrodynamic parameters, where 408 of these locations are for Collier County and the other 659 locations are for Monroe County. From the 1067 locations included in our analysis, 123 of these buildings do not have any user returning by the end of September 2017, indicating these 123 buildings were uninhabitable due to Hurricane Irma. 85 of these uninhabitable buildings are in Monroe County and the other 38 are in Collier County.
3.1 Developing habitability functions
The outputs generated from the previous section are used to develop habitability functions for Florida due to Hurricane Irma as a function of the modeled maximum depth, flow speed, and significant wave height (Figs. 4 and A3). Since each datapoint's habitability entry is binary (habitable/uninhabitable), logistic regression is used to develop habitability functions.
where P(y=1) is the probability of a building being uninhabitable, X is the hydrodynamic hazard level, and β0 and β1 are the logistic regression coefficients. Maximum likelihood estimation is used to estimate the values of the coefficients. Additionally, the 95 % confidence interval is determined to assess the uncertainty of each function (Fig. 4). Goodness of fit for the developed habitability functions is determined with the Akaike information criterion (AIC) and Bayesian information criterion (BIC) (Akaike, 1974; Schwarz, 1978), where lower values of AIC and BIC indicate a better fit.
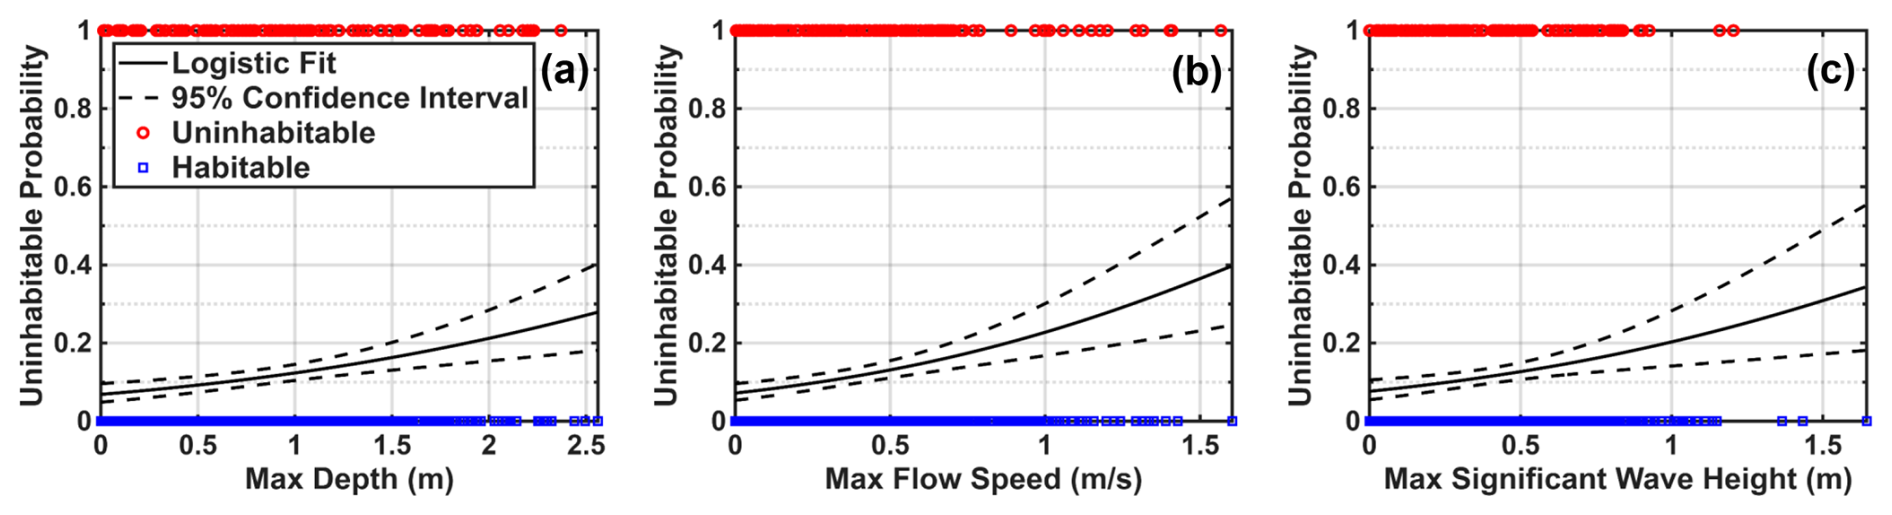
Figure 4Building habitability as a function of maximum depth (a), flow speed (b), and significant wave height (c) for buildings analyzed in Collier and Monroe Counties.
All three habitability functions developed show positive relationships between hazard level and uninhabitable probability that are significant at the 95 % confidence level (Table 2). This indicates that buildings that experienced larger flood depths, flow speeds, and wave heights were more likely to be uninhabitable following Hurricane Irma. Of the three habitability functions developed, the one dependent on flow speed performs the best, having the lowest AIC and BIC values. Conversely, using significant wave height to predict building uninhabitability shows the worst fit. Another apparent detail of these functions is that some buildings are uninhabitable at relatively low hazard levels and others are habitable at relatively high hazard levels. This highlights some of the uncertainty in estimating building habitability using just hazard levels.
Table 2Coefficients for maximum depth, flow speed, and significant wave height for buildings in Collier and Monroe Counties.
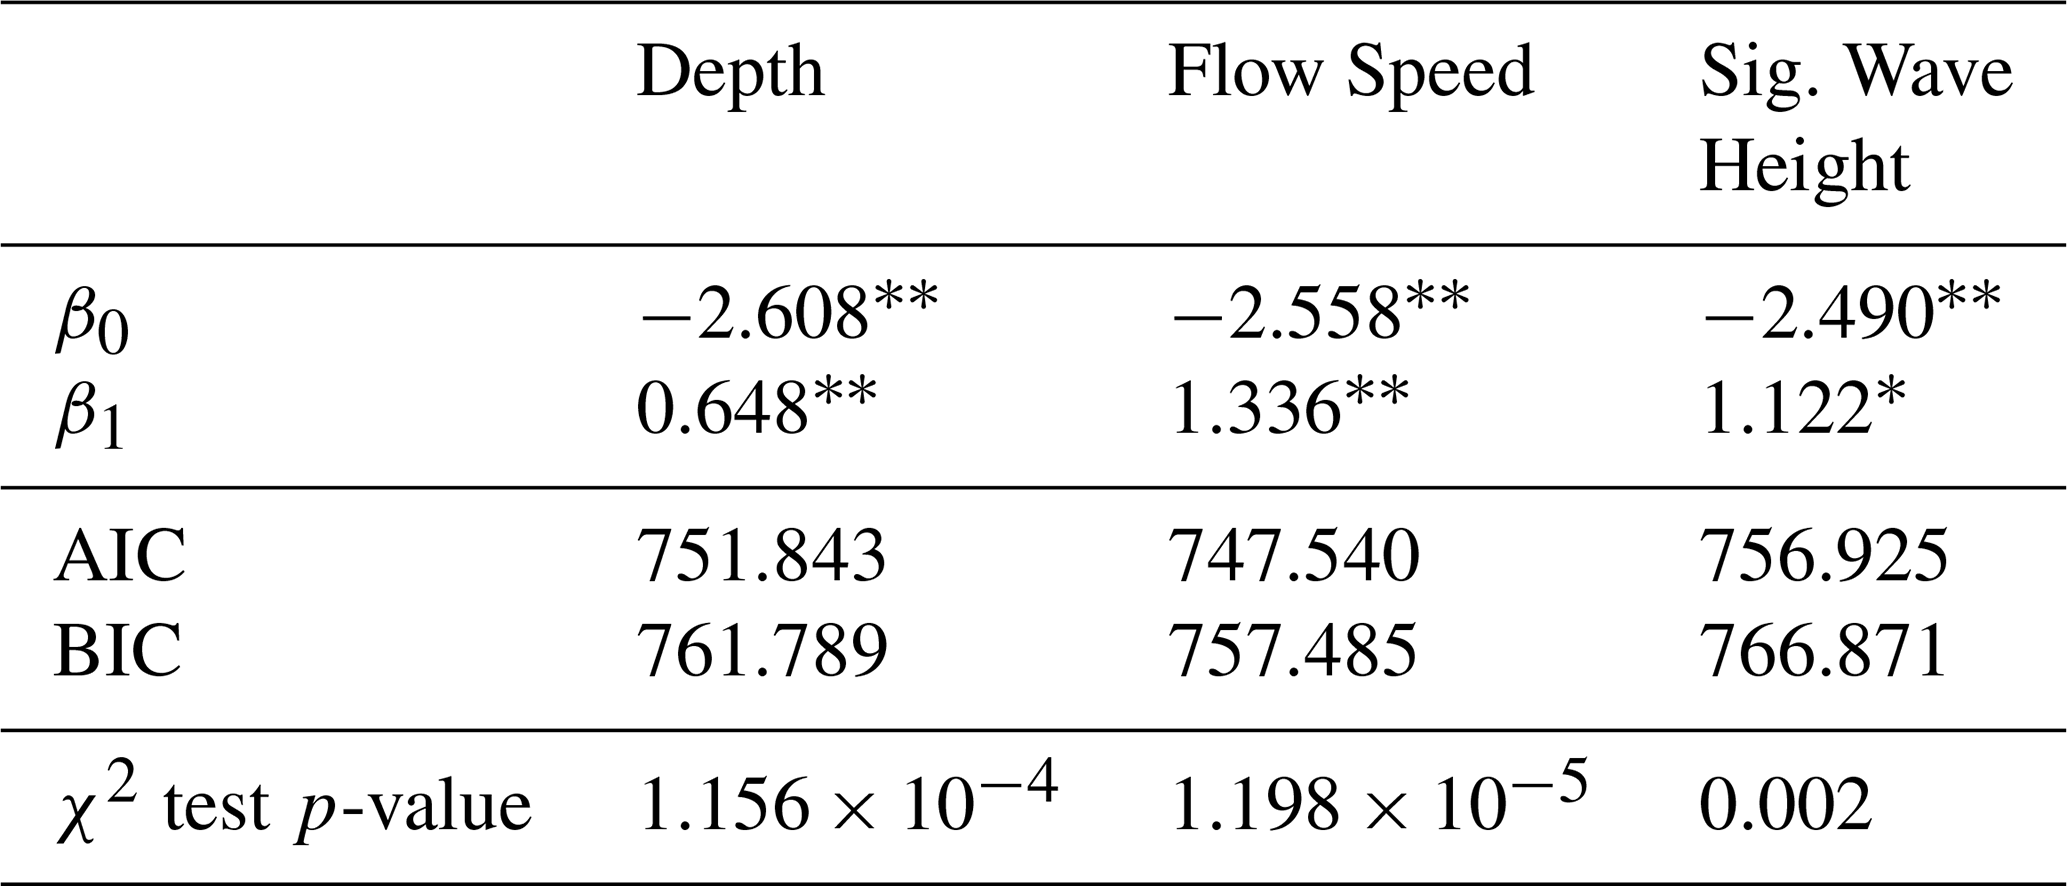
For individual coefficients: ∗ p-value < 0.05, p-value < 0.001.
3.2 Influence of building material on habitability
The exterior wall material listed for each building is the building material information available for locations in Monroe County. Collier County does not have any relevant building material information from the CoreLogic dataset used; therefore, only Monroe County locations are included in this section's analysis. The listed exterior wall materials are aggregated into three categories: “Concrete”, “Wood”, and “Other” (Fig. 5a). Habitability functions are then developed for the concrete and wood categories as functions of maximum water depth, flow speed, and significant wave height (Fig. 5b–g). Habitability functions are not generated for the other category since there is no similar defining feature within the group.
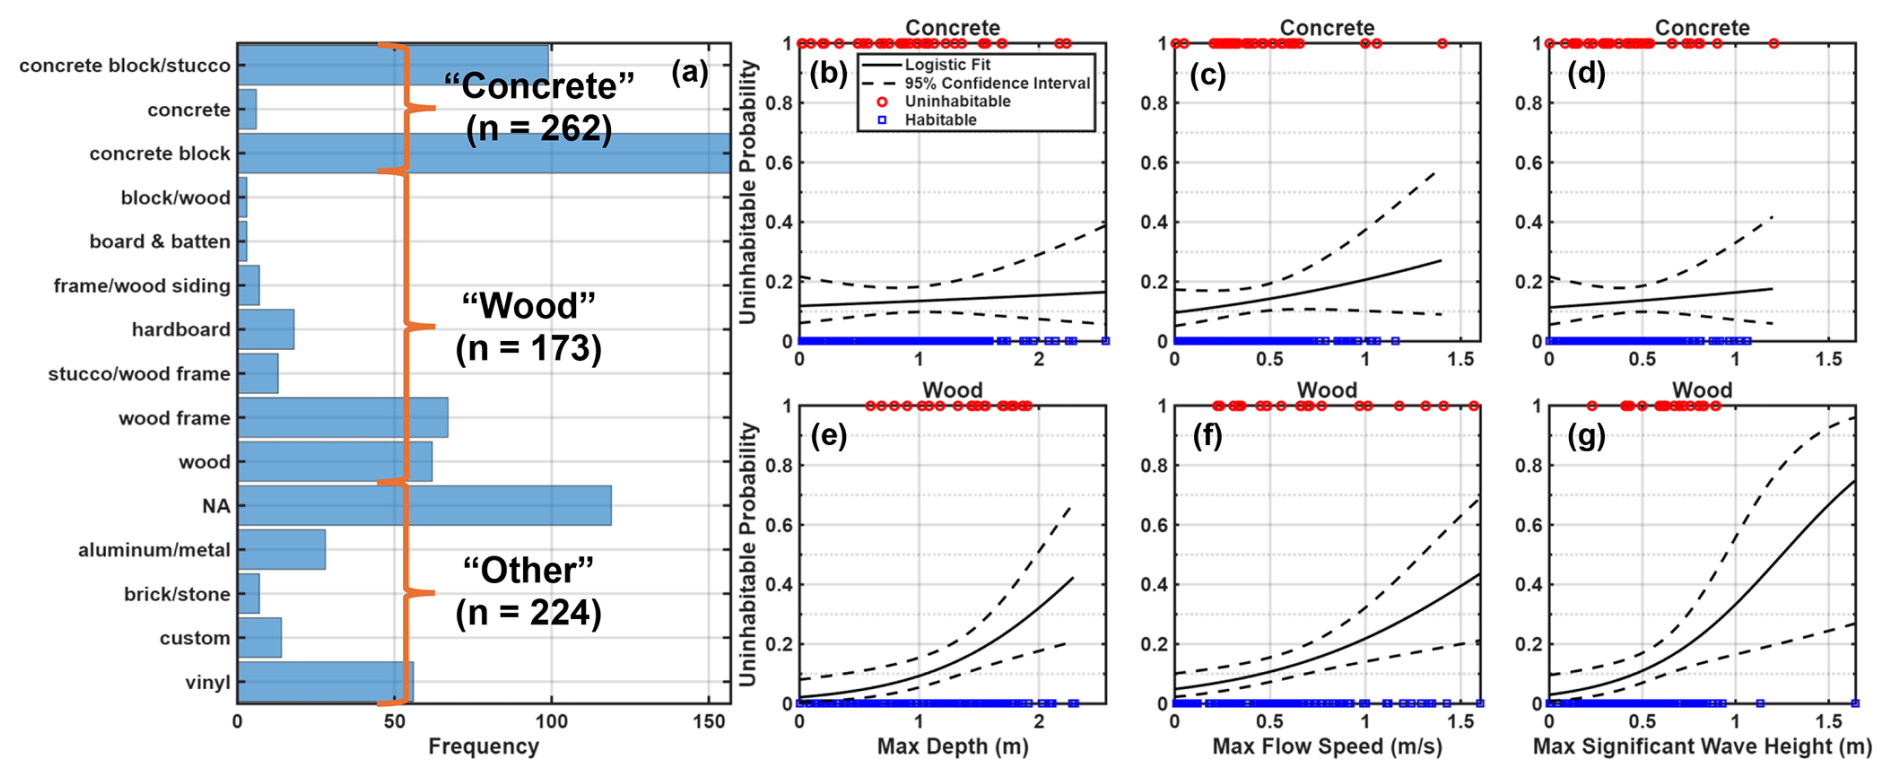
Figure 5Histogram of the exterior wall descriptions from CoreLogic for buildings analyzed in Monroe County and the three aggregated categories: concrete, wood, and other (a). Building habitability as a function of maximum depth, flow speed, and significant wave height for concrete (b–d) and wood (e–g).
Table 3Coefficients for different building materials for buildings in Monroe County.
For individual coefficients: ∗ p-value < 0.05, p-value < 0.001.
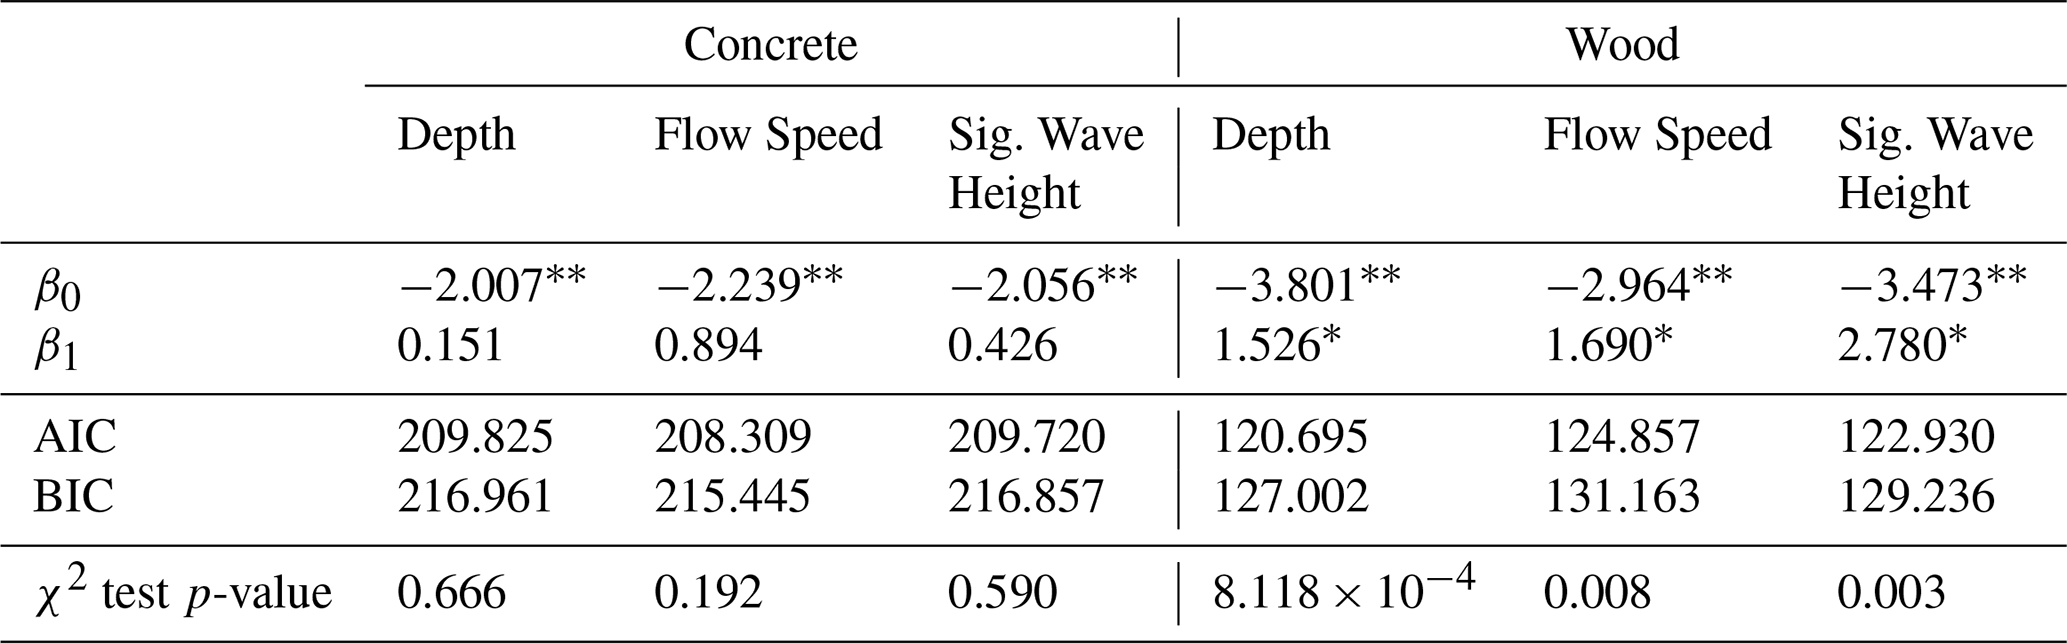
The only significant trends revealed from this analysis are for the habitability functions developed for the wood category (Table 3). The habitability functions developed for the concrete group are not significant at the 95 % confidence interval. This can be interpreted to mean that wooden buildings are less likely to be habitable after sustaining a relatively larger maximum depth, flow speed, or significant wave height, while the uninhabitable probability of concrete structures is not influenced by the level of hazard. For these wooden buildings, the depth-dependent habitability function has the greatest fit.
3.3 Habitability functions based on additional hydrodynamic parameters
Habitability functions are also developed using the maximum unit discharge (hv), flow momentum flux (ρhv2), total water depth (h+Hsig), wave energy flux (), and total force () as the hazard level (Figs. 6 and A3), where h is the water depth, v is the flow speed, ρ is the density of water (1000 kg m−3), Hsig is the significant wave height, and g is gravitational acceleration (9.81 m s−2). These additional hydrodynamic parameters have been shown to be significant drivers of flood damage in addition to the basic hazard parameters of depth, flow speed, and significant wave height (Diaz Loaiza et al., 2022; Xu et al., 2023), motivating the following analysis on their influence of building habitability.
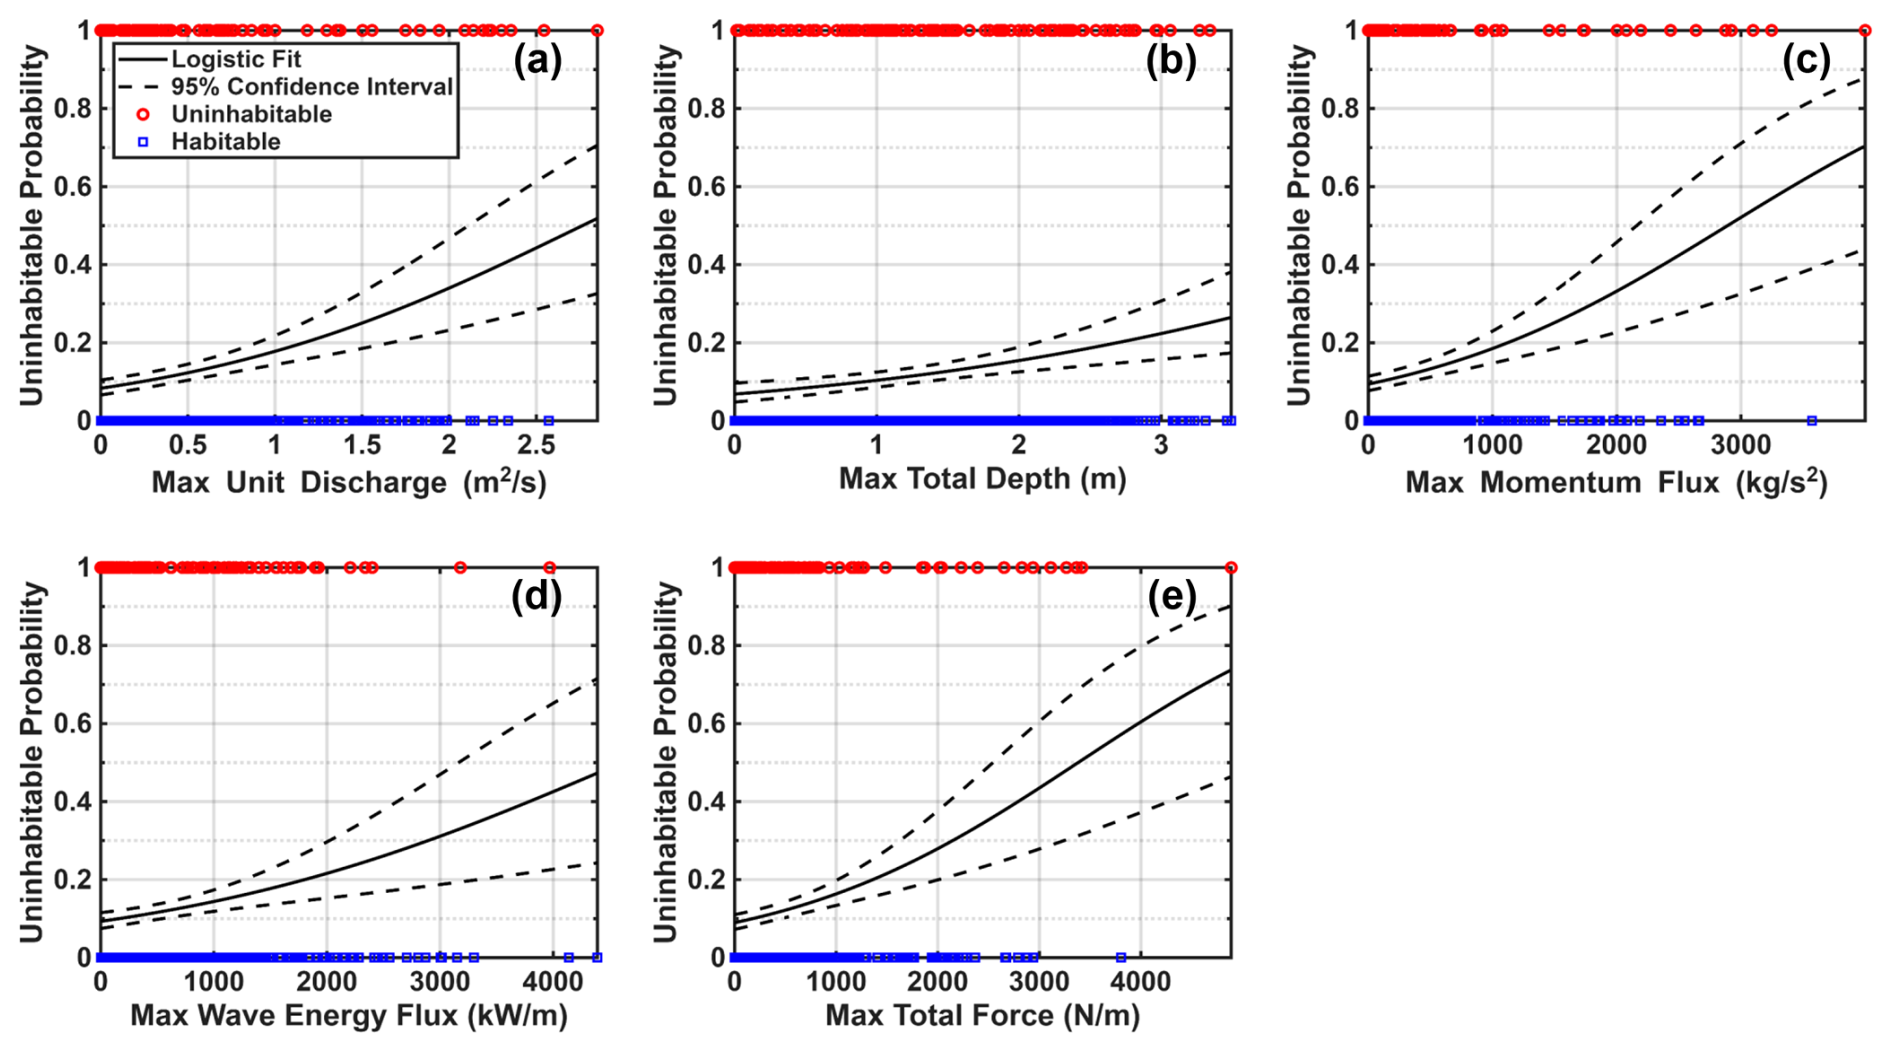
Figure 6Building habitability as a function of maximum unit discharge (a), total depth (b), flow momentum flux (c), wave energy flux (d), and total force (e) for buildings analyzed in Collier and Monroe Counties.
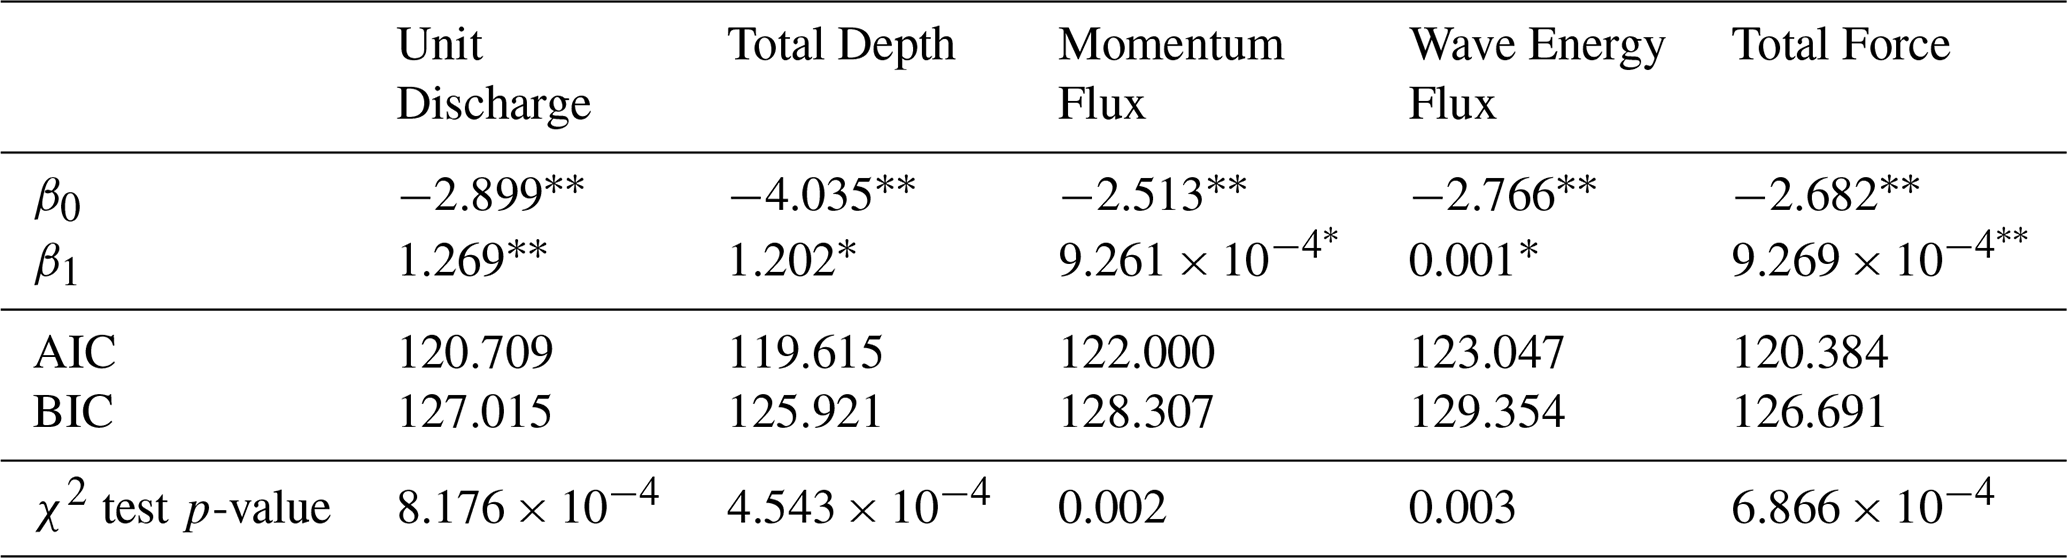
Table 4Coefficients for buildings in Monroe and Collier Counties as a function of maximum unit discharge, total depth, flow momentum flux, wave energy flux, and total force.
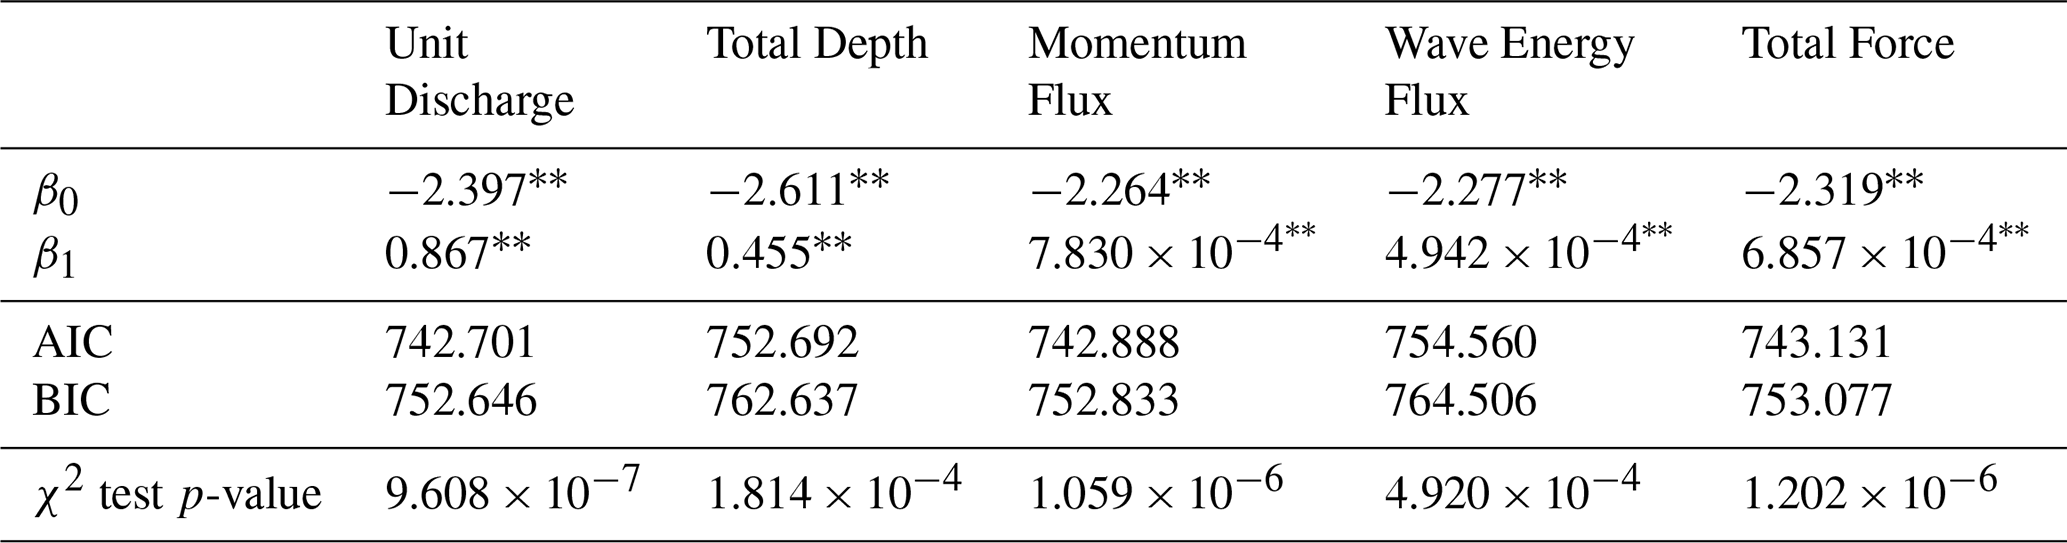
For individual coefficients: ∗ p-value < 0.05, p-value < 0.001.
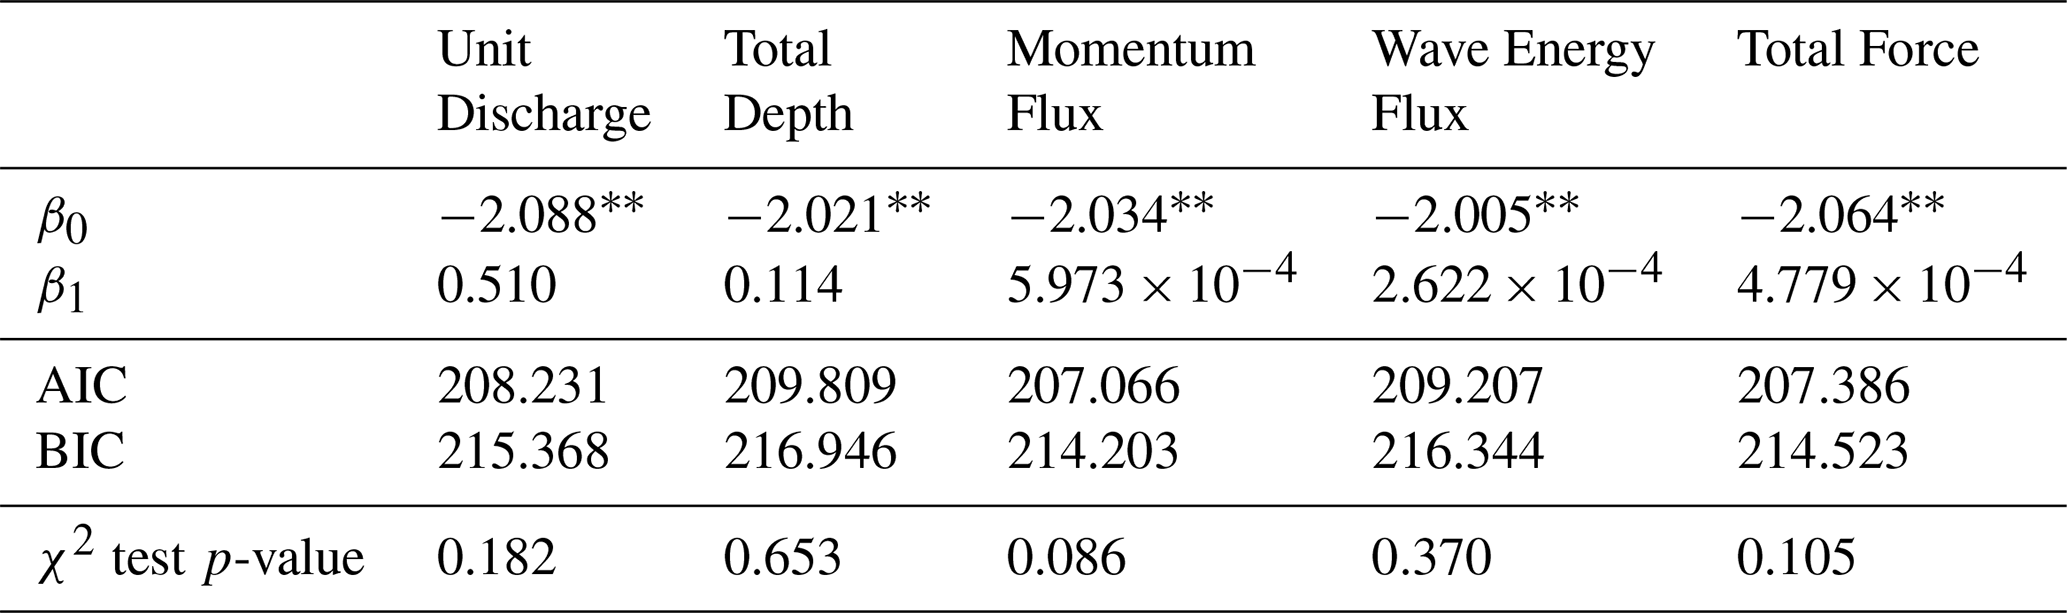
The additional habitability functions generated for maximum unit discharge, flow momentum flux, total water depth, wave energy flux, and total force all exhibit significant positive relationships with the probability of a building being uninhabitable (Table 4). Of these five parameters, the habitability function dependent on maximum wave energy flux has the worst fit with an AIC of 754.560 and BIC of 764.506. While the habitability function developed for maximum wave energy flux performs relatively poorly, the other functions developed based on the additional hydrodynamic parameters are comparable to those developed for depth and flow speed. Habitability functions based on unit discharge, momentum flux, and total force all exhibit better fits than the functions generated based on either depth or flow speed (Tables 2 and 4). The function dependent on total depth performs worse than the depth or flow speed habitability functions.
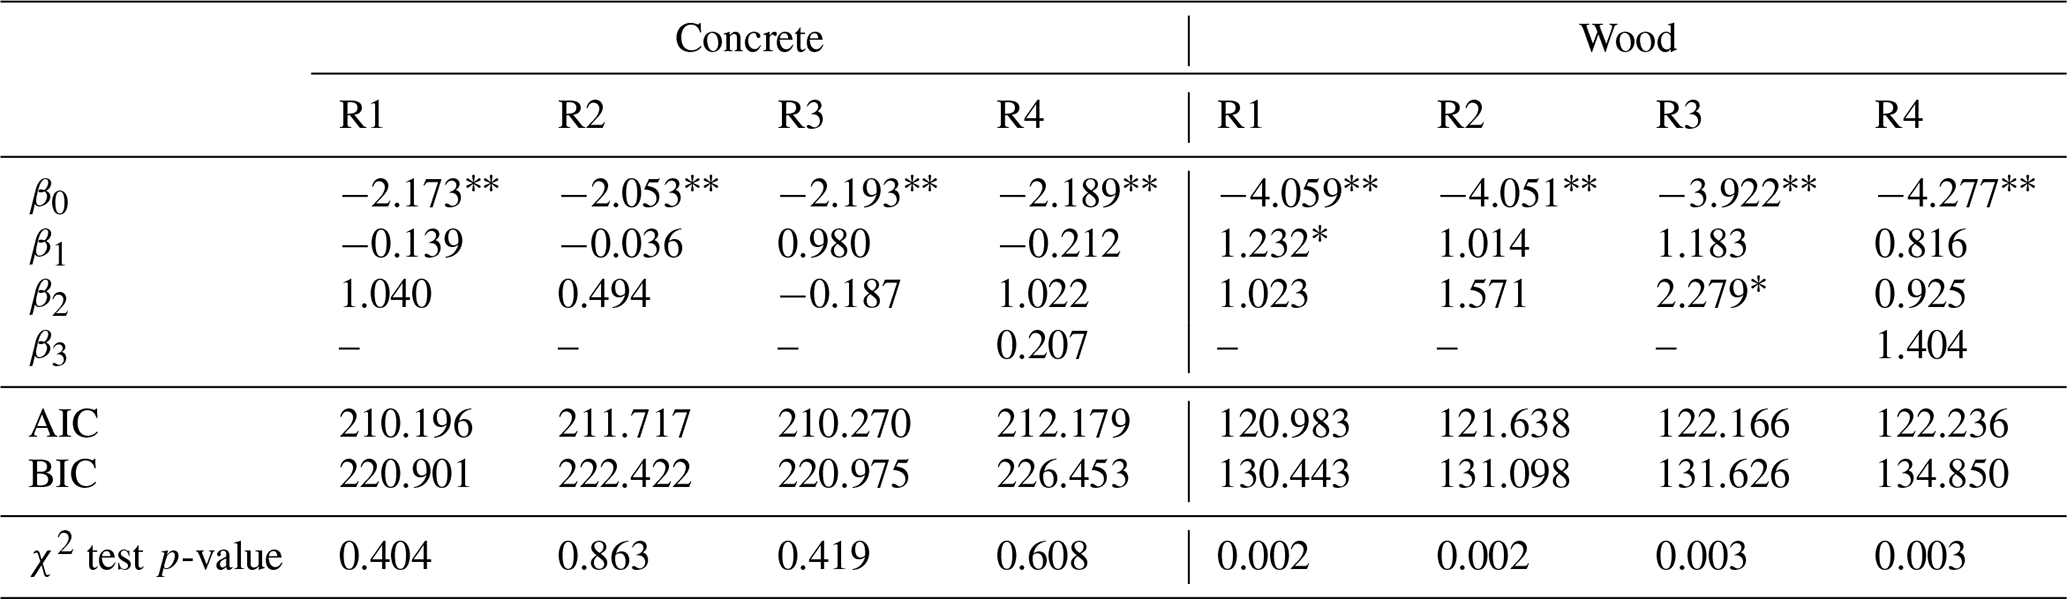
Habitability functions for these additional hydrodynamic parameters are also developed for the concrete and wood building material categories described in the previous section (Figs. B1–B4). None of these habitability functions for concrete buildings are significant at the 95 % confidence level (Table B1), but all those for wood buildings show significant positive relationships (Table B2). Furthermore, the wooden structure habitability function dependent on total depth (h+Hsig) has the greatest fit of all habitability functions developed for wooden buildings, including the one developed for just depth. Therefore, predicting habitability can be improved by incorporating information on both inundation depths and significant wave heights at wooden structures for the buildings analyzed.
3.4 Habitability functions derived from multivariable logistic regression
Rather than combining the three basic parameters of depth, flow speed, and significant wave height into additional hydrodynamic parameters to develop habitability functions as in the previous section, multivariable logistic regression can be used as an alternative to derive habitability functions. This expands Eq. (2) into the following:
where the i subscript indicates the ith parameter in the regression model. Including multiple independent variables has been shown to improve traditional depth-dependent fragility functions (Charvet et al., 2015; De Risi et al., 2017), making it an important consideration for the habitability functions developed in this study. Four multivariable logistic regression models are considered (R1–R4), and Table 5 lists the hydrodynamic parameters considered for each model. The three basic parameters of maximum depth (h), flow speed (v), and significant wave height (Hsig) are considered for these models. To check for multicollinearity in these models, the variance inflation factor (VIF) is computed. All VIF values for these models are between 1.7 and 3.4, which is generally accepted as an indicator that multicollinearity problems are small (Sheather, 2009).
Table 5Hydrodynamic parameters considered for each multivariable logistic regression model.
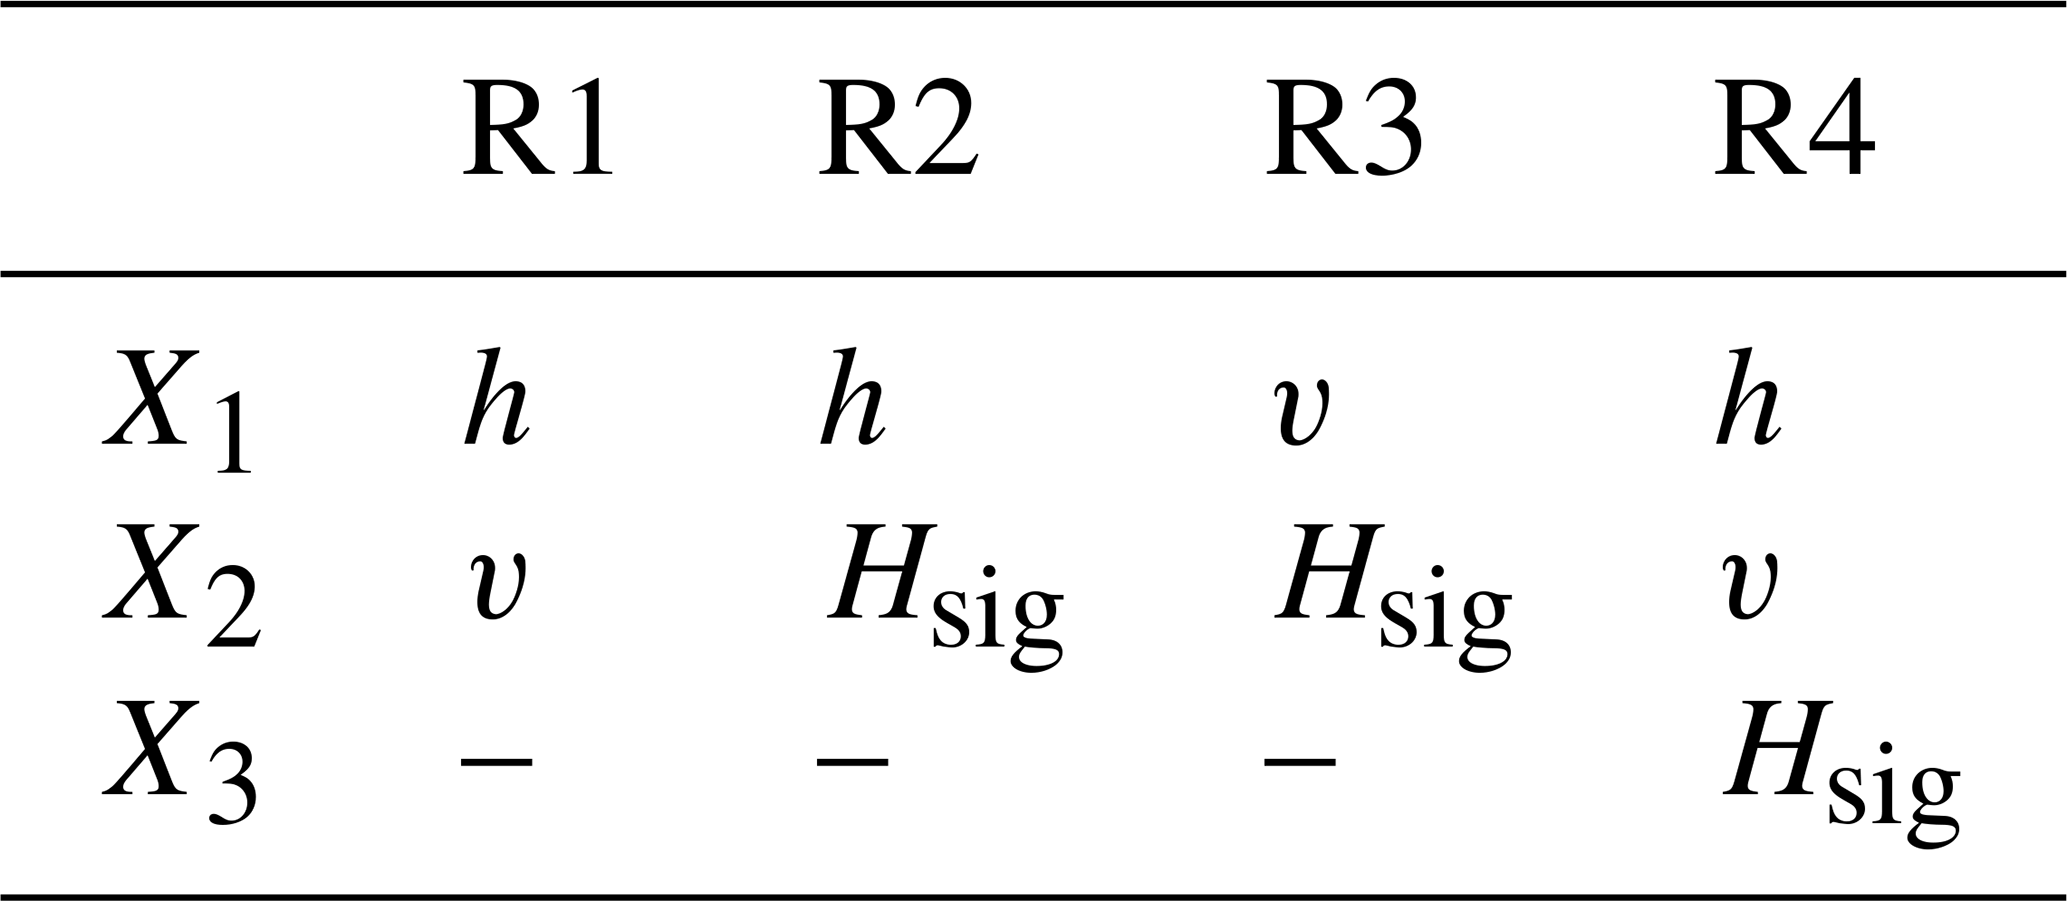
Table 6Coefficients for each multivariable logistic regression model for buildings in Monroe and Collier Counties.
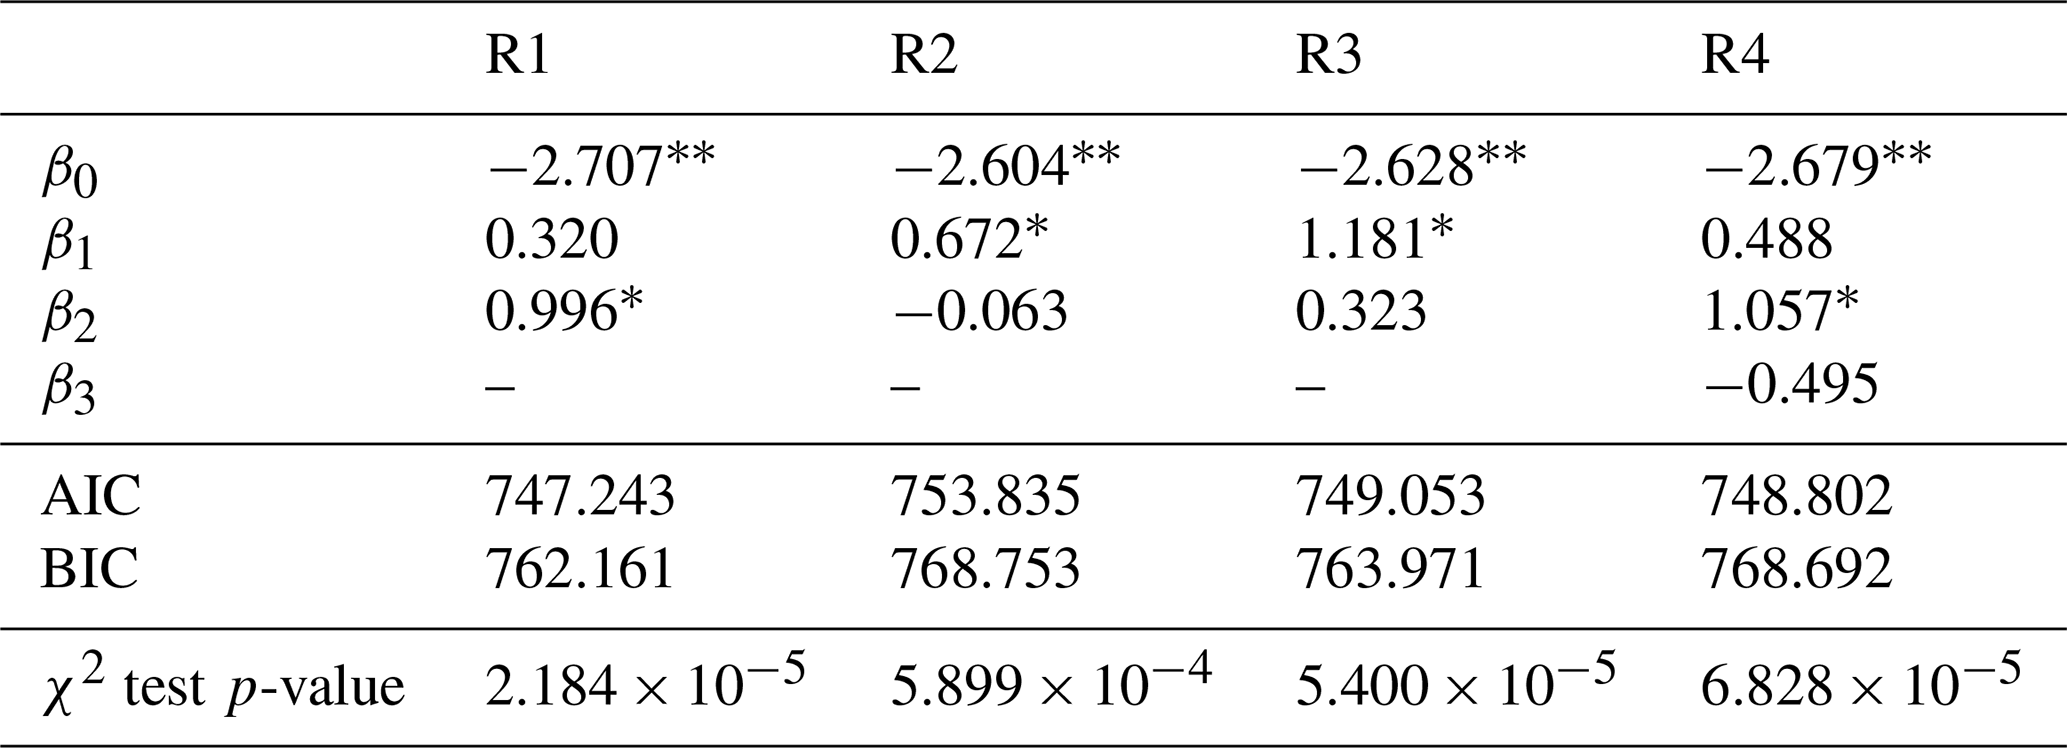
For individual coefficients: ∗ p-value < 0.05, p-value < 0.001.
Of the four multivariable models developed, R1 displays the best fit and R2 displays the worst fit (Table 6). While the AIC of R1 is slightly smaller than the AIC of the flow speed-dependent habitability function, the BIC shows a greater preference for the flow speed-dependent function over R1. Furthermore, a likelihood ratio test to statistically determine if R1 offers significant improvements over the nested flow speed-dependent habitability function is performed. This likelihood ratio test accepts the null hypothesis, the nested habitability function dependent on just flow speed, over the alternative of R1 (p-value = 0.130). Therefore, it can be concluded that the habitability function developed depending solely on maximum flow speed is a better predictor of habitability than any of the multivariable models.
Habitability functions based on the four multivariable models are also developed for the buildings in the concrete and wood categories (Table B3). However, none of the functions for concrete or wood structures based on these four models offer any serious improvement over those developed with the univariable models presented in Table 3.
Overall, many of the habitability functions developed show that hydrodynamic hazard level significantly increases the probability of a building being uninhabitable following Hurricane Irma. This holds true for the first functions developed based on the three basic hazards of maximum flood depth, flow speed, and significant wave height, where the flow speed-dependent habitability function shows the best fit (Fig. 4 and Table 2). In an effort to improve upon these habitability functions dependent on the three basic hazards, two methods for combining the basic hazard levels are explored. The first method creates new habitability functions based on five additional hydrodynamic parameters used previously to generate damage functions (Diaz Loaiza et al., 2022; Xu et al., 2023): maximum unit discharge, flow momentum flux, total water depth, wave energy flux, and total force. Not only does the probability of uninhabitability exhibit a significant positive dependency on these additional hydrodynamic parameters, but the habitability functions dependent on unit discharge, flow momentum flux, and total force offer greater fits than the flow speed-dependent function (Tables 2 and 4). Specifically, the unit discharge-dependent habitability function shows the greatest performance for predicting building habitability of the univariable models. The second method aimed at improving the developed habitability functions expands the univariable regression to multivariable regression based on depth, flow speed, and significant wave height. The multivariable model R1 (depth and flow speed) performs best of the multivariable models and shows a slightly improved AIC value to the solely flow speed-dependent function. This potentially aligns with previous studies that have shown including multivariable models improves fragility functions based on a single variable (Charvet et al., 2015; De Risi et al., 2017). However, comparison of the BIC values shows a clearer preference for the univariable flow speed-dependent function. This questions whether including maximum depth with flow speed in a multivariable model actually improves the ability to estimate building habitability. Results from the likelihood ratio test agree with those from comparing BIC values, suggesting the flow speed-dependent function is superior to the multivariable models. This leads back to the function dependent on unit discharge as being the best habitability function developed in this study.
This study also revealed significant differences in how varying hazard levels impact habitability probability for wooden and concrete buildings. None of the habitability functions developed for concrete buildings exhibit significant relationships between hazard level and uninhabitable probability. This indicates that other factors besides hydrodynamic hazards strongly influenced whether people returned to concrete structures after Irma. Conversely, the habitability functions developed for wooden structures display significant positive relationships between hazard level and uninhabitable probability, showing that hydrodynamic hazards strongly influenced if a wooden building became uninhabitable due to Hurricane Irma. These differences between wooden and concrete structures are understandable since flood hazards typically result in greater damage to wooden buildings than concrete ones (Charvet et al., 2015; De Risi et al., 2017; Suppasri et al., 2013).
While the habitability functions developed generally show the expected dependency of hazard level on building uninhabitable probability, there is still a good degree of uncertainty in estimating which buildings people return to. This is evident when visually inspecting the habitability functions, where some buildings are habitable at relatively high hazard levels and uninhabitable at lower hazard levels (Figs. 4–6). This shows a major difference between traditional damage and fragility functions and these new habitability functions, where many socioeconomic factors can also influence if and when people return to a building after a flood event. For example, someone may not return to a completely undamaged building if they are able to stay with friends or family for an elongated period, and for others, returning to a highly damaged building may be the best option, which may bias these functions against people with fewer recovery options. While previous studies have looked at some of these factors influencing post-flood building habitability (Nofal et al., 2024; Paprotny et al., 2021; Paul et al., 2024; Yabe et al., 2020), this is the first study, to our knowledge, that directly quantifies how flood hazards influence habitability.
Besides uncertainties associated with socioeconomic factors, there are other assumptions and uncertainties in this study that could be addressed in the future. Firstly, the confidence intervals of the developed habitability functions typically widen at larger hazard levels due to a smaller number of buildings experiencing these large hazard levels, which could be improved by including areas that experienced greater flood impacts in future studies. Uncertainty in the developed Hurricane Irma model is highly influenced by grid and DEM resolution, and higher resolutions are known to improve the flood model accuracy (Diaz Loaiza et al., 2022; Luppichini et al., 2019; Muñoz et al., 2024). The spatially varying Manning's roughness coefficients and parameterization of Hurricane Irma's wind and pressure fields also introduce uncertainties in the flood model that influence the developed habitability functions (Asher and Luettich, 2025). Aside from the flood model, the LBS data used to determine buildings that were uninhabitable due to Hurricane Irma bring their own uncertainties. For example, spatial inaccuracies of the LBS data could lead to misidentification of the associated building. Additional uncertainties could arise if the LBS data used is not representative of the study areas and populations (Swanson and Guikema, 2024). Another important assumption for our definition of building habitability is that essential services such as power and schools are recovered 18 d after Irma's landfall in Florida. While this assumption is appropriate for Irma (Hodge and Lee, 2017; Mitsova et al., 2018; Swanson and Guikema, 2024), flood events that cause longer recovery periods for essential services may create difficulties in estimating building habitability the same way. Finally, these habitability functions could be improved if additional building information such as the number of stories or whether a building is elevated was available.
This study utilizes a Hurricane Irma flood model and LBS data to develop habitability functions for buildings in two Florida counties. First, we show that of the habitability functions dependent on maximum depth, flow speed, or significant wave height, the flow speed-dependent function performs the best. Five additional hydrodynamic parameters are also investigated to see if improvements can be made to the flow speed-dependent habitability function, and we find that the habitability function dependent on maximum unit discharge offers the greatest improvement. Then multivariable regression is employed, showing potential improvements to the univariable flow speed function with model R1 (depth and flow speed). However, additional analysis indicates these multivariable models do not offer significant improvements to the univariable flow speed-dependent function. Furthermore, buildings are grouped by material to evaluate how habitability functions compare for wooden and concrete structures, showing that the uninhabitable probability of concrete buildings is not influenced by hazard level while wooden buildings' uninhabitable probability increase with hazard level. These findings provide novel quantifications of the influence of flood hazards on whether a building becomes uninhabitable due to a flood event. This can be used in applications like Hazus, which currently assumes buildings become uninhabitable for any nonzero flood depth (FEMA, 2024b).
Future work could be done to incorporate socioeconomic factors into these habitability functions to increase the accuracy of estimating which buildings become uninhabitable during Irma due to flooding. Developing habitability curves for different regions and flood events is another area of future research that should be explored. Given this study focuses on two Florida counties, it would be insightful to investigate other regions both inside and outside the United States. Differences in building codes, zoning laws, and other policies may significantly change how flood hazards influence building habitability, which could be compared against the habitability functions developed here for Collier and Monroe Counties.
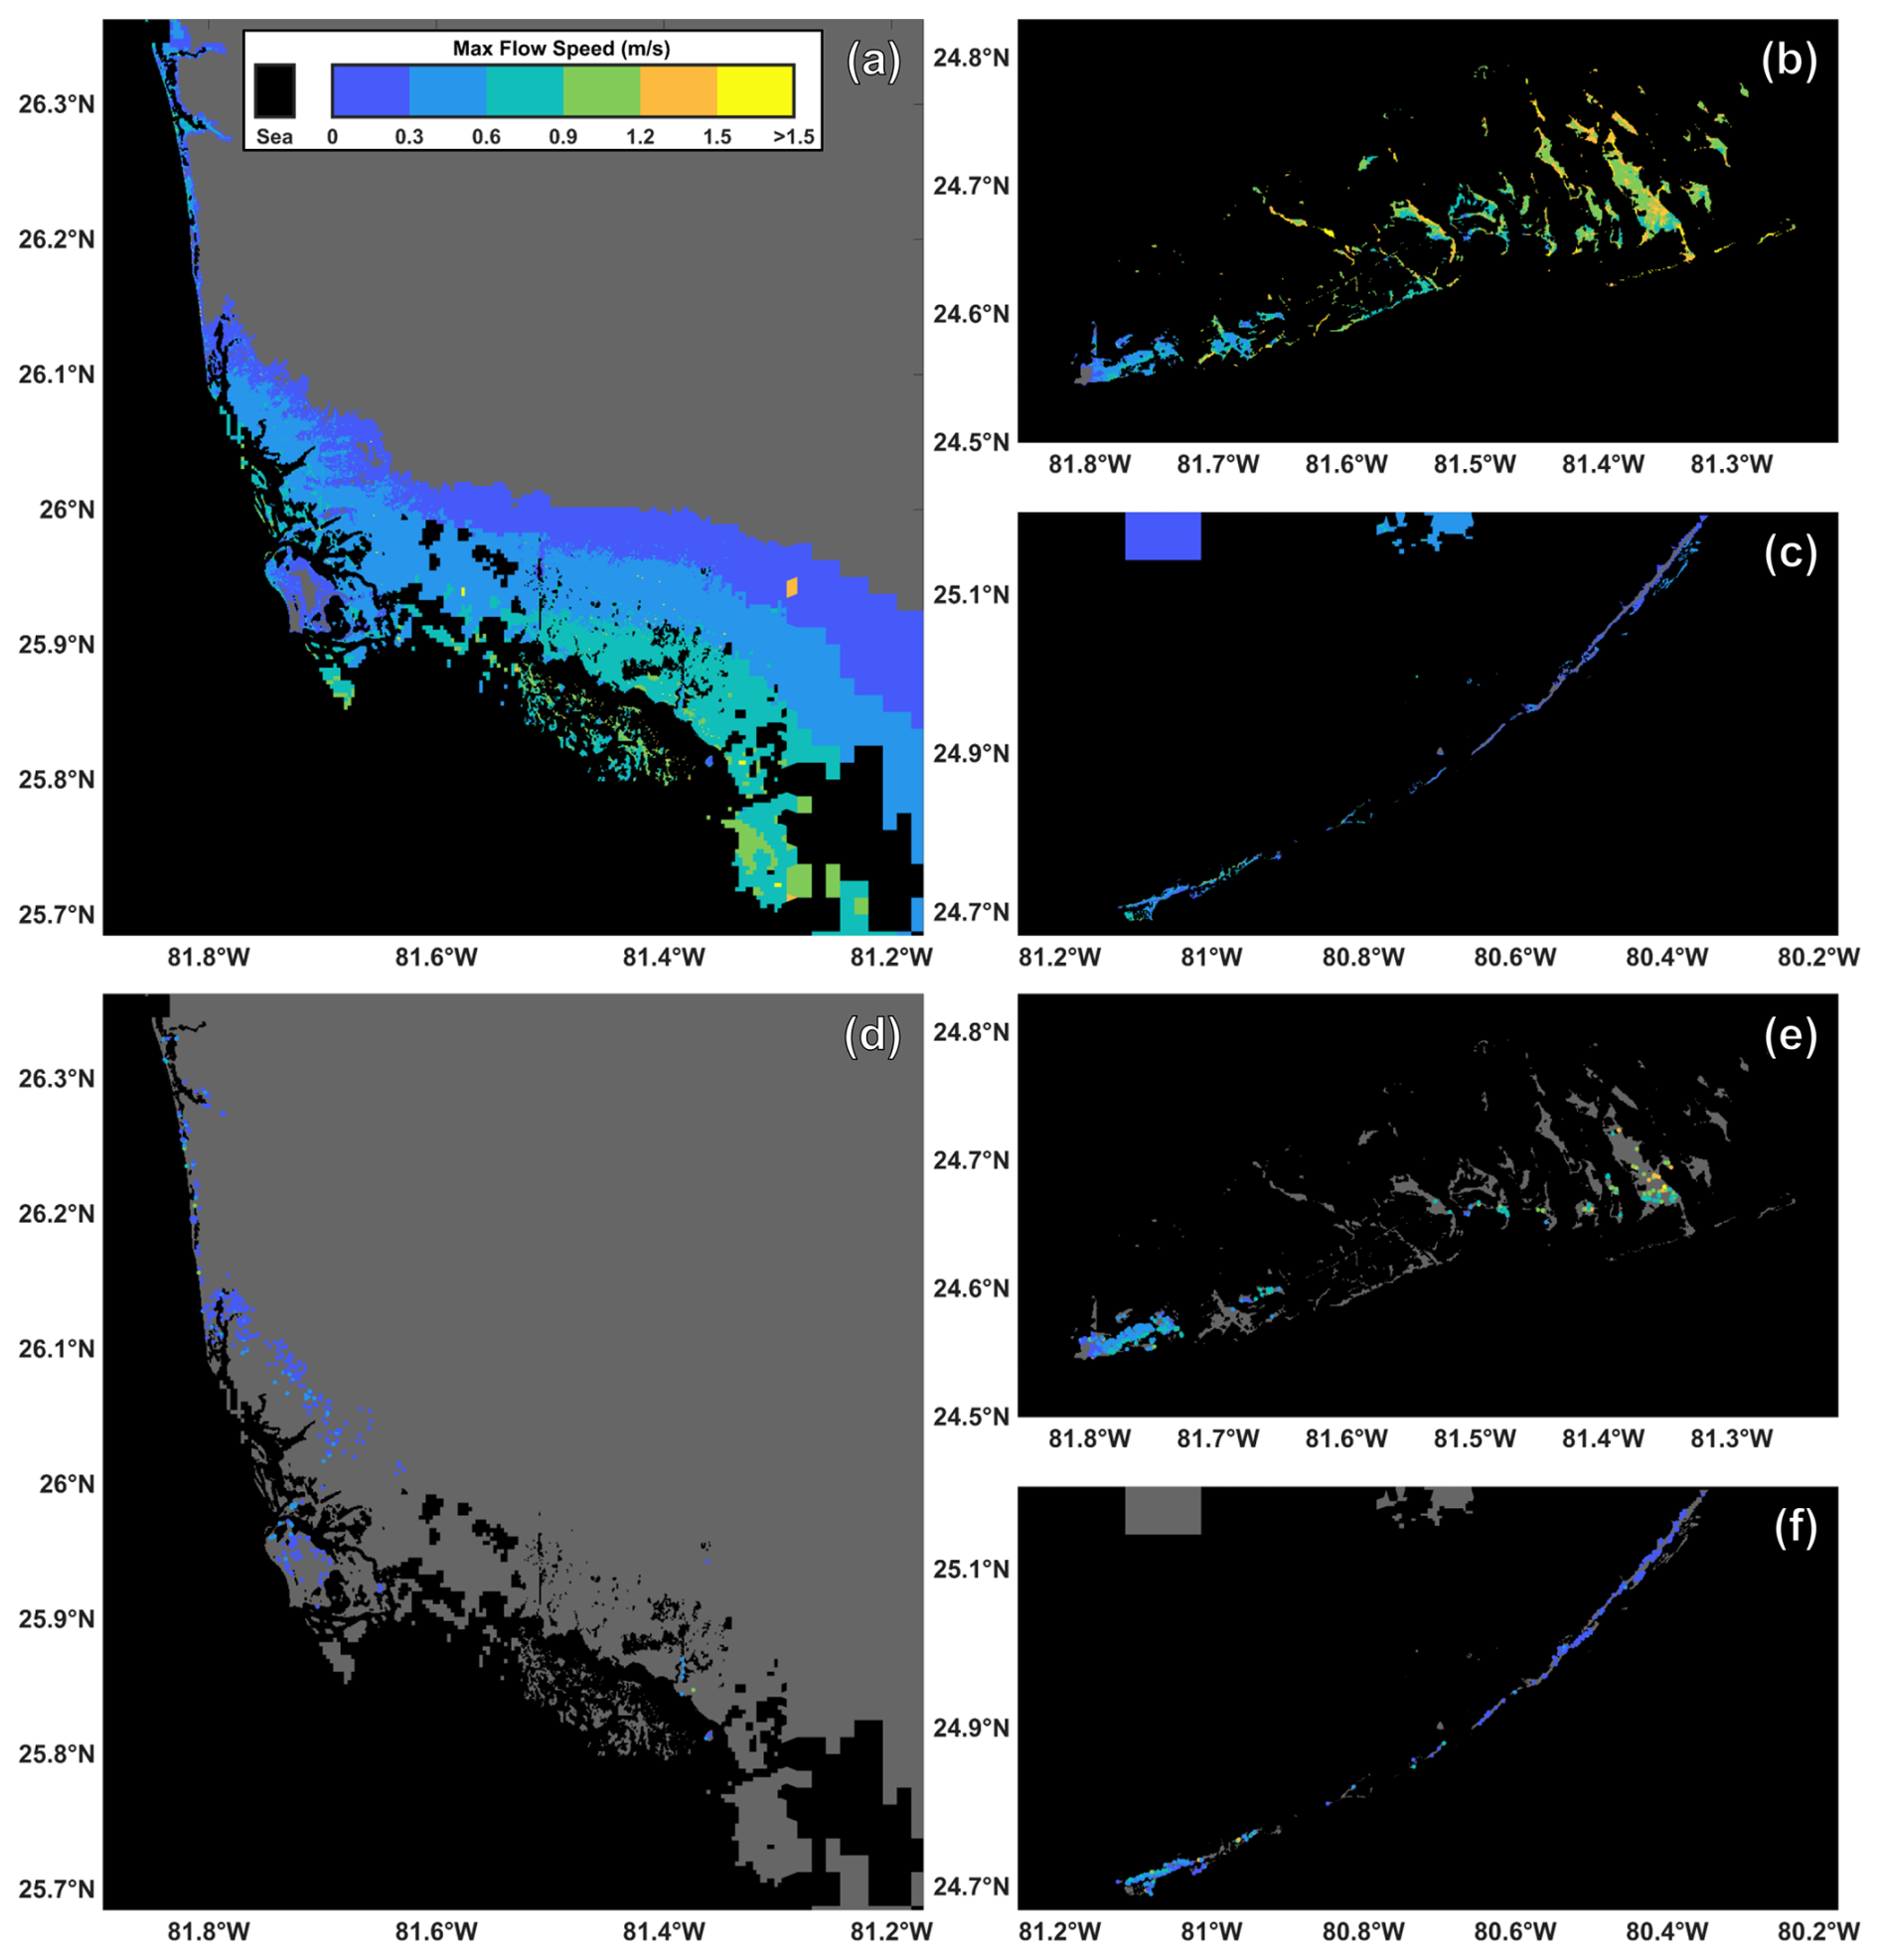
Figure A1Maximum modeled flow speeds for Collier County (a) and the western (b) and eastern (c) regions of Monroe County. Building locations and associated maximum flow speeds used for habitability functions (d–f). To preserve privacy the exact building locations are not identified.
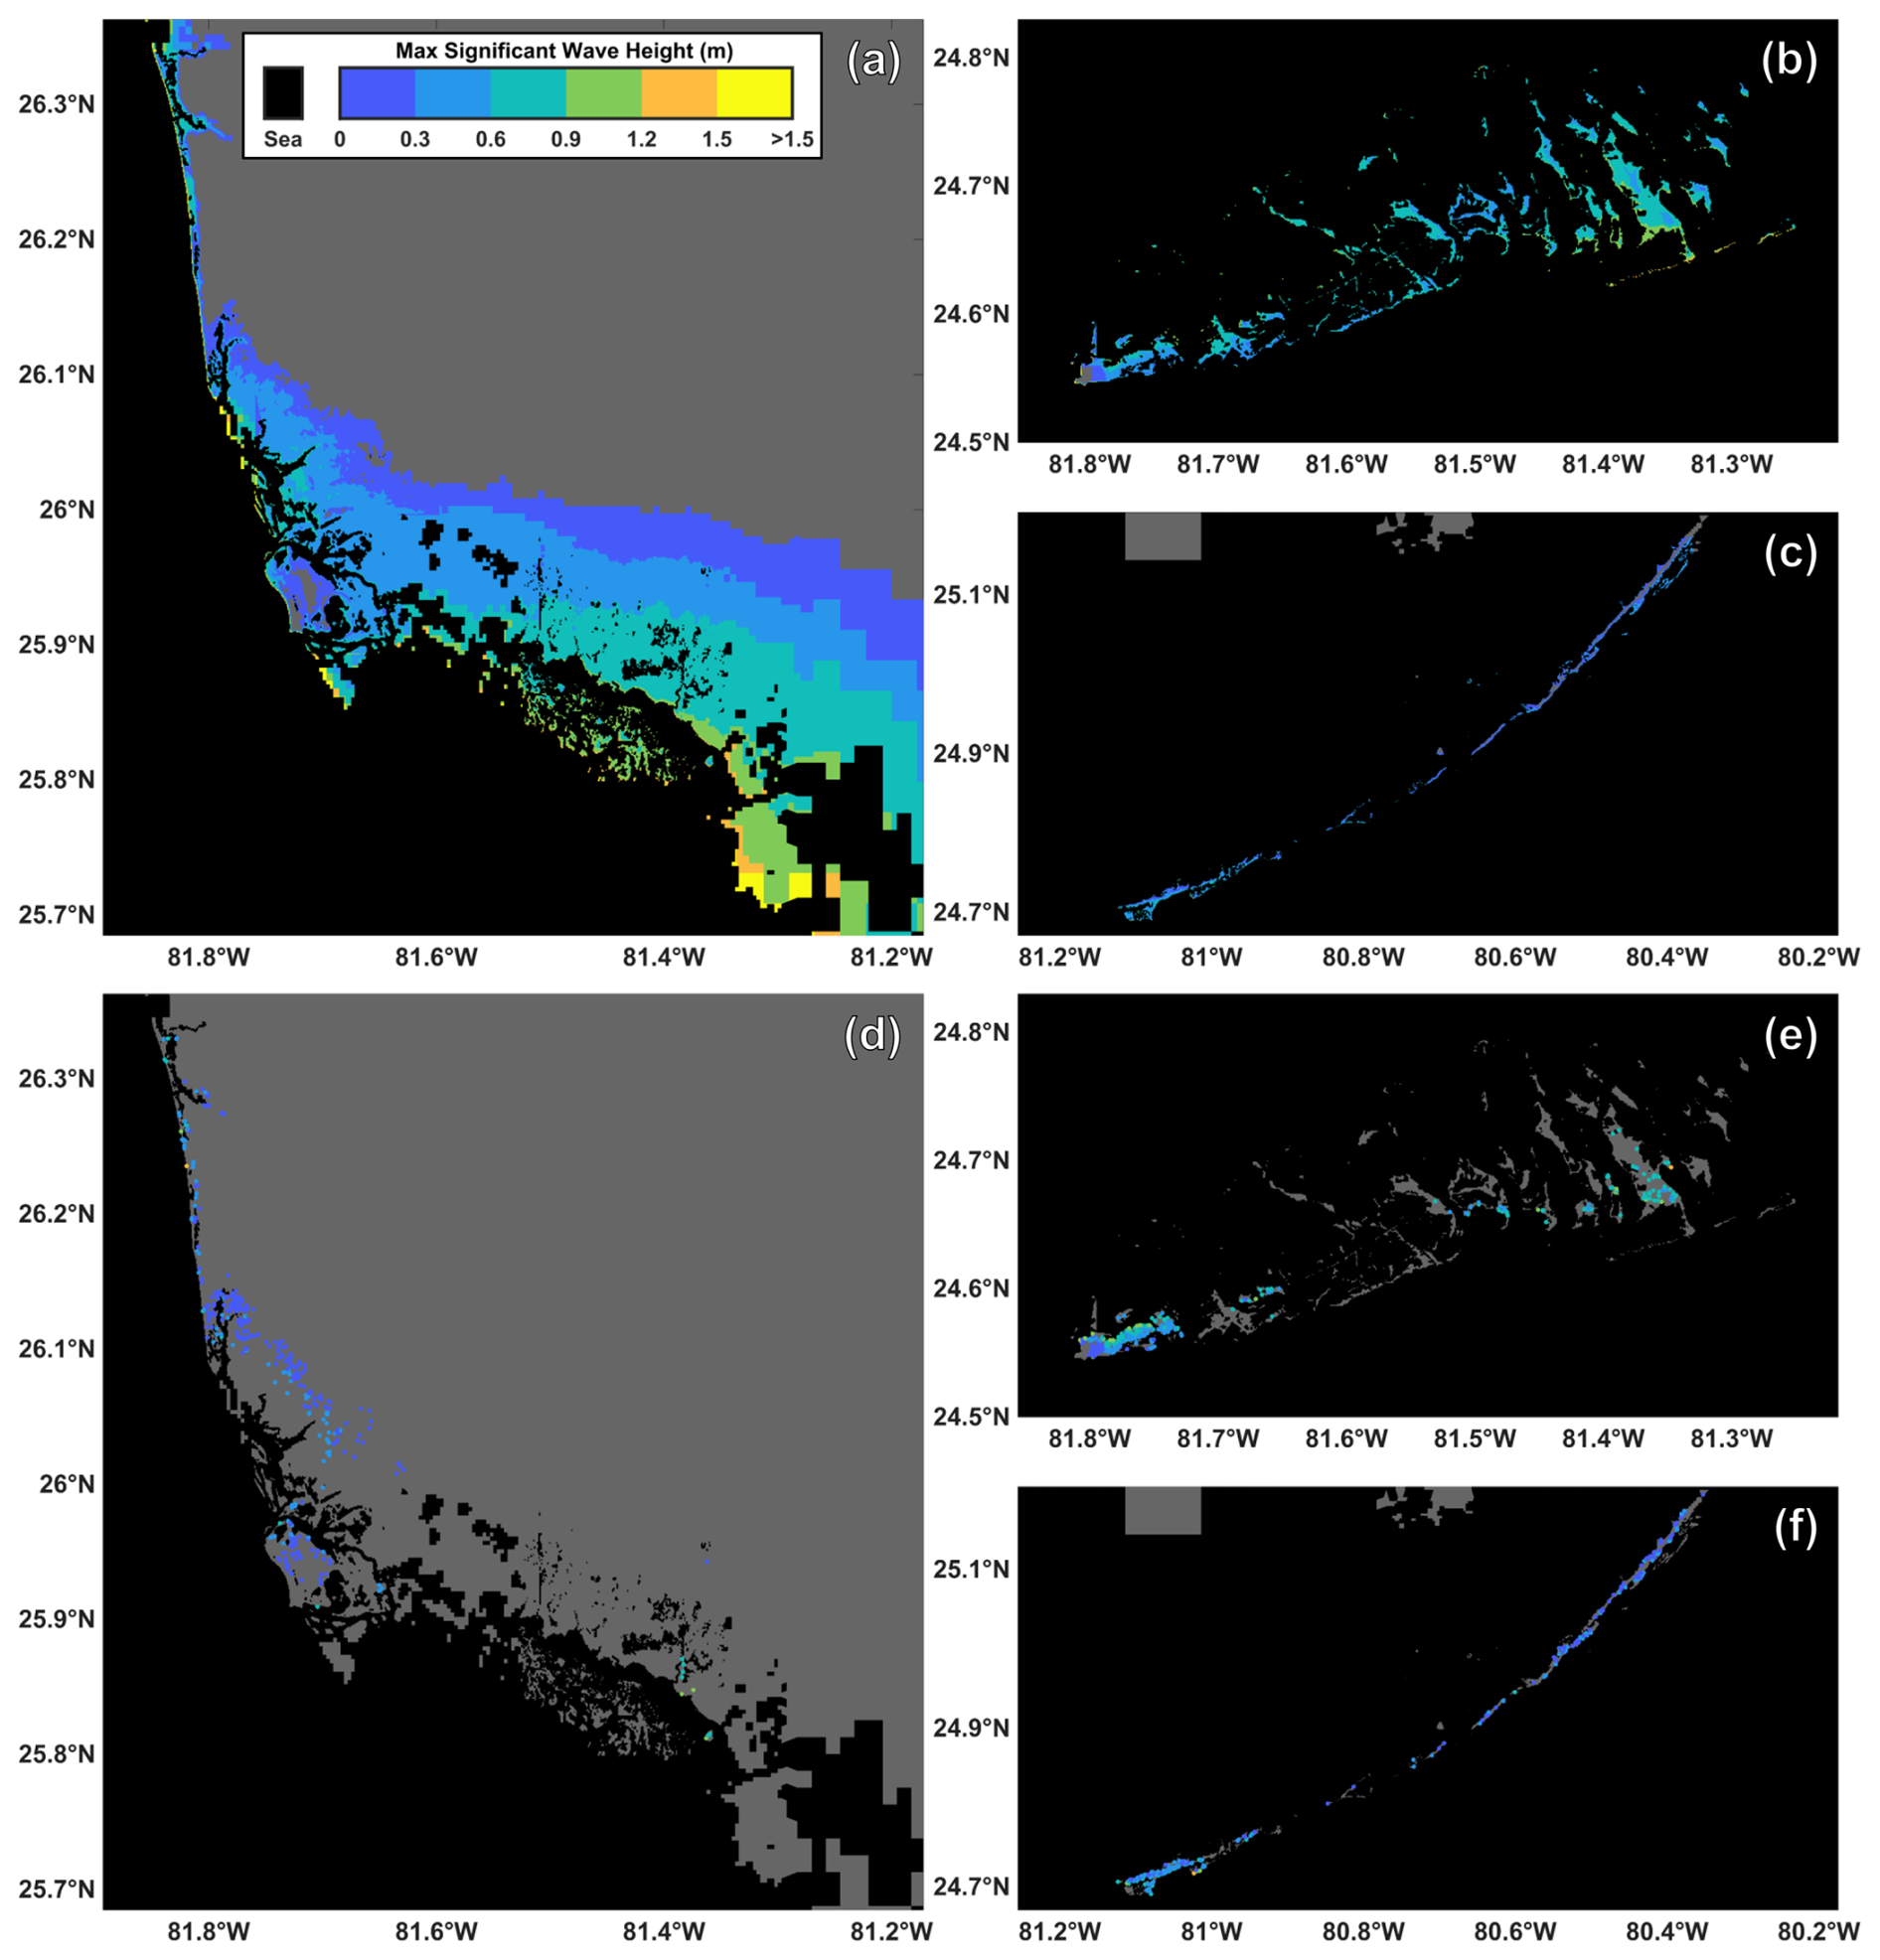
Figure A2Maximum modeled significant wave heights for Collier County (a) and the western (b) and eastern (c) regions of Monroe County. Building locations and associated maximum significant wave heights used for habitability functions (d–f). To preserve privacy the exact building locations are not identified.
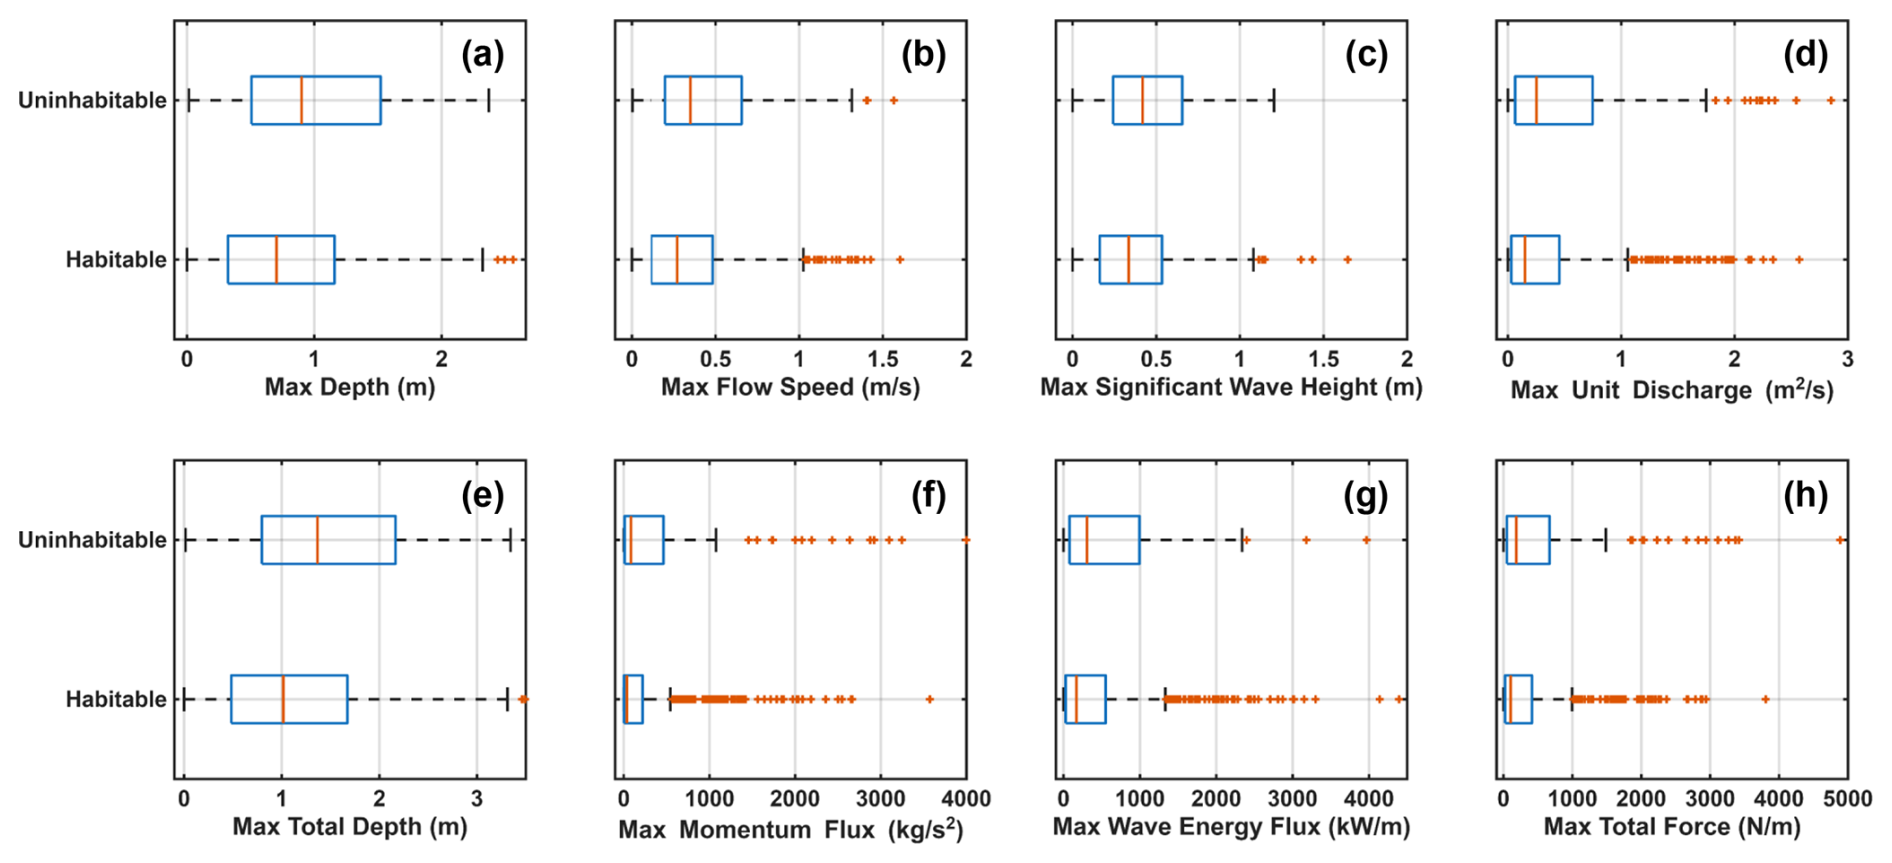
Figure A3Box plots of the maximum depth (a), flow speed (b), significant wave height (c), unit discharge (d), total depth (e), flow momentum flux (f), wave energy flux (g), and total force (h) used to develop habitability functions for Collier and Monroe Counties.
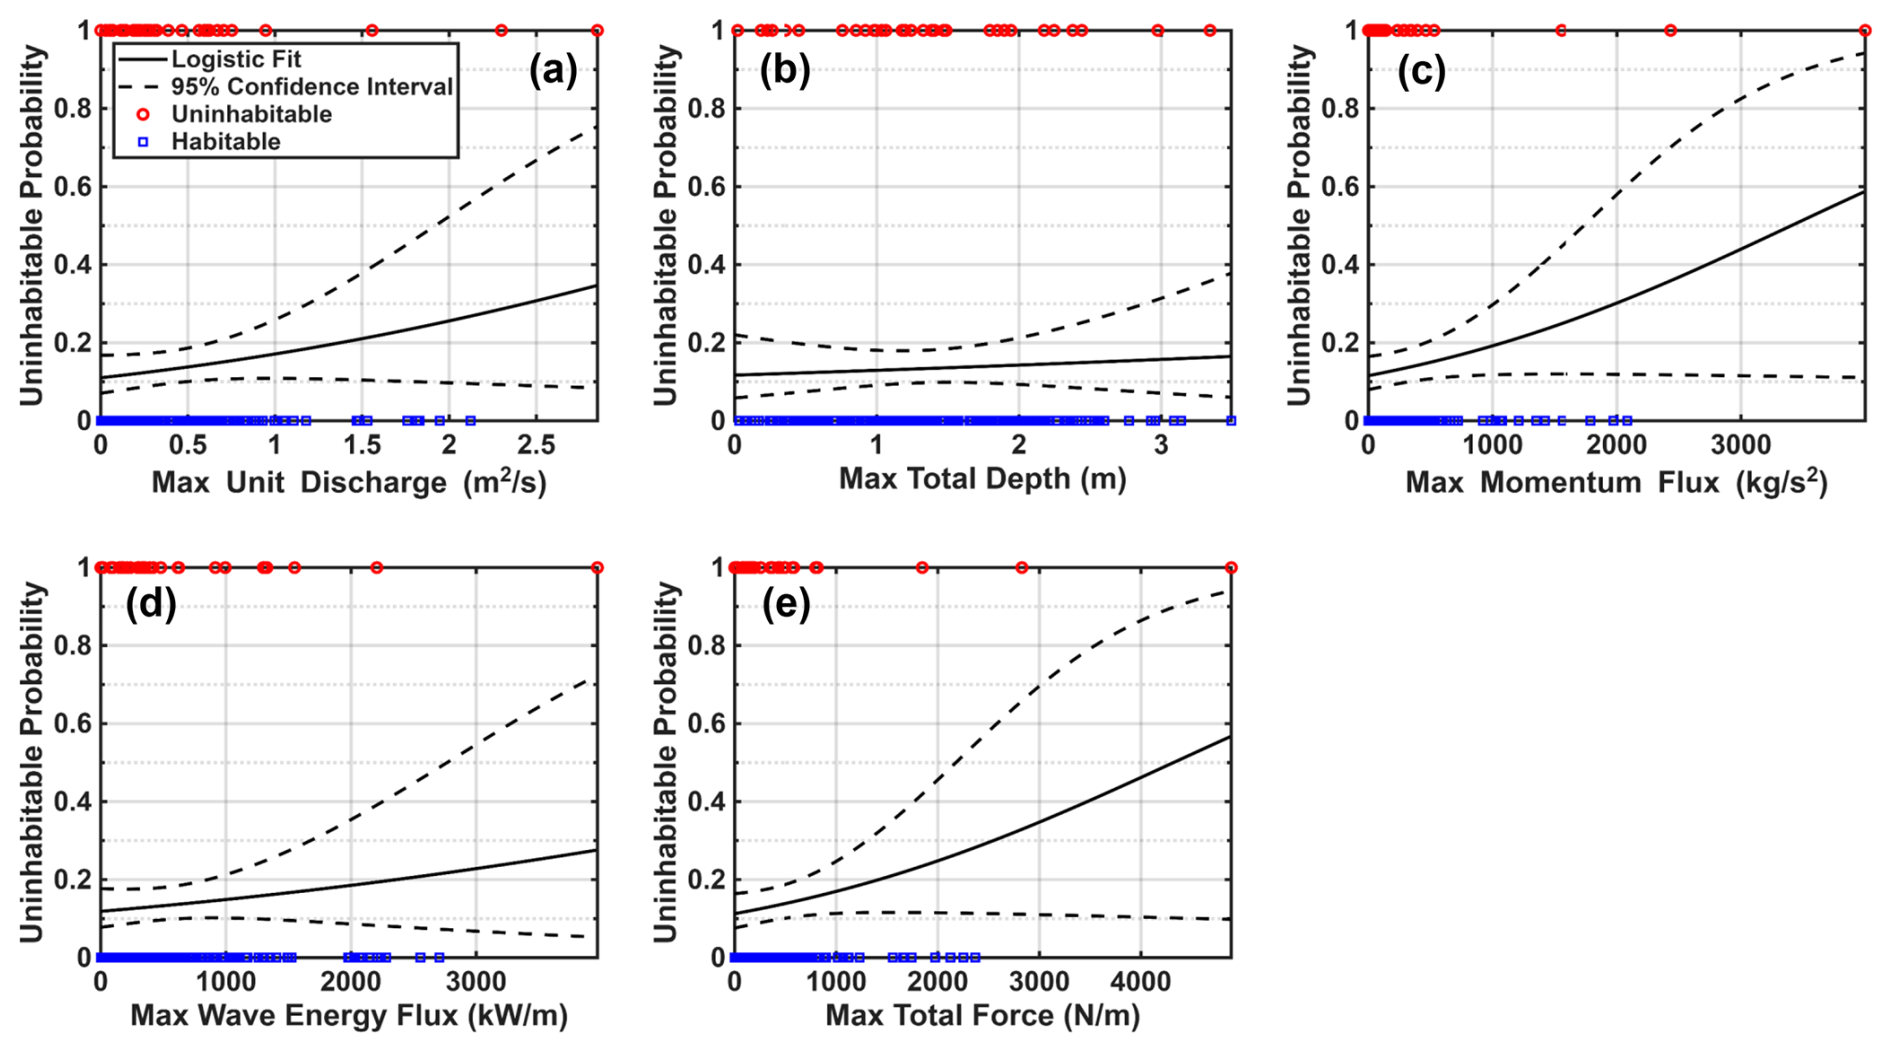
Figure B1Building habitability for buildings in Monroe County as a function of maximum unit discharge (a), total depth (b), flow momentum flux (c), wave energy flux (d), and total force (e) for buildings in the concrete category.
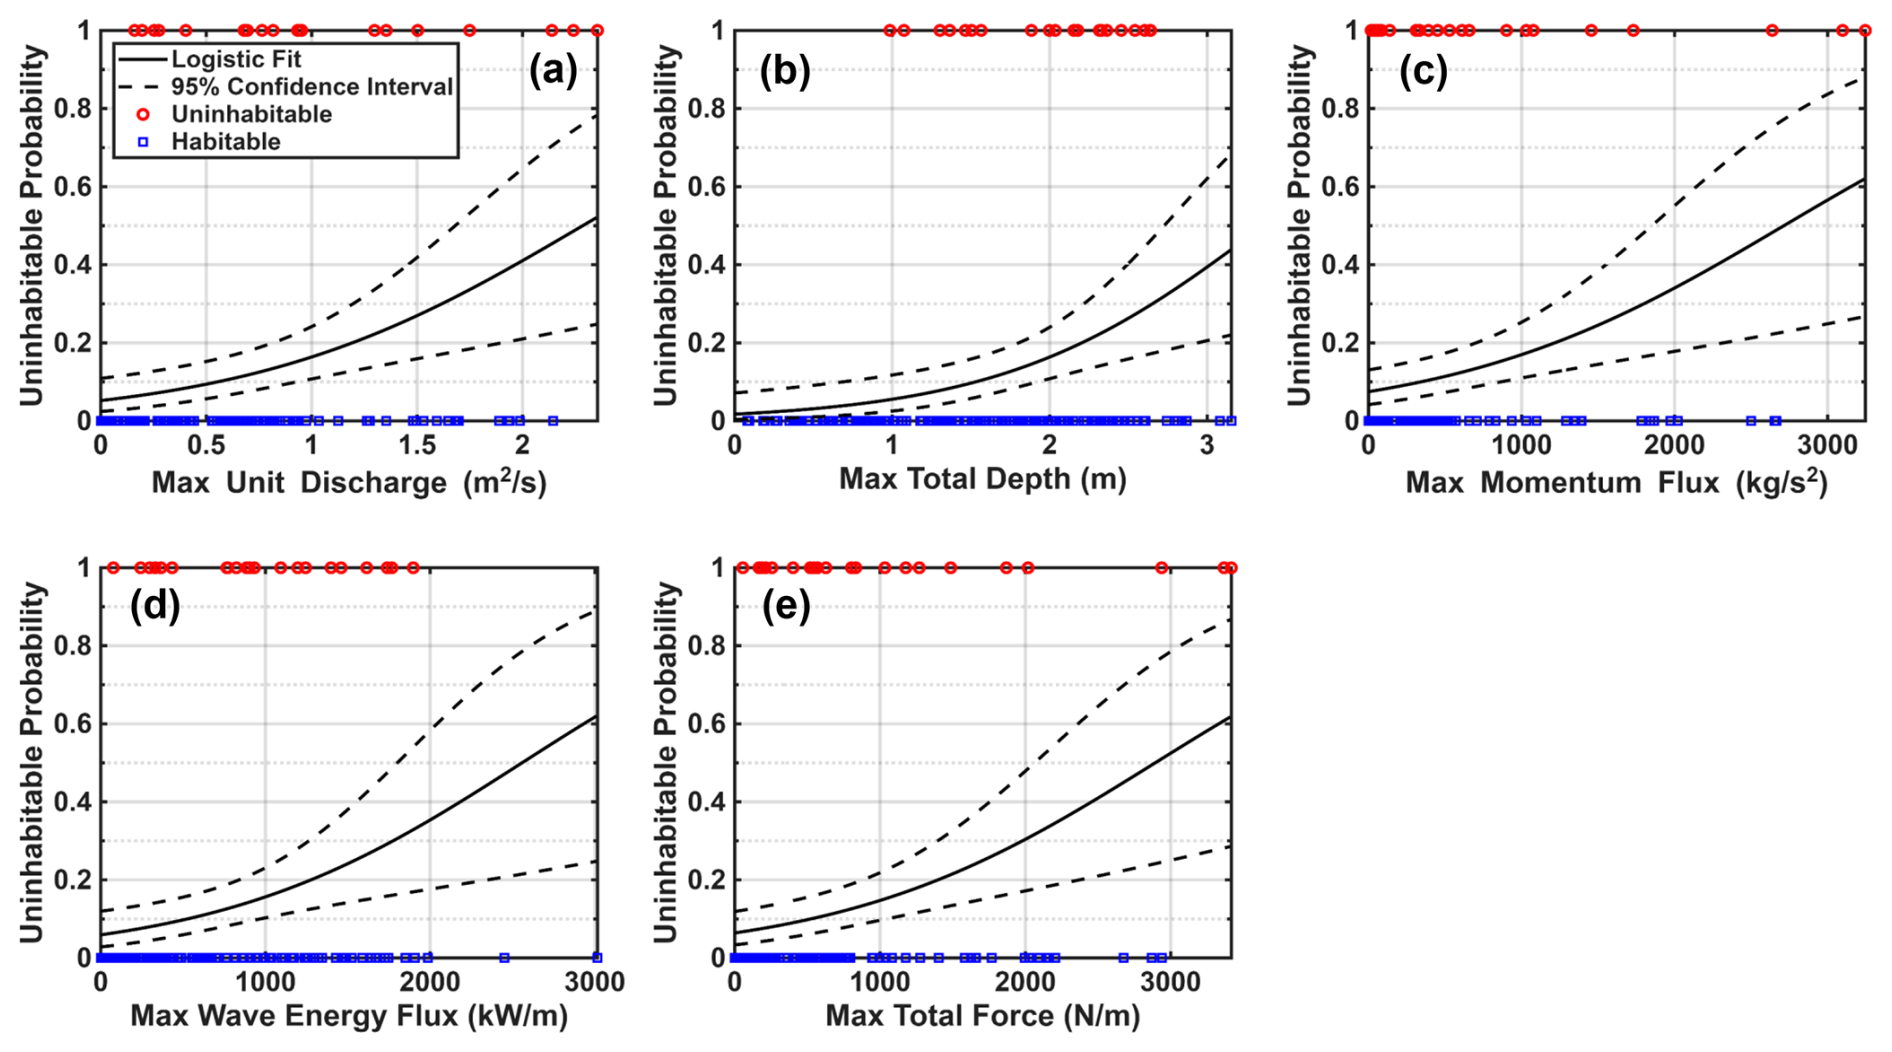
Figure B2Building habitability for buildings in Monroe County as a function of maximum unit discharge (a), total depth (b), flow momentum flux (c), wave energy flux (d), and total force (e) for buildings in the wood category.
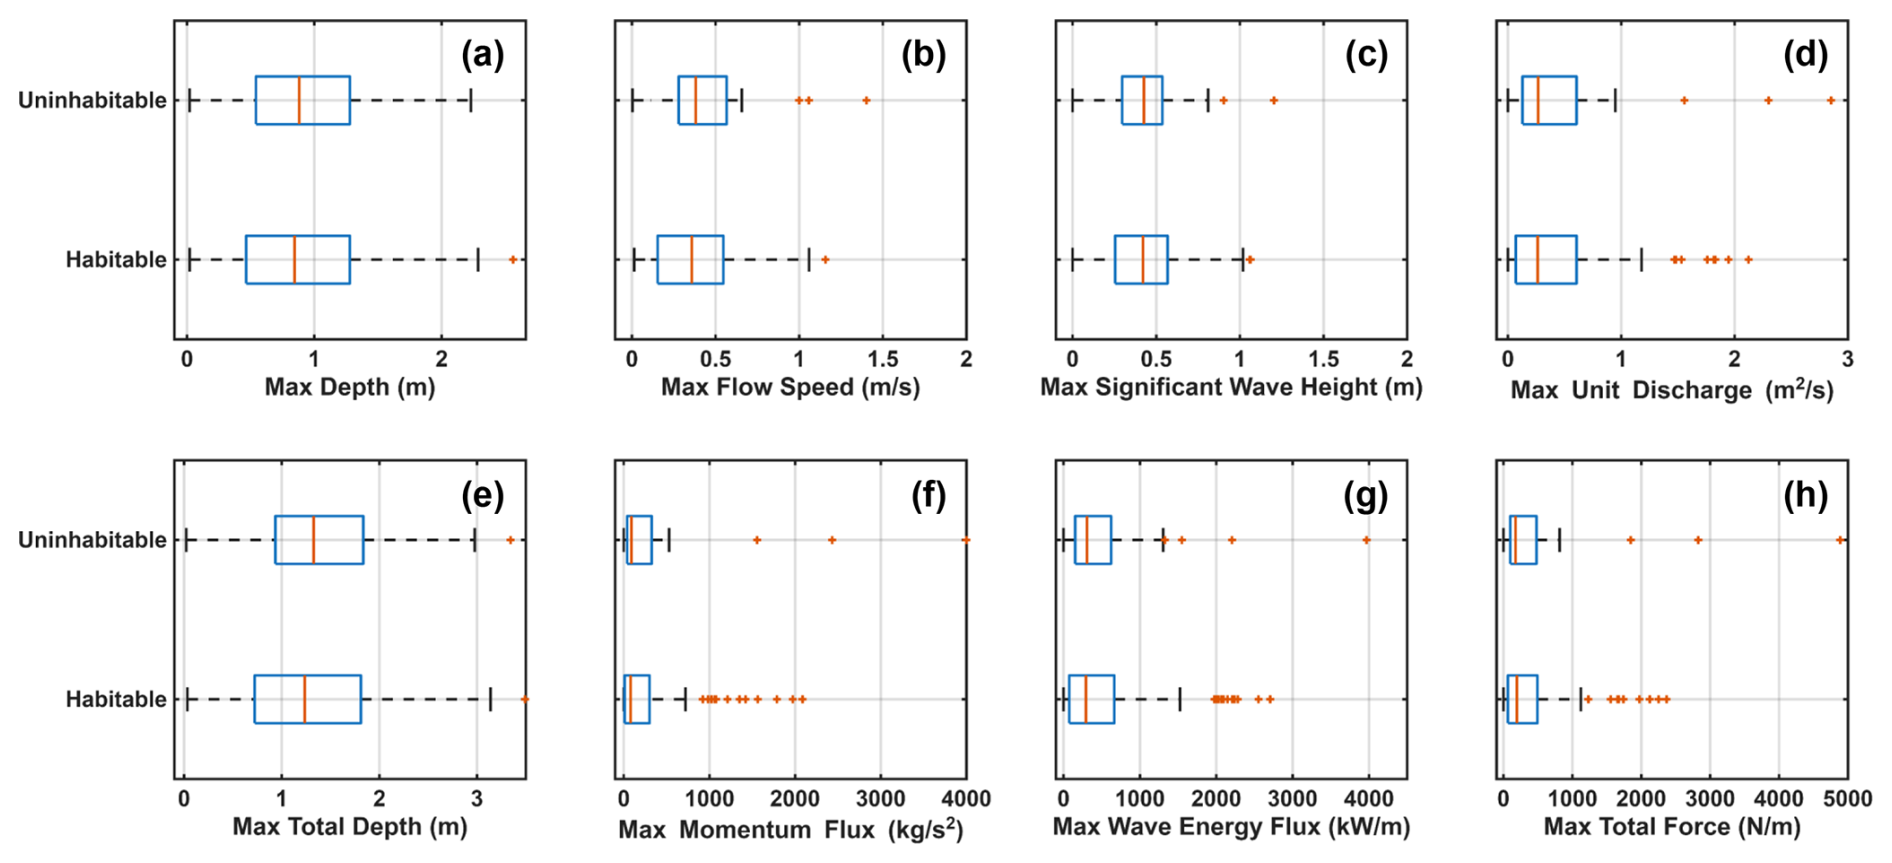
Figure B3Box plots of the maximum depth (a), flow speed (b), significant wave height (c), unit discharge (d), total depth (e), flow momentum flux (f), wave energy flux (g), and total force (h) used to develop habitability functions for Monroe County buildings in the concrete category.
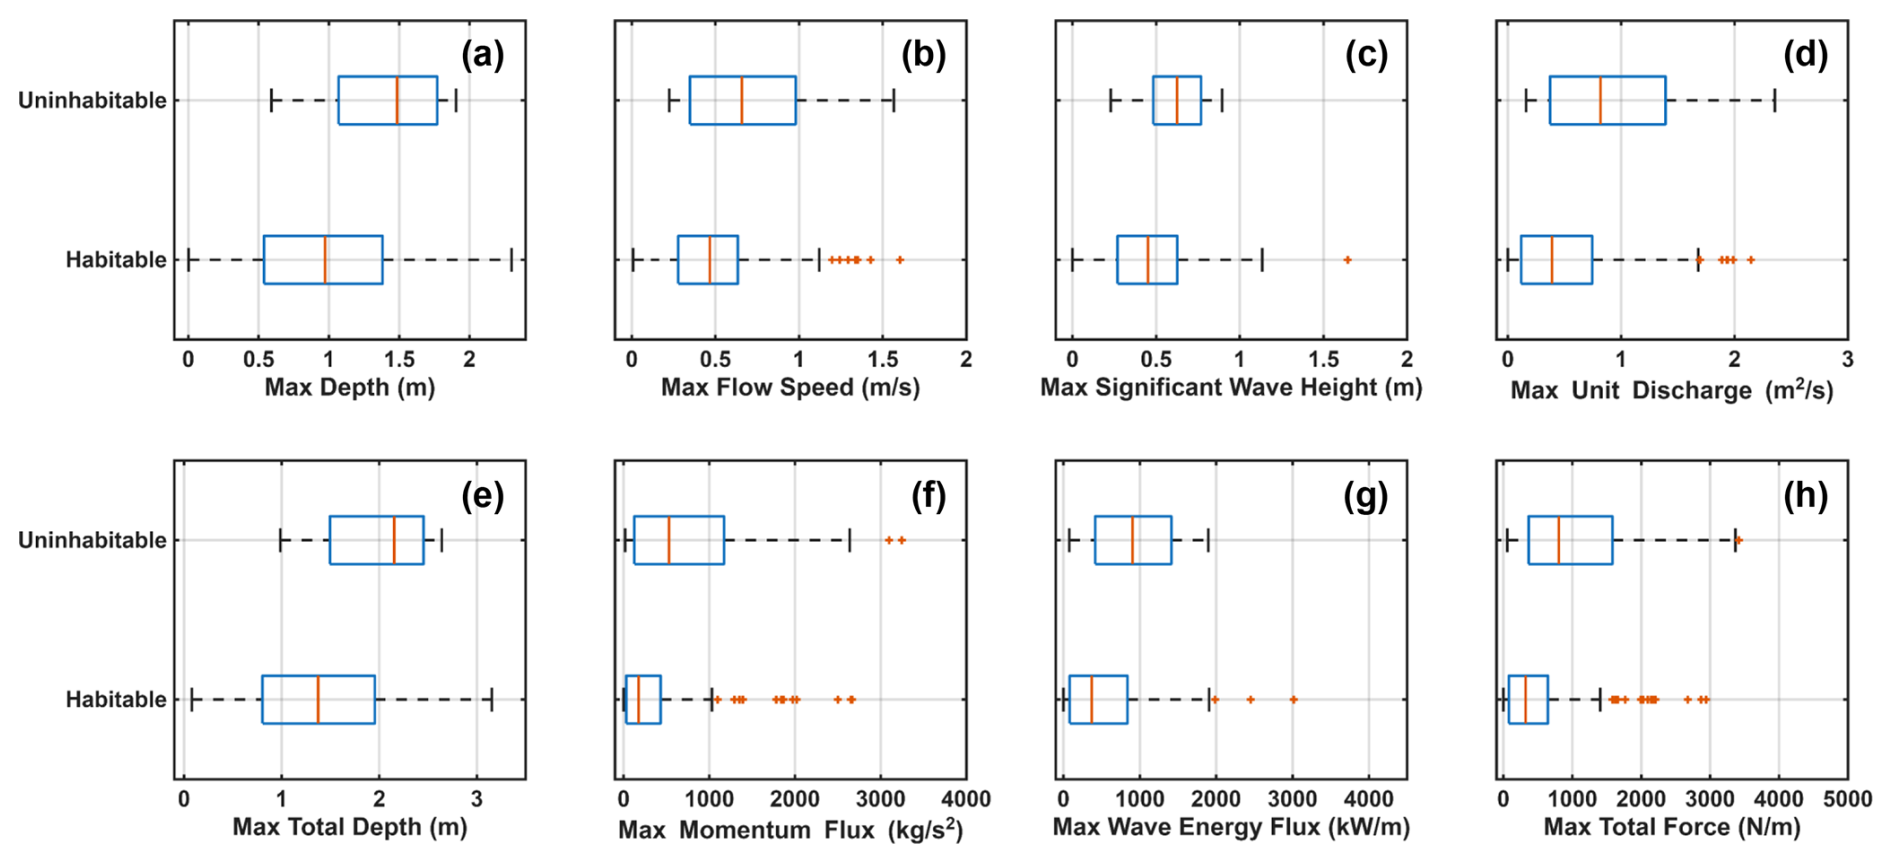
Figure B4Box plots of the maximum depth (a), flow speed (b), significant wave height (c), unit discharge (d), total depth (e), flow momentum flux (f), wave energy flux (g), and total force (h) used to develop habitability functions for Monroe County buildings in the wood category.
Table B1Logistic regression coefficients for buildings in Monroe County as a function of maximum unit discharge, total depth, flow momentum flux, wave energy flux, and total force for buildings in the concrete category.
For individual coefficients: ∗ p-value < 0.05, p-value < 0.001.
Table B2Logistic regression coefficients for buildings in Monroe County as a function of maximum unit discharge, total depth, flow momentum flux, wave energy flux, and total force for buildings in the wood category.
For individual coefficients: ∗ p-value < 0.05, p-value < 0.001.
Table B3Coefficients for each multivariable logistic regression model for buildings in the concrete or wood categories in Monroe County.
For individual coefficients: ∗ p-value < 0.05, p-value < 0.001.
Elevation models are available from NOAA's National Centers for Environmental Information and the General Bathymetric Chart of the Oceans (https://www.gebco.net/data-products/gridded-bathymetry-data, GEBCO, 2023; https://noaa.maps.arcgis.com/home/item.html?id=c876e3c96a8642ab8557646a3b4fa0ff, NOAA NCEI, 2022). Land cover data comes from the 2019 National land Cover Database for the Contiguous United States (https://doi.org/10.5066/P9KZCM54, Dewitz and USGS, 2024). Meteorological data for Hurricane Irma is retrieved from the National Hurricane Center's revised Atlantic hurricane database (https://www.nhc.noaa.gov/data/, last access: 13 January 2026) and the Tropical Cyclone Extended Best Tract Dataset (https://rammb2.cira.colostate.edu/research/tropical-cyclones/tc_extended_best_track_dataset/, last access: 13 January 2026; Demuth et al., 2006; Landsea and Franklin, 2013). Tidal constituents are available from the Oregon State University Tidal Inversion Software (https://www.tpxo.net/home, last access: 13 January 2026; Egbert and Erofeeva, 2002). NOAA station data is available from NOAA's National Data Buoy Center (https://www.ndbc.noaa.gov/, last access: 13 January 2026). The developed Hurricane Irma flood model can be shared upon reasonable request. Location Based Services (LBS) data, provided by Veraset LLC, and CoreLogic property data are not publicly available.
BN, SG, and JB conceptualized the study. BN and JB developed the flood model and regression models. TS and SG analyzed the LBS data. BN drafted the manuscript and created the figures. All authors discussed and reviewed the final manuscript.
The contact author has declared that none of the authors has any competing interests.
The content of the information provided in this publication does not necessarily reflect the position or the policy of the government, and no official endorsement should be inferred.
Publisher's note: Copernicus Publications remains neutral with regard to jurisdictional claims made in the text, published maps, institutional affiliations, or any other geographical representation in this paper. The authors bear the ultimate responsibility for providing appropriate place names. Views expressed in the text are those of the authors and do not necessarily reflect the views of the publisher.
The authors acknowledge the USACE, NOAA Sea Grant, and USCRP's support of their effort to strengthen coastal academic programs and address coastal community needs in the United States.
This project is funded, in part, with federal funds under award number NA23OAR4170115 from the US Coastal Research Program (USCRP) as administered by the US Army Corps of Engineers (USACE), Department of Defense, and the National Oceanic and Atmospheric Administration (NOAA) Sea Grant program, Department of Commerce. This work was also funded by a 2021 Catalyst Grants from the Michigan Institute for Computational Discovery and Engineering (MICDE).
This paper was edited by Animesh Gain and reviewed by two anonymous referees.
Akaike, H.: A new look at the statistical model identification, IEEE T. Automatic Control, 19, 716–723, https://doi.org/10.1109/TAC.1974.1100705, 1974.
Asher, T. G. and Luettich Jr., R. A.: A hindcast of coastal flooding from hurricane Irma, Ocean Model., 197, 102582, https://doi.org/10.1016/j.ocemod.2025.102582, 2025.
Cangialosi, J. P., Latto, A. S., and Berg, R.: National Hurricane Center tropical cyclone report – Hurricane Irma, National Hurricane Center, 111 pp., https://www.nhc.noaa.gov/data/tcr/AL112017_Irma.pdf (last access: 30 October 2025), 2021.
Charvet, I., Suppasri, A., Kimura, H., Sugawara, D., and Imamura, F.: A multivariate generalized linear tsunami fragility model for Kesennuma City based on maximum flow depths, velocities and debris impact, with evaluation of predictive accuracy, Nat. Hazards, 79, 2073–2099, https://doi.org/10.1007/s11069-015-1947-8, 2015.
Deltares: D-Flow Flexible Mesh User Manual, Version: 2022.02, SVN Revision: 75614, https://content.oss.deltares.nl/delft3d/D-Flow_FM_User_Manual.pdf (last access: 1 May 2025), 2022a.
Deltares: D-Waves User Manual, Version: 1.2, SVN Revision: 75624, https://content.oss.deltares.nl/delft3d/D-Waves_User_Manual.pdf (last access: 1 May 2025), 2022b.
Demuth, J. L., DeMaria, M., and Knaff, J. A.: Improvement of advanced microwave sounding unit tropical cyclone intensity and size estimation algorithms, J. Appl. Meteorol. Clim., 45, 1573–1581, https://doi.org/10.1175/JAM2429.1, 2006.
De Risi, R., Goda, K., Yasuda, T., and Mori, N.: Is flow velocity important in tsunami empirical fragility modeling?, Earth-Sci. Rev., 166, 64–82, https://doi.org/10.1016/j.earscirev.2016.12.015, 2017.
Dewitz, J. and USGS: National Land Cover Database (NLCD) 2019 Products (ver. 3.0, February 2024), U.S. Geological Survey data release [data set], https://doi.org/10.5066/P9KZCM54, 2024.
Diaz Loaiza, M. A., Bricker, J. D., Meynadier, R., Duong, T. M., Ranasinghe, R., and Jonkman, S. N.: Development of damage curves for buildings near La Rochelle during storm Xynthia based on insurance claims and hydrodynamic simulations, Nat. Hazards Earth Syst. Sci., 22, 345–360, https://doi.org/10.5194/nhess-22-345-2022, 2022.
Dobbelaere, T., Curcic, M., Le Hénaff, M., and Hanert, E.: Impacts of Hurricane Irma (2017) on wave-induced ocean transport processes, Ocean Model., 171, 101947, https://doi.org/10.1016/j.ocemod.2022.101947, 2022.
Egbert, G. D. and Erofeeva, S. Y.: Efficient inverse modeling of barotropic ocean tides, J. Atmos. Ocean. Tech., 19, 183–204, https://doi.org/10.1175/1520-0426(2002)019<0183:EIMOBO>2.0.CO;2, 2002.
FEMA: Hazus Flood Model Technical Manual – Hazus 6.1, https://www.fema.gov/sites/default/files/documents/fema_hazus-flood-model-technical-manual-6-1.pdf (last access: 30 October 2025), 2024a.
FEMA: Hazus Hurricane Model Technical Manual – Hazus 6.1, https://www.fema.gov/flood-maps/tools-resources/flood-map-products/hazus/documentation (last access: 30 October 2025), 2024b.
Fothergill, A. and Peek, L. A.: Poverty and disasters in the United States: a review of recent sociological findings, Nat. Hazards, 32, 89–110, https://doi.org/10.1023/B:NHAZ.0000026792.76181.d9, 2004.
GEBCO: Gridded Bathymetry Data, General Bathymetric Chart of the Oceans [data set], https://www.gebco.net/data-products/gridded-bathymetry-data (last access: 1 May 2025), 2023.
Gori, A., Lin, N., Xi, D., and Emanuel, K.: Tropical cyclone climatology change greatly exacerbates US extreme rainfall–surge hazard, Nat. Clim. Change, 12, 171–178, https://doi.org/10.1038/s41558-021-01272-7, 2022.
Hallegatte, S., Vogt-Schilb, A., Rozenberg, J., Bangalore, M., and Beaudet, C.: From poverty to disaster and back: a review of the literature, Economics of Disasters and Climate Change, 4, 223–247, https://doi.org/10.1007/s41885-020-00060-5, 2020.
Hodge, T. and Lee, A.: Hurricane Irma cut power to nearly two-thirds of Florida's electricity customers, U.S. Energy Information Administration, https://www.eia.gov/todayinenergy/detail.php?id=32992 (last access: 16 October 2024), 2017.
Holland, G.: A revised hurricane pressure–wind model, Mon. Weather Rev., 136, 3432–3445, https://doi.org/10.1175/2008MWR2395.1, 2008.
Holland, G., Belanger, J. I., and Fritz, A.: A revised model for radial profiles of hurricane winds, Mon. Weather Rev., 138, 4393–4401, https://doi.org/10.1175/2010MWR3317.1, 2010.
Hughes, W. and Zhang, W.: Evaluation of post-disaster home livability for coastal communities in a changing climate, Int. J. Disast. Risk Re., 96, 103951, https://doi.org/10.1016/j.ijdrr.2023.103951, 2023.
Hydrologic Engineering Center: HEC-RAS 2D User's Manual, https://www.hec.usace.army.mil/confluence/rasdocs/r2dum/latest (last access: 1 May 2025), 2021.
Issa, A., Ramadugu, K., Mulay, P., Hamilton, J., Siegel, V., Harrison, C., Campbell, C. M., Blackmore, C., Bayleyegn, T., and Boehmer, T.: Deaths related to Hurricane Irma – Florida, Georgia, and North Carolina, September 4–October 10, 2017, MMWR-Morbid. Mortal. W., 67, 829–832, https://doi.org/10.15585/mmwr.mm6730a5, 2018.
Joyce, B. R., Gonzalez-Lopez, J., Van der Westhuysen, A. J., Yang, D., Pringle, W. J., Westerink, J. J., and Cox, A. T.: U.S. IOOS coastal and ocean modeling testbed: hurricane-induced winds, waves, and surge for deep ocean, reef-fringed islands in the Caribbean, J. Geophys. Res.-Oceans, 124, 2876–2907, https://doi.org/10.1029/2018JC014687, 2019.
Landsea, C. W. and Franklin, J. L.: Atlantic hurricane database uncertainty and presentation of a new database format, Mon. Weather Rev., 141, 3576–3592, https://doi.org/10.1175/MWR-D-12-00254.1, 2013.
Li, Y., Chen, Q., Kelly, D. M., and Zhang, K.: Hurricane Irma simulation at South Florida using the parallel CEST model, Front. Clim., 3, https://doi.org/10.3389/fclim.2021.609688, 2021.
Loos, S., Lallemant, D., Khan, F., McCaughey, J. W., Banick, R., Budhathoki, N., and Baker, J. W.: A data-driven approach to rapidly estimate recovery potential to go beyond building damage after disasters, Commun. Earth Environ., 4, 1–12, https://doi.org/10.1038/s43247-023-00699-4, 2023.
Luppichini, M., Favalli, M., Isola, I., Nannipieri, L., Giannecchini, R., and Bini, M.: Influence of topographic resolution and accuracy on hydraulic channel flow simulations: case study of the Versilia River (Italy), Remote Sensing, 11, 1630, https://doi.org/10.3390/rs11131630, 2019.
Mendelsohn, R., Emanuel, K., Chonabayashi, S., and Bakkensen, L.: The impact of climate change on global tropical cyclone damage, Nat. Clim. Change, 2, 205–209, https://doi.org/10.1038/nclimate1357, 2012.
Mitsova, D., Esnard, A-M., Sapat, A., and Lai, B. S.: Socioeconomic vulnerability and electric power restoration timelines in Florida: The case of Hurricane Irma, Nat. Hazards, 94, 689–709, https://doi.org/10.1007/s11069-018-3413-x, 2018.
Muñoz, D. F., Moftakhari, H., and Moradkhani, H.: Quantifying cascading uncertainty in compound flood modeling with linked process-based and machine learning models, Hydrol. Earth Syst. Sci., 28, 2531–2553, https://doi.org/10.5194/hess-28-2531-2024, 2024.
Musinguzi, A., Reddy, L., and Akbar, M. K.: Evaluation of wave contributions in Hurricane Irma storm surge hindcast. Atmos., 13, 404, https://doi.org/10.3390/atmos13030404, 2022.
Neumann, B., Vafeidis, A. T., Zimmermann, J., and Nicholls, R. J.: Future coastal population growth and exposure to sea-level rise and coastal flooding – a global assessment, PLOS ONE, 10, e0118571, https://doi.org/10.1371/journal.pone.0118571, 2015.
NOAA NCEI: Digital Elevation Models Global Mosaic (Elevation Values), NOAA NCEI [data set], https://noaa.maps.arcgis.com/home/item.html?id=c876e3c96a8642ab8557646a3b4fa0ff (last access: 1 May 2025), 2022.
Nofal, O., Rosenheim, N., Kameshwar, S., Patil, J., Zhou, X., van de Lindt, J. W., Duenas-Osorio, L., Cha, E. J., Endrami, A., Sutley, E., Cutler, H., Lu, T., Wang, C., and Jeon, H.: Community-level post-hazard functionality methodology for buildings exposed to floods, Comput.-Aided Civ. Inf., 39, 1099–1122, https://doi.org/10.1111/mice.13135, 2024.
Nofal, O. M., van de Lindt, J. W., and Do, T. Q.: Multi-variate and single-variable flood fragility and loss approaches for buildings, Reliab. Eng. Syst. Safe., 202, 106971, https://doi.org/10.1016/j.ress.2020.106971, 2020.
Paprotny, D., Kreibich, H., Morales-Nápoles, O., Wagenaar, D., Castellarin, A., Carisi, F., Bertin, X., Merz, B., and Schröter, K.: A probabilistic approach to estimating residential losses from different flood types, Nat. Hazards, 105, 2569–2601, https://doi.org/10.1007/s11069-020-04413-x, 2021.
Paul, N., Galasso, C., and Baker, J.: Household displacement and return in disasters: a review, Nat. Hazards Rev., 25, 03123006, https://doi.org/10.1061/NHREFO.NHENG-1930, 2024.
Pistrika, A. K. and Jonkman, S. N.: Damage to residential buildings due to flooding of New Orleans after Hurricane Katrina, Nat. Hazards, 54, 413–434, https://doi.org/10.1007/s11069-009-9476-y, 2010.
Schwarz, G.: Estimating the dimension of a model, The Annals of Statistics, 6, 461–464, 1978.
Sheather, S. J.: Diagnostics and transformations for multiple linear regression, in: A Modern Approach to Regression with R, edited by: Sheather, S., Springer, New York, NY, 151–225, https://doi.org/10.1007/978-0-387-09608-7_6, 2009.
Smith, A. B.: U.S. billion-dollar weather and climate disasters, 1980–present, NOAA National Centers for Environmental Information [data set], https://doi.org/10.25921/stkw-7w73, 2020.
Smith, S. D. and Banke, E. G.: Variation of the sea surface drag coefficient with wind speed, Q. J. Royal Meteor. Soc., 101, 665–673, https://doi.org/10.1002/qj.49710142920, 1975.
Suppasri, A., Mas, E., Charvet, I., Gunasekera, R., Imai, K., Fukutani, Y., Abe, Y., and Imamura, F.: Building damage characteristics based on surveyed data and fragility curves of the 2011 Great East Japan tsunami, Nat. Hazards, 66, 319–341, https://doi.org/10.1007/s11069-012-0487-8, 2013.
Swanson, T.: Towards new measures of resilience: leveraging location based services data for evaluating hazard-induced changes in access to essential services and community recovery, PhD thesis, University of Michigan, https://doi.org/10.7302/22240, 2023.
Swanson, T. and Guikema, S.: Using mobile phone data to evaluate access to essential services following natural hazards, Risk Anal., 44, 883–906, https://doi.org/10.1111/risa.14201, 2024.
Thieken, A. H., Müller, M., Kreibich, H., and Merz, B.: Flood damage and influencing factors: new insights from the August 2002 flood in Germany, Water Resour. Res., 41, https://doi.org/10.1029/2005WR004177, 2005.
Tomiczek, T., Kennedy, A., and Rogers, S.: Survival analysis of elevated homes on the Bolivar Peninsula after Hurricane Ike, Advances in Hurricane Engineering, ASCE, 108–118, https://doi.org/10.1061/9780784412626.010, 2013.
Tsubaki, R., Bricker, J. D., Ichii, K., and Kawahara, Y.: Development of fragility curves for railway embankment and ballast scour due to overtopping flood flow, Nat. Hazards Earth Syst. Sci., 16, 2455–2472, https://doi.org/10.5194/nhess-16-2455-2016, 2016.
Washington, V., Guikema, S., Mondisa, J., and Misra, A.: A data-driven method for identifying the locations of hurricane evacuations from mobile phone location data, Risk Anal., 44, 390–407, https://doi.org/10.1111/risa.14188, 2024.
Woodruff, J. D., Irish, J. L., and Camargo, S. J.: Coastal flooding by tropical cyclones and sea-level rise, Nature, 504, 44–52, https://doi.org/10.1038/nature12855, 2013.
Wu, J.: Wind-stress coefficients over sea surface from breeze to hurricane, J. Geophys. Res., 87, 9704–9706, https://doi.org/10.1029/JC087iC12p09704, 1982.
Xie, L., Bao, S., Pietrafesa, L. J., Foley, K., and Fuentes, M.: A real-time hurricane surface wind forecasting model: formulation and verification, Mon. Weather Rev., 134, 1355–1370, https://doi.org/10.1175/MWR3126.1, 2006.
Xu, C., Nelson-Mercer, B. T., Bricker, J. D., Davlasheridze, M., Ross, A. D., and Jia, J.: Damage curves derived from Hurricane Ike in the West of Galveston Bay based on insurance claims and hydrodynamic simulations, Int. J. Disast. Risk Sc., 14, 932–946, https://doi.org/10.1007/s13753-023-00524-8, 2023.
Yabe, T., Tsubouchi, K., Fujiwara, N., Sekimoto, Y., and Ukkusuri, S. V.: Understanding post-disaster population recovery patterns, J. R. Soc. Interface, 17, 20190532, https://doi.org/10.1098/rsif.2019.0532, 2020.