
the Creative Commons Attribution 4.0 License.
the Creative Commons Attribution 4.0 License.
 | 20 Oct 2026
Hydrologically enhanced machine learning framework for urban flood inundation mapping using multi-sensor remote sensing data: a case study of Mumbai, India
Ankush S. Pawar

Mapping urban flooding in rapidly urbanizing coastal megacities remains challenging due to complex terrain conditions, high population density, and the limited availability of reliable ground observations. This study presents a hydrologically enhanced machine-learning framework for automated urban flood inundation mapping by integrating multi-sensor satellite observations within a scalable decision-support system. A comprehensive predictor dataset was generated using Sentinel-1 synthetic aperture radar (SAR), Sentinel-2 optical imagery, Shuttle Radar Topography Mission (SRTM) digital elevation data, and Climate Hazards Group InfraRed Precipitation with Station data (CHIRPS) rainfall products through Google Earth Engine.
To explicitly represent hydrologic controls on flood propagation that are often overlooked in purely data-driven approaches, two hydrologically informed predictors were incorporated: the Relative Elevation Model (REM), which characterizes terrain-controlled flood accumulation, and the Rainfall-Normalized Index (RNI), which represents rainfall-conditioned surface wetness. A flood inventory was generated by integrating SAR backscatter change detection, optical water indices, and topographic constraints, resulting in approximately 2.6 × 10⁵ flooded pixels across the Mumbai Metropolitan Region during the 2019 monsoon season. A balanced stratified sampling strategy was employed to create representative training and testing datasets for supervised classification.
Random Forest, optimized Extreme Gradient Boosting (XGBoost), and ensemble models were developed and evaluated using standard classification metrics. The optimized XGBoost model achieved the highest predictive performance, with an overall accuracy of 71.7 % and an area under the receiver operating characteristic curve (AUC) of 0.803, outperforming both the Random Forest and ensemble models. The DeLong test indicated statistically significant differences in AUC for the evaluated hydrologic-predictor ablation comparisons at the 95 % confidence level. Feature ablation analysis further demonstrated the importance of hydrologic-topographic predictors, with REM and RNI contributing an increase of approximately 5 %–6 % in AUC. The inclusion of hydrologic predictors improved model discrimination from approximately 0.66 using SAR-only predictors to approximately 0.80 using the complete predictor framework. The resulting flood maps exhibited spatial patterns that were hydrologically consistent with major drainage networks and low-lying areas across the study region.
The proposed framework provides a reproducible, scalable, and hydrologically informed and physically interpretable predictors approach for urban flood inundation mapping and demonstrates considerable potential for operational flood monitoring, hazard assessment, and decision-support applications in data-limited tropical urban environments.
- Article
(4550 KB) - Full-text XML
- BibTeX
- EndNote


Urban flooding is one of the most frequent and severe natural hazards worldwide, causing substantial socio-economic losses and posing significant risks to human life, particularly in rapidly urbanizing coastal megacities. Over recent decades, increases in extreme rainfall events, unplanned urban expansion, and the widespread replacement of natural land cover with impervious surfaces have significantly altered the hydrological response of urban environments. Cities such as Mumbai, India, experience recurrent flooding where intense monsoon rainfall, low-lying topography, inadequate drainage infrastructure, and tidal influences combine to produce severe inundation events.
Existing flood hazard assessment methodologies are primarily based on hydrodynamic and hydraulic models that simulate water flow and inundation processes using physically based equations. Although these models can generate detailed estimates of flood depth, extent, and flow velocity, their application in large urban areas is often constrained by high computational requirements, extensive parameterization, and the need for high-resolution spatial datasets. These limitations reduce their suitability for rapid flood mapping and near-real-time operational applications, particularly in data-scarce environments.
In recent years, advances in satellite remote sensing and machine learning have created new opportunities for urban and regional flood inundation mapping. Ensemble tree-based classifiers, hybrid machine learning approaches, and deep learning models have demonstrated strong capabilities in capturing nonlinear relationships among radar backscatter, spectral indices, terrain characteristics, and flood occurrence (Vongkusolkit et al., 2023; Samanta et al., 2018; Khosravi et al., 2019; Mosavi et al., 2018). The increasing availability of freely accessible Earth observation data from missions such as Sentinel-1 and Sentinel-2 has further accelerated the development of data-driven flood mapping frameworks.
Despite these advances, many machine learning-based flood mapping studies continue to rely primarily on spectral and radar-derived features, while providing limited representation of hydrologic and topographic controls that influence flood propagation. Flood occurrence is not governed solely by surface reflectance and radar response; it is also strongly affected by terrain configuration, local elevation differences, rainfall accumulation, and drainage characteristics. A recent review by Islam et al. (2025) highlighted the growing use of machine learning approaches for urban flood susceptibility and inundation mapping, while also emphasizing the limited incorporation of physically meaningful hydrologic controls within predictive frameworks.
This limitation creates a gap between data-driven flood mapping approaches and the hydrological processes that govern flood inundation dynamics. Consequently, machine learning models trained primarily on spectral and backscatter information may exhibit reduced transferability across heterogeneous urban environments and varying hydrometeorological conditions. Recent studies have attempted to integrate elevation and surface models with SAR observations to improve flood delineation (Sharif et al., 2023). However, many of these approaches rely on computationally intensive deep-learning architectures that require large training datasets and may be difficult to implement within operational decision-support systems.
Urban flood generation is fundamentally controlled by complex interactions among rainfall forcing, terrain characteristics, drainage conditions, and surface water accumulation. Nevertheless, physically interpretable hydrologic predictors remain underutilized in machine learning-based flood mapping. To address this gap, the present study integrates hydrologically informed predictors with multi-sensor remote sensing observations and systematically evaluates their contribution through feature importance analysis, feature ablation experiments, robustness assessment, and statistical performance evaluation. By incorporating hydrologic-topographic information directly into the predictive framework, the study aims to improve both model performance and physical interpretability for urban flood inundation mapping.
Research Objectives and Contributions
This study aims to develop a hydrologically enhanced machine learning framework for urban flood inundation mapping in the Mumbai Metropolitan Region. Specifically, the study makes three key contributions. First, it integrates multi-sensor remote sensing observations with hydrologically informed terrain-conditioned predictors to improve the representation of flood-generating processes within a machine learning framework. Second, it systematically evaluates the contribution of hydrologic-topographic predictors through feature importance analysis, feature ablation experiments, and statistical significance testing. Third, it assesses model robustness and internal stability through cross-validation, sensitivity analysis, and comparative evaluation of multiple machine learning classifiers. The resulting framework provides a scalable and physically interpretable approach for urban flood mapping and can support flood monitoring and decision-making in data-limited urban environments.
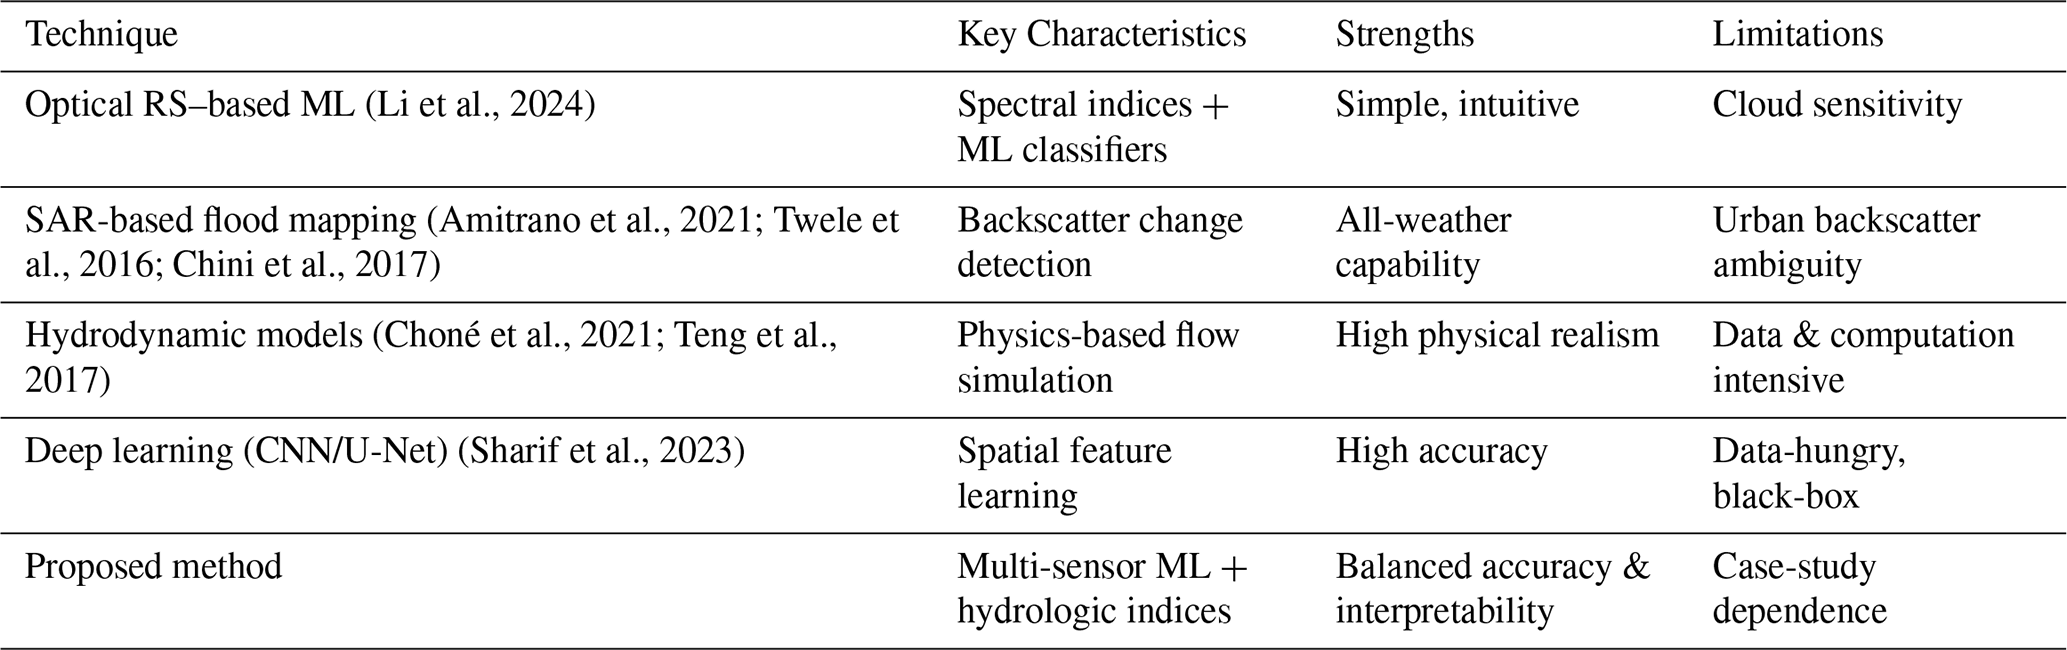
Table 1 gives an overview of functionalities of popular methods of flood monitoring. The methods of optical and SAR offer quick inundation sensing, but their usage is frequently limited by cloud interference or back scattering confusion in cities with high levels of urbanization. Hydrodynamic models provide physical interpretable flood models, but necessitate a large scale of calibration and computation, reducing their scalability to operational scale. Recent deep learning methods have shown encouraging results but require the use of large labeled data and do not provide the ability to make decisions in a transparent manner. Contrary to this, the proposed framework incorporates multi-sensor satellite data with topographic-hydrologic context which allows a compromise between performance, interpretability, and scalability in mapping urban flood inundation.
Table 1Functional comparison of commonly used flood monitoring and mapping techniques.
In spite of the fact that recent research considered the use of ensemble and deep learning models to map flood inundation, the explicit combination of hydrologic-topographic conditioning has not been extensively used in most data-driven models (Samanta et al., 2018; Khosravi et al., 2019). The lack of physically relevant ground-based controls limits the external applicability of machine learning models to a heterogeneous urban environment and dissimilar hydrometeorological conditions (Islam et al., 2025; Abedi et al., 2023).
3.1 Study Area
The study area as presented in Fig. 1 is the Mumbai Metropolitan Region (MMR) which is situated along the western coast of India (Lat: 18.9–19.3° N, Long: 72.7–73.0° E).The topography of Mumbai is low, the city receives a lot of rainfall during the monsoon season (June–September) and the impervious surfaces are very high leading to flash floods. The area contains an intricate system of rivers, creeks, reclaimed lowlands and highly populated spaces, so it is suitable to test how hydrologically-friendly flood mapping techniques can be used.
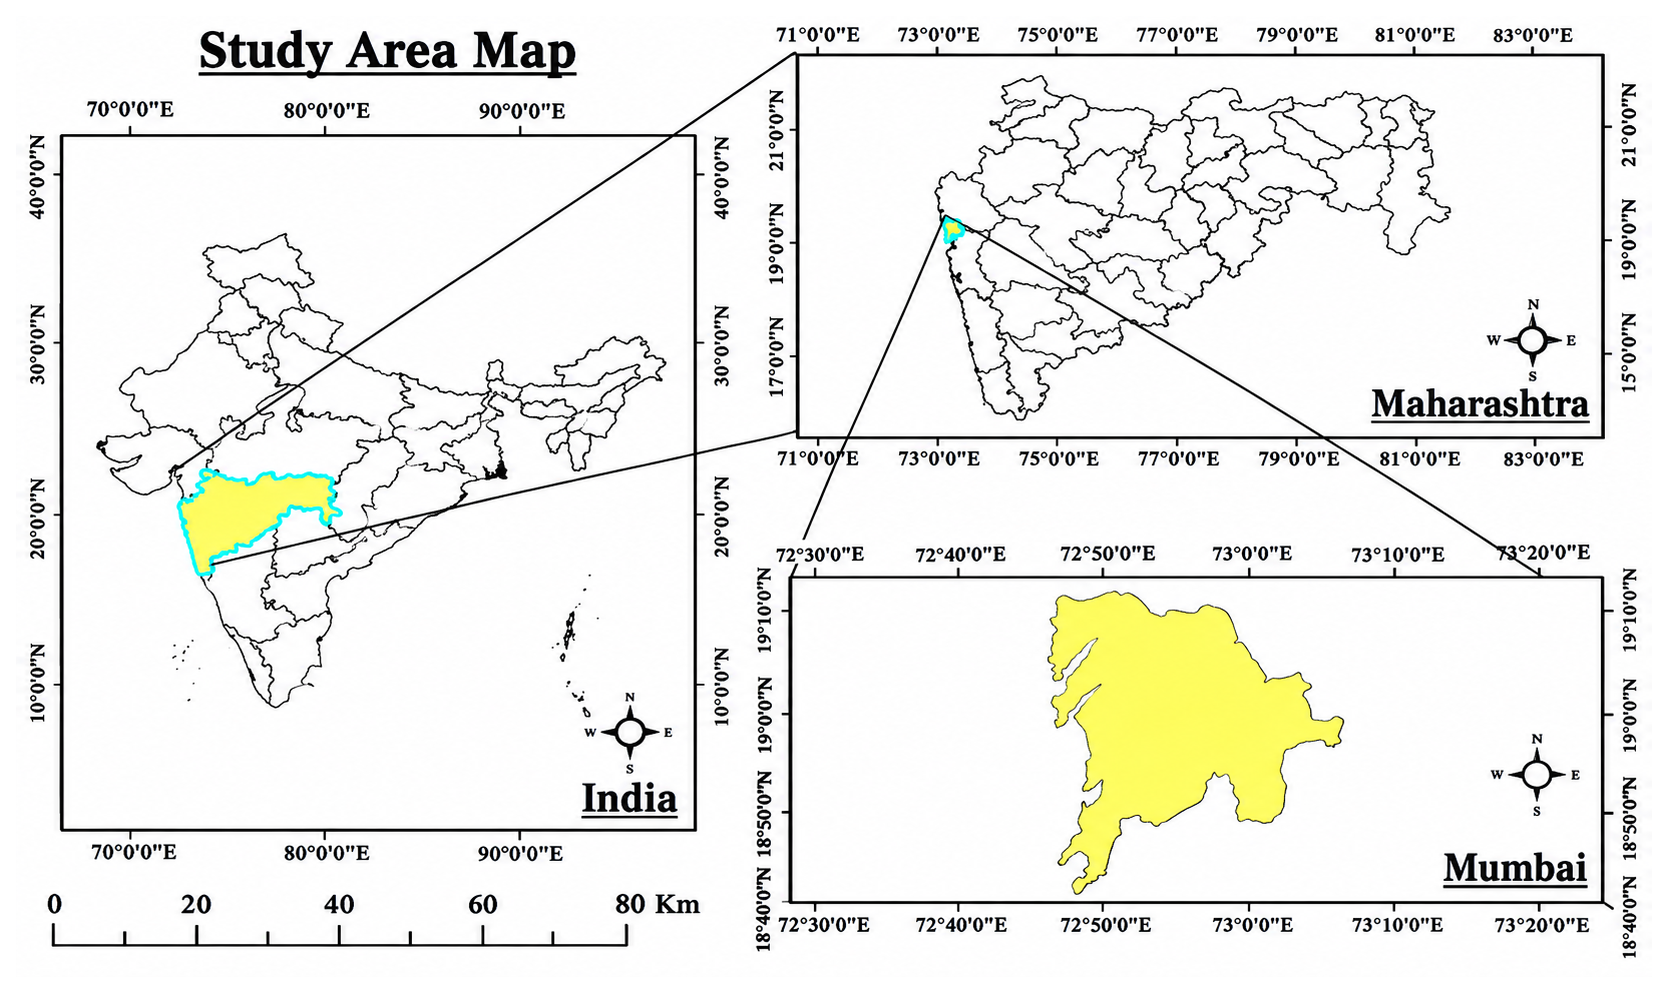
Figure 1Mumbai Metropolitan Region.
3.2 Data Sources
Table 2 summarizes all datasets used.
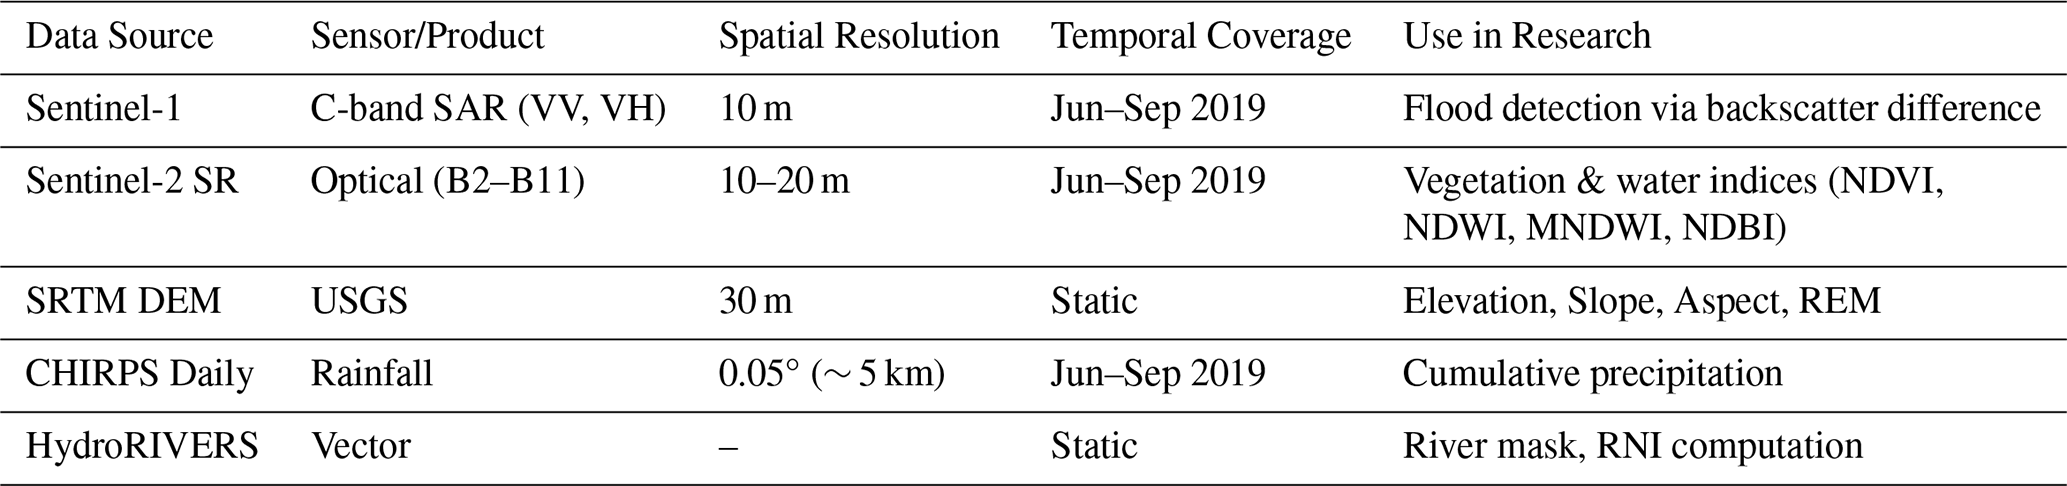
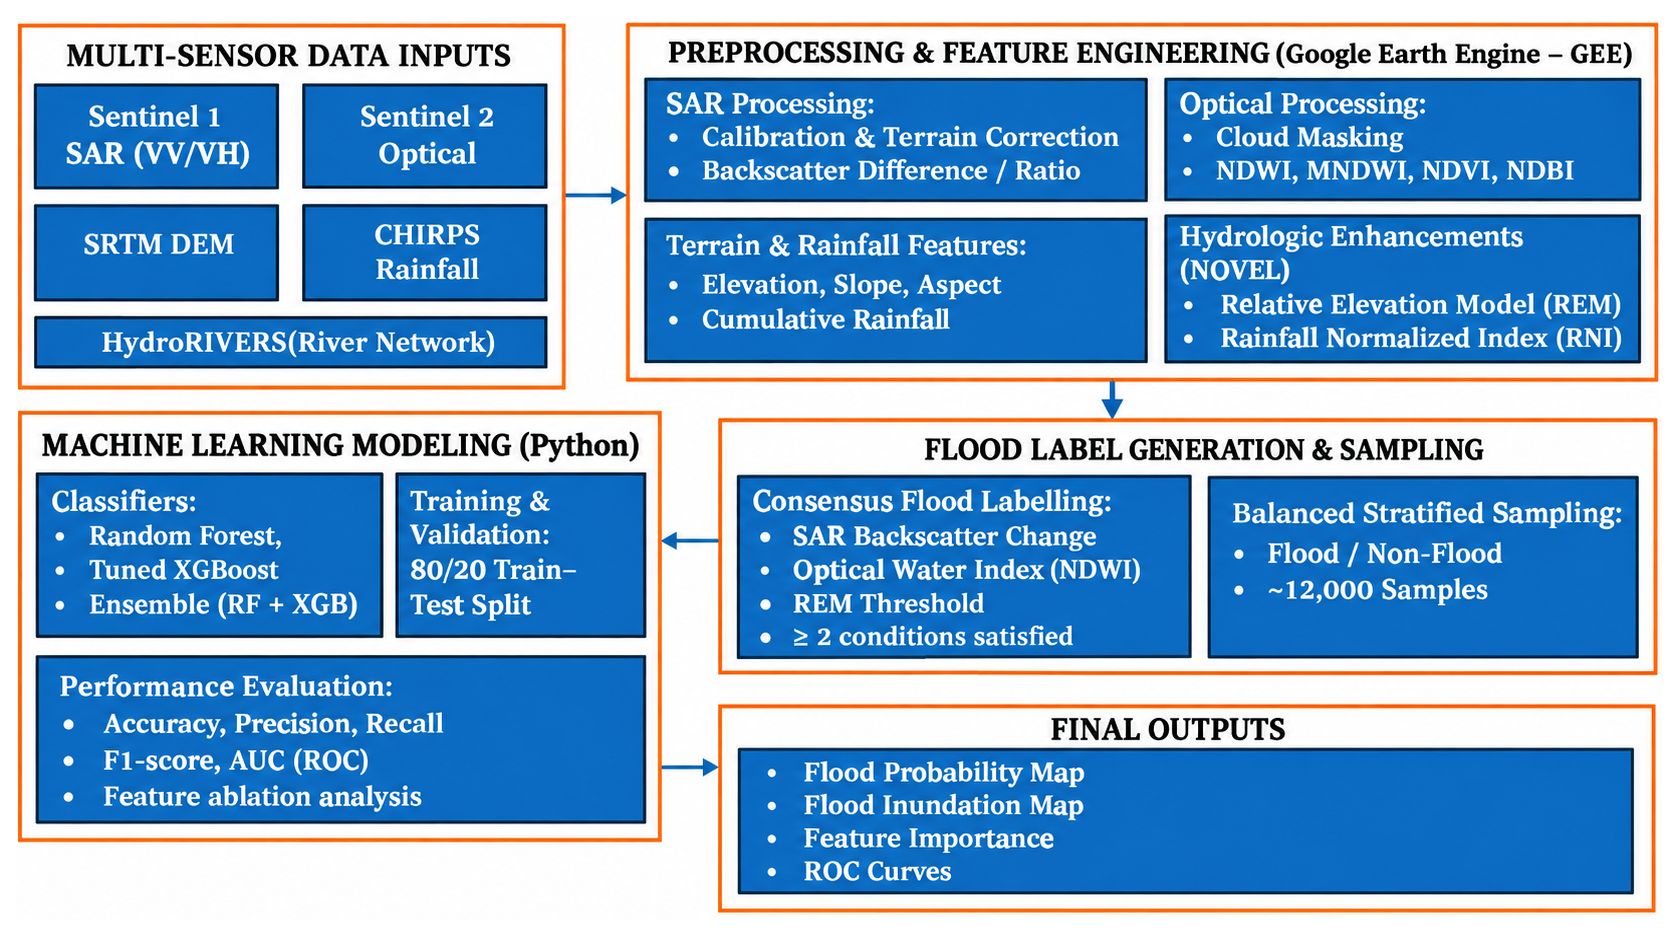
Figure 2 illustrates the overall flood analysis workflow adopted in this study, outlining the sequential integration of multi-sensor satellite data, hydrologic feature enhancement, flood label generation, and machine learning-based classification. The workflow begins with the acquisition and preprocessing of Sentinel-1 SAR, Sentinel-2 optical imagery, SRTM digital elevation data, and CHIRPS rainfall within the Google Earth Engine platform to generate a harmonized predictor stack. A hydrologic-topographic predictor is then calculated, explicitly capturing the effects of terrain control on flood accumulation and the effects of rainfall on surface wetness, respectively, through the Relative Elevation Model (REM) and the Rainfall-Normalized Index (RNI). These predictors give physically significant information to aid in the flood detection process, along with the spectral and radar data.Flood training labels are generated using a consensus-based approach that integrates SAR backscatter change, optical water indices, and topographic constraints to minimize false detections. The labeled dataset is then used to train and evaluate machine learning models, including Random Forest, XGBoost, and an ensemble configuration, with performance assessed using standard classification metrics and statistical significance testing. The workflow culminates in the production of spatially explicit flood probability and inundation maps, enabling robust and operationally scalable urban flood monitoring.
4.1 Multi-Sensor Data Preprocessing and Feature Extraction
For preprocessing of geospatial data and feature extraction, Google Earth Engine (GEE) cloud-based computing system is used in order to achieve scalability and reproducibility. Sentinel-1 C-band SAR images (VV and VH polarizations) are radiometrically calibrated and terrain-corrected and smoothed to eliminate speckle effects. The flood-sensitive SAR characteristics are obtained based on the difference, as well as ratio measures of the pre-event and the peak-flood measurements of the backscatter.
The scene classification layer is used to cloud-mask sentinel-2 surface reflectance data and calculate spectral indices that are useful in identifying water, vegetation, and built-up regions such as NDWI, NDVI, MNDWI, and NDBI. These indices are used to record supplementary data about the presence of surface water and land cover background in cloud-clear conditions. The spectral water indices NDWI and MNDWI are popular in recent literature to further improve the surface water detection in urban settings and can still be effective supplements to SAR-based flood indicators (Li et al., 2024).
The 30 m SRTM digital elevation model gave topographic predictors in the form of elevation, slope, and aspect. Cumulative CHIRPS rainfall is used in the monsoon season to incorporate satellite-based precipitation information to depict spatial variability of rainfall. Predictor layers are brought to a comparable spatial resolution and projection and resampled before model development.
4.2 Hydrologic-Topographic Improvements
Two new predictors based on terrain are developed to explicitly define hydrologic control over the movement of floods:
It is demonstrated that incorporation of terrain-controlled hydrologic indicators can greatly complement flood susceptibility and inundation modeling by accounting of the locally depressions and hydraulic connectivity which cannot be directly observed using spectral or radar signals alone (Samanta et al., 2018; Khosravi et al., 2019). In this connection, Relative Elevation Model (REM) and Rainfall Normalized Index (RNI) were proposed to incorporate physically significant flood propagation regulations into the machine learning system.
4.2.1 Relative Elevation Model (REM)
The Relative Elevation Model (REM) is a local elevation model with respect to nearby drainage features and can be used to estimate the flood accumulation potential of modeled terrain. Lower values of REM signify that the area has poorer gravitational drainage and is thus more vulnerable to water logging in extreme rainfall events.
Where, DEM SRTM elevation at pixel (x,y) RiverElevnearest= Elevation of nearest river pixel from HydroRIVERS shapefile Conceptually REM is related to measures of terrain-relative elevation, for example, Height Above Nearest Drainage (HAND): in this paper it is realized in the form of a simplified drainage-referenced elevation difference, based on SRTM and HydroRIVERS.
4.2.2 Rainfall Normalized Index (RNI)
The Rainfall Normalized Index (RNI) was formulated to account for the effect of the forcing by rainfall and surface wetness conditions. The index combines cumulative monsoon precipitation from CHIRPS rainfall data with a Normalized Difference Water Index (NDWI) from Sentinel-2 imagery. This method helps determine areas where high rainfall is occurring, and where the surface moisture or standing water is also high.
where: NDWI = Normalized Difference Water Index, P = cumulative precipitation from CHIRPS, ln(P+1) reduces the influence of extreme rainfall values.
Higher RNI values indicate areas where substantial rainfall coincides with elevated surface wetness, increasing the likelihood of flood inundation.
4.3 Threshold Selection and Multi-Sensor Consensus Flood Labeling
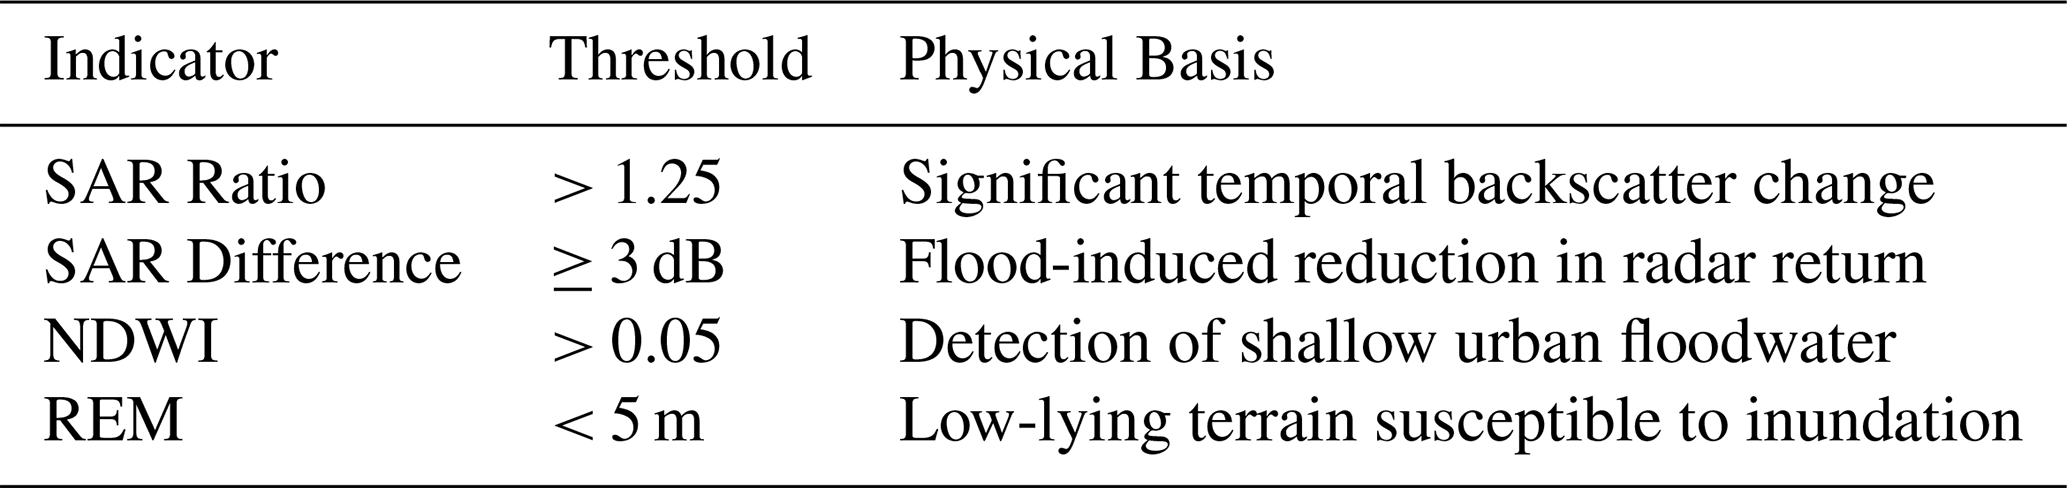
This section discusses threshold selection and Multi-Sensor Consensus Flood Labeling. The flood labels were produced based on a multi-sensor consensus approach that combines radar, optical and topographic data. Threshold values were chosen according to physical principles, published flood mapping studies and nature of urban flooding in Mumbai.Flood inventory generation was done using threshold values as summarized in Table 3. The thresholds selected were derived using theory of radar scattering and optical water detection principles, topographic controls to flood accumulation, and evidence reported in previous flood mapping studies. These physically meaningful criteria can help boost the reliability of the flood labels generated.
Radar (SAR)-Based Thresholds – Aperture Radar (SAR) measurements are sensitive to surface properties such as roughness and dielectric properties. Because smooth water surface reflect radars away from the radar, radar backscatter is generally low when flooded. The threshold of 3 dB was chosen as a reasonable backscatter difference and is compatible with the variations likely to occur due to speckle, which are approximately 1 dB. A 3 dB threshold has been shown to give a good compromise between detection and reducing false alarms; previous flood mapping studies have confirmed that changes greater than the 2–5 dB range give good discrimination of flooded areas. Likewise, a SAR ratio cutoff of more than 1.25 was applied to determine significant temporal changes related to inundation.
Optical (NDWI)-Based Threshold – The Normalized Difference Water Index (NDWI) takes advantage of the high absorption of water in near-infrared radiation and the high reflectance in the green spectral region. While a typical NDWI threshold range used for open water mapping is 0.2–0.3, urban flood waters may be shallow and turbid and blended with debris and have lower spectral response. In addition, uncertainty can be caused by cloud shadows and wet surfaces. For this reason, it was decided to use a threshold value of NDWI > 0.05, which will allow to better detect shallow urban inundation while avoiding omission errors.
Topographic (REM)-Based Threshold – The topography of the area, in terms of local topographic position and relative elevation above the drainage channels, plays an important role in flood inundation. Runoff accumulation and overbank flooding areas were identified using the Relative Elevation Model (REM) considering low gravitational potential. A threshold of REM < 5 m was used because other hydrologic studies have shown that low-relief coastal floodplains are especially vulnerable to inundation in this range. The DEM profiles of the river systems Mithi, Dahisar and Ulhas also showed that some of the flood-prone areas in Mumbai, such as Kurla, Saki Naka and Vakola are in this range.
Multi-Sensor Consensus Rule – Every individual indicator has its own particular advantages and disadvantages. SAR observations are available on an all-weather basis, optical indices give direct detection of surface water under cloud-free conditions, and REM gives the hydrologic plausibility based on terrain controls. To minimize the classification uncertainty, a consensus rule was used, assigning a flooded classification to a pixel if at least two of the three complementary indicators agreed. This reduces the influence of false detections associated with individual indicators and provides a more internally consistent flood inventory by combining complementary sources of information.
Table 3Threshold values used for multi-sensor flood inventory generation and their hydrologic rationale.
It is important to note that some variables used in the consensus flood inventory, including SAR-derived indicators, NDWI, and REM, are also included as predictors in the machine learning models. Consequently, the reported performance measures represent the ability of the models to discriminate the consensus-derived flood inventory rather than an independent ground-truth flood inventory. This shared information between target-label generation and predictor construction may introduce target–predictor dependence. The results are therefore interpreted as an assessment of model consistency with the multi-sensor flood inventory, while independent flood observations are required to establish external validity.
4.4 Data and Sample Preparation: Balanced Sampling
In order to reduce the class imbalance and model bias, a balanced stratified sampling method is used based on GEE stratifiedSample () function. A sample of about 12 000 points is sampled, of which there are equal samples of flooded and non-flooded classes. As a tabular dataset to be used in supervised learning, the values of the predictors are exported.
Before training the models, the features are standardized, and those with no values treated with the mean imputation. A stratified sampling, which maintains the proportions of classes, is used to divide the dataset into training (80 %) and testing (20 %) subsets in order to maintain the proportions of classes.
4.5 Model Development and Evaluation
Python implementation Three monitored classifiers are implemented:
Random forest and XGBoost are tree-based ensemble learning algorithms, which have gained popularity in flood susceptibility and inundation mapping since they are more resistant to multicollinearity, they are able to capture nonlinear interactions, and relatively low amounts of data are required (Mosavi et al., 2018). Gradient-boosting models have been shown to have superior performances compared to bagging-based classifiers in complicated urban flood conditions (Shen et al., 2021).
-
Random Forest (RF) as an ensemble model with a baseline.
-
XGBoost (XGB) with grid search hyperparameter optimization.
-
RF-XGB ensemble model which averages probabilities to make predictions.
Accuracy, precision, recall, F1-score and the AUC are used as evaluation measures on model performance. AUC is highlighted as an independent measure that is threshold-insensitive to measure discriminatory power. Also, the ablation experiments are carried out to determine the contribution of hydrologic predictors (REM and RNI). The test of statistical significance is the fourth element. The DeLong test is used to determine whether the model discrimination performance differences are statistically significant by comparing the AUCs to competing classifiers. The DeLong test is a non-parametric test which is commonly employed in comparing differences between correlated Receiver Operating Characteristic (ROC) curves of a common test data.
The level of statistical significance is tested at the level of 95 percent confidence (a=0.05). The changes in AUC are said to be statistically significant when the p-value associated is below 0.05. This analysis will make performance increases reported not due to random variability in the test samples.
The whole process of preprocessing and models is done based on open access datasets and reproducible workflows to enable transference to other flood-prone regions of a city.
This section presents a comprehensive evaluation of the proposed framework through quantitative performance assessment, statistical significance testing, hydrologic enhancement analysis, and spatial consistency evaluation. The results are interpreted in the context of urban flood dynamics and compared with existing flood mapping approaches reported in recent literature.
5.1 Performance Analysis
Table 4 illustrates the performance of evaluated models based on the performance parameters like, accuracy, precision, recall, F1 score and AUC. Among 3 classifiers mentioned in table 4, the tuned XGBoost model achieved the highest overall accuracy (71.7 %) and AUC (0.803), marginally outperforming Random Forest (AUC = 0.796) and the ensemble configuration (AUC = 0.794).
Table 4Model performance metrics. The bold values highlight the highest accuracy and AUC achieved by the tuned XGBoost model.

The superior performance of the tuned XGBoost model can be attributed to its ability to model complex nonlinear interactions among multi-sensor predictors while effectively handling feature heterogeneity and collinearity. The observed AUC difference was statistically significant for the evaluated comparison, although the magnitude of the improvement was moderate and indicates enhanced discriminatory capability in separating flooded and non-flooded pixels, which is critical for operational flood mapping applications.
Figure 3 shows the ROC curves of the assessed machine learning classifiers demonstrating the relative performance of the all three classifiers in discriminating between flooded and non-flooded pixels at different decision thresholds.
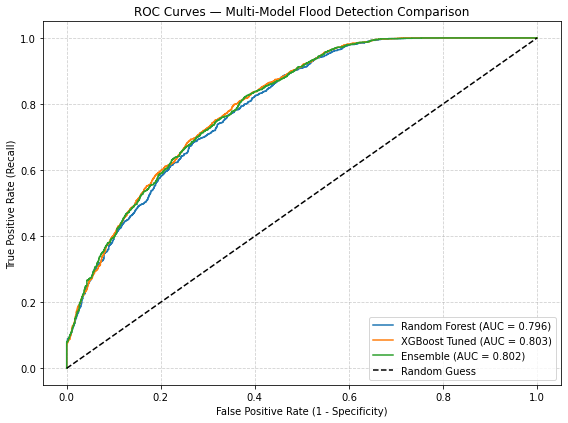
Figure 3ROC curves for flood inundation classification using different machine learning models.
XGBoost model has the largest value of area under the curve (AUC = 0.803), as compared to the Ensemble and the Random Forest classifier. The regular difference between the ROC curves suggests the enhanced classification strength in the case of hydrologic-topographic predictors. The statistical comparison between the two models based on the DeLong test shows that the positive change in AUC due to hydrologically improved XGBoost model is significant at the 95 percent level.
The success of this classification is in line with the results of recent studies of urban flood mapping using multi-sensor satellite data and machine learning, in which the reported AUCs have a range of 0.75 to 0.85 based on urban complexity and the availability of data (Islam et al., 2025; Islam et al., 2025; Chini et al., 2017; Shen et al., 2021).
The focus of statistical testing was to test the added value of the hydrologic-topographic predictors, even though the best performing model was XGBoost (AUC 0.803). The DeLong test results showed that adding REM and RNI to the reduced predictor configurations had a significant increase in model discrimination.
By comparison, there are no statistically significant differences between the ensemble model and single classifiers (p>0.05), indicating that probability averaging is not offering any added discriminatory advantage to tuned XGBoost model. These results support the use of the tuned XGBoost configuration within the evaluated framework
5.2 Hydrologic Enhancement Impact
Table 5 gives the ablation analysis which is done to estimate the contribution of hydrologic-topographic predictors to the model performance. The XGBoost classifier is found to have an AUC of 0.77 when the Relative Elevation Model (REM) and Rainfall Normalized Index (RNI) are omitted, which is the performance of a traditional SAR-optical feature set. Adding in REM and RNI led to the boost in AUC to 0.803, and overall improvement in accuracy of 0.69 to 0.717, or a relative improvement of about 5–6 % in AUC. This was observed to improve the discriminatory capability upon the inclusion of hydrologic-topographic predictors and this is in line with the findings reported in current literature indicating the significance of terrain-guided variables in improving physical consistency and predictive robustness of the ML-based flood models (Samanta et al., 2018; Khosravi et al., 2019; Jung et al., 2023). The assessment of the hydrologically enhanced framework using statistics showed that it was significantly better at discrimination. Comparing the Full Model with the NoREM configuration resulted in a p value of 3.97 × 10⁻⁶ and a p value of 2.37 × 10⁻⁴ when compared with the Default Predictor Set, indicating that hydrologic predictors were important. Figure 4 shows the input predictors of the relative contribution to flood inundation classification based on the XGBoost model. Among the most important variables, hydrologic-topographic variables, especially the Relative Elevation Model (REM) and Rainfall Normalized Index (RNI) are primarily crucial because they enhance the discrimination of the models in comparison to traditional spectral and SAR predictors.
Table 5Ablation analysis of hydrologic–topographic predictors. The bold-highlighted values indicate the improved performance obtained after inclusion of the hydrologic–topographic predictors (REM and RNI), compared with the corresponding reduced predictor configuration.

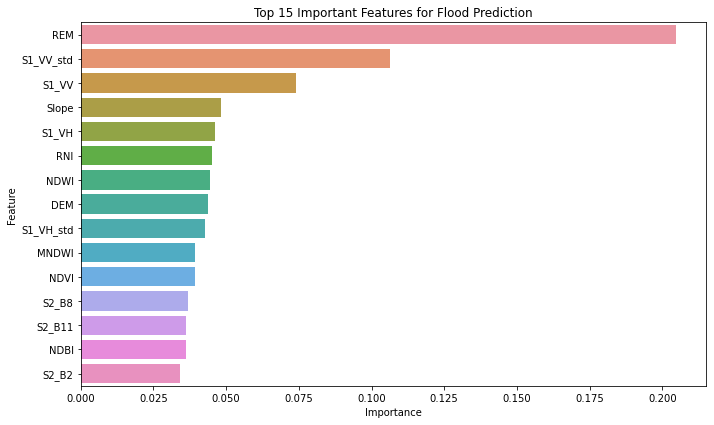
Radar backscatter characteristics and optical water indices also have significant significance, and this implies that they are sensitive to the dynamics of urban surface water. The significance of terrain-guided variables highlights the importance of the inclusion of physically significant hydrologic context into data-driven flood mapping systems to build strength and interpretability. The recent literature with progressively growing importance on the need to include terrain and hydrologic context in data-based flood mapping models in order to enhance physical consistency and generalization in diverse urban landscapes (Islam et al., 2025; Sharif et al., 2023).
5.3 Spatial Consistency and Flood Pattern Analysis
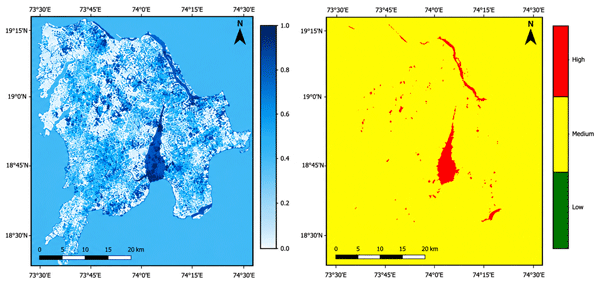
Following the analysis of the spatial consistency issue, it is essential to examine the flood pattern analysis problem too. In Fig. 5, the spatial distribution of the predicted probability of flood and its resulting inundation extent of the hydrologically enhanced XGBoost model are shown. The likelihood of high floods is mostly prevalent along the major drainage systems and low-lying coastal and riverine areas especially in areas near the Mithi River and other related floodplains. (Abedi et al., 2023; Jung et al., 2023) Inundation patterns predicted by the model are localized along major drainage corridors, river adjacent floodplains and low lying areas, suggesting a hydrologically plausible flood behavior is being captured by the model.The fact that the values of the flood probability change smoothly also implies that there is stable model behavior in heterogeneous urban landscapes.
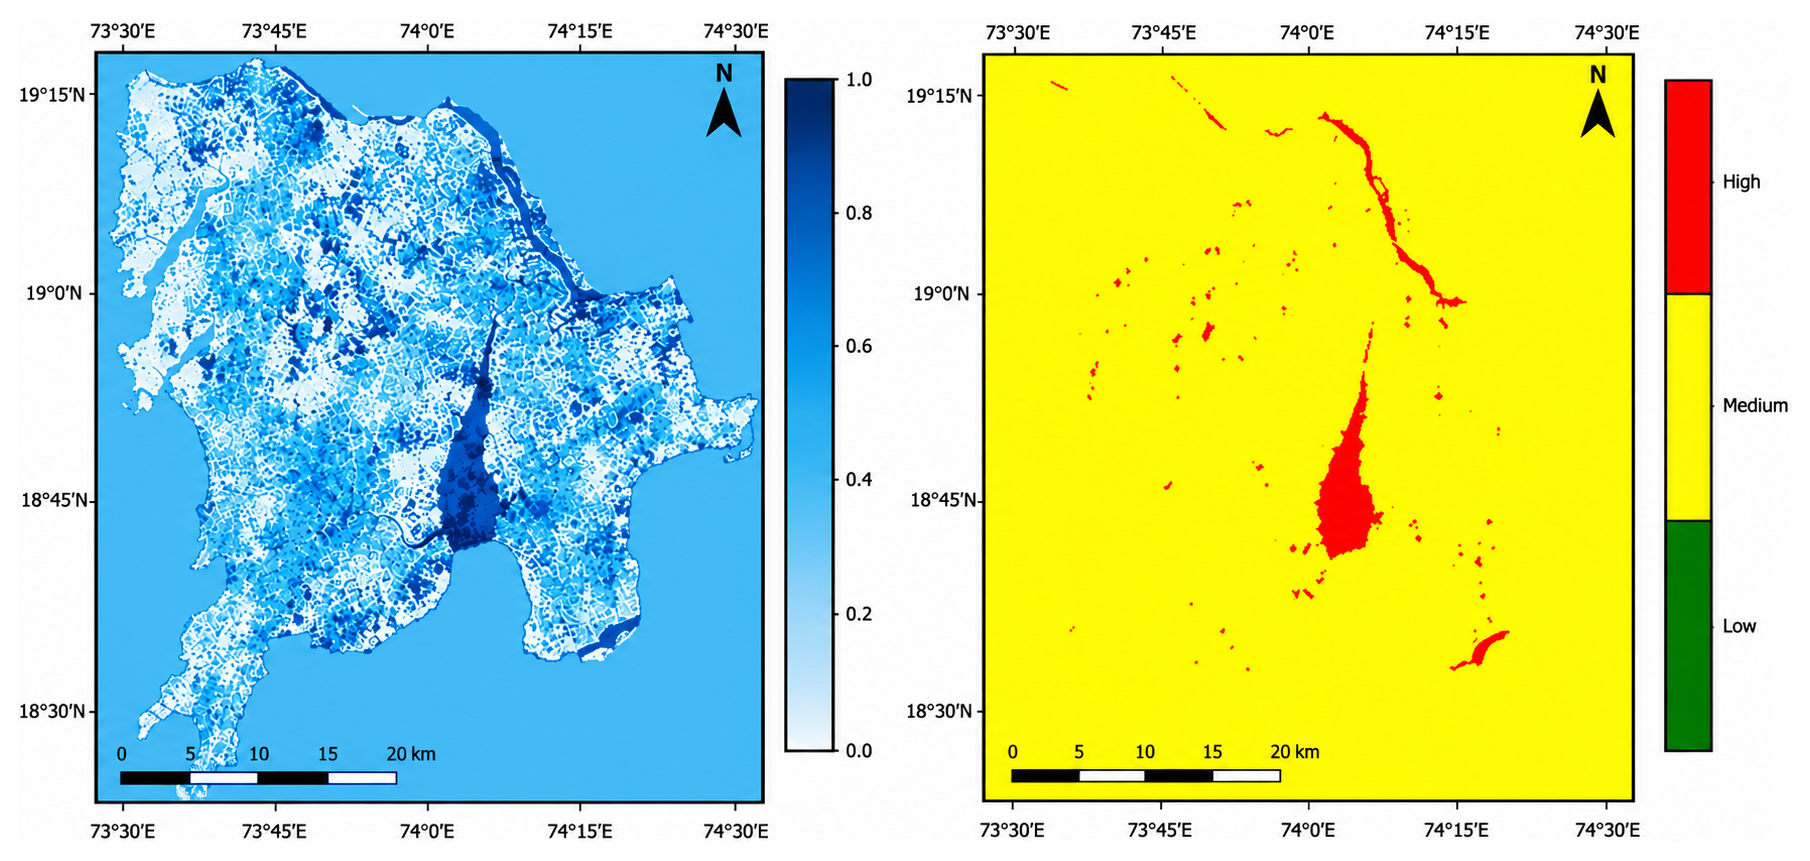
Figure 5Spatial distribution of predicted flood probability and inundation extent for the Mumbai metropolitan region.
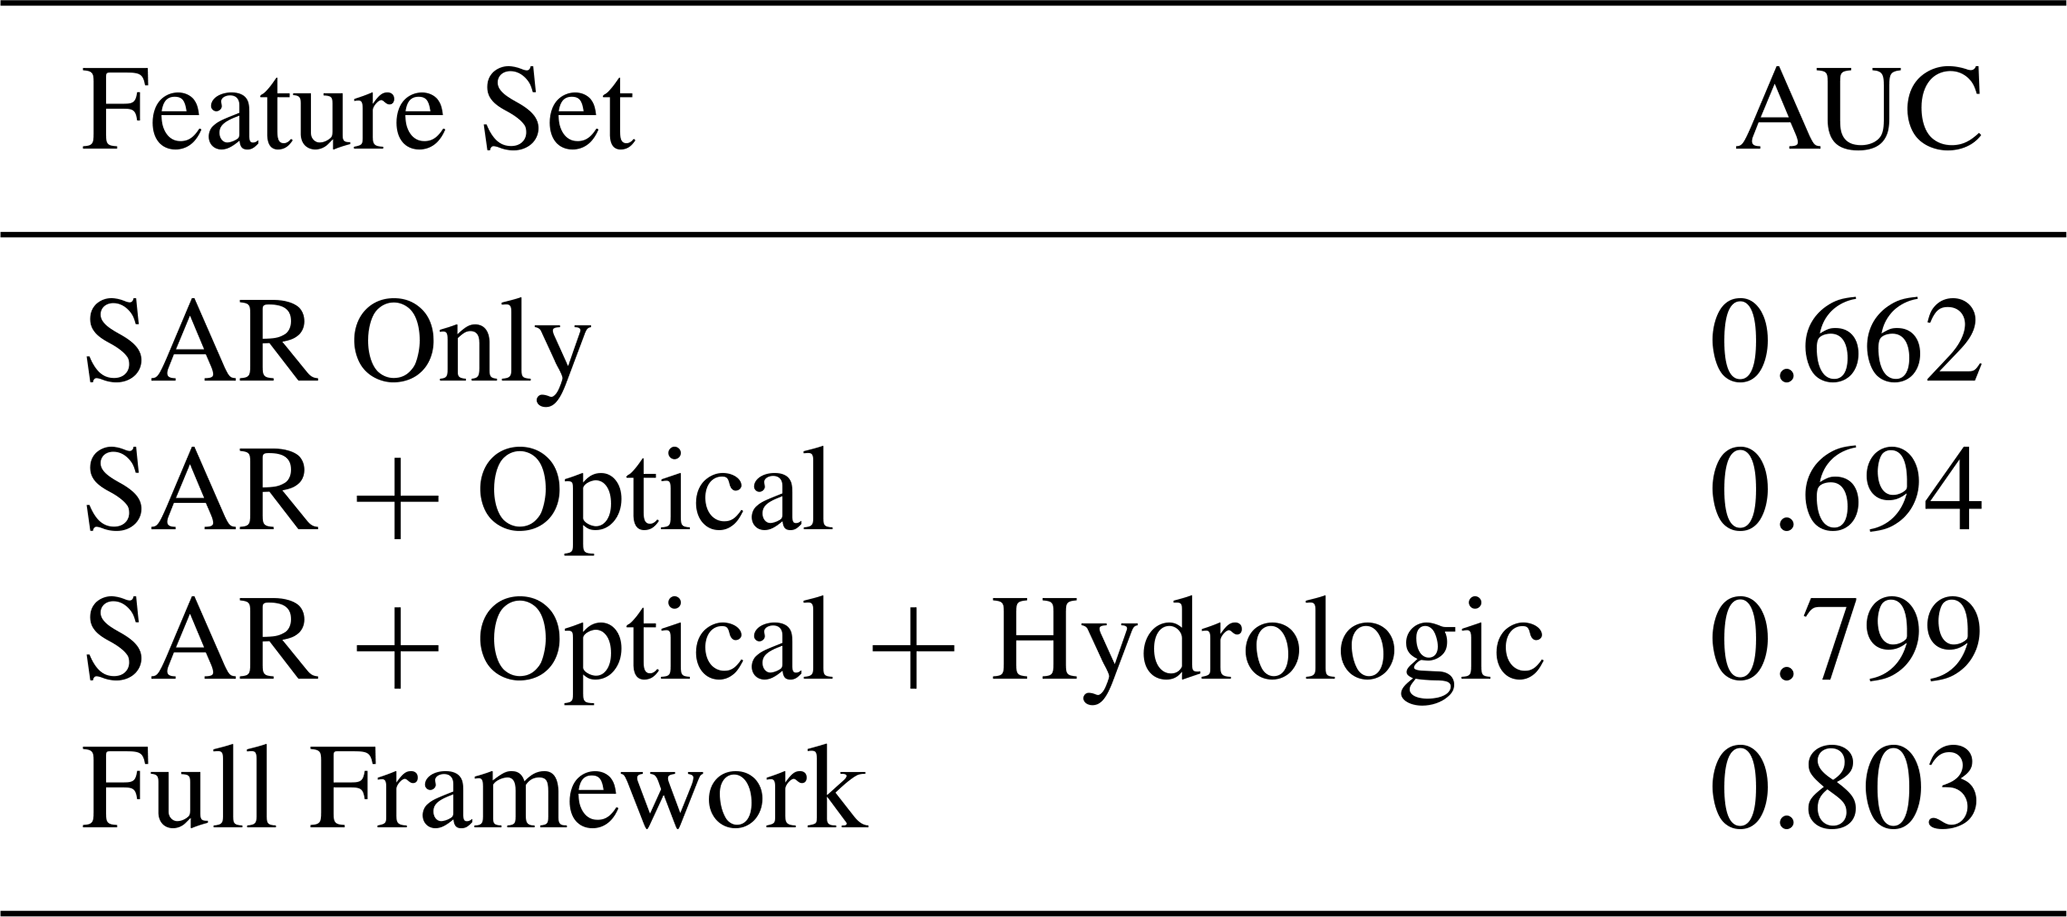
The results from feature ablation analysis showed that the model discrimination was significantly enhanced by adding hydrologic predictors, with AUC increasing from around 0.66 for SAR-only predictions to around 0.80 for prediction using the entire hydrologic predictor framework.
5.4 Feature Ablation Analysis
The contribution of each predictor group to the classification of floods is shown in Table 6. The best improvement is seen with the addition of the hydrologic predictor (REM and RNI), which means the information contained in terrain-induced flood accumulation and rainfall-conditioned wetness is valuable in addition to the information contained in the spectral and radar observations.
Table 6Feature ablation analysis showing the contribution of different predictor groups to model performance.
5.5 Sample Size Sensitivity Analysis
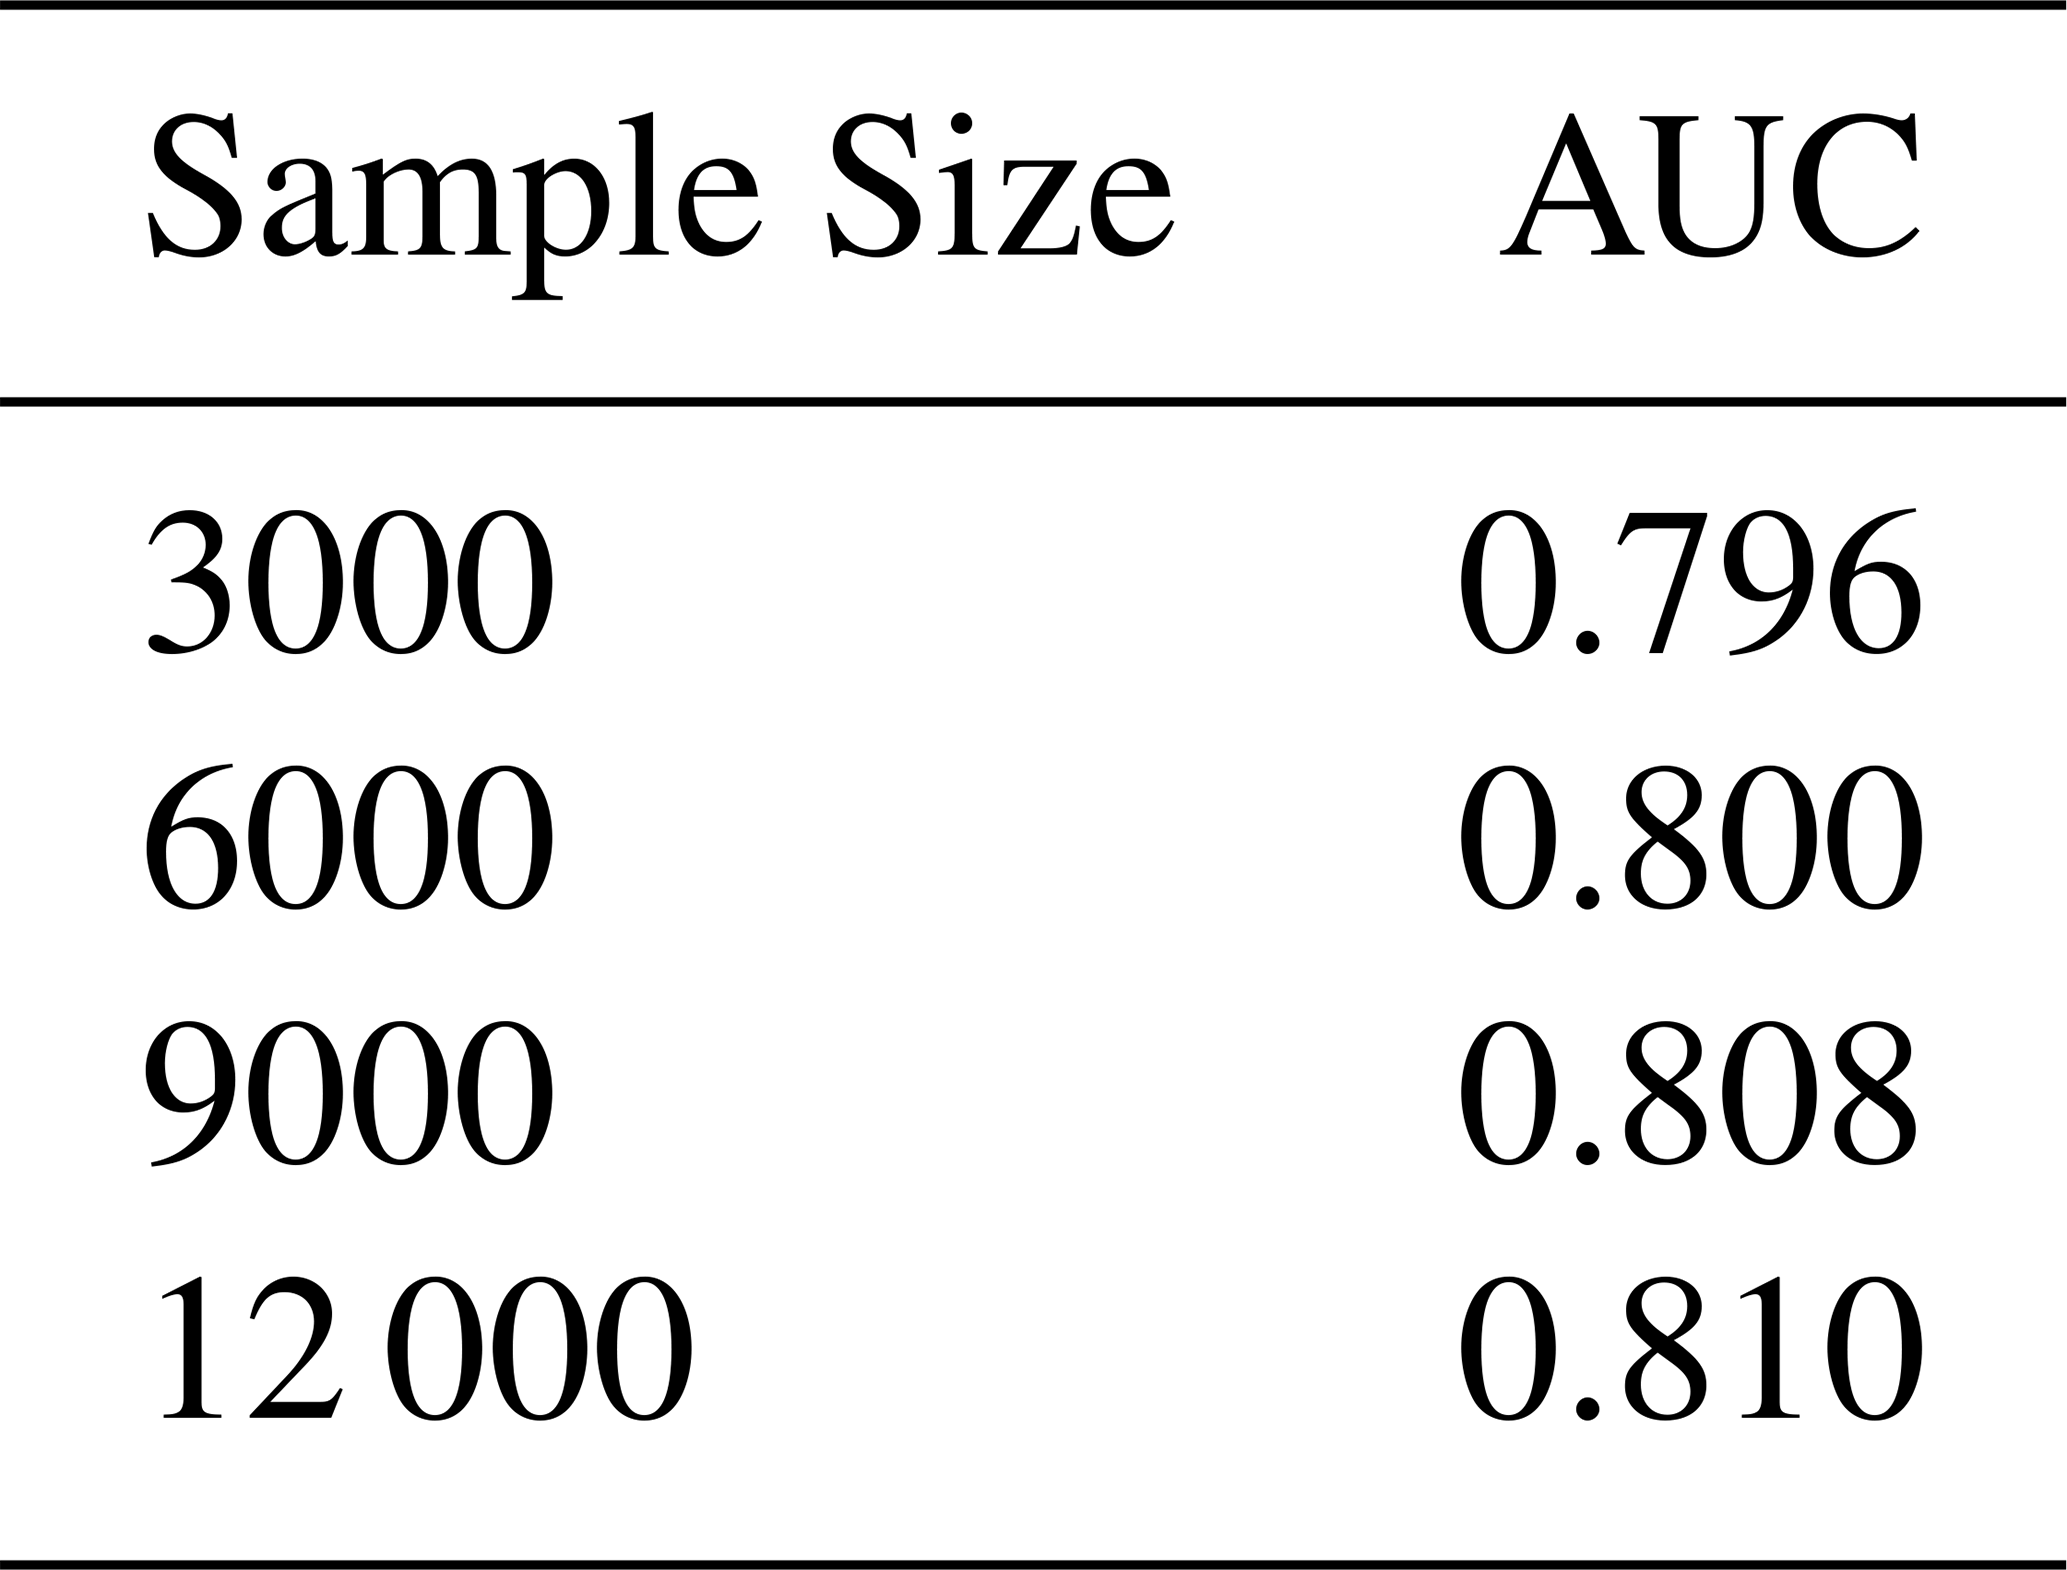
In Table 7 the stability of the model performance is assessed for different training sample sizes. The relatively low ranges of the AUC values suggest that the proposed framework is robust and less dependent on the particular setting of sample sizes.
Table 7Sample-size sensitivity analysis of the XGBoost flood mapping model.
5.6 Cross-Validation Stability
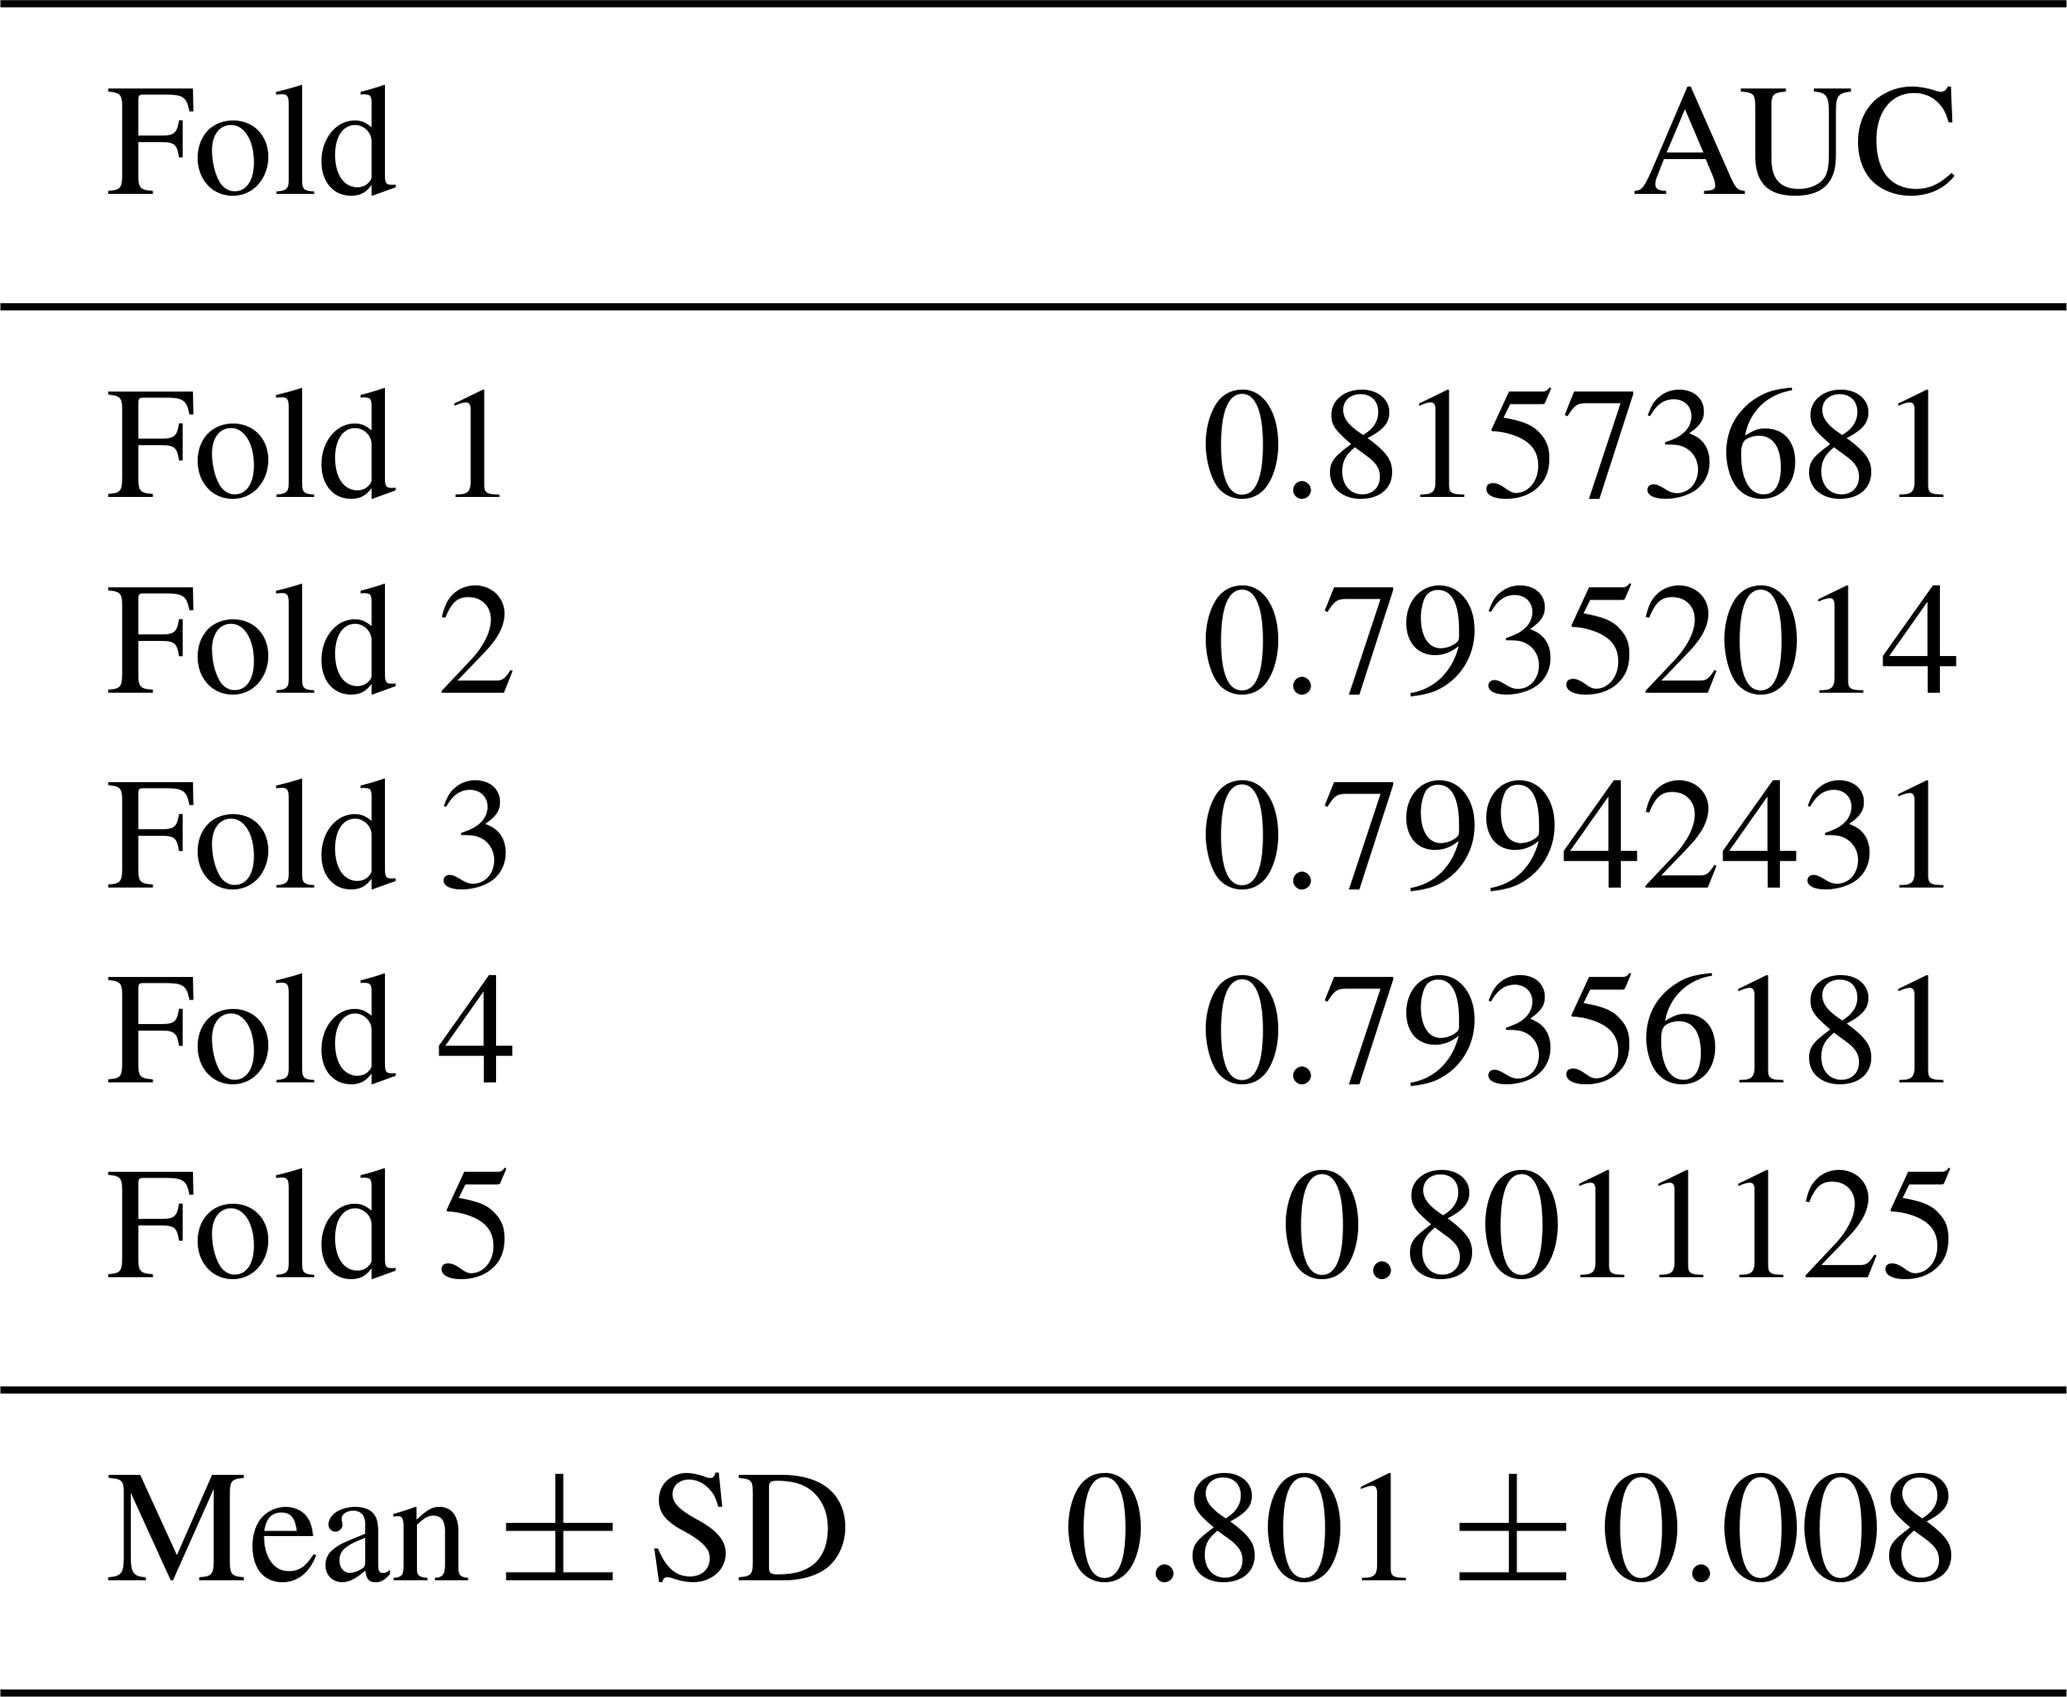
The results of cross validation to evaluate the stability of model performance across different data partitions which are presented in Table 8. The mean of the five-fold cross validation results was 0.801 ± 0.008, which showed stable model behavior and small sensitivity to model partitioning.
Table 8Five-fold cross-validation performance statistics for the XGBoost model.
5.7 Statistical Assessment of Hydrologic Predictor Contribution
Statistically comparing the full predictor framework and reduced predictor configurations was used to quantify the contribution of hydrologic predictors. Comparing the Full Model to the NoREM Model resulted in a very strong difference (), with exclusion of the Relative Elevation Model significantly decreasing predictive performance. Likewise, the difference between the Full Model and Default Predictor Set was also statistically significant (). The results of effect size analysis also showed high values of Cohen's d, which indicated very large practical effects (Table 9). The outcomes of this research highlight the significant hydrologic-topographic predictors in flood discrimination capabilities in addition to the traditional remote sensing predictors.
Table 9Statistical significance of hydrologic-topographic enhancement based on feature ablation experiments.

The Cohen's d values of 15.65 and 5.58 suggest very large practical effects, indicating that the hydrologic-topographic predictors have a significant role in classification performance beyond a statistical significance.
5.8 Qualitative Comparison with Documented Flood-Prone Locations
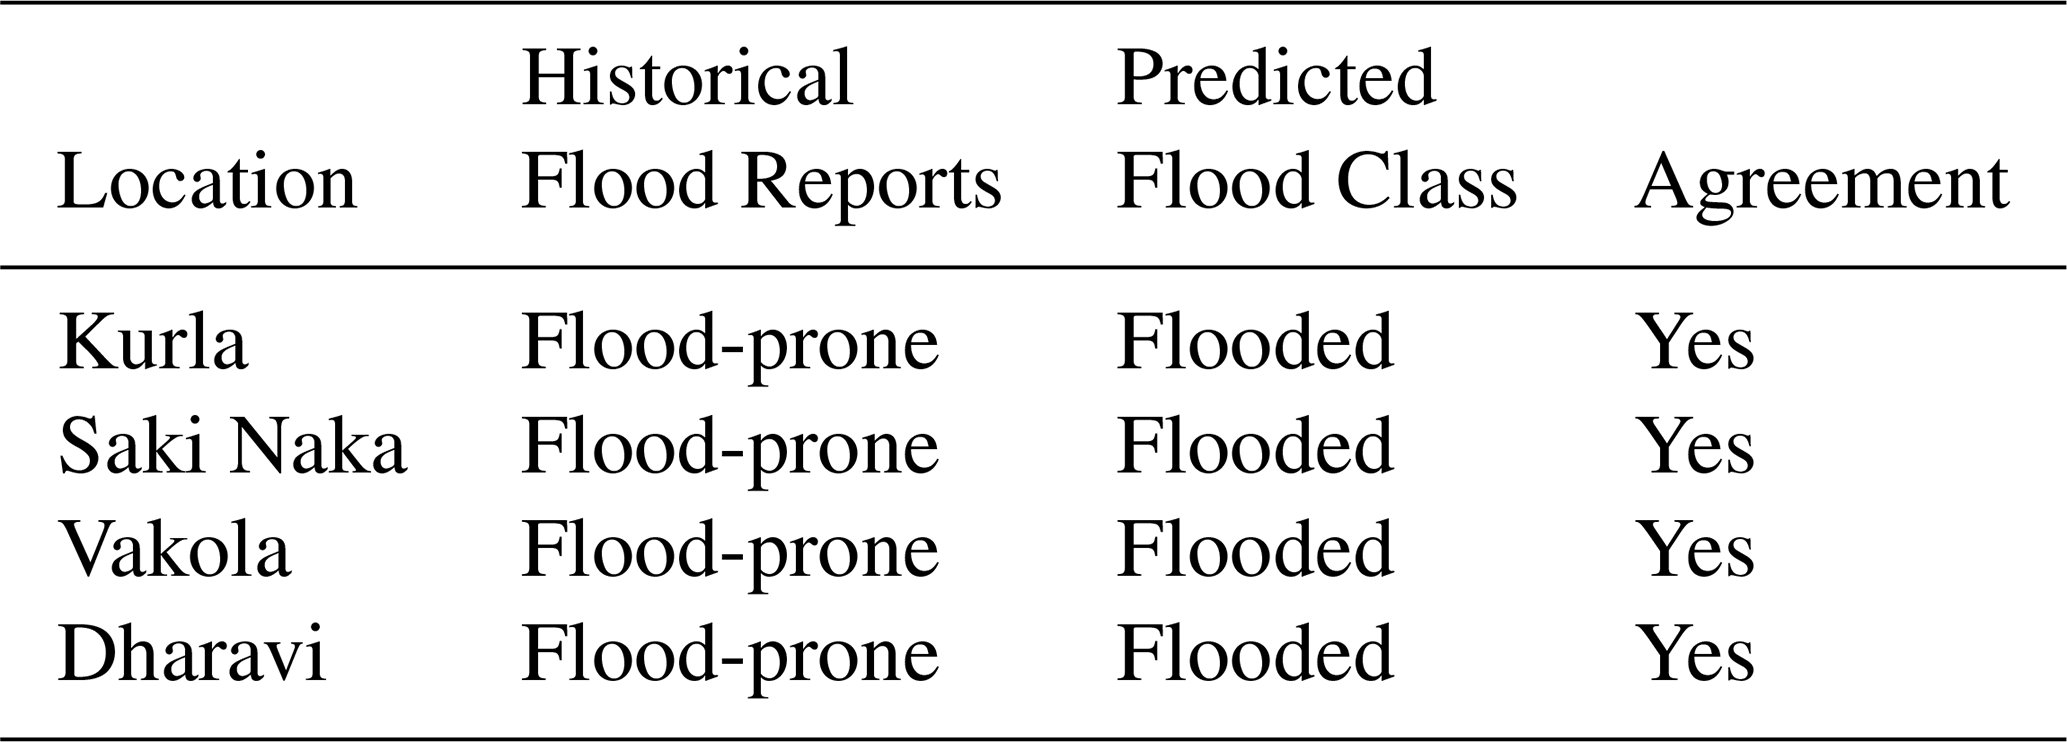
Model-based flood-prone locations are compared with documented flood-prone locations reported by municipal agencies and previous studies in Table 10. This comparison provides qualitative spatial evidence that the predicted flood-prone areas are consistent with locations that have been historically reported as vulnerable to flooding. However, this comparison does not constitute independent quantitative validation of the predicted flood extent because an independent, spatially explicit flood inventory was not available for the study event.
Table 10Qualitative comparison of predicted flood-prone locations with documented flood-prone areas in Mumbai.
5.9 Discussion and Limitations
The results indicate that integrating hydrologic–topographic information can enhance model discrimination and physical interpretability within the evaluated Mumbai study setting. However, because the analysis is based on a single monsoon season and consensus-derived labels, generalization across heterogeneous urban landscapes remains to be established through multi-event and independent validation.
Table 11 is a comparison of the performance of the proposed framework with the representative flood inundation mapping techniques that are published over the recent literature. Although in full data-rich environments, deep learning models tend to be more accurate in their classification, they need large amounts of labeled data and have low levels of interpretability (Sharif et al., 2023; Shen et al., 2021). Similar accuracy can be achieved with SAR-based and optical ML approaches, which are often unable to work in complicated urban settings because of signal ambiguity. Values summarised in Table 11 give contextual comparison with selected studies, but the difference in study area, data, label-generation methods, spatial resolution and evaluation methods mean that no performance ranking is possible across studies. The proposed framework in this document does not as such demonstrate superiority over existing frameworks, but rather represents an alternative to them based on data.
Table 11Performance comparison with existing flood mapping studies.

NA: not available.
However, the research is constrained by the scope of the study that is based on a single monsoon cycle and is derived by labeling according to consensus as opposed to direct ground observations. Further validation of models by time should be established over several events of floods and more validation datasets should be used in future work to further test the model generalizability.
The relative elevation emerged as one of the most influential predictors because it directly affects the accumulation of gravitational water in urban terrain and flood persistence. Likewise, RNI was able to record the surface wetness associated with rainfall and added value to the SAR backscatter and optical indices. Removing these predictors resulted in a marked reduction in model performance, further indicating their contribution to predictive discrimination and physical interpretability.
Several limitations should be acknowledged. The flood inventory was generated using a multi-sensor consensus framework rather than direct field observations. Although the approach reduces individual sensor uncertainty, some classification errors may persist in densely urbanized environments. In addition, the 30 m spatial resolution may not fully capture fine-scale drainage pathways and localized inundation patterns. Future studies should incorporate higher-resolution DEMs, UAV observations, and municipal flood inventories to further improve validation and operational applicability.
This proposed plan is computationally efficient since all the generation steps of the predictors can be carried out within cloud-based geospatial platforms like Google Earth Engine. This allows for the quick mapping of flood events without the need for extensive calibration as would be required for hydrodynamic models, and hence the framework is appropriate for operational flood monitoring for data-poor urban areas.
This study developed a hydrologically enhanced machine learning framework for urban flood inundation mapping by integrating multi-sensor satellite observations with physically meaningful hydrologic-topographic predictors. The proposed workflow integrates large-scale geospatial processing in Google Earth Engine with supervised machine learning implemented in Python, providing a reproducible and computationally scalable framework with potential for future operational applications, subject to independent validation.
Results from the Mumbai Metropolitan Region demonstrated that tree-based machine learning models can effectively capture the nonlinear relationships among SAR backscatter, optical water indices, terrain characteristics, and rainfall information. Among the evaluated classifiers, the optimized XGBoost model yielded the highest performance among the evaluated configurations, with an overall accuracy of 71.7 % and an AUC of 0.803.
The inclusion of hydrologic-topographic predictors substantially improved model discrimination, increasing the AUC from approximately 0.66 for SAR-only predictors to approximately 0.80 for the complete predictor framework. Statistical evaluation using the DeLong test confirmed that these improvements were significant at the 95 % confidence level.
This study addresses an important gap between data-driven flood mapping approaches and physically informed hydrologic reasoning by explicitly incorporating hydrologic-topographic conditioning within a machine learning framework. The Relative Elevation Model (REM) and Rainfall-Normalized Index (RNI) provided valuable predictive information beyond conventional radar- and optical-derived predictors. Furthermore, the resulting flood maps exhibited hydrologically plausible spatial patterns that were consistent with major drainage corridors and low-lying areas across the study region. However, several caveats should be noted.
The flood inventory was generated using a multi-sensor consensus approach, and the analysis was limited to a single monsoon season. The use of this method is suitable for urban areas where data is limited, but future research should incorporate independent validation datasets, multi-event assessments, and higher-resolution topographic data, to further test the transferability and robustness of the models under different hydrological conditions.
Overall, the proposed framework demonstrates that integrating hydrologically informed predictors with multi-sensor remote sensing observations can improve both urban flood prediction and the physical interpretability of machine learning models. The framework provides a foundation for further exploration of operational flood monitoring applications, with its computational scalability and reproducible workflow, subject to independent validation in the future for new flood events and flood data.
Future research should expand the proposed framework to make it more robust, generalizable and practically applicable. First, the methodology should be tested over several monsoon seasons and flood events to determine its temporal stability and transferability under varying hydrometeorological conditions.
Second, the incorporation of near real-time and forecast-based precipitation products should be investigated to facilitate dynamic flood susceptibility assessment and early-warning applications. The framework, when combined with short-range rainfall forecasts, could enhance the lead time for urban flood preparedness, emergency response, and risk mitigation.
Third, future research should investigate spatially explicit deep learning models, such as convolutional neural networks (CNNs) and encoder–decoder models like U-Net, which can better capture spatial context and neighborhood interactions that are not explicitly represented in pixel-based classifiers. These methods may help to better define complex urban inundation patterns and further improve predictive performance.
Fourth, the proposed data-driven framework could be coupled with physics-based hydrodynamic models for flood-depth estimation and inundation-volume assessment. Hybrid modeling methods that integrate physically interpretable models with data-driven machine learning methods may offer more robust assistance for infrastructure planning, scenario analysis, and climate resilience evaluation.
Lastly, future research should focus on uncertainty quantification and model explainability by integrating probabilistic predictions, confidence mapping, and explainable artificial intelligence (XAI) methods. These would improve transparency, boost user confidence in model products, and enable the incorporation of machine-learning products into operational decision-support systems.
These developments would contribute to the scientific strength and applicability of hydrologically-informed machine learning tools for urban flood monitoring and flood-risk management in rapidly urbanizing settings.
All datasets used in this study are open access. The processed datasets, hydrologic-topographic predictors, machine-learning training data, and consensus-derived flood labels are publicly accessible through Zenodo at: https://doi.org/10.5281/zenodo.18486214 (Pawar and Phade, 2026) under the Creative Commons Attribution (CC-BY 4.0) licence. The analysis was implemented using Google Earth Engine and Python. The code used for preprocessing, feature generation, model development, and evaluation is available from the authors upon reasonable request.
Ankush Pawar conceptualized the study, conducted data processing, model development, analysis, and manuscript drafting. Gayatri Phade supervised the research, contributed to methodological refinement, interpretation of results, and manuscript review and editing. Both authors approved the final manuscript.
The contact author has declared that none of the authors has any competing interests.
Publisher's note: Copernicus Publications remains neutral with regard to jurisdictional claims made in the text, published maps, institutional affiliations, or any other geographical representation in this paper. The authors bear the ultimate responsibility for providing appropriate place names. Views expressed in the text are those of the authors and do not necessarily reflect the views of the publisher.
The authors also mention the European Space Agency (ESA) that manages to deliver Sentinel-1 and Sentinel-2 data in the Copernicus Programme. We also note the SRTM Digital Elevation Model provided by the United States Geological Survey (USGS) and the Climate Hazards Group of the precipitation dataset provided in the CHIRPS. Geospatial processing in large scale was carried out using Google Earth Engine.
This paper was edited by Leonard K. Amekudzi and reviewed by five anonymous referees.
Abedi, R., Costache, R., and Pradhan, B.: Urban flood hazard mapping using machine learning and geospatial big data, Sustain. Cities Soc., 91, 104416, 2023.
Amitrano, D., Di Martino, G., Guida, R., Iervolino, P., Iodice, A., Papa, M. N., Riccio, D., and Ruello, G.: Earth Environmental Monitoring Using Multi-Temporal Synthetic Aperture Radar: A Critical Review of Selected Applications, Remote Sensing, 13, 604, https://doi.org/10.3390/rs13040604, 2021.
Chini, M., Hostache, R., Giustarini, L., and Matgen, P.: A Hierarchical Split-Based Approach for Parametric Thresholding of SAR Images: Flood Inundation as a Test Case, IEEE T. Geosci. Remote, 55, 6975–6988, https://doi.org/10.1109/TGRS.2017.2737664, 2017.
Choné, J. C., Biron, P. M., Buffin-Bélanger, T., Mazgareanu, I., Neal, J. C., and Sampson, C. C.: An assessment of large-scale flood modelling based on LiDAR data, Hydrol. Process., 35, e14333, https://doi.org/10.1002/hyp.14333, 2021.
Islam, T., Zeleke, E. B., Afroz, M., and Melesse, A. M.: A systematic review of urban flood susceptibility mapping: remote sensing, machine learning, and other modeling approaches, Remote Sens., 17, 524, https://doi.org/10.3390/rs17030524, 2025.
Jung, Y., Merwade, V., and Kim, S.: Operational flood mapping using explainable machine learning and satellite data, Environ. Model. Softw., 164, 105670, 2023.
Khosravi, K., Shahabi, H., Pham, B. T., Adamowski, J., Shirzadi, A., Pradhan, B., Dou, J., Ly, H.-B., Gróf, G., Ho, H. L., Hong, H., Chapi, K., and Prakash, I.: A comparative assessment of flood susceptibility modeling using Multi-Criteria Decision-Making Analysis and Machine Learning Methods, J. Hydrol., 573, 311–323, https://doi.org/10.1016/j.jhydrol.2019.03.073, 2019.
Li, L., Woodley, A., and Chappell, T.: Mapping Urban Floods via Spectral Indices and Machine Learning Algorithms, Sustainability, 16, 2493, https://doi.org/10.3390/su16062493, 2024.
Mosavi, A., Ozturk, P., and Chau, K. W.: Flood prediction using machine learning models: Literature review, Water, 10, 1536, https://doi.org/10.3390/w10111536, 2018.
Pawar, A. and Phade, G.: Data for hydrologic–topographic enhanced machine learning for urban flood inundation mapping, Zenodo [data set], https://doi.org/10.5281/zenodo.18486214, 2026.
Samanta, S., Pal, D. K., and Palsamanta, B.: Flood susceptibility analysis through remote sensing, GIS and frequency ratio model, Appl. Water Sci., 8, 66, https://doi.org/10.1007/s13201-018-0710-1, 2018.
Sharif, M., Heidari, S., and Hosseini, S. M.: MAPPING OF URBAN FLOOD INUNDATION USING 3D DIGITAL SURFACE MODEL AND SENTINEL-1 IMAGES, ISPRS Ann. Photogramm. Remote Sens. Spatial Inf. Sci., X-4/W1-2022, 715–720, https://doi.org/10.5194/isprs-annals-X-4-W1-2022-715-2023, 2023.
Shen, X., Wang, D., and Hong, Y.: Urban flood mapping using multi-source remote sensing and machine learning approaches, ISPRS J. Photogramm. Remote Sens., 178, 21–37, 2021.
Teng, J., Jakeman, A. J., Vaze, J., Croke, B. F. W., Dutta, D., and Kim, S.: Flood inundation modelling: A review of methods, recent advances and uncertainty analysis, Environ. Model. Softw., 90, 201–216, 2017.
Twele, A., Cao, W., Plank, S., and Martinis, S.: Sentinel-1-based flood mapping: a fully automated processing chain, Int. J. Remote Sens., 37, 2990–3004, https://doi.org/10.1080/01431161.2016.1192304, 2016.
Vongkusolkit, J., Peng, B., Wu, M., Huang, Q., and Andresen, C. G.: Near real-time flood mapping with weakly supervised machine learning, Remote Sens., 15, 3263, https://doi.org/10.3390/rs15133263, 2023.