
the Creative Commons Attribution 4.0 License.
the Creative Commons Attribution 4.0 License.
 | 19 Oct 2026
Application of radar remote sensing for cyclone damage mapping in Bangladesh: a coherence-based approach
Shadmin Islam Prova
Md. Shahoriar Sarker

Rosdania Islam
Ridad Ibne Mahfuz
Rapid and reliable assessment of cyclone-induced damage remains a major challenge in coastal regions where cloud cover and limited accessibility constrain conventional approaches. This study presents a coherence-based Synthetic Aperture Radar (SAR) framework for identifying and quantifying cyclone-induced surface changes in the coastal districts of Bangladesh. Multi-temporal Sentinel-1 data were analyzed using interferometric coherence to capture spatial and temporal variations associated with five major cyclones: Amphan (2020), Sitrang (2022), Mocha (2023), Hamoon (2023), and Remal (2024). A time-series approach incorporating multiple pre-, during-, and post-event image pairs was implemented to distinguish cyclone-driven changes from natural surface variability and to improve detection reliability. The results reveal a consistent decline in coherence during cyclone events, followed by gradual recovery. Spatial analysis indicates that areas of significant coherence loss correspond to zones affected by flooding, vegetation damage, and structural disruption. Estimated damage extents varied across cyclones, with Remal (2024) showing the largest affected area (∼ 601 km2), followed by Mocha (∼ 474 km2), Amphan (∼ 288 km2), Sitrang (∼ 122 km2), and Hamoon (∼ 117 km2). Validation using field observations and secondary data yielded an overall classification accuracy of 94 %, confirming the robustness of the coherence-based approach. Complementary inundation mapping further demonstrated that coherence captures a broader spectrum of cyclone impacts beyond flood extent alone, including wind-induced damage and geomorphic changes. This study establishes multi-temporal SAR coherence analysis as a scalable, cloud-independent, and operationally effective tool for rapid post-cyclone damage assessment. The proposed framework enhances the reliability of disaster monitoring in complex coastal environments and offers strong potential for integration into near-real-time disaster response systems. Future research should focus on integrating multi-sensor datasets and long-term coherence time series to refine damage characterization and reduce uncertainty.
- Article
(8667 KB) - Full-text XML
- BibTeX
- EndNote


Tropical cyclones are among the most significant geophysical causes of loss of life and property damage, resulting in widespread casualties (Emanuel, 1987). Bangladesh, located along the northern coast of the Bay of Bengal, is particularly vulnerable due to its low-lying topography, dense population, and frequent cyclone landfalls. Over the past decade, Bangladesh has experienced two of the most devastating cyclones in its recent history (Islam and Peterson, 2009), while on average about four tropical cyclones and one flood-season event occur each year (Saha and Khan, 2014). In 2021, climate-related disasters led to economic losses estimated at USD 11.3 billion, accounting for approximately 2.47 % of the country's GDP (WMO, 2022; Ministry of Environment, Forest and Climate Change, 2022). Rapid, reliable, and near-real-time damage assessment that delivers continuous information is essential for effective disaster monitoring, emergency response, and long-term resilience planning (Al Shafian and Hu, 2024).
The integration of GIS with remote sensing supports land-use-based damage interpretation. Remote sensing data enable rapid post-disaster information acquisition by characterizing spatial phenomena and providing concerned national stakeholders and scientists with objective data for informed decision-making (Ge et al., 2019; Washaya and Balz, 2018). Conventional post-cyclone damage assessment methods, such as optical satellite imagery and ground-based surveys, are often hampered by cloud cover, adverse weather, and logistical constraints. Previous cyclone damage assessments have relied predominantly on optical satellite imagery (Landsat, Sentinel-2), sometimes supplemented with multi-sensor data for land-use and land-cover (LULC) analysis (Tazneen et al., 2021; Salman et al., 2024). However, some persistent challenges remain in field validation, classification uncertainty, and the timely updating of hazard maps (Uddin and Matin, 2021). Optical imagery, especially near-nadir acquisition, often fails to detect wall damage in buildings with intact roofs, as it mainly captures roof condition and nearby debris rather than wall status. Synthetic Aperture Radar (SAR) provides a powerful alternative as it operates independently of weather and lighting conditions. Its ability to penetrate cloud cover and acquire data continuously makes it particularly suitable for monitoring cyclone-affected regions (Olen and Bookhagen, 2018; Bürgmann et al., 2000). The advantage of SAR lies in the use of phase differences in interferometric analysis. The SAR interferometric phase can reveal damage in seemingly intact buildings, though visibility is strongly affected by side-looking geometry, layover, and shadowing (Plank, 2014). Among SAR-based techniques, Interferometric SAR (InSAR) coherence, defined as the correlation between two complex SAR images analyzed through phase variation acquired at different times, has emerged as an effective approach for detecting surface changes by measuring the similarity between radar signals acquired at different times (Touzi et al., 1999; Bürgmann et al., 2000). It is particularly beneficial for evaluating natural hazards associated with heavy precipitation, such as cyclone-induced, seasonal, and rainfall-induced floods, particularly in regions where persistent cloud cover limits the effectiveness of optical satellite imagery (Tralli et al., 2005). Changes in land surface properties such as vegetation disturbance, structural damage, or flooding led to a reduction in coherence, allowing for spatial identification of affected areas. Previous studies have applied SAR-based change detection using different approaches, including intensity-based, coherence-based, and integrated multi-sensor methods (Ge et al., 2020). While optical datasets such as Landsat and Sentinel-2 remain widely used for large-scale damage assessment, their effectiveness is limited in cyclone-prone regions due to persistent cloud cover and revisit constraints (Tazneen et al., 2021; Salman et al., 2024).
The availability of Sentinel-1 SAR data has significantly improved the potential for operational damage assessment. With its C-band radar, near-global coverage, and short revisit interval, Sentinel-1 enables the construction of multi-temporal coherence time series for continuous monitoring (Torres et al., 2012). By analyzing coherence variations over time, it becomes possible to characterize baseline surface conditions and identify statistically significant deviations associated with extreme events. This approach reduces false detections and enhances the reliability of change identification, particularly in dynamic coastal environments. Despite these advancements, several challenges remain. Coherence measurements are influenced by factors such as vegetation dynamics, soil moisture variability, and imaging geometry, all of which can introduce noise into the signal. Moreover, heterogeneous land cover and rapid environmental changes in coastal regions complicate the interpretation of SAR-based results (Sarker et al., 2024). Many existing methodologies also lack standardized frameworks that can be consistently applied across different cyclone events and geographic settings.
Despite the growing application of SAR-based coherence analysis for disaster assessment, most SAR-based damage assessment has generally relied on a single pre- and post-event image pair, or on differencing two such pairs to isolate event-related change, applied to one disaster and one location at a time (Meneses and Blanco, 2022; Malmgren-Hansen et al., 2020; Alexandre et al., 2020; Fielding and Jung, 2024, Mastro et al., 2022). This limited their ability to distinguish cyclone-induced changes from natural temporal variability or seasonal and environmental fluctuations (Olen and Bookhagen, 2018). Plank (2014) identified the resulting difficulty of separating true disaster-induced decorrelation from seasonal vegetation growth, soil moisture changes, and other natural variability as a persistent limitation of pair-based designs, calling for more standardized, transferable procedures. Washaya and Balz (2018) advanced this approach by stacking multiple coherence pairs and computing per-block standard deviation. The authors still applied a fixed threshold to a single earthquake case and a single hurricane case rather than a statistically derived baseline. This study followed these approaches by constructing multi-temporal Sentinel-1 coherence time series, characterizing baseline surface dynamics that capture how much coherence naturally varies before a cyclone, and testing whether post-event coherence reductions exceeded the range of natural temporal variability observed during the pre-event period.
This study addresses these challenges by applying a coherence-based change detection approach to assess cyclone-induced damage in the most affected coastal districts of Bangladesh. The analysis focuses on five major cyclones – Amphan (2020), Sitrang (2022), Mocha (2023), Hamoon (2023), and Remal (2024) and examines spatial patterns of coherence loss across the most affected districts, including Khulna, Satkhira, Barguna, Patuakhali, Bhola, Cox's Bazar, and Chattogram. By integrating SAR coherence analysis with secondary impact data, the study provides a consistent and scalable framework for mapping cyclone-induced surface changes. The findings aim to improve understanding of coherence behavior in complex deltaic environments and contribute to more effective disaster assessment and resilience planning in Bangladesh.
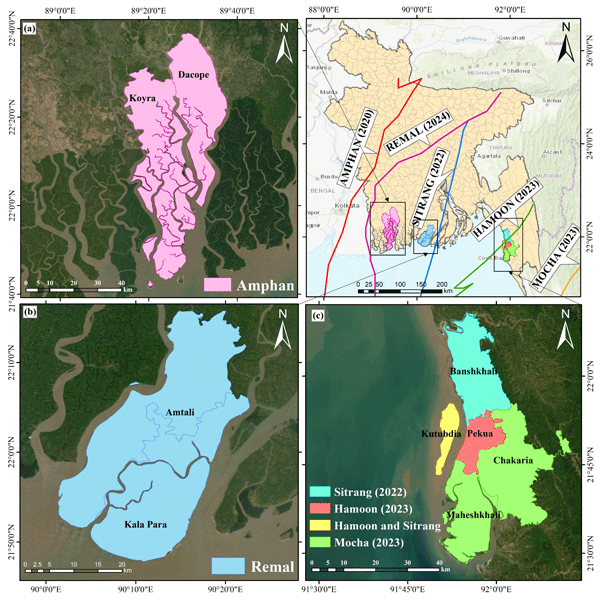
The study focuses on coastal Bangladesh, one of the world's most cyclone-exposed deltaic regions, to evaluate SAR coherence change across major recent cyclones (Fig. 1). Five cyclone events from 2019–2025 were selected for analysis, comprising Amphan (2020), Sitrang (2022), Mocha (2023), Hamoon (2023), and Remal (2024), based on verified impact reports from BMD, DDM, UNOSAT, and Copernicus. The most affected districts, Khulna, Satkhira, Barguna, Patuakhali, Bhola, Cox's Bazar, and Chattogram, were mapped to define the spatial extent for coherence evaluation. These areas consistently experience severe wind, surge, and flooding impacts, making them suitable as our study area. Within these districts, selected upazilas represent the dominant coastal landscape, such as low-lying tidal floodplains (Kalapara, Dacope, Koyra), exposed offshore islands (Kutubdia), and complex peri-urban coastal zones (Pekua, Maheshkhali, Chakaria).
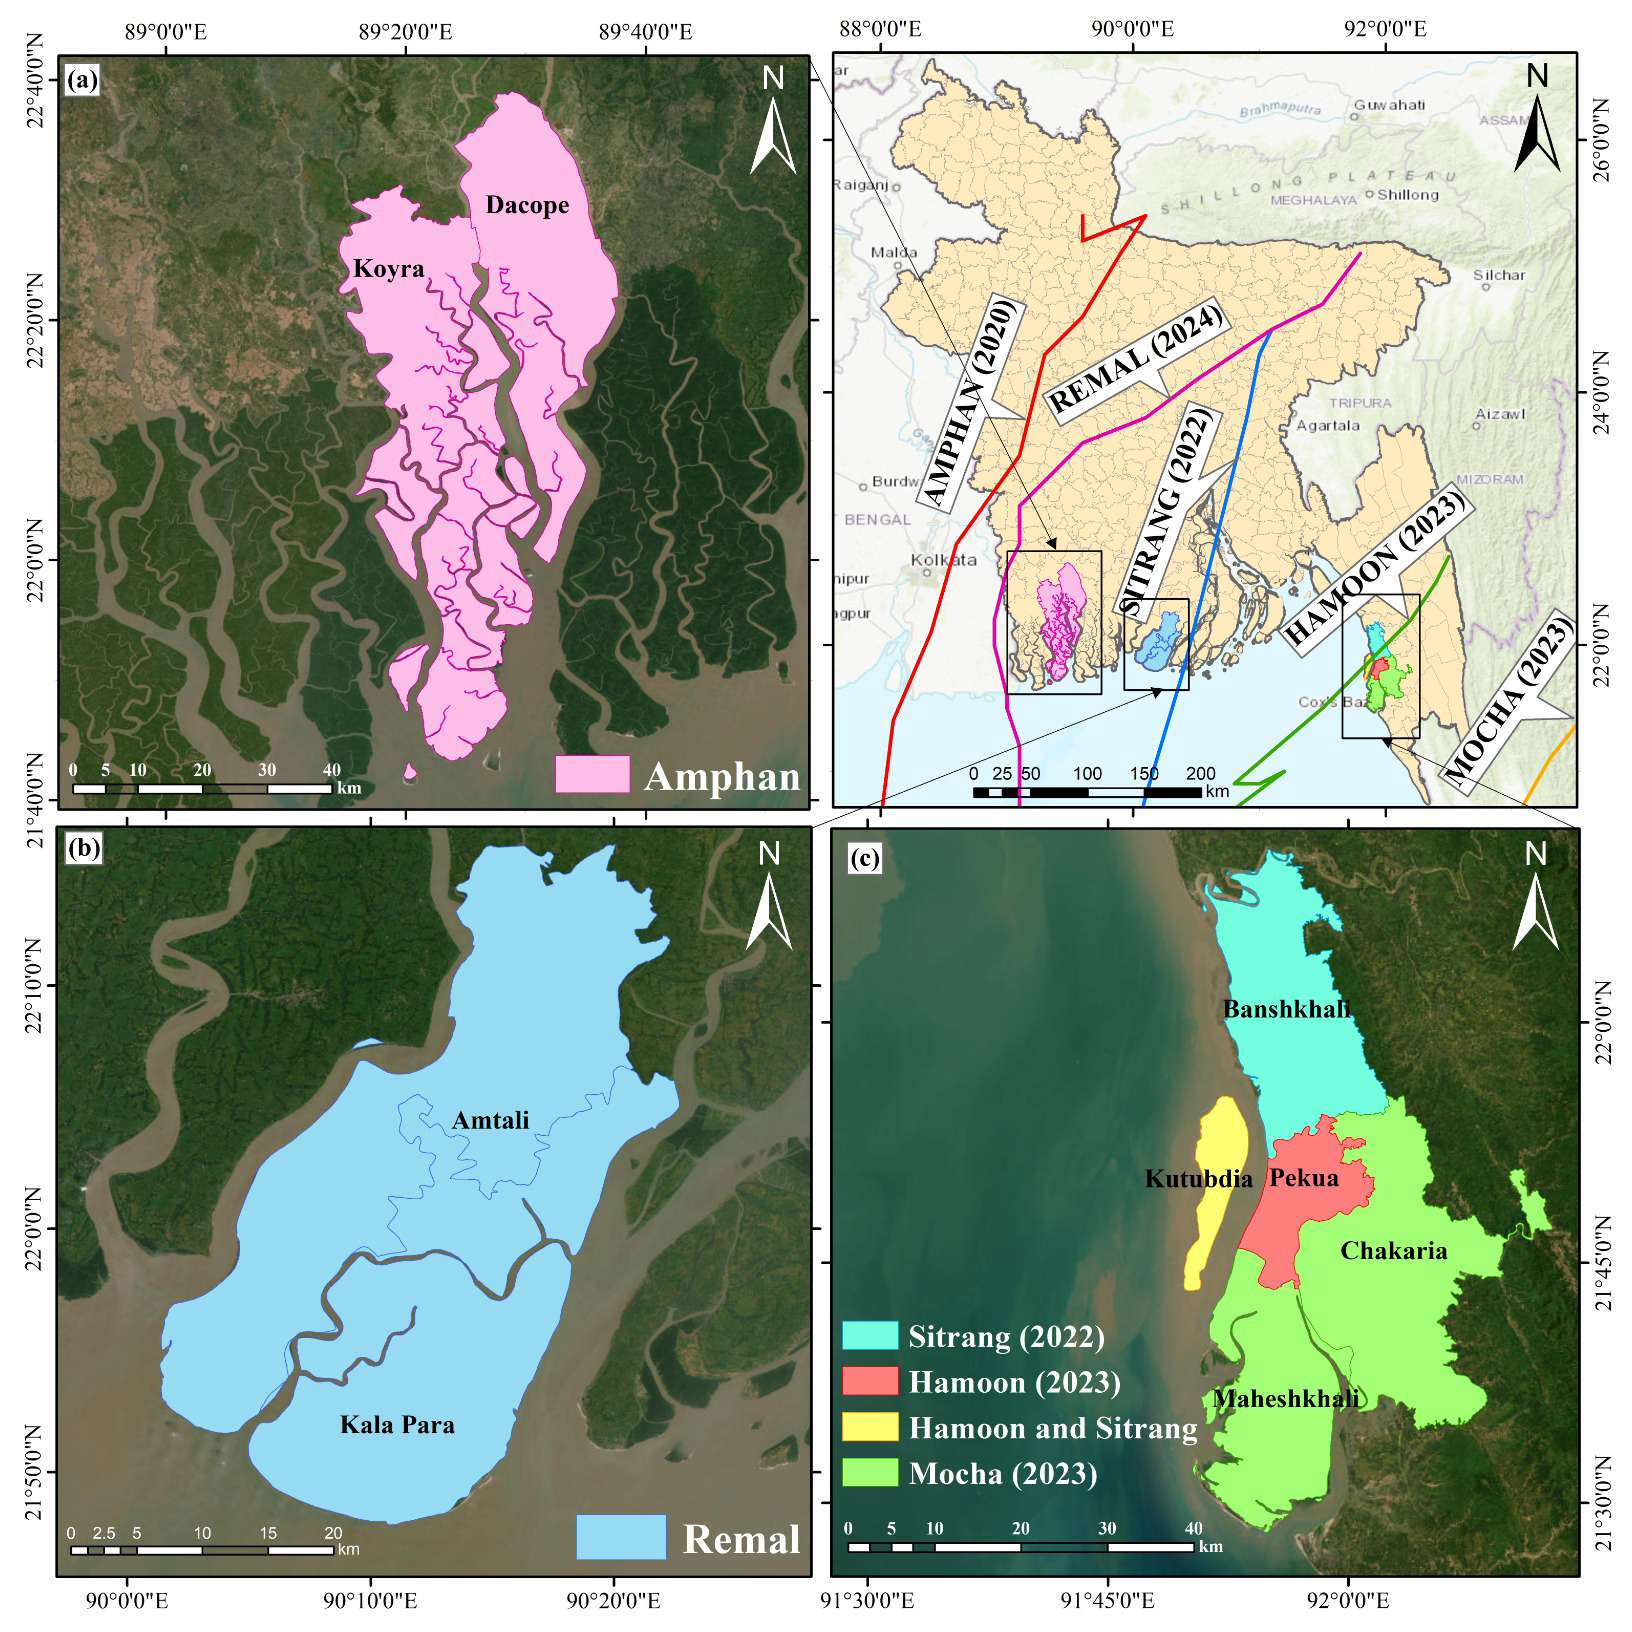
Figure 1Study area location based on the cyclone landfall. (a) Areas affected by Cyclone Amphan (2020); (b) Areas affected by Cyclone Remal (2024); (c) Areas affected by Cyclone Hamoon (2023), Cyclone Mocha (2023), and Cyclone Sitrang (2022). Base maps are from ESRI World Imagery and World Topographic Map, with data sources including Esri, Maxar, Earthstar Geographics, HERE, Garmin, OpenStreetMap contributors, and the GIS User Community | Powered by Esri.
3.1 InSAR Coherence Measurements
SAR systems are active microwave radars that measure both signal amplitude (return strength) and phase (wave offset) from reflected Earth surface waves. Each SAR image pixel is a complex value represented by real and imaginary parts, which represent amplitude and phase, respectively. To compare two SAR images and compute coherence, they must be precisely aligned, with the secondary image typically resampled to match the primary one. Correlation and coherence are often used interchangeably, and coherence can be used to estimate phase noise (Haque, 2016). The coherence between two signals, S1 and S2, observed at interferometer apertures 1 and 2, is defined as:
where S1 and S2 are the complex pixel values at times t = 1 and t = 2; s* is the complex conjugate of s; and 〈 〉 represents the ensemble average. (Touzi et al., 1999; Zebker and Villasenor, 1992). Coherence is a normalized measure ranging from 0 to 1, with higher values indicating stable surfaces and lower values reflecting changes in phase or amplitude. For example, changes in surface elevation (e.g., building damage), backscatter properties (e.g., vegetation growth or removal), or surface dielectric characteristics (e.g., wet vs. dry soil) can reduce coherence (Zebker and Villasenor, 1992). Thus, coherence provides a spatial and temporal estimate of where and when changes occur (Olen and Bookhagen, 2018). The accuracy of phase measurements depends on interferometric coherence, which can be reduced by factors such as receiver noise, temporal changes in the scene, geometric baseline, and volume effects. The overall coherence loss is determined by combining these individual contributions (Moreira et al., 2013).
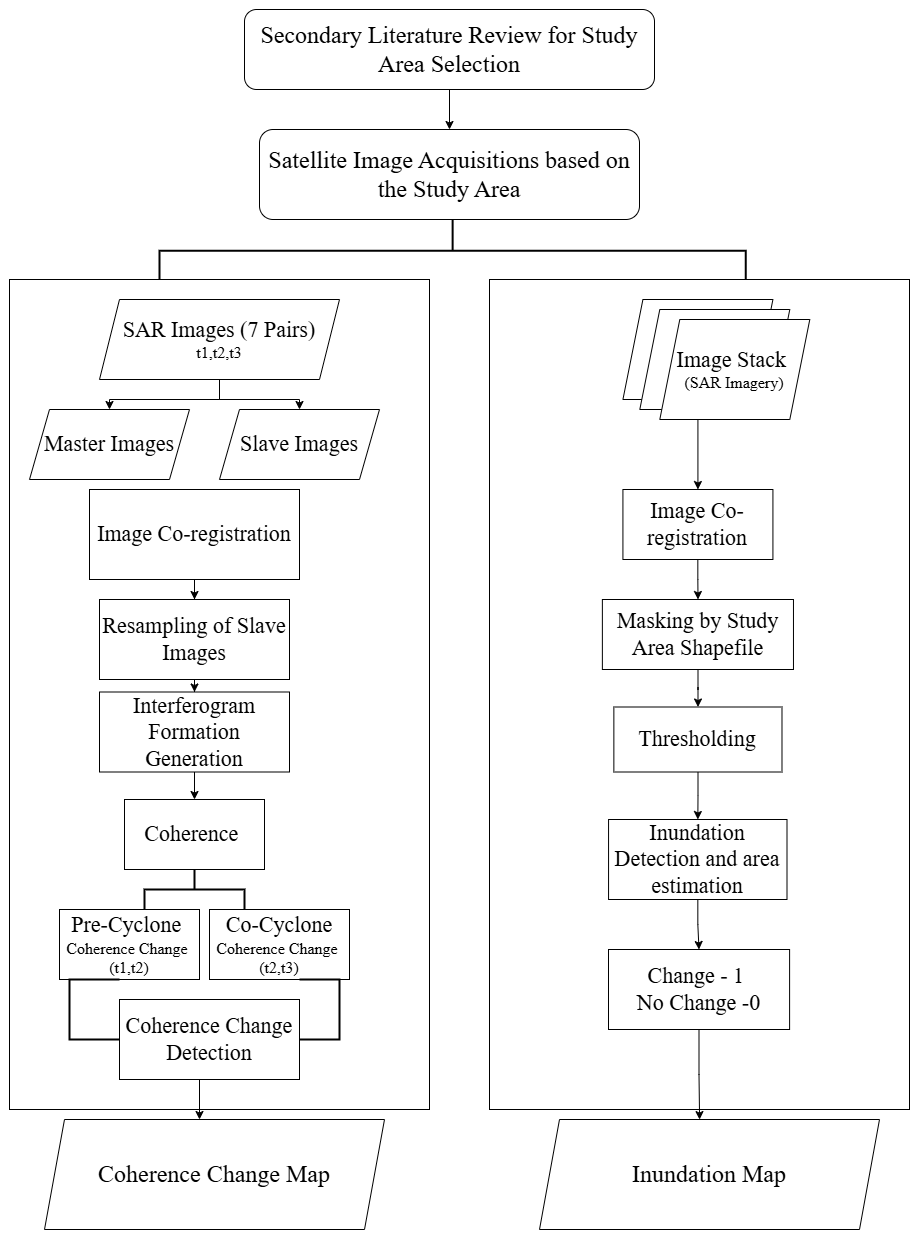
Figure 2Methodological framework for this study shows conceptual and processing flowchart for conducting the research.
In this study, Sentinel-1 SAR imagery was used for coherence for Change Detection (CCD) to assess cyclone impacts taking advantage of SAR's all-weather imaging capability, which overcomes the cloud cover limitations in optical imagery (Phiri et al., 2021). Eight SAR acquisitions were analyzed: three pre-cyclone pairs to establish normal surface variability, one pair during the cyclone, and three post-cyclone pairs to measure changes caused by the event. Using multiple pre-event pairs improves the statistical characterization of normal coherence and allows more reliable detection of anomalous coherence loss linked to cyclone damage. Coherence generation, multi-temporal stacking, and conditional change detection were conducted using the ESA open-source Sentinel Application Platform (SNAP), with results validated against ground truth and comparative remote sensing data. Thus, this methodology combines quantitative coherence metrics with qualitative interpretation of surface changes and terrain effects, thereby enhancing detection of cyclone-related disturbances and reducing false positives (Fig. 2).
3.2 Data and Materials
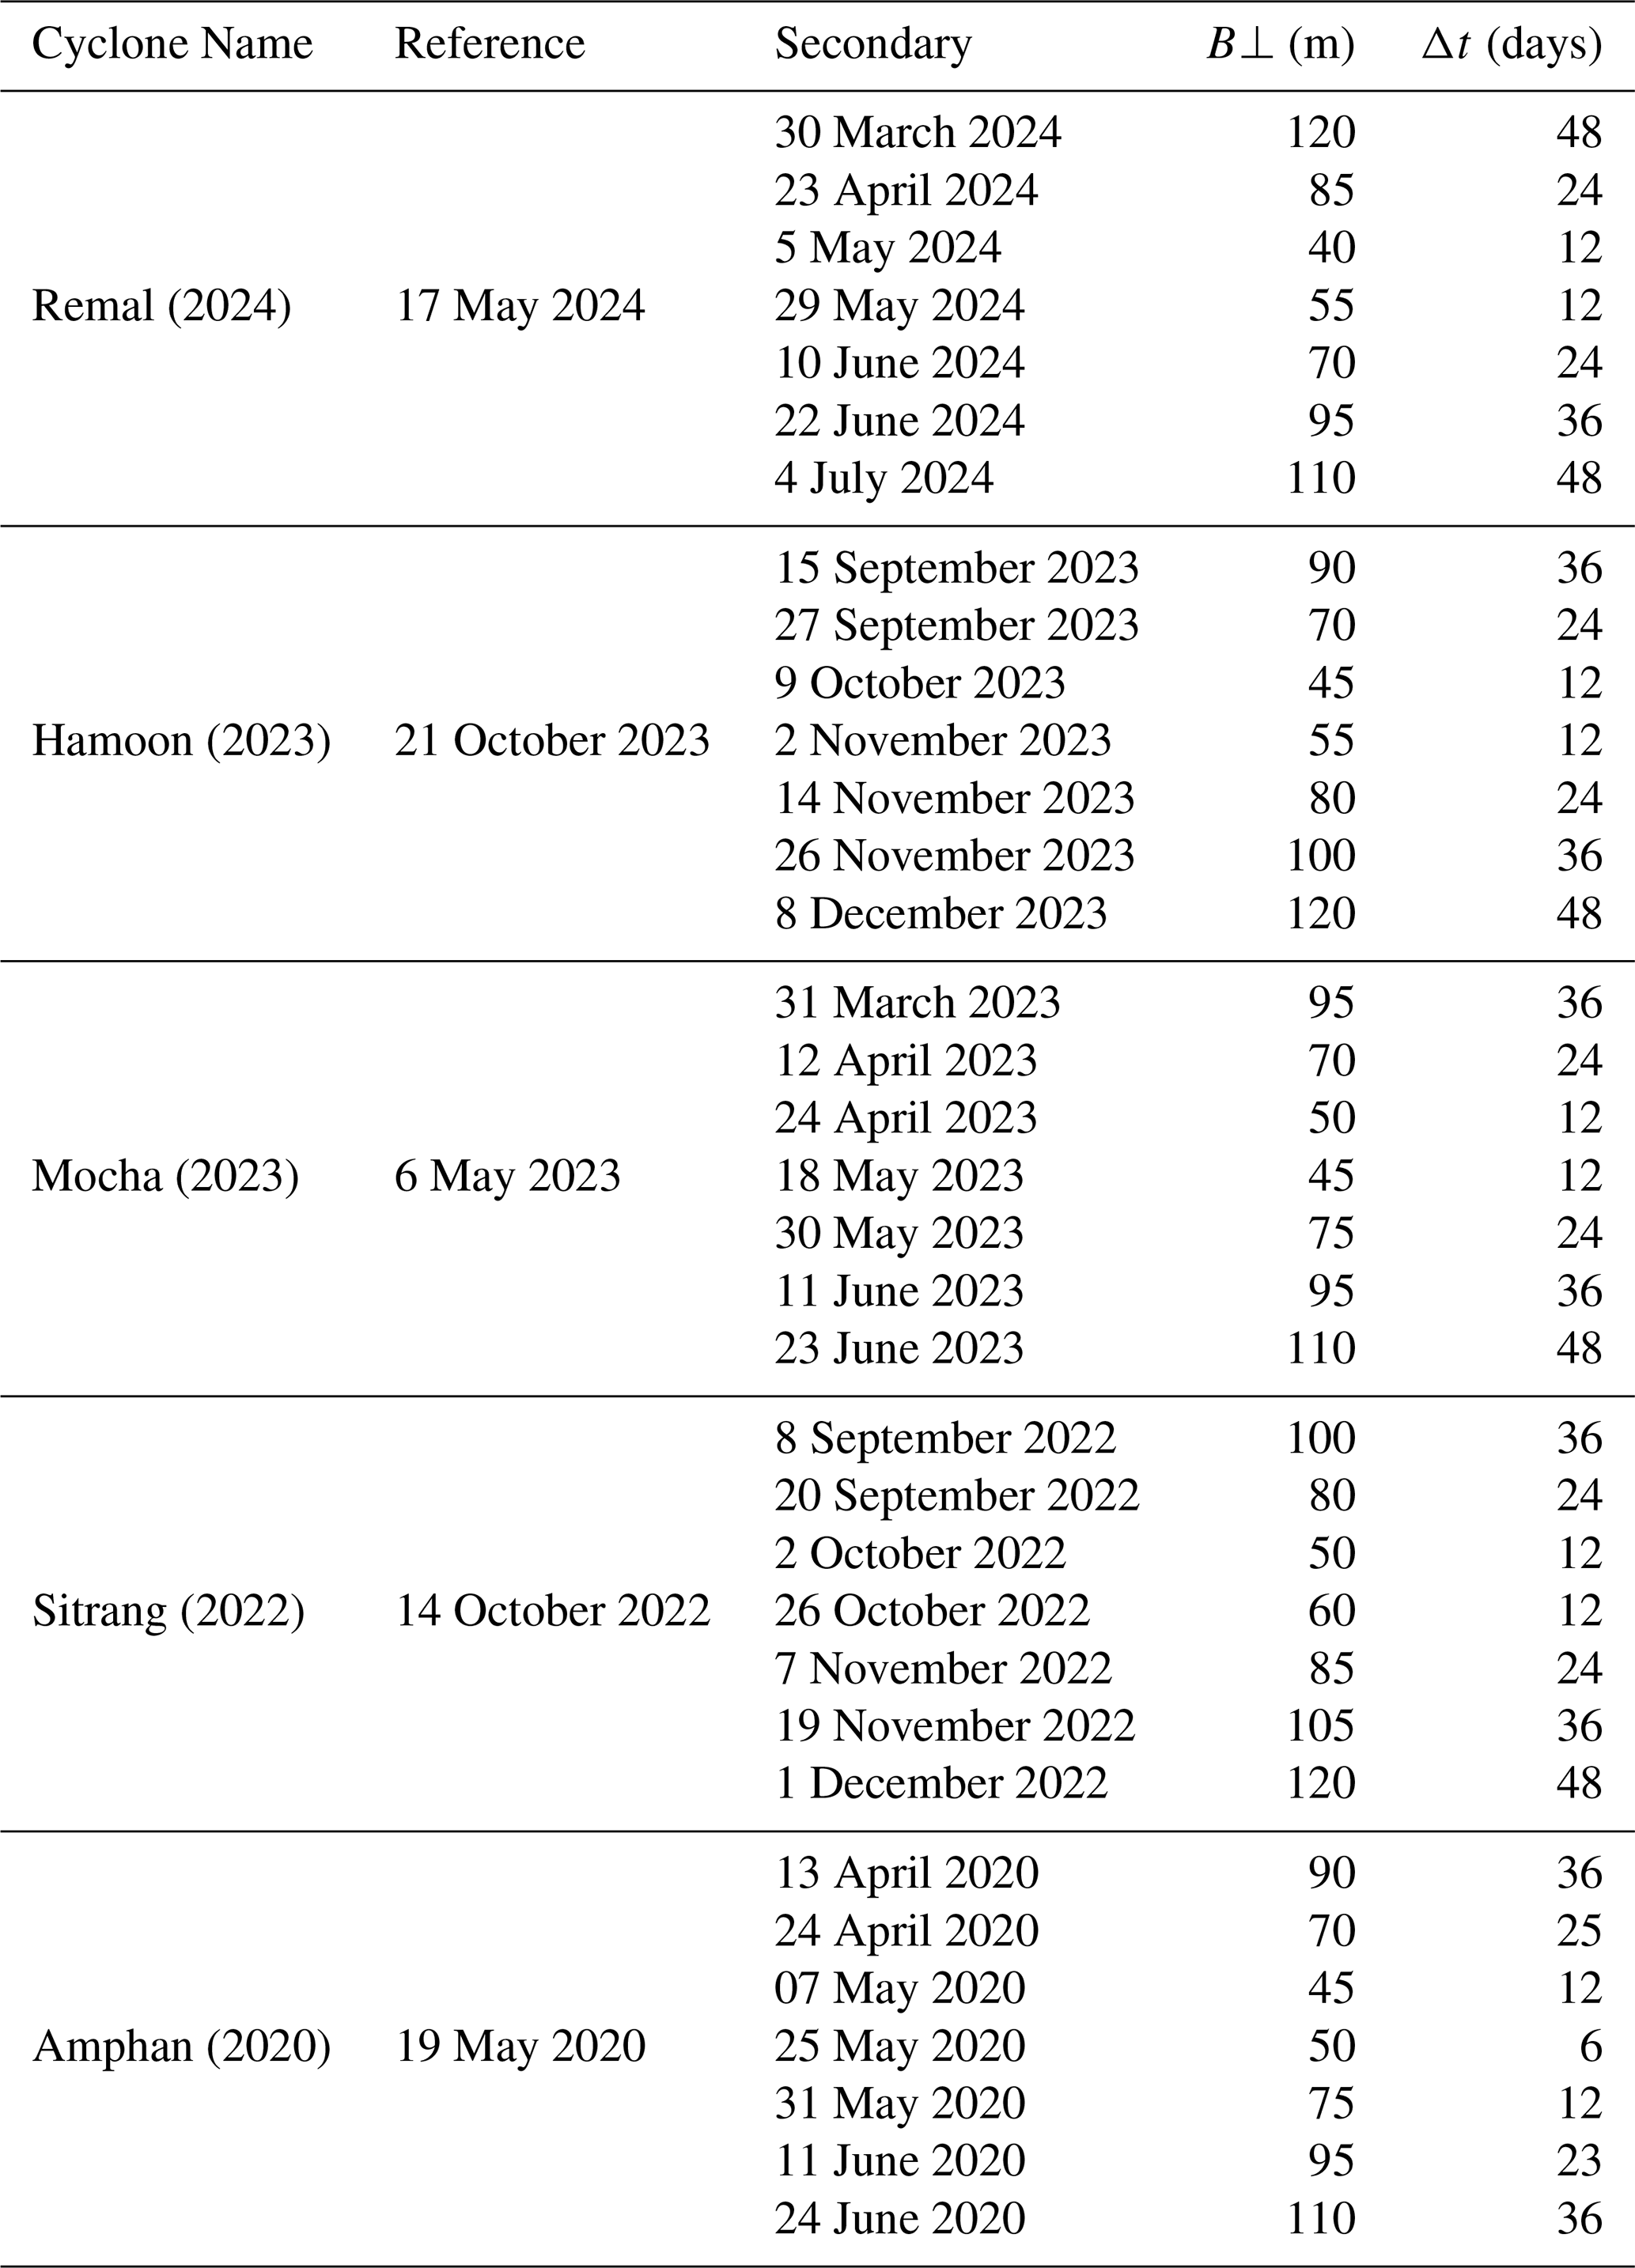
This study used multi-temporal Sentinel-1 C-band Single Look Complex (SLC) SAR data acquired in Interferometric Wide Swath (IW) mode in ascending orbit from the Copernicus Sentinel-1 mission. VV-polarized imagery was selected because it generally provides a stronger and more stable interferometric signal over land surfaces than VH, supporting more consistent coherence estimation across events. Although VH may provide complementary information on vegetation disturbance, VV was used to maintain methodological consistency. The images were analyzed with swath and burst selections adjusted to fully cover the cyclone-affected coastal districts. For each cyclone, a set of three pre-event image pairs was used to establish a stable reference baseline; one image pair was acquired during the event, and at least two post-event images were acquired immediately after landfall to detect surface changes. Image pairs were selected to maintain short temporal baselines (typically ≤ 15 d) and acceptable perpendicular baselines (generally < 100 m), ensuring phase stability for interferometric coherence estimation. The pre-event image acquired closest to the landfall date was selected as the reference image, and all other images were co-registered to this reference to generate a reference–secondary stack suitable for coherence computation (Table 1).
Table 1Multi-temporal Sentinel-1 image pairs used for each cyclone, demonstrating the systematic selection of the pre-, during-, and post-event acquisitions with controlled temporal and spatial baselines to ensure reliable coherence-based change detection.
3.3 Coherence-based Damage Assessment
3.3.1 Pre-processing of SAR Imagery
To accurately detect cyclone-related surface disturbance and flooding, all Sentinel-1 Single Look Complex (SLC) images were processed using a consistent workflow in SNAP. Preprocessing began with organizing and stacking pre-, during-, and post-cyclone images to maintain temporal consistency and allow meaningful comparison over time. VV-polarized IW swath images were aligned through co-registration so that each pixel corresponded spatially across all images, minimizing errors caused by misalignment rather than actual surface change.
To improve image quality, multilooking was applied by averaging neighboring pixels in both range and azimuth directions, which helped reduce speckle noise and standardize pixel spacing. The data were resampled to a resolution of approximately 30 × 30 m and corrected for topographic effects using the SRTM 1 arcsec (∼ 30 m) Digital Elevation Model. Coherence was then calculated for consecutive image pairs across the time series to ensure the shortest possible temporal baseline, capturing subtle surface changes more effectively. These coherence values were combined into a multi-dimensional stack, in which the spatial dimensions (x, y) were linked with a temporal component, enabling pixel-wise analysis of coherence behavior over time. Resampling and terrain correction ensured that all images shared a consistent spatial reference and geometric accuracy. As a result, the final dataset was well-aligned, radiometrically consistent, and suitable for reliable coherence analysis. For each cyclone, coherence was computed for multiple pre- and post-event image pairs, generating several coherence layers that allowed clear separation of surface conditions before and after the event. This multi-temporal structure reduced phase noise, improved baseline characterization, and enhanced sensitivity to cyclone-induced changes. The processed coherence maps were terrain-corrected and exported in GeoTIFF format for further spatial analysis.
3.3.2 Damage Mapping
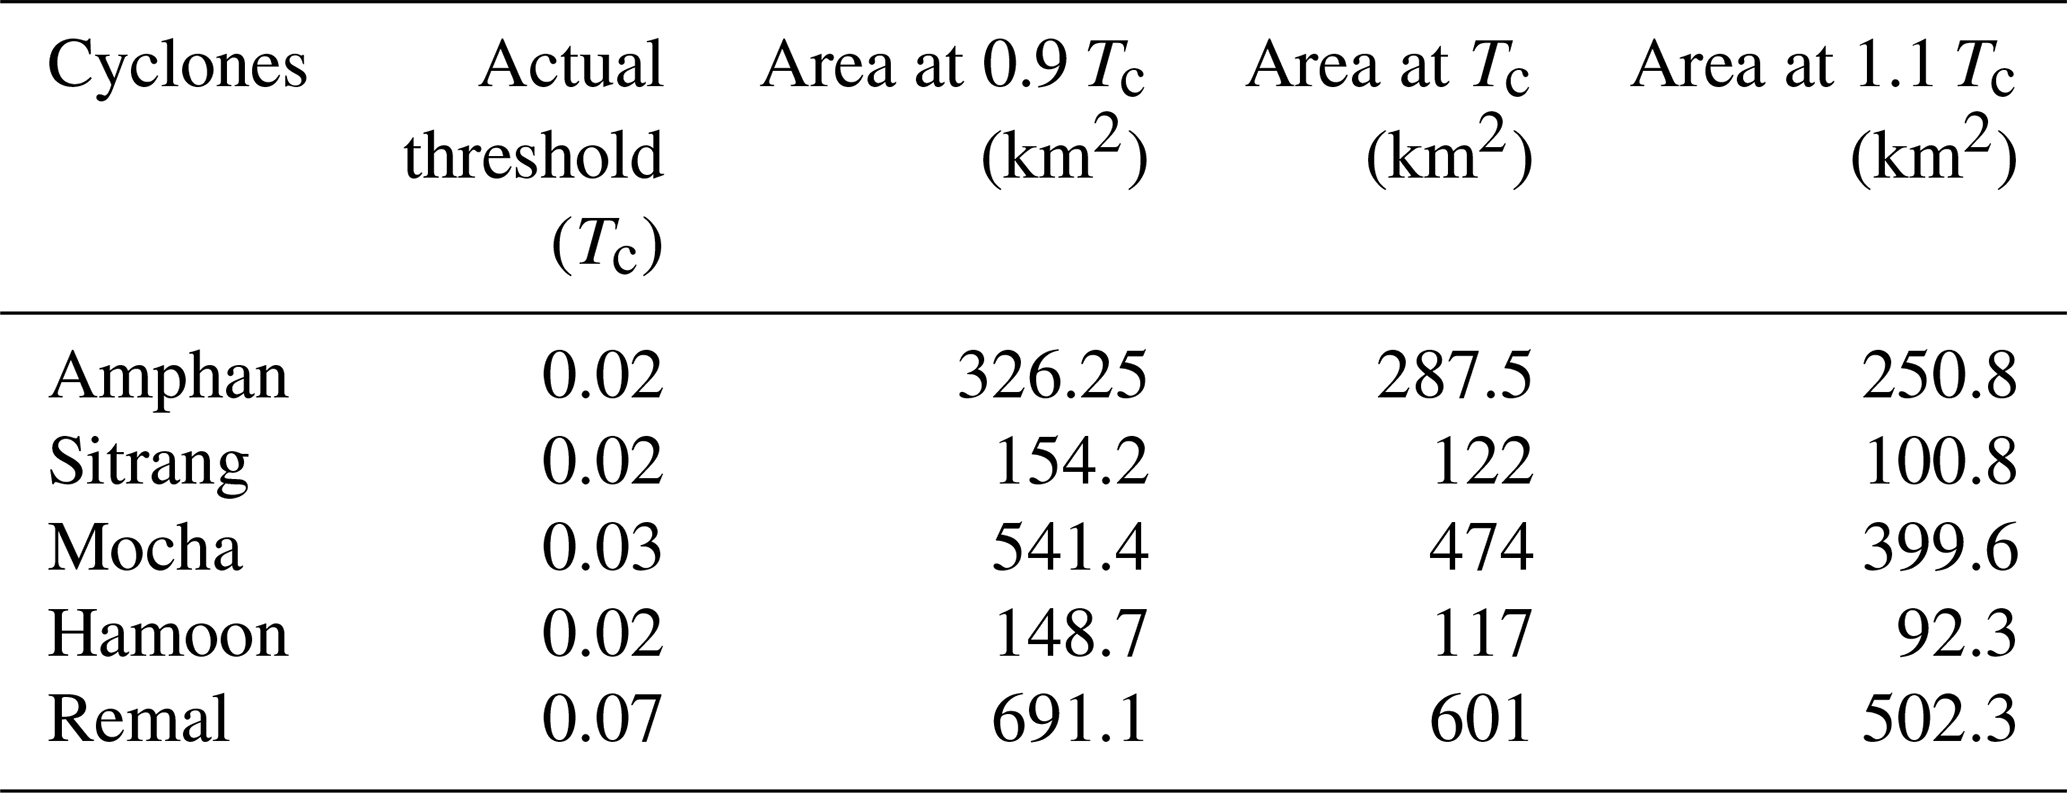
After preprocessing, interferometric coherence was calculated for each image pair to represent the degree of similarity between acquisition times. These coherence layers were then combined into a multi-temporal stack, enabling direct comparison between normal surface conditions and those affected by the cyclone. In contrast to conventional coherence change detection methods that employ a numerical coherence threshold, this study adopted a rule-based threshold derived from multi-temporal coherence relationships. To establish the pre-event coherence condition, four Sentinel-1 pre-event acquisitions were used to generate three consecutive coherence layers. These coherence layers were averaged on a pixel-by-pixel basis to represent the normal temporal coherence behavior before cyclone occurrence. The normalized averaged pre-event coherence was subsequently compared with the coherence derived from the image pair spanning the cyclone period to quantify coherence reduction associated with the event. Rather than applying a fixed numerical coherence threshold, an adaptive cyclone-specific threshold was adopted. The mean coherence reduction across the valid analysis area was used as the decision criterion, whereby pixels exhibiting coherence reductions greater than the scene-average reduction were identified as potential cyclone-induced disturbance, while pixels with smaller reductions were considered relatively stable. This adaptive strategy was selected because Sentinel-1 coherence varies with land-cover characteristics, vegetation, surface moisture, and acquisition conditions, making a single universal threshold unsuitable for all cyclone events. The resulting surface-disturbance maps were subsequently evaluated using field observation and independent secondary damage datasets to assess the spatial correspondence between detected coherence loss and documented cyclone damage. The ±10 % sensitivity analysis showed that mapped surface-disturbance area varied systematically with threshold selection. Reducing the actual threshold (Tc) by 10 % increased the estimated disturbed area by 13.5 %–27.1 %, whereas increasing (Tc) by 10 % reduced it by 12.8 %–21.1 % (Table 2). Amphan, Mocha, and Remal were comparatively less sensitive to threshold perturbation, while Sitrang and Hamoon showed larger changes in mapped extent, indicating greater classification sensitivity around their respective decision thresholds.
Table 2Thresholds and sensitivity analysis of damage areas according to coherence threshold value.
3.3.3 Post Processing
Multiple coherence layers, typically representing pre-, during-, and post-event stages, were stacked to support temporal comparison and improve the reliability of change detection. Damaged areas were identified using band-math operations. These maps were then geocorrected, visualized, and exported for integration into GIS platforms such as ArcGIS. Optional post-processing, such as median filtering, was applied to reduce noise in the binary damage maps. The coherence-based damage layers were validated by cross-referencing with official cyclone reports and internal consistency checks comparing baseline pre-event coherence values.
3.4 Inundation Mapping
To complement the SAR-based damage assessment, inundation mapping was conducted using Sentinel-1 VV-polarized GRD imagery in Google Earth Engine (GEE). This approach allowed spatially consistent identification of flood-affected areas during each cyclone event. For each event, two image composites were generated: one representing pre-flood conditions and another capturing the situation during the cyclone. Sentinel-1 data were filtered by acquisition mode, orbit, and polarization, then processed using median compositing to reduce noise and highlight persistent water signals. Flooded areas were identified through backscatter thresholding, while permanent water bodies were masked using pre-flood imagery to isolate newly inundated areas. The resulting difference between pre-flood and during-flood water masks produced a binary inundation layer, effectively capturing the spatial extent of cyclone-induced flooding. Flood extent maps were exported from GEE for integration with field validation and further spatial analysis.
3.5 Validation and Accuracy Assessment
Validation was essential to assess the reliability of the coherence-based cyclone damage detection results. Owing to the different acquisition years of the five cyclone events, a uniform field-based validation strategy was not feasible. Field verification was carried out only for Cyclone Remal (2024), as it was the only event for which post-disaster site visits could be conducted within a reasonable timeframe. For Cyclones Sitrang, Amphan, Mocha, and Hamoon, validation was performed using secondary datasets. Although these secondary sources provide independent evidence for evaluating the spatial distribution of cyclone impacts, they introduce additional sources of uncertainty, including differences in spatial resolution, reporting bias, and temporal mismatch with the satellite acquisition dates. The field observations collected for Cyclone Remal provide direct verification of the coherence-based damage detection, whereas the validation for earlier cyclones represents an indirect assessment based on independent reference information. This limitation has been considered when interpreting the accuracy results and is acknowledged as an inherent constraint of multi-event retrospective disaster studies. For Cyclone Remal, representative validation points were selected from the coherence-based damage map using Google Earth Pro, covering both low-coherence (potentially damaged) and high-coherence (stable) areas. The points were georeferenced and visited in the field using GPS-enabled devices, where photographs and observations were collected to document surface conditions such as structural damage, vegetation loss, and flood impacts. To quantify accuracy, predicted damage areas were compared with reference data using a confusion matrix and Kappa coefficient.
4.1 Summary of Coherence Change
The temporal behaviour of mean coherence values across the five major cyclonic events (Fig. 3) shows a consistent V-shaped decline during each cyclone event, followed by gradual post-event recovery, reflecting the extent of surface disturbance. In this study context, low coherence indicates areas exhibiting coherence loss associated with flooding, structural damage, or vegetation disturbance, while high coherence corresponds to stable, undisturbed surfaces.
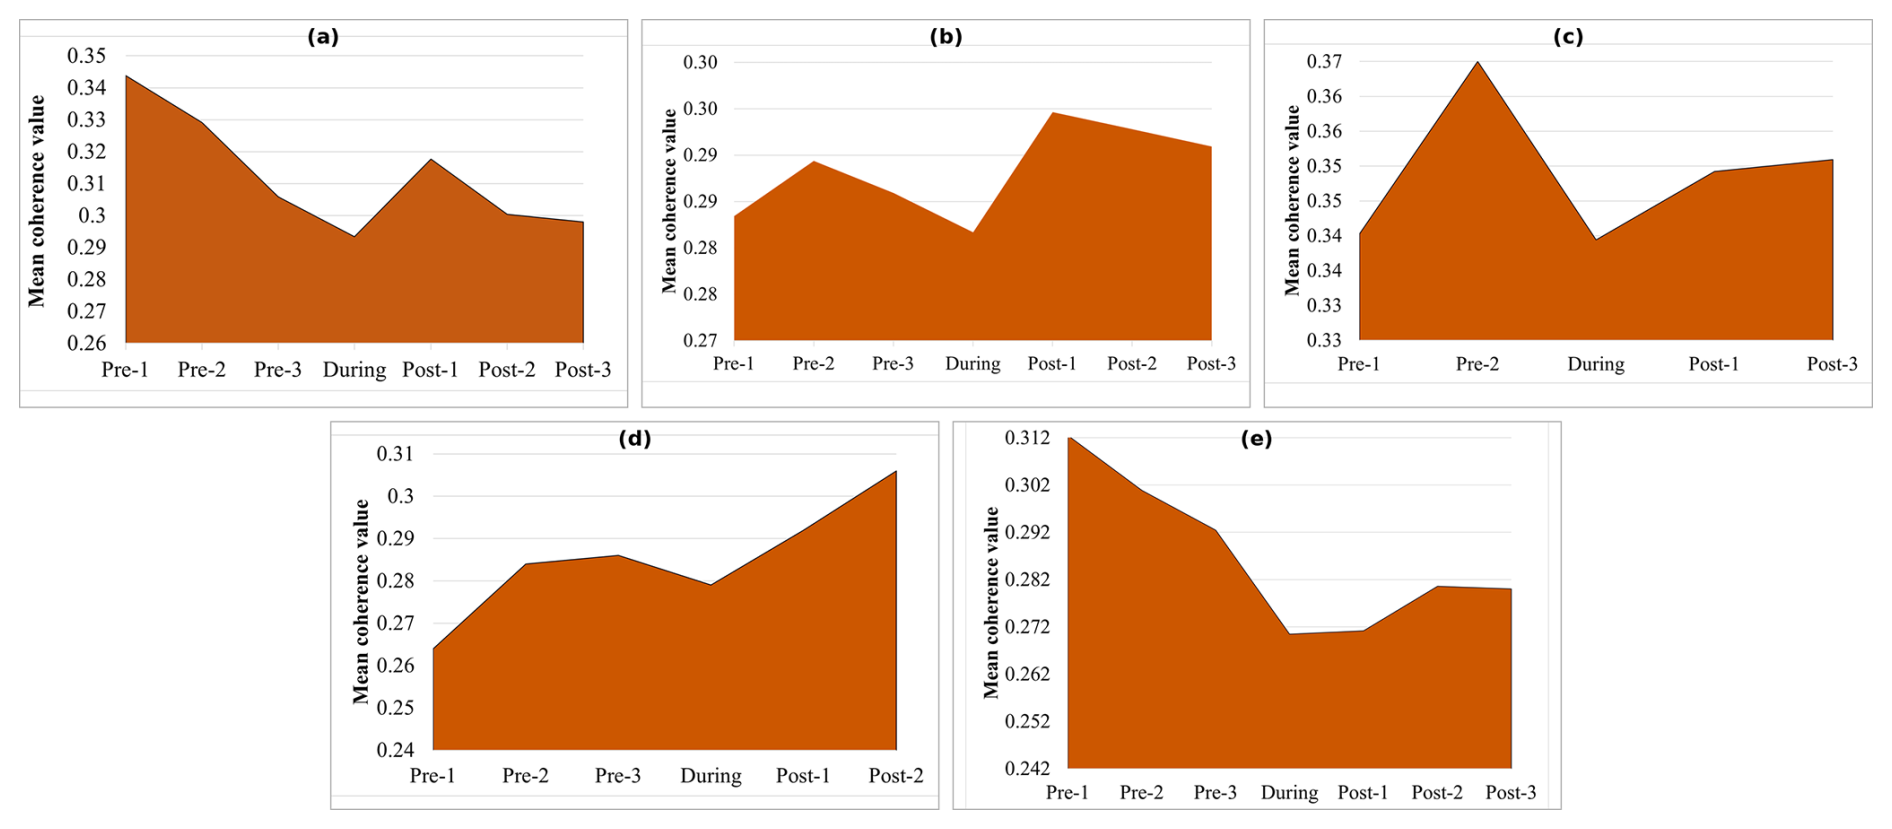
Figure 3Mean Coherence Change graph of (a) Cyclone Remal (2024); (b) Cyclone Hamoon (2023); (c) Cyclone Mocha (2023); (d) Cyclone Sitrang (2022); (e) Cyclone Amphan (2020).
For Cyclone Remal (2024) the coherence value decreased from ∼ 0.31 pre-event to ∼ 0.27 during the event, rising to ∼ 0.28 afterward. Cyclone Hamoon (2023) showed a similar shift from ∼ 0.289 to ∼ 0.275 before steady recovery. Cyclone Mocha (2023) presented the most pronounced drop, falling from ∼ 0.37 to ∼ 0.34. Cyclone Sitrang (2022) declined from ∼ 0.28 to ∼ 0.27 with a more prolonged recovery phase, while Cyclone Amphan (2020) decreased from ∼ 0.34 to ∼ 0.29 and stabilized near ∼ 0.30 in later post-event scenes. These declines reflect widespread coherence loss (i.e., decorrelation) associated with intense rainfall, canopy disturbance, inundation, and localized structural impacts, whereas post-event increases indicate restoration of surface scattering as water receded and vegetation recovered. Although magnitudes varied, stronger cyclones such as Remal and Amphan produced deeper coherence drops, signaling higher levels of surface disruption. The consistent pattern across events demonstrates the method's capacity to capture both immediate disturbance and short-term recovery processes and provides a quantitative foundation for the spatial surface-disturbance mapping.
4.2 Coherence-Based Damage Maps
The coherence-based detection maps in Fig. 4 illustrate the spatial distribution of cyclone-induced damage across the five cyclonic events. Each map presents areas of coherence loss, representing potential surface disturbance associated with the respective cyclone. In all events, zones classified as “damage” (shown in yellow) correspond to areas where coherence loss exceeded the event-specific decision criterion between pre- and during-event SAR images, indicating sudden physical or environmental alterations.
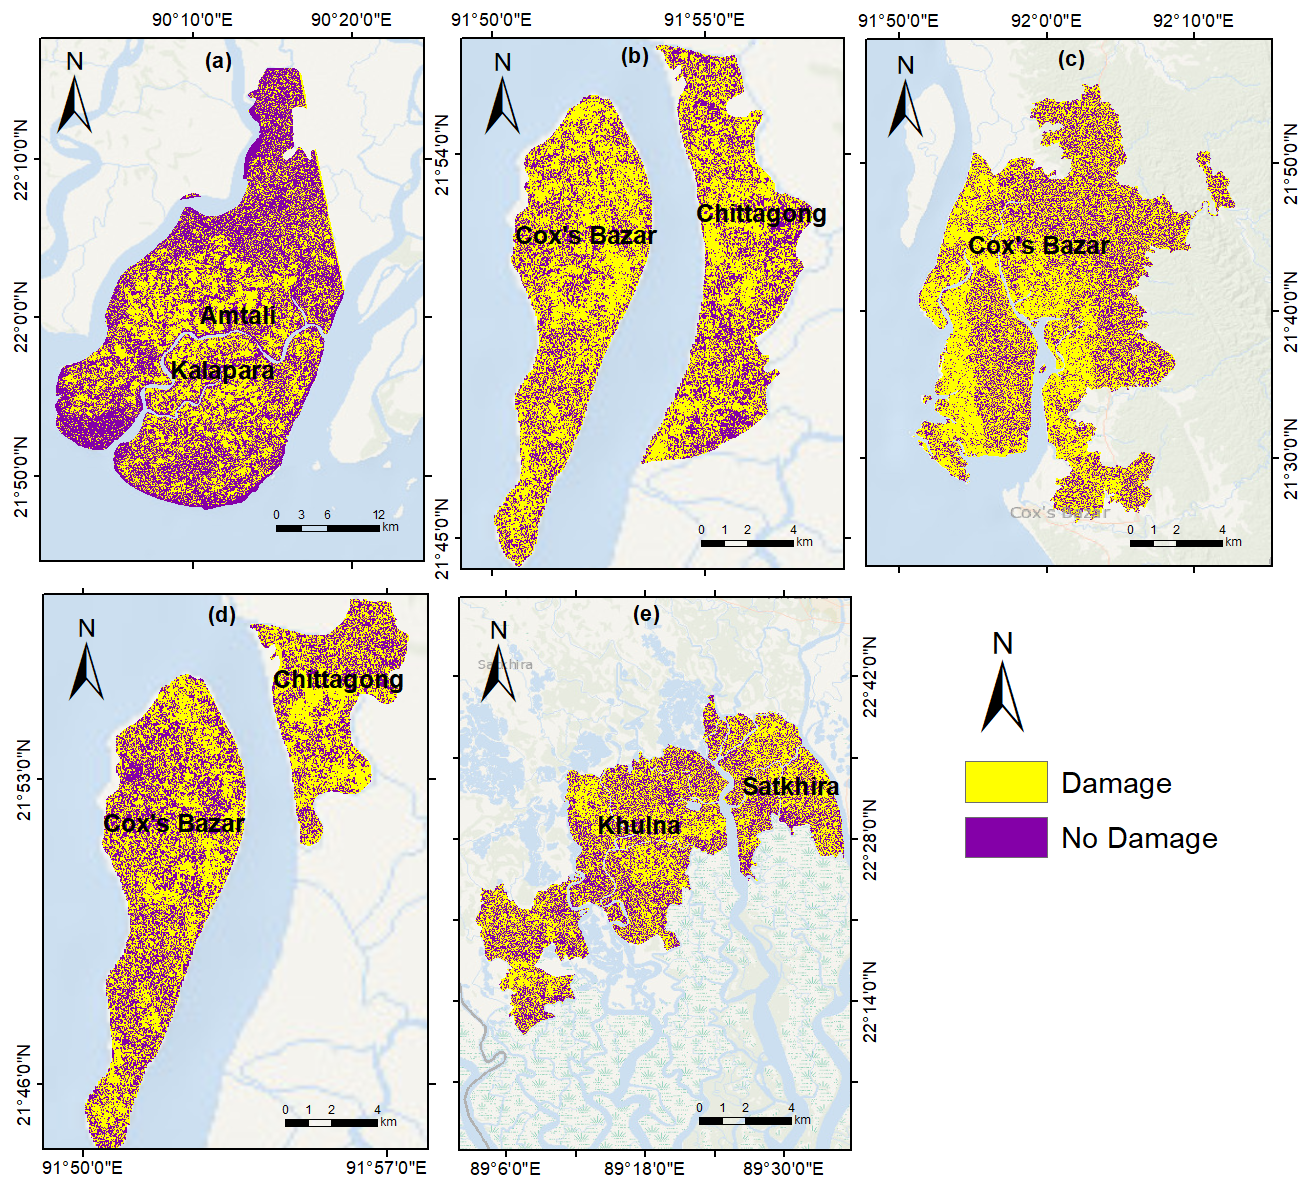
Figure 4Coherence-based damage map of (a) Cyclone Remal (2024); (b) Cyclone Hamoon (2023); (c) Cyclone Mocha (2023); (d) Cyclone Sitrang (2022); (e) Cyclone Amphan (2020). Basemap sources: Esri, GEBCO, NOAA, National Geographic, Garmin, HERE, and other contributors | Powered by Esri.
During Cyclone Remal (2024), the southern coastal unions, e.g., Nilganj, Mithaganj, Sarikkhali, Lalua in Kalapara, and Amtali upazilas – exhibited extensive coherence loss. Approximately two-thirds of the region displayed reduced coherence values, particularly along riverine and low-lying zones. This spatial pattern suggests widespread inundation and vegetation disturbance, consistent with field reports of prolonged waterlogging and embankment breaches. For Cyclone Hamoon (2023), notable coherence reduction occurred in the western coastal belt of Cox's Bazar and the adjacent offshore island areas. High concentrations of damaged zones appeared near Kutubdia and Maheshkhali, aligning with the cyclone's landfall trajectory. The eastern portion showed relatively higher coherence retention, indicating localized but intense impacts rather than uniform damage across the area. Cyclone Mocha (2023) produced one of the most extensive spatial footprints of coherence loss among all studied events. Widespread areas of damage are visible across Teknaf, Ukhia, and Maheshkhali, reflecting severe disturbance to vegetation and built-up areas. Coastal exposure and storm surge likely contributed to the pronounced loss of phase stability. The broad distribution of low-coherence patches highlights the scale and intensity of Mocha's landfall in southern Cox's Bazar. In the case of Cyclone Sitrang (2022), coherence reduction was comparatively moderate but still concentrated along the western portion of Chattogram and the offshore islands. The inland regions retained higher coherence, suggesting partial shielding from storm surge and wind. The damage pattern here reflects a cyclone of moderate intensity whose impacts were geographically constrained. Finally, Cyclone Amphan (2020) demonstrates the most intense and spatially extensive pattern of damage, particularly across Satkhira and Khulna districts. Extensive coherence loss occurred along the coastal polders and agricultural belts, with localized patches of stability in higher elevation areas. The widespread loss of coherence aligns with the well-documented devastation caused by Amphan's strong winds and tidal surge. This consistent coherence loss across multiple events highlights the research method's sensitivity to cyclone-related surface disturbance, including structural and environmental changes.
4.3 Inundation Scenario
The inundation maps of the study cyclones in Fig. 5 show clear differences in the extent and spatial concentration of floodwater across the affected region. Cyclone Remal (2024) displays the most widespread inundation, with dense clusters of flooded pixels spreading across the southern and southwestern floodplains.
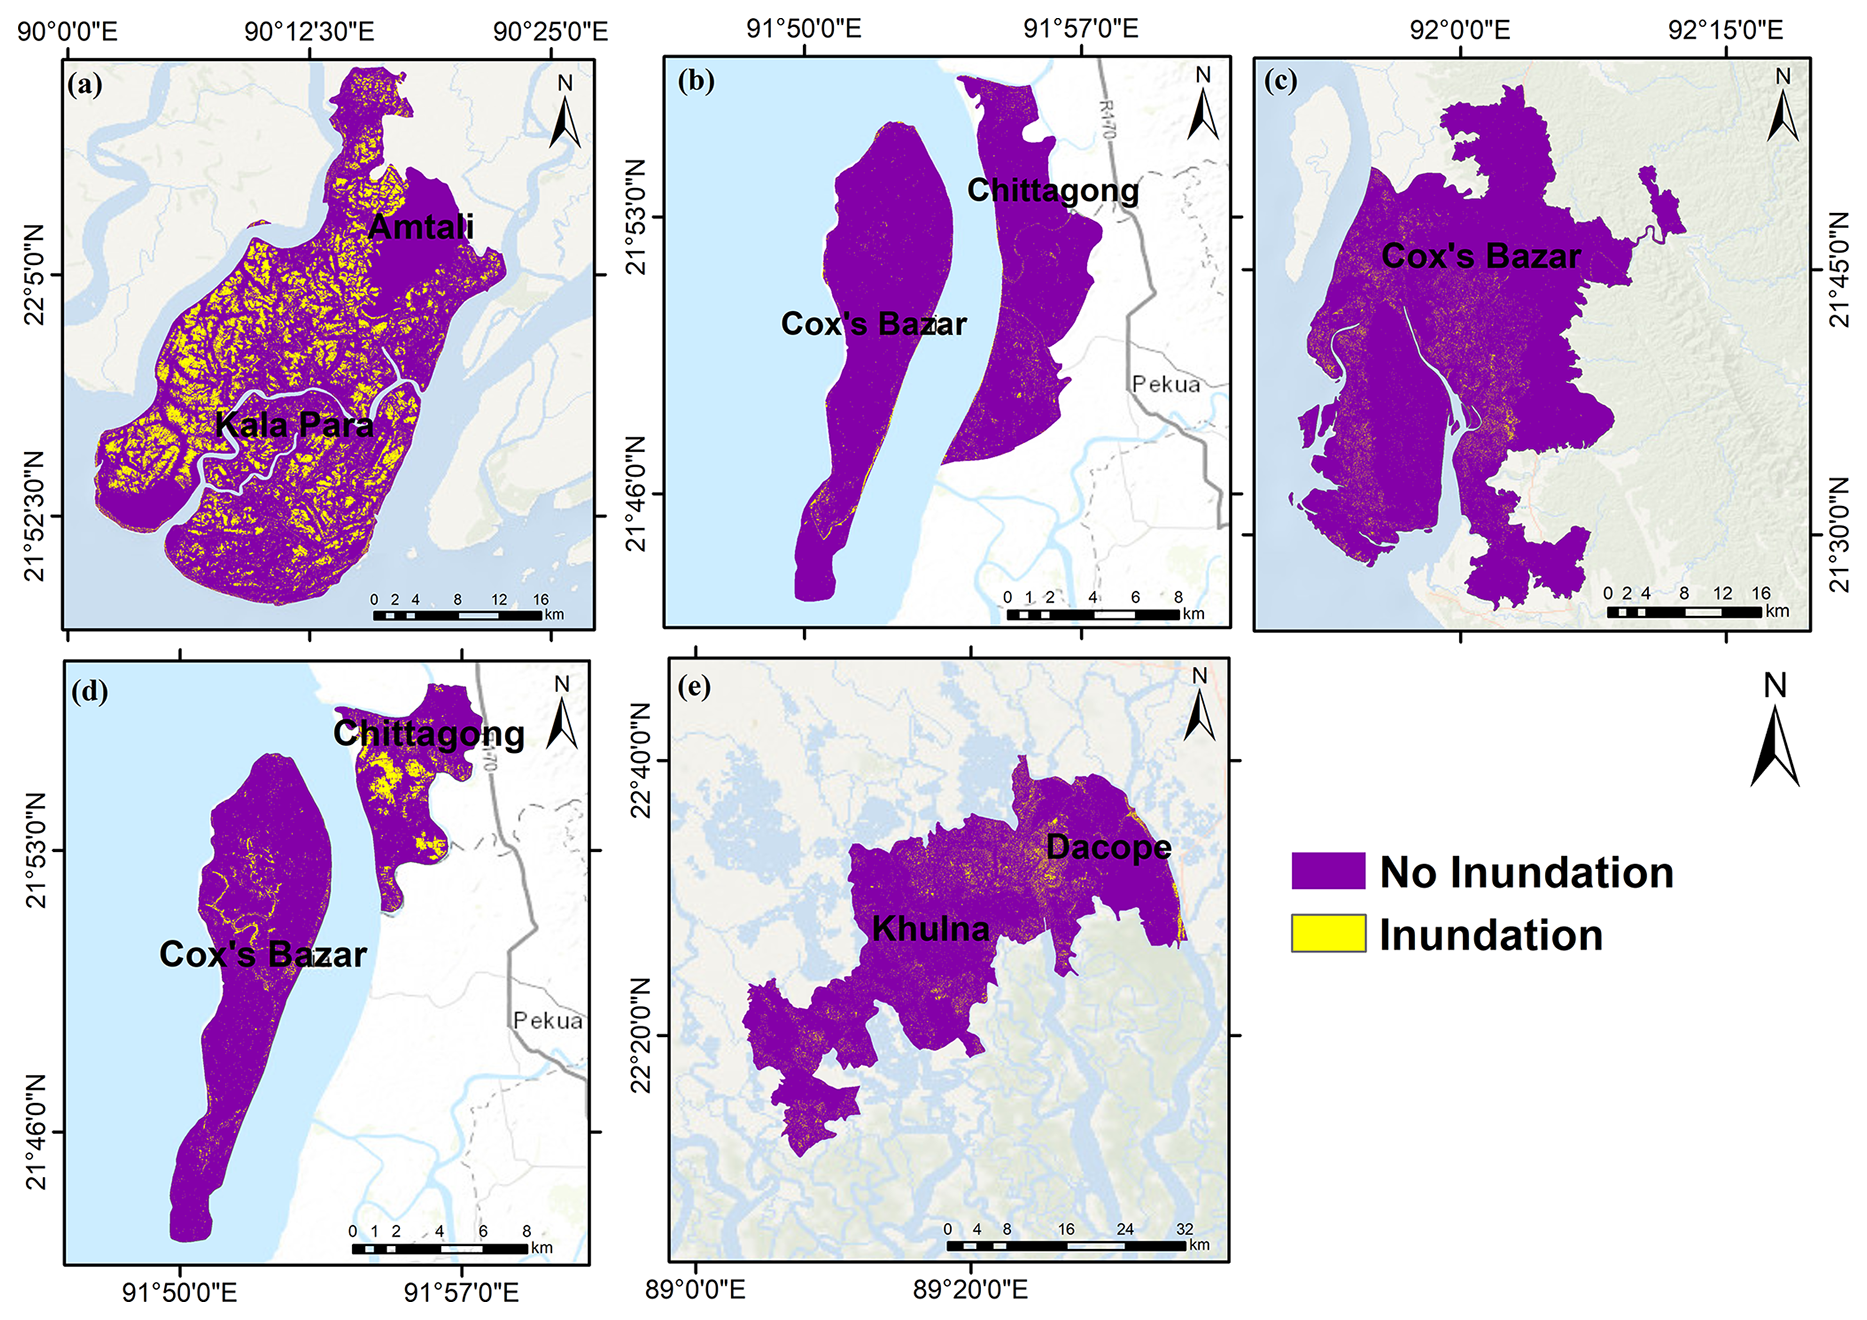
Figure 5Inundation Maps of (a) Cyclone Remal (2024); (b) Cyclone Hamoon (2023); (c) Cyclone Mocha (2023); (d) Cyclone Sitrang (2022); (e) Cyclone Amphan (2020). Basemap sources: Esri, GEBCO, NOAA, National Geographic, Garmin, HERE, and other contributors | Powered by Esri.
Cyclone Hamoon (2023) shows a much narrower inundation footprint, concentrated mainly along the coastal barrier islands. Most inland areas remained unaffected, indicating that the cyclone produced limited inland flooding despite notable wind impacts captured in coherence reduction. A similar pattern is observed for Cyclone Sitrang (2022), where inundation is confined to the northern tip of the island, and the remaining zones show no major flooding. Cyclone Mocha (2023) presents a broader but relatively shallow inundation pattern around the Cox's Bazar region. Flooded pixels are scattered and discontinuous, suggesting localized water accumulation rather than a widespread surge. Cyclone Amphan (2020) shows a mixed scenario, with moderate inland inundation expanding across settlements and river-adjacent areas.
4.4 Result Validation
To validate the Sentinel-1 SAR-based coherence map for Cyclone Remal (2024), a total of 50 representative points were initially selected from the predicted damaged areas. These points were chosen to represent varying levels of predicted damage and corresponding coherence values. The selected points were successfully evaluated through field visits and visual confirmation, allowing direct comparison with the predicted damage map. Each point was categorized as True Positive (TP), False Positive (FP), True Negative (TN), or False Negative (FN) based on the agreement between ground observations and the SAR-derived predictions. A mixed validation framework was used across cyclone events: field-based validation with geotagged ground photographs was conducted only for Cyclone Remal (2024), while validation for the earlier cyclones (Sitrang, Amphan, Mocha, Hamoon) relied on secondary datasets and published damage assessments (Fig. 6).
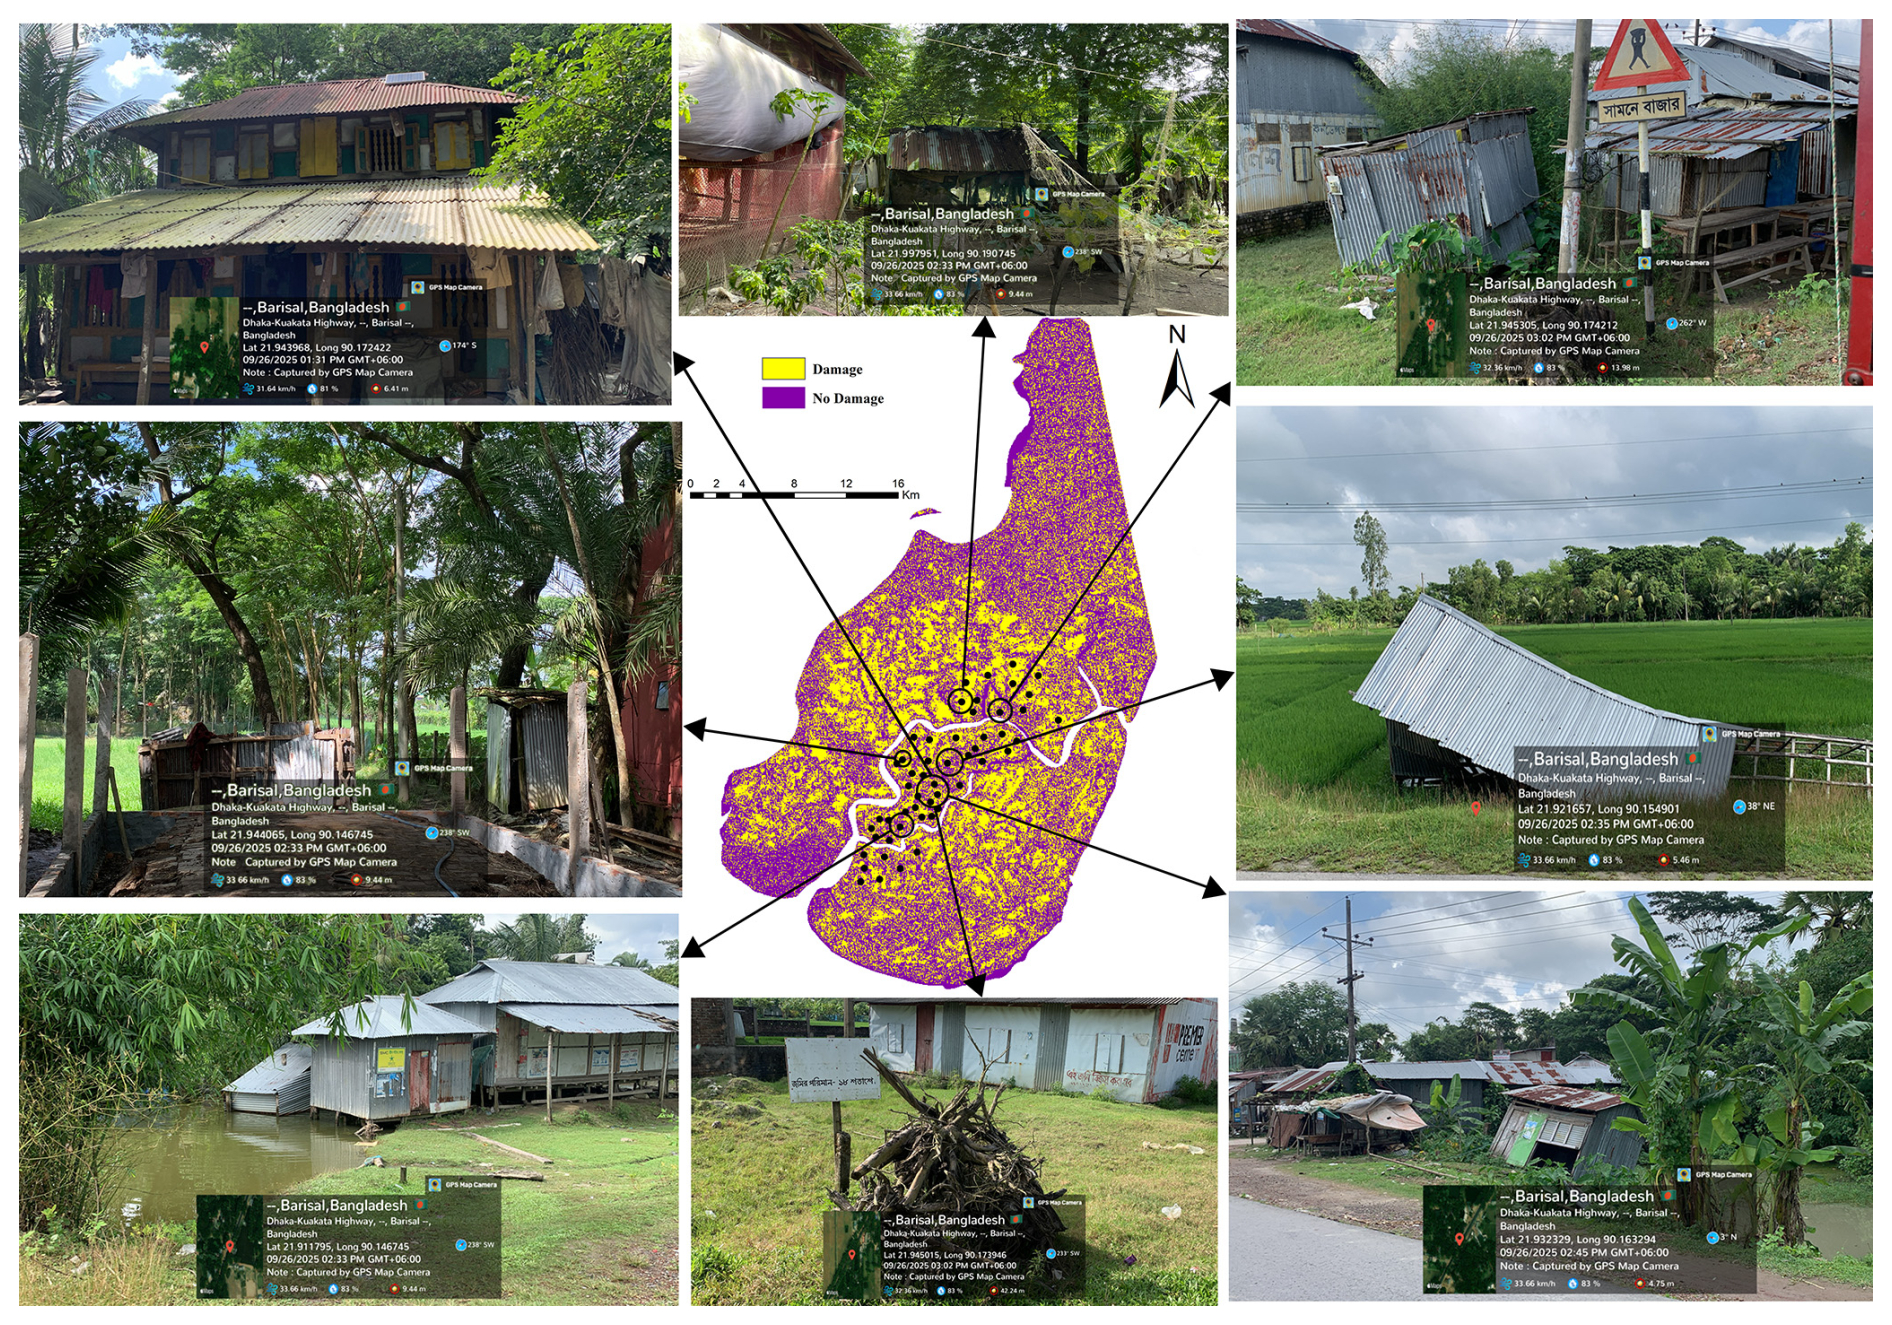
Figure 6Damage from Cyclone Remal (2024) observed during field validation in Kala Para Subdistrict.
4.5 Damage Accuracy Assessment
Field validation following Cyclone Remal supported the reliability of the proposed mapping approach. The coherence-based classification achieved an overall accuracy of 94 % and a kappa coefficient of 0.88, indicating strong agreement with field observations. However, the approximately one-year interval between the cyclone and the field survey introduces uncertainty because some surface conditions may have changed during that period. Despite this limitation, the results demonstrate the potential of coherence-based mapping for identifying cyclone-related surface disturbance and are comparable with accuracies reported in previous SAR-based disaster assessments.
4.6 Inundation Accuracy Assessment
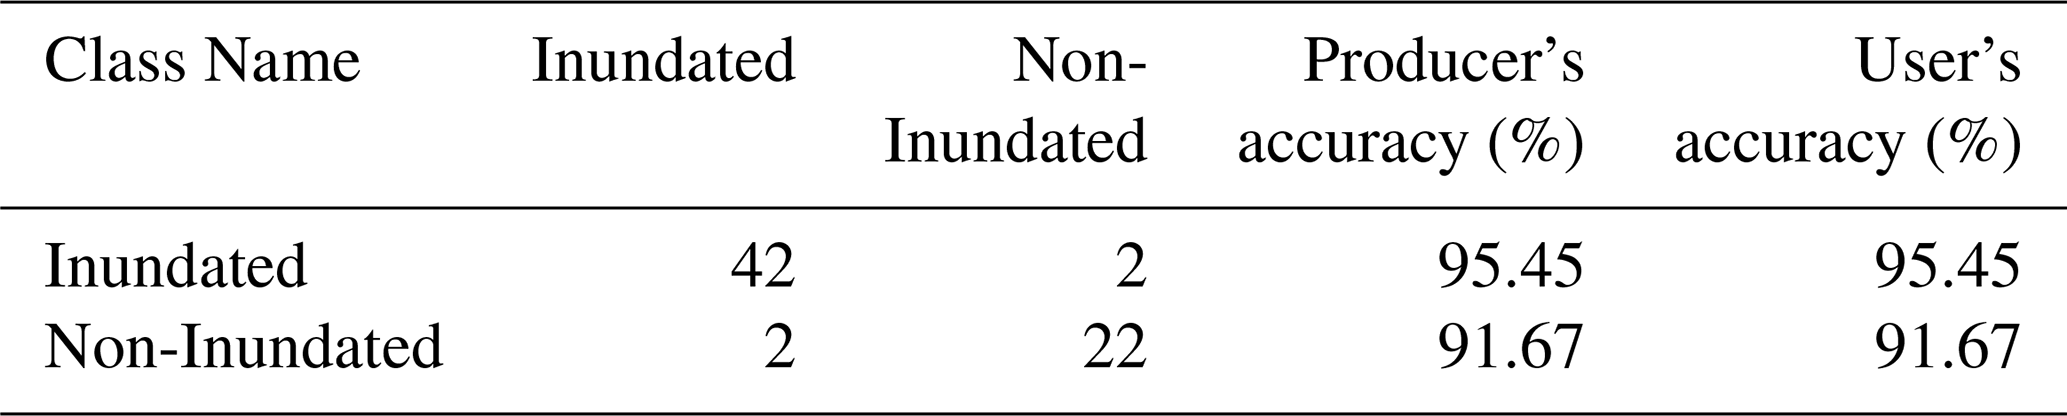
Water body detection produced two classes: Inundated and Non-Inundated. The overall classification accuracy is 94.12 %, with a Kappa coefficient of 0.87. Producer's and user's accuracy values were consistent across both classes: 95.45 % for Inundated and 91.67 % for Non-Inundated (Table 3).
Table 3Accuracy assessment results for the inundation mapping.
4.7 Integration of Damage Scenario and Inundation
To further evaluate the relationship between surface disturbance inferred from coherence loss and cyclone-induced flooding, a quantitative spatial comparison was conducted between the coherence-derived surface-disturbance maps and independently derived inundation extent maps for the corresponding cyclone events. The analysis showed that 78.85 % of pixels located within mapped inundation areas were classified as coherence-derived surface disturbance, whereas 44.90 % of pixels outside the inundation extent were similarly classified as coherence-derived surface disturbance. The nearly 34 percentage point difference demonstrates a strong spatial association between inundation and coherence loss, indicating that cyclone-induced flooding is a major contributor to coherence reduction. Nevertheless, the substantial occurrence of coherence-derived surface disturbance outside the mapped inundation areas indicates that the coherence-based method is not limited to detecting flood impacts alone. Instead, it also responds to other cyclone-related surface disturbances, including vegetation damage, structural damage, erosion, sediment redistribution, and changes in the surface. Conversely, some inundated areas exhibited relatively limited coherence reduction, which may reflect differences in land-cover characteristics, flood duration, acquisition timing, and post-event surface recovery. These findings demonstrate that surface disturbance inferred from coherence loss mapping and inundation mapping provide complementary rather than equivalent representations of cyclone impacts, highlighting the value of integrating multiple sources of information for comprehensive post-disaster assessment.
The results indicate that interferometric coherence is a reliable indicator of cyclone-induced surface change. The observed temporal changes in coherence and the spatial distribution of decorrelation indicate that cyclone impacts are expressed through multiple interrelated processes, including inundation, wind-driven structural damage, vegetation disturbance, and other surface changes. This is also consistent with observations reported in the secondary literature. Moreover, the partial correspondence between disturbance resulting from coherence reduction and inundation extent indicates that coherence loss should not be interpreted singularly as a proxy for flooding. Instead, it provides an integrated instrument to quantify surface change that can complement hazard-specific products. The consistent detection of disturbance across five cyclone events establishes the potential of the multi-temporal CCD as a method that offers key advantages such as cloud independence, sensitivity to both flooded and wind-damaged surfaces, and scalability for temporal monitoring over optical approaches supported (Plank, 2014). However, the variation in magnitude and spatial distribution of coherence loss also highlights the importance of weighing in other factors such as local surface conditions, cyclone characteristics, temporal baselines, and threshold selection.
5.1 Comparison of Cyclone Damage Scenario and Inundation Scenario
Coherence-based surface disturbance maps showed clear variation in the spatial extent and distribution of affected areas, reflecting differences in cyclone characteristics, surface conditions, and threshold response. Cyclone Remal produced a broad low-coherence zone around Kalapara and Amtali subdistricts, consistent with reported inundation and embankment failure; Hamoon showed a more localized footprint around Kutubdia; and Mocha generated a widespread, relatively uniform decorrelation pattern across southern Cox's Bazar, consistent with its extensive wind field. These differences indicate that coherence response varies with both hazard characteristics and the type and distribution of surface disturbance. This event-dependent variation in the magnitude of decorrelation is consistent with Washaya and Balz (2018), where marked differences in overall coherence losses for a hurricane (75 %) and an earthquake (65 %) were reported. It indicates that the magnitude of decorrelation is influenced by hazard characteristics and surface conditions rather than being a fixed property of the method. Compared with inundation maps, although 78.85 % of pixels within mapped inundation areas were classified as surface disturbance inferred from coherence loss, a substantial proportion of all pixels classified as coherence-derived surface disturbance occurred outside the mapped inundation extent. Substantial decorrelation was frequently detected in inland areas with little or no inundation, where field observations documented structural damage and vegetation loss that were consistent with wind-related impacts. For example, Remal showed notable coherence loss in Nilganj, Baliatali, and Lalua unions despite limited flooding, and Hamoon produced strong inland damage signals in Barabakia and Lemshikhali unions; Mocha and Sitrang showed similar wind-driven decorrelation, while Amphan showed both overlapping and distinct zones of flood- and wind-related damage. This partial overlap with inundation extent is broadly consistent with the SAR-based cyclone flood-mapping literature: Alexandre et al. (2020) applied a Sentinel-1 normalized difference ratio (NDR) chain specifically to delineate flood extent after cyclones AVA and DIANE in Madagascar, and reported strong agreement with Copernicus EMS flood products, but their approach was designed to isolate inundated area rather than the wider set of surface changes considered here. The present results suggest that a coherence-based formulation detects flood-related changes together with additional forms of surface disturbance, including wind-related structural and vegetation changes that a flood-focused change-detection method may not be expected to identify. A similar distinction between water-related and non-water-related surface change was noted by Malmgren-Hansen et al. (2020), who used Sentinel-1 intensity-based Wishart change detection for Cyclone Idai in Beira and found that filtering changes by building footprints was necessary to separate impacts on houses from changes in the surrounding natural environment; their analysis likewise showed that a substantial share of detected change could not be attributed to inundation alone. The methodological logic of isolating hazard-related decorrelation from other sources of surface change also parallels Fielding and Jung (2024), who used correlation-difference mapping between pre- and co-event image pairs to separate earthquake-induced building damage from vegetation-driven decorrelation at Bam, Iran; although the hazard type differs, this supports the broader principle that a single coherence or correlation measurement conflates multiple surface processes unless compared against a reference state, as done here through the pre-event coherence baseline. Together with the comparison with previous studies, this indicates that the principal contribution of the present study is not limited to detecting cyclone-related decorrelation in Bangladesh but lies in its use of multi-temporal coherence to characterize a broader surface response across different cyclone events. Previous studies have demonstrated the utility of SAR coherence or correlation-based change detection for other hazards and in different geographic and hazard contexts, including flooding, building damage, earthquakes, hurricanes, and typhoons (Alexandre et al., 2020; Malmgren-Hansen et al., 2020; Fielding and Jung, 2024; Meneses and Blanco, 2022; Washaya and Balz, 2018). The findings of our study extend its implications by demonstrating that a common multi-temporal coherence framework can capture both inundation-related and non-inundation-related surface disturbances across multiple cyclone events within a complex deltaic environment. This has broader operational implications for rapid disaster assessment because the same framework can potentially provide a spatially consistent first-order assessment of cyclone impacts where cloud cover, limited field access, or incomplete event-specific damage records constrain conventional approaches. But the thresholds and classification parameters used in this study may not be directly applicable to other regions. Variations in land cover, vegetation dynamics, imaging geometry, cyclone intensity, and image acquisition timing can affect coherence response. Thus, application of the multi-temporal framework to other cyclone-prone regions would require local baseline assessment, threshold adjustment, and independent validation.
5.2 Contribution of this study considering the current context
This study contributes to social resilience by improving rapid and accurate assessment of cyclone-induced damage in Bangladesh's vulnerable coastal communities. The coherence-based framework offers disaster management agencies, ministries, and humanitarian actors a cost-effective, cloud-independent tool for identifying affected areas, planning rescue operations, and allocating resources efficiently. The integration of satellite data with ground validation enables operational assessment even in logistically challenging settings. The approach supports resilience building by informing mitigation strategies, infrastructure planning, and preparedness initiatives. Ultimately, it strengthens community safety, safeguards livelihoods, and enhances climate-adaptive capacity in cyclone-prone coastal regions.
5.3 Limitations
Despite its strengths, the study has a few limitations. The absence of socioeconomic and infrastructural data limited contextual understanding of vulnerability and recovery processes in the cyclone-affected areas. The validation dataset, derived from ground reference points, was initially identified through visual interpretation of the raw imagery and subsequently cross-checked using area-specific secondary information on structural damage to improve reliability. Due to the temporal gap between Cyclone Remal, the most recent cyclonic event, and the field validation visit, direct event-time ground data were unavailable. This may have introduced some uncertainty in the validated results, particularly for water-inundation-related impacts such as damage to croplands. Future research should integrate multi-sensor platforms including SAR, optical, LiDAR, and hyperspectral to overcome single-sensor constraints and enable more detailed three-dimensional surface deformation mapping in the context of cyclone damage assessment.
Effective disaster management strategies are critical for enabling rapid and comprehensive responses to cyclonic events, ultimately reducing their overall impacts. In hazard-prone regions, the development of a SAR coherence-based framework offers a practical means of identifying and mapping affected areas. Beyond post-event assessment, this approach also holds potential as a detection tool in remote or poorly monitored regions, where traditional observation systems may fail to capture the full extent of an event. The findings of this study highlight the importance of integrating robust remote sensing techniques into disaster monitoring systems. The application of Coherent Change Detection (CCD) proved effective for assessing cyclone-induced damage, demonstrating operational feasibility and accuracy. These findings are consistent with those from similar studies conducted in regions such as the United States, Japan, Italy, and Mozambique, reinforcing the broader applicability of this approach. The following conclusions can be drawn from this study:
-
The coherence maps consistently revealed substantial coherence loss, indicating surface disturbance associated with structural deformation, vegetation disturbance, and inundation.
-
Temporal analysis showed a sharp decline in coherence within several days of landfall, followed by a gradual recovery as floodwaters receded and vegetation regenerated, indicating a strong correspondence between cyclone damage and coherence loss.
-
Field validation confirmed strong alignment between mapped disturbance and actual post-cyclone conditions. The overall accuracy of 94 % demonstrates the reliability of CCD for post-cyclone assessment.
-
CCD has several advantages such as all-weather operability, rapid data availability, and sensitivity to subtle structural or surface changes. With accurate co-registration and baseline selection, false-positive data can be minimized.
Although this study focuses on coherence-loss-based detection of cyclone-related surface disturbance using C-band SAR data from the Sentinel-1 mission, future research could further enhance this methodology through long-term coherence time-series analysis. Approaches similar to those proposed by Olen and Bookhagen (2018) could improve the identification of unusual surface changes while reducing uncertainties associated with seasonal variability. When combined with relevant local datasets, such as population distribution and infrastructure information, coherence-based surface-disturbance mapping can provide valuable insights for identifying and prioritizing affected regions following natural hazard events. The study demonstrated an empirically validated, scalable, and reproducible relationship between coherence loss and areas of cyclone-related surface disturbance, with independent validation supporting its use for cyclone-damage assessment. To maximize national capacity, the Coherence Change Detection workflow could be integrated into a centralized GIS-based Disaster Data Management System or HCTT interactive dashboards to support D-Form reporting, Joint Needs Assessments, and Post-Disaster Needs Assessment (PDNA) processes within 48 to 72 h of cyclone landfall.
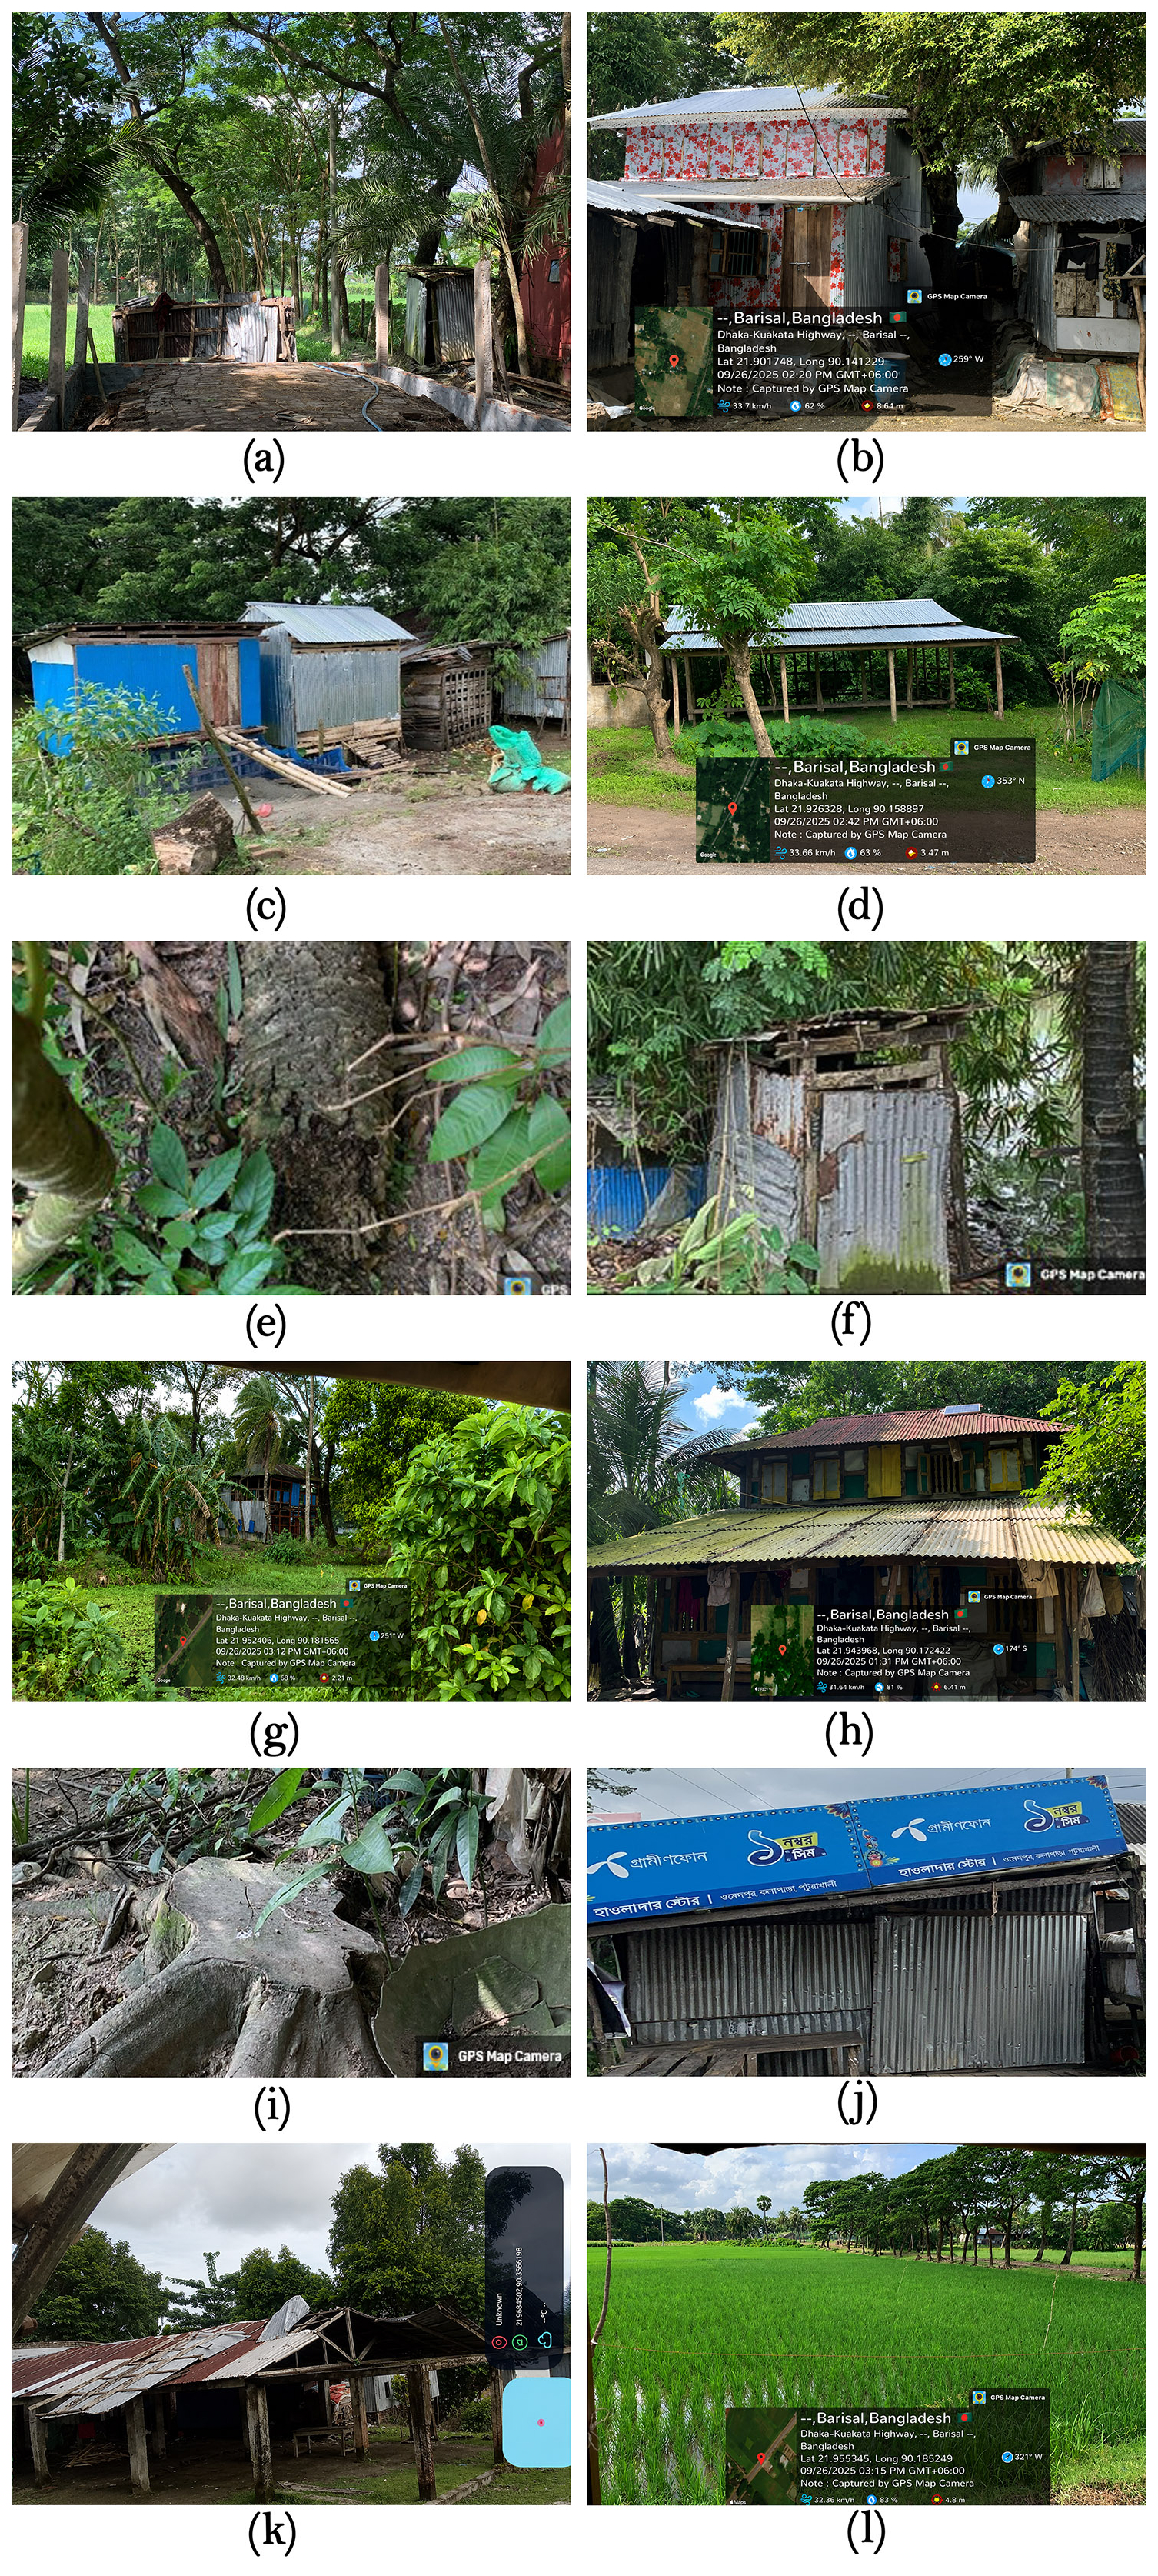
Figure A1Field validation images taken in Kala Para subdistrict, Patuakhali, for the damage validation of Cyclone Remal.
Sentinel-1 GRD and SLC data used in this study are freely available from the Copernicus Open Access Hub (https://browser.dataspace.copernicus.eu/, last access: 20 September 2025) and the ASF Vertex archive (https://search.asf.alaska.edu/, last access: 20 September 2025). The SNAP software used for data processing is freely available. The code developed for this study has been made available via a Zenodo repository (https://doi.org/10.5281/zenodo.19857126, Prova, 2026). The validation datasets supporting the findings of this study are available from the corresponding author upon reasonable request.
SIP carried out the conceptualization, acquired funding, investigation, data curation and validation, formal analysis of the data, visualization, and writing of the original draft of the manuscript. MSS contributed to conceptualization, supervision of the study, designing the methodology, writing, review, editing, and visualization. RI was involved in data curation, visualization, and writing of the original draft. RIM contributed to methodology, software, and result visualization. All authors were involved in reviewing and editing the manuscript.
The contact author has declared that none of the authors has any competing interests.
Publisher's note: Copernicus Publications remains neutral with regard to jurisdictional claims made in the text, published maps, institutional affiliations, or any other geographical representation in this paper. The authors bear the ultimate responsibility for providing appropriate place names. Views expressed in the text are those of the authors and do not necessarily reflect the views of the publisher.
The authors express their sincere gratitude to the Department of Disaster Science and Climate Resilience at the University of Dhaka for providing the necessary research facilities to support this study. The authors also gratefully acknowledge the ESA Copernicus Data Space Ecosystem Open Access Hub for supplying the SAR imagery used in this study through their data portal (https://browser.dataspace.copernicus.eu/, last access: 20 September 2025). A very small part of this research used artificial intelligence for grammar correction and to improve readability.
This paper was edited by Bayes Ahmed and reviewed by Giovanni Scardino and one anonymous referee.
Alexandre, C., Johary, R., Catry, T., Mouquet, P., Révillion, C., Rakotondraompiana, S., and Pennober, G.: A Sentinel-1 based processing chain for detection of cyclonic flood impacts, Remote Sens., 12, 252, https://doi.org/10.3390/rs12020252, 2020.
Al Shafian, S. and Hu, D.: Integrating Machine Learning and Remote Sensing in Disaster Management: A Decadal Review of Post-Disaster Building Damage Assessment, Buildings, 14, 2344, https://doi.org/10.3390/buildings14082344, 2024.
Bürgmann, R., Rosen, P. A., and Fielding, E. J.: Synthetic Aperture Radar Interferometry to Measure Earth's Surface Topography and Its Deformation, Annu. Rev. Earth Planet. Sci., 28, 169–209, https://doi.org/10.1146/annurev.earth.28.1.169, 2000.
Emanuel, K. A.: The dependence of hurricane intensity on climate, Nature, 326, 483–485, https://doi.org/10.1038/326483a0, 1987.
Fielding, E. J. and Jung, J.: Damage proxy mapping with SAR interferometric coherence change, Procedia Comput. Sci., 239, 2322–2328, https://doi.org/10.1016/j.procs.2024.06.425, 2024.
Ge, P., Gokon, H., Meguro, K., and Koshimura, S.: Study on the intensity and coherence information of high-resolution ALOS-2 SAR images for rapid massive landslide mapping at a pixel level, Remote Sens., 11, 2808, https://doi.org/10.3390/rs11232808, 2019.
Ge, P., Gokon, H., and Meguro, K.: A review on synthetic aperture radar-based building damage assessment in disasters, Remote Sens. Environ., 240, 111693, https://doi.org/10.1016/j.rse.2020.111693, 2020.
Haque, D. M. E.: 3-D surface deformation model from sub-pixel correlation of optical imagery and InSAR, M.Sc. thesis, Faculty of Geo-Information Science and Earth Observation (ITC), University of Twente, Enschede, the Netherlands, 71 pp., https://purl.utwente.nl/essays/83845 (last access: 22 March 2026), 2016.
Islam, T. and Peterson, R. E.: Climatology of landfalling tropical cyclones in Bangladesh 1877–2003, Nat. Hazards, 48, 115–135, https://doi.org/10.1007/s11069-008-9252-4, 2009.
Malmgren-Hansen, D., Sohnesen, T., Fisker, P., and Baez, J.: Sentinel-1 change detection analysis for cyclone damage assessment in urban environments, Remote Sens., 12, 2409, https://doi.org/10.3390/rs12152409, 2020.
Mastro, P., Masiello, G., Serio, C., and Pepe, A.: Change Detection Techniques with Synthetic Aperture Radar Images: Experiments with Random Forests and Sentinel-1 Observations, Remote Sens., 14, 3323, https://doi.org/10.3390/rs14143323, 2022.
Meneses, S. F. and Blanco, A. C.: Rapid mapping and assessment of damages due to typhoon Rai using Sentinel-1 synthetic aperture radar data, Int. Arch. Photogramm. Remote Sens. Spatial Inf. Sci., XLIII-B3-2022, 1139–1146, https://doi.org/10.5194/isprs-archives-XLIII-B3-2022-1139-2022, 2022.
Ministry of Environment, Forest and Climate Change, Government of the People's Republic of Bangladesh: National Adaptation Plan of Bangladesh 2023–2050, MoEFCC, Dhaka, Bangladesh, https://www.flipsnack.com/77777E5569B/national-adaptation-plan-of-bangladesh-2023-2050/full-view.html (last access: 7 June 2026), 2022.
Moreira, A., Prats-Iraola, P., Younis, M., Krieger, G., Hajnsek, I., and Papathanassiou, K. P.: A tutorial on synthetic aperture radar, IEEE Geosci. Remote Sens. Mag., 1, 6–43, https://doi.org/10.1109/MGRS.2013.2248301, 2013.
Olen, S. and Bookhagen, B.: Mapping damage-affected areas after natural hazard events using Sentinel-1 coherence time series, Remote Sens., 10, 1272, https://doi.org/10.3390/rs10081272, 2018.
Phiri, D., Simwanda, M., and Nyirenda, V.: Mapping the impacts of cyclone Idai in Mozambique using Sentinel-2 and OBIA approach, S. Afr. Geogr. J., 103, 237–258, https://doi.org/10.1080/03736245.2020.1740104, 2021.
Plank, S.: Rapid damage assessment by means of multi-temporal SAR- A comprehensive review and outlook to Sentinel-1, Remote Sens., 6, 4870–4906, https://doi.org/10.3390/rs6064870, 2014.
Prova, S. I.: shahoriarsarker-archive/Flood-Inundation-Mapping: Flood Inundation Mapping Code (Version v1.0), Zenodo [code], https://doi.org/10.5281/zenodo.19857126, 2026.
Saha, M. K. and Khan, N. A.: Changing profile of cyclones in the context of climate change and adaptation strategies in Bangladesh, J. Bangladesh Inst. Plan., 7, 63–78, https://doi.org/10.3329/jbip.v7i1.77022, 2014.
Salman, A., Saha, A., Nomaan, S. S., Haque, E., and Asadi, T.: Assessing Tropical Cyclone Destruction Using Landsat Satellite Imagery: a Case Study in Bangladesh, J. Integr. Disaster Risk Manag., 14, 54–68, https://doi.org/10.5595/001c.123359, 2024.
Sarker, M. S., Kamal, A. S. M. M., Rahman, M. Z., and Faruki Fahim, A. K.: Land subsidence monitoring using InSAR technique in the southwestern region of Bangladesh, Geomat. Nat. Hazards Risk., 15, 2333795, https://doi.org/10.1080/19475705.2024.2333795, 2024.
Tazneen, F., Rahman, H., Rahman, S., Sultana, N., and Faisal, B. R.: Preliminary Application of Space-based Remote Sensing and Geospatial Technology for Investigation on the Geo-environmental Consequences of Cyclone Aila 2009 in Bangladesh, Int. J. Environ. Geoinformat., 8, 229–244, https://doi.org/10.30897/ijegeo.837770, 2021.
Torres, R., Snoeij, P., Geudtner, D., Bibby, D., Davidson, M., Attema, E., Potin, P., Rommen, B. Ö., Floury, N., Brown, M., Traver, I. N., Deghaye, P., Duesmann, B., Rosich, B., Miranda, N., Bruno, C., L'Abbate, M., Croci, R., Pietropaolo, A., Huchler, M., and Rostan, F.: GMES Sentinel-1 mission, Remote Sens. Environ., 120, 9–24, https://doi.org/10.1016/j.rse.2011.05.028, 2012.
Touzi, R., Lopes, A., Bruniquel, J., and Vachon, P. W.: Coherence Estimation for SAR Imagery, IEEE Trans. Geosci. Remote Sens., 37, 135–149, https://doi.org/10.1109/36.739146, 1999.
Tralli, D. M., Blom, R. G., Zlotnicki, V., Donnellan, A., and Evans, D. L.: Satellite remote sensing of earthquake, volcano, flood, landslide and coastal inundation hazards, ISPRS J. Photogramm. Remote Sens., 59, 185–198, https://doi.org/10.1016/j.isprsjprs.2005.02.002, 2005.
Uddin, K. and Matin, M. A.: Potential flood hazard zonation and flood shelter suitability mapping for disaster risk mitigation in Bangladesh using geospatial technology, Prog. Disaster Sci., 11, https://doi.org/10.1016/j.pdisas.2021.100185, 2021.
Washaya, P. and Balz, T.: SAR coherence change detection of urban areas affected by disasters using Sentinel-1 imagery, Int. Arch. Photogramm. Remote Sens. Spatial Inf. Sci., XLII-3, 1857–1861, https://doi.org/10.5194/isprs-archives-XLII-3-1857-2018, 2018.
WMO: State of the Climate in Asia 2021, WMO-No. 1303, World Meteorological Organization, Geneva, Switzerland, ISBN 978-92-63-11303-0, https://library.wmo.int/idurl/4/58229 (last access: 12 October 2026), 2022.
Zebker, H. A. and Villasenor, J.: Decorrelation in Interferometric Radar Echoes, IEEE Trans. Geosci. Remote Sens., 30, 950–959, https://doi.org/10.1109/36.175330, 1992.